regional trends in retail trade - economic data publications
TRANSCRIPT

by Clement Winston and Marie P. Hertzberg
Regional Trends in Retail Trade
cOMPLETION of tabulations of sales of retail stores fromthe 1954 Census of Business makes available new data byregions and by lines of trade for that year. Similar datafor other census years and the Office of Business Economies'studies of State personal income make possible the analysisof long-term trends and relationships in retail trade activityby regions. Since the regional pattern and the structure ofretail trade change rather slowly, this information is usefulin appraising current regional market patterns.
Summary
The principal results of this study are as follows:1. Retail store sales in 1954 had risen to 3/£ times those
of 1929. After adjustment for price changes, sales in 1954were more than double 1929; on a per capita physicalvolume basis sales were up \% times. By major kinds ofbusiness, the increase in dollar volume ranged from a dou-bling of sales to a fivefold gain.
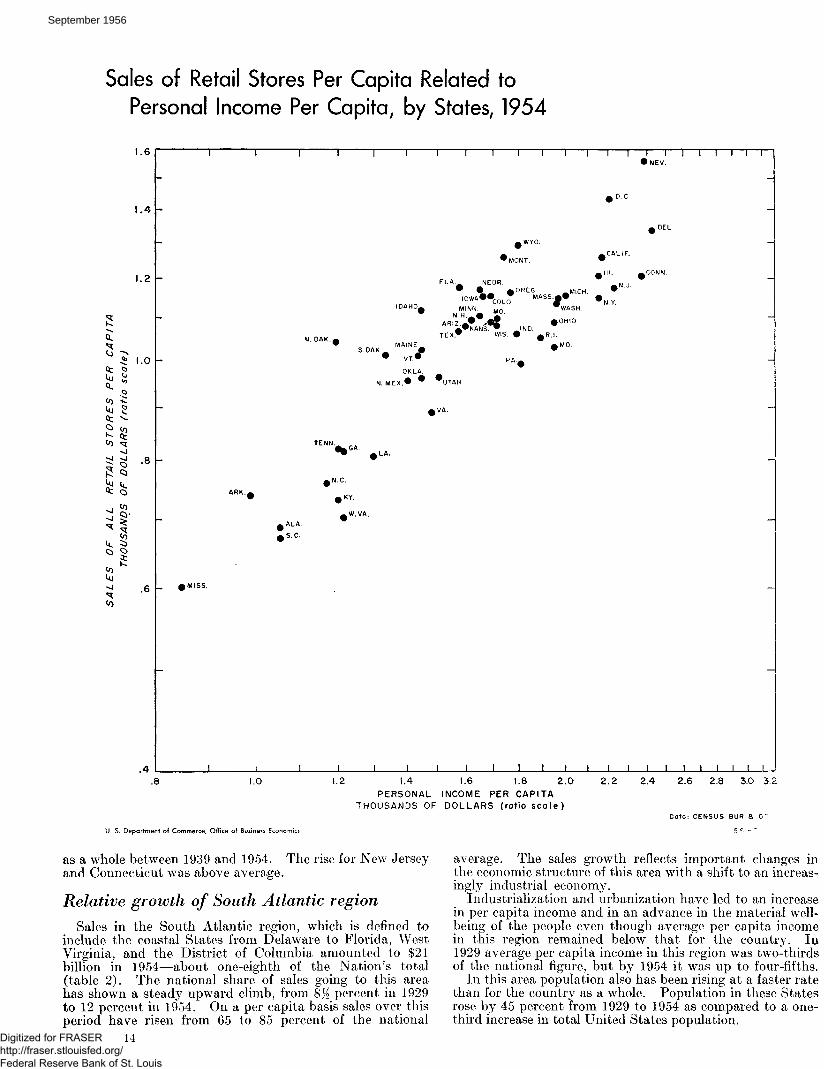
2. In 1954, when retail sales per capita were $1,054 forthe United States as a whole, they varied by States from$602 in Mississippi to $1,557 in Nevada.
3. In 1954, the ratio of retail sales to total personal incomewas about 60 percent for the country as a whole; this ratiovaried considerably by States and regions.
4. In the past 25 years, retail sales and personal incomein each State or region have moved in a parallel fashion,suggesting that current income is the dominant factor indetermining the regional course of retail trade. Differentialrates in population growth and industrialization are alsosignificant.
5. The ratios to United States sales of retail stores in theSouth and West were higher in 1954 than in 1929. Thehighly developed New England, Middle Atlantic, and WestNorth Central regions showed lower shares of total UnitedStates sales in 1954 than in 1929, while the East NorthCentral region maintained a fixed share. Sample data col-lected in the Annual Retail Trade Report indicated a generalcontinuation in these trends from 1954 to 1955.
6. In 1954, the percentage distribution of retail salesby major kinds of business varied widely among States andregions. Food and automotive dealers' sales accounted for asubstantial proportion of all retail sales in each State.Sales in the building materials, hardware, and farm imple-ments group showed the largest percentage variation whiledrugstore sales showed the smallest.
7. Relative to total retail sales within a State, sales of auto-motive dealers, gasoline service stations, and the lumber,building materials, hardware, farm equipment group are ingeneral proportionately larger in predominantly agriculturalStates than in other States. The highly urbanized Statestend to have higher proportions of sales by food, apparel, andfurniture and appliance stores than do less urbanized States.
8. Generally, States with the smallest income and salesvolume showed relatively greater gains in income and salesfrom 1929 to 1954 than the larger States.
9. While the center of the city has continued to representthe core of retail trade, the expansion has been greatest in
NOTE.—MR. WINSTON AND MRS. HERTZBERG ARE MEMBERS OF THEBUSINESS STRUCTURE DIVISION, OFFICE OF BUSINESS ECONOMICS.
the metropolitan area surrounding the city, particularly inthe recent postwar years.
The 1929-54 sales experience
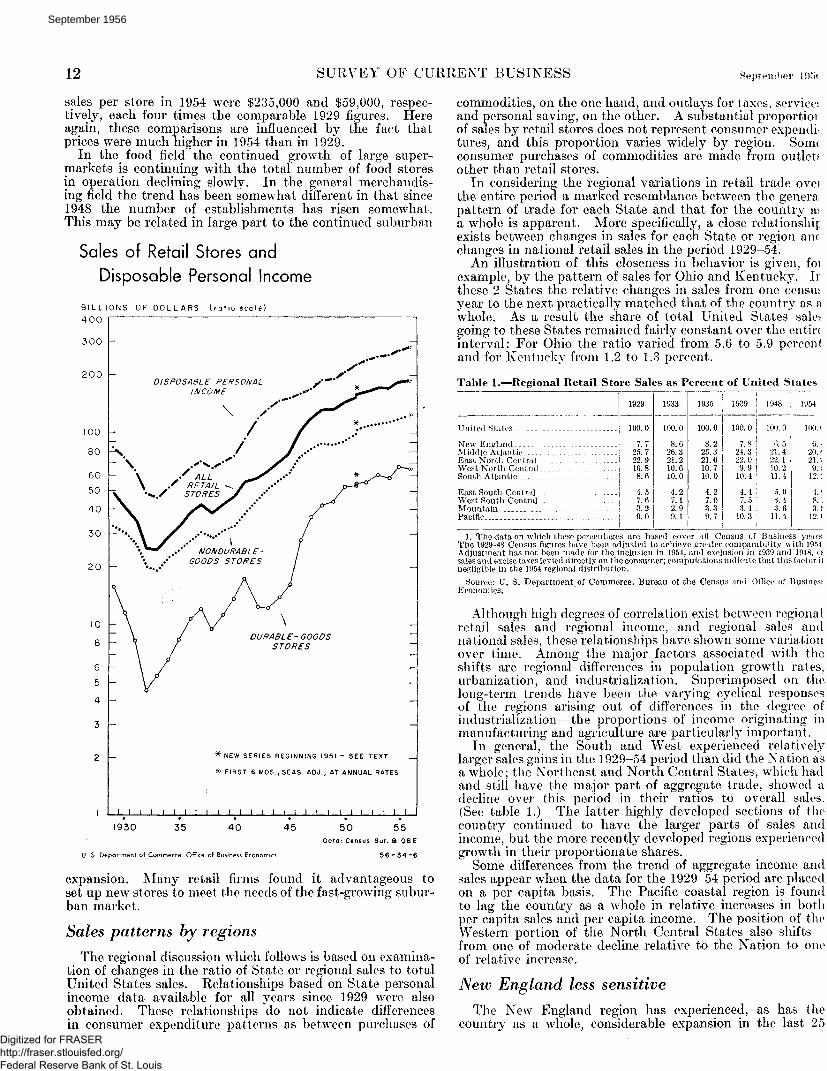
In the past 25 years sales declined from $48 billion in 1929to $24 billion in 1933 and then advanced to $170 billion in1954.1 Thus retail store sales in 1954 were 3% times those of1929 while disposable personal income trebled and populationrose about 39 million or about a third.
On a physical volume basis, after adjusting for pricechanges, retail sales in 1954 were more than double the 1929high. Finally, "real" retail sales per capita rose more than50 percent over this period.
All the trades shared in this expansion but not to the sameextent. The largest percentage increases from 1929 to 1954were shown for gasoline service stations and eating anddrinking places—with the repeal of prohibition importantin the latter's trend. In these trades 1954 sales (in currentdollars) were about six times as great as at the beginning ofthe period. For the automotive group and food stores thetotals were four times as great, while for the remaining majorgroups the advances were smaller, with all segments at leastdoubling their 1929 sales.
Store size increases
During the period under discussion the trend in retailmerchandising has been to larger individual establishments,especially in some lines of trade, and the new stores by theirvery size have tended to influence marketing practices. Inthe last 2 decades, the ever-increasing volume of retailbusiness has been met more by increasing the size of in-dividual establishments than by increasing the total numberof stores. The number of retail stores was 1.7 million inthe 1954 Census of Retail Trade and 1.5 million according tothe census of 1929; employment in retail trade over thisperiod rose about two-thirds.2 The average sales per storeof $100,000 in 1954 was about three times the average in1929, but the average increase in volume was, of course,considerably less.
In this period prices of goods sold at retail rose substan-tially, from an index (1935-39=100) of 121 in 1929 to 208in 1954. Thus after the dollar sales are adjusted for pricechanges the estimates indicate that the real volume of goodssold at the average retail establishment nearly doubled inthe 25-year period. From 1948 to 1954—the last 2 Censusof Business periods—the physical volume of retail sales inretail trade continued to increase while the number of retailstores was virtually unchanged.
Food stores have shown the largest rise in size of establish-ment. Average sales of food stores exceeded $100,000 in1954, about 5 times the 1929 experience. For generalmerchandise stores and gasoline service stations average
1. Changes in definition of terms and collection methods have resulted in minor differencesin the 6 Censuses of Business taken in 1929, 1933, 1935, 1939, 1948 and 1954. Sales and excisetaxes levied directly on the consumer were included in sales in 1954 but excluded in 1939 and1948. These taxes amounted to about 2 percent of the United States total in 1954. Anotherdifference arises in that stores with no paid employees which had a 1954 sales volume of lessthan $2,500 were excluded in 1954 and 1948 as revised. The previous censuses used a $500 cutoff.
2. A rough allowance for definitional and coverage changes between the 2 censuses wouldlower the 1929 figure by about 100,000 establishments relative to 1954.
11Digitized for FRASER http://fraser.stlouisfed.org/ Federal Reserve Bank of St. Louis
September 1956
12 SURVEY OF CURRENT BUSINESS September
sales per store in 1954 were $235,000 and $59,000, respec-tively, each four times the comparable 1929 figures. Hereagain, these comparisons are influenced by the fact thatprices were much higher in 1954 than in 1929.
In the food field the continued growth of large super-markets is continuing with the total number of food storesin operation declining slowly. In the general merchandis-ing field the trend has been somewhat different in that since1948 the number of establishments has risen somewhat.This may be related in large part to the continued suburban
Sales of Retail Stores and
Disposable Personal Income
B I L L I O N S O F D O L L A R S ( r a t i o s c a l e )400
300
200
100
80
60
50
40
30
20
10
8
6
5
4
- \
2 -
I
DISPOSABLE PERSONALINCOME
DURABLE-GOODSSTORES
NEW SERIES BEGINNING 1951 - SEE TEXT
FIRST 6 MOS., SEAS. ADJ., AT ANNUAL RATES
I I I I I I I I I I I I I I I I I I I I I I I I I I I
1930
U. S. Department of Comm
35 40
rce, Office of Business Ecc
45 50 55Doto: Census Bur . a Q B E
56-34-6
expansion. Many retail firms found it advantageous toset up new stores to meet the needs of the fast-growing subur-ban market.
Sales patterns by regions
The regional discussion which follows is based on examina-tion of changes in the ratio of State or regional sales to totalUnited States sales. Relationships based on State personalincome data available for all years since 1929 were alsoobtained. These relationships do not indicate differencesin consumer expenditure patterns as between purchases of
commodities, on the one hand, and outlays for taxes, service*and personal saving, on the other. A substantial proportioiof sales by retail stores does not represent consumer expendi-tures, and this proportion varies widely by region, Sormconsumer purchases of commodities are made from outletsother than retail stores.
In considering the regional variations in retail trade oveithe entire period a marked resemblance between the generapattern of trade for each State and that for the country asa whole is apparent. More specifically, a close relationshipexists between changes in sales for each State or region amchanges in national retail sales in the period 1929-54.
An illustration of this closeness in behavior is given, foiexample, by the pattern of sales for Ohio and Kentucky. Iithese 2 States the relative changes in sales from one censusyear to the next practically matched that of the country as awhole. As a result the share of total United States salesgoing to these States remained fairly constant over the eritminterval: For Ohio the ratio varied from 5.6 to 5.9 percentand for Kentucky from 1.2 to 1.3 percent.
Table 1.—Regional Retail Store Sales as Percent of United States
United States
New EnglandMiddle AtlanticEast North CentralWest North Central .South Atlantic
East South CentralWest South Central -Mountain-. -Pacific
1 1929j
.... 100.0
7.725.722.910.88.6
4.57.63.29.0
1
1933
100. 0
8.626.321.210.610.0
4.2
2.99.1
1935
100.0
8.225.321.610.710.0
4.27.03.39.7
1939 !
100. 0 1
7.8 !24.3 !22.0 j9.9 |
10.4 !
4.4 !7.5 ;3,4 ;
10.3 !
1948
100. 0
6.521.422.110.211.4
5.03.43.6
11.4
1954
100. (
6. -20. (21.!9 ;
12.:
4.!8 ;3.J
12. (
1. The data on which these percentages are based cover all Census of Business yearsThe 1929-48 Census figures have been adjusted to achieve greater comparability with 1954Adjustment has not been made for the inclusion in 1954, and exclusion in 1939 and 1948, ossales and excise taxes levied directly on the consumer; computations indicate that this factor i Inegligible in the 1954 regional distribution.
Source: U. S. Department of Commerce, Bureau of the Census and Office of BusinessEconomics.
Although high degrees of correlation exist between regionalretail sales and regional income, and regional sales andnational sales, these relationships have shown some variationover time. Among the major factors associated with theshifts are regional differences in population growth rates,urbanization, and industrialization. Superimposed on thelong-term trends have been the varying cyclical responsesof the regions arising out of differences in the degree ofindustrialization—the proportions of income originating inmanufacturing and agriculture are particularly important.
In general, the South and West experienced relativelylarger sales gains in the 1929-54 period than did the Nation asa wliole; the Northeast and North Central States, which hadand still have the major part of aggregate trade, showed adecline over this period in their ratios to overall sales.(See table 1.) The latter highly developed sections of thecountry continued to have the larger parts of sales andincome, but the more recently developed regions experiencedgrowth in their proportionate shares.
Some differences from the trend of aggregate income andsales appear when the data for the 1929-54 period are placedon a per capita basis. The Pacific coastal region is foundto lag the country as a whole in relative increases in bothper capita sales and per capita income. The position of theWestern portion of the North Central States also shifts—from one of moderate decline relative to the Nation to oneof relative increase,
New England less sensitiveThe New England region has experienced, as has the
country as a whole, considerable expansion in the last 25Digitized for FRASER http://fraser.stlouisfed.org/ Federal Reserve Bank of St. Louis
September 1956
September 105(5 SURVEY OF CURRENT BUSINESS 13
Percentage Distribution of Retail Sales andPersonal Income, by Regions
PERCENT OF U. S TOTAL ( ra t io sca le )
10
9 NEW ENGLAND
PERSONAL INCOME
WEST NORTH CENTRAL
SOUTH ATLANTIC
3 ! 1 1 I ! i I I I I I I I I I I I l I I I I i I I I
6 -'
WEST SOUTH CENTRAL
MOUNTAIN
2 1 i i 1 l l I i i I I i I I I i i i 1 1 1 I I I i i I
1929 31 33 35 37 39 41 43 45 47 49 51 53 55
U S. Deportment of Commerce, Office of Business Economics
Data: CENSUS BUR. 8 QBE
5 6 - 3 4 - 7
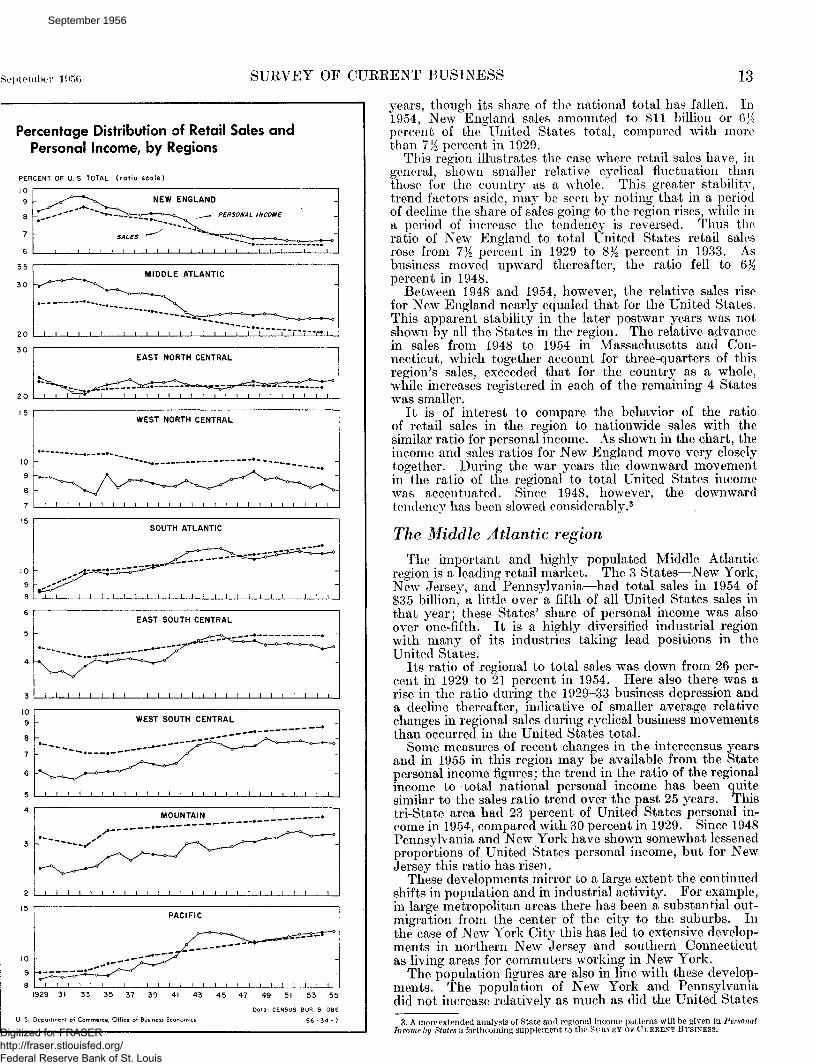
years, though its share of the national total has fallen. In1954, New England sales amounted to $11 billion or 6X2percent of the United States total, compared with morethan 7K percent in 1929.
This region illustrates the case where retail sales have, ingeneral, shown smaller relative cyclical fluctuation thanthose for the country as a whole. This greater stabilit}T
?trend factors aside, may be seen by noting that in a periodof decline the share of sales going to the region rises, while ina period of increase the tendency is reversed. Thus theratio of New England to total United States retail salesrose from 1% percent in 1929 to 8J£ percent in 1933. Asbusiness moved upward thereafter, the ratio fell to 6Kpercent in 1948.
Between 1948 and 1954, however, the relative sales risefor New England nearly equaled that for the United States.This apparent stability in the later postwar years was notshown by all the States in the region. The relative advancein sales from 1948 to 1954 in Massachusetts and Con-necticut, which together account for three-quarters of thisregion's sales, exceeded that for the country as a whole,while increases registered in each of the remaining 4 Stateswas smaller.
It is of interest to compare the behavior of the ratioof retail sales in the region to nationwide sales with thesimilar ratio for personal income. As shown in the chart, theincome and sales ratios for New England move very closelytogether. During the war years the downward movementin the ratio of the regional to total United States incomewas accentuated. Since 1948, however, the downwardtendency has been slowed considerably.3
The Middle Atlantic regionThe important and highly populated Middle Atlantic
region is a leading retail market. The 3 States—New York,New Jersey, and Pennsylvania—had total sales in 1954 of$35 billion, a little over a fifth of all United States sales inthat year; these States' share of personal income was alsoover one-fifth. It is a highly diversified industrial regionwith many of its industries taking lead positions in theUnited States.
Its ratio of regional to total sales was down from 26 per-cent in 1929 to 21 percent in 1954. Here also there was arise in the ratio during the 1929-33 business depression anda decline thereafter, indicative of smaller average relativechanges in regional sales during cyclical business movementsthan occurred in the United States total.
Some measures of recent changes in the intercensus yearsand in 1955 in this region may be available from the Statepersonal income figures; the trend in the ratio of the regionalincome to total national personal income has been quitesimilar to the sales ratio trend over the past 25 years. Thistri-State area had 23 percent of United States personal in-come in 1954, compared with 30 percent in 1929. Since 1948Pennsylvania and New York have shown somewhat lessenedproportions of United States personal income, but for NewJersey this ratio has risen.
These developments mirror to a large extent the continuedshifts in population and in industrial activity. For example,in large metropolitan areas there has been a substantial out-migration from the center of the city to the suburbs. Inthe case of New York City this has led to extensive develop-ments in northern New Jersey and southern Connecticutas living areas for commuters working in New York.
The population figures are also in line with these develop-ments. The population of New York and Pennsylvania-did not increase relatively as much as did the United States
3. A more extended analysis of State and regional income patterns will be given in PersonalIncome by States a forthcoming supplement to the SURVEY OF CURRENT BUSINESS.Digitized for FRASER
http://fraser.stlouisfed.org/ Federal Reserve Bank of St. Louis
September 1956
Sales of Retail Stores Per Capita Related toPersonal Income Per Capita, by States, 1954
1.6
1.4
1.2
5
1.0
a
Uj^ .6
.4
I I I I I I I I I \ [ I I I 1 I+ NEV.
FLA NEBR.
• • ftOREG.lOWA^^ MASS.J
MINN. Mn ' *N.H.^* _1U'
OKLA.
N. MEX.* * UTAH
I _L I _L I JL J_ I I I I i I I.8 1.0 1.2 1.4
PERSONALTHOUSANDS OF
1.6 1.8 2.0INCOME PER CAPITADOLLARS (ratio sca le)
2.2 2.4 2.6 2.8 3.0 3.2
Data: CENSUS BUR. 8
U. S. Department of Commerce, Office of Business Economics
as a whole between 1939 and 1954. The rise for New Jerseyand Connecticut was above average.
Relative growth of South Atlantic regionSales in the South Atlantic region, which is defined to
include the coastal States from Delaware to Florida, WestVirginia, and the District of Columbia amounted to $21billion in 1954—about one-eighth of the Nation's total(table 2). The national share of sales going to this areahas shown a steady upward climb, from 8%, percent in 1929to 12 percent in 1954. On a per capita basis sales over thisperiod have risen from 65 to 85 percent of the national
14
average. The sales growth reflects important changes inthe economic structure of this area with a shift to an increas-ingly industrial economy.
Industrialization and urbanization have led to an increasein per capita income and in an advance in the material well-being of the people even though average per capita incomein this region remained below that for the country. In1929 average per capita income in this region was two-thirdsof the national figure, but by 1954 it was up to four-fifths.
In this area population also has been rising at a faster ratethan for the country as a whole. Population in these Statesrose by 45 percent from 1929 to 1954 as compared to a one-third increase in total United States population.
Digitized for FRASER http://fraser.stlouisfed.org/ Federal Reserve Bank of St. Louis
September 1956

September 1956 SURVEY OF CURRENT BUSINESS 15
There was some divergence in movement among the Statesin this region with Florida experiencing the greatest ex-pansion. Reflecting expanded tourist travel and a morethan doubling of population, Florida's retail store sales rosefrom 1 percent of the Nation's sales in 1929 to 2]4 percent in1954.
In Maryland, Virginia, Delaware, the Carolinas, andGeorgia, sales showed steady and substantial advancesparalleling income gains, while West Virginia has shownrelative decline in the postwar period. Delaware wasamong the highest per capita sales and income areas in theUnited States.
Rising proportion in Pacific region
The Pacific coastal region consisting of California, Oregon,and Washington is another example of a region with a steadilyrising sales trend relative to the Nation. The ratio of salesto the United States total rose from 9 percent in 1929 to 12percent in 1954.
The 108-percent increase in population in this area from1929 to 1954 has exceeded by far that of any of the otherregions. The favorable economic opportunities and climateon the west coast have drawn increasing numbers of thepopulation from other parts of the country. These wereimportant factors behind the greater than national advancesbetween 1929 and 1954 in income and retail sales for thisarea.
The sales expansion was concentrated mainly in California,where sales of retail stores rose from 6/£ to 9 percent of theUnited States total from 1929 to 1954. The shares of Wash-ington and Oregon rose from 1.6 to 1.7 percent and from 0.9to 1.1 percent, respectively.
The West South-Central States
In the West South-Central region also, sales have showna somewhat greater relative rise over the 1929-54 periodthan that recorded by the Nation. It is noted that from1929 to 1933 when United States total sales declined, theratio of the region's sales to total sales fell off from 7/2 to 7percent. Thereafter, except for the 1933-35 period, theratio has tended upward to reach nearly 9 percent in 1954.In Texas and Louisiana the sales ratios have shown anupward trend in the period, while a contrary movement wasshown for Arkansas and Oklahoma.
Sales in Te^as in 1954 were more than 4/^ times the 1929figure and, on a per capita basis, were equal to the UnitedStates average. Personal income also rose sharply and,even though relative population growth exceeded that of theNation as a whole, per capita income in Texas rose fromtwo-thirds of the United States average in 1929 to nine-tenthsin 1954. Oil, natural gas, and livestock have played aprominent part in the prosperity of this State, but newindustries also have been moving in to lift the geneial levelof activity.
Since 1939, Oklahoma retail activity has tended to parallelthe United States total; Arkansas had recovered most of itsprewar loss in relative sales position by 1948, but showed arelative decline from 1948 to 1954. This reflected, in part,the falling off in agricultural income in these years.
The East and West North Central States
The East North Central States showed a sales behaviorwhich closely paralleled that of the Nation. Its ratio to theUnited States has remained close to 22 percent for sales and23 percent for income since 1929 indicating the same degreeof sensitivity to economic fluctuations as the Nation.
Table 2.—Regional and State Sales of Retail Stores for Census Year *
[Millions of dollars]
United States
New EnglandMaineNew Hampshire-Vermont _ _ _ _ _ . _ _ ._MassachusettsRhode IslandConnecticut
Middle AtlanticNew YorkNew JerseyPennsylvania
East North CentralOhioIndiana. - _ _ _ _ _ _IllinoisMichigan _ _Wisconsin
West North CentralMinnesota .. - _IowaMissouriNorth DakotaSouth Dakota-NebraskaKansas
South Atlantic _ _DelawareMarylandDistrict of ColumbiaVirginiaWest VirginiaNorth Carolina- _South CarolinaGeorgiaFlorida
East South CentralKentuckyTennesseeAlabamaMississippi
Wes t South CentralArkansasLouisianaOklahomaTexas
Mountain _ __ _ - _ _ _ _ _MontanaIdahoWyomingColorado -New MexicoArizonaUtahNevada
PacificWashington _OregonCalifornia
1929
47, 769
3, 701298179148
2,013312750
12,2696,8161,7683,684
10, 9512,7961,1913,5832,1781,203
5,1491,026
9531,407
230250553730
4,105100596324589440641296626493
2,133575632519408
3,646406469780
1, 991
1,51023816510145511619319349
4,305742442
3,122
1933
24, 126
2,08017510675
1,150161414
6,3423,583
9641,795
5,1171,392
5511,658
914601
2,547559463737104101266318
2,41655
367236349239358183347282
1,001295322246139
1,711177259334941
7111078454
22652738827
2,200355215
1,630
1935
32,338
2,63922514796
1,416213541
8,1784,5951,1682,414
6,9871,910
7652,1051,356
851
3,444797636928147144353440
3,24475
447326463328459246480421
1,367381476334177
2,278239340429
1,270
1,07918513881
29788
11912943
3,123519329
2,276
1939
41,445
3,247278181122
1,698269699
10,0685,4661,5343,068
9,1012,4001,0562,8081,7931,043
4,0971,000
8181,089
156169394472
4,325108606391622403631331623611
1,837516603435282
3,090298484513
1,795
1,42122117510040712516116962
4,259666441
3,152
1948
128, 849
8,321741461332
4,166694
1,927
27, 62714, 3814, 3818,866
28, 5077,2403,4998,7205,8543,193
13, 1532, 8672,5403,526
607620
1,3101,684
14, 631376
1,8711,1032,2031,2782,2341,1422,0982,327
6,3701,6622,0761,6291,004
10, 8591,0791,6731,6296,479
4,640599579307
1,250474654576200
14, 7402,2041,586
10, 950
1954
169, 968
10,911924604380
5,539848
2,618
35,05418, 1166, 145
10, 793
37, 2569,6334,513
11,0198,1683,924
16, 1813,4503,0784,525
662679
1,5882,201
20,609493
2, 6751,2123, 1211, 4013,2101,5192,9634, 014
8,3542,2012,7592,1121, 282
14, 8061,3342,3392,1019,032
6,357778670385
1,727733
1,001733330
20, 4392,8741,921
15, 644
Percentageincrease
1929 to1954
256
195210237157175172249
186166248193
240245279208275226
2142362?3222188172187202
402393349274430218401413373714
292283337307214
306329399169354
321227306281280532419280573
375287335401
1948 to1954
32
31253114332236
27264022
313329264023
232021
,289
102131
41314310421044334172
3132333028
3624402939
373016253855532765
39302143
1. See footnote to table 1.
Source: U. S. Department of Commerce, Bureau of the Census and Office of BusinessEconomics.
Ohio and Wisconsin most nearly matched the sales trendof the Nation, receiving about 6 and 2 percent, respectively,of both United States sales and income throughout trie 1929-54 period. Population growth parallel to the Nation wasan additional factor stabilizing these ratios.
Michigan and Indiana exhibited somewhat sharper re-sponses to cyclical fluctuations than the Nation, reflectingthe heavy role of automotive production. In 1954 Michiganwas receiving about 5 percent of United States sales andincome while Indiana's ratio was 8 percent for both. Illinoisalone registered a small but steady downtrend throughoutthe period in its sales, income and population ratios. Itssales fell from 7% to 6K percent of the United States total,while its income share declined from 8}_. to 7 percent.
In the West North Central region, consisting largely ofagricultural States, retail sales have tended to lag relatively
Digitized for FRASER http://fraser.stlouisfed.org/ Federal Reserve Bank of St. Louis
September 1956

16 SURVEY OF CURRENT BUSINESS September
behind the national average, reflecting income trends. Inthis region, the relative rise in population between 1929 and1954 was smaller than that for the country as a whole. Thelag in sales relative to the United States total was general—especially in the Dakotas and Nebraska where populationdeclined in absolute number from 1929 to 1948. Populationhas since risen in these States, though less than in the coun-try as a whole. In most of the States the percent advancesin sales of retail stores from 1948 to 1954 were less than forthe United States total in every major line of trade.
The East South Central and Mountain StatesBoth the East South Central and the Mountain States
exhibited small gains in their share of total sales from 1929to 1954. In the East South-Central .region this was duemainly to Tennessee, the most industrialized State in thegroup. Kentucky and Alabama showed slight increases intheir sales ratios, while Mississippi lost ground through 1935and recovered somewhat by 1954. Both per capita salesand income in this region were one-third below the Nationin 1954. However, there has been considerable relativegrowth since 1929 when per capita sales were only one-halfthose of the United States. This region has shown heavyoutmigration equaling 12 percent of its population from1940 to 1950 and 8 percent from 1950 to 1954.
In the Mountain region upward trends are found for anumber of States. Nevada took the lead position in thisgroup reflecting the expansion of vacation trade.
Sales-income pattern by States
The close interrelationship between the different regions'shares of income and sales is also brought out by the sales-income pattern for the various States for a particular year.Such a cross-sectional view brings out the similarities anddifferences among the States in the distribution of sales andincome. In addition, examination of this cross-section indifferent years indicates whether shifts have occurred withthe passage of time.
Table 3 shows 1954 data on personal income and retailstore sales both on an aggregate and per capita basis.
In general, the close relationship between size of totalpersonal income and total retail sales which would be ex-pected on a priori grounds is apparent in the data. It isfound, that for each of the census years from 1929 to 1954for which State sales data are available, whether for a highor low point in the cycle, a similar pattern is obtained.The generally close correspondence between State sales andincome (R2=.99 in the year 1954 and is not much differentin other years) is in part a function of population size of eachState. The scatter diagram in this article (see chart) showsthe relationship between per capita sales and per capitapersonal income, thus removing the influence of total popu-lation size. In this case the R2 falls to .78—still a significantresult.
While the correlation between total sales and total incomebased on these State data is high, some important deviationsnre noted. For example, Delaware with total personalincome in 1954 estimated at $890 million, reported sales of$495 million, while Idaho with nearly the same income,$860 million, had sales of $670 million. Again Connecticutwi th personal income of $5.2 billion had sales of $2.6 billion,while Florida with personal income of $5.3 billion had sales of$4.0 billion.
Deviations from the average relationship are also found inthe per capita data. For example, although Nevada andConnecticut each had a per capita income of almost $2,400in 1954, Nevada's per capita retail sales of $1,560 were 30percent above Connecticut's $1,200. As can be seen in the
Table 3.—Retail Store Sales and Personal Income by States andRegions, 1954
United States
New EnglandMaineNew HampshireVermontMassachusetts
Millions ofdollars
Re-tail
storesales
169, 968
10,811924604380
n 529
Rhode Island 848Connecticut ... 2. 618
Middle AtlanticNew YorkNew JerseyPennsylvania -
East North CentralOhioIndianaIllinoisMichiganWisconsin. . .
West North CentralMinnesotaIowa ._ . _. ..MissouriNoith Dakota .South DakotaNebraskaKansas
South AtlanticDelawareMarylandDistrict of Columbia-VirginiaWest Virginia, ..North CarolinaSouth CarolinaGeorgiaFlorida
East South CentralKentuckyTennesseeAlabama. .Mississippi
West South CentralArkansasLouisianaOklahomaTexas
MountainMontanaIdaho..Wyoming ..ColoradoNew MexicoArizonaUtahNevada. ..
Pacific -WashingtonOregonCalifornia
35, 05418, 1166, 145
10, 793
37, 2569, 6334 513
11,0198, 1683,924
16, 1813, 4503, 0784, 525
662679
1, 5882,201
20, 609493
2, 6751,2123, 1211, 4013,2101, 5192, 9634. 014
8,3542,2012, 7592,1121,282
14, 8061, 3342, 3392,1019, 032
6,357778670385
1,727733
1,001733330
20, 4392,8741,921
15, 644
Per-sonal
in-come
284, 747
18, 8601, 304
894536
9,4481, 5225, 156
65, 44034, 17511,61919, 646
65,01017, 2217,619
19, 78614, 1726,212
23, 9915, 1694,4497, 066
760901
2, 2363, 410
32, 563891
5, 0791,8715 1932,4194, 9592, 3914,4185, 342
12, 6823, 5944,0383, 2391,811
21, 9821,7813,7423, 159
13,300
9,2051,074
861536
2, 5191,0771,4861,146
506
35, 0144,9632,903
27, 148
Percent ofUnited
States total
Re- Per-tail | sonal j
store ! in-sales | come
100.0
6.4.5,4.2
3.3. 5
1.5
20.610.73.66.3
21.95.72.66.54.82.3
9.52.01.82.7.4_ 4!9
1.3
12.1
L6
L8.8
1.9.9
1.72.4
4.91.31.61.2.8
8.7.8
1.41.25.3
3.8.5.4
d.4.6
2
12.11.71.29.2
100.0
6.6. 5.3.2
3.3.5
1.8
23.012.04.16.9
22.86.02.76.95.02.2
8.41.81.52.5
:l.8
1.2
11.5.3
1.8.7
1.8.9
1.7.8
1.61.9
4.51.31.41.2.6
7.7.6
1.31.14.7
3.2.3.3.2.9.4.5.4.2
12.31.81.0
| 9.5!
Rank
Re- ! Per-tail ! sonal
store 1 in-sales come
3745 I489
3822
! 184
51137
13
H171044423025
462135163215311812
24202634
3323276
3943472941364049
19282
3843479
3616
18 !4
51036
12
15201146423225
441733143019312113
24222634
3523277
4145482940373949
18282
Dollars
Percapitasales
1,054
1, 1321, 0251,0941, 0151,1471, 0501,202
1,0991, 145
il,178994
1, 1311, 089
1 1,0641,2041, 1541,081
1,1071,102
11,154i 1,0971 1,0401,009
! 1,168j 1,088
903! 1,336i 1,027! 1,428
891704
! 760670816
1,185
723735
1 820687602
965738810
| 9611,067
kn9! 1,2571,1201,291
i 1,157i 9531 1,076! 9621 1,557
k,22511,137! 1,166!l,251
Percapita
in-come
1,767
1,9571,4471, 6201, 4331, 9571, 8S62, 368
2,0512, 1592,2271,810
1,9731,9471,7972,1622,0031,711
1,6421, 6511,6691, 7131, 1951, 3391, 6451,686
1,4272, 4151,949
'2,204;1,4831,2151, 1731, 0551,2171, 576
1,0971,2001,2001. 054
850
1,433986
1,2961,445,1,572
1,6211, 7351,4401,7991,6881,4011, 5981, 5042,387
!2,0991, 9641,762
12.170
Sales-in-
comeratio
59.7
57.970.867. 670.858.655.750.8
53.653.0
• 52. 954.9
57.355. 959. 2
! 55.7I 57. 6i 63. 2
67.466. 769.264.087.075. 371.064. 5
63.355. 352.764. 860.157.964.763. o67.175. 1
65.961.268.365. 270.8
67.474.962. 566. 567.9
69.172.477.871.868. 568.167.464.065. 3
58.457.966.257.6
Source: U. S. Department of Commerce, Bureau of the Census and Office of BusinessEconomics.
chart, per capita sales in North and South Dakota, Nebraska,Idaho, Montana, Wyoming, and Florida are considerablyhigher than average, relative to per capita income. Most ofthe Southern States are found to fall below the averageposition.
Apart from the level of income itself, there are variousfactors that may influence the sales-income position of oneState relative to the others. Among these are the tendencyfor individuals living in one State, which is credited withtheir income, to do a substantial amount of purchasing inanother State. This is especially true where a large metro-politan area spills over from one State into another. As aresult some States may show less sales relative to income thanothers. Examples of such States which are relatively low inthe general State pattern in most census years are Marylandand Connecticut.
Digitized for FRASER http://fraser.stlouisfed.org/ Federal Reserve Bank of St. Louis
September 1956

September 1956 SURVEY OF CURRENT BUSINESS 17
Also, mail-order sales are important—especially in certainStates far removed from extensive shopping centers. Thisalso would operate to lower the ratio of sales to income insuch States as well as to strengthen the share of the State inwhich the mail-order house is found or reports its sales.
Another factor strongly influencing the position of certainStates is to be found in the composition of the retail salesfigure with respect to the importance of sales which representbusiness type expenditures rather than consumption expendi-tures. For example, among the States in which sales areabove the general pattern are North and South Dakota,Idaho, Iowa, and Nebraska. In these States, as will bepointed out later, sales in the lumber, building, hardwaregroup, including farm equipment dealers, form an unusuallylarge proportion of total retail sales. This reflects in largepart purchases for use in farm production. When suchfigures are removed from all State totals the points for theseStates fall much closer to the general position of the States.
Smaller States advance relatively more
As has been pointed out above, all States shared in theretail sales advance in the last 2}^ decades. However, itis found that, in general, on a per capita basis the relativeexpansion in sales of the States at the lower end of the rangeexceeded that of the States at the upper end. This wasassociated with the similar experience in personal income.Because of the tendency—to which there are numerousexceptions—for the large States to rank toward the top inper capita income and sales, there was a decrease in therange of the relative dispersion of total as well as per capitasales by States in the later part of the period.
This narrowing of the range among the States in percapita income and sales was pronounced. For example, in1929 New York (which ranked high among the States inboth per capita income and sales) had per capita sales andincome 229 percent and 329 percent, respectively, higherthan South Carolina, the State with the lowest per capitasales and income in that year. By 1954 the range betweenthe States at the extreme ends of these scales had narrowedto 159 and 184 percent, respectively—with Nevada reportingthe largest per capita sales, Delaware the largest per capitaincome, and Mississippi the lowest per capita sales andincome.
Also of interest is the shift over the years in the relativeranking of the States. This is best measured by the rankorder correlation coefficient. Despite the narrowing of dif-ferentials the ranking of the individual States by total salesand personal income has shifted little over the 1929-54period—the rank correlation coefficient lor the 2 years 1929and 1954 was .96 for sales and .97 for income.
Even so. as many as 10 States have shown sales shifts offive ranks or more. Florida, which was 27th in order ofmagnitude with regard to sales in 1929, had risen to 12th in1954. Other States that moved up by 5 or more ranks wereVirginia that rose from 23d to 16th, South Carolina 37th to31st, Louisiana 28th to 23d, Arizona 41st to 36th and NewMexico 46th to 41st. The declines of a similar magnitudewere Oklahoma 15th to 27th, Connecticut 16th to 22d,Kansas 18th to 25th, Nebraska 25th to 30th. At the top ofthe scale, California moved up from fourth to second andPennsylvania dropped from second to fourth, while Texasmoved past Michigan and Massachusetts to go into sixthposition. These same States also tended to show shifts inincome positions.
When sales and income data are placed on a per capitabasis the shifts become more pronounced, particularly in thesales ranking. Based on per capita income, the rank correla-tion coefficient for 1929 and 1954 equaled .95 with about one-fourth of the States shifting positions by five or more ranks.
39G0160— 56 3
The coefficient for per capita sales was considerablysmaller (.85) with almost one-half of the States showingsubstantial shifts. In general, losses in position occurred inthe North, East and on the West Coast, while gains wereregistered in most South Atlantic and Mountain States.
Consumer markets by States
Market analysts are greatly interested in the pattern ofretail sales for the various types of goods as they differ fromregion to region. Variations in resources, climate, industrialstructure and other factors lead to considerable variation inthis pattern from one geographic area to another.
An analysis of the regional data by lines of trade for the1954 Census of Business throws some light on regionalexpenditure patterns in the various States and regions.For this purpose nine kinds of businesses were used whichare broad in coverage yet provide some useful marketingguides. Commodity data were not collected in the 1954census.
The census tabulations show that in the 1929-54 periodincreasing percentages of the dollars spent at retail storeswere taken by automotive stores, gasoline service stations,and food stores; offset by declining portions of the dollargoing to apparel and general merchandise stores. Theremaining groups showed moderate declines. These shiftsoccurred uniformly in the various regions.
Both cyclical and secular factors account for distributionshifts during this period. High automotive sales reflectgeneral increases in living standards, particularly in thelower and medium brackets, and the increased needs arisingfrom suburban living as well as the high level of income. Thetrend toward urbanization and more balanced diets withtheir greater emphasis on higher cost food have increasedfood store sales; the increasing volume of nonfood itemshandled in supermarkets is also important. The sharprise in sales by eating and drinking places since 1929 reflectsin large part the repeal of prohibition. Apparel and generalmerchandise sales, being primarily nondurable items, areless sensitive to cyclical swings. Hence their relation tototal sales would decline in periods of prosperity and riseduring cyclical downswings.
When we analyze the percentage ranges for each kind ofbusiness for each of the States, we note an increasing uni-formity in the distribution of retail sales over the successivecensuses in the 1929-54 period. Most major groups showa narrowing of range from the highest to the lowest States.However, the range for drug stores changed little during thisperiod, while that for the building materials and farmimplement group widened.
The narrowing of the income range throughout the UnitedStates may have been a factor in increasing the uniformity.Modern transportation and mass advertising also operatetoward making product demand more uniform throughoutthe country.
The sharpest contraction in disparity7 among the Statesoccurred in general merchandise and food stores. The vir-tual disappearance of general stores which used to differen-tiate urban and rural States in these 2 lines of trade, has beena factor increasing the uniformity among the States. Ap-parel stores and eating and drinking places also showed aconsiderable narrowing in range between the percent of theretail dollar spent in the highest and lowest State.
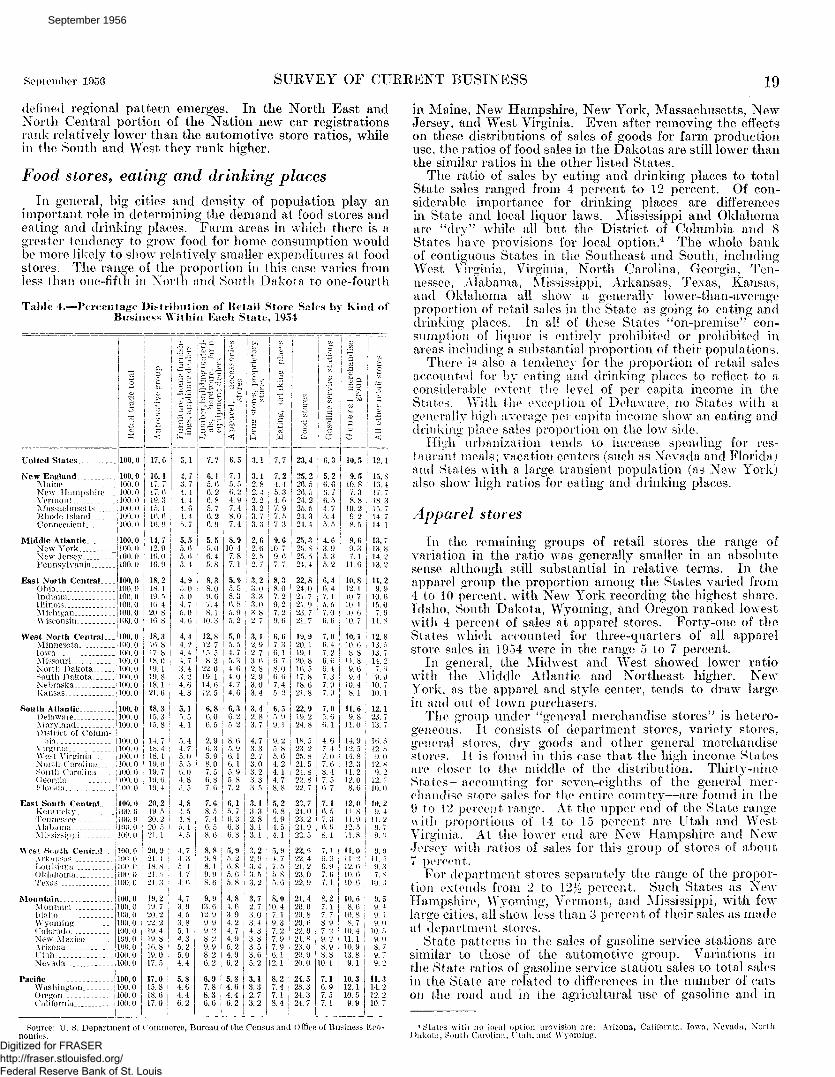
Table 4 shows a percentage distribution of State and re-gional sales by major kinds of business for 1954. It is seenfrom the table that the distributions of retail sales amongmajor kinds of business vary markedly7 from State to State.For example, in the lumber, building, hardware group (in-cluding farm equipment dealers), the range of variation isfrom 3 percent in the lowest State to 22 percent in the high-
Digitized for FRASER http://fraser.stlouisfed.org/ Federal Reserve Bank of St. Louis
September 1956
18 SURVEY OF CURRENT BUSINESS September 1956
est; for furniture and appliance stores the range is from 3 to6 percent and for drug stores from 2 to 5 percent.
Lumber, hardware, and farm equipment dealersIn the case of this group of retail stores the range of vari-
ation, as already indicated, is widest. For example, it was5 percent in New York and around 20 percent in the Dakotas.It is noted that the States with the greatest proportion ofretail sales going to this category—the Dakotas, Iowa,Nebraska, Montana, Idaho, Minnesota, and Kansas—arethose in which agriculture is important. In addition toproducts largely confined to farm use, demand for lumber andbuilding materials from retail outlets is likely to be relativelygreater in farm then in urbanized areas. The major portionof sales by these types of establishments go not for consumeruse, as in most retail stores but rather for construction andgeneral farm use.
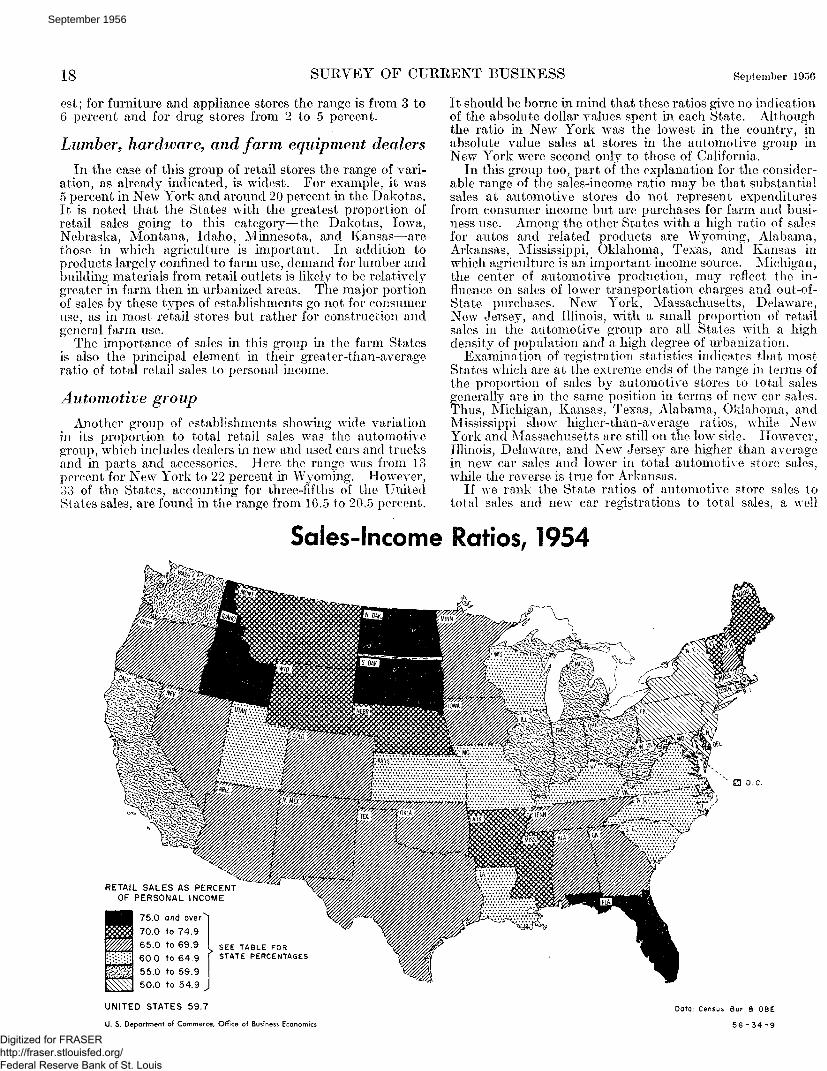
The importance of sales in this group in the farm Statesis also the principal element in their greater-than-averageratio of total retail sales to personal income.
Automotive groupAnother group of establishments showing wide variation
in its proportion to total retail sales was the automotivegroup, which includes dealers in new and used cars and trucksand in parts and accessories. Here the range was from 13percent for New York to 22 percent in Wyoming. However,33 of the States, accounting for three-fifths of the UnitedStates sales, are found in the range from 16.5 to 20.5 percent.
It should be borne in mind that these ratios give no indicationof the absolute dollar values spent in each State. Althoughthe ratio in New York was the lowest in the country, inabsolute value sales at stores in the automotive group inNew York were second only to those of California.
In this group too, part of the explanation for the consider-able range of the sales-income ratio may be that substantialsales at automotive stores do not represent expendituresfrom consumer income but are purchases for farm and busi-ness use. Among the other States with a high ratio of salesfor autos and related products are Wyoming, Alabama,Arkansas, Mississippi, Oklahoma, Texas, and Kansas inwhich agriculture is an important income source. Michigan,the center of automotive production, may reflect the in-fluence on sales of lower transportation charges and out-of-State purchases. New York, Massachusetts, Delaware,New Jersey, and Illinois, with a small proportion of retailsales in the automotive group are all States with a highdensity of population and a high degree of urbanization.
Examination of registration statistics indicates that mostStates which are at the extreme ends of the range in terms ofthe proportion of sales by automotive stores to total salesgenerally are in the same position in terms of new car sales.Thus, Michigan, Kansas, Texas, Alabama, Oklahoma, andMississippi show higher-than-average ratios, while NewYork and Massachusetts are still on the low side. However,Illinois, Delaware, and New Jersey are higher than averagein new car sales and lower in total automotive store sales,while the reverse is true for Arkansas.
If we rank the State ratios of automotive store sales tototal sales and new car registrations to total sales, a well
Sales-Income Ratios, 1954
a o.c.
RETAIL SALES AS PERCENTOF PERSONAL INCOME
75.0 and over
70.0 to 74.9
65.0 to 69.9
60.0 to 64.9
55.0 to 59.9
50.0 to 54.9
SEE TABLE FORSTATE PERCENTAGES
UNITED STATES 59.7
U. S. Department of Commerce, Office of Business Economics
Data: Census Bur. 3 QBE
56 - 3 4 - 9
Digitized for FRASER http://fraser.stlouisfed.org/ Federal Reserve Bank of St. Louis
September 1956
September 1956 SURVEY OF CURRENT BUSINESS 19
defined regional pattern emerges. In the North East andNorth Central portion of the Nation new car registrationsrank relatively lower than the automotive store ratios, whilein the South and West they rank higher.
Food stores, eating and drinking places
In general, big cities and density of population play animportant role in determining the demand at food stores andeating and drinking places. Farm areas in which there is agreater tendency to grow food for home consumption wouldbe more likely to show relatively smaller expenditures at foodstores. The range of the proportion in this case varies fromless than one-fifth in North and South Dakota to one-fourth
Table 4,~ -Pereciilage Distribution of Retail Store Sales by Kind ofBusiness Within Each State, 1954
New EnglandMaine . . _ _ _New Hampshire--VermontMassachusettsRhode Island _ _ j l ( ) ( ) . 0Connecticut j 100.0
Middle Atlantic ! 100.0 j 14.7 5.5New York J lOO.O ! 12.9 | 5.6New Jersey 100.0Pennsylvania 100.0
East North CentralOhioIndianaIllinois ;M ichigan 1100.0Wisconsin j 100.0
West North Central...MinnesotaIowaMissouri 100.0North Dakota .. ilOO. 0South Dakota j 100.0Nebraska 100.0Kansas 100.0
South Atlantic __________Delaware ____________Maryland ____________District of Colurn-
b i i
J loud i
East South Centralkent iu k v! enne^eeM i b r m aM i^issipj i
Wes< S« i«th Cent, jlV i M i ^LOUIM nia
< )kl ihomaTexas
MountainMontana _ _ _IdahoWyomingColoradoNew Mexico..A rizonaUtahNevada
PacificWashington..Oregon.California
100.
u. u0.0
0.00.00.00.00.00.0
0.00.00.00.00.00.00.00.0
0.00.00.0
0.00.00.00 00 00 00 0
0.00 0) 0) 0x 0
0.01 0) 0} ()) I)
9.0).0) . ( )).03.03.0).()U)3.0
).o3.03.03.0
10. u16.9
18.218. 119. 510.420.8K). 8
18.3IB. 817.818.019. 119. 818.121.0
18.315 3lo! 8
14.7lw 418. 119 ()19.719 I)19 4
20.219 T20 220 T21. 1
20.921 11* S2121 3
19.219.7 ;20. 222.219.419.810. 819.017.5 j17.015.818.617.0
o. u5.4
4.95.05.04. 75.04. G
4.44 24'. 44.73.43.24.64.8
5.15. 54.1
r> 44 75.05 >() 01 8i 5
4.84 51 8i 1i ->
4.74 3i 14 7
1- < >
4.73. 94.53.85.14.35.25.04.4
5.84.64.46.2
u. ^5.8
8.38.09.67.48.1
10.3
12.812.715. 58.3
22.019.114.612.5
6.86.06.5
2.9G 35.98 07. 5(> 87 b
7.68.57 4b 58 0
8.89 88. 19 9S b
9.913.612. 99.99.28.29.98.26.2
6.97.88.36.6
/ . o7. 1
5.95. 55.36.85.95.2
5.05. 54.75.34.64.04.74.6
6.36.25.2
8 65.9() 16 15 95 S7.2
6.15 76.36 j(> 3
5.95 2b 85 b5.8
4.84.63.94.24.74.95.24.96.2
5.84.64.46.2
4. 0
2.7
3.23.03.33.03.82 7
3.12.92.73.62.82.93.03.4
3.42.83.7
4 73 32 73 03 23 33 5
3,1o 32 S3. 13 1
t.22 93 11 ">3 2
3.72.73.03.44.33.83.53.65.2
3.13.32.73.2
y. o
8.38.07.29.27.29. 6
6.67.36.16.78.06. 67.45.2
6.55. 99.1
9 25 85 64.24.14.78 8
5.2b S4 91 i4.1
5.9\ 7t r>'> 85 0
8.010.47. 19! 37. 27.97.96.1
12.1
8.27.47. 18.4
6,3. 024.4
22.824.021.721. 923. 721.7
19.920.119. 120. 816. 517.818.621.8
22.919.224.8
18 ~,2 < 225 821 524 822 8^2 7
23. 724*023 22t 922 3
22.622 421.223 022.9
21.420.020.820.622.021.823.020.920.0
24.523.324.324.7
0. 0
5.2
6.46.47. 15.57.06. 6
7.06.47 26.66.47.37.97.9
7.05. 66. 1
1 b7 17 07 (>s 17. 5b 7
7.1(> 57.3b tX
7,u() 97 (>7.1
8.27. 17. 78.97.29.28.98.8
10.1
7.16.97. 57.1
i t. i11.6
10.812. 110. 710.110.610.7
i10.1
i 10. 61 8.8: 11.8
9.69.4
10.48.1
11.69.8
11.0
11 912 T14 812.311.212 08 6
12.011 811.912 511 *>
11.011 212 b10 b10 b
10,68.6
10. 8
W. 411.110.913.89.1
10.312.110.59.9
i I*.
| 13.
11.9.
10.15.
7_1L
12.13.13.14.
79!
10.10.
12.23.13.
Ib129.
129.
1210.
10.)
11.99
a
l l "97
10.
9.9.9.9.i
10.9. (8.9.9.
11..14.12..10.
in Maine, New Hampshire, New York, Massachusetts, NewJersey, and West Virginia. Even after removing the effectson these distributions of sales of goods for farm productionuse, the ratios of food sales in the Dakotas are still lower thanthe similar ratios in the other listed States.
The ratio of sales by eating and drinking places to totalState sales ranged from 4 percent to 12 percent. Of con-siderable importance for drinking places are differencesin State and local liquor laws. Mississippi and Oklahomaare "dry" while all but the District of Columbia and 8States have provisions for local option.4 The whole bankof contiguous States in the Southeast and South, includingWest Virginia, Virginia, North Carolina, Georgia, Ten-nessee, Alabama, Mississippi, Arkansas, Texas, Kansas,and Oklahoma all show a generally lower-than-averageproportion of retail sales in the State as going to eating anddrinking places. In all of these States "on-premise" con-sumption of liquor is entirely prohibited or prohibited inareas including a substantial proportion of their populations.
There is also a tendency for the proportion of retail salesaccounted for by eating and drinking places to reflect to aconsiderable extent the level of per capita income in theStates. With the exception of Delaware, no States with agenerally high average per capita income show an eating anddrinking place sales proportion on the low side.
High urbanization tends to increase spending for res-taurant meals; vacation centers (such as Nevada and Florida)and States with a large transient population (as New York)also show high ratios for eating arid drinking places.
Apparel stores
In the remaining groups of retail stores the range ofvariation in the ratio was generally smaller in an absolutesense although still substantial in relative terms. In theapparel group the proportion among the States varied from4 to 10 percent, with New York recording the highest share.Idaho, South Dakota, Wyoming, and Oregon ranked lowestwith 4 percent of sales at apparel stores. Forty-one of theStates which accounted for three-quarters of all apparelstore sales in 1954 were in the range 5 to 7 percent.
In general, the Midwest and West showed lower ratiowith the Middle Atlantic and Northeast higher. NewYork, as the apparel and style center, tends to draw largein and out of town purchasers.
The group under "general merchandise stores" is hetero-geneous. It consists of department stores, variety stores,general stores, dry goods and other general merchandisestores. It is found in this case that the high income Statesare closer to the middle of the distribution. Thirty-nineStates—accounting for seven-eighths of the general mer-chandise store sales for the entire country—are found in the9 to 12 percent range. At the upper end of the State rangewith proportions of 14 to 15 percent are Utah and WestVirginia. At the lower end are New Hampshire and NewJersey with ratios of sales for this group of stores of about7 percent.
For departapartment stores separately the range of the propor-tion extends from 2 to 12K percent. Such States as NewHampshire, Wyoming, Vermont, and Mississippi, with fewlarge cities, all sho\v less than 3 percent of their sales as madeat department stores.
State patterns in the sales of gasoline service stations aresimilar to those of the automotive group. Variations inthe State ratios of gasoline service station sales to total salesin the State are related to differences in the number of carson the road and in the agricultural use of gasoline and in
Source: U. S. Department of Commerce, Bureau of the Census and Office of Business Economics.
* States with no local option provision are:Dakota, South Carolina, l"tah,and Wyoming.
Arizona, California, Iowa, Nevada, North
Digitized for FRASER http://fraser.stlouisfed.org/ Federal Reserve Bank of St. Louis
September 1956

20 SURVEY OF CURRENT BUSINESS September 1956
the density of population. Here the lowest proportions,4 and 5 percent, are shown in the Middle Atlantic and NewEngland States (New York is lowest among the States withslightly less than 4 percent), while the Midwest and WesternStates show the high proportions. In Nevada 10 percent oftotal sales is found in this group, with 9 percent shown forWyoming, New Mexico, Arizona, and Utah.
The furniture and appliance store and drug store cate-
gories showed the smallest absolute variations in the pro-portions of their sales within each State. In each trade,the ratios for each of the States fell within the range of3 percentage points with drug stores receiving 2 to 5 percentof the retail dollar and only 4 States falling at the 2 extremes,and furniture and appliance stores receiving 3 to 6 percent.The higher income States reported the larger percentagesof furniture and appliance store sales.
Balance of Payments .(Continued from page 10)
New issues of securities remained relatively high. Mostof the funds went to Canada, but Australia also floatedbonds in this market. Bond retirements were considerablysmaller than last year when repurchases by Canada wereunusually high.
Over the last 3% years the general expansion in interna-tional transactions of the United States—as indicated bythe chart—was determined more by transactions with non-European countries than by those with Europe and its de-pendencies. The difference between payments and receipts,however, resulted largely from our transactions with Europe.
The excess of United States payments to Europe duringthe first 2 quarters of 1956 was more than $700 million, $100million less than a year earlier. Thus the excess of UnitedStates payments continued with relatively little change andon a large scale, although United States exports of goods andservices to the area increased by about $550 million andUnited States Government nonmilitary grants and loansdeclined by about $250 million.
To a minor extent these changes, totaling $800 million,were offset by a $75 million increase in military expenditures.More important, however, were the increase in privateUnited States purchases of goods and services whichamounted to about $440 million, and the rise in the outflow ofprivate capital by about $175 million. Thus Europe wasable to expand exports and attract private capital in amountssufficient not only to compensate for a decline in UnitedStates Government payments but to finance at the sametime a large increase in its purchases here.
The rise in European gold and dollar holdings during thefirst 6 months of 1955 and 1956 was smaller than the netbalance of paj^ments with the United States because ofEuropean deficits with other areas, particularly Canada.During the first half of this year the rise in European dollarholdings was also kept down by repayment by France of $45million to the International Monetary Fund. Total addi-tions to European gold and dollar holdings during the firsthalf of this year were, nevertheless, not far from $500 million.Most of this rise took place in the first quarter, as net pay-ments by Europe to other areas (including the MonetaryFund) seem to have increased sharply in the second quarter.Liquid dollar holdings by Europe during the second quarterrose by only $20 million, but it may be assumed that Euro-pean gold stocks increased through purchases from newproduction or from reserves of other countries. The principalchanges in reserves during the first half of 1956 were lossesby France and gains by Germany and the United Kingdom.
Transactions with the non-European countries during the3l/2 years covered by the chart showed a rather close balancebetween receipts and payments. Except for the first quarterof 1953 United States payments did not exceed receipts bymore than $200 million and the highest quarterly amount bywhich United States receipts exceeded United States pay-ments was $125 million. During the last five quarters ofthis period, however, United States expenditures continu-ously exceeded United States receipts.
The close relationship of our expenditures in and receiptsfrom non-European countries results ia part from thesizeable amount of the transactions which do not involveactual transfers of money, and consequently appear immedi-ately on both sides of the accounts. Among these areexports which are sent out as grants, loans or investments,and the income receipts and the return flow of capital,which are obtained by the owners through imports of goodsproduced by their foreign enterprises.
In part, however, this close balance is due to the generalpractice of most of the countries included here of keepingtheir dollar expenditures as high as their current dollarincome permits.
Of course, the transactions of the United States do notbalance with each of these non-European countries indi-vidually. Transactions with Canada usually result in alarge excess of United States receipts which is financed byCanadian surplus with Europe; transactions with the FarEastern countries often result in an excess of United Statespayments which these countries, in turn, use for paymentsto other countries. The fact that net United States pay-ments to some countries in that area more or less equal netUnited States receipts from the others indicates that, onbalance, dollars have not been paid so far by these countriesto Europe and that except for purchases of newly mined ordishoarded gold and some gold from the Soviet bloc Europehas so far not augmented its reserves through transactionswith countries other than the United States.
The rise in United States interchange from the first halfof 1955 to the first half of this year affected all the majornon-European areas. The rise in United States expendituresin Canada was 29 percent, while payments to Latin Americaas well as to the independent countries of Asia and Africarose by 15 percent. The relatively larger rise in payments toCanada resulted mainly from the higher outflow of UnitedStates capital; imports of goods and services increased bynot quite 12 percent. Canadian expenditures in the UnitedStates rose by about the same absolute amount as UnitedStates payments to Canada, but relatively the increase wassomewhat smaller.
The rise in our payments to Latin America was mostlythe result of higher purchases of goods and services. Theoutflow of United States capital also rose, but not by a largeamount. Latin American payments to the United Statesincreased by the same amount as our payments to that area,so that the very small excess of United States receiptsremained practically unchanged.
In our transactions with the independent countries of Asiaand Africa, the increase in the outflow of U. S. Governmentcapital and nonmilitary grants was an important element.United States imports from these countries rose considerablyfaster than those from Latin America or Canada, but privateinvestments and other transactions expanded relatively little.Expenditures by these countries in the United States rosemuch less than our expenditures there, but the increase intheir net dollar receipts seems to have been spent on trans-actions not recorded in the United States balance of pay-ments, including those which resulted in payments to otherareas.
Digitized for FRASER http://fraser.stlouisfed.org/ Federal Reserve Bank of St. Louis
September 1956