bound report 1 - retail attractions - economic development
TRANSCRIPT

MARKET ASSESSMENT
Prepared and presented byRetail Attractions, LLC
12150 East 96th St North, Suite 202Owasso, Oklahoma 74055
Tel: (918) 376-6707Fax: (918) 272-5376
www.retailattractions.com
CITY OF GLENPOOL, OKLAHOMA
2013
Ed Tinker, City Manager
Prepared and presented toCity of Glenpool
140 W 141stGlenpool, OK 74033Tel: (918) 322-5409Fax: (918) 322-5433

TABLE OF CONTENTSABOUT THE CITY OF GLENPOOL
Location and AccessibilityDevelopment Assets and ConcernsBusiness EnvironmentPopulation GrowthRetail EnvironmentAction ItemsSales Tax RevenueBuilding Permits
Area MapPopulation by AgePopulation by RacePopulation by IncomePopulation by EducationPopulation by OccupationHousing Value Distribution
DEMOGRAPHIC PROFILE - CITY LIMITS
Area MapPopulation by AgePopulation by RacePopulation by IncomePopulation by EducationPopulation by OccupationHousing Value Distribution
DEMOGRAPHIC PROFILE - PRIMARY TRADE AREA
Nielsen Claritas Retail Market PowerRetail CategoriesOpportunity Gap - Primary Trade AreaOpportunity Gap - City Limits
OPPORTUNITY GAP
DEFINING TRADE AREA
RETAIL ATTRACTIONS
ACKNOWLEDGEMENTS AND DISCLAIMER
33345789
19202122232425
12131415161718
26272830
10
36
About UsOur StaffOur MethodologyOur Data
32333435
2Glenpool Market Assessment | Retail Attractions, LLC

The City of Glenpool is located on Highway 75, the main portal to the greater Tulsa MSA from the south. Highway 75 runs south to north through the Glenpool community into Tulsa's downtown business district. The Highway 75 corridor creates a vibrant retail market that has recently exploded. The access from Highway 75 creates a regional base for consumers along an eight mile corridor through the city. Traffic counts on Highway 75 at Glenpool indicate 45,000 vehicles a day passing through Glenpool. Glenpool is centered in the fast-growing South County area of the Tulsa MSA and is expected to continue to grow rapidly through the next 5 to 10 years.
The City of Glenpool has created an environment in the community that is pro-growth and pro-business. Although growth has been slow, Glenpool did show positive growth over the last decade unlike countless other rural Oklahoma communities. Residential construction totals show an increase of 661 new residential permits in the city limits over the past five years totaling nearly $70 million in value. Glenpool benefits from its location on Highway 75 with average daily traffic counts of more than 36,000 vehicles per day travel to and through Glenpool making the area a regional collection point for retail shopping opportunities.
ABOUT THE CITY OF GLENPOOL
DEVELOPMENT ASSETS AND CONCERNS
LOCATION AND ACCESSIBILITY
The City of Glenpool has created an environment where public/private partnerships expedite both the timing and profitability of investments in the community. The City of Glenpool is actively seeking additional retail development to fill identified product and service gaps and offers retail incentives. The City administration understands the necessity for public-private partnerships to facilitate retail development and works to make the development process as streamlined as possible.
BUSINESS ENVIRONMENT
3Glenpool Market Assessment | Retail Attractions, LLC
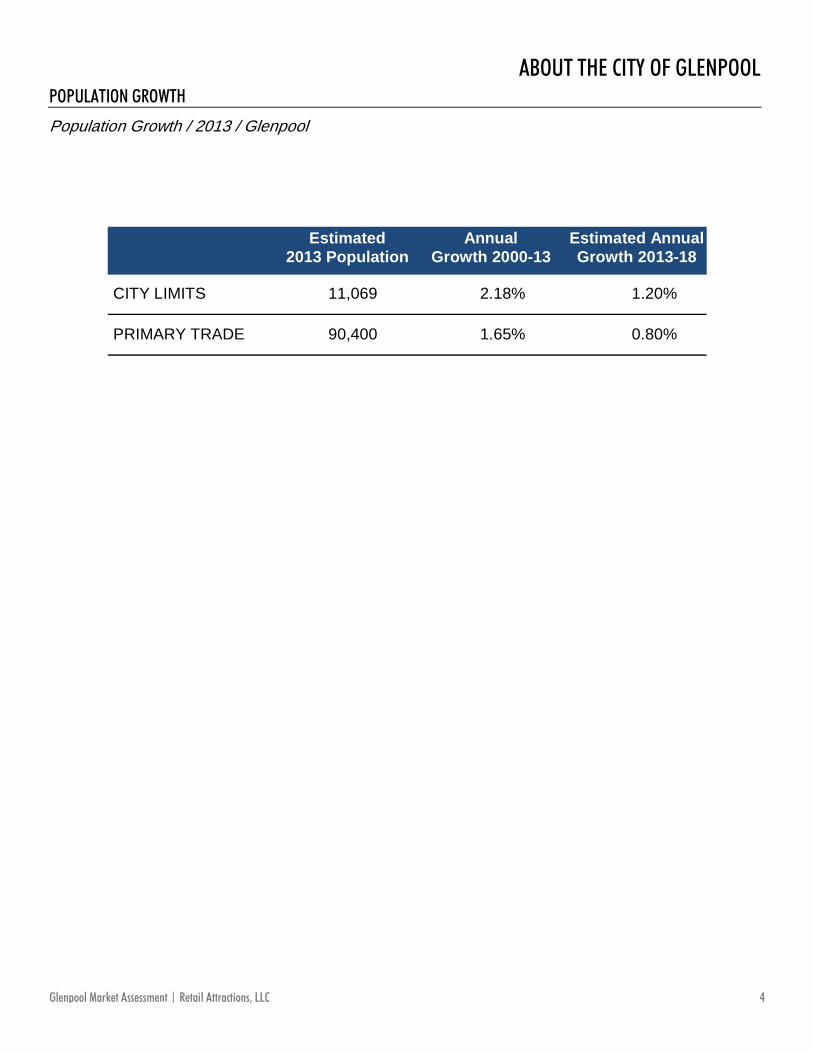
POPULATION GROWTH
Population Growth / 2013 / Glenpool
ABOUT THE CITY OF GLENPOOL
Estimated AnnualGrowth 2013-18
AnnualGrowth 2000-13
Estimated2013 Population
11,069 2.18% 1.20%CITY LIMITS
90,400 1.65% 0.80%PRIMARY TRADE
4Glenpool Market Assessment | Retail Attractions, LLC

ABOUT THE CITY OF GLENPOOLRETAIL ENVIRONMENT
Several national chains are currently located in Glenpool including Sonic, Subway, Papa Johns, Arby's, IHOP, Oreillys, and Dollar General. However, the opportunity gap shows that there are still significant leakages in the general merchandise and food & beverage store sectors.
Glenpool serves as the retail source for the nearby towns of Kiefer, Mounds, and Winchester. Residential construction totals show an increase of 661 new residential homes in the past five years. Benefiting from its location on Highway 75, average daily traffic counts of more than 36,000 vehicles per day travel to and through Glenpool making the Glenpool area a regional collection point for retail shopping opportunities.
5Glenpool Market Assessment | Retail Attractions, LLC

RETAIL CATEGORY ANNUAL LEAKAGE
TOTAL RETAIL LEAKAGE
General Merchandise
Non-Store Retailers
Food and Beverage Stores
Building Materials and Garden Eqpt
Health and Personal Care
Full Service Restaurants
Limited Service Restaurants
Clothing and Clothing Accessories
Sporting Goods, Hobby, Books and Music
Appliances, TVs, Electronics
Furniture and Home Furnishings
Office Supplies, Stationery, Gift
$675,208,387
$139,336,141
$101,941,118
$79,988,476
$58,807,624
$46,903,310
$46,039,779
$40,680,912
$40,176,468
$19,698,428
$14,377,758
$13,495,563
$11,166,426
PRIMARY TRADE
ABOUT THE CITY OF GLENPOOLRETAIL ENVIRONMENT
A category with retail leakage indicates revenue leaving a market and an unmet demand in that category. When consumers from an area are spending more for goods than the businesses in that area are providing, that area has retail leakage. Categories with retail leakage suggest that the area can support additional retailers in those categories. Several categories in the Glenpool primary trade area show significant leakages as shown below. The total retail leakage includes categories not listed in the table below. The categories listed are highlighted categories which show substantial leakage in the market.
6Glenpool Market Assessment | Retail Attractions, LLC

ACTION ITEMS
For Glenpool to maximize its retail potential moving forward, Retail Attractions would recommend the following considerations:
ABOUT THE CITY OF GLENPOOL
Engage the entire community to establish ownership, support, and participation from a broad cross-section of the stakeholders.
Develop a cooperative effort from local governing bodies including city, county, state, school and other community organizations.
Develop and enhance the depth and consistency of the pool of individuals for local leadership and develop a shared vision for leadership of the community.
Improve the image of the community in terms of aesthetics. Cleanup, beautify, and do whatever is feasible to present the best "look" for the city.
Develop short and long-range plans to deal with new growth and the maintenance of infrastructure systems including transportation, water, sanitary sewer, and storm sewer. This will allow the community to be able to accommodate potential development investments in an efficient and timely manner.
Develop and modernize IT infrastructure including an up to date city and ED website, staying active in social media, and providing adequate internet speeds to businesses and residents.
Develop modern, up-to-date, accurate and informative marketing material.
Develop a strategy for incentives and public-private partnerships that are effective and make sense for the community. Evaluate opportunities to pursue Tax Increment Financing (TIF) Districts and Tax Increment Reinvestment Zones.
Identify and pursue grant funding opportunities when available.
Assess city's development protocol with the goal of making the process as efficient as possible. Identify and train key personnel so that when opportunity knocks, the community responds immediately.
7Glenpool Market Assessment | Retail Attractions, LLC
$0
$1,000,000
$2,000,000
$3,000,000
$4,000,000
$5,000,000
$6,000,000
2003 2004 2005 2006 2007 2008 2009 2010 2011 2012
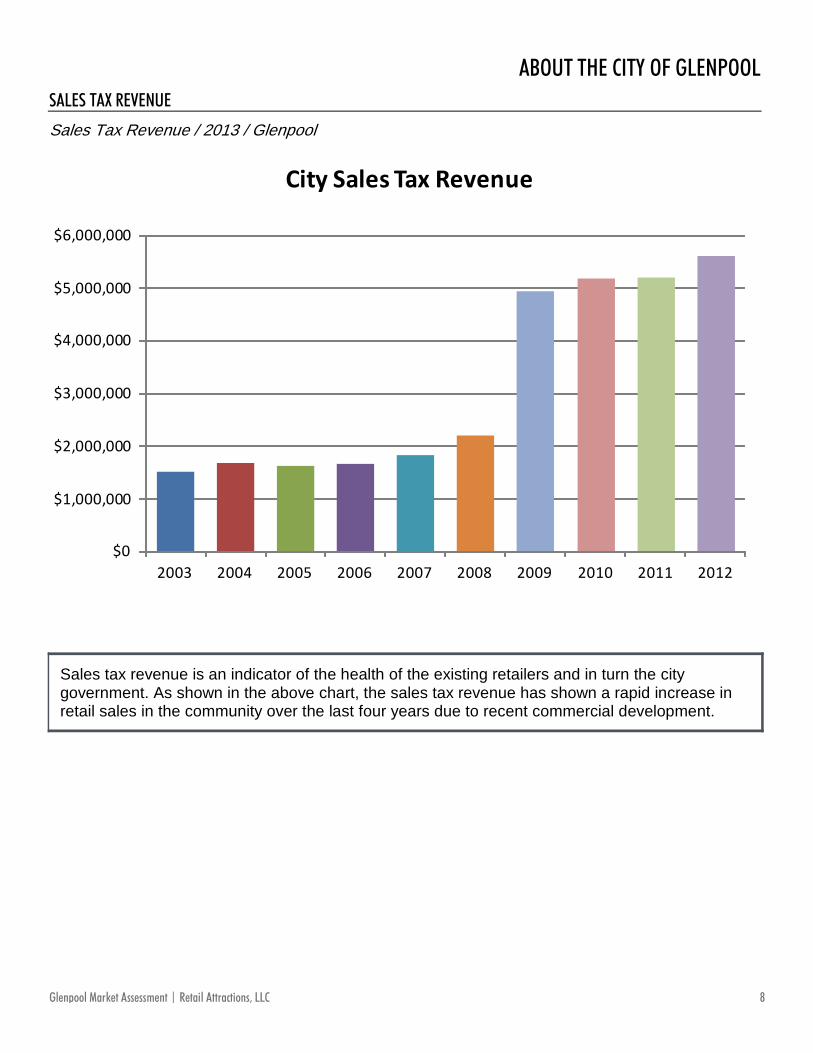
City Sales Tax Revenue
ABOUT THE CITY OF GLENPOOLSALES TAX REVENUE
Sales tax revenue is an indicator of the health of the existing retailers and in turn the city government. As shown in the above chart, the sales tax revenue has shown a rapid increase in retail sales in the community over the last four years due to recent commercial development.
Sales Tax Revenue / 2013 / Glenpool
8Glenpool Market Assessment | Retail Attractions, LLC
ABOUT THE CITY OF GLENPOOL
0
20
40
60
80
100
120
140
160
180
200
2002 2003 2004 2005 2006 2007 2008 2009 2010 2011
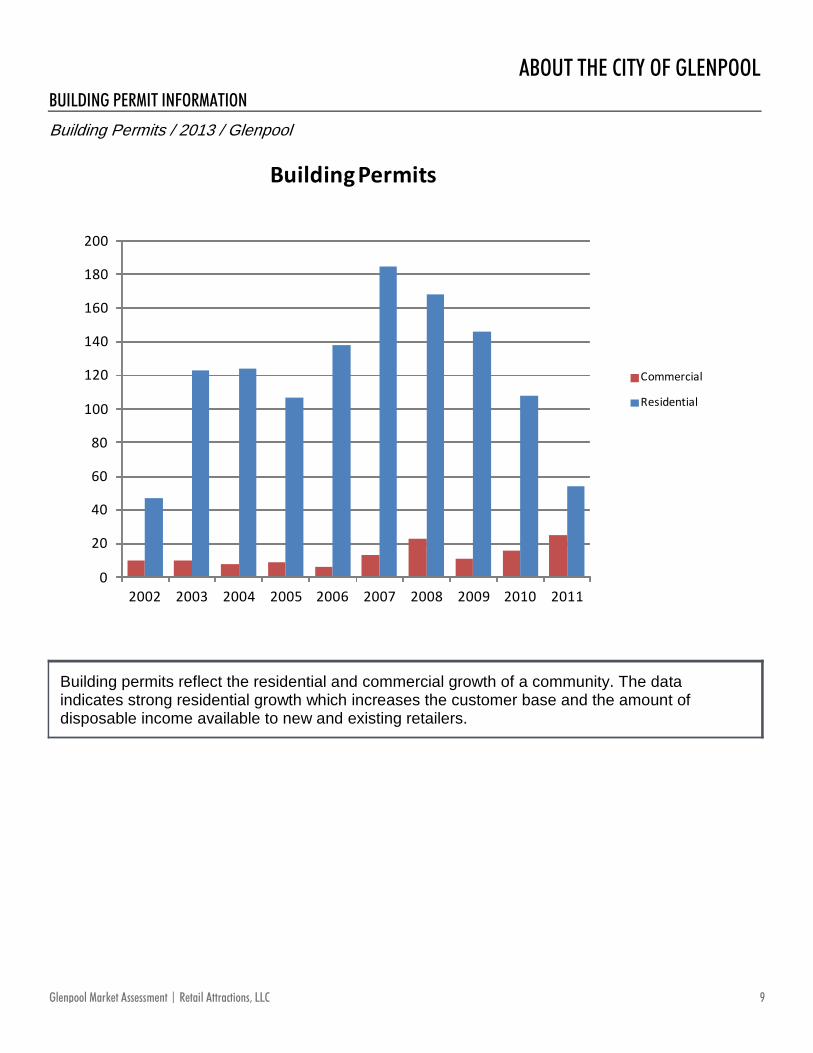
Building Permits
Commercial
Residential
BUILDING PERMIT INFORMATION
Building permits reflect the residential and commercial growth of a community. The data indicates strong residential growth which increases the customer base and the amount of disposable income available to new and existing retailers.
Building Permits / 2013 / Glenpool
9Glenpool Market Assessment | Retail Attractions, LLC
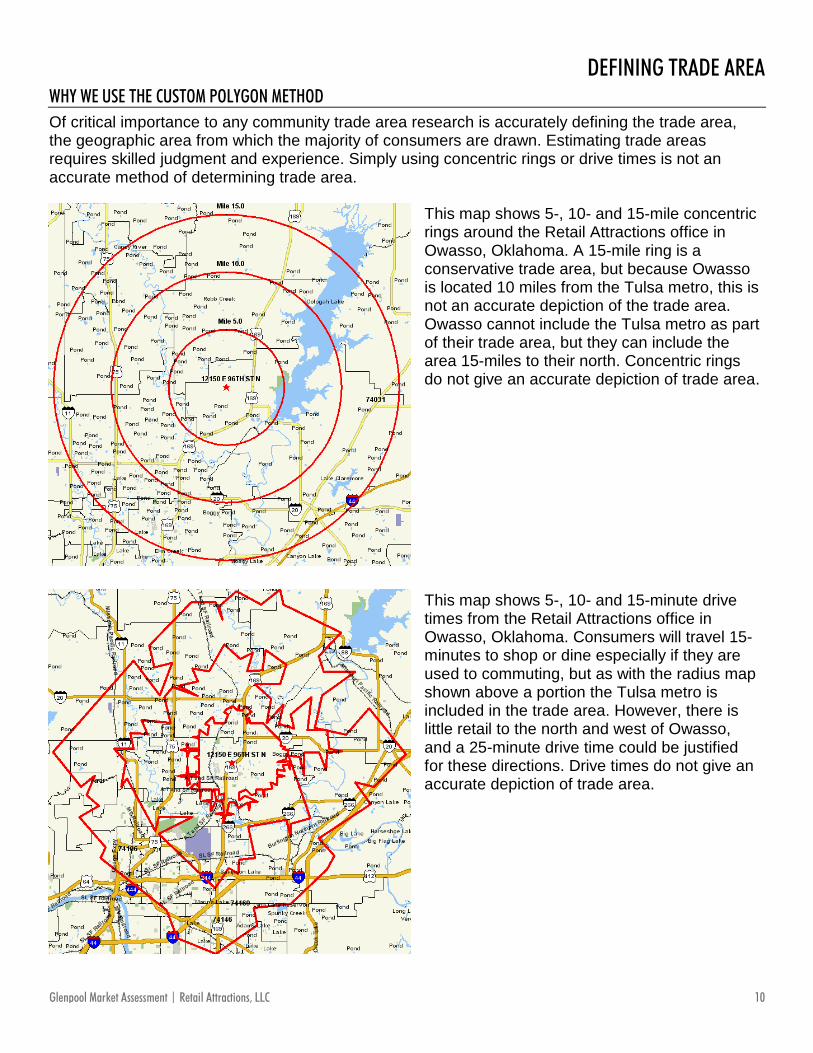
Of critical importance to any community trade area research is accurately defining the trade area, the geographic area from which the majority of consumers are drawn. Estimating trade areas requires skilled judgment and experience. Simply using concentric rings or drive times is not an accurate method of determining trade area.
WHY WE USE THE CUSTOM POLYGON METHODDEFINING TRADE AREA
This map shows 5-, 10- and 15-mile concentric rings around the Retail Attractions office in Owasso, Oklahoma. A 15-mile ring is a conservative trade area, but because Owasso is located 10 miles from the Tulsa metro, this is not an accurate depiction of the trade area. Owasso cannot include the Tulsa metro as part of their trade area, but they can include the area 15-miles to their north. Concentric rings do not give an accurate depiction of trade area.
This map shows 5-, 10- and 15-minute drive times from the Retail Attractions office in Owasso, Oklahoma. Consumers will travel 15-minutes to shop or dine especially if they are used to commuting, but as with the radius map shown above a portion the Tulsa metro is included in the trade area. However, there is little retail to the north and west of Owasso, and a 25-minute drive time could be justified for these directions. Drive times do not give an accurate depiction of trade area.
10Glenpool Market Assessment | Retail Attractions, LLC
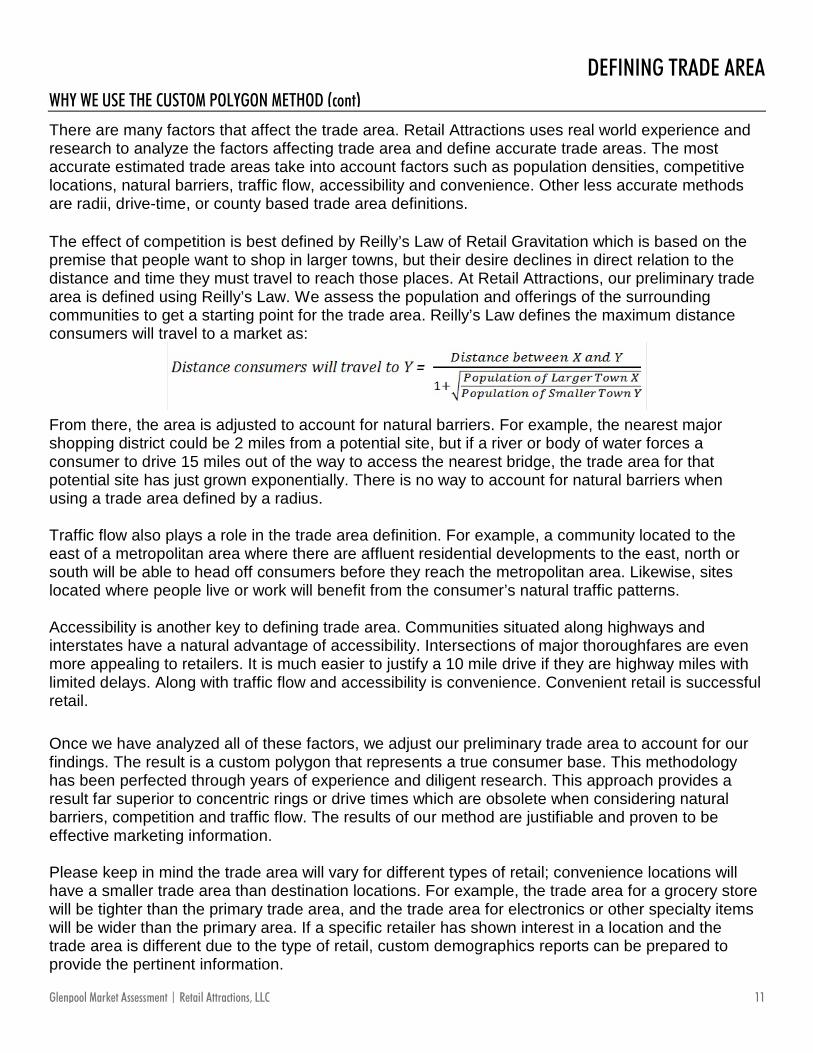
The effect of competition is best defined by Reilly’s Law of Retail Gravitation which is based on the premise that people want to shop in larger towns, but their desire declines in direct relation to the distance and time they must travel to reach those places. At Retail Attractions, our preliminary trade area is defined using Reilly’s Law. We assess the population and offerings of the surrounding communities to get a starting point for the trade area. Reilly’s Law defines the maximum distance consumers will travel to a market as:
WHY WE USE THE CUSTOM POLYGON METHOD (cont)
DEFINING TRADE AREA
From there, the area is adjusted to account for natural barriers. For example, the nearest major shopping district could be 2 miles from a potential site, but if a river or body of water forces a consumer to drive 15 miles out of the way to access the nearest bridge, the trade area for that potential site has just grown exponentially. There is no way to account for natural barriers when using a trade area defined by a radius.
Traffic flow also plays a role in the trade area definition. For example, a community located to the east of a metropolitan area where there are affluent residential developments to the east, north or south will be able to head off consumers before they reach the metropolitan area. Likewise, sites located where people live or work will benefit from the consumer’s natural traffic patterns.
Accessibility is another key to defining trade area. Communities situated along highways and interstates have a natural advantage of accessibility. Intersections of major thoroughfares are even more appealing to retailers. It is much easier to justify a 10 mile drive if they are highway miles with limited delays. Along with traffic flow and accessibility is convenience. Convenient retail is successful retail.
Once we have analyzed all of these factors, we adjust our preliminary trade area to account for our findings. The result is a custom polygon that represents a true consumer base. This methodology has been perfected through years of experience and diligent research. This approach provides a result far superior to concentric rings or drive times which are obsolete when considering natural barriers, competition and traffic flow. The results of our method are justifiable and proven to be effective marketing information.
Please keep in mind the trade area will vary for different types of retail; convenience locations will have a smaller trade area than destination locations. For example, the trade area for a grocery store will be tighter than the primary trade area, and the trade area for electronics or other specialty items will be wider than the primary area. If a specific retailer has shown interest in a location and the trade area is different due to the type of retail, custom demographics reports can be prepared to provide the pertinent information.
There are many factors that affect the trade area. Retail Attractions uses real world experience and research to analyze the factors affecting trade area and define accurate trade areas. The most accurate estimated trade areas take into account factors such as population densities, competitive locations, natural barriers, traffic flow, accessibility and convenience. Other less accurate methods are radii, drive-time, or county based trade area definitions.
11Glenpool Market Assessment | Retail Attractions, LLC
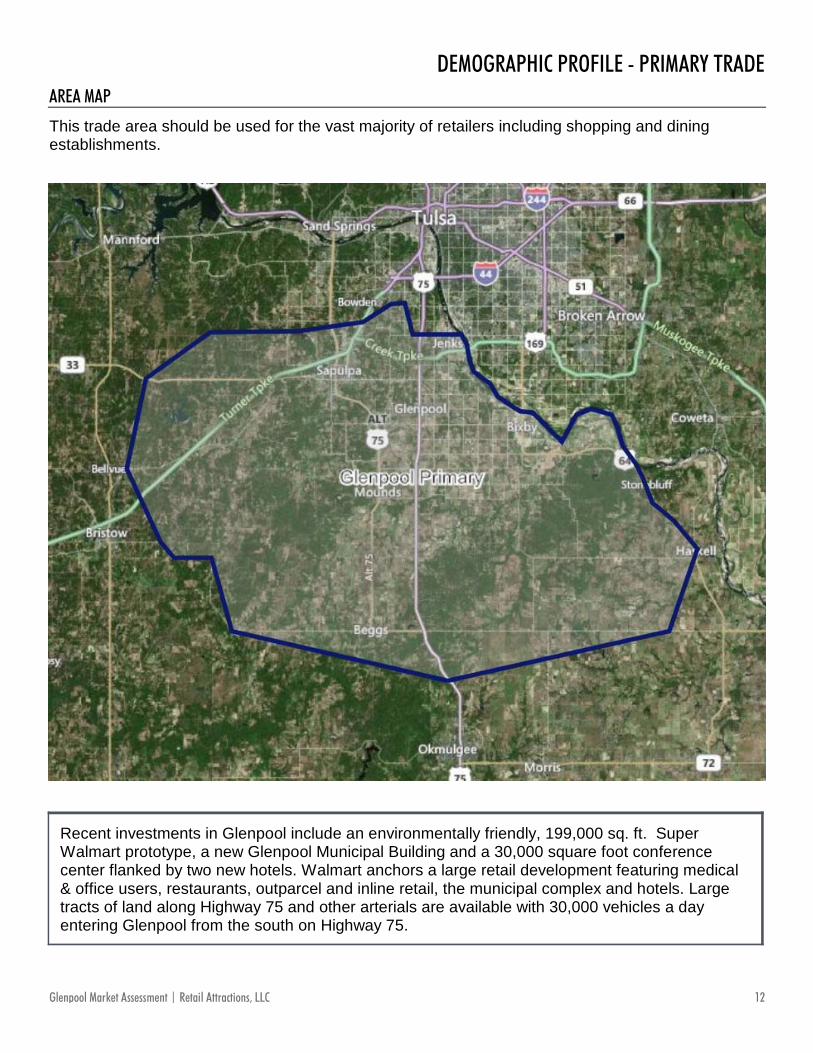
This trade area should be used for the vast majority of retailers including shopping and dining establishments.
AREA MAP
DEMOGRAPHIC PROFILE - PRIMARY TRADE
Recent investments in Glenpool include an environmentally friendly, 199,000 sq. ft. Super Walmart prototype, a new Glenpool Municipal Building and a 30,000 square foot conference center flanked by two new hotels. Walmart anchors a large retail development featuring medical & office users, restaurants, outparcel and inline retail, the municipal complex and hotels. Large tracts of land along Highway 75 and other arterials are available with 30,000 vehicles a day entering Glenpool from the south on Highway 75.
12Glenpool Market Assessment | Retail Attractions, LLC

0%
1%
2%
3%
4%
5%
6%
7%
8%
9%
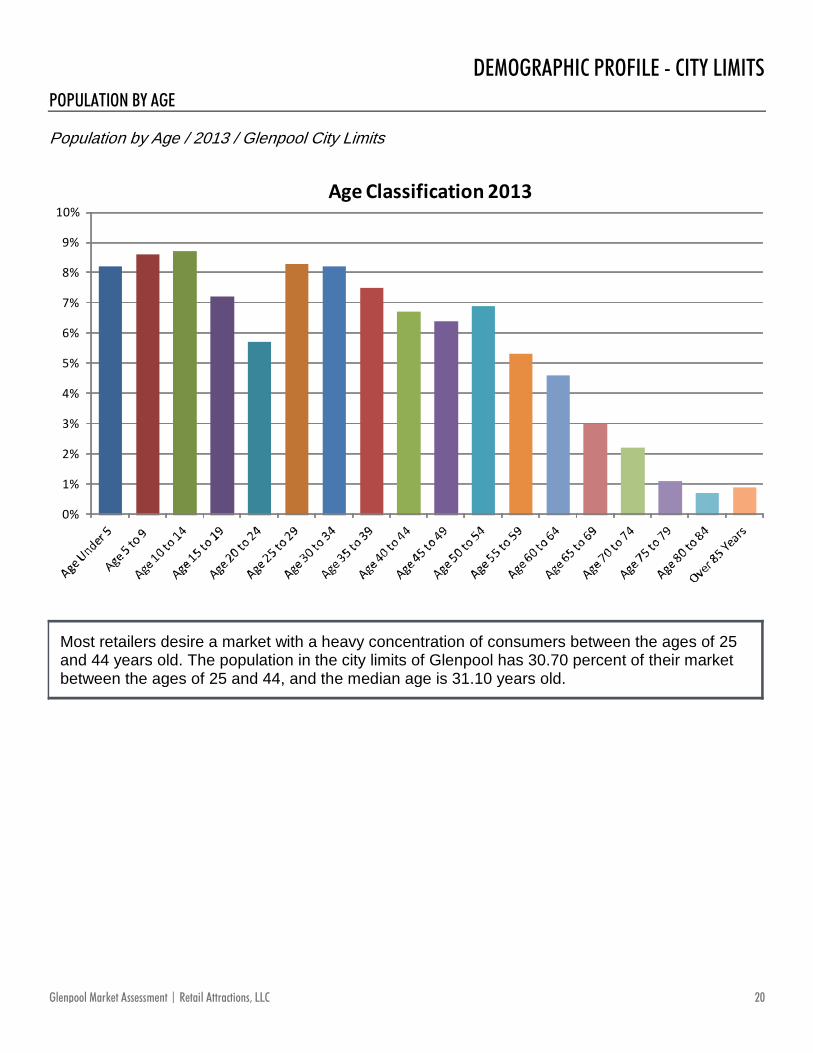
Age Classification 2013
POPULATION BY AGE
DEMOGRAPHIC PROFILE - PRIMARY TRADE
Most retailers desire a market with a heavy concentration of consumers between the ages of 25 and 44 years old. The population in the primary trade area of Glenpool has 26.20 percent of their market between the ages of 25 and 44, and the median age is 36.60 years old.
Population by Age / 2013 / Glenpool Primary Trade
13Glenpool Market Assessment | Retail Attractions, LLC

Single Race Classification 2013
White
Black or African American
American Indian or Alaska Native
Asian
Hawaiian or Pacific Islander
Other Race
Two or More Races
POPULATION BY RACEDEMOGRAPHIC PROFILE - PRIMARY TRADE
Population by Race / 2013 / Glenpool Primary Trade
The population in the primary trade area of Glenpool has 69.60% White residents, 2.80% Black or African American residents, and 13.10% American Indian or Alaska Native residents. 4.90% of the population is Hispanic or Latino by origin.
14Glenpool Market Assessment | Retail Attractions, LLC

Household Income 2013
Under $10,000
$10,000 to $14,999
$15,000 to $24,999
$25,000 to $34,999
$35,000 to $49,999
$50,000 to $74,999
$75,000 to $99,999
$100,000 to $124,999
$125,000 to $149,999
$150,000 to $199,999
$200,000 or More
POPULATION BY INCOME
DEMOGRAPHIC PROFILE - PRIMARY TRADE
Population by Income / 2013 / Glenpool Primary Trade
The average household income in the primary trade area of Glenpool is $74,854.00. Of the households in the primary trade area of Glenpool, 52.90% have an average annual income at or above $50,000, and 86.00% are family households.
2013 Household Income (Estimated)
$78,411CITY LIMITS
$74,854PRIMARY TRADE
15Glenpool Market Assessment | Retail Attractions, LLC

Educational Attainment 2013
Elementary (Grade Level 0 to 8)
Some High School (Grade Level 9 to 11)
High School Graduate
Some College
Associate Degree Only
Bachelor Degree Only
Graduate Degree
POPULATION BY EDUCATION
DEMOGRAPHIC PROFILE - PRIMARY TRADE
Population by Education / 2013 / Glenpool Primary Trade
Of the population age 16 and over in the primary trade area of Glenpool, 53.30% have some post-secondary education, and 30.40% have a college degree.
16Glenpool Market Assessment | Retail Attractions, LLC

0%
5%
10%
15%
20%
25%
30%
Management, Business, Financial Operations
Professional, Related
Service Sales, Office Farming, Fishing, Forestry
Construction, Extraction, Maintenance
Production, Transport,
Material Moving
Occupational Classification, Employed Population Aged 16+
POPULATION BY OCCUPATION
DEMOGRAPHIC PROFILE - PRIMARY TRADE
Population by Occupation / 2013 / Glenpool Primary Trade
Of the population in the primary trade area of Glenpool, 61.50% is engaged in white collar occupations, with 19.10% in professional occupations and another 14.90% in management, business and financial operations. Of the population in the primary trade area of Glenpool, 38.50% is engaged in blue collar occupations with 10.00% in construction and maintenance and 12.00% in production and transport.
17Glenpool Market Assessment | Retail Attractions, LLC

Housing Value Distribution 2013
Less than $10,000
$10,000 ‐ $34,999
$35,000 ‐ $59,999
$60,000 ‐ $79,999
$80,000 ‐ $99,999
$100,000 ‐ $149,999
$150,000 ‐ $199,999
$200,000 ‐ $299,999
$300,000 ‐ $399,999
$400,000 ‐ $499,999
$500,000 ‐ $749,999
$750,000 ‐ $999,999
$1,000,000 or more
HOUSING VALUE DISTRIBUTION
DEMOGRAPHIC PROFILE - PRIMARY TRADE
The median value of a home in the primary trade area of Glenpool is $134,051.00. Of these homes, 78.60% are owner occupied and 21.70% were built between 2000 and 2010.
Housing Value Distribution / 2013 / Glenpool Primary Trade
18Glenpool Market Assessment | Retail Attractions, LLC
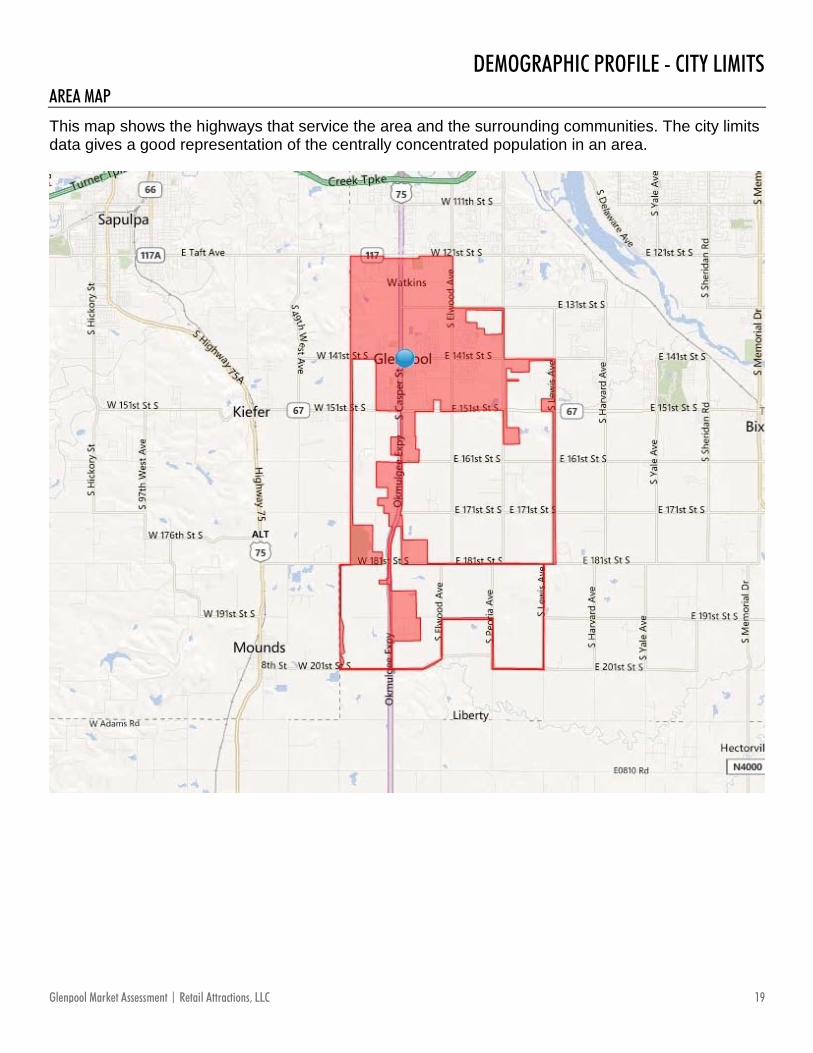
This map shows the highways that service the area and the surrounding communities. The city limits data gives a good representation of the centrally concentrated population in an area.
AREA MAP
DEMOGRAPHIC PROFILE - CITY LIMITS
19Glenpool Market Assessment | Retail Attractions, LLC
0%
1%
2%
3%
4%
5%
6%
7%
8%
9%
10%
Age Classification 2013
POPULATION BY AGE
DEMOGRAPHIC PROFILE - CITY LIMITS
Most retailers desire a market with a heavy concentration of consumers between the ages of 25 and 44 years old. The population in the city limits of Glenpool has 30.70 percent of their market between the ages of 25 and 44, and the median age is 31.10 years old.
Population by Age / 2013 / Glenpool City Limits
20Glenpool Market Assessment | Retail Attractions, LLC

Single Race Classification 2013
White
Black or African American
American Indian or Alaska Native
Asian
Hawaiian or Pacific Islander
Other Race
Two or More Races
POPULATION BY RACEDEMOGRAPHIC PROFILE - CITY LIMITS
Population by Race / 2013 / Glenpool City Limits
The population in the city limits of Glenpool has 63.80% White residents, 2.30% Black or African American residents, and 15.90% American Indian or Alaska Native residents. 5.60% of the population is Hispanic or Latino by origin.
21Glenpool Market Assessment | Retail Attractions, LLC
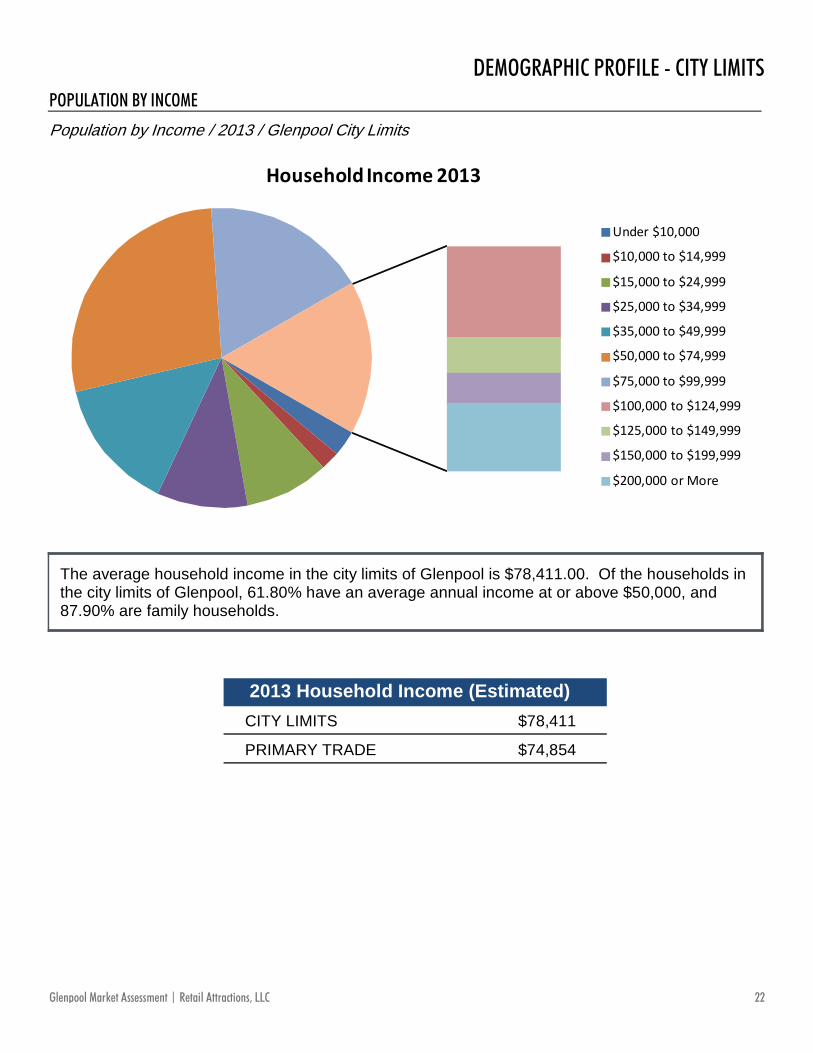
Household Income 2013
Under $10,000
$10,000 to $14,999
$15,000 to $24,999
$25,000 to $34,999
$35,000 to $49,999
$50,000 to $74,999
$75,000 to $99,999
$100,000 to $124,999
$125,000 to $149,999
$150,000 to $199,999
$200,000 or More
POPULATION BY INCOME
DEMOGRAPHIC PROFILE - CITY LIMITS
Population by Income / 2013 / Glenpool City Limits
The average household income in the city limits of Glenpool is $78,411.00. Of the households in the city limits of Glenpool, 61.80% have an average annual income at or above $50,000, and 87.90% are family households.
2013 Household Income (Estimated)
$78,411CITY LIMITS
$74,854PRIMARY TRADE
22Glenpool Market Assessment | Retail Attractions, LLC

Educational Attainment 2013
Elementary (Grade Level 0 to 8)
Some High School (Grade Level 9 to 11)
High School Graduate
Some College
Associate Degree Only
Bachelor Degree Only
Graduate Degree
POPULATION BY EDUCATION
DEMOGRAPHIC PROFILE - CITY LIMITS
Population by Education / 2013 / Glenpool City Limits
Of the population age 16 and over in the city limits of Glenpool, 60.40% have some post-secondary education, and 31.40% have a college degree.
23Glenpool Market Assessment | Retail Attractions, LLC
0%
5%
10%
15%
20%
25%
30%
35%
Management, Business, Financial Operations
Professional, Related
Service Sales, Office Farming, Fishing, Forestry
Construction, Extraction, Maintenance
Production, Transport,
Material Moving
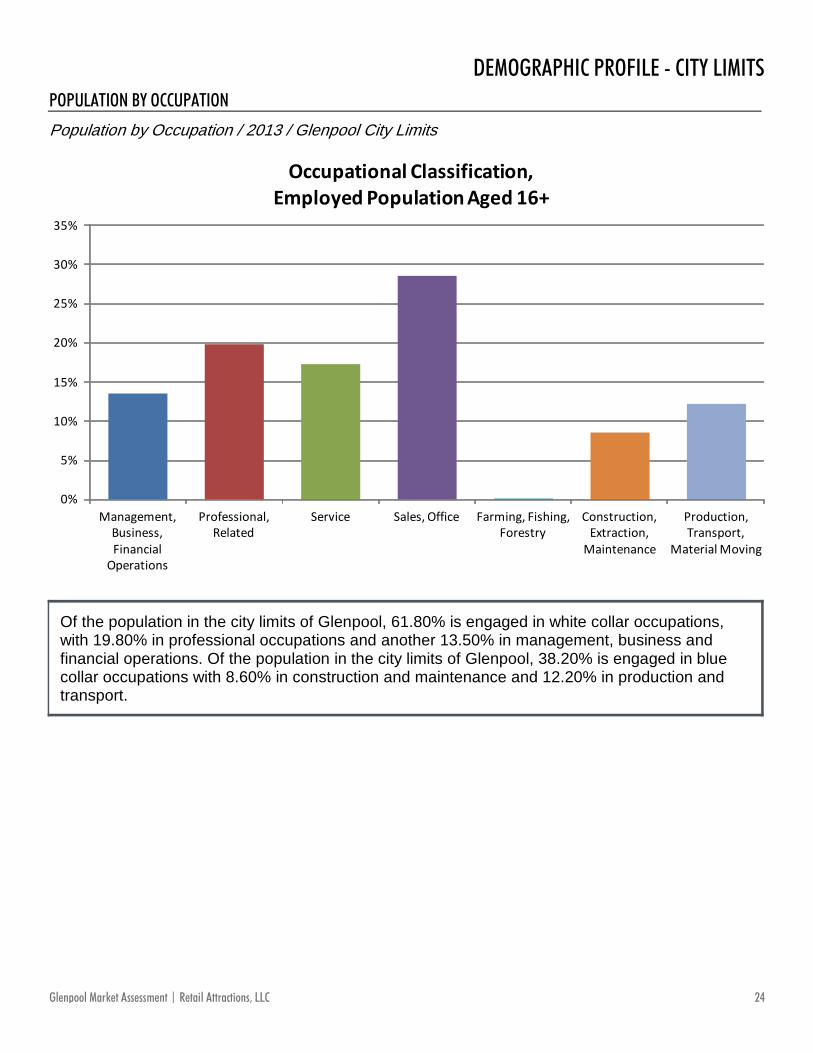
Occupational Classification, Employed Population Aged 16+
POPULATION BY OCCUPATION
DEMOGRAPHIC PROFILE - CITY LIMITS
Population by Occupation / 2013 / Glenpool City Limits
Of the population in the city limits of Glenpool, 61.80% is engaged in white collar occupations, with 19.80% in professional occupations and another 13.50% in management, business and financial operations. Of the population in the city limits of Glenpool, 38.20% is engaged in blue collar occupations with 8.60% in construction and maintenance and 12.20% in production and transport.
24Glenpool Market Assessment | Retail Attractions, LLC
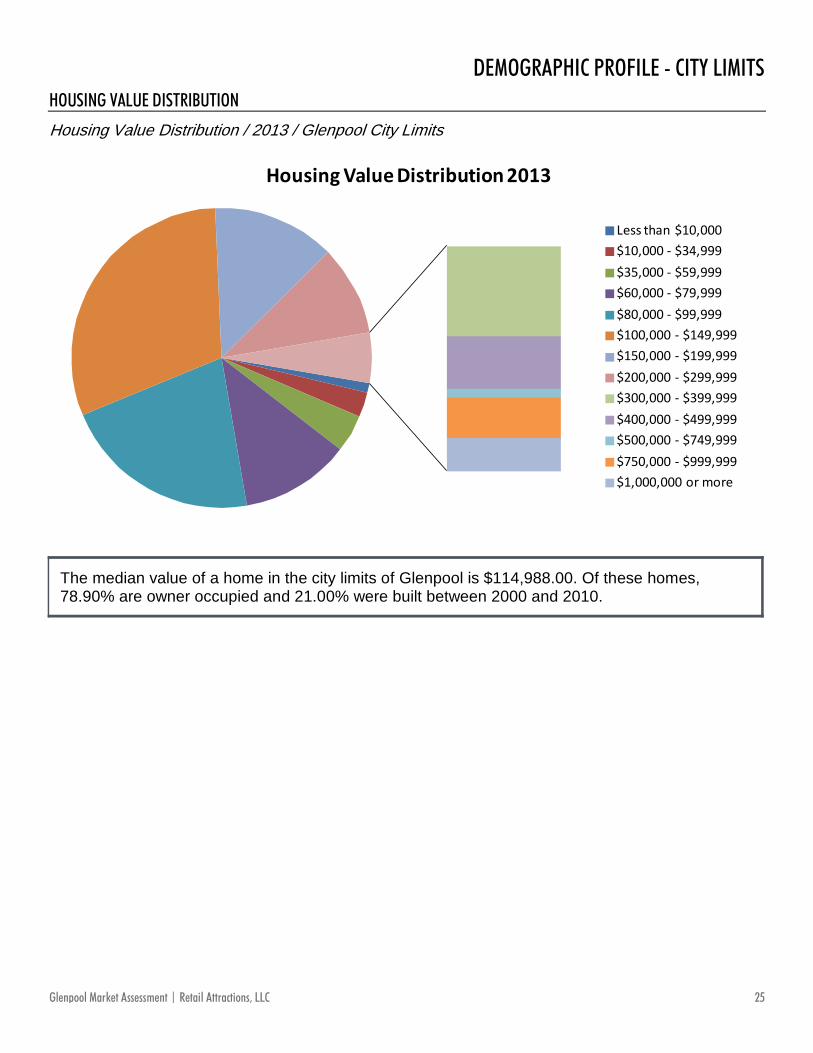
Housing Value Distribution 2013
Less than $10,000
$10,000 ‐ $34,999
$35,000 ‐ $59,999
$60,000 ‐ $79,999
$80,000 ‐ $99,999
$100,000 ‐ $149,999
$150,000 ‐ $199,999
$200,000 ‐ $299,999
$300,000 ‐ $399,999
$400,000 ‐ $499,999
$500,000 ‐ $749,999
$750,000 ‐ $999,999
$1,000,000 or more
HOUSING VALUE DISTRIBUTION
DEMOGRAPHIC PROFILE - CITY LIMITS
The median value of a home in the city limits of Glenpool is $114,988.00. Of these homes, 78.90% are owner occupied and 21.00% were built between 2000 and 2010.
Housing Value Distribution / 2013 / Glenpool City Limits
25Glenpool Market Assessment | Retail Attractions, LLC

The Nielsen Claritas Retail Market Power™ (RMP) database provides an actionable portrait of sales opportunity for optimal site and market analysis, allowing you to maximize your growth strategies by accurately targeting the sales gaps that exist in the marketplace. By using sales potential to depict supply and geography-based estimates of potential annual consumer expenditures to depict demand within a specific market, RMP enables an opportunity gap analysis of the retail environment. The database was developed using the Consumer Expenditure (CEX) surveys conducted by the Bureau of Labor Statistics and the Census of Retail Trade conducted by the US Census. Current-year (CY) supply and demand estimates and five-year (5Y) demand projections are available for all standard census, postal, and marketing geographies.
Data Sources for Potential Sales:
Data Sources for Potential Expenditures:
Census of Retail Trade (CRT) Annual Survey of Retail TradeClaritas Business-FactsCensus of Employment WagesState Sales Tax reportsTrade AssociationsDemand Side Estimates
Consumer Expenditure Survey (CEX) Global InsightsClaritas Current Year demographicsTrade Associations
NIELSEN CLARITAS RETAIL MARKET POWER
OPPORTUNITY GAP
The Nielsen Claritas Retail Market Power™ (RMP) allows you to compare supply and demand to determine potential sources of revenue growth at any standard or user defined geographic level. Such comparison can be achieved at the retail outlet level or the merchandise line level. An opportunity gap appears when household expenditure levels for a specific geography are higher than the corresponding retail sales estimates. This difference signifies that resident households are meeting the available supply and supplementing their additional demand potential by going outside of their own geography. The opposite is true in the event of an opportunity surplus which occurs when the levels of household expenditures are lower than the retail sales estimates. In this case, local retailers are attracting residents from other areas to their stores.
26Glenpool Market Assessment | Retail Attractions, LLC
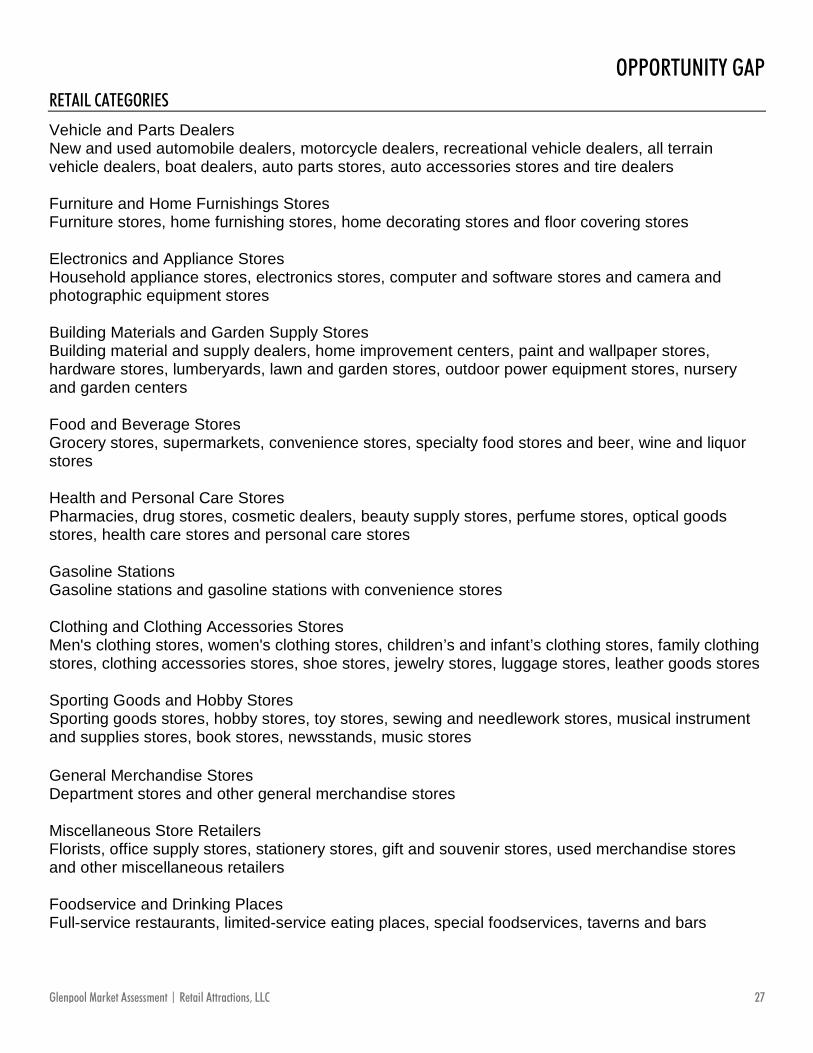
Vehicle and Parts DealersNew and used automobile dealers, motorcycle dealers, recreational vehicle dealers, all terrain vehicle dealers, boat dealers, auto parts stores, auto accessories stores and tire dealers
Furniture and Home Furnishings StoresFurniture stores, home furnishing stores, home decorating stores and floor covering stores
Electronics and Appliance StoresHousehold appliance stores, electronics stores, computer and software stores and camera and photographic equipment stores
Building Materials and Garden Supply StoresBuilding material and supply dealers, home improvement centers, paint and wallpaper stores, hardware stores, lumberyards, lawn and garden stores, outdoor power equipment stores, nursery and garden centers
Food and Beverage StoresGrocery stores, supermarkets, convenience stores, specialty food stores and beer, wine and liquor stores
Health and Personal Care StoresPharmacies, drug stores, cosmetic dealers, beauty supply stores, perfume stores, optical goods stores, health care stores and personal care stores
Gasoline StationsGasoline stations and gasoline stations with convenience stores
Clothing and Clothing Accessories StoresMen's clothing stores, women's clothing stores, children’s and infant’s clothing stores, family clothing stores, clothing accessories stores, shoe stores, jewelry stores, luggage stores, leather goods stores
Sporting Goods and Hobby StoresSporting goods stores, hobby stores, toy stores, sewing and needlework stores, musical instrument and supplies stores, book stores, newsstands, music stores
RETAIL CATEGORIES
OPPORTUNITY GAP
General Merchandise StoresDepartment stores and other general merchandise stores
Miscellaneous Store RetailersFlorists, office supply stores, stationery stores, gift and souvenir stores, used merchandise stores and other miscellaneous retailers
Foodservice and Drinking PlacesFull-service restaurants, limited-service eating places, special foodservices, taverns and bars
27Glenpool Market Assessment | Retail Attractions, LLC
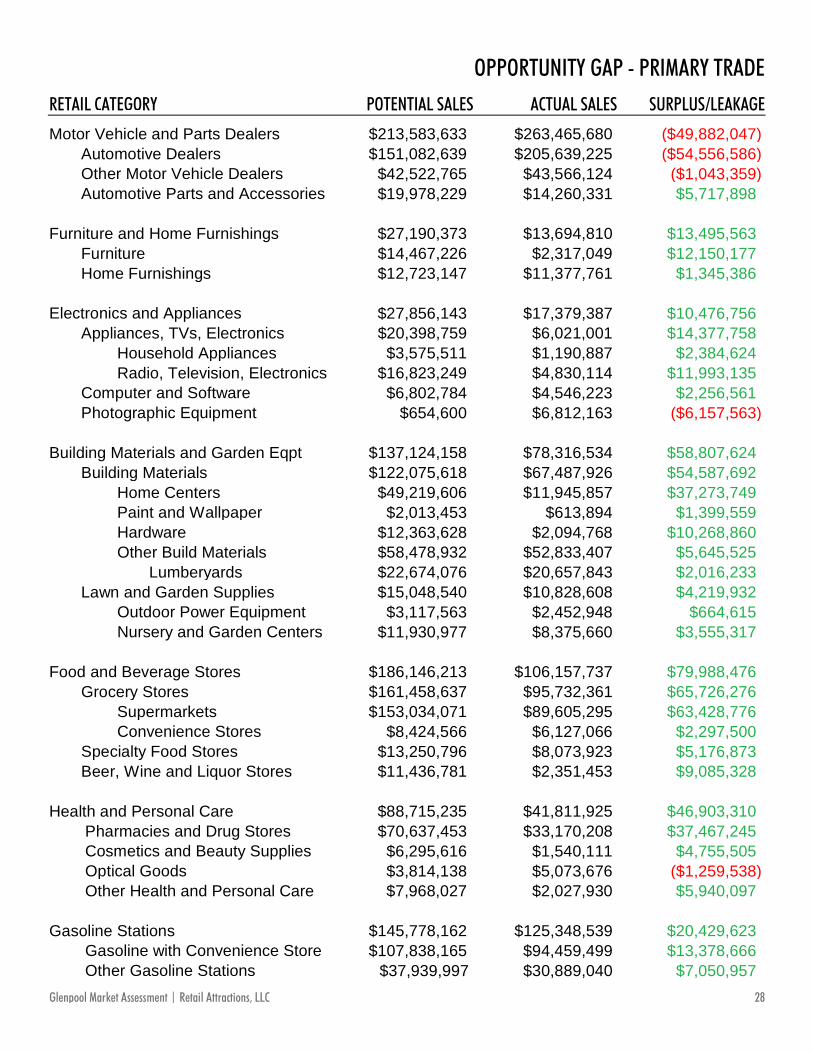
Motor Vehicle and Parts Dealers $213,583,633 $263,465,680Automotive Dealers $151,082,639 $205,639,225Other Motor Vehicle Dealers $42,522,765 $43,566,124Automotive Parts and Accessories $19,978,229 $14,260,331
Furniture and Home Furnishings $27,190,373 $13,694,810Furniture $14,467,226 $2,317,049Home Furnishings $12,723,147 $11,377,761
Electronics and Appliances $27,856,143 $17,379,387Appliances, TVs, Electronics $20,398,759 $6,021,001
Household Appliances $3,575,511 $1,190,887Radio, Television, Electronics $16,823,249 $4,830,114
Computer and Software $6,802,784 $4,546,223Photographic Equipment $654,600 $6,812,163
Building Materials and Garden Eqpt $137,124,158 $78,316,534Building Materials $122,075,618 $67,487,926
Home Centers $49,219,606 $11,945,857Paint and Wallpaper $2,013,453 $613,894Hardware $12,363,628 $2,094,768Other Build Materials $58,478,932 $52,833,407
Lumberyards $22,674,076 $20,657,843Lawn and Garden Supplies $15,048,540 $10,828,608
Outdoor Power Equipment $3,117,563 $2,452,948Nursery and Garden Centers $11,930,977 $8,375,660
Food and Beverage Stores $186,146,213 $106,157,737Grocery Stores $161,458,637 $95,732,361
Supermarkets $153,034,071 $89,605,295Convenience Stores $8,424,566 $6,127,066
Specialty Food Stores $13,250,796 $8,073,923Beer, Wine and Liquor Stores $11,436,781 $2,351,453
Health and Personal Care $88,715,235 $41,811,925Pharmacies and Drug Stores $70,637,453 $33,170,208Cosmetics and Beauty Supplies $6,295,616 $1,540,111Optical Goods $3,814,138 $5,073,676Other Health and Personal Care $7,968,027 $2,027,930
Gasoline Stations $145,778,162 $125,348,539Gasoline with Convenience Store $107,838,165 $94,459,499Other Gasoline Stations $37,939,997 $30,889,040
($49,882,047)($54,556,586)
($1,043,359)$5,717,898
$13,495,563$12,150,177
$1,345,386
$10,476,756$14,377,758
$2,384,624$11,993,135
$2,256,561($6,157,563)
$58,807,624$54,587,692$37,273,749
$1,399,559$10,268,860
$5,645,525$2,016,233$4,219,932
$664,615$3,555,317
$79,988,476$65,726,276$63,428,776
$2,297,500$5,176,873$9,085,328
$46,903,310$37,467,245
$4,755,505($1,259,538)$5,940,097
$20,429,623$13,378,666
$7,050,957
OPPORTUNITY GAP - PRIMARY TRADERETAIL CATEGORY POTENTIAL SALES ACTUAL SALES SURPLUS/LEAKAGE
28Glenpool Market Assessment | Retail Attractions, LLC

Clothing and Clothing Accessories $64,987,523 $24,811,055Clothing $49,165,595 $17,882,630
Men's Clothing $2,761,960 $0Women's Clothing $10,796,571 $3,064,762Children's Clothing $3,295,118 $1,136,994Family Clothing $25,878,899 $9,865,981Clothing Accessories $2,002,835 $964,805Other Clothing $4,430,212 $2,850,087
Shoes $8,188,025 $2,799,986Jewelry $7,043,260 $4,128,439Luggage and Leather Goods $590,643 $0
Sporting Goods, Hobby, Book Music $25,676,153 $5,977,725Sporting Goods $10,860,003 $3,487,915Hobby, Toys, Games $6,014,575 $900,279Sew, Needlework, Piece Goods $2,145,795 $339,264Musical Instruments $1,497,074 $635,077Book Stores $3,731,360 $23,581News Dealers and Newsstand $461,314 $0Prerecorded Tapes, CDs, Record $966,032 $591,609
General Merchandise $185,732,384 $46,396,243
Miscellaneous Retailers $42,275,291 $9,681,132Florists $1,745,317 $499,259Office Supplies, Stationery, Gifts $12,305,478 $1,139,052Used Merchandise $3,398,765 $736,634Other Miscellaneous $24,825,730 $7,306,187
Food and Drink $148,532,537 $50,306,817Full Service Restaurants $68,670,971 $22,631,192Limited Service Restaurants $60,904,055 $20,223,143Special Food $11,778,111 $6,306,522Drinking Places $7,179,399 $1,145,959
$40,176,468$31,282,965
$2,761,960$7,731,809$2,158,124
$16,012,918$1,038,030$1,580,125$5,388,039$2,914,821
$590,643
$19,698,428$7,372,088$5,114,296$1,806,531
$861,997$3,707,779
$461,314$374,423
$139,336,141
$32,594,159$1,246,058
$11,166,426$2,662,131
$17,519,543
$98,225,720$46,039,779$40,680,912
$5,471,589$6,033,440
OPPORTUNITY GAP - PRIMARY TRADERETAIL CATEGORY (cont) POTENTIAL SALES ACTUAL SALES SURPLUS/LEAKAGE
TOTAL SURPLUS ($63,017,046)$675,208,387TOTAL LEAKAGE
BALANCE $612,191,341
Non-Store Retailers $109,408,609 $7,467,491 $101,941,118
29Glenpool Market Assessment | Retail Attractions, LLC
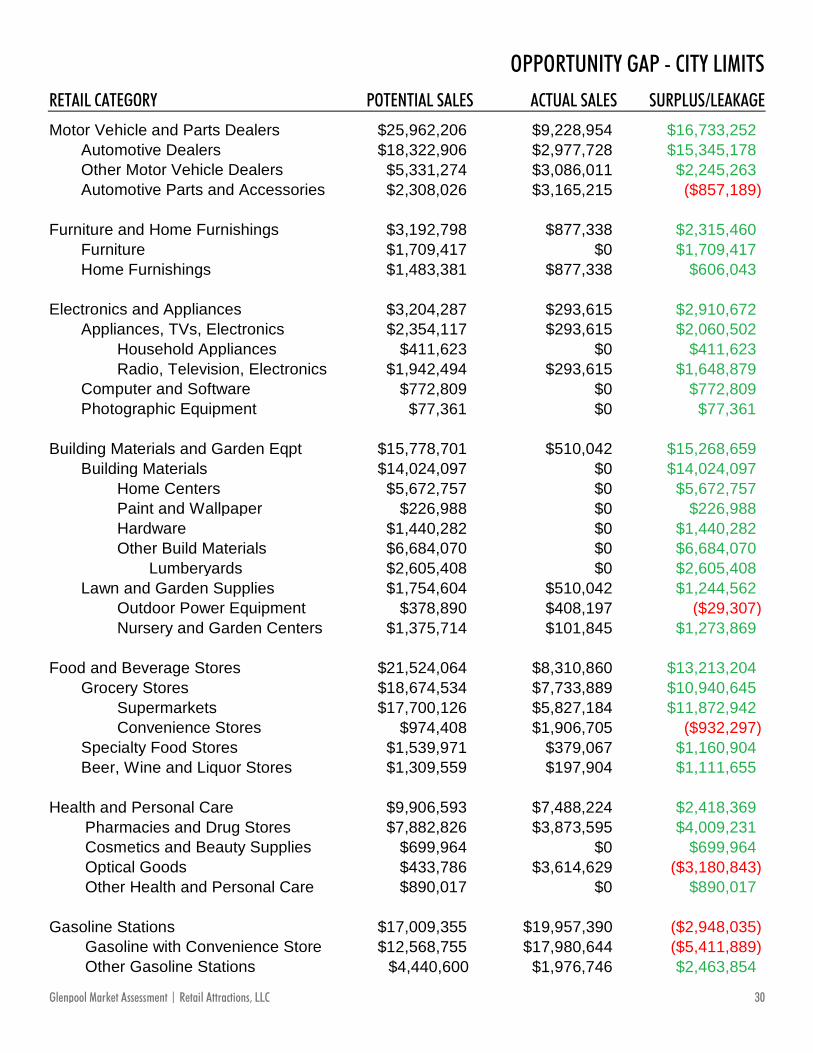
Motor Vehicle and Parts Dealers $25,962,206 $9,228,954Automotive Dealers $18,322,906 $2,977,728Other Motor Vehicle Dealers $5,331,274 $3,086,011Automotive Parts and Accessories $2,308,026 $3,165,215
Furniture and Home Furnishings $3,192,798 $877,338Furniture $1,709,417 $0Home Furnishings $1,483,381 $877,338
Electronics and Appliances $3,204,287 $293,615Appliances, TVs, Electronics $2,354,117 $293,615
Household Appliances $411,623 $0Radio, Television, Electronics $1,942,494 $293,615
Computer and Software $772,809 $0Photographic Equipment $77,361 $0
Building Materials and Garden Eqpt $15,778,701 $510,042Building Materials $14,024,097 $0
Home Centers $5,672,757 $0Paint and Wallpaper $226,988 $0Hardware $1,440,282 $0Other Build Materials $6,684,070 $0
Lumberyards $2,605,408 $0Lawn and Garden Supplies $1,754,604 $510,042
Outdoor Power Equipment $378,890 $408,197Nursery and Garden Centers $1,375,714 $101,845
Food and Beverage Stores $21,524,064 $8,310,860Grocery Stores $18,674,534 $7,733,889
Supermarkets $17,700,126 $5,827,184Convenience Stores $974,408 $1,906,705
Specialty Food Stores $1,539,971 $379,067Beer, Wine and Liquor Stores $1,309,559 $197,904
Health and Personal Care $9,906,593 $7,488,224Pharmacies and Drug Stores $7,882,826 $3,873,595Cosmetics and Beauty Supplies $699,964 $0Optical Goods $433,786 $3,614,629Other Health and Personal Care $890,017 $0
Gasoline Stations $17,009,355 $19,957,390Gasoline with Convenience Store $12,568,755 $17,980,644Other Gasoline Stations $4,440,600 $1,976,746
$16,733,252$15,345,178
$2,245,263($857,189)
$2,315,460$1,709,417
$606,043
$2,910,672$2,060,502
$411,623$1,648,879
$772,809$77,361
$15,268,659$14,024,097
$5,672,757$226,988
$1,440,282$6,684,070$2,605,408$1,244,562
($29,307)$1,273,869
$13,213,204$10,940,645$11,872,942
($932,297)$1,160,904$1,111,655
$2,418,369$4,009,231
$699,964($3,180,843)
$890,017
($2,948,035)($5,411,889)$2,463,854
OPPORTUNITY GAP - CITY LIMITSRETAIL CATEGORY POTENTIAL SALES ACTUAL SALES SURPLUS/LEAKAGE
30Glenpool Market Assessment | Retail Attractions, LLC
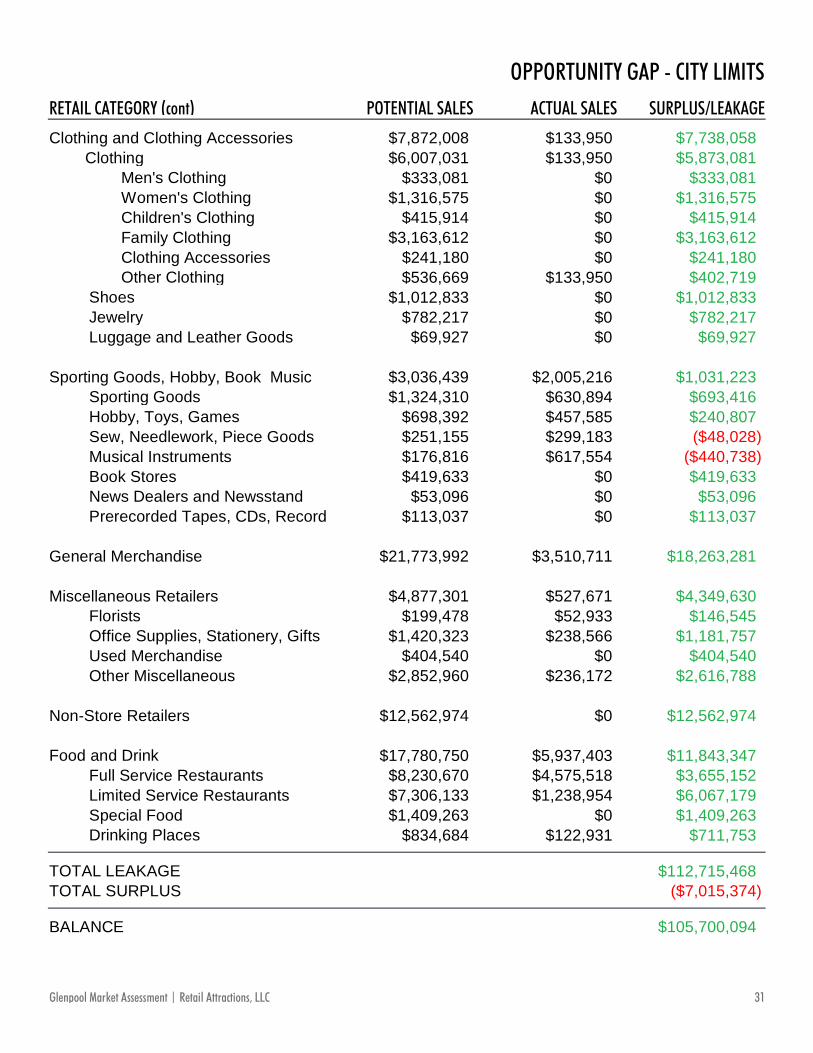
Clothing and Clothing Accessories $7,872,008 $133,950Clothing $6,007,031 $133,950
Men's Clothing $333,081 $0Women's Clothing $1,316,575 $0Children's Clothing $415,914 $0Family Clothing $3,163,612 $0Clothing Accessories $241,180 $0Other Clothing $536,669 $133,950
Shoes $1,012,833 $0Jewelry $782,217 $0Luggage and Leather Goods $69,927 $0
Sporting Goods, Hobby, Book Music $3,036,439 $2,005,216Sporting Goods $1,324,310 $630,894Hobby, Toys, Games $698,392 $457,585Sew, Needlework, Piece Goods $251,155 $299,183Musical Instruments $176,816 $617,554Book Stores $419,633 $0News Dealers and Newsstand $53,096 $0Prerecorded Tapes, CDs, Record $113,037 $0
General Merchandise $21,773,992 $3,510,711
Miscellaneous Retailers $4,877,301 $527,671Florists $199,478 $52,933Office Supplies, Stationery, Gifts $1,420,323 $238,566Used Merchandise $404,540 $0Other Miscellaneous $2,852,960 $236,172
Food and Drink $17,780,750 $5,937,403Full Service Restaurants $8,230,670 $4,575,518Limited Service Restaurants $7,306,133 $1,238,954Special Food $1,409,263 $0Drinking Places $834,684 $122,931
$7,738,058$5,873,081
$333,081$1,316,575
$415,914$3,163,612
$241,180$402,719
$1,012,833$782,217$69,927
$1,031,223$693,416$240,807($48,028)
($440,738)$419,633$53,096
$113,037
$18,263,281
$4,349,630$146,545
$1,181,757$404,540
$2,616,788
$11,843,347$3,655,152$6,067,179$1,409,263
$711,753
OPPORTUNITY GAP - CITY LIMITSRETAIL CATEGORY (cont) POTENTIAL SALES ACTUAL SALES SURPLUS/LEAKAGE
TOTAL SURPLUS ($7,015,374)$112,715,468TOTAL LEAKAGE
BALANCE $105,700,094
Non-Store Retailers $12,562,974 $0 $12,562,974
31Glenpool Market Assessment | Retail Attractions, LLC

ABOUT US
RETAIL ATTRACTIONS
Retail Attractions is an economic development consulting firm specializing in market research, creating workable incentive packages and retail recruiting. Our firm believes healthy economic development is a process. Retail Attractions partners with our clients in a coordinated and strategic course of action resulting in extraordinary results. Retail Attractions believes smart, successful retail development is a vital part of a community’s economic development program. We leverage our national network of relationships and our proven expertise to bring retailers, developers, landowners and communities together to grow new retail business… one relationship at a time. We partner with our client cities to achieve their community goals through retail development. Far beyond concentric rings, drive times or just another bound report, we develop actionable information and make sure the right people have access to it. In short, we make a difference for your community.
The truth is that anyone or any competent firm can pull demographics for a location based on a radius or a drive time. What makes us different is our custom approach to developing a community’s trade area. We evaluate the existing retail options nearby, physical barriers to traffic, natural existing shopping patterns, and the potential draw of new shopping opportunities to develop a custom trade area for each community we serve. Your trade area is prepared by seasoned retail recruitment professionals based on criteria we know is important to the audience who will be receiving the finished marketing materials. We integrate demographic data with data we develop from other sources to create a complete picture of a community... one that will resonate with developers, brokers and retailers. We work with a community to prepare materials and get them in the hands of interested parties rather than merely deliver data that then the community has to send out on its own. We also recognize that “one size DOESN’T fit all” when it comes to trade areas. Some sites may be perfect for a grocery store, with a more localized trade area, while others may support a more regional draw. If your community has unique opportunities that require more than one trade area, we deliver what you need rather than forcing your community into our “standard offering.”
Retail Attractions sends our custom marketing material, developed for each city based on the unique characteristics and demographic indicators for that city, to our network of developers, brokers and retailers. In addition, we contact retailers through our accurate, proprietary database to make sure they are aware of opportunities in your city that match their specs.
We have an extensive knowledge of various types of incentives, and their practical application, and the experience to work with city staff to develop a framework for evaluating opportunities and providing creative incentives that result in win-win scenarios for both the public and private sector. Beyond merely a list of incentive possibilities, Retail Attractions serves as an ongoing advisor to city staff, helping to craft incentives that make sense for the city, meet developer’s needs and truly encourage new business development.
Retail Attractions understands municipal government and the interplay of political, financial, and regulatory environments. We also understand how development works and what site selectors, developers and retail tenants need to see, hear, and feel from a potential location to move forward. Retail Attractions features a team of research and marketing professionals who assist retail recruiters in developing the necessary data and marketing materials to prove the case for investment in your community. Since beginning Retail Attractions, we have helped our clients launch millions of square feet of retail and reap the associated benefits of additional city revenues, plus new goods and services for citizens, and increasing the quality of life in the community.
32Glenpool Market Assessment | Retail Attractions, LLC

RETAIL ATTRACTIONSOUR STAFF
During his six years as Economic Development Director for the City of Owasso, Rickey Hayes facilitated new commercial construction totaling more than 4.2 million square feet with more than a quarter of a billion dollars in total value, resulting in a city sales tax base more than double what it had been. Since beginning Retail Attractions, Rickey has helped cities launch millions of square feet of additional retail space and reap the associated benefits in additional revenues, goods and services for their citizens. Rickey has developed an extensive personal network of relationships in the areas of government, retail, land development, real estate and site selection, leasing and tenanting, engineering, creative financing for development projects, and architecture and planning. Rickey holds a Bachelors Degree in Criminal Justice and a Masters Degree in Counseling from Great Plains Baptist College. Rickey is a member of International Council of Shopping Centers (ICSC). Rickey and his wife, Wendy, have four children, and one grandchild.
RICKEY HAYES, PRINCIPAL
Beth has a Bachelor of Science in Electrical Engineering from Purdue University. She has been with Retail Attractions since inception and manages marketing and recruitment projects at Retail Attractions. Beth is a member of the International Council of Shopping Centers (ICSC).
BETH NICHOLS, PROJECT MANAGEMENT
Rob has a Bachelor of Science in Electrical Engineering from Oklahoma State University. He has been with Retail Attractions since inception and manages the website, data storage and access for Retail Attractions.
ROBERT NICHOLS, INFORMATION TECHNOLOGY
33Glenpool Market Assessment | Retail Attractions, LLC
OUR METHODOLOGY
RETAIL ATTRACTIONS
Our ApproachJust as every city has distinctive characteristics, every consulting project is unique. Retail Attractions employs proven strategies to achieve economic development and growth in your community. We offer three tiers of contract service in addition to project-based and short-term engagements, allowing us to tailor our services to each client community’s individual needs. Unlike “cookie-cutter” approaches to retail development that return little more than a bound document, partnering with Retail Attractions means you gain an experienced, dedicated staff who will work diligently on your behalf to grow your city. In addition to our tiered services under contract, additional services such as municipal web site development (for the city overall or specifically for economic development), experienced city and economic development PR efforts, and public meetings/input process management are available as well. These types of services may either be included in the contract for an additional cost or may be utilized on a project / as-needed basis by a client city for an additional estimated cost.
Market AssessmentRetail Attractions uses data from a variety of sources to accurately portray the trade area, retail potential and opportunities within a market. Sources used in this report include Nielsen-Claritas, Applied Geographic Solutions (AGS), the City, various state agencies, US Census Bureau, US Economic Survey and US Bureau of Labor information. Retail Attractions combines physical observation, data-driven research and information, retail site selection methodologies and competitive analysis with personal experience and a reputation for finding the right sites for the right retail to create our market assessment reports.
Retail RecruitmentOur relationships with our clients do not end when we deliver our market assessment report. We promote and actively recruit for our clients throughout the term of their contracts through mail, email, web, phone and personal contacts in our comprehensive nationwide contact database. Our diligent pursuit of development for your community assures your community will be on the radar of appropriate national retailers.
The BenefitsEmploying Retail Attractions to fulfill the city’s need for an economic development professional allows the city to conserve resources that would otherwise be spent for no direct gain including insurance, employment taxes and other benefits. The city can reap the benefit of utilizing an experienced, successful economic development professional without incurring the expense of a full-time exempt employee. Retail Attractions is intimately familiar with development dynamics and can bring our experience, network and concentrated approach to bear immediately on behalf of the city. No valuable time is lost through a “learning the process” or “learning the area” acclimation period. Commercial development often feels painfully slow when observing the process from the outside. From initial interest in a site to doors open for business is often an 18- to 24-month process. Retail Attractions will be with you every step of the way to help your community reach its maximum retail potential.
34Glenpool Market Assessment | Retail Attractions, LLC
OUR DATA
RETAIL ATTRACTIONS
Retail Attractions compiles data from a number of sources including Nielsen-Claritas, Applied Geographic Solutions (AGS), the client City, various state agencies, the US Census Bureau, the US Economic Survey and information from the US Bureau of Labor. The primary sources for the demographic information included in this report are Nielsen-Claritas SiteReports and Applied Geographic Solutions (AGS).
Both Nielsen-Claritas and AGS pull data from public and private sources and apply their proprietary algorithm to determine demographic projections and estimates. Retail Attractions has carefully analyzed the resulting statistics and determined the algorithms that best represent the client community and trade area.
Nielsen-Claritas and AGS are highly respected data providers in the retail industry, and both sources calculate estimates for the current year and projections for five years in the future. Both companies produce data at varying geographic levels including national, state, county, city/town, zip code, and block group. These estimates and projections on a defined population can be analyzed according to population characteristics such as age, sex, race, Hispanic ethnicity, income, education, occupation, housing or rate of growth.
The demographic data contained in this report comes from AGS, and the opportunity gap data comes from Nielsen Claritas Retail Market Power™ (RMP). The RMP data allows the comparison of supply and demand to determine potential sources of revenue growth at any standard or user defined geographic level.
If there are any questions about the data used in this report, please contact Retail Attractions, and we will be happy to answer your questions.
35Glenpool Market Assessment | Retail Attractions, LLC

ACKNOWLEDGEMENTS
ACKNOWLEDGEMENTS AND DISCLAIMER
Nielsen and Applied Geographic Solutions are both highly respected data providers. However, these companies use algorithms to make estimates and projections. While these estimates and projections are based on years of research and adjustment, they are still only estimates and projections.
DISCLAIMER
All information is believed to be accurate and is presented in good faith by Retail Attractions, LLC under the terms and protections of the contact between the Client and Retail Attractions, LLC.
While we do expect to successfully complete the objective of increasing commercial investment in your community, it is impossible to guarantee a level of investment or even any investment since market conditions, retailer’s business plans, city policies and other market drivers are subject to change at any time and are beyond the control of Retail Attractions, LLC. You understand and agree that any advice provided under this proposal is true and correct to the best knowledge and ability of Retail Attractions, LLC and will be provided in good faith. The city accepts full responsibility for its decisions to act or not act according to said advice and agrees to indemnify and hold harmless Retail Attractions, LLC; its principals, employees, sub-contractors and associates pertaining to outcomes or situations that arise from the advice, materials or other items provided under this proposal agreement.
36Glenpool Market Assessment | Retail Attractions, LLC