economic evaluation of damage caused by, and methods of ... · production in the maghreb (algeria,...
TRANSCRIPT
IAEA-TECDOC-830
Economic evaluation ofdamage caused by,
and methods of control of,the Mediterranean fruit fly
in the MaghrebAn analysis covering three control options,
including the sterile insect technique
Report of an expert grouporganized by the
Joint FAO/IAEA Division of Nuclear Techniques in Food and Agriculture
m xT iD of
INTERNATIONAL ATOMIC ENERGY AGENCY /A\

The IAEA does not normally maintain stocks of reports in this series.However, microfiche copies of these reports can be obtained from
INIS ClearinghouseInternational Atomic Energy AgencyWagramerstrasse 5P.O. Box 100A-1400 Vienna, Austria
Orders should be accompanied by prepayment of Austrian Schillings 100,-in the form of a cheque or in the form of IAEA microfiche service couponswhich may be ordered separately from the INIS Clearinghouse.

The originating Section of this publication in the IAEA was:
Insect and Pest Control SectionInternational Atomic Energy Agency
Wagramerstrasse 5P.O. Box 100
A-1400 Vienna, Austria
ECONOMIC EVALUATION OF DAMAGE CAUSED BY, AND METHODS OF CONTROL OF,THE MEDITERRANEAN FRUIT FLY IN THE MAGHREB
IAEA, VIENNA, 1995IAEA-TECDOC-830
ISSN 1011-4289
© IAEA, 1995
Printed by the IAEA in AustriaOctober 1995

FOREWORD
Fruit and vegetable production is a major component of the agricultural sectorthroughout the Mediterranean Basin. At present, however, there is a major dependence onaerial or ground insecticide applications to protect commercial crops against theMediterranean fruit fly. This pest causes enormous damage in the more than two hundredspecies of fruit and vegetables it attacks. Pesticide applications are frequently required upto twelve times a year, costing large sums of money everywhere in the region.
The objective of this study was to assess for the four North African countries theeconomics of different pest control/eradication alternatives. It is the first study of its kindanalyzing in detail three options of controlling the Mediterranean fruit fly on an area-widebasis. The study compares economic costs and benefits of control based on the continueduse of insecticide sprays, with more environmentally friendly alternatives based on the SterileInsect Technique.
Results indicate that even without including a number of important environmentalcosts in the study, the latter biological alternatives, when considered over the medium term,are more favourable in spite of the high initial investment. The Sterile Insect Technique usedfor control or eradication is, therefore, not only very attractive from the environmental pointof view, but is also a feasible option from the economic point of view.
Environmentally, eradication using SIT is the most attractive alternative because thepresent insecticide use is not sustainable. Eradication would result in less outbreaks of newinsect pests as their natural enemies will no longer be eliminated by pesticides, as well as hia drastically reduced insecticide load in the environment. The absence of the Mediterraneanfruit fly would also attract renewed investment in improved fruit production and theintroduction of new fruit species to the region. Finally, as medfly is a feared quarantine pestin certain countries importing fresh fruit, its absence would allow access to these importantexport markets.
In the future, with increasing sensitivity of the public, and with proper quantificationof environmental costs, biological control methods such as the Sterile Insect Technique willbecome even more attractive. Already now, there is growing pressure throughout the regionto reduce the use of insecticides as important trading blocks and countries that import freshfruit are changing regulations governing the acceptable treatment and pesticide residues onfruit and vegetables.

EDITORIAL NOTE
In preparing this publication for press, staff of the IAEA have made up the pages from theoriginal manuscript (s). The views expressed do not necessarily reflect those of the governments of thenominating Member States or. of the nominating organizations.
The use of particular designations of countries or territories does not imply any judgement bythe publisher, the IAEA, as to the legal status of such countries or territories, of their authorities andinstitutions or of the delimitation of their boundaries.
The mention of names of specific companies or products (whether or not indicated as registered)does not imply any intention to infringe proprietary rights, nor should it be construed as anendorsement or recommendation on the part of the IAEA.

CONTENTS
SUMMARY . . . . . . . . . . . . . . . . . . . . . . . . . . . . . . . . . . . . . . . . . . . . 7
INTRODUCTION . . . . . . . . . . . . . . . . . . . . . . . . . . . . . . . . . . . . . . . . . 9
1. THE MEDFLY PROBLEM IN THE MAGHREB . . . . . . . . . . . . . . . . . . . . 101.1. Extent of medfly damage and cost of chemical control . . . . . . . . . . . . . . 10
1.1.1. Fruit production losses . . . . . . . . . . . . . . . . . . . . . . . . . . . . . 111.1.2. Environmental costs . . . . . . . . . . . . . . . . . . . . . . . . . . . . . . 151.1.3. Benefits forgone under current control technologies . . . . . . . . . . . 15
1.1.3.1. Fruit consumption . . . . . . . . . . . . . . . . . . . . . . . . . . 161.1.3.2. Potential markets . . . . . . . . . . . . . . . . . . . . . . . . . . 161.1.3.3. Fruit quality . . . . . . . . . . . . . . . . . . . . . . . . . . . . . 17
1.2. Prospects for improved medfly control . . . . . . . . . . . . . . . . . . . . . . . 17
2. MEDFLY CONTROL OPTIONS . . . . . . . . . . . . . . . . . . . . . . . . . . . . . . 182.1. Regional SIT eradication . . . . . . . . . . . . . . . . . . . . . . . . . . . . . . . . 192.2. Regional suppression using SIT . . . . . . . . . . . . . . . . . . . . . . . . . . . . 202.3. Regional suppression using bait sprays . . . . . . . . . . . . . . . . . . . . . . . . 21
3. COST-BENEFIT ANALYSIS . . . . . . . . . . . . . . . . . . . . . . . . . . . . . . . . 21
3.1. Maghreb fruit fly and market model . . . . . . . . . . . . . . . . . . . . . . . . . 223.2. Model output . . . . . . . . . . . . ; . . . . . . . . . . . . . . . . . . . . . . . . . . 26
3.2.1. Costs and benefits for control zones . . . . . . . . . . . . . . . . . . . . . 273.2.2. Assumptions about performance . . . . . . . . . . . . . . . . . . . . . . . 273.2.3. Action schedule and costs . . . . . . . . . . . . . . . . . . . . . . . . . . . 273.2.4. Projection of costs and benefits over time . . . . . . . . . . . . . . . . . 27
3.3. Risks . . . . . . . . . . . . . . . . . . . . . . . . . . . . . . . . . . . . . . . . . . . . 29
4. RESULTS OF COST-BENEFIT ANALYSES . . . . . . . . . . . . . . . . . . . . . . 33
4.1. Regional SIT eradication . . . . . . . . . . . . . . . . . . . . . . . . . . . . . . . . 334.2. Regional suppression using SIT . . . . . . . . . . . . . . . . . . . . . . . . . . . . 334.3. Regional suppression using bait sprays . . . . . . . . . . . . . . . . . . . . . . . . 33
5. DISCUSSION . . . . . . . . . . . . . . . . . . . . . . . . . . . . . . . . . . . . . . . . . 33
6. CONCLUSION . . . . . . . . . . . . . . . . . . . . . . . . . . . . . . . . . . . . . . . . 38
REFERENCES . . . . . . . . . . . . . . . . . . . . . . . . . . . . . . . . . . . . . . . . . . . 39
APPENDIX 1. LIST OF EXPERTS . . . . . . . . . . . . . . . . . . . . . . . . . . . . . 43APPENDIX 2. ADDITIONAL TABLES AND CALCULATIONS . . . . . . . . . . . 45

SUMMARY
The Mediterranean fruit fly, Ceratitis capitata, is a major problem for fruitproduction in the Maghreb (Algeria, Libya, Morocco and Tunisia). Fruit growing is animportant industry in the region, with an estimated value of over US $800 million peryear, including considerable exports. The extent of the financial loss imposed by this pestin the region is estimated to be US $60-90 million per year, plus approximately US $7-10million per year in insecticide treatment costs. There are additional unquantifiable lossesrelated to (1) the lack of opportunities to export some commodities, especially stonefruits, due to high medfly infestations; (2) the need to apply additional pesticides againstsecondary pests, such as scale insects, mites, aphids and aleurods, as a result of theelimination of their natural enemies by insecticide applications against the medfly; and(3) the effects of the increasing insecticide use on the environment and human health.There are, therefore, two problems that require action:
• High crop losses, resulting in low yields for low input producers and lost exportopportunities for high input producers.
• High pesticide use for high input producers.
Three area-wide strategies for solving the medfly problem in the Maghreb areevaluated:
• Bait suppression.• SIT (Sterile Insect Technique) suppression.• SIT eradication.
Technical and economic information about the three strategies was based ongovernment statistics, a survey of losses and control in the region, past experience withmedfly control in other countries, and an IAEA technical group report on theimplementation of the Sterile Insect Technique (SIT) in the Maghreb.
Economic information was assembled concerning the extent of the problem and costsof these control strategies. Cost and benefit models for these control strategies applied inthe Maghreb were developed to standardize the current level of production and lossesamong the four countries and to allow comparison of control scenarios with standardassumptions. These models can be used for several purposes: testing the outcomes of thevarious strategies, providing a framework to incorporate additional information that maybecome available for refining these evaluations, and providing guidance concerningadditional economic information that needs to be collected in the future.
Cost-benefit estimations are based on a 15 year time scale determined by the longestoption, SIT eradication. Each of the three control strategies requires three years ofpreparatory work to provide baseline ecological and environmental data. Bait suppressionwould then be implemented simultaneously throughout the region. SIT suppression wouldbe implemented over a four year period. SIT eradication would require very intensivecontrol, monitoring and quarantine efforts and would be done successively in nine zones(ranging in size from 2,500 to 5,250 km2) over nine years. Ongoing costs and benefits areconsidered for a further three years after full implementation to allow a reasonablecomparison of the final impact.

Three sets of criteria are considered in comparing the three strategies:
• Financial indicators.• Environmental indicators.• Response to market changes.
As exemplified in Figure 2, bait suppression was the most favourable strategy interms of net present value, since it gives quick returns with little investment. However, interms of the final annual net benefit SIT eradication would be more favourable, once ithad been implemented throughout the region.
The main environmental indicator applied was pesticide use. Both SIT-basedstrategies reduce pesticide use whereas bait suppression increases pesticide use by anestimated 400% compared to current practice. Medfly eradication with SIT eliminates allbait sprays.
All area-wide control programmes would increase domestic consumption of fruit,contributing to the nutrition of the population.
It is expected that the importers of fruit from the Maghreb producers are likely tobecome more discriminating in the future, particularly to pesticide residues. Such marketchanges may force growers in the Maghreb to abandon insecticide-based control in orderto maintain their market share. This may also affect the acceptability of bait treatments,which also interfere with attempts to control secondary pests (mostly Homopteran insects)by the release of natural enemies. Even relatively small changes hi export markets couldgreatly reduce the economic benefits of bait suppression, if bait-treated fruit do notcontinue to have access to high value export markets. In that event, the SIT suppressionstrategy in particular, would become the most attractive strategy (based on net presentvalue over 15 years). SIT eradication becomes the most attractive if additional marketsopen for fruit from certified fly-free producers.
If improved medfly control strategies are widely implemented in the Maghreb,consumers and processors would be the primary beneficiaries. Pesticide use in citruswould decrease, and losses in pome and, especially, stone fruits would be reduced. Thiscould allow a great expansion of stone fruit production, presenting further export earningpotential hi the region. The cost-benefit analyses presented hi the report do not takeaccount of potential increased areas cultivated following the reduction or elimination ofthe medfly. Other benefits are expected with the expansion of fruit processing industrieswhich might occur for fruit exports.

INTRODUCTION
The main objective of this report is to provide an assessment of the economicbenefits of medfly management on fruit crops using the Sterile Insect Technique (SIT) inthe four Maghreb countries (Algeria, Libya, Morocco and Tunisia). The report isdesigned to enhance the decision process of Maghreb countries and donor agencies byproviding an economic foundation for using area-wide control strategies. A draft report[1] established the economic feasibility of three area-wide medfly control strategies in theMaghreb:
• Bait suppression.• SIT suppression.• SIT eradication.
Fruit production is a major industry in the Maghreb. Two countries (Morocco andTunisia) have substantial fruit exports (almost entirely citrus), and all have significantdomestic fresh and processed fruit consumption. For a wide range of fruit and vegetablesthe medfly is the only economically important fruit fly in the region and it is the primaryinsect pest responsible for fruit losses and pesticide residues. It is an important quarantinepest in many countries, and its presence prevents the export of some Maghreb fruits toseveral potential markets.
The current technique used for medfly control in the Maghreb is mainly extensivebait and cover sprays on commercial fruit crops for both export and domestic markets.This method gives good control when it is applied consistently, but it is not widelyadopted by small-scale producers. It is expensive and its effect on natural enemies of suchpests as white flies, scale insects, aphids and mites, may result in increased pesticide usewithin the Maghreb.
Medfly control using SIT has been successful in several countries (USA, CentralAmerica) and new production and sterilization techniques have been developed at theFAO/IAEA Agriculture and Biotechnology Laboratory in Seibersdorf to reduce the cost ofSIT. The SIT has the potential to both reduce medfly losses and pesticide applications inthe Maghreb. However, given the investments required to adopt SIT hi the Maghreb, adetailed cost-benefit analysis of the likely impacts on different economic components ofthe fruit sectors constitutes an important input for the decision-making process.
The report includes five sections devoted to the objectives of this study. The firstpresents the current situation of fruit production, medfly losses and control costs in theMaghreb countries. Section 2 presents the medfly control options considered hi the cost-benefit analysis. Section 3 discusses the cost-benefit techniques used to analyze medflycontrol hi the Maghreb. Section 4 focuses on the cost-benefit results, while Section 5discusses the implications of the results. Various appendices provide additional details.

1. THE MEDFLY PROBLEM IN THE MAGHREB
This section focuses on the magnitude and extent of medfly damage to fruit in theMaghreb and shows the level of current and future losses occurring under the prevailingcontrol technologies.
1.1. EXTENT OF MEDFLY DAMAGE AND COST OF CHEMICAL CONTROL
Commercial citrus, pome and stone fruits are known to be susceptible to medflywith both yield and quality losses. Other traditional fruits in the Maghreb, such aspomegranates and figs, are also affected by the medfly, but these crops are less widelygrown commercially. In addition, there are many non-cultivated (wild) hosts, which areof lesser economic value but cover large areas. As a result, the analysis of damageconcentrates on commercial citrus, pome and stone fruits.
Three types of costs are faced by fruit producers due to medfly damage. The fürstcost is physical loss of crop, through fallen, rotten, culled and discarded fruit. The secondcost is in lower prices from downgraded fruit in the market. The third cost is related todamage control at any stage between production and marketing. Those controls includemainly bait and cover sprays and cultural practices in the field, and post-harvestfumigation or cooling treatments for marketing higher quality grades (mainly exports). Allthese costs vary in different years and locations because of variability in pest levels.
Besides the costs to fruit producers identified above, fresh fruit consumers also bearcosts due to high medfly pressure because of higher fruit prices and lower fruit qualityresulting from reduced supply. Most Maghreb countries have high tariffs on fruit importsand are consequently protecting their domestic markets from competition. Thisexacerbates the price increases caused by losses in domestic supply. The fruit processingindustry (mainly juice, jams and tinned fruit) may also be less competitive because ofhigher domestic fruit costs caused by medfly losses. Consumers respond by purchasingless fresh and processed fruits than they would if prices were lower.
Therefore, the problem posed by the medfly on susceptible fruits is related tocurrent and future costs and opportunities forgone by fruit producers, merchants andconsumers for both fresh and processed fruit. Such losses occur both in quantity andquality at production, marketing and export stages. Other costs are those related to theuse of insecticides to control the medfly. These have negative environmental effects onproducers and consumers and form another component of the social costs associated withcurrent technologies for medfly control.
Estimates of medfly damage in the Maghreb were initially based on data obtainedfrom the survey conducted in 1990 [2-6]. They were then standardized using a computermodel of fruit production and medfly control in the Maghreb [1]. These estimates arethen used hi assessing future benefits since they reduce cross-country data inconsistenciesand eliminate discrepancies due to direct use of the survey data. The current cost ofcontrolling medfly in the Maghreb has also been estimated based on average numbers oftreatments for high and low input producers in each country.
10

1.1.1. Fruit production losses
Fruit crops susceptible to medfly infestation in the Maghreb cover a wide range ofhosts. The first set is composed of commercial fruits including citrus varieties, apricots,peaches, apples, pears, medlars and quinces. The second set includes pomegranates, figsand some other fruits (including Opuntia cactus) which are sold on the domestic marketsbut for which little information is available.
According to various authors (see bibliographical references), wild hosts of themedfly are widespread in the Maghreb. They include natural forest plants, such as argan(700,000 hectares in south-west Morocco), and other bushes and shrubs. While thisnatural vegetation is socially valuable (firewood, animal feeding, wild fruits, argan oil,soil preservation ...), it constitutes a reservoir of medfly. While not of direct economicvalue, these plants are very important ecologically and control of the medflies infestingthese areas must be considered in any attempt to eradicate or suppress the pest.
The main domestically grown fruits (citrus, pome and stone) are produced over atotal area of 344,198 hectares in Algeria, Libya, Morocco and Tunisia. Table I shows thetotal area of fruits in the Maghreb, by country. Citrus is the major crop overall (46% oftotal area), followed by stone fruits (30%) and pome fruits (24%). The table shows the
TABLE I. AVERAGE AREA, PRODUCTION AND YIELD OF CITRUS, POME AND STONEFRUITS IN MAGHREB COUNTRIES, 1 980-1989
Area (thousand hectares)
Algeria Libya Morocco Tunisia Maghreb
Citrus
Pome
Stone
37
21
31
35
8.2
5.9
71
13.1
19.6
14
39
49.4
157
81.3
105.9
Total 89 49.1 103.7 102.4 344.2
Production (thousand tonnes)
Citrus
Pome
Stone
300
66
88
857
8
17
1095
204
135
210
49
53
2250
327
293
Yield (tonnes/ha)
Citrus
Pome
Stone
8.1
3.2
2.8
24.5
1.0
2.9
15.4
15.5
6.9
14.9
1.3
1.1
14.3
4.0
2.8
11

TABLE II. AVERAGE ANNUAL CHANGES IN PRODUCTION OF CITRUS, POME ANDSTONE FRUITS IN MAGHREB COUNTRIES (% PER YEAR), 1980-1989 (BASED ONREGRESSION OF FAO PRODUCTION DATA)
Algeria Libya Morocco Tunisia Maghreb
Citrus
Pome
Stone
-3.75
9.82
4.88
2.66
7.44
9.64
3.03
14.95
4.14
5.00
10.06
0.00
3.15
13.00
3.74
relative importance of citrus, pome and stone fruits in the Maghreb. It also shows that thecitrus area is mainly located in Morocco, Algeria and Libya and that pome and stonefruits are extensively cropped in Tunisia, Algeria and Morocco respectively.
Over the period 1980-1989, fruit production throughout the Maghreb has beenincreasing, except for citrus in Algeria (Table II). These trends do not account for price,inflation, agricultural and trade policy regime changes. These increases hi production canbe related to the incentives generated by relatively high fruit prices and high tariffs forfruit imports hi these countries. Such a progression indicates that losses are likely toincrease under the current medfly control technology, along with increased production. Itis also possible that medfly is preventing an even more rapid intensification of fruitproduction hi the region, especially for stone fruits, which are seriously attacked bymedfly.
Table III presents the total annual loss for each crop and country. Citrus is themajor source of loss, most of which is in Morocco. Monetary values have been assessedusing domestic prices and exchange rates which prevailed during the period 1980-1989[1]. Total losses are approximately US $60 million, half of which occur in Morocco.Algeria and Tunisia have lower loss levels occurring mainly on stone fruits even thoughphysical losses are higher for citrus. This is related to the higher stone fruit prices hithose countries. However, these figures should be treated with some caution, as they donot account for inconsistency in data, exchange rate overvaluations, price distortions anddomestic inflation.
Also, when observing commodity losses, stone fruits account for half of the totalloss from medfly hi the Maghreb with Libya and Morocco losing the most. This situationcan be explained by the relatively low level of control on stone fruits, which are mainlygrown hi the low input sector, and also because the harvesting periods coincide with peakmedfly activity. Lower figures are obtained for citrus, much of which is exported inMorocco and Tunisia, where extensive medfly control has already been undertaken onthese crops using bait and cover sprays in the high input sector. Citrus in Algeria andLibya is oriented to domestic markets, and although they have almost the same cropareas, total losses are higher in Libya because of higher yields (24 tonnes/ha, against8 tonnes/ha in Algeria).
12

The second component of medfly costs on the host fruits is related to expendituresfor pesticide applications. Medfly in the Maghreb is mainly controlled on commercialfruit farms using either bait or cover sprays, often applied by air on larger farms. Baitsprays consist of a mixture of insecticide (generally malathion or chlorpyrifos) with aprotein derived from yeast extract. The protein bait emits ammonia, which is a strongattractant to both male and female fruit flies. The protein itself attracts female flies sinceit is required for egg maturation. The insecticide mixed with the bait then kills the fliesvery efficiently. In some cases cover sprays are used instead of bait applications, controlis achieved by giving a good overall coverage of insecticide on the crop and killing theflies on contact. In principle, cover sprays are less efficient than bait sprays, but they mayneed to be used when other insects or diseases (for which baits do not work) are alsobeing targeted by the same spray or spray mix. However, in much of the Maghreb themedfly is the only serious pest of fruit that requires control with pesticides.
The progressive increase of repeated pesticide applications presents anenvironmental pollution problem and little research has been conducted so far hi theMaghreb on its consequences. In Morocco, Algeria and Tunisia, damage caused by mites,scale insects, aphids and aleurods in citrus is increasing, requiring in turn, more pesticideapplications. Biological control based on the use of entomophagous insects has been triedin Algeria and Tunisia, however, large-scale insecticidal applications are a majorobstacle. The economic consequences of the elimination of natural enemies from stonefruit and citrus orchards in Israel, where a national campaign based on area-wide baitsprays has been in progress throughout the last 30 years, are only poorly documented andstudied.
TABLE III. AVERAGE ANNUAL LOSSES ATTRIBUTED TO MEDFLY ON CITRUS, POMEAND STONE FRUITS IN MAGHREB COUNTRIES, 1980-1989
Total (thousand tonnes)
Algeria Libya Morocco Tunisia Maghreb
Citrus
Pome
Stone
10.22
2.19
4.65
4.81
2.43
10.36
77.20
30.03
41.58
9.24
7.25
14.74
101.47
41.90
71.33
Total (US$ million)
Algeria Libya Morocco Tunisia Maghreb
Citrus
Pome
Stone
1.02
0.44
0.93
2.91
3.67
12.33
8.77
9.95
13.93
1.06
1.61
3.49
13.76
15.67
30.68
Total 2.39 18.91 32.65 6.16 60.11
13

TABLE IVA. AVERAGE ANNUAL COST OF MEDFLY CONTROL ON CITRUS, POME ANDSTONE FRUITS IN MAGHREB COUNTRIES, 1980-1 989 (BASED ON SURVEY DATA)
Total (US$ million)
Algeria Libya Morocco Tunisia Maghreb
Citrus
Pome
Stone
0.65
0.48
0.56
2.13
0.12
0.12
3.85
0.40
0.63
0.38
0.11
0.16
7.01
1.11
1.47
Total 1.69 2.37 4.88 0.65 9.59
TABLE IVB. PROJECTIONS FOR 1990-1 999 OF AVERAGE ANNUAL COST OF MEDFLYDAMAGE AND CONTROL ON CITRUS, POME AND STONE FRUITS
Algeria Libya Morocco Tunisia Maghreb
Citrus
Pome
Stone
1.62
1.01
1.70
6.93
4.63
14.32
14.27
18.23
20.63
8.52
2.34
4.26
24.66
26.24
40.22
Total 4.33 25.88 53.13 15.12 91.12
Despite excellent control using bait sprays, some export quality fruit may needadditional post-harvest control to meet the requirements of some importers. This mayconsist of chilling for several days, heating for several minutes or fumigation with methylbromide, depending on the fruit species and the intended market. All fruit for export mustbe cleaned and culled to ensure good presentation in the market, which adds further to thecost of control of medfly.
On large commercial farms the effectiveness of insecticidal control of medfly is verygood, with 8-10 sprays per season. Virtually all fruit should be free of fruit fly damage ifproperly sprayed. However, small farms producing for the domestic market apply fewersprays, if any at all, and do so less effectively. Most home-grown fruits are not sprayed.
Even with fruit that has had completely effective medfly control, some exportmarkets have quarantine regulations that prevent acceptance of even clean fruit fromcountries in which medfly is present (Japan and southern USA).
Table IVA shows that citrus is the main crop on which medfly is controlled in allfour countries. The high cost of control in Morocco can be attributed to the high
14

proportion of export-oriented producers in that country, who use a greater number of baitor cover spray applications. Higher pesticide prices and labour costs, along with aircraftapplication prices explain the high control cost obtained for Libya. The lower levels ofcontrol costs per hectare in Algeria and Tunisia confirm the inconsistencies obtained whencomparing countries. The same Table IVB shows losses and costs due to medfly projectedover the next decade if both losses and control costs increase at the current rate of fruitproduction. Medfly losses for the Maghreb would reach US $81 million if no furtheraction is taken, and control costs could rise to US $10 million at constant prices. Overalllosses plus costs for the Maghreb would rise to US $91 million. In Section 4, thesefigures are adjusted and presented for the assessment of the future benefits obtained underalternative medfly control technologies.
1.1.2. Environmental costs
A simple measure of the environmental costs of current medfly control efforts canbe obtained by calculating the amount of pesticide put into the environment. No figuresare available on pesticide volumes used for medfly control in the Maghreb, but anapproximation can be based on the total expenditure for control. Calculations are based onthe assumptions that about 25% of total cost is made up of pesticide (the remainder islabour and equipment), and that most of the pesticide used is malathion at approximatelyUS $10/litre at a concentration of 57% active ingredient (ai). On this basis, Table Vpresents estimates of malathion used by commodity and country. Subsequent estimateswere produced using the market model described in Section 3.1 which suggest a lowerlevel of pesticide use in the Maghreb (94 tonnes ai), in Morocco (45.6 tonnes), Libya (13tonnes) and in Algeria (19.5 tonnes). In Tunisia the level of malathion used has beenadjusted upward 16.25 tonnes. While malathion has relatively low mammalian toxicity, itis toxic to fish and beneficial insects. Other environmental costs, such as effect on honeyproduction, water pollution and human health could not be considered due to a lack ofdata.
1.1.3. Benefits forgone under current control technologies
The direct benefits identified in most project analyses do not include all the indirecteffects generated in the medium and long runs. Market development, quality enhancement
TABLE V. ESTIMATED VOLUMES (TONNES AI) OF MALATHION USED ON CITRUS,POME AND STONE FRUITS IN MAGHREB COUNTRIES, 1 980-1989
Algeria Libya Morocco Tunisia Maghreb
Citrus
Pome
Stone
8.1
6.0
7.0
26.6
1.5
1.5
48.1
5.0
7.9
4.7
1.4
2.0
87.6
13.9
18.4
Total 21.1 29.6 61.0 8.1 119.9
15

and fruit consumption effects are major cases considered here. If data were available,these foregone benefits could have been added to the current costs under the prevailingmedfly control technologies.
1.1.3.1. Fruit consumption
With rising population and income in the Maghreb, demand for fruit is increasingand prices will continue to increase as well, for both fresh and processed fruit. Under thecurrent control technologies consumers are loosing all these extra benefits given thatdemand moves faster than fruit supply and prices increase rapidly from year to year. Soconsumption may decline, and low income groups might have even lower consumptionlevels if the trend were to continue. The examples of the market models shown in theappendices indicate estimates of fruit consumption in four countries.
Consumers would benefit from lower fresh fruit prices if more efficient medflycontrols are adopted. They would also benefit from the availability of higher grades offruit, with a large diversity of fruit types. Processed fruits could be more available than atpresent, with increased consumption. Such increases in consumption, while benefiting allconsumers, are likely to improve the nutritional status of low income groups.
1.1.3.2. Potential markets
More efficient medfly controls would increase national supplies of fruits andenhance their quality. Given the current intensity of medfly attacks on susceptible fruitsand the losses generated, the projected levels of fruit supplies in the Maghreb countriesshow a progressive reduction in meeting the need of each economy. Loss of currentexport foreign markets, and potential new export opportunities, are likely to form majorissues for Maghrébin economies. Maintaining and improving supplies to local andtraditional foreign markets and gaining access to new export markets are among the majordirect benefits to be achieved by a medfly control project. Furthermore, a net fruitimporter such as Libya could reduce stone and pome fruit imports. Algeria could againexport its excess supply. Moreover, expansion in domestic fruit markets is an importanteffect resulting from medfly control.
With regard to this last issue, each Maghrébin economy has an annual populationgrowth of 2 to 3% with higher rates observed in cities. This implies that demand forfruits is mainly driven by urban population growth. Furthermore, with rising incomes forsome of the population there will be a greater demand for higher fruit quality atreasonable prices for consumers in domestic markets.
Concerning regional trade among the Maghreb countries, and with the availability ofdiversified and higher fruit grades, improvements can be made in the overall Maghrebeconomy. These flows would increase the affordability of fruits and consequentlycontribute to nutritional improvements among low income consumer groups in eachcountry.
In parallel with these regional and domestic markets, processing can be developedfurther to supply different qualities of processed fruits. This would increase the demandfor lower fruit grades which are not suitable for consumption as fresh fruit.
16

Higher export levels can be reached if the overall quality of fresh and processedfruits improves. Traditional importers in Europe might allow for export increases if therequired quality is met competitively by Maghreb countries. Also, new export marketscan be developed under similar conditions (USA, Canada, Eastern Europe, Japan ...).While Morocco and Tunisia, as net exporters, would benefit more from these potentialmarkets, Libya and Algeria could reach this target in the longer run. Libya can activelyreduce its import levels for pome and stone fruits besides promoting citrus exports.Algeria can enhance its levels of supplies and enter export markets.
These domestic and foreign markets form the basis for potential marketimprovements and generate new streams of benefits to each economy. Such benefitswould only develop with long-term medfly control strategies.
1.1.3.3. Fruit quality
The improvement of fruit quality is an important consequence of a medfly controlproject. As such, improvements can be observed at each stage of production, marketingand export. Furthermore, with the development of new fruit growing opportunities, newvarieties and fruit species can be introduced and grown in different areas in the Maghreb,whenever production costs and returns allow such activities.
Along with improving yields, medfly control will improve fruit quality andcontribute to reduced production and marketing costs. This might increase returns to fruitgrowers and merchants. Consumers are also potential gainers since they would haveaccess to greater choice of fruit quality and might have lower prices due to higher level ofsupply. Moreover, higher nutritional possibilities are offered to low income groups.
Export possibilities would be enhanced with improved fruit quality and marketingstandards. Contract renegotiation with the European Community could be more likely tobe achieved under new sets of fruit grades and qualities. New export markets are alsoimportant to be considered under these conditions. Better fruit quality would be reflectedin higher producer prices.
These changes in fruit quality may induce new production, marketing, consumptionand trade of both fresh and processed fruits. As such, the impact of seasonality can bereduced since longer storage, preservation and processing can make the commoditiesavailable all-year-round. Such a change is likely to occur with the elimination of themajor source of fruit damage. Fruit storage and conservation, along with the developmentof new fruit varieties, would expand the supply of fresh fruits over the year. Thesechanges are major sources of indirect benefits to different economic agents. They inducenew export possibilities based on the availability of fruits in different importing marketsthroughout the year. Early and late season fruit varieties can be expanded and new fruitsintroduced. Late season fruits, especially, would be encouraged by eliminating the build-up of medfly during the season. Currently, many late maturing varieties of fruit cannot begrown economically in the Maghreb because of medfly attack.
1.2. PROSPECTS FOR IMPROVED MEDFLY CONTROLUnder the assumptions adopted and with data limitations underlined in previous
reports [1-6], the costs obtained are likely to be biased estimates of the level of lossinvolved since other host fruit losses are not included. Variations among countries and
17

crops are also important features to be considered. They are related to variations in lossrate estimates for each of the host fruits in different countries. Besides that, comparisonsamong countries are likely to be biased since cost figures are not adjusted for agricultural,price, exchange rate and trade policies. However, the likely impact of such problems areconsidered and costs are adjusted for the reference period in order to have consistentbenefit estimates for the current situation.
Consequently, under the technologies which have been prevailing since 1980, thecosts obtained herein show that important economic losses are occurring in each countryand for the Maghreb as a whole. Such costs are increasing each year and affect producersand consumers. Producers are affected because of higher production costs whileconsumers pay higher prices. The medfly also affects other related sectors. Fruitprocessing (juices, jams, preserves, etc.) have higher prices and higher production costs.Furthermore, as the quality and quantity of fruit is increasingly affected by medfly attack,there may be reductions in exports in some countries (Morocco and Tunisia).Domestically marketed host fruits at the current and projected costs with reductions insupplies and with important shifts in demand (population growth 2 to 3% per year) willhave progressive price increases. Under the current agricultural and trade policiesinvolving high import tariffs on fruits (Algeria, Morocco and Tunisia), domestic priceswill increase greatly implying reduction in per capita consumption for citrus, pome andstone fruits. With overvalued currencies, such as in Libya, consumers pay higher prices(imports and subsidies) in order to ensure domestic fruit consumption.
During the 1980s, structural adjustment programmes have begun to affect prices ofagricultural commodities, including fruit, in the various Maghreb countries. These mightlead to reduction of trade distortions with other countries. Under those policies, fruitimports will become possible and cheaper while fruit exports will become more valuablefor each country. Consequently, medfly host fruit producers in complying with the newpolicies have to reduce their production costs in order to stay competitive in selling theircommodities.
Fruit producers under any agricultural price policies are inclined to reduce theirproduction costs in order to ensure income either from exports or domestic markets.Given the costs related to medfly damage and control occurring under the currenttechnologies, it has been necessary to identify all the possible technological changeswhich might enhance the social benefits related to fruit production. Evaluation of costsand benefits related to each alternative technology over a 15 year horizon has permittedan appropriate ranking of the available options relative to the current situation. Theoptions compared [1] consisted of area-wide pest management with and without SIT, anderadication from the entire Maghreb using SIT. Each of these area-wide medfly controlprogrammes offers more efficient control than is currently available, and would relieveindividual growers of the need to manage pests, especially in citrus, where medfly is theonly serious pest. This would allow growers more time to develop and market theircrops. These area-wide control options are described in the following section.
2. MEDFLY CONTROL OPTIONS
Three options are considered for the management of medfly in the Maghreb, apartfrom the present use of insecticide sprays by private fruit growers. All are regionalprogrammes aimed at extending the benefits of medfly control to all fruit producers. The
18

options include regional SIT eradication, suppression using SIT, and suppression usingbait sprays. Smaller areas for suppression can also be considered if countries choose toconcentrate efforts on specific zones.
2.1. REGIONAL SIT ERADICATION
The general plan for an SIT eradication for medfly has been presented by a group ofIAEA technical experts [7]. The plan is based on the experience of successful eradicationcampaigns using SIT for medfly in Central America. It also draws on experience gainedin a recent programme in the Maghreb which very effectively eradicated the New WorldScrewworm in Libya using the same technique [8], as had been done previously in theUSA and Mexico. A great deal of experience in operating and evaluating medflyeradication has been assembled in the operational MOSCAMED programmes in Mexicoand Guatemala [9]. MOSCAMED began in 1979 and operates under ecological conditionsranging from very arid to humid tropical. In addition, the economic status of farmers,fruit wholesalers, exporters and local consumers have many similarities to the Maghrebregion.
The plan requires an initial preliminary phase of three years to collect data aboutmedfly abundance in different areas and seasons and to make detailed plans on the timingand intensity of the subsequent eradication programme. During the third year of thepreliminary phase a fruit fly rearing and irradiating facility (fly factory) would be built. Itwould also be possible to import flies from surplus capacity in Central America orHawaii, but in the event of a major medfly emergency in the USA, these factories maynot be able to continue supplying flies to the Maghreb.
The eradication programme would be conducted across the region in zones,nominally estimated by the technical experts at 5,000 km2 each [7]. As eradication isachieved or approached in each zone, the campaign would be extended to the next zone.It is expected that the entire operation would take nine years (one zone per year), butthere may be some opportunity to speed up the progress in later years as more experienceis gained. The medfly population would be suppressed at the start of the season in theeradication zone using bait sprays, mainly applied by air. Once trapping showed thatpopulations had been reduced to low levels, sterilized flies would be released by airduring the first two years at a rate of 100,000 per km2 per week if both sexes are used, or50,000 if males only are used. During the second year of eradication in each zone,pockets of residual populations would be eliminated by intensive release of sterile flies orbait spraying.
During the eradication programme, intensive quarantine would be implemented tocheck or limit movement of fruit into the zone from neighbouring medfly-infested areas.In Algeria and Morocco this would require some internal quarantines for several years.After eradication has been achieved, a quarantine system should be maintained to preventthe accidental introduction of fruit flies from outside the region.
The size of the nine zones has been estimated in more detail in the present study,based on the known area of susceptible fruit production in the four countries, and anestimation of the extent of the potential wild medfly reservoirs in each country. The areaof wild reservoirs is greater further to the west. In Morocco a ratio of 1:12 for cultivatedand wild host areas is assumed. There are, for example, approximately 120,000 ha offruit and about 700,000 ha of argan forest. Much of the land in fruit-growing areas is not
19

in susceptible fruit, but since flies are released by air and disperse, an area considerablyin excess of the actual host area must also be included. The ratio of known host areas of1:6 is therefore doubled. The ratio in Algeria is estimated to be 1:8, while in Tunisia andLibya, where hosts are more limited, it is assumed to be 1:4. From these ratios and theknown areas of fruit, estimated sizes for the eradication zones are calculated as follows:Libya (2,500 km2); Tunisia (5,250 km2); Algeria (3 zones of 2,700 km2); and Morocco(4 zones of 3,900 km2). The total area to be treated is estimated to be much less than the220,000 km2 in which medfly could live based on bioclimatic indicators [9]. Much of thatarea is extensively cultivated with non-host crops such as wheat and barley, and some ismarginal to medfly survival in colder winters.
It is assumed that the number of sterile flies which will be needed each year will, onaverage, be enough to treat one zone at the full rate for a first period, and one zone at ahalf rate during a second period (see action plan in Appendix 2). The maximumrequirement for sterile flies would come in year two of implementation taking intoaccount a reserve production capacity of about 1 billion a week.
2.2. REGIONAL SUPPRESSION USING SIT
A major cost in an eradication programme involves sampling and quarantine, plusapplication of eradication efforts to large areas of non-economic wild hosts. Costs can,therefore, be reduced by concentrating efforts on suppression of medfly only in theeconomic areas, and by not taking as rigorous an approach to sampling.
Suppression can be carried out without bait spraying at the beginning of the season.Flies would be released at the same rate as for eradication, but only for the duration ofthe commercial cropping season. Treatments would occur in all zones eventually, whichwould require three fly factories of the size needed for SIT eradication. The constructionof factories would be phased over three years. Implementation could begin inapproximately one-third of the area in the year after each factory was built. Much of thepreliminary phase to collect data on medfly abundance would still be required. Flyreleases would continue as a recurrent expense.
Pesticide application would be eliminated, and the benefits of medfly controlextended to smaller commercial and home producers who make relatively lower effort tocontrol medfly now. However, there would be no improvement in export markets withouteradication.
The SIT has been effectively used in the pink bollworm management programme inCalifornia cotton each year for 23 years [11, 12]. Pheromone traps and SIT release overcotton-growing areas at a rate of 6 million moths per day are the main programmecomponent. The total programme cost in 1991-92 was US $6.3 million to protect aboutUS $780 million of annual output (gross sales value of cotton at world prices) spread overabout 0.49 million ha in the San Joaquin Valley. Growers pay a levy based on theirreported cotton production and this levy covers about 87% of the total programme cost.The strategy does not aim at eradication, but maintains low population levels so thatfarmers do not need to apply insecticides.
20

2.3. REGIONAL SUPPRESSION USING BAIT SPRAYS
It would also be possible to give smaller producers the benefits of medfly control,and reduce the levels of spraying currently practised by large citrus growers, by an area-wide aerial bait application programme. Regional control would reduce reinvasion onfarms currently spraying against medfly. Some new technologies, such as improvedmonitoring and better baits and application equipment, could make a regional baitprogramme much more efficient than individual applications.
Bait sprays would be applied every 10 to 14 days throughout the fruit season. Baitapplications would be made in all areas of fruit production, but not in wild reservoirs. Apreliminary planning phase would be necessary, as with the other options, to establishgood practices under local conditions. This option could be undertaken in all zonessimultaneously. While it would broaden the benefits of medfly control in the same way asSIT suppression, it would increase the volume of pesticide used to control medfly in theMaghreb. The potential for secondary pest outbreaks is thereby increased [13] and theremay ultimately be problems with insecticide resistance, although this has not yet occurredin medfly control programmes since 1956 [14].
One of the major innovations of the regional bait suppression option is the use ofco-ordinated control over multi-farm areas of management. The increased effectiveness ofarea-wide management has been recognized for mobile pests by entomologists in manyprogrammes [15, 16, 17]. However, it is usually very difficult to quantify theseadvantages per hectare or per dollar of product produced at various scales of operationand over time without actual trial experience. Costs of inputs are known, but scaleeconomies and level of effectiveness vary greatly with the speed and intensity ofreinvasion of pests, the costs of local quarantine, the costs of clean-up of reinvasions, thespeed of the spread of the area-wide management campaign and product price changes[18, 19, 20].
For the Maghreb region the most similar experience of organized, area-widemanagement for medfly comes from Israel [14]. An area-wide bait programme is alsoplanned for Mauritius [21]. The speed of adoption of area-wide bait application will bemore rapid than voluntary IPM (integrated pest management) programmes, but theremight be efficiencies relative to the base technology for the Maghreb region because ofreduced fruit losses and less spread of infested fruit. While bait applications may be athigh levels relative to current use in low-input orchards, total insecticide application maydecline on some commercial orchards because of reduced infestation from surroundingwild areas.
3. COST-BENEFIT ANALYSIS
A standard 15 year time horizon is used to compare all the management options.This time-scale was chosen to cover the longest of the three options (eradication). Itincludes three phases in each option, the first three years are devoted to a pre-implementation research and planning phase, implementation would then be undertakenover one to nine years, and a further three years are included to show postimplementation recurrent costs and benefits. A constant 8% discount rate is assumed,based on interest and inflation rates in the region during the 1980-1989 period.
21

Net present values for the discounted stream of costs and benefits, benefit/cost ratiosand the internal rate of return to investment (IRR) are computed. Return on equity isassessed as the ratio of the present value of positive terms over negative terms in thecumulative flow of costs and benefits. The pay-back period is established to indicate howquickly benefits are generated through the project.
Environmental benefits for various management options are indicated by comparingthe cost of pesticide-based medfly control before and after the implementation of theproject. A standard time unit of ten years is used for this comparison. Thus, for allprojects, pesticide expenditures for ten years at current rates and at post-implementationrates are compared. It is assumed throughout that the same pesticide is used in each stageand in each project (generally malathion), and that the proportion of pesticide material toapplication costs remains constant. Given these assumptions, the dollar value of pesticide-based control operations is a good index of the amount of pesticide entering theenvironment. Approximately one quarter of the cost of pesticide use is attributable topesticide itself. Therefore, US $1 million spent on medfly control is equivalent toapproximately 12,500 kg malathion ai (US $250,000 @ US $10/litre and 50% ai).
Estimates of fruit production, medfly losses and control costs for the four Maghrebcountries were presented in the previous sections. This forms the foundation of theestimates of the potential benefits from improved medfly management. These estimateshave been incorporated into a computer model of production, losses and control whichprovided standardized estimates for each country and the region. The model has twoadvantages over the raw data on losses and control collected in each of the four countries.Standard functions are used to make a loss and control cost estimate for each country, sothe reasons for differences in production, costs and prices across countries are moreclearly explained. More importantly, the implications of changes in the fruit productionsystem as a result of medfly management are more easily predicted and illustrated.
3.1. MAGHREB FRUIT FLY AND MARKET MODEL
A spreadsheet model was developed to make estimates of market losses and costsunder a range of possible medfly control options (the functions are described in Table VI,while example output is shown in Table VII). The programme estimates fruit production,values and control costs for three groups of commodities (citrus, pome and stone fruits),for two production sectors (high and low input commercial growers) and for threemarkets (exports requiring and not requiring fruit fly free quality, and the combineddomestic market and home consumption). Inputs include crop areas and potential yieldsfor each commodity and production sector, fruit prices and price elasticities, control costsand performance estimates, the extent of control, and the human population of the area.
Some of the inputs of the model are based on relatively reliable data (for example,crop areas and average yields). Other inputs are based on assumptions which should betested further (average fruit fly damage and control functions). However, the model hasvalue in two ways at present. It can be used to test outputs from realistic ranges of inputs(sensitivity analysis), and it serves as a framework for determining additional data needs.
Crop areas in each of the two producer sectors are based on reported crop areas ineach of the four Maghreb countries. Potential yields were estimated from area andproduction data.
22

TABLE VI. FUNCTIONS USED IN THE FRUIT FLY AND MARKET MODEL (FUNCTIONSIN [] ARE CALCULATED VALUES, OTHERS ARE INPUT BY THE USER)
Potentialproduction
Damage
Control
Control cost
• crop area (hectares by commodity and sector)• potential yield (kg/ha by commodity and sector)
• [potential production (by commodity and sector)]• uncontrolled % medfly damage (by commodity and sector)
• % reduction of damage when control is used (by sector)• average number of treatments by sector
• unit costs of control• average number of treatments by sector
From the inputs andsector is estimated,and sector.
Prices
Distribution
Marketresponse
functions above the production of each commodity by eachand losses and control costs are calculated for each commodity
farm gate prices at local market qualityfarm gate prices at export quality
three markets (fly-free export, export, domestic)export market limits (by commodity)high input commercial production goes to export markets untilexport limits are reached, any excess goes into the domesticmarket at local prices
• all low input domestic production goes into the domestic market
• in the export market the prices are considered to be constantregardless of local production, which is assumed to be a smallproportion of the total world market
• the domestic market takes all production in excess of exportlimits, at constant crop prices
From these functions losses due to medfly can be attributed to markets and theoverall net crop value can be determined.
Consumptionindices
• [consumption (kg/yr) of domestic produce]• [per capita expenditure on fruit in domestic market at farm gate
price]• [average domestic market farm gate price ($/kg) weighted by
commodity]
The damage function assumes that uncontrolled medfly losses are greater in lessintensive production (due, for instance, to less intense crop hygiene, or delayedharvesting). Uncontrolled loss estimates range from 20% in high input citrus to 60% inlow input stone fruit.
The control functions assume that high input commercial growers get about 80%control, while low input commercial growers get about 20% control. Control hi this caseis expressed as the reduction in the potential damage for that crop and sector. Currentcontrol costs are assumed to average about US $40/ha for high input growers andUS $10/ha for low input growers. This is equivalent to approximately 4 bait spray
23

TABLE VII. AN EXAMPLE RUN OF THE FRUIT FLY AND MARKETMODEL FOR THE MAGHREB
Maghreb Fruit Fly and Market Run: Maghreb totalPRODUCTION AND CONTROL VARIABLESHa ('000) Total area
High inputcitrus 92pome 8stone 20
348Low input
667587
Damage functions (% loss)High input Low input
citrus 20 30pome 30stone 40
4560
Sprays per season (average)High input Low input
citrus 4 1pome 5stone 6
11
MARKET VARIABLESPrice Market limit($/kg) ('000 T)
Fly-free certified exportscitrus 1.00 0.00pome 1 .00stone 0.70
0.000.00
Production (kg/ha)High input Low input
16000 100006000
1000025002500
Control (% loss saved)High input Low input
80 208080
2020
Spray cost (@$10/ha)High input Low input
3.68 0.660.401.20
0.750.87
Quantity('000 T)
0.000.000.00
Potential production('000 tonnes)
2132235417
Average loss (%)despite control
10
Total control($ million)
2928
cost
4.341.152.07
Gross crop value ($ million)Market Subtotal
0.00
Exports not requiring fly-free certificatecitrus 1.00 470.00 470.00pome 1.00stone 0.70
Domestic marketcitrus 0.15pome 0.30stone 0.30
0.002.00
0.002.00
1444.72165.12295.10
0.000.00
470.000.001.40
216.7149.5488.53
Total
0.00
471.40
354.77826.17
LOSS AND CONTROL COST SUMMARYLoss by market ($m)
Exports (fly-free)citrus 0.00pome 0.00stone 0.00
0.00Exports (not fly-free)citrus 0.00pome 0.00stone 0.00
0.00Domesticcitrus 32.59pome 21.11stone 36.12
citruspomestone
Loss by commodity(T'OOO) ($m)
217.28 32.5969.88
119.9021.1136.12
Control Loss plus($m) cost ($m)
4.34 36.931.152.07
Population m)Consumption (kg/yr)Mkt expenditure ($/yr)Avg mkt price ($/kg)
22.2638.19
63.0030.24
5.630.19
Crop loss ($m)Control cost ($m)Net crop value ($m)
89.8267.560
818.614
24

applications per year in high input and 1 per year in low input sectors. While manyproducers treat more frequently, some may not treat as much. The figures for low inputgrowers are quite nominal, since many may have widely scattered trees.
On these assumptions the model calculates an expected production for each crop ineach sector and distributes it into the various markets. A limit on export sales is set basedon recent exports from each country. There is evidence that some export quality fruitgoes onto the domestic market because the export market is satisfied. Up to the limit forthe export markets, produce from high input commercial producers goes to export atexport prices. The rest of the production goes to the domestic market, which varies hiprice from country to country.
TABLE VIM. CURRENT ANNUAL LOSSES AND CONTROL COSTS DUE TO MEDFLY INTHE MAGHREB COUNTRIES BASED ON THE FRUIT FLY AND MARKET MODELOUTPUT (US$ MILLION)
Losses
Algeria Libya Morocco Tunisia Maghreb
Citrus
Pome
Stone
7.39
4.25
5.69
17.35
1.18
0.66
5.89
7.70
18.72
2.81
8.42
10.63
32.59
21.11
36.12
Total 17.33 19.19 32.31 21.86 89.83
Control costs
Citrus
Pome
Stone
0.66
0.29
0.61
0.66
0.16
0.21
2.66
0.31
0.70
0.36
0.39
0.55
4.34
1.15
2.07
Total 1.56 1.03 3.67 1.30 7.56
Total losses and control costs
Citrus
Pome
Stone
8.05
4.54
6.30
18.01
1.34
0.87
8.55
8.01
19.42
3.17
8.81
11.18
36.93
22.26
38.19
Total 18.89 20.22 35.98 23.16 97.39
25

Losses are determined by comparing production of each crop in each market withthe potential production assuming there is no damage. Therefore, loss equals potentialproduction minus the production calculated under the given set of damage, control andadoption functions. Losses are calculated in tonnes.
The value of production (and also losses) is calculated assuming constant prices(although market value for organic produce may be higher). Export prices are assumed tobe constant, since Maghreb production is only a part of a larger international market,while domestic prices could be greatly affected by changes in the amount of produce soldlocally. The areas under cultivation are also assumed to be constant. It would be difficultto predict the additional benefits related to expansion of production areas without somevalues for production costs other than pest control.
Benefits from other control strategies can be estimated by replacing the controleffect and cost functions in the benefit model (Table VIII).
For instance, in an eradication programme all growers would have control and allwould get 100% control (compared with the partial control shown in the current situationin Table VIII). The control function for each crop and sector would then be 100% and ifthe private control cost is set at US$0.00 then a gross revenue can be determined.
Runs of the model with estimates of the current situation in each of the fourcountries are shown in Appendix 2.
3.2. MODEL OUTPUT
The model described above has been used to produce revised standard tables formedfly losses and control costs (Table IX) for the four Maghreb countries under currentconditions.
These figures are revisions of those based on the 1990 survey [2-6]. In most casesthe revision accounts for some consistent underestimation of losses. There are verysignificant deviations from the survey estimates for stone fruit losses in Libya, in whichthe loss given in the survey came to an unlikely US $2,000/ha/yr. Losses on citrus,however, were considerably increased in the model, probably accounting forunderestimation of the large low input commercial sector in the country. Overall losses
TABLE IX. ANNUAL BENEFITS BY ZONES, BASED ON FRUIT FLY AND MARKETMODEL (US$ MILLION) WITHOUT INCREASES IN EXPORT MARKETS
Crop loss Pesticide costs Total
Libya
Tunisia
Algeria (3 zones)
Morocco (4 zones)
19.190
21.860
5.770
8.700
1.030
1.300
0.520
0.910
20.220
23.160
6.290
9.610
26

estimated by the model are about 50% greater than those obtained from the nationalsurveys, which may understate losses in the low input sectors.
Table IX shows that most of the medfly control in the Maghreb is associated withcitrus, especially in Morocco where there is a large high input commercial sector. Controlcosts estimated from the model are about 40% higher than those reported in the survey(see Table IV), in keeping with the higher estimates of losses.
3.2.1. Costs and benefits for control zones
Because of the plan to introduce SIT eradication in nine annual zones all benefitsand costs for each option must be calculated on the basis of these zones so that theoptions can be compared accurately. Libya and Tunisia are treated as individual zones,Algeria is divided into three equal zones, and Morocco into four equal zones. All benefitsand costs in Algeria and Morocco are divided equally among their zones. Both benefitsand costs vary for the zones in the four countries because of different total areas of thezones, and different distributions of fruit crops and production sectors.
3.2.2. Assumptions about performance
All three options (eradication and suppression) are assumed to eliminate losses frommedfly, either completely or to negligible amounts on cultivated fruits. Eradication hasthe added advantage of potentially opening markets that are closed to producers inmedfly-infested countries. As a result, benefits are assumed to include prevention of allcurrent losses and control costs. These losses and costs (equivalent to the benefits shownin Table IX) were calculated using the market model illustrated for each country inAppendix 2.
3.2.3. Action schedule and costs
The actions undertaken in each year of the three options are shown in tables inAppendix 2, along with unit costs per area. A sterilized fly rearing facility suitable forproducing enough flies to release in up to three zones at a time is expected to be aroundUS $20 million to construct, based on experience with such factories in Central America.
Total operating costs for each zone for each option are shown in Table X. Moredetailed costs for the SIT eradication option by zones are shown in tables in Appendix 2.
A breakdown of costs associated with SIT eradication is shown in Figure 1.
3.2.4. Projection of costs and benefits over time
The cost-benefit analysis for each option is based on a projection of the actions andassociated benefits and costs over a 15 year time period for each case. The actions (foreach zone in each year) for the various options were entered into a matrix in aspreadsheet model which produced outputs illustrated in Section 4. The model consists ofthree main parts: a table showing the status of activity in each zone over each year; atable of benefits and costs by year for the project; and a table of benefit indices derivedfrom calculations over the entire period. All projects are entered into the tables in thesame way, but with different costs and benefits associated with their respective actionplans.
27

TABLE X. ANNUAL COSTS BY ZONES, BASED ONFRUIT FLY AND MARKET MODEL (US$ MILLION)FOR THREE MEDFLY MANAGEMENT OPTIONS
Annual costs by zones(US$ million)SIT Eradication
Year Eradication phase Post0 1 2 3»»
All eradication costsLibyaTunisiaAlgeria (3 zones)Morocco (4 zones)
SIT fly factory(ies)
Bait application costsLibyaTunisiaAlgeria (3 zones)Morocco (4 zones)
15.03531.57313.15117.282
20.000
2.0804.3681.2961.344
10.09721.204
8.32610.593
1.0402.1840.6480.672
1.7043.5791.3111.599
0.0000.0000.0000.000
SIT Suppression
All control costsLibyaTunisiaAlgeria (3 zones)Morocco (4 zones)
SIT fly factory(ies)
Bait application costsLibyaTunisiaAlgeria (3 zones)Morocco (4 zones)
Year Suppression0 1
4.0008.4013.8025.204
20.000 20.000
0.5201.0920.3240.336
every year2
4.0008.4013.8025.204
20000
0.5201.0920.3240.336
3»»
4.0008.4013.8025.204
0.5201.0920.3240.336
BAIT SuppressionYear Bart applied every year
0 1 2All control costsLibyaTunisiaAlgeria (3 zones)Morocco (4 zones)
SIT fly factory(ies)
Bait application costsLibyaTunisiaAlgeria (3 zones)Morocco (4 zones)
6.76214.2004.2674.478
0.000
5.20010.9203.2403.360
6.76214.2004.2674.478
5.20010.9203.2403.360
3»»
6.76214.2004.2674.478
5.20010.9203.2403.360
28

Medfly eradication costs (15 yr total)US $ 350.9 million
Publicity, Research, Training
Field equip
Quarantine
v**-(6.5%)
(5.8%)—
(4.4%)
(3.1%)Emergency capacity
(7.5%) Fruit sampling
(7.4%)
(21.6%) (18.6%)Bait spraying
Fly releases Fly production
Figure 1. Breakdown of SIT eradication costs.
3.3. RISKS
It must be noted that the benefit and cost models used in this study do not take intoaccount risks associated with breakdown or delay of new technologies or of quarantinebreaches by new species. While the emergency capacity associated with the SIT optionsincludes some bait spray capability, if a fruit fly species other than medfly becameestablished then the regional bait suppression would be the only option that wouldmaintain low losses and high benefits without much greater costs.
There is some flexibility to deal with changing conditions and objectives within thevarious programmes considered. If SIT eradication efforts were unsuccessful, or activitiesdelayed, then SIT suppression could be undertaken as an alternative. Similarly, if SITsuppression was started, and eradication appeared within reach, the SIT suppressionproject could be expanded or extended to achieve the new goal.
Other potential risks are related to changes which can occur to fruit production fromgeneral environmental conditions, or from changing market demand. These factors couldeither increase or decrease the benefits of eradication or suppression of the medfly.However, such risks are independent of medfly control and foreseeable changes shouldnot affect the viability of any of the options.
Risks from changes to any of the inputs in the fruit fly and market model could betested, but such a procedure would be very time-consuming and has not been applied atthis stage.
29

UJO
TABLE XI. COST-BENEFIT ANALYSIS FOR SIT ERADICATION OVER NINE ANNUAL ZONES FROM MOROCCO TO LIBYA
Cost-Benefit Analysis for MAGHREBMED (values m USS million)
Analysis Morocco to Libya SIT eradication
YearProject phase
1 2 3Phase 2
4 5 6 7 8 9 1 0 1 1 1 2Phases
13 14 15Project complete
Total
Status by zone (annual)MoroccoMoroccoMoroccoMoroccoAlgeriaAlgenaAlgeriaTunisiaLibya
ERAD ERADERAD
ERADERADERAD
ERADERADERADERAD
ERADERADERADERADERAD
ERADERADERADERADERADERAD
ERADERADERADERADERADERADERAD
ERADERADERADERADERADERADERADERAD
ERADERADERADERADERADERADERADERADERAD
ERADERADERADERADERADERADERADERADERAD
ERADERADERADERADERADERADERADERADERAD
ERADERADERADERADERADERADERADERADERAD
Costs (cum)3327431 675300762847721 01719706183954231018443
Benefits (annual)Total 0000 17991 26987 35982 42278___48574 54 870 78 034 98259l 98259 98259 708 747
Costs (annual)SIT - eradication
FactoryPost-eradication maintenance
Phase 2 preparation
Total
20000
1 500 2 000 1 500
1 500 2 000 21 500
17282 27875 27875 27875 23745 21477 21477 39899 382390000 0000 0000 0000 0000 0000 0000 0000 00000000 0000 1599 3199 4798 6397 7708 9019 10330
17282 27875 29474 31074 28542 27874 29185 48918 46569
2000 0000 00000000 0000 0000
19429 19429 19429
24006 15613 15613
25384020000881855000
367025
Net benefits (annual)Net benefits (cumulative)
-1500-1 500
-2000-3500
-21500-25000
-8286•33 286
-9884-43170
-2488-45858
4908-40749
1373627014
20700-6314
2568519371
2911648487
51 690100 177
74253174430
82646257 076
82646339 722
339722339722
Benefit indices
Overall
Net present value (US$ m)Benefit/cost ratio (B/C)Return on equity (N/K)Internal rate of return (IRR) (%)Pay-back period (years)
112491 59426
282210
Present value of gross benefits by country (US$ m)
UbyaTunisiaAlgenaMoroccoTotal
287304283953381
177509302459
Comparison of pesticide use projected over 10 years (US$ m)Current
ubya 10 300Tunisia 13 000Algena 15600Morocco 36 700Total 75 600
Post-eradication00000000000000000000
Notes A 15 year time period is used to compare all projects This is based on a time frame for SIT eradication involving 3 years pre-lmplementation, 9 years SIT campaigns by zonesand 3 years post-implementation Pesticide use Includes application costs It is compared over 10 years to account for trie length of the transition penod to eradication
Discount rate 0 08The discount rate of 8% is based on interest and inflation rates In the region during 1980-1990

TABLE XII. COST-BENEFIT ANALYSIS FOR SIT SUPPRESSION OVER FOUR ANNUAL STEPS FROM MOROCCO TO LIBYA
Cost-Benefit Analysis for MAGHREBMED (values In US$ million)
Analysis: Morocco to Libya SIT suppression
YearProject phase
1 2 3Phase 2
4 5 6 7 8 9 10 11 12Phases
13 14 15Project complete
Total
Status by zone (annual)MoroccoMoroccoMoroccoMoroccoAlgeriaAlgeriaAlgeriaTunisiaLibya
SIT-SUPPSIT-SUPP
SIT-SUPPSIT-SUPPSIT-SUPPSIT-SUPP
srr-suppsrr-suppSIT-SUPPSIT-SUPP
SIT-SUPP
SIT-SUPPSIT-SUPPSIT-SUPPSIT-SUPPSIT-SUPPSIT-SUPPSIT-SUPPSIT-SUPPSIT-SUPP
SIT-SUPPSIT-SUPPSIT-SUPPSIT-SUPPSIT-SUPPSIT-SUPPSIT-SUPPSIT-SUPPSIT-SUPP
SIT-SUPPSIT-SUPPSIT-SUPPSIT-SUPPSIT-SUPPSIT-SUPPsrr-suppSIT-SUPPSIT-SUPP
SIT-SUPPSIT-SUPPSIT-SUPPSIT-SUPPSIT-SUPPSIT-SUPPSIT-SUPPSIT-SUPPSIT-SUPP
SIT-SUPPSIT-SUPPSIT-SUPPSIT-SUPPSIT-SUPPsrr-suppSIT-SUPPSIT-SUPPsrr-supp
srr-suppSIT-SUPPSIT-SUPPSIT-SUPPSIT-SUPPSIT-SUPPsrr-suppsrr-suppSIT-SUPP
SIT-SUPPSIT-SUPPSIT-SUPPSIT-SUPPSIT-SUPPSIT-SUPPSIT-SUPPSIT-SUPPSIT-SUPP
SIT-SUPPSIT-SUPPSIT-SUPPSIT-SUPPSIT-SUPPSIT-SUPPSIT-SUPPSIT-SUPPSIT-SUPP
SIT-SUPPSIT-SUPPSIT-SUPPSIT-SUPPSIT-SUPPSIT-SUPPSIT-SUPPSIT-SUPPSIT-SUPP
Costs (cum)57.24957.24952.04552.04530.41930.41930.41975.60632.002
Benefits (annual)Total 0.000 0.000 0.000 17.991 35.982 59.146 98.259 98.259 98.259 98.259 98.259 98.259 98.259 98.259 98.259 997.450
Costs (annual)SIT - suppression
FactorySuppression maintenance
Phase 2 preparation
Total
20.000
1.500 2.000 1.500
1.500 2.000 21.500
10.409 20.818 18.810 23.808 15.407 0.000 0.000 0.000 0.00020.000 20.000 0.000 0.000 0.000 0.000 0.000 0.000 0.0000.000 0.000 10.409 20.818 29.219 44.626 44.626 44.626 44.626
30.409 40.818 29.219 44.626 44.626 44.626 44.626 44.626 44.626
0.000 0.000 0.0000.000 0.000 0.000
44.626 44.626 44.626
44.626 44.626 44.626
89.25260.000
372.8275.000
527.078
Net benefits (annual)Net benefits (cumulative)
-1.500 -2.000 -21.500-1.500 -3.500 -25.000
-12.418 -4.836 29.927 53.633 53.633 53.633 53.633 53.633 53.633-37.418 -42.254 -12.326 41.307 94.940 148.573 202.206 255.839 309.472
53.633 53.633 53.633363.105 416.739 470.372
470.372470.372
Benefit indices
Overall
Net present value (US$ m)Benefit/cost ratio (8/C)Return on equity (N/K)Internal rate of return (IRR) (%)Pay-back period (years)
197.401.757.06
51.167
Present value of gross benefits by country (US$ m)
UbyaTunisiaAlgeriaMoroccoTotal
79.618105.78574.354
202.034461.791
Comparison of pesticide use projected over 10 years (US$ m)Current
Ubya 10.300Tunisia 13.000Algeria 15.600Morocco 36.700Total 75.600
Post-suppression5.200
10.9209.720
13.44039.280
Notes: A 15 year time period is used to compare all projects. This Is based on a time frame for SIT eradication Involving 3 years pre-implementation, 9 years SIT campaigns by zones,and 3 years post-implementation. Pesticide use includes application costs. K is compared over 1 0 years to account for the length of the transition period to eradication.
Discount rate 0.08The discount rate of 8% Is based on Interest and Inflation rates In the region during 1980-1990.

U)N)
TABLE XIII. COST-BENEFIT ANALYSIS FOR BAIT SPRAY SUPPRESSION
Cost-Benefit Analysis for MAGHREBMED (values In US$ million)
Analysis: Simultaneous BAIT suppressionYearProject phase
1 2 3Phase 2
Status by zone (annual)UbyaTunisiaAlgeriaAlgeriaAlgeriaMoroccoMoroccoMoroccoMorocco
Benefits (annual)Total
Costs (annual)
FactonesBAIT suppression
Phase 2 preparation
Total
Net benefits (annual)Net benefits (cumulative)
0 000 0 000 0 000
0000
0 300 0 300 0 400
0 300 0 300 0 400
-0 300 -0 300 -0 400-O 300 -0 600 -1 000
4 5 6 7 8 9 10 11 12Phases
BAITBAITBAITBAITBAITBAITBAFTBAITBAIT
BAFTBAR-BAITBAFTBAFTBAFTBAITBAITBAIT
BAFTBAFTBAITBAITBAFTBAITBAFTBAITBAIT
BAITBAFTBAITBAITBAITBAITBAFTBAITBAR-
BAITBAFTBAITBAITBAFTBAITBAR-BAITBAIT
BAITBAITBAITBAITBAITBAITBAITBAITBAIT
BAITBAITBAFTBAITBAITBAITBAITBAITBAIT
BAITBAITBAITBAFTBAITBAITBAFTBAFTBAFT
BAFTBAFTBAFTBAFTBAITBAFTBAFTBAITBAIT
98259 98259 98259 98259 98259 98259 98259 98259 98259
0000 0000 0000 0000 0000 0000 0000 0000 000051 674 51 674 51 674 51 674 51 674 51 674 51 674 51 674 51 674
51 674 51 674 51 674 51 674 51 674 51 674 51 674 51 674 51 674
46585 46585 46585 46585 46585 46585 46585 46585 4658545585 92169 138754 185338 231923 278507 325092 371677 418261
13 14 15Project complete
BAFTBAFTBAFTBAFTBAFTBAFTBAITBAFTBAIT
BAFTBAFTBAFTBAITBAFTBAITBAFTBAFTBAFT
BAITBAFTBAFTBAFTBAFTBAFTBAFTBAFTBAFT
98 259 98 259 98 259
0000 0000 000051 674 51 674 51 674
51 674 51 674 51 674
Total
Costs (cum)74380
15619746941439414694149255492554925549255
1179108
0000620093
1000
621 093
46 585 46 585 46 585464846 511430 558015
558015558015
Benefit indicesOverall
Net present value (US$ m)BeneWcost ratio (B/C)Return on equity (N/K)Internal rate of return (IRR) (%)Pay-back period (years)
277831 90
3269043697
4
Present value of gross benefits by country (US$ m)
UbyaTunisiaAlgeriaMoroccoTotal
120994138576112995215258587823
Comparison of pesticide use projected over 10 years (US$ m)Current
Ubya 10 300Tunisia 13 000Algeria 15 600Morocco 36 700Total 75 600
Post-suppression52000
10920097200
134400392800
Notes A 15 year time period Is used to compare all projects This Is based on a time frame for SIT eradication Involving 3 years pre-lmplementatlon, 9 years SIT campaigns by zones,and 3 years post-implementation Pesticide use includes application costs It Is compared over 10 years to account for the length of the transition period to eradication
Discount rate 0 OSThe discount rate of 8% Is based on Interest and Inflation rates In the region during 1980-1990

4. RESULTS OF COST-BENEFIT ANALYSES
The results of cost-benefit analyses for five scenarios are presented in this section.Each output is presented in a similar format for easy comparison. The action plan ispresented in the upper part of each table, a summary of benefits by year in the centralpart, and a table of benefit indices is presented in the lower part.
4.1. REGIONAL SIT ERADICATION
The IAEA technical experts proposed an eradication campaign based on nine annualzones [7]. A modification of this plan is illustrated in Table XI. There is some possibilityfor accelerating this plan in the latter part of the project, as experience is gained.However, the more conservative nine year plan was used for comparison.
4.2. REGIONAL SUPPRESSION USING SIT
The SIT suppression option is assumed to be accomplished more rapidly thaneradication (Table XII). It includes the construction of three fly factories hi successiveyears, with four steps of implementation. After the initial preparatory phase, suppressionwould begin hi two zones of Morocco hi the first year, expand to the rest of Morocco hithe second year, all of Tunisia in the third year and Algeria and Libya in the fourth year.Overall, the benefits of this intermediate option are very favourable, although it involvesvery high capital costs for factories and does not present a final solution to the medflyproblem (with opportunities for some increases in export markets), as eradication does.
4.3. REGIONAL SUPPRESSION USING BAIT SPRAYS
The bait suppression option could be implemented more rapidly than the otheroptions and requires no major capital inputs (Table XIII). However, it is the mostexpensive option overall, and would greatly increase the amount of pesticide hi theenvironment. Like SIT suppression, it does not give a final solution to the medflyproblem, nor does it give any potential to open new markets that do not accept fruit frommedfly-infested areas.
5. DISCUSSION
Various criteria can be considered to compare the three area-wide medfly controlprogrammes (Table XIV). Net present value, benefit/cost ratio, the internal rate of returnand the pay-back period show that all three options are better than current control. Baitsuppression gives the best overall financial return over the first 15 year period. However,once established, SIT eradication becomes the dominant strategy in terms of annual netbenefits (Figure 2). Alternative estimates for bait suppression using lower and higher ratesof annual pesticide sprays are shown in Table XV. At around 13 bait applications perfruit season, the bait spray option becomes less economic than SIT suppression over theinitial 15 year period.
Using an environmental indicator, the value of pesticide use (Table XIV), showsclearly that the area-wide bait suppression gives an inferior outcome to the two SITschemes.
33

TABLE XIV. ECONOMIC AND ENVIRONMENTAL INDICATORS FOR THREE MEDFLYCONTROL OPTIONS COMPARED TO CURRENT CONTROL, OVER A 1 5 YEAR PERIOD
Options
Now(currentcontrol)
Area-wide BaitSuppression
Area-wide SITSuppression
Area-wide SITEradication
Economic Indicators
Net present value(15 yr @ 8%)(US$ million)
Benefit/cost ratio
Internal rate ofreturn (%)
Annual net returnafterimplementation(US$ million)
Pay-back period(years afterPhase 2)
-
-
-
-
278
1.90
437
47
1
197
1.75
51
54
4
112
1.59
28
83
7
Environmental Indicators
Net change inpesticide use peryear (US$ million)
Pesticide use peryear (US$ million)
-
7.5
+ 31.8
39.3
-3.6
3.9
-7.5
0
Note: Pesticide use costs include both cost of materials and application, but representsimilar proportions of active ingredient. Pesticide use in SIT suppression may belimited to "clean-up" and barrier treatments around the edge of orchards, and maynot contribute to residues on the fruit. Some bait applications would be used in theinitial phase of SIT eradication, but no pesticide would be needed after the first twoyears in each eradication zone (except in the event of occasional local quarantineoperations).
The economic advantages of area-wide bait suppression are offset by higherenvironmental costs and the potential loss of export market shares if current marketsin North America and Europe become more discriminating against perceived pesticideresidues and medfly presence in producing countries (see Figure 3 and Table XVII).
Both SIT-based control schemes have been costed assuming dedicated fly factoriesare built specifically for the project. However, an alternative budget could be based onpurchasing flies from commercially operated fly factories, reducing capital investment,but paying higher rates for the flies when needed. In Table XVI these two alternatives arecompared, using a commercial rate of US $300 per million flies (male plus female)compared to US $175/million from dedicated factories. At these prices there is littlechange in the net present value over 15 years, but much higher internal rates of return,
34
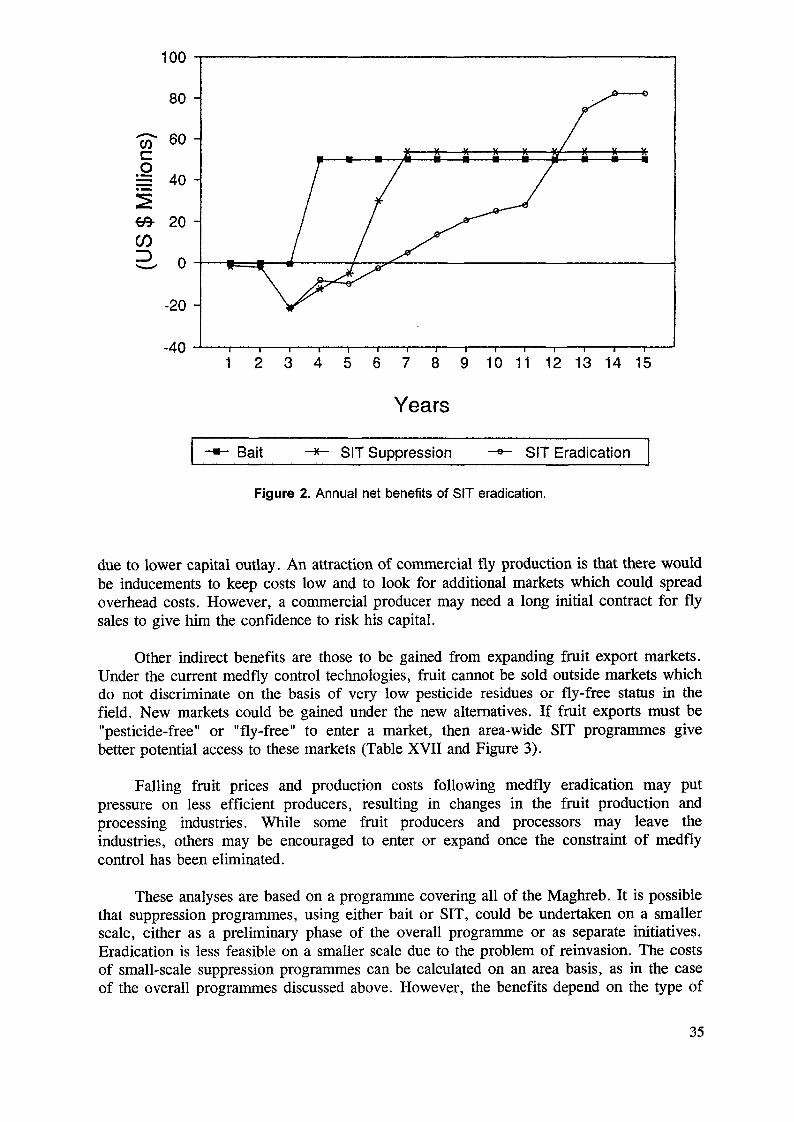
100
1 2 3 4 5 6 7 8 9 10 11 12 13 14 15
Years
Bait SIT Suppression SIT Eradication
Figure 2. Annual net benefits of SIT eradication.
due to lower capital outlay. An attraction of commercial fly production is that there wouldbe inducements to keep costs low and to look for additional markets which could spreadoverhead costs. However, a commercial producer may need a long initial contract for flysales to give him the confidence to risk his capital.
Other indirect benefits are those to be gained from expanding fruit export markets.Under the current medfly control technologies, fruit cannot be sold outside markets whichdo not discriminate on the basis of very low pesticide residues or fly-free status in thefield. New markets could be gained under the new alternatives. If fruit exports must be"pesticide-free" or "fly-free" to enter a market, then area-wide SIT programmes givebetter potential access to these markets (Table XVII and Figure 3).
Falling fruit prices and production costs following medfly eradication may putpressure on less efficient producers, resulting in changes in the fruit production andprocessing industries. While some fruit producers and processors may leave theindustries, others may be encouraged to enter or expand once the constraint of medflycontrol has been eliminated.
These analyses are based on a programme covering all of the Maghreb. It is possiblethat suppression programmes, using either bait or SIT, could be undertaken on a smallerscale, either as a preliminary phase of the overall programme or as separate initiatives.Eradication is less feasible on a smaller scale due to the problem of reinvasion. The costsof small-scale suppression programmes can be calculated on an area basis, as in the caseof the overall programmes discussed above. However, the benefits depend on the type of
35

TABLE XV. ECONOMIC AND ENVIRONMENTAL INDICATORS FOR THREE LEVELS OFBAIT APPLICATION IN AREA-WIDE BAIT SUPPRESSION OVER A 15 YEAR PERIOD(THE 10x/yr OPTION IS USED FOR COMPARISON WITH OTHER CONTROL OPTIONS)
Options
Now(currentcontrol)
Area-wideBait
Suppression7x/yr
Area-wideBait
Suppression1 0x/yr
Area-wideBait
Suppression1 3x/yr
Economic Indicators
Net present value(15 yr @ 8%)
Benefit/cost ratio
Internal rate ofreturn (%)
Annual net returnafter implementa-tion (US$ million)
Pay-back period(years afterPhase 2)
-
-
-
-
-
365
2.63
488
61
1
278
1.90
437
47
1
191
1.48
374
32
1
Environmental Indicators
Net change inpesticide use peryear (US$ million)
Pesticide use peryear (US$ million)
-
7.5
+ 20.0
27.5
+ 31.7
39.3
+ 43.0
50.5
TABLE XVI. COMPARISON OF SOME ECONOMIC INDICATORS FOR SIT-BASEDCONTROL OPTIONS WITH INTERNALLY COSTED FLY FACTORIES AND FLIESPRODUCED AT COST VS EXTERNALLY-FUNDED FLY FACTORIES WITH FLIESPURCHASED AT MARKET PRICES
Factory cost(US$ million)
Fly price permillion (malesplus females)(US$)
Net presentvalue over 15years @ 8%
Internal rate ofreturn (%)
SIT Suppression
Internalfactory
3@ 2060 total
175
197
51
Purchased flies
-
300
199
109
SIT Eradication
Internalfactory
1 @ 2020 total
175
112
28
Purchasedflies
-
300
108
32
36
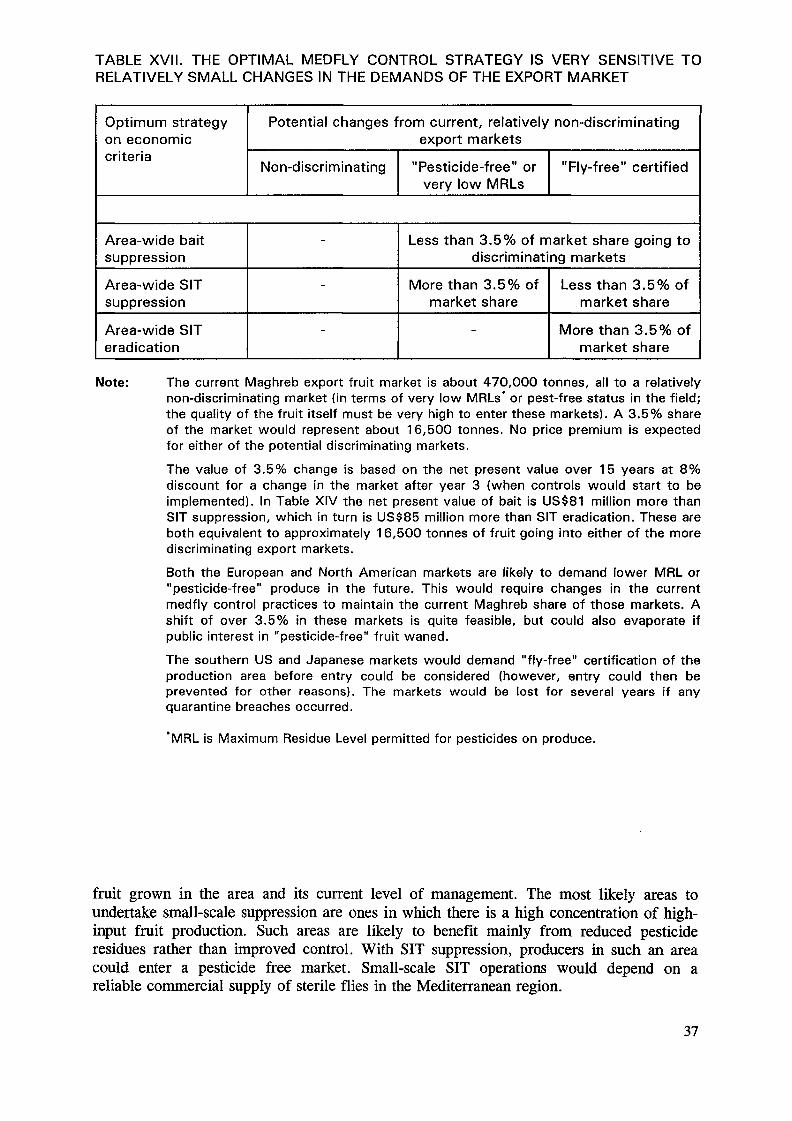
TABLE XVII. THE OPTIMAL MEDFLY CONTROL STRATEGY IS VERY SENSITIVE TORELATIVELY SMALL CHANGES IN THE DEMANDS OF THE EXPORT MARKET
Optimum strategyon economiccriteria
Potential changes from current, relatively non-discriminatingexport markets
Non-discriminating "Pesticide-free" orvery low MRLs
"Fly-free" certified
Area-wide baitsuppression
Area-wide SITsuppression
Area-wide SITeradication
-
-
-
Less than 3.5% of market share going todiscriminating markets
More than 3.5% ofmarket share
-
Less than 3.5% ofmarket share
More than 3.5% ofmarket share
Note: The current Maghreb export fruit market is about 470,000 tonnes, all to a relativelynon-discriminating market (in terms of very low MRLs* or pest-free status in the field;the quality of the fruit itself must be very high to enter these markets). A 3.5% shareof the market would represent about 16,500 tonnes. No price premium is expectedfor either of the potential discriminating markets.
The value of 3.5% change is based on the net present value over 15 years at 8%discount for a change in the market after year 3 (when controls would start to beimplemented). In Table XIV the net present value of bait is US$81 million more thanSIT suppression, which in turn is US$85 million more than SIT eradication. These areboth equivalent to approximately 16,500 tonnes of fruit going into either of the morediscriminating export markets.
Both the European and North American markets are likely to demand lower MRL or"pesticide-free" produce in the future. This would require changes in the currentmedfly control practices to maintain the current Maghreb share of those markets. Ashift of over 3.5% in these markets is quite feasible, but could also evaporate ifpublic interest in "pesticide-free" fruit waned.
The southern US and Japanese markets would demand "fly-free" certification of theproduction area before entry could be considered (however, entry could then beprevented for other reasons). The markets would be lost for several years if anyquarantine breaches occurred.
'MRL is Maximum Residue Level permitted for pesticides on produce.
fruit grown in the area and its current level of management. The most likely areas toundertake small-scale suppression are ones in which there is a high concentration of high-input fruit production. Such areas are likely to benefit mainly from reduced pesticideresidues rather than improved control. With SIT suppression, producers in such an areacould enter a pesticide free market. Small-scale SIT operations would depend on areliable commercial supply of sterile flies in the Mediterranean region.
37
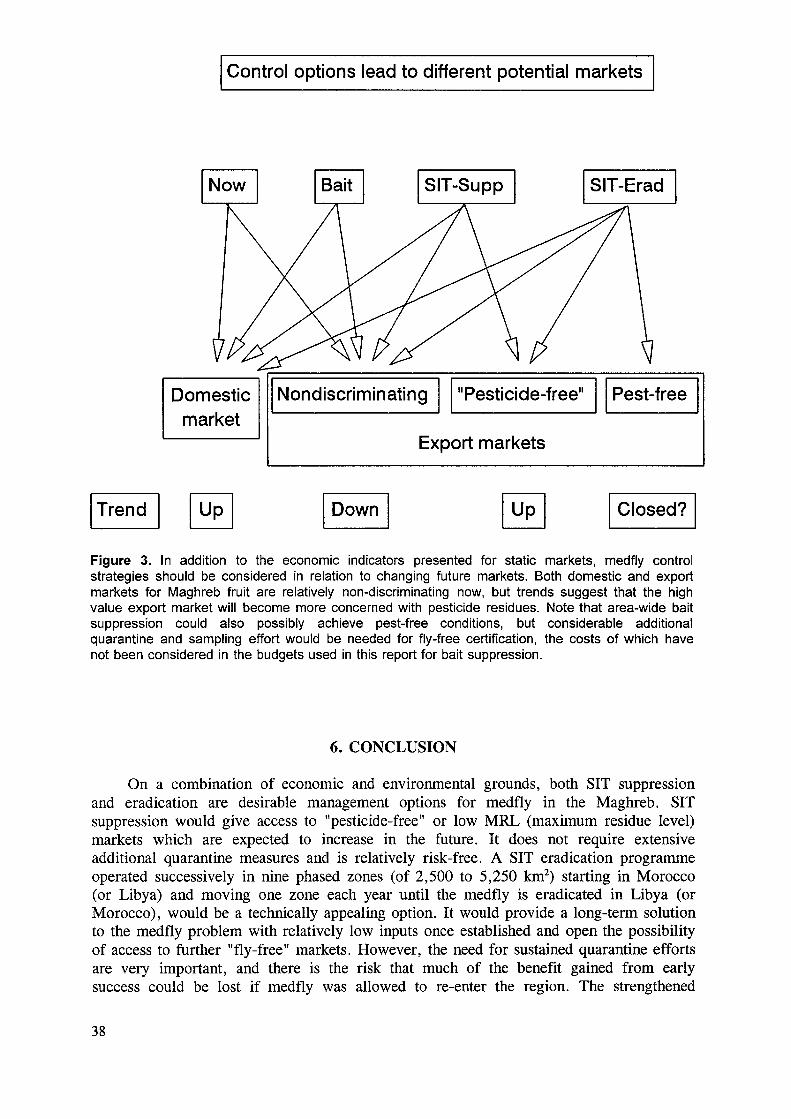
Control options lead to different potential markets
Domesticmarket
Nondiscriminating "Pesticide-free" Pest-free
Export markets
Figure 3. In addition to the economic indicators presented for static markets, medfly controlstrategies should be considered in relation to changing future markets. Both domestic and exportmarkets for Maghreb fruit are relatively non-discriminating now, but trends suggest that the highvalue export market will become more concerned with pesticide residues. Note that area-wide baitsuppression could also possibly achieve pest-free conditions, but considerable additionalquarantine and sampling effort would be needed for fly-free certification, the costs of which havenot been considered in the budgets used in this report for bait suppression.
6. CONCLUSION
On a combination of economic and environmental grounds, both SIT suppressionand eradication are desirable management options for medfly in the Maghreb. SITsuppression would give access to "pesticide-free" or low MRL (maximum residue level)markets which are expected to increase in the future. It does not require extensiveadditional quarantine measures and is relatively risk-free. A SIT eradication programmeoperated successively in nine phased zones (of 2,500 to 5,250 km2) starting in Morocco(or Libya) and moving one zone each year until the medfly is eradicated in Libya (orMorocco), would be a technically appealing option. It would provide a long-term solutionto the medfly problem with relatively low inputs once established and open the possibilityof access to further "fly-free" markets. However, the need for sustained quarantine effortsare very important, and there is the risk that much of the benefit gained from earlysuccess could be lost if medfly was allowed to re-enter the region. The strengthened
38

quarantine infrastructure, preventing the entry of other exotic fruit fly pests, would be anadditional benefit for the Maghreb countries.
About 40% of the costs are related to sterile fly production and release while 30%to trapping, sampling and quarantine activities. The remaining 30% covers fieldequipment, administration, research, emergencies and other activities.
All the benefit indices described for the SIT suppression and eradication of themedfly in the Maghreb are favourable, both in economic and environmental terms. Thetechniques have been proven in large-scale programmes on the American Continent. Withadequate funding provided for quarantine and emergency capacity, the risk of successfulreinvasion by medfly, or invasion by a new fruit fly species, is minimized, and benefitsshould continue well beyond the end of the project.
REFERENCES
REFERENCES CITED
[I] Expert Group, 1992, Draft of Economic Evaluation of Alternative Strategies forMedfly Control in the Maghreb, Report, IAEA, Vienna.
[2] Driouchi, A., 1990, Note sur l'élaboration économique des pertes dues à la moucheméditerranéenne des fruits (Ceratitis capitata): Cas de l'économie agricolealgérienne, Rapport AIEA, Vienne.
[3] Driouchi, A., 1990, Note on Economie Assessment of Losses due to Medfly onFruit Economy of Libya, IAEA Report, Vienna.
[4] Driouchi, A., 1990, Note sur l'élaboration économique des pertes dues à la moucheméditerranéenne des fruits (Ceratitis capitata): Cas de l'économie agricolemarocaine, Rapport AIEA, Vienne.
[5] Driouchi, A., 1990, Note sur l'élaboration économique des pertes dues à la moucheméditerranéenne des fruits (Ceratitis capitata): Cas de l'économie agricoletunisienne, Rapport AIEA, Vienne.
[6] Driouchi, A. et Buyckx, E.J., Report of a Meeting of National Agro-economists onthé Evaluation of the Economie Loss due to the Medfly, Report AE/1/90, IAEA,Vienna.
[7] Expert Group, April 1992, A Programme for the Eradication of Medfly fromAlgeria, Libyan Arab Jamahiriya, Morocco and Tunisia, IAEA, Vienna.
[8] IAEA, 1990, The New World Screwworm Eradication Programme for NorthAfrica, Vienna, January 1990.
[9] Buyckx, E.J., 1992, Bioclimatic Effects on the Distribution of the MediterraneanFruit Fly (Diptera: Tephritidae) in the Maghreb., Proc., XIX. Symposium on FruitFlies of Economic Importance, Int. Congress of Entomology, Beijing, China.
[10] Schwarz, A.J., Liedo, J.P. and Hendrichs, J.P., Current Programme in Mexico,World Crop Pests, Vol. 3B, Fruit Flies Biology, Natural Enemies and Control, A.S.Robinson and G.H.S. Hooper (Eds).
[II] LaChance, L.E., 1985, Genetic Methods for the Control of Lepidopteran Species,USDA, ARS, Washington, D.C.
[12] Clark, D.A., 1992, Co-operative Pink Bollworm Program, San Joaquin Valley,California: 1992 Workplan, California Department of Food and Agriculture,Sacramento.
39

[13] Cohen, E., Podoler, H., El-Hamlauwi, M., 1987: Effects of the malathion-baitmixture used on citrus to control Ceratitis capitata (Wiedemann) (Diptera:Tephritidae) on the Florida red scale, Chrsomphalus aonidum (L.) (Hemiptera:Diaspididae), and its parasitoid, Aphytis holoxanthus DeBach (Hymenoptera:Aphelinidae). Bull. Entomol. Res., 77, 303-307.
[14] Rössler, Y., 1989, Insecticidal Bait and Cover Sprays, pp. 329-336, in A.SRobinson and G.H.S. Hooper. Fruit Flies: Biology and Control, World Crop Pest,Volume 3B, Elsevier Publ., Amsterdam.
[15] Klassen, W., 1989, Eradication of Introduced Arthropod Pests: Theory andHistorical Practice, Misc. Publications 73, Ent. Soc. America.
[16] Fletcher, B.S, 1989, Movements of Tephritid Fruit Flies, pp. 209-219, in A.SRobinson and G.H.S. Hooper. Fruit Flies: Biology and Control, World Crop Pest,Volume 3B, Elsevier Publ., Amsterdam.
[17] White, I.M. and Elson-Harris, 1992, Fruit Flies of Economic Significance: TheirIdentification and Bionomics, ACIAR, CAB.
[18] Carlson, G.A., Sappie, G., Hammig, M., 1989, Economic Returns to Boll WeevilEradication, USDA, ARS, Washington, D.C.
[19] Reichelderfer, K.H., Carlson, G.A. and Norton, G.A., 1984, Economic Guidelinesfor Crop Pest Control, FAO Plant Production and Protection Paper 58, FAO,Rome.
[20] Secretaria de Agricultura y Recursos Hidraulicos, Direcciön General SanidadVegetal (DGSV), 1991, Estudio Beneficio/Costo de la Campana de Erradicaciön delas Moscas de la Fruta, Mexico.
[21] Mumford, J.D., Smith, E.S.C. and Norton, G.A., 1991, Fruit Fly Control inMauritius, Phase 2: Feasibility Study for National and Regional Programmes,Landell Mills Associates Ltd., Bath, U.K.
OTHER REFERENCES
Animal and Plant Health Inspection Service, USDA, 1991.Japan-US Caribfly Protocol on Fresh Florida Fruits.
Armstrong, J.W., 1988, Post-harvest Quarantine Treatments in the Tropics, 1st Int.Symp. Fruit Flies in the Tropics, K. Lumpur, Malaysia.
Blak, M., Neshnush, I.M. and Bin Kafu, A.A., 1987, New Hosts of the Fruit Fly,Libya, Agricultural Research Center, Report, Tripoli.
Buyckx, E.J. and Vita, G., 1988, Report of Visits to Algeria, Morocco and Tunisia,Project RAF/5/013: Survey on the Extent of Medfly Infestation in North Africa, IAEA,Vienna.
Delanoue, P. et Soria, F., 1962, Les fruits de l'oranger amer (Citrus bigaradia Riss),réserve dangereuse en Tunisie de mouches des fruits (Ceratitis capitata Wied.), Ann.INRAT, 35, 1, 125-204.
FAO, 1986, Africa, Statistical Basebook for Food and Agriculture, FAO, Rome.
FAO Trade Yearbook, 1989, FAO, Rome.
40

PAO Production Yearbook, 1990, PAO, Rome.
IAEA, 1990, Northern Africa Regional Programme for Medfly Control and Eradication,Plan of Operation, Draft No. 1, Vienna.
IAEA, 1990, Northern Africa Regional Programme for Medfly Control and Eradication(MAGHREBMED), Phase 2, Plan of Operation, Draft No. 5, Vienna.
IAEA, 1991, Report of the Third Meeting of National Co-ordinators, Report NC/3/1991,Vienna.
Janick, J., 1989, Horticulture in Morocco: North Africa's California, Hort. Science, 24,1:18-22.
Liquido, N.J., Shinoda, L.A. and Cunningham, R.T., 1991, Host Plants of theMediterranean Fruit Fly (Diptera: Tephritidae): An Annotated World Review, Misc.Publications, 77, Ent. Soc. America.
Monjauze, A. et Le Houérou, H.N., 1965, Le rôle des Opuntia dans l'économie agricoleNord Africaine, Bull. Ecole Nat. Supérieure d'Agriculture de Tunis, 8-9, 85-104.
Policy and Program Development, Animal and Plant Health Inspection Service, USDA,1993, An Economie Impact Assessment of the Mediterranean Fruit Fly Co-operativeEradication Program, 26 pages of text, 48 pages of appendices.
Rieuf, P., 1962, Les champignons de l'arganier, les cahiers de la recherche agronomique,15, Direction de la recherche agronomique et de l'enseignement agricole, Rabat, Maroc.
Sacantanis, K.B., 1955, La forêt d'arganier, le plus grand foyer de Ceratitis capitataWied. connu au monde, Service de la défense des végétaux, Marrakech, Maroc.
Soria, P., 1962, Plantes-hôtes secondaires de Ceratitis capitata Wied. en Tunisie, Ann.INRAT, 35:51-72.
USDA, 1990, Strategic Plan For Dealing With Fruit Flies, APHIS, Washington.
41Next page(s) left blank

Appendix 1LIST OF EXPERTS
Dr. J.D. MumfordDepartment of BiologyImperial College at S il wood ParkAscot, Berks SL5 7PYUNITED KINGDOM
Dr. A. DriouchiAgricultural and Applied EconomicsEcole nationale d'agricultureP.O. Box 40MeknèsMOROCCO
Mr. W. EnkerlinPrograma MOSCAMED-SARHApdo. Postal 36830700 Tapachula, ChiapasMEXICO
Dr. G.A. CarlsonDept. of Economics and BusinessNorth Carolina State UniversityRaleigh, NC 27650USA
Dr. E.J. BuyckxViale dei Primati Sportivi 861-00144 RomeITALY
IAEA Staff
Dr. W. KlassenDr. D.A. LindquistDr. J. Hendrichs
43Next page(s) left blank
Appendix 2
ADDITIONAL TABLES AND CALCULATIONS
45

Table 1
Maghreb Fruit Fly and Market Run: AlgeriaPRODUCTION AND CONTROL VARIABLESHa ('000) Total area
High inputcitrus 1 0pome 2stone 6
88Low input
261925
Damage functions (% loss)High input Low input
citrus 20 30pome 30stone 40
4560
Sprays per season (average)High input Low input
citrus 4 1pome 5stone 6
11
MARKET VARIABLESPrice Market limit($/kg) ('000 T)
Fly-free certified exportscitrus 1.00 0.00pome 1.00stone 0.70
0.000.00
ProductionHigh input
1200040002000
(kg/ha)Low input
1000020001500
Control (% loss saved)High input Low input
80 208080
Spray costHigh input
0.400.100.36
2020
(@$10/ha)Low input
0.260.190.25
Quantity('000 T)
0.000.000.00
Potential production('000 tonnes)
3804649
Average loss (%)despite control
173038
Total control cost($ million)
0.660.290.61
Gross crop value ($Market
0.00
Exports not requiring fly-free certificatecitrus 1.00 0.00 0.00pome 1.00stone 0.70
Domestic marketcitrus 0.11pome 0.30stone 0.30
0.000.00
0.000.00
312.8031.8430.54
0.000.00
0.000.000.00
34.419.559.16
Total
million)Subtotal
0.00
0.00
53.1253.12
LOSS AND CONTROL COST SUMMARYLoss by market ($m)
Exports (fly-free)citrus 0.00pome 0.00stone 0:00
0.00Exports (not fly-free)citrus 0.00pome 0.00stone 0.00
0.00Domesticcitrus 7.39pome 4.25stone 5.69
citruspomestone
Loss by commodity(T'OOO) ($m)
67.20 7.3914.1618.46
4.255.69
Control($m)
0.660.290.61
Population (m)Consumption (kg/yr)Mkt expend ture ($/yr)Avg mkt price ($/kg)
Loss, pluscost ($m)
8.054.546.30
25.0015.01
2.120.14
Crop loss ($m)Control cost ($m)Net crop value ($m)
17.3281.560
51.562
46

Table 2
Maghreb Fruit Fly and Market Run: LibyaPRODUCTION AND CONTROL VARIABLESHa ('000) Total area
High inputcitrus 10pome 2stone 3
50Low input
2663
Damage functions (% loss)High input
citrus 20pome 30stone 40
Low input304560
Sprays per season (average)High input
citrus 4pome 5stone 6
Low input111
MARKET VARIABLESPrice($/kg)
Market limit('000 T)
ProductionHigh input
1200040002000
Control (%High input
808080
Spray costHigh input
0.400.100.18
(kg/ha)Low input
850016001200
loss saved)Low input
202020
(@$10/ha)Low input
0.260.060.03
Quantity('000 T)
Potential production('000 tonnes)
341179
Average loss (%)despite control
162324
Total control cost($ million)
0.660.160.21
Gross crop value ($Market
million)Subtotal
Fly-free certified exportscitrus 1.00pome 1.00stone 0.70
0.000.000.00
0.000.000.00
0.000.000.00
0.00Exports not requiring fly-free certificatecitrus 1.00pome 1.00stone 0.70
Domestic marketcitrus 0.30pome 0.30stone 0.30
0.000.000.00
0.000.000.00
283.1613.66
7.39
0.000.000.00
84.954.102.22
Total
0.00
91.2691.26
LOSS AND CONTROL COST SUMMARYLoss by market ($m)
Exports (fly-free)citrus 0.00pome 0.00stone 0.00
0.00Exports (not fly-free)citrus 0.00pome 0.00stone 0.00
0.00Domesticcitrus 17.35pome 1.18stone 0.66
Loss by commodity
citruspomestone
(T'OOO)
57.843.341.61
($m)
17.351.180.66
Population
Control($m)
0.660.160.21
(m)Consumption (kg/yr)Mkt expenditure ($/yr)Avg mkt price ($/kg)
Loss pluscost ($m)
18.011.340.87
4.0874.5622.37
0.30
Crop loss ($m)Control cost ($m)Net crop value ($m)
19.1951.030
90.235
47

Table 3
Maghreb Fruit Fly and Market Run: MoroccoPRODUCTION AND CONTROL VARIABLESHa ('000) Total area
High inputcitrus 65pome 4stone 1 0
106Low input
61110
Damage functions (% loss)High input
citrus 20pome 30stone 40
Low input304560
Sprays per season (average)High input
citrus 4pome 5stone 6
Low input111
MARKET VARIABLESPrice($/kg)
Market limit('000 T)
Production (kg/ha)High input
160008000
18000
Low input120006000
10000Control (% loss saved)High input
808080
Low input202020
Spray cost (@$10/ha)High input
2.600.200.60
Low input0.060.110.10
Quantity('000 T)
Potential production('000 tonnes)
111298
280Average loss (%)despite control
52622
Total control cost($ million)
2.660.310.7
Gross crop value ($ million)Market Subtotal
Fly-free certified exportscitrus 1 .00pome 1.00stone 0.70
0.000.000.00
0.000.000.00
0.000.000.00
0.00Exports not requiring fly-free certificatecitrus 1.00pome 1.00stone 0.70
Domestic marketcitrus 0.10pome 0.30stone 0.30
420.000.002.00
420.000.002.00
633.1272.32
215.60
420.000.001.40
421.40
63.3121.7064.68
149.69Total 571 .09
LOSS AND CONTROL COST SUMMARYLoss by market ($m)
Exports (fly-free)citrus 0.00pome 0.00stone 0.00
0.00Exports (not fly-free)citrus 0.00pome 0.00stone 0.00
0.00Domesticcitrus 5.89pome 7.70stone 18.72
Loss by commodity
citruspomestone
(T'OOO)
58.8825.6862.40
($m)
5.897.70
18.72
Population
Control Loss plus($m) cost ($m)
2.66 8.550.31 8.010.70 19.42
(m) 25.60Consumption (kg/yr) 35.98Mkt expenditure ($/yr) 5.85Avg mkt price ($/kg) 0. 1 6
Crop loss ($m) 32.312Control cost ($m) 3.670Net crop value ($m) 567.41 8
48

Table 4
Maghreb Fruit Fly and Market Run: TunisiaPRODUCTION AND CONTROL VARIABLESHa ('000) Total area
High inputcitrus 7pome 0stone 1
104Low input
83949
Damage functions (% loss)High input Low input
citrus 20 30pome 30stone 40
4560
Sprays per season (average)High input Low input
citrus 4 1pome 5stone 6
11
MARKET VARIABLESPrice Market limit($/kg) ('000 T)
Fly-free certified exportscitrus 1.00 0.00pome 1.00stone 0.70
0.000.00
Production (kg/ha)High input Low input
18000 1200040002000
20001500
Control (% loss saved)High input Low input
80 208080
2020
Spray cost (@$10/ha)High input Low input
0.28 0.080.000.06
0.390.49
Quantity('000 T)
0.000.000.00
Potential production('000 tonnes)
2227875
Average loss (%)despite control
123647
Total control cost($ million)
0.360.390.55
Gross crop value ($ million)Market Subtotal
0.00
Exports not requiring fly-free certificatecitrus 1.00 50.00 50.00pome 1.00stone 0.70
Domestic marketcitrus 0.10pome 0.30stone 0.30
0.000.00
0.000.00
143.9249.9240.06
0.000.00
0.00
50.000.000.00
50.00
14.3914.9812.02
41.39Total 91.39
LOSS AND CONTROL COST SUMMARYLoss by market ($m)
Exports (fly-free)citrus 0.00pome 0.00stone 0.00
0.00Exports (not fly-free)citrus 0.00pome 0.00stone 0.00
0.00Domesticcitrus 2.81pome 8.42stone 10.63
citruspomestone
Loss by commodity(T'OOO) ($m)
28.08 2.8128.0834.94
8.4210.63
Control Loss plus($m) cost ($m)
0.36 3.170.39 8.810.55 11.18
Population (m) 7.90Consumption (kg/yr) 29.61Mkt expenditure ($/yr) 5.24Avg mkt price ($/kg) 0.18
Crop loss ($m) 21.864Control cost ($m) 1.300Net crop value ($m) 90.086
49

Table 5
Estimates of costs for medfly control programmesUnit costs $ per unit
Flies per million (males+females) 175.00Release per million flies 300.00Trap servicing (per trap) 3.17Fruit sampling per sample 2.50Lab l D per fly 0.02Fruit sample analysis (per kg) 1.40Baft spray per ha aerial in orchards 10.00Baft spray in wild area 0.10Quarantine (basic cost) 0.50Emergency capacity (per total ha) 1.00
% of variable costsCapital field equipment 8.00Publicity, research and training 5.00Administration 10.00
50

Table 6
Action plan for medfly eradication
SIT EradicationStandard zone 1Area of orchards (ha) 1 00000Multiple for non crop 4Total area (ha) 500000
Year
1 2
Eradication Phase
3 4 5
Fly-free post eradication period » »
15yrTotal
(US$ m)
Traps/ha* UnitsOrchardsWildSamples per year
0.10.005
52
0.20.01
52
0.020.002
52
0.020.002
52
0.020.002
52Lab ID for traps (estimated flies/ha caught)**
OrchardsWild
Fruit sampling/haOrchardsWildSamples per year
Fruit sample analysis (kg/ha)OrchardsWildSamples per year
Quarantine (intensity x basic cost)OrchardsWildOperations per year
Bait sprayOperations per year
SIT release (million flies/ha)***OrchardsWild vegetationOperations per year
101
0.50.01
26
0.1250.003
26
0.150.01
52
4
0.00050.0005
104
101
0.250.0002
26
0.010.0002
26
0.40.004
52
2
0.00050.0005
52
50.5
000
000
0.40.004
52
0
000
50.5
000
000
0.40.004
52
0
000
50.5
000
000
0.40.004
52
0
000
It may be possible to reduce the level of trapping depending on the progress of eradication.This is an average figure based on anticipated sampling methods.Equivalent to release of 100,000 flies/sq km/week in the first period (twice a week at 50,000 flies/sq km).
51

Table 7
Estimates of phased costs for medfly eradication programme
SIT EradicationAlgeria zone 3
Area of orchards (ha) 30000Multiple for non crop 8Total area (ha) 270000
Year
1 2
Eradication Phase
3 4 5
Fly-free post eradication period » »
1 5 yr Total
(US$ m)
Costs per zoneTotal costs (US$ millions)
TrapsFruit samplingFruit sample analysisBait sprayingFly productionSIT release of fliesEmergency capacityQuarantineCapital field equipPublicity, research and trainingAdministration
Total
1.2541.1310.1631.2962.4574.2120.0000.1790.8550.5351.069
13.151
1.9460.4910.0130.6481.2292.1060.0000.3370.5420.3380.677
8.326
0.4590.0000.0000.0000.0000.0000.2700.3370.0850.0530.107
1.311
0.4590.0000.0000.0000.0000.0000.2700.3370.0850.0530.107
1.311
0.4590.0000.0000.0000.0000.0000.2700.3370.0850.0530.107
1.311
9.1651.6220.1751.9443.6866.3183.5104.8972.5051.5663.132
38.519
Total cost for country
Total costs (US$ millions)
TrapsFruit samplingFruit sample analysisBait sprayingFly productionSIT release of fliesEmergency capacityQuarantineCapital field equipPublicity, research and trainingAdministration
Total
3.7623.3930.4883.8887.371
12.6360.0000.5382.5661.6043.208
39.454
5.8391.4720.0381.9443.6866.3180.0001.0111.6251.0152.031
24.978
1.3760.0000.0000.0000.0000.0000.8101.0110.2560.1600.320
3.933
1.3760.0000.0000.0000.0000.0000.8101.0110.2560.1600.320
3.933
1.3760.0000.0000.0000.0000.0000.8101.0110.2560.1600.320
3.933
27.4954.8650.5265.832
11.05718.95410.53014.691
7.5164.6979.395
115.557
52

Table 8
Estimates of phased costs for medfly eradication programme
SIT EradicationLibya zone 1
Area of orchards (ha) 50000Multiple for non crop 4Total area (ha) 250000
Year
1 2
Eradication Phase
3 4 5
Fly-free post eradication period »»
15yrTotal
(US$ m)
Costs per zoneTotal costs (US$ millions)
TrapsFruit samplingFruit sample analysisBait sprayingFly productionSIT release of fliesEmergency capacityQuarantineCapital field equipPublicity, research and trainingAdministration
Total
1.7171.7550.2492.0802.2753.9000.0000.2470.9780.6111.222
15.035
2.7060.8150.0201.0401.1381.9500.0000.5410.6570.4100.821
10.097
0.5950.0000.0000.0000.0000.0000.2500.5410.1110.0690.139
1.704
0.5950.0000.0000.0000.0000.0000.2500.5410.1110.0690.139
1.704
0.5950.0000.0000.0000.0000.0000.2500.5410.1110.0690.139
1.704
12.1552.5700.2693.1203.4135.8503.2507.8183.0761.9223.845
47.287
Total cost for country
Total costs (US$ millions)
TrapsFruit samplingFruit sample analysisBait sprayingFly productionSIT release of fliesEmergency capacityQuarantineCapital field equipPublicity, research and trainingAdministration
Total
1.7171.7550.2492.0802.2753.9000.0000.2470.9780.6111.222
15.035
2.7060.8150.0201.0401.1381.9500.0000.5410.6570.4100.821
10.097
0.5950.0000.0000.0000.0000.0000.2500.5410.1110.0690.139
1.704
0.5950.0000.0000.0000.0000.0000.2500.5410.1110.0690.139
1.704
0.5950.0000.0000.0000.0000.0000.2500.5410.1110.0690.139
1.704
12.1552.5700.2693.1203.4135.8503.2507.8183.0761.9223.845
47.287
53
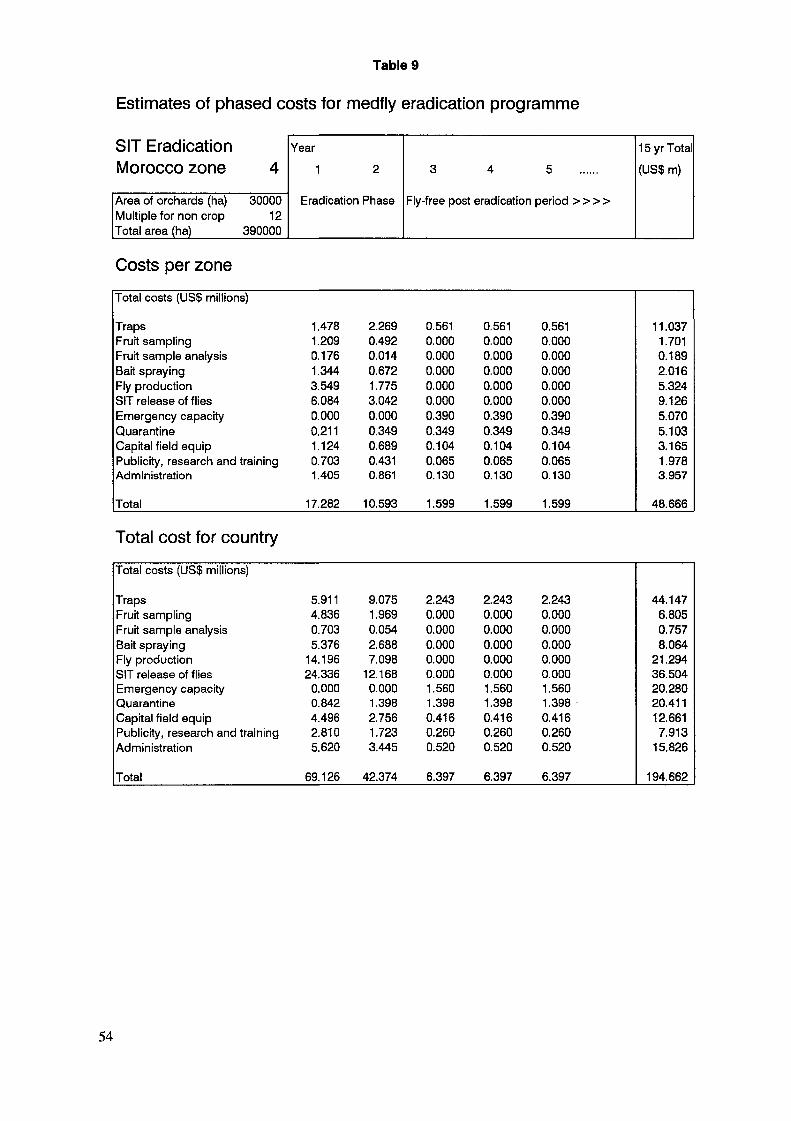
Table 9
Estimates of phased costs for medfly eradication programme
SIT EradicationMorocco zone 4
Area of orchards (ha) 30000Multiple for non crop 12Total area (ha) 390000
Year
1 2
Eradication Phase
3 4 5
Fly-free post eradication period » »
15yrTotal
(US$ m)
Costs per zoneTotal costs (US$ millions)
TrapsFruit samplingFru'rt sample analysisBait sprayingFly productionSIT release of fliesEmergency capacityQuarantineCapital field equipPublicity, research and trainingAdministration
Total
1.4781.2090.1761.3443.5496.0840.0000.2111.1240.7031.405
17.282
2.2690.4920.0140.6721.7753.0420.0000.3490.6890.4310.861
10.593
0.5610.0000.0000.0000.0000.0000.3900.3490.1040.0650.130
1.599
0.5610.0000.0000.0000.0000.0000.3900.3490.1040.0650.130
1.599
0.5610.0000.0000.0000.0000.0000.3900.3490.1040.0650.130
1.599
11.0371.7010.1892.0165.3249.1265.0705.1033.1651.9783.957
48.666
Total cost for country
Total costs (US$ millions)
TrapsFruit samplingFruit sample analysisBait sprayingFly productionSIT release of fliesEmergency capacityQuarantineCapital field equipPublicity, research and trainingAdministration
Total
5.9114.8360.7035.376
14.19624.336
0.0000.8424.4962.8105.620
69.126
9.0751.9690.0542.6887.098
12.1680.0001.3982.7561.7233.445
42.374
2.2430.0000.0000.0000.0000.0001.5601.3980.4160.2600.520
6.397
2.2430.0000.0000.0000.0000.0001.5601.3980.4160.2600.520
6.397
2.2430.0000.0000.0000.0000.0001.5601.3980.4160.2600.520
6.397
44.1476.8050.7578.064
21.29436.50420.28020.41112.6617.913
15.826
194.662
54

Table 10
Estimates of phased costs for medfly eradication programme
SIT EradicationTunisia zone 1
Area of orchards (ha) 1 05000Multiple for non crop 4Total area (ha) 525000
Year
1 2
Eradication Phase
3 4 5
Fly-free post eradication period » »
15yrTotal
(US$ m)
Costs per zoneTotal costs (US$ millions)
TrapsFruit samplingFruit sample analysisBart sprayingFly productionSIT release of fliesEmergency capacityQuarantineCapital field equipPublicity, research and trainingAdministration
Total
3.6063.6860.5244.3684.7788.1900.0000.5192.0541.2832.567
31.573
5.6831.7120.0412.1842.3894.0950.0001.1361.3790.8621.724
21.204
1.2490.0000.0000.0000.0000.0000.5251.1360.2330.1450.291
3.579
1.2490.0000.0000.0000.0000.0000.5251.1360.2330.1450.291
3.579
1.2490.0000.0000.0000.0000.0000.5251.1360.2330.1450.291
3.579
25.5265.3970.5656.5527.166
12.2856.825
16.4186.4594.0378.073
99.303
Total cost for country
Total costs (US$ millions)
TrapsFruit samplingFruit sample analysisBait sprayingFly productionSIT release of fliesEmergency capacityQuarantineCapital field equipPublicity, research and trainingAdministration
Total
3.6063.6860.5244.3684.7788.1900.0000.5192.0541.2832.567
31.573
5.6831.7120.0412.1842.3894.0950.0001.1361.3790.8621.724
21.204
1.2490.0000.0000.0000.0000.0000.5251.1360.2330.1450.291
3.579
1.2490.0000.0000.0000.0000.0000.5251.1360.2330.1450.291
3.579
1.2490.0000.0000.0000.0000.0000.5251.1360.2330.1450.291
3.579
25.5265.3970.5656.5527.166
12.2856.825
16.4186.4594.0378.073
99.303
55

Action plan for medfly control
Table 11
SIT SuppressionStandard zone 1Area of orchards (ha) 1 00000Multiple for non crop 4Total area (ha) 500000
Year1 2
SIT Suppression
3 4 5
SIT suppression continues » »
15yrTotal
(US$ m)
Traps/ha* UnitsOrchards 0.02Wild 0.002Samples per year 52
Lab ID for traps (estimated flies/ha caught)**Orchards 5Wild 0.5
Fruit sampling/haOrchards 0Wild 0Samples per year 0
Fruit sample analysis (kg/ha)Orchards 0Wild 0Samples per year 0
Quarantine (intensity x basic cost)Orchards 0Wild 0Operations per year 0
Bait sprayOperations per year 1
SIT release (million flies/ha)***Orchards 0.0005Wild 0.0005Operations per year 36
0.020.002
52
50.5
000
000
000
1
0.00050.0005
36
0.020.002
52
50.5
000
000
000
1
0.00050.0005
36
0.020.002
52
50.5
000
000
000
1
0.00050.0005
36
0.020.002
52
50.5
000
000
000
1
0.00050.0005
36
* It may be possible to reduce the level of trapping depending on the progress of eradication.** This is an average figure based on anticipated sampling methods.*** Equivalent to release of 50,000/sq km/week in the first year.
56

Table 12
Estimates of phased costs for medfly control programmes
SIT SuppressionAlgeria zone 3Area of orchards (ha) 30000Multiple for non crop 8Total area (ha) 270000
Year
1 2
SIT suppression
3 4 5
SIT suppression continues » »
1 Syr Total
(US$ m)
Costs per zoneTotal costs (US$ millions)
TrapsFruit samplingFruit sample analysisBait sprayingFly productionSIT release of fliesEmergency capacityQuarantineCapital field equipPublicity, research and trainingAdministration
Total
0.4590.0000.0000.3240.8511.4580.0000.0000.2470.1550.309
3.802
0.4590.0000.0000.3240.8511.4580.0000.0000.2470.1550.309
3.802
0.4590.0000.0000.3240.8511.4580.0000.0000.2470.1550.309
3.802
0.4590.0000.0000.3240.8511.4580.0000.0000.2470.1550.309
3.802
0.4590.0000.0000.3240.8511.4580.0000.0000.2470.1550.309
3.802
6.8820.0000.0004.860
12.75821.8700.0000.0003.7102.3184.637
57.035
Total cost for country
Total costs (US$ millions)
TrapsFruit samplingFruit sample analysisBait sprayingFly productionSIT release of fliesEmergency capacityQuarantineCapital field equipPublicity, research and trainingAdministration
Total
1.3760.0000.0000.9722.5524.3740.0000.0000.7420.4640.927
11.407
1.3760.0000.0000.9722.5524.3740.0000.0000.7420.4640.927
11.407
1.3760.0000.0000.9722.5524.3740.0000.0000.7420.4640.927
11.407
1.3760.0000.0000.9722.5524.3740.0000.0000.7420.4640.927
11.407
1.3760.0000.0000.9722.5524.3740.0000.0000.7420.4640.927
11.407
20.6470.0000.000
14.58038.27365.6100.0000.000
11.1296.955
13.911
171.105
57

Table 13
Estimates of phased costs for medfly control programmes
SIT SuppressionLibya zone 1
Area of orchards (ha) 50000Multiple for non crop 4Total area (ha) 250000
Year
1 2
SIT suppression
3 4 5
SIT suppression continues » »
15yrTotal
(US$ m)
Costs per zoneTotal costs (US$ millions)
TrapsFruit samplingFruit sample analysisBait sprayingFly productionSIT release of fliesEmergency capacityQuarantineCapital field equipPublicity, research and trainingAdministration
Total
0.5950.0000.0000.5200.7881.3500.0000.0000.2600.1630.325
4.000
0.5950.0000.0000.5200.7881.3500.0000.0000.2600.1630.325
4.000
0.5950.0000.0000.5200.7881.3500.0000.0000.2600.1630.325
4.000
0.5950.0000.0000.5200.7881.3500.0000.0000.2600.1630.325
4.000
0.5950.0000.0000.5200.7881.3500.0000.0000.2600.1630.325
4.000
8.9220.0000.0007.800
11.81320.2500.0000.0003.9032.4394.878
60.004
Total cost for country
Total costs (US$ millions)
TrapsFruit samplingFruit sample analysisBait sprayingFly productionSIT release of fliesEmergency capacityQuarantineCapital field equipPublicity, research and trainingAdministration
Total
0.5950.0000.0000.5200.7881.3500.0000.0000.2600.1630.325
4.000
0.5950.0000.0000.5200.7881.3500.0000.0000.2600.1630.325
4.000
0.5950.0000.0000.5200.7881.3500.0000.0000.2600.1630.325
4.000
0.5950.0000.0000.5200.7881.3500.0000.0000.2600.1630.325
4.000
0.5950.0000.0000.5200.7881.3500.0000.0000.2600.1630.325
4.000
8.9220.0000.0007.800
11.81320.2500.0000.0003.9032.4394.878
60.004
58

Table 14
Estimates of phased costs for medfly control programmes
SIT SuppressionMorocco zone 4Area of orchards (ha) 30000Multiple for non crop 12Total area (ha) 390000
Year
1 2
SIT suppression
3 4 5
SIT suppression continues » »
15yrTotal
(US$ m)
Costs per zoneTotal costs (US$ millions)
TrapsFruit samplingFruit sample analysisBait sprayingFly productionSIT release of fliesEmergency capacityQuarantineCapital field equipPublicity, research and trainingAdministration
Total
0.5610.0000.0000.3361.2292.1060.0000.0000.3390.2120.423
5.204
0.5610.0000.0000.3361.2292.1060.0000.0000.3390.2120.423
5.204
0.5610.0000.0000.3361.2292.1060.0000.0000.3390.2120.423
5.204
0.5610.0000.0000.3361.2292.1060.0000.0000.3390.2120.423
5.204
0.5610.0000.0000.3361.2292.1060.0000.0000.3390.2120.423
5.204
8.4120.0000.0005.040
18.42831.5900.0000.0005.0783.1736.347
78.067
Total cost for country
Total costs (US$ millions)
TrapsFruit samplingFruit sample analysisBait sprayingFly productionSIT release of fliesEmergency capacityQuarantineCapital field equipPublicity, research and trainingAdministration
Total
2.2430.0000.0001.3444.9148.4240.0000.0001.3540.8461.693
20.818
2.2430.0000.0001.3444.9148.4240.0000.0001.3540.8461.693
20.818
2.2430.0000.0001.3444.9148.4240.0000.0001.3540.8461.693
20.818
2.2430.0000.0001.3444.9148.4240.0000.0001.3540.8461.693
20.818
2.2430.0000.0001.3444.9148.4240.0000.0001.3540.8461.693
20.818
33.6470.0000.000
20.16073.710
126.3600.0000.000
20.31012.69425.388
312.269
59
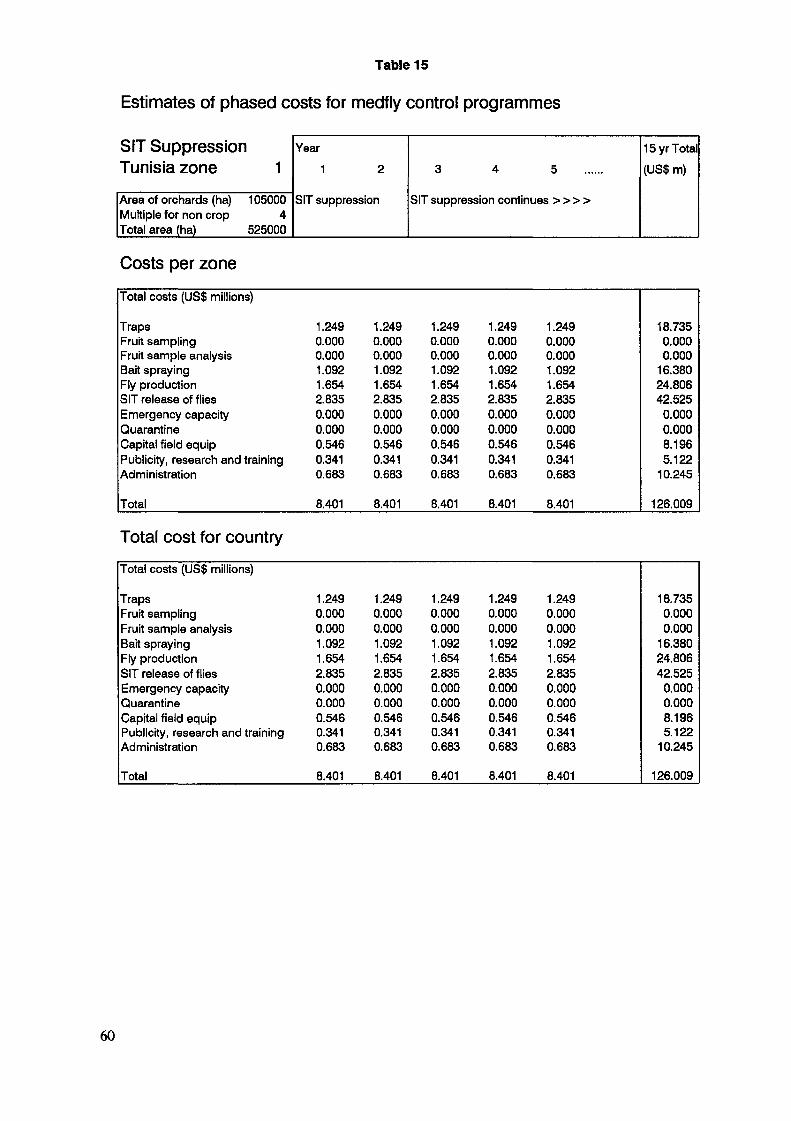
Table 15
Estimates of phased costs for medfly control programmes
SIT SuppressionTunisia zone 1
Area of orchards (ha) 1 05000Multiple for non crop 4Total area (ha) 525000
Year
1 2
SIT suppression
3 4 5
SIT suppression continues » »
15yrTotal
(US$ m)
Costs per zoneTotal costs (US$ millions)
TrapsFruit samplingFruit sample analysisBait sprayingFly productionSIT release of fliesEmergency capacityQuarantineCapital field equipPublicity, research and trainingAdministration
Total
1.2490.0000.0001.0921.6542.8350.0000.0000.5460.3410.683
8.401
1.2490.0000.0001.0921.6542.8350.0000.0000.5460.3410.683
8.401
1.2490.0000.0001.0921.6542.8350.0000.0000.5460.3410.683
8.401
1.2490.0000.0001.0921.6542.8350.0000.0000.5460.3410.683
8.401
1.2490.0000.0001.0921.6542.8350.0000.0000.5460.3410.683
8.401
18.7350.0000.000
16.38024.80642.5250.0000.0008.1965.122
10.245
126.009
Total cost for country
Total costs (US$ millions)
TrapsFruit samplingFruit sample analysisBait sprayingFly productionSIT release of fliesEmergency capacityQuarantineCapital field equipPublicity, research and trainingAdministration
Total
1.2490.0000.0001.0921.6542.8350.0000.0000.5460.3410.683
8.401
1.2490.0000.0001.0921.6542.8350.0000.0000.5460.3410.683
8.401
1.2490.0000.0001.0921.6542.8350.0000.0000.5460.3410.683
8.401
1.2490.0000.0001.0921.6542.8350.0000.0000.5460.3410.683
8.401
1.2490.0000.0001.0921.6542.8350.0000.0000.5460.3410.683
8.401
18.7350.0000.000
16.38024.80642.5250.0000.0008.1965.122
10.245
126.009
60

Action plan for medfly control
Table 16
BAIT SuppressionStandard zone 1Area of orchards (ha) 1 00000Multiple for non crop 4Total area (ha) 500000
Year
1 2
Bait application
3 4 5
Continued bait application » »
1 Syr Total
(US$ m)
Traps/ha UnitsOrchardsWildSamples per year
0.020.002
26
0.020.002
26
0.020.002
26
0.020.002
26
0.020.002
26Lab ID for traps (estimated flies/ha caught)
OrchardsWild
Fruit sampling/haOrchardsWildSamples per year
Fruit sample analysis (kg/ha)OrchardsWildSamples per year
Quarantine (intensity x basic cost)OrchardsWildOperations per year
Bait sprayOperations per year
SIT release (million flies/ha)OrchardsWildOperations per year
50.5
000
000
000
10
000
50.5
000
000
000
10
000
50.5
000
000
000
10
000
50.5
000
000
000
10
000
50.5
000
000
000
10
000
61

Table 17
Estimates of phased costs for medfly control programmes
BAIT SuppressionAlgeria zone 3
Area of orchards (ha) 30000Multiple for non crop 8Total area (ha) 270000
Year
1 2
Bait application
3 4 5
Continued bait application » »
1 5 yr Total
(US$ m)
Costs per zoneTotal costs (US$ millions)
TrapsFruit samplingFruit sample analysisBait sprayingFly productionSIT release of fliesEmergency capacityQuarantineCapital field equipPublicity, research and trainingAdministration
Total
0.2290.0000.0003.2400.0000.0000.0000.0000.2780.1730.347
4.267
0.2290.0000.0003.2400.0000.0000.0000.0000.2780.1730.347
4.267
0.2290.0000.0003.2400.0000.0000.0000.0000.2780.1730.347
4.267
0.2290.0000.0003.2400.0000.0000.0000.0000.2780.1730.347
4.267
0.2290.0000.0003.2400.0000.0000.0000.0000.2780.1730.347
4.267
3.4410.0000.000
48.6000.0000.0000.0000.0004.1632.6025.204
64.01 1
Total cost for countryTotal costs (US$ millions)
TrapsFruit samplingFruit sample analysisBait sprayingFly productionSIT release of fliesEmergency capacityQuarantineCapital field equipPublicity, research and trainingAdministration
Total
0.6880.0000.0009.7200.0000.0000.0000.0000.8330.5201.041
12.802
0.6880.0000.0009.7200.0000.0000.0000.0000.8330.5201.041
12.802
0.6880.0000.0009.7200.0000.0000.0000.0000.8330.5201.041
12.802
0.6880.0000.0009.7200.0000.0000.0000.0000.8330.5201.041
12.802
0.6880.0000.0009.7200.0000.0000.0000.0000.8330.5201.041
12.802
10.3240.0000.000
145.8000.0000.0000.0000.000
12.4907.806
15.612
192.032
62

Table 18
Estimates of phased costs for medfly control programmes
BAIT SuppressionLibya zone 1
Area of orchards (ha) 50000Multiple for non crop 4Total area (ha) 250000
Year1 2
Bait application
3 4 5
Continued bait application »»
15yrTotal
(US$ m)
Costs per zoneTotal costs (US$ millions)
TrapsFruit samplingFruit sample analysisBait sprayingFly productionSIT release of fliesEmergency capacityQuarantineCapital field equipPublicity, research and trainingAdministration
Total
0.2970.0000.0005.2000.0000.0000.0000.0000.4400.2750.550
6.762
0.2970.0000.0005.2000.0000.0000.0000.0000.4400.2750.550
6.762
0.2970.0000.0005.2000.0000.0000.0000.0000.4400.2750.550
6.762
0.2970.0000.0005.2000.0000.0000.0000.0000.4400.2750.550
6.762
0.2970.0000.0005.2000.0000.0000.0000.0000.4400.2750.550
6.762
4.4610.0000.000
78.0000.0000.0000.0000.0006.5974.1238.246
101.427
Total cost for countryTotal costs (US$ millions)
TrapsFruit samplingFruit sample analysisBait sprayingFly productionSIT release of fliesEmergency capacityQuarantineCapital field equipPublicity, research and trainingAdministration
Total
0.2970.0000.0005.2000.0000.0000.0000.0000.4400.2750.550
6.762
0.2970.0000.0005.2000.0000.0000.0000.0000.4400.2750.550
6.762
0.2970.0000.0005.2000.0000.0000.0000.0000.4400.2750.550
6.762
0.2970.0000.0005.2000.0000.0000.0000.0000.4400.2750.550
6.762
0.2970.0000.0005.2000.0000.0000.0000.0000.4400.2750.550
6.762
4.4610.0000.000
78.0000.0000.0000.0000.0006.5974.1238.246
101.427
63

Table 19
Estimates of phased costs for medfly control programmes
BAIT SuppressionMorocco zone 4Area of orchards (ha) 30000Multiple for non crop 1 2Total area (ha) 390000
Year
1 2
Bait application
3 4 5
Continued bait application » »
15yrTotal
(US$ m)
Costs per zoneTotal costs (US$ millions)
TrapsFruit samplingFruit sample analysisBait sprayingFly productionSIT release of fliesEmergency capacityQuarantineCapital field equipPublicity, research and trainingAdministration
Total
0.2800.0000.0003.3600.0000.0000.0000.0000.2910.1820.364
4.478
0.2800.0000.0003.3600.0000.0000.0000.0000.2910.1820.364
4.478
0.2800.0000.0003.3600.0000.0000.0000.0000.2910.1820.364
4.478
0.2800.0000.0003.3600.0000.0000.0000.0000.2910.1820.364
4.478
0.2800.0000.0003.3600.0000.0000.0000.0000.2910.1820.364
4.478
4.2060.0000.000
50.4000.0000.0000.0000.0004.3682.7305.461
67.165
Total cost for country
Total costs (US$ millions)
TrapsFruit samplingFruit sample analysisBait sprayingFly productionSIT release of fliesEmergency capacityQuarantineCapital field equipPublicity, research and trainingAdministration
Total
1.1220.0000.000
13.4400.0000.0000.0000.0001.1650.7281.456
17.911
1.1220.0000.000
13.4400.0000.0000.0000.0001.1650.7281.456
17.911
1.1220.0000.000
13.4400.0000.0000.0000.0001.1650.7281.456
17.911
1.1220.0000.000
13.4400.0000.0000.0000.0001.1650.7281.456
17.911
1.1220.0000.000
13.4400.0000.0000.0000.0001.1650.7281.456
17.911
16.8240.0000.000
201.6000.0000.0000.0000.000
17.47410.92121.842
268.661
64

Table 20
Estimates of phased costs for medfly control programmes
BAIT SuppressionTunisia zone 1Area of orchards (ha) 1 05000Multiple for non crop 4Total area (ha) 525000
Year
1 2
Bait application
3 4 5
Continued bait application » »
15yrTotal
(US$ m)
Costs per zone
Total costs (US$ millions)
TrapsFruit samplingFruit sample analysisBait sprayingFly productionSIT release of fliesEmergency capacityQuarantineCapital field equipPublicity, research and trainingAdministration
Total
0.6250.0000.000
10.9200.0000.0000.0000.0000.9240.5771.154
14.200
0.6250.0000.000
10.9200.0000.0000.0000.0000.9240.5771.154
14.200
0.6250.0000.000
10.9200.0000.0000.0000.0000.9240.5771.154
14.200
0.6250.0000.000
10.9200.0000.0000.0000.0000.9240.5771.154
14.200
0.6250.0000.000
10.9200.0000.0000.0000.0000.9240.5771.154
14.200
9.3680.0000.000
163.8000.0000.0000.0000.000
13.8538.658
17.317
212.996
Total cost for countryTotal costs (US$ millions)
TrapsFruit samplingFruit sample analysisBait sprayingFly productionSIT release of fliesEmergency capacityQuarantineCapital field equipPublicity, research and trainingAdministration
Total
0.6250.0000.000
10.9200.0000.0000.0000.0000.9240.5771.154
14.200
0.6250.0000.000
10.9200.0000.0000.0000.0000.9240.5771.154
14.200
0.6250.0000.000
10.9200.0000.0000.0000.0000.9240.5771.154
14.200
0.6250.0000.000
10.9200.0000.0000.0000.0000.9240.5771.154
14.200
0.6250.0000.000
10.9200.0000.0000.0000.0000.9240.5771.154
14.200
9.3680.0000.000
163.8000.0000.0000.0000.000
13.8538.658
17.317
212.996
65

QUESTIONNAIRE ON IAEA-TECDOCs
It would greatly assist the International Atomic Energy Agency in its analysis of the effective-ness of its Technical Document programme if you could kindly answer the following questionsand return the form to the address shown below. Your co-operation is greatly appreciated.
Title: Economic evaluation of damage caused by, and methods of control of, theMediterranean fruit fly in the Maghreb
Number: IAEA-TECDOC-830
1. How did you obtain this TECDOC?
[ ] From the IAEA:[ ] At own request[ ] Without request[ ] As participant at an IAEA meeting
[ ] From a professional colleague[ ] From library
2. How do you rate the content of the TECDOC?
[ ] Useful, includes information not found elsewhere[ ] Useful as a survey of the subject area[ ] Useful for reference[ ] Useful because of its international character[ ] Useful for training or study purposes[ ] Not very useful. If not, why not?
3. How do you become aware of the TECDOCs available from the IAEA?
[ ] From references in:[ ] IAEA publications[ ] Other publications
[ ] From IAEA meetings[ ] From IAEA newsletters[ ] By other means (please specify)[ ] If you find it difficult to obtain information on TECDOCs please tick this box
4. Do you make use of IAEA-TECDOCs?
[ ] Frequently[ ] Occasionally[ ] Rarely
5. Please state the institute (or country) in which you are working:
Please return to: R.F. KelleherHead, Publishing SectionInternational Atomic Energy AgencyP.O. Box 100Wagramerstrasse 5A-1400 Vienna, Austria