ecological practices and return on investment: farm level evidence from …€¦ · ·...
TRANSCRIPT
Organic Certification, Agro-Ecological Practices and Return on
Investment: Farm Level Evidence from Ghana
by Linda Kleemann and Awudu Abdulai
No. 1816| December 2012
Kiel Institute for the World Economy, Hindenburgufer 66, 24105 Kiel, Germany
Kiel Working Paper No. 1816| December 2012
Organic Certification, Agro-Ecological Practices and Return on Investment: Farm Level Evidence from Ghana*
Linda Kleemann and Awudu Abdulai
Abstract:
The recent empirical literature on economic sustainability of certified export crops shows that certification standards that enhance yields are important for improving farm revenues and farmer welfare. However, limited evidence exists on the impact of organic certification on the adoption of agro-ecological practices. In this study, we use unique farm-level data from Ghana to examine the impact of organic certification on the use of agro-ecological practices to improve environmental conditions, as well as how using these measures affect farm outcomes such as return on investment. In the former, we utilize an endogenous switching regression approach to account for selection bias due to unobservable factors. Our empirical results reveal that organic certification increases agro-ecological practice use, although from a very low starting point. Using a generalized propensity score approach, we show that there is a nonlinear relationship between the intensity of agro-ecological practice use and return on investment.
Keywords: organic agriculture, certification, agro-ecological practices, return on investment, impact assessment
JEL classification: O13, Q13, Q17, Q56 Linda Kleemann Kiel Institute for the World Economy 24100 Kiel, Germany Telephone: +49(0)431-8814-248 E-mail: [email protected]
*We would like to thank the Poverty Reduction, Equity and Growth Network (PEGNet) and the H.Wilhelm Schaumann Stiftung for financial support. ____________________________________ The responsibility for the contents of the working papers rests with the author, not the Institute. Since working papers are of a preliminary nature, it may be useful to contact the author of a particular working paper about results or caveats before referring to, or quoting, a paper. Any comments on working papers should be sent directly to the author.
Coverphoto: uni_com on photocase.com

2
1 Introduction
Concerns over climate change and increasing pressure on land have resulted in increased
promotion of sustainable production methods that increase yields, while protecting the
environment as well as increasing the resilience of crops to climatic change (Kassam et al.,
2012; Branca et al., 2011; FAO, 2011; Knowler and Bradshaw, 2007; Erenstein, 2002). Such
agro-ecological practices form part of organic agriculture principles, but in practice, low-input
production with none, or very little sustainable soil and water management practices are
frequently certified as organic in many developing countries.
To encourage the adoption of sustainable production methods, national governments,
NGOs and international donors have promoted the marketing of export crops through certified
marketing channels, mostly through farmer-based groups, as an attractive business model for
smallholders in developing countries (Beuchelt and Zeller, 2011). These sustainable
certification schemes have become increasingly popular in many countries because they
combine valued traits that are related to the environment, poverty alleviation, and health
outcomes into a single commodity (Barham and Weber, 2012). Consumers generally show
their preferences for such products by paying higher prices to support an environmentally
healthy world. However, the success of these schemes depends to a large extent on prices
received and incomes earned by the farmers.
The significance of these schemes in promoting sustainable farm practices and
improving the incomes of smallholders in developing countries has attracted the attention of
many policy analysts over the last few years. In particular, several studies have examined the
impacts of certification schemes on farm outcomes such as farm revenues, profits, and
household poverty (Pretty et al., 2003; Ninan and Sathyapalan, 2005; Bolwig et al., 2009;
Valkila, 2009; Beuchelt and Zeller, 2011; Barham and Weber, 2012). Most researchers find
modest positive impacts of organic certification on farm revenues and household income,
using various measures and econometric approaches. They attribute the positive impacts of
3
certification to price premiums that are paid at least for part of the crop sales (e.g. Valkila,
2009; Bolwig et al., 2009; ITC, 2011), although it is usually not clear whether the effect
comes from certification, contract farming, or export market access. It is important to note that
some researchers have been rather skeptical on the ability of certification to lift farmers out of
poverty, given the usually low revenue increases. The main reasons for this skepticism are the
high certification and investment costs involved in the process (Calo and Wise, 2005; Valkila,
2009; Beuchelt and Zeller, 2011).
Despite this increasing number of impact assessment studies, very few studies have
considered the environmental outcomes of different certification programs (Barham and
Weber, 2012). Philpott et al.’s (2007) study on Mexico examines environmental outcomes by
analyzing the impact of certification on vegetation and ant, as well as bird diversity in coffee
farms and forests. Rather surprisingly, their findings show no differences between in
vegetation characteristics, ant or bird species richness, or fraction of forest fauna in farms
based on certification. Pretty et al. (2006) conduct a review of 286 interventions to show that
the use of sustainable agricultural practices increases productivity on developing country
farms, albeit using best practices. Bolwig et al. (2009) studied the effect of organic contract
farming and adoption of organic practices on 112 coffee producing smallholders and conclude
there are somewhat higher revenues for farmers that adopt organic farming techniques,
findings confirmed by Blackman and Naranjo (2010) who find that organic certified farmers
in Costa Rica use less chemicals and adopt some environmental friendly management
practices. However, they base their analysis on only 35 certified coffee farmers in Costa Rica.
With the notable exception of the study by Pretty et al. (2006), which includes
countries from sub-Saharan Africa, we find no empirical evidence on the impacts of
certification on environmental outcomes in sub-Saharan Africa. In particular, the dependence
of the yield impact of organic certification on the intensity of agro-ecological practice use has
hardly been studied in the existing literature. Some authors have argued that organic farming
4
in Africa mostly implies the non-application of chemical inputs, without necessarily adopting
alternative soil fertility management practices. This is particularly so for the many
smallholders in Africa, who traditionally produce ”organically by default”, since they virtually
use no external input. The smallholders who use no chemical inputs or very low levels of
external inputs normally face lower entry barriers into organic certification programs, since
they require small adjustments to meet certification requirements. Organic certification only
requires abstaining from the use of chemical substances, but not the active use of alternative
inputs. However, Barham and Weber (2012) suggest that improving productivity by means of
agronomic practices may be more important than focusing on price increases by means of
certification. On the other hand access to higher-priced organic markets may provide
incentives to adopt (more) agro-ecological practices (Wollni et al., 2010).
This study contributes to the literature by examining the effect of organic certification on the
extent to which agro-ecological practices are used, as well as the impact of the intensity of use on the
return on investment (ROI). We employ data from a recent farm-level survey of 386 small-scale
pineapple farmers in the Greater-Accra and Central Regions of Ghana. The study accounts for
selection bias due to unobservable factors by using the framework of endogenous switching regression
approach (Lee, 1978). The approach allows us to analyze the determinants and effects of the adoption
decision of organic farming on the use of agro-ecological practices, separately for adopters and non-
adopters among the sample of 386 pineapple farmers. In investigating the impact of agro-ecological
practice on ROI, we use the generalized propensity score approach developed by Hirano and Imbens
(2004) to control for selection bias.
As in many other developing countries, agricultural production in Ghana contributes to
environmental damage such as underground water depletion, soil erosion, water and soil pollution, loss
of biodiversity, deforestation, and global climate change. In particular, crops that are produced for
export are usually intensively treated with pesticides to assure the required quality and uniformity.
This is also the case for pineapple, the third most important agricultural export product of the country,
after cocoa and palm oil. On the environmental side, climate change is expected to have negative

5
effects on agricultural production, while population pressure will contribute to increased soil
degradation and consequently lower crop yields (Diao and Sarpong, 2007). The Ghanaian government
has attempted to address these problems through environmental protection (Government of Ghana,
2010) and has established an organic agriculture desk in the Ministry of Food and Agriculture
(MOFA).
Our findings show that organic certification increases agro-ecological practice use, suggesting
that certification already serves as a catalyst for the use of agro-ecological practices. We also find that
the use of agro-ecological practices generally has a positive and nonlinear effect on the return on
investment.
The remainder of the study is structured as follows: The next section gives an
overview of the pineapple sector in Ghana and the data used in the analysis. It is followed by
the presentation of the corresponding descriptive statistics. Subsequently, section 3 presents
the conceptual framework and empirical strategy employed in the analysis. The empirical
results are presented in section 4. The final section provides concluding remarks and
implications.
2 Background and Data
2.1 Background
The agricultural sector in Ghana accounts for about 30% of gross domestic product (GDP)
and employs over 50% of the Ghanaian working population (WDI, 2011). In recent years,
non-traditional exports of horticultural products experienced significant growth. Exports of
fresh fruits and vegetables, especially to Europe, are now the most important growth sector of
Ghana’s agriculture. The country began exporting pineapples in small quantities in the 1980s.
Ghanaian pineapple farmers produce the varieties MD2, Smooth Cayenne, Sugar Loaf and
Queen Victoria, where Sugar Loaf is mainly produced for the local market, or for processing,
while Queen Victoria plays a minor role as a high-priced specialty product. Pineapple exports
increased rapidly until 2004, after which it declined towards 2010, partly because of a change

6
in varieties demanded on world markets, to which the Ghanaian pineapple sector reacted
slowly. Many farmers gradually switched to the new world market variety (MD2), while some
produced organic pineapples for export. According to estimates from the Ghanaian export
promotion council (GEPC) and the Sea Freight Pineapple Exporters Association of Ghana
(SPEG) about 31,000 tons of the estimated 75000 tons produced in the country were exported
in 2009 (GEPC, 2010).
Actors in the Ghanaian Pineapple Sector
Pineapple farming in Ghana is largely located within a radius of 100 km north-west of the
capital Accra in the regions of Greater Accra, and the Central and Eastern Region. The
pineapple industry is driven by two dominant groups of producers that include few large or
medium-sized producers, and a large number of small-scale farmers. The small-scale farmers
mostly sell their fruits on the local market or to exporters. Among these smallholders, there
are two clusters, traditional low-input “organic-by-default” producers and another group of
farmers that strive to imitate large-scale high-input production. Smallholders prefer selling
their fruits on the export market because of higher prices, but due to high quality
requirements, fruits for export are also more expensive to produce (Suzuki et al., 2011).
Pineapple export in Ghana is predominantly organized by export companies that are also
engaged in pineapple production.
Organic Production
Certified organic products achieve price premia and access to new markets. According to
Kleemann (2011), organic certified pineapples from Africa receive a price premium on the
European market, which is normally passed on to the producers. About 0.19% of the
agricultural land in Ghana is organic certified, with a presumably higher part in pineapples1.
Organic certification refers to the standards in the EU regulations (EC) 834/2007 and (EC)
889/2008. It entails, among others, largely refraining from the use of synthetic inputs and the
use of only stipulated inputs for flower induction. These requirements lead to a higher labor

7
intensity of organic farming by way of more manual weeding, pest control and possibly own
production of fertilizers. The resulting use of on-farm/local inputs in organic farming can be
an advantage when markets are missing or do not function well. However, a major
disadvantage of organic farming is potentially lower yields, in particular, when synthetic
inputs are not replaced by organic inputs and when knowledge about soil nutrient and plant
pest and disease management is not sufficient. Moreover, since organic production involves a
long-term investment in soil fertility and sustainability, time lags between investment and
returns may prove to be an entry barrier for small resource- constrained farmers in insecure
environments. The Ministry of Food and Agriculture (MOFA), Agro Eco/Louis Bolk, West
African Fair Fruit (WAFF) and the German International Cooperation are involved in the
promotion of organic farming.
2.2 Data
The data used in the study come from a farm household survey that was conducted from
January to March 2010 in six different districts2 of the Central, Eastern and Greater Accra
regions in southern Ghana, where pineapple cultivation is mostly located. Stratified random
sampling in three stages was used. First, districts with significant amounts of smallholder
pineapple production for export were selected, using information from development agencies
and the Pineapple Exporters Association of Ghana. Next, lists of all pineapple farmer groups
in the selected districts that are certified (organic or GlobalGAP if conventional) and
producing for the export market certified were obtained. Finally, in each group, a percentage
of farmers proportional to the total number of farmers in the group were selected randomly
from the lists. The farmer answered a detailed questionnaire on the household’s management
of the pineapple farm, inputs into pineapple production, harvesting and marketing, the
certification process, and relations with exporters. Besides, information on household
characteristics, social capital and land disposition were requested, as well as data concerning
8
non-income wealth indicators and perceptions of different statements about environmental
values, organic farming techniques and the use of fertilizers and pesticides.
The dataset includes 386 households from 75 villages and 9 (organic) and 14
(conventional) different farmer associations. In total, 185 organic farmers and 201
conventional farmers were interviewed. All organic farmers sold part of their produce as
organic certified to exporters or processors and part of it on the local market, without
reference to the certification. Respectively, all conventional farmers sold their produce
preferably to exporters or exporting processors, but also on the local market. In theory, there
could be one-directional overlaps. This means that organic certified farmers could sell as
organic certified (which has the highest price) as first preference, as conventional export
produce as second preference and on the local market as last option. However, this is not the
case in our sample. The opposite, i.e. conventional farmers trying to sell on the organic export
market is not possible.
Descriptive Statistics of Sociodemographic Variables
The typical household in our sample has a similar income compared to the average in Ghana
(country average 88.83 GHS per month, survey average: highest density in income groups 51-
150 GHS per month), and a higher income share from agriculture (47.8% versus 67%; data
from Ghana Living Standards Survey 5). All sociodemographic variables that are included in
the estimations are presented in Table 1.
Organic farm household heads are older and less educated than conventional farm
households. They have smaller farms, but are more specialized in pineapple farming. On
average 39% of the organic farms, including the homesteads and 16% of the conventional
farms are occupied with pineapple. They also seem to have fewer assets. However, the
average organic household head received credit more often during the last five years, and
stated a higher willingness to take risks in order to achieve success, as well as a greater
openness to innovation.

9
Even though organic farming is supposedly more management intensive, organic
farmers did not receive more training for improving farming techniques. The most likely
reason is the lack of opportunities resulting from niche position of organic agriculture. Even
with more labor needed for production, organic farmers more often recruit their workers from
the family than hiring farm workers, which is reflected in the lower proportion of the
production cost they spend on hired labor. Concerning location specific variables, organic
farmers own a larger share of their land and grow pineapple on different soil types compared
to conventional farmers. There is also a difference concerning the variety of pineapples
planted: Organic farmers prefer Sugar Loaf, whereas conventional farmers favor Smooth
Cayenne or MD2. To our knowledge this difference is caused by the buyers’ preferences.
Of relevance to the adoption mechanism is the fact that organic farmers seem to have a
stronger link to the local government and visit the capital more frequently. They are also more
likely to have learned pineapple farming from friends or family members compared to in
training courses or as laborers on large farms. Moreover, their certification process is more
often organized by the farmer organization, compared to conventional farmers. The majority
of farmers of both groups have been certified within the last two years and about 40 % have a
written contract with an exporter, all others have an oral contract. The number of years that
the farmers have been certified is slightly longer for organic farmers.
Descriptive Statistics of Economic Variables
Differences in economic characteristics of the farmers are presented in Table 2. Columns (2)
and (3) of Table 2 show the average costs for each category per kilogram of pineapples.
Kilogram is taken as a base factor instead of pieces to control for the fact that organic fruits
are on average smaller than conventional fruits, they are on average 0.18 kg lighter than
conventional fruit.
As expected, there are large differences in labor, equipment and input costs per Kg
between organic and conventional pineapple production, and costs for land are similar for

10
both groups. While organic farmers spent much more on labor - hired workers as well as
household labor - conventional pineapple producers use more inputs and equipment3. We also
observed that (not presented in the Table), organic farmers do not use any chemicals, and
utilize very little organic fertilizers, spent a lot of time with manual removal of weeds and
more often produce their own planting and mulching material, or exchange it with other
farmers. Expenses for inputs like inorganic fertilizers, herbicides, fungicides and pesticides, as
well as suckers (seedlings), are hence much higher for conventional farmers. In addition, they
use chemicals to induce flowering more frequently (90% of conventional but only 30% of
organic farmers) and spend more on plastic foil and safety equipment for their farm.
Certification costs are higher for conventional farmers, but in total they are small,
because this Table shows only the part that the farmers themselves cover. A large part is often
paid for by the exporter or a donor or NGO. Overall, these cost differences form the
individual investment that each farmer makes in his production structure. For instance, for
organic certification as such the farmer has to invest in certification, and potential changes in
production.
Note that the production cycle on organic farms is on average longer than the
production cycle on conventional farms, namely 18.72 month instead of 15.46 month. The
different lengths of the production cycles do not affect the informative value of the returns on
investment (ROI). However, it obviously affects other key figures such as yearly income from
pineapple farming. The average ROI of certified organic farming is higher than of
conventional farming, due to higher prices and lower production costs.
It is evident from Table 2 that conventional farmers sold 1.5 times as many pineapples
as organic farmers. This is mainly because of the larger areas under conventional farming, as
well as the higher yields obtained from this farming method.
As expected, export prices were in general higher than local prices for both groups.
But organic pineapple achieved a price premium on both local and export markets, even

11
though they were not marketed as certified locally. This suggests different marketing
strategies by organic farmers, which seem to better match local preferences, a presumption for
which we however do not have further information for verification. One hint is that the Sugar
Loaf variety yielded the highest prices on the local (and export) market and was produced
more frequently by organic than by conventional farmers.
Descriptive Statistics of Intensity of Agro-ecological Practice Use
To examine the impact of organic agricultural practices on the ROI we employ the framework
proposed by Rigby et al (2001) to construct a variable that consists of the different organic
cropping practices most relevant for pineapple production. The framework is based on a
scoring system that range from 0 (technique not used) to 5 (highest frequency or intensity this
technique was used, taking into account the type of material used). The practices considered
include organic fertilizer, non-chemical weeding, mulching, manure, trash lines, infiltration
ditches and crop rotation. The information on relevant practices was given by an agronomist
and included in the questionnaire. Weeding seems to be an out of range at first sight; however
it is very important in pineapple production. Since pineapple grow relatively small, apart from
using herbicides or not, the weeding technique is relevant for soil water management and
erosion control. Variables for organic pesticide use, cover crops, and leguminous residues use
are zero when not used, and one when used4. All the variables were weighted according to the
average importance of each practice for sustainability given by 13 Ghanaian agronomists. The
variable used in the analysis (AGRECPRAC) was then constructed by adding up.
Table 3 shows the descriptive statistics for each method. Robustness checks were
made by a) repeating the analysis without any weights and b) using an alternative weighting
scheme which consisted in giving similar practice groups (fertilizers and fertilizing material,
soil cover, and weeding and pesticides) the same overall weights, and c) by excluding
weeding, since we cannot distinguish between weeding by hand (which is not strictly a

12
sustainable practice) and weed prevention using e.g. beneficial organisms. For a), b) and c) all
regressions were replicated.
Figure 1 presents kernel density estimates of the intensity of agro-ecological practices
by the two categories of farmers. The estimates reveal that although conventional farmers
also use sustainable farming methods, their intensity of use is generally less than that of their
counterparts practicing organic farming. Moreover, it is clear from the results that there are
hardly any organic farmers that do not employ these farming practices, whereas some
conventional farmers never employed agro-ecological practices.
3 Conceptual Framework
The conceptual framework employed here is based on the assumption that farmers choose
between adopting organic farming and practicing conventional farming. For analytical
purposes, we assume here that farmers are risk neutral, and take into account the potential
benefit derived from adopting organic farming or non-adoption in the decision making
process. Farmers are therefore assumed to choose the technology that provides maximum
benefits. Under these assumptions, let us represent the net benefits farmer i derives from
adopting the technology as and the net benefits from non-adoption represented as .
These two regimes can be can be specified as
(1)
(2)
Where is a vector of variable factor prices, fixed factors, as well as farm and household
characteristics; and are vectors of parameters; and are iids. The farmer will
normally choose the organic technology if the net benefits obtained by doing so are higher
than that obtained by not choosing the technology, that is .
The individual preferences of the farmers are normally unknown to the analysts, but
the characteristics of the farmer and the attributes of the technology under consideration are

13
observed during the survey period. Given the available information, net benefits can be
represented by a latent variable ∗, which is not observed, but can be expressed as a function
of the observed characteristics and attributes, denoted as Z, in a latent variable model as
follows:
∗ , 1 ∗ 0 (3)
where is a binary indicator variable that equals 1 for household i, in case of adoption of the
technology and 0 otherwise, is a vector of parameters to be estimated, is a vector of
household and plot-level characteristics as defined earlier, and is an error term assumed to
be normally distributed. The probability of adoption can then be expressed as
Pr 1 Pr ∗ 0 Pr 1
(4)
where F is the cumulative distribution function for .
Impact of organic farming on agro-ecological practices
As indicated earlier, the intensity of use of agro-ecological practices vary between organic
farm practices and conventional farm practices. To capture the effects of the different farm
practices on the use of agro-ecological farm methods, we employ a specification from the
impact assessment literature on outcomes to participation choice. Specifically, we hypothesize
that adoption or non-adoption of organic technology, positively influences the use of agro-
ecological farm practices. This may be expressed as
(5)
where represents the intensity of agro-ecological practices and is the adoption dummy;
is a vector of farm-level and household-level characteristics, such as age and education of
farmer, access to credit, social network variables, farm size, and soil quality variables. The
coefficient in the specification captures the impact of adoption on the use of agro-ecological
practices. The issue of self-selection is crucial here because the decision of households to
adopt or not to adopt organic farming may be associated with the net benefits of adoption.

14
Selection bias arises if unobservable factors influence both the error term of the technology
choice, , in equation (13) and the error term of the outcome specification (εi), in equation
(5), resulting in correlation of both error terms. When the correlation between the two error
terms is greater than zero, OLS regression techniques tend to yield biased estimates. To
address these issues, we employ an endogenous switching regression model (ESR) to jointly
examine the determinants of adoption and the impact of adoption on the intensity of agro-
ecological practice use5.
The parametric approach of the endogenous switching regression (ESR) model goes
back to Lee (1978) and Maddala (1983), and accounts for self-selection and systematic
differences across groups. Outcome equations are specified differently for each regime,
conditional on the adoption decision, which is estimated by a probit model. Thus, if we define
and as the intensity of agro-ecological practices for organic and non-organic farmers,
we can specify the outcome equations as:
if 1 (6)
if 0 (7)
Although self-selection based on observables is taken into account in the above
specification, unobservable factors could still create a correlation between and , .The
endogenous switching regression model treats the sample selectivity problem as a missing
variable problem, which can be estimated and plugged into the equations (6) and (7). Thus,
after estimating a probit model in the first stage, the Mills ratios and and the covariances
and can be computed and employed in the following
second stage specification:
if 1 (8)
if 0 (9)

15
In these equations, the error terms and have conditional zero means.
Following Lokshin and Sajaia (2004) we use the full information maximum likelihood
method (FIML) to estimate this model, i.e. the selection equation and the outcome equations
are estimated simultaneously.
When the correlation coefficients of and ( / ) and of and
/ ) are significant, the model has an endogenous switch, i.e. selection on
unobservables is substantial. The coefficients obtained from the endogenous switching
regression model can be employed to derive the average treatment effect (ATT) as:
| 1 | 1 (10)
4. Empirical Results
4.1. Empirical Results for Adoption
The full information maximum likelihood estimates of the determinants of adoption of
organic farming, as well as the impact of adoption on the intensity of use of agro-ecological
practices are presented in Table 4. As mentioned earlier, identification of the model requires
that there is at least one variable in the selection equation that does not appear in the outcome
equation. The variable representing relation to the local government is used as identifying
instrument, and as such dropped from the outcome equations. Quite interesting is the
insignificance of the correlation coefficients presented in the Table. This finding indicates the
absence of any endogenous switch, suggesting that there is no substantial selection on
unobservables.
The selection equation, which can be interpreted as probit estimates of determinants of
adoption generally indicate that farm-level and household characteristics do influence
adoption decisions of farmers. The estimates of the impact of adoption on the intensity of use
of agro-ecological practices show that the farm-level and household characteristics influence
the behavior of adopters and non-adopters differently. In particular, education and wealth

16
appear to have positive and significant effects on organic farmers using more agro-ecological
practices, while no significant effect is observed for conventional farmers. Land ownership
also appears to influence the intensity of use by organic farmers, but not by conventional
farmers. Similarly, the number of years being certified positively and significantly influences
the intensity of agro-ecological practices by organic farmers, but exerts a negative, albeit
insignificant effect on conventional farmers.
The estimates for the average treatments effect (ATT), which shows the impact of
organic certification on the use of agro-ecological practice was computed with equation (10).
The results are presented in the first row in Table 5. Unlike the mean differences in the use of
agro-ecological practices shown in Table 3, the ATT estimate accounts for selection bias
arising from the fact that adopters and non-adopters may be systematically different. The
estimated ATT is positive and highly significant, suggesting that organic certification does
indeed act as a catalyst for the increased use of agro-ecological practices. Specifically, organic
certification moves the farmer up 15-20% on the full range of possible intensities, or by about
80% taking the overall mean use as a reference point. It is interesting to note that when asked
directly for changes in production methods after certification, 67% of organic and only 35%
of conventional households claimed to have changed their use of agro-ecological practices.
The robustness of the ESR is checked by estimating the same model, but using the three other
specifications described in section 3.2. The estimates, which are also reported in the Table 5,
also confirm the positive and highly significant impact of organic certification on the intensity
of agro-ecological practices.
Given the absence of any endogenous switch, we also employed propensity score
matching (PSM) approach to compute the ATT and compare with those from the ESR. PSM
is basically a technique that mimicks an experiment ex post. The results, which are presented
in the lower part of Table 5, show that the ATT ranges between 4.07 and 4.23, depending on
the matching algorithm used. Overall, the results confirm the positive and significant impact
17
of organic certification on the intensity of agro-ecological practices. The matching quality test
conducted with the Rosenbaum and Rubin (1985) test shows that differences in the means of
the covariates between the two groups vanish after matching. The sensitivity of the estimates
to unobservables was also tested with the Rosenbaum (2002) bounds. Based on kernel
matching, the critical value of Γ(Γ*) =1.35 indicates that the ATT would still be significant
even if matched pairs differ in their odds of certification by the factor 1.35.
4.2. Impact of Intensity of Agro-ecological Practice Use on ROI
In this section, we examine the impact of agro-ecological practices on the return on
investment (ROI), in order to ascertain whether using these practices tend to affect the
economic viability of the farm. Given that the intensity of agro-ecological practices is a
continuous variable, we employ the generalized propensity score (GPS) approach developed
by Hirano and Imbens (2004). Thus, the analysis in this section considers the treatment
variable as a continuous variable, and not a dichotomous decision variable as was assumed in
the previous analyses.
In line with GPS approach, equation (5) can be re-specified as , where
refers to the return on investment and is the actual level of agro-ecological practice of the
farm. Of significance is the average dose response function (DRF), which relates to each
possible treatment level , the unbiased potential outcome of the farmer i:
∀ (11)
where represents the DRF. In line with Hirano and Imbens (2004), we presume that the
assignment to the treatment is weakly unconfounded given the controls, i.e.
⎸ ∀ (12)
Thus, the treatment assignment process is supposed to be conditionally independent of
each potential outcome, given the control variables. Hence, there is no systematic selection
into specific levels of agro-ecological practice intensity caused by unobservable

18
characteristics (Flores et al., 2009). Weak unconfoundedness implies that this independence
only has to hold for each level of treatment t but not jointly for all potential outcomes. The
generalized propensity score (GPS) suggested by Hirano and Imbens (2004) is defined as the
conditional probability of a particular treatment given the observed covariates. When
, is the conditional density of potential treatment levels given specific
covariates, then the GPS of a household i is given as , . The GPS is a balancing
score, i.e. within strata with the same value of , the probability that T = t does not
depend on the covariates . Given this balancing property and weak unconfoundedness,
Hirano and Imbens (2004) show that using the GPS to remove the selection bias allows the
estimation of the average DRF of equation (11).
In the first step the conditional expectation of the outcome as a function of treatment T
and GPS R is estimated as
, | , (13)
Then, the DRF at each level of treatment can be estimated by averaging the conditional
expectation over the GPS at that treatment level:
, , (14)
In our application, the GPS is estimated using a normal distribution of the logarithmic
treatment given covariates . The validity of the assumed normal distribution is assessed
using the Kolomogorov-Smirnov test for normality. We followed Hirano and Imbens (2004)
and took the logarithm of the treatment variable, because the distribution of the agro-
ecological practices was skewed. This procedure yielded low skewness (0.090) and kurtosis
(1.698) values and a positive Kolmogorov-Smirnov test for normality at the 5% level of
significance. The balancing property of the estimated GPS is tested by employing the method
proposed by Hirano and Imbens (2004). The common support condition, i.e. that households
in one group have to match with comparable households in other treatment groups, is imposed
by employing the method suggested by Flores et al. (2009). After estimating the GPS, the

19
DRF is estimated using a flexible polynomial function as in Bia and Mattei (2008). The
average potential outcome at each treatment level is estimated using a quadratic
approximation of the treatment variable and a linear one for the GPS. The specification is
estimated using OLS regression for the ROI. Confidence bounds at 95% level are estimated
using the bootstrapping procedure.
Results of Generalized Propensity Score Matching
The treatment variable is AGRECPRAC as indicated previously. The results of the maximum
likelihood estimation of the GPS, which are presented in Table A.1 in the appendix, are not
discussed here, since the estimates only serve to balance the observed distribution of
covariates across the treated and untreated groups (Hirano and Imbens, 2004). It is however
interesting to note that as in the regressions in the previous section, the organic certification
dummy is again highly significant in the probit regression. Balancing tests indicate that the
GPS has quite well balancing properties, i.e. the GPS eliminates bias in the estimates of the
dose-response function6. Regarding the common support condition, 278 farmers were on
support, which represents 87% of the initial 311 farmers for which we have sufficient data to
calculate the ROI.
Figure 2 shows the dose response function of the impact of the use of agro-ecological
practices on the return on investment in pineapple farming7. There is a non-linear hook shaped
relationship, whereby the effect on the ROI is positive, but in different ways at different
levels. The impact if high at very low levels of agro-ecological practice use, but declines at
higher levels of use, before rising again, with increasing intensity. It is significant to note that
in our analysis, a low level of the index implies very little use of agro-ecological practices and
even a high level is still low compared to developed country agriculture. At the lowest point,
the estimated ROI is just below the mean of the sample (2.265). While the impact of using
agro-ecological practices is overall positive, relatively low and relatively high levels appear to
perform better in terms of rate of return than a medium level of agro- ecological practice

20
intensity. This implies that the motivation to increase the use may be low when farmers are
unaware of the shape of this impact curve or have a high discount rate into the future. A look
at the kernel density estimates in Figure 1 shows that most farmers are exactly in this impact
dip.
To gain further insights into the differential behavior of the farmers, we also examined
the composition of agro-ecological practices used at different intensities. Specifically, we
divided the sample into several equally sized groups, according to the AGRECPRAC variable,
involving those below and above the low impact dip. It was observed that at low levels of
intensity, the average farmer restricts the use very few practices and first starts to use them
more intensively, before adding different practices. Noteworthy is the fact that it is not the
potentially costly organic fertilizers and pesticides that are used significantly less in the low-
use groups, but rather manure, animal mulch, and cover crops. Since the farmers stated that
they know what each practice is, the problem cannot be attributed to lack of information or
knowledge, but rather economies of scale in transport cost.8
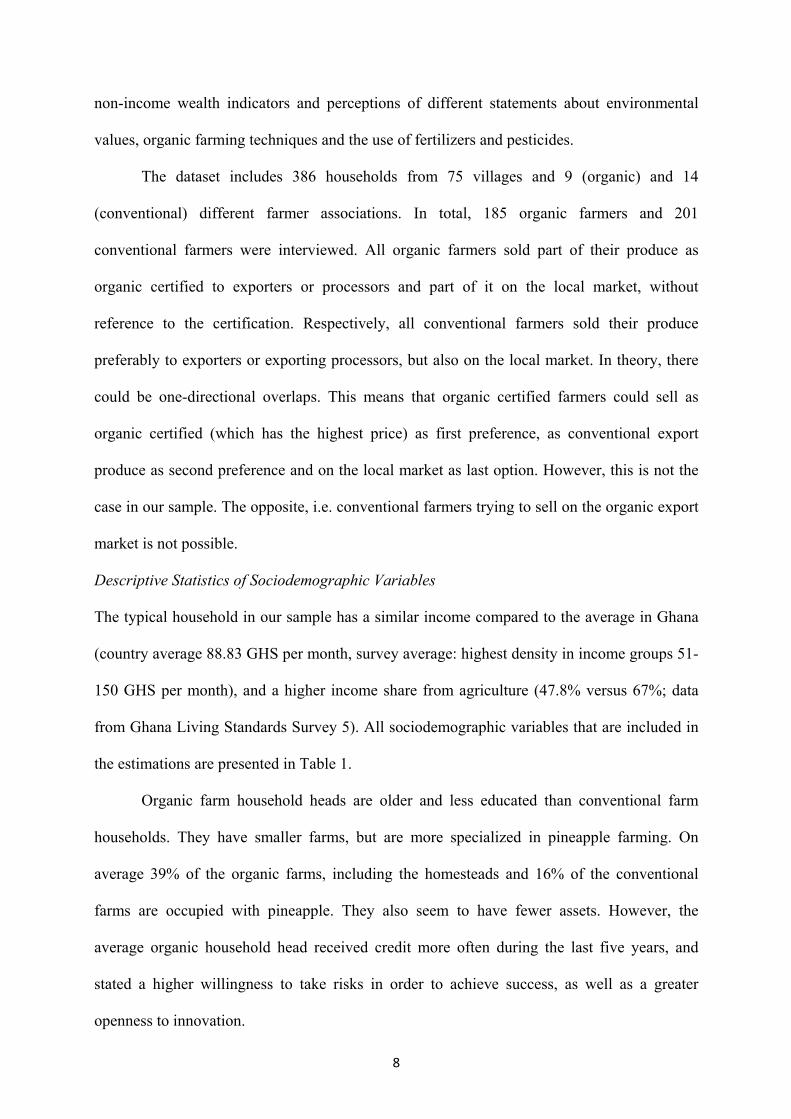
Robustness Checks
The large confidence bands at the ends of the distribution in Figure 2 suggest that the impacts
are less clear among the non-users and the very intensive users. We therefore conducted a
robustness check in which we excluded values of AGRECPRAC of over 13. The result
obtained is shown in Figure A.1 in the appendix. It is slightly different at high values, with no
flattening out, with the predicted impact higher at the right end. However, the shape of the
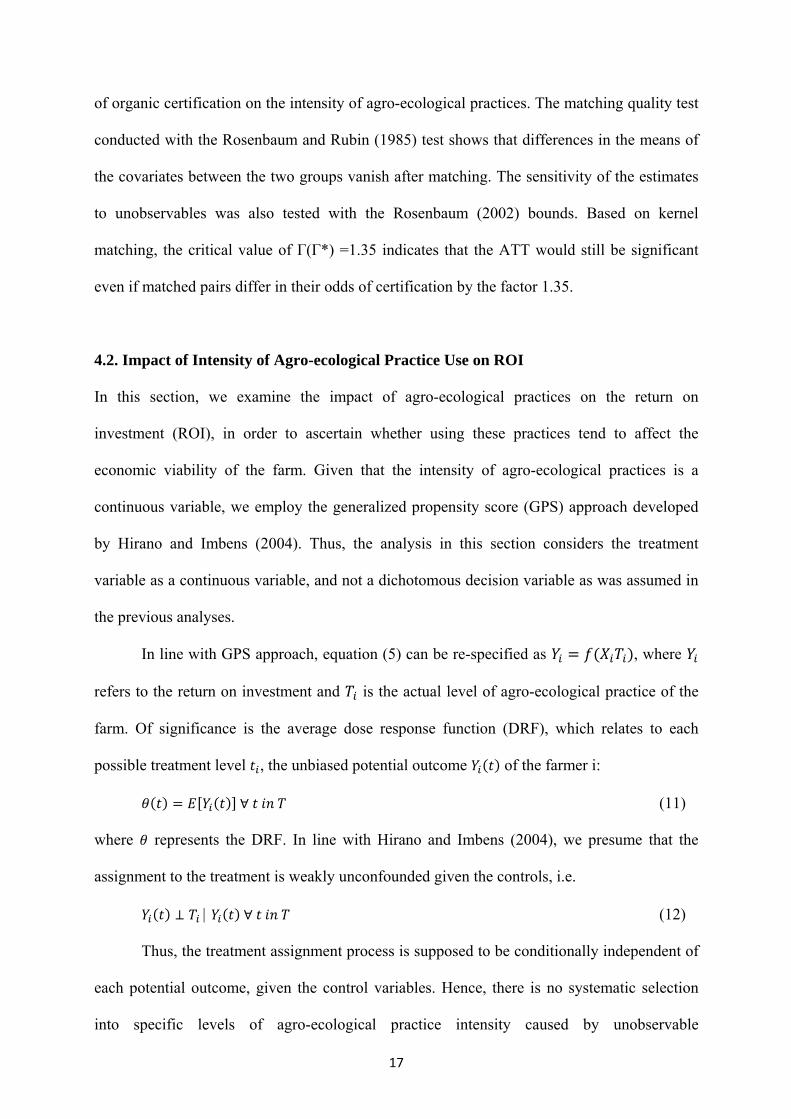
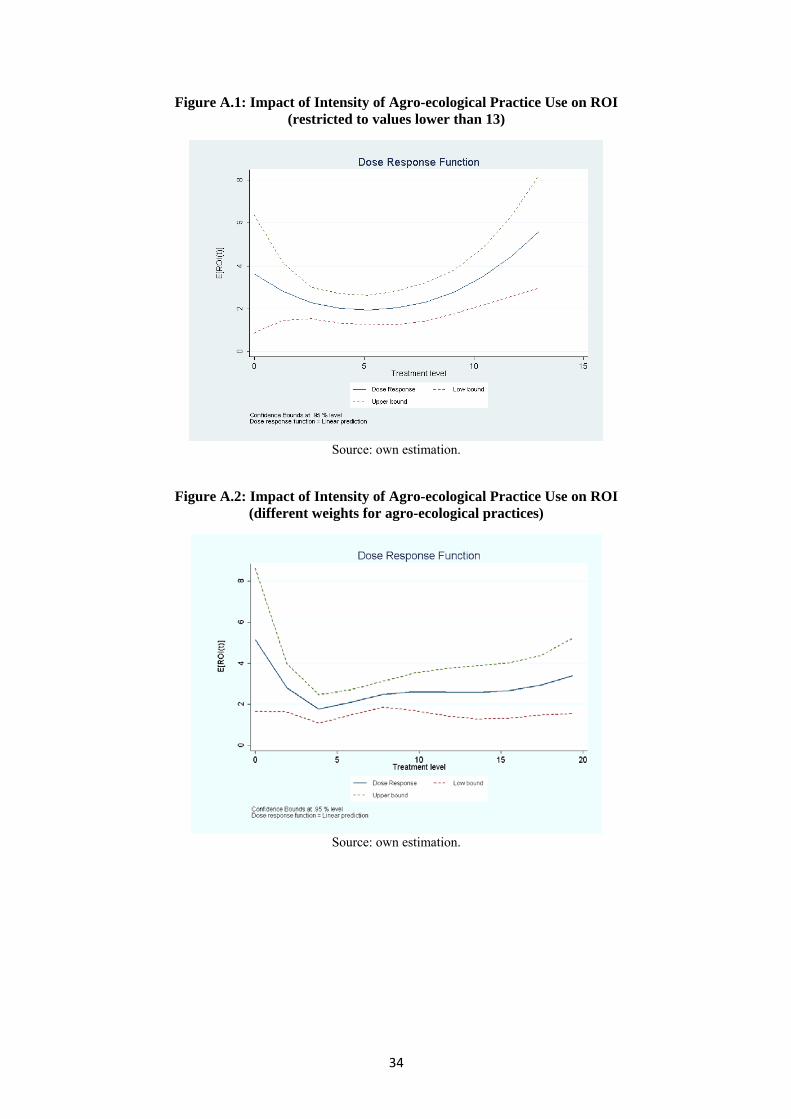
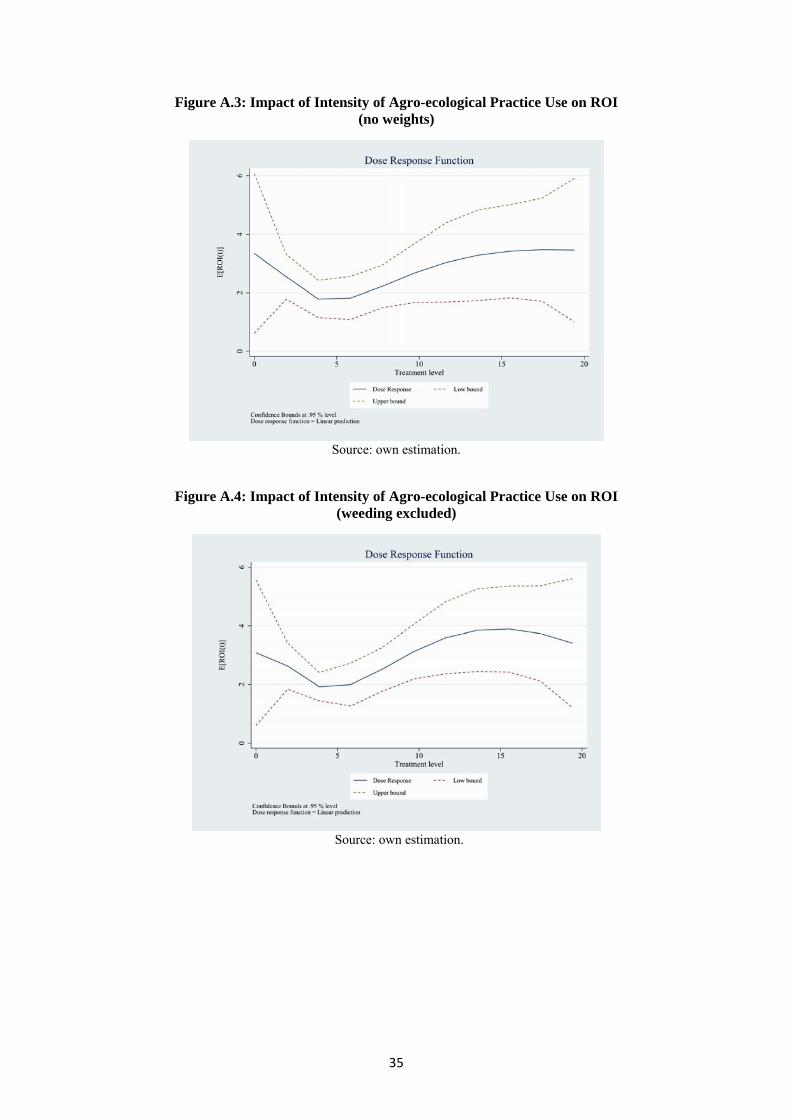
curve, which is of primary interest, remains the same. As a further robustness check, we use
different specifications of the agro-ecological practice index. The results, which are are
presented in Figures A.2 (different weights described in section 3.2), A.3 (no weights), and
A.4 (weeding excluded) in the appendix appear to be similar to the findings presented in
Figure 2.

21
5 Concluding Remarks
Some concerns have been raised that organic certification and sustainable farming practices
are insufficiently linked on farms in developing countries. Most farmers certified as organic
producers have therefore been considered to be producing organic-by-default, with very little
or no use of productivity-enhancing inputs and soil-improving measures, often resulting in
low yields and unsustainable production.
In this paper we examine the impact of organic certification on the intensity of agro-
ecological practice use, as well as the return on investment of such practices, using recent
farm-level data from the Greater Accra and Central regions in Ghana. Our empirical results
show that organic certification increases agro-ecological practice use, suggesting that
certification already serves as a catalyst for the use of agro-ecological practices.
The estimates of the economic impacts of agro-ecological practices generally reveal a
positive and nonlinear relationship between the rate of return and the intensity of agro-
ecological practice use, indicating that more intensive use of agro-ecological practices is
economically beneficial for farmers. This finding suggests that from an environmental policy
perspective this link needs to be strengthened considerably, since the intensity of agro-
ecological practice use is overall quite low. The low level of use is probably because of the
nonlinear relationship, which suggests economic benefits at low levels and high levels.
However, farmers need to surmount a low impact gap to attain high levels, including
availability of organic material and high transport costs for organic material. Given that
external inputs from cocoa production and juice factories are normally available for use, but at
prohibitive transport costs for individual farmers, government agencies or certification
agencies could organize intermediates to fill this gap by purchasing these organic materials
from juice factories and cocoa producers and selling to farmers. Certification may therefore
help ease the problem through high prices on the produce and the support by buyers.

22
Moreover, certification systems could also require the active use of organic soil fertility
management methods to increase their intensity of use.
Overall, such a strategy could provide an alternative sustainable development strategy
for parts of the rural population. If successfully managed, organic certification for the
dominantly small farmers in Africa may provide two types of economic benefits. It may
reduce rural poverty by providing market access and higher profits through a combination of
high prices and better or more resilient yields, and it may provide environmental benefits for
the local economy in the long term.

23
References
Abadie, A. and G.W. Imbens (2008). On the failure of the bootstrap for matching estimators.
Econometrica, 76 (6), pp. 1537-1557.
Barham, B.L. and J.G. Weber (2012). The Economic Sustainability of Certified Coffee:
Recent Evidence from Mexico and Peru. World Development, 40 (6), pp. 1269-1279.
Beuchelt, T. and M. Zeller (2011). Profits and poverty: Certification’s troubled link for
Nicaragua’s organic and fairtrade coffee producers. Ecological Economics, 70 (7), pp. 1316-
1324.
Bia, M. and A. Mattei (2008). A Stata package for the estimation of the dose response
function through adjustment for the generalized propensity score. The Stata Journal, 8 (3), pp.
354-373.
Blackman, A. and M.A. Naranjo (2010). Does Eco-Certification Have Environmental
Benefits? Organic Coffee in Costa Rica. Resources for the Future Discussion Paper,
November 2010.
Bolwig, S., P. Gibbon, and S. Jones (2009). The Economics of Smallholder Organic Contract
Farming in Tropical Africa. World Development, 37 (6), pp. 1094-1104.
Branca, G., N. McCarthy, L. Lipper, and M.C. Jolejole (2011). Climate Smart Agriculture: A
Synthesis of Empirical Evidence of Food Security and Mitigation Benefits from Improved
Cropland Management. FAO Working paper.
Caliendo, M. and S. Kopeinig (2008). Some Practical Guidance For The Implementation Of
Propensity Score Matching. Journal of Economic Surveys, 22 (1), pp. 31-72.
Calo, M. and T.A. Wise (2005). Revaluing Peasant Coffee Production: Organic and Fair Trade
Markets in Mexico. Global Development and Environment Institute Tufts University.

24
Diao, X. and D.B. Sarpong (2007). Cost Implications of Agricultural Land Degradation in
Ghana. IFPRI Discussion Paper 00698.
Erenstein, O. (2002). Crop residue mulching in tropical and semi-tropical countries: An
evaluation of residue availability and other technological implications. Soil and Tillage
Research, 6 (2), pp. 115-33.
Flores, C.A., A. Flores-Lagunes, A. Gonzalez, and T.C. Neumann (2009). Estimating the
Effects of Length of Exposure to Training Program: The Case of Job Corps. Working Papers
2010-3, University of Miami, Department of Economics.
Food and Agricultural Organization of the United Nations (FAO) (2011). Socio-economic
analysis of conservation agriculture in southern Africa. Network Paper 2, FAO Rome.
Food and Agricultural Organization of the United Nations Statistics (FAOSTAT) (2011).
Economic Growth Center Discussion Paper 984.
Ghana Export Promotion Council (GEPC) (2010). Ghana Pineapple Export Declines.
Available at: http://www.gepcghana.com/news.php?news=196&pnm=Ghana Pineapple
Export Declines, 11/29/2011.
Government of Ghana (2010). Medium-term national development policy framework: Ghana
shared growth and development agenda, 2010-2013. Volume 1, Policy Framework.
Hirano, K. and G.W. Imbens (2004). The Propensity Score with Continuous Treatments. In:
A. Gelman and X.-L. Meng (Eds.): Applied Bayesian Modeling and Causal Inference from
Incomplete-Data Perspectives. West Sussex, England: Wiley InterScience.
International Trade Center (ITC) (2011). The Impacts of Private Standards on Producers in
Developing Countries. Literature Review Series on the Impacts of Private Standards, Part II,
Geneva.

25
Kassam, A., T.Friedrich, R. Derpsch, R. Lahmar, R. Mrabet, G. Basch, E. Gonzalez-Sanchez,
and R. Serraj (2012). Conservation agriculture in the dry Mediterranean climate. Field Crops
Research, 132, pp. 7-17.
Kersting, Sarah and Meike Wollni (2012). New institutional arrangements and standard
adoption: Evidence from small-scale fruit and vegetable farmers in Thailand. Food Policy, 37,
pp. 452–462.
Kleemann, L. (2011). Organic Pineapple Farming in Ghana - A Good Choice for
Smallholders? Kiel Working Paper 1671, Kiel Institute for the World Economy, Germany.
Knowler, D. and B. Bradshaw (2007). Farmers’ adoption of conservation agriculture: A
review and synthesis of recent research. Food Policy, 32 (1), pp. 25-48.
Lee, L.-F. (1978). Unionism and Wage Rates: A Simultaneous Equations Model with
Qualitative and Limited Dependent Variables. International Economic Review, 19 (2), pp.415-
433.
Lokshin, M. and Z. Sajaia (2004). Maximum likelihood estimation of endogenous switching
regression models. The Stata Journal, 4 (3), pp. 282-289.
Maddala, G.S. (1983). Limited-dependent and qualitative variables in econometrics.
Cambridge University Press, Cambridge.
Ninan, K.N. and J. Sathyapalan (2005). The economics of biodiversity conservation: a study of a
coffee growing region in the Western Ghats of India. Ecological Economics, 55 (1), pp. 61-72.
Philpott, S.M., P. Bichier, R. Rice, and R. Greenberg (2007). Field-Testing Ecological and Economic
Benefits of Coffee Certification Programs. Conservation Biology, 21 (4), pp. 975–985.
Pretty, J.N., A.D. Noble, D. Bossio, J. Dixon, R.E. Hine, F.W.T. Penning de Vries, and J.I.L.Morison
(2006). Resource-Conserving Agriculture Increases Yields in Developing Countries. Environmental
Science and Technology, 40 (4), pp. 1114–1119.

26
Rigby, D., P. Woodhouse, T. Young, and M. Burton. (2001). Constructing a farm level indicator of
sustainable agricultural practice. Ecological Economics, 39, pp. 463–478.
Rosenbaum, P.R. and D.B. Rubin (1985). Constructing a Control Group Using Multivariate Matched
Sampling Methods That Incorporate the Propensity Score. The American Statistician, 39 (1), pp. 33-
38.
Rosenbaum, P.R. (2002). Observational Studies. Springer, New York.
Suzuki, A., L.S. Jarvis, and R.J. Sexton (2011). Partial Vertical Integration, Risk Shifting, and Product
Rejection in the High-value Export Supply Chain: The Ghana Pineapple Sector. World Development,
39 (9), pp. 1611-1623.
Valkila, J. (2009). Fair Trade organic coffee production in Nicaragua - Sustainable development or a
poverty trap? Ecological Economics, 68, pp. 3018-3025.
Wollni, M., D.R. Lee, and J.E. Thies (2010). Conservation agriculture, organic marketing, and
collective action in the Honduran hillsides. Agricultural Economics, 41 (3-4), pp. 373–384.
World Development Indicators (WDI) (2011). The World Bank.

27
Figures and Tables
Figure 1: Intensity of Agro-ecological Practice Use and Certification
Source: own estimation.
Figure 2: Impact of Intensity of Agro-ecological Practice Use on ROI
Source: own estimation.

28
Table 1: Descriptive Statistics of Variables Included in the Estimations
Definition Variable Organic Farmers (N=185)
Convent. Farmers (N=201)
t-Stat.
Gender of household head (HHH) =female, 1=male
GENDER 0.891 0. 982 -3.51***
Age of HHH AGE 46.313 42.970 2.82*** Household size (persons living in household) HHSIZE 5.23 5.917 -2.35** Fraction of adults in household
(older than 15) (%) ADULT 0.684 0.665 0.75
Being native in community 0=no, 1=yes
NATIVE 0.738 0.738 -0.01
Maximal educational level in household 1=none, 2=primary school, 3=junior secondary, 4=senior secondary, 5=technical/vocational training, 6=tertiary/university
EDUC 9.470 10.195 -3.19***
Farm size (acre) FSIZE 10.35 18.720 -5.02*** Share of land owned OWNLAND 0.549 0.204 7.628*** Pineapple land (acre) PINLAND 4.014 3.066 2.07** Access to credit during the last 5 years
0=no, 1=yes CREDIT 0.317 0.232 1.78*
Bank account with more than 200 GHS 0=no, 1=yes
BANK 0.339 0.512 -3.21***
Number of durable goods owned WEALTH 4.765 8.481 -10.875*** Relation to the local government
1=none, 2=HHH knows someone in the local government, 3=HHH has friends in the local government, 4=strong relation/politically active
GOVERN 2.257 1.774 4.27***
Self-stated openness to innovation and risk (factor analysis: the stronger the agreement, the higher the factor)
RISK 0.152 -0.166 3.01***
Years of experience in pineapple farming EXPER 11.557 11.595 -0.05How pineapple farming was learned from family members and friends
0=no, 1=yes LEARN 1 0.863 0.501 7.97***
as a laborer on a farm or from 0=no, 1=yes
LEARN 2 0.071 0.286 -5.51***
Importance of preserving the environment 1= very important, ..., 4= not important
ENV 1.775 1.281 6.91***
Number of years being certified CERTIFYEARS 3.165 2.032 3.875*** Distance to the closest local market (hours) DIST 0.698 0.804 -1.59Soil characteristics
1=red or black sandy, 2=white sandy, 3=white rocky, 4=rocky red or black, 5=sandy or rocky clay, 6=clay, 7=other
SOIL 2.781 2.304 2.13**
Smooth Cayenne SC 0.098 0.351 -5.99*** Sugar Loaf SL 0.634 0.036 15.06*** Share of production cost for (of total labor costs) hired
workers HIRED 0.484 0.607 -3.13***
Assistance or training for farming received during last 5 years 0=no, 1=yes
ASSIST 0.732 0.708 0.50
Number of farm inspection during the last 5 years INSPECT 1.913 2.619 -0.94Written contract with exporter
0=no, 1=yes CONTR 0.410 0.417 -0.13
Organizer of the certification process 0=else than farmer organization, 1=farmer organization
ORGA 0.508 0.143 7.84***
Significance levels: *: 10% **: 5% ***: 1%. We use a conversion factor of 1 GHS = 0.46 Euros (calculated on the basis of the exchange rate on January 12, 2012).

29
Table 2: Descriptive Statistics of Economic Variables
Variable Organic Farmers
Conventional Farmers
t-Stat.
Agricultural equipment 0.002 0.009 -2.77 ***
Agricultural inputs 0.011 0.077 -5.97 ***
Renewal of certification 0.000 0.006 -4.27 ***
Land used for pineapple 0.004 0.004 -0.004
Hired workers 0.037 0.019 3.77 ***
Household labor 0.034 0.009 5.68 ***
Yield (pineapple per acre) 15780 18259 -4.11 ***
Quantity sold (in Kg) 23486 36235 -2.81 ***
Average local price (GHS per Kg) 0.210 0.131 8.50 ***
Average export price (GHS per Kg) 0.251 0.196 5.40 ***
Share sold on local market 0.495 0.354 3.00 ***
Revenue (GHS per Kg) 0.219 0.170 5.80 ***
Production costs (GHS per Kg) 0.105 0.118 -0.94
Profits (GHS per Kg) 0.114 0.052 4.01 ***
ROI 2.760 1.800 3.11 ***
We use a conversion factor of 1 Ghana Cedi (GHS)=0.46 Euros. The t-statistic belongs to the mean difference test between column (2) and (3). Significance levels: *:10% **:5% ***:1%

30
Table: 3 Descriptive Statistics of Agro-Ecological Practices
Variable Organic Farmers (N=176)
Conventional Farmers (N=168)
t-Statistics
Organic fertilizer 2.164 0.030 8.288*** Organic fertilizer 2.164 0.030 8.288***
Organic pesticides 0.083 0.082 -0.032
Mulch 1.590 1.328 5.294***
Manure 1.998 0.912 3.543***
Weeding 2.410 2.327 0.566
Cover crops 0.175 0.161 0.353
Crop rotation 0.980 0.132 6.343***
Trash lines 2.932 1.043 9.451***
Infiltration ditches 1.066 0.721 1.979**
Leguminous residues 0.066 0.018 2.217**
Significance levels for the t-statistics of the mean difference test: *: 10% **: 5% ***: 1%

31
Table 4: Estimation results of ESR for Impact of Organic Certification on Agro-ecological Practice Use
Selection Eq. Organic farmers Convent. farmers Variable Coefficient Std. Err. Coefficient Std. Err. Coefficient Std. Err. (1) (2) (3) (4) (5) (6) GENDER -0.122 0.513 0.173 0.101 1.769 0.597 AGE 0.004 0.018 -0.006 0.023 -0.056** 0.024 NATIVE -0.151 0.275 0.443 0.513 0.401 0.399 RISK 0.306*** 0.095 -0.133 0.207 0.135 0.196 HHSIZE -0.058 0.052 -0.146 0.099 -0.068 0.071 EDUC -0.094* 0.059 0.323** 0.096 0.135 0.286 WEALTH -0.296*** 0.090 0.397*** 0.142 0.138 0.089 FSIZE -0.012 0.010 -0.006 0.012 0.0001 0.011 OWNLAND 0.586** 0.236 1.051** 0.558 0.927 0.827 EXPER 0.034 0.032 0.020 0.036 0.024 0.033 LEARN1 0.829** 0.597 1.053 1.146 -0.774 0.440 LEARN2 -0.537** 0.217 0.357 1.387 -0.223 0.530 DIST -0.341** 0.164 -0.130 0.405 -0.947** 0.373 SOIL 0.008 0.058 -0.316*** 0.1281 -0.268*** 0.085 ORGA 1.403*** 0.218 -1.232* 0.665 0.828 0.747 ENV 1.431*** 0.325 -1.423*** 0.412 0.038 0.388 GOVERN 0.445*** 0.164 BANK -0.468 0.558 0.403 0.497 CREDIT -0.526 0.466 -0.239 0.487 VARIETYMD2 2.550*** 0.989 -0.128 0.396 HIRED -0.569 0.821 0.452 0.578 INSPECT -0.113 0.026 0.074** 0.029 CONTR 1.154** 0.543 -0.083 0.380 CERTIFYEARSNO 0.299** 0.141 -0.203 0.457 INTERCEPT 1.038 0.985 1.027 1.347 3.455** 1.754
-0.320 0.466 0.916*** 0.070
0.260 1.048 0.744*** 0.104
Log-Likelihood: -993.143 Wald test of indep. eqns.: 2 = 3.69*** Significance levels for the t-statistics of the mean difference test: *: 10% **: 5% ***: 1%

32
Table 5: Results of Impact of Organic Certification on Agro-ecological Practice Use
Method Predicted Use of certified
Predicted Use of non-certified
ATT t-Statistic
ESR Organic certified farmers 5.921 2.518 3.403 13.314*** Conventional farmers 8.135 3.788 Alternative Specifications ESR using different weights Organic certified farmers 6.102 3.046 3.056 11.465*** Conventional farmers 7.979 3.594 ESR using no weights Organic certified farmers 5.986 2.136 3.851 12.258*** Conventional farmers 8.115 3.266 ESR (weeding excluded) Organic certified farmers 5.728 2.667 3.061 10.894*** Conventional farmers 7.934 3.363 PSM Kernel (bandwidth=0.4) 6.751 2.680 4.071 7.98*** Radius (caliper=0.05) 6.751 2.523 4.228 7.34*** Nearest-neighbor 6.751 2.351 4.400 6.98*** Significance levels for the t-statistics of the mean difference test: *: 10% **: 5% ***: 1% For PSM, standard errors are calculated with bootstrapping using 1000 replications. Bootstrapping of standards errors is necessary because the estimated variance does not include the variance that may appear due to the estimation of the propensity score and the imputation of the common support assumption (Caliendo and Kopeinig (2008)). Even though Abadie and Imbens (2008) criticism the use of bootstrapping for the nearest-neighbor algorithm, its application is still common practice.

33
Appendix
Table A.1: Estimation Results of Generalized Propensity Score
Variable Coefficient Std. Err.Equation 1 ORGANIC 0.165*** 0.026
GENDER 0.050 0.052
AGE -0.005** 0.002
RISK 0.019 0.048
HHSIZE -0.041*** 0.018
EDUC 0.101** 0.079
FSIZE 0.003** 0.001
OWNLAND 0.283*** 0.096
EXPER 0.042* 0.021
LEARN1 -0.101* 0.060
LEARN2 0.108* 0.074
DIST -0.152 0.135
ORGA -0.126 0.114
SOIL -0.112*** 0.022
WEALTH 0.165*** 0.071
ENV 0.266** 0.170
INTERCEPT 0.935*** 0.149
Equation 2
INTERCEPT 0.31*** 0.014
Significance levels for the t-statistics of the mean difference test:*: 10% **: 5% ***: 1%
Table A.2: Estimation Results of the Coefficients of the Dose Response Function
Variable Coefficient Std. Err. T -0.305** 0.121 T2 0.019*** 0.004 GP S -3.252** 1.401 T * GP S 0.385 0.259 INTERCEPT 4.638*** 1.251 Significance levels for the t-statistics of the mean difference test:*: 10% **: 5% ***: 1%
34
Figure A.1: Impact of Intensity of Agro-ecological Practice Use on ROI (restricted to values lower than 13)
Source: own estimation.
Figure A.2: Impact of Intensity of Agro-ecological Practice Use on ROI (different weights for agro-ecological practices)
Source: own estimation.
35
Figure A.3: Impact of Intensity of Agro-ecological Practice Use on ROI (no weights)
Source: own estimation.
Figure A.4: Impact of Intensity of Agro-ecological Practice Use on ROI (weeding excluded)
Source: own estimation.

36
Notes
1 Source: http://www.organic-world.net/statistics-data-tables-dynamic.html. 2 Ajumako Enyan Esiam, Akuapem South, Ewutu-Efutu-Senya, Ga, Kwahu South and Mfantseman. 3 We are aware that measurement errors are frequent in measuring agricultural inputs and outputs in developing countries. However, when farmers in both groups are sufficiently similar in their sociodemographic characteristics we can assume that measurement errors do not significantly differ between farmers. 4 In these cases either it was logical to pose the question with a yes/no option only, as in the case of cover crops or the quality of the data retrieved from the survey did not allow the division into frequency of use, as in the case of organic pesticides and leguminous residues. 5 The unbiased treatment effect is hard to measure because, when treatment is non-random as in our case, untreated individuals may differ systematically because of self-selection into treatment. A popular approach to avoid biased results is to randomize treatment. In our case randomization over which farmers use which agro-ecological methods is impossible to realize because all the methods in question are already common or widely known by the farmers. The underlying treatment is not a development intervention, but the outcome of various interventions in a longer time horizon. 6 For testing the balancing property of the GPS, the treatment variable was divided into 4 intervals with cut-off points at 25%, 50%, etc. Without adjusting for the GPS, t-tests of mean difference between the intervals revealed that 14 t-tests were significant at the 5% level, after dividing into 4 intervals and conducting block-wise t-tests this number was reduced to 2. We repeated the analysis with more intervals, namely 7, which did not affect our conclusions, but the number of observations in each interval becomes quite small, so the results are weaker. 7 The estimated quadratic dose response function regression is shown in Table A.2 in the appendix. All GPSM regressions were also repeated with net farm income as impact variable. Due to the low investment level of the farmers, the results did not change significantly. Therefore the results are omitted here, but are available upon request from the authors. 8 When the farm is strongly specialized in pineapple, mulching material and manure cannot be produced on the farm (see also e.g. Branca et al., 2011). The required material is often available at no or low cost, but needs to be transported to the farm. Since this material is relatively bulky, transport costs can impede their use in case of lack of cash, or if their perceived benefits are lower than the effort of organizing and paying for their transport.