biodiversity assessment on landscape and farm level the...
TRANSCRIPT
Biodiversity assessment on
landscape and farm level
– the LISA approach
– results of the Landscape Infrastructure and
Sustainable Agriculture (LISA) study 2014
Dr. Rainer Oppermann
Institute for Agroecology and Biodiversity (IFAB) Mannheim
Presentation in Madrid, 29.09.2015,
at the “Natura 2000 Farmland Management and Biodiversity Conference”,
WorkGroup1: “Biodiversity for Better Farmland Management”

2
Motivations for the LISA study
(1) Continuing decline in agrobiodiversity due to changes in the ecological
quality of agricultural habitats
(2) There are large numbers of small scale ecological studies as well as
large scale monitoring approaches, but no detailed, comparable data
available from across Europe
(3) New policies targeting the ecological quality of farmland (particularly
greening) need to be monitored using standardised data over space
and over time
The presentation refers to the landscape level
– however, the methods are applicable
- on specific regions (e.g. N2000) and
- on farms as well
3
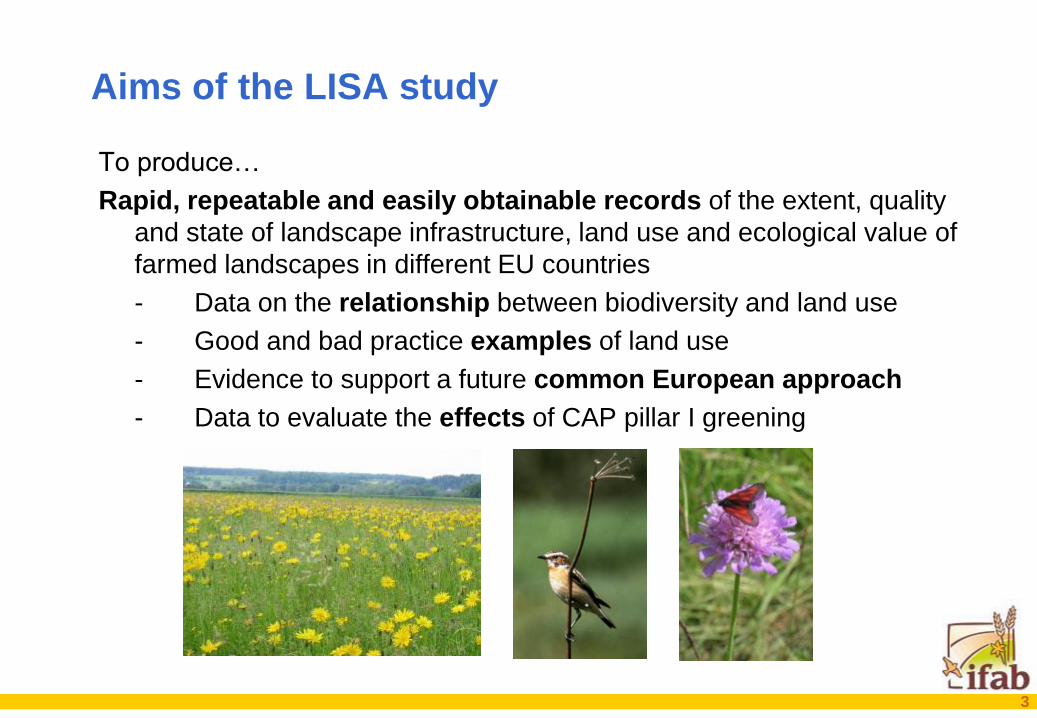
Aims of the LISA study
To produce…
Rapid, repeatable and easily obtainable records of the extent, quality
and state of landscape infrastructure, land use and ecological value of
farmed landscapes in different EU countries
- Data on the relationship between biodiversity and land use
- Good and bad practice examples of land use
- Evidence to support a future common European approach
- Data to evaluate the effects of CAP pillar I greening
4
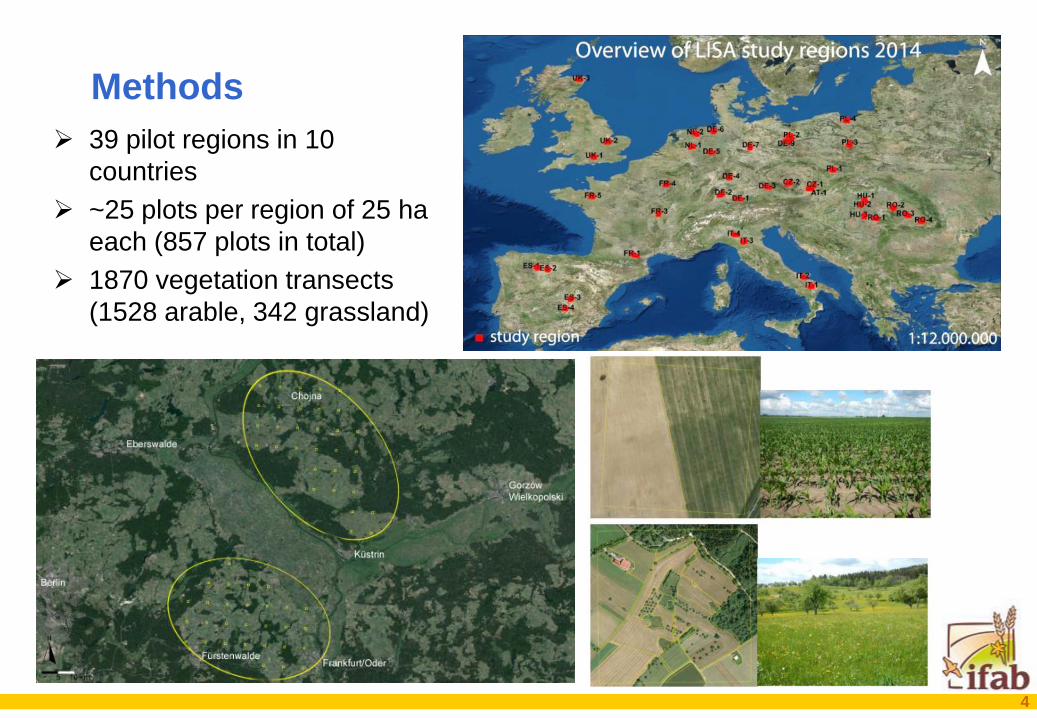
Methods
39 pilot regions in 10
countries
~25 plots per region of 25 ha
each (857 plots in total)
1870 vegetation transects
(1528 arable, 342 grassland)

5
Methods 1. Plot mapping
- landuse
- landuse intensity scale 1 – 5
- nature value scale 1 – 5
- landscape elements and buffer strips
- ecological sensitivity
2. Detailed transect data - vegetation cover
- cover of crops and of weeds
- vegetation structure
- flower density and number of flowering species
- potential key species
3. Photo documentation - different types of landuse and nature value
- landscape elements
- buffer strips
- vegetation transects
6
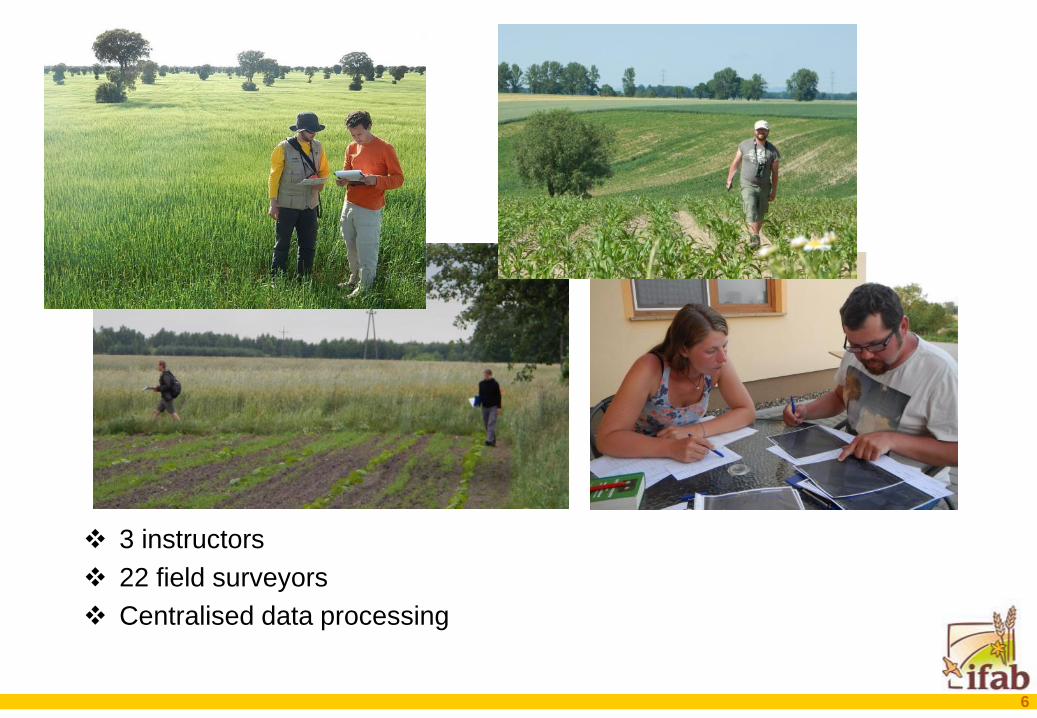
3 instructors
22 field surveyors
Centralised data processing
7
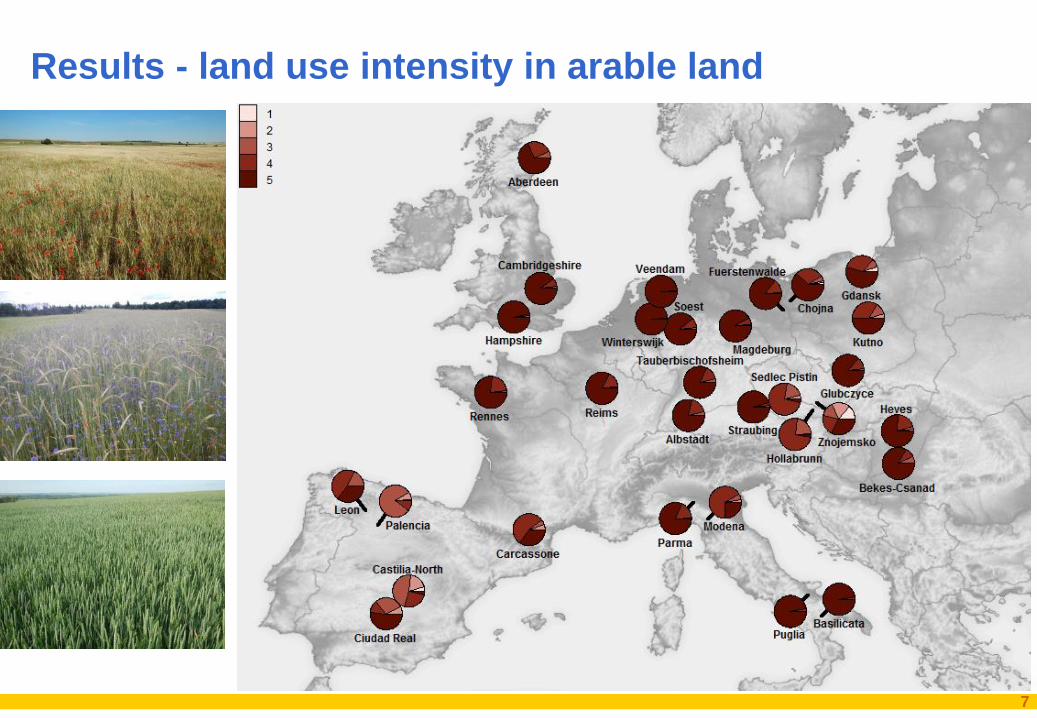
Results - land use intensity in arable land
8
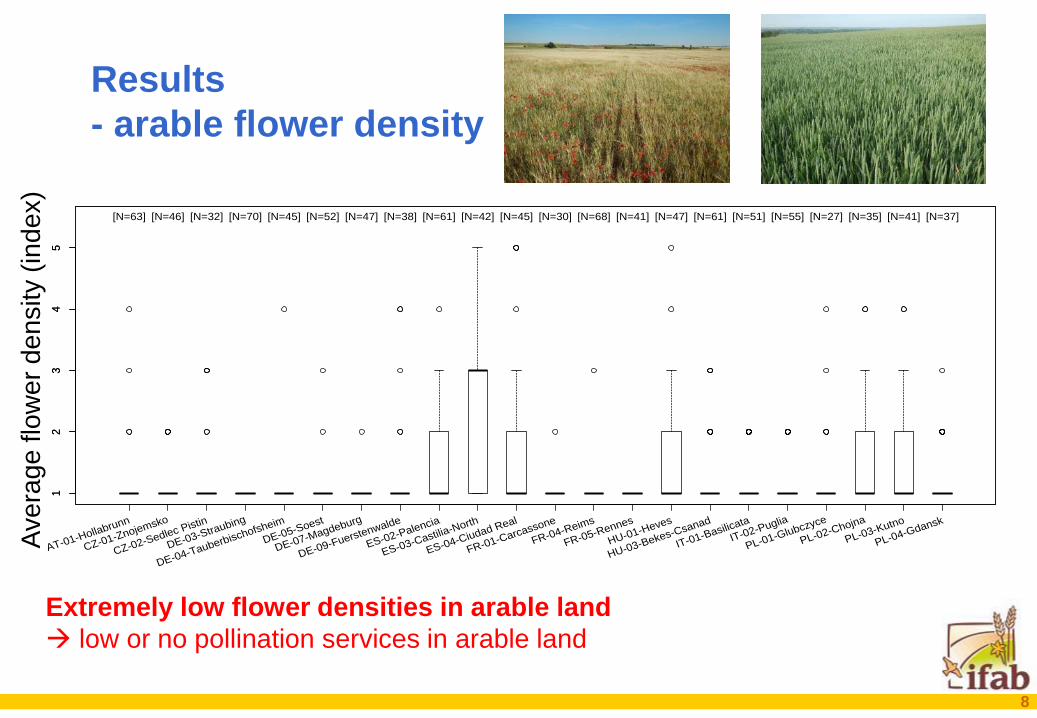
Results
- arable flower density
12
34
5
Flo
wer
density
Arable land
AT-01-Hollabrunn
CZ-01-Znojemsko
CZ-02-Sedlec Pistin
DE-03-Straubing
DE-04-Tauberbischofsheim
DE-05-Soest
DE-07-Magdeburg
DE-09-Fuerstenwalde
ES-02-Palencia
ES-03-Castilia-North
ES-04-Ciudad Real
FR-01-Carcassone
FR-04-Reims
FR-05-Rennes
HU-01-Heves
HU-03-Bekes-Csanad
IT-01-Basilicata
IT-02-Puglia
PL-01-Glubczyce
PL-02-Chojna
PL-03-Kutno
PL-04-Gdansk
[N=63] [N=46] [N=32] [N=70] [N=45] [N=52] [N=47] [N=38] [N=61] [N=42] [N=45] [N=30] [N=68] [N=41] [N=47] [N=61] [N=51] [N=55] [N=27] [N=35] [N=41] [N=37]
12
34
5
Extremely low flower densities in arable land
low or no pollination services in arable land
Ave
rag
e flo
we
r d
en
sity (
ind
ex)

02
46
8
Nu
mb
er
of
ke
y s
pe
cie
s
Arable land
AT-01-Hollabrunn
CZ-01-Znojemsko
CZ-02-Sedlec Pistin
DE-03-Straubing
DE-04-Tauberbischofsheim
DE-05-Soest
DE-07-Magdeburg
DE-09-Fuerstenwalde
ES-02-Palencia
ES-03-Castilia-North
ES-04-Ciudad Real
FR-01-Carcassone
FR-04-Reims
FR-05-Rennes
HU-01-Heves
HU-03-Bekes-Csanad
IT-01-Basilicata
IT-02-Puglia
PL-01-Glubczyce
PL-02-Chojna
PL-03-Kutno
PL-04-Gdansk
[N=63] [N=46] [N=32] [N=70] [N=45] [N=52] [N=47] [N=38] [N=61] [N=43] [N=45] [N=44] [N=68] [N=41] [N=47] [N=61] [N=54] [N=55] [N=27] [N=36] [N=41] [N=37]
02
46
8
9
Results
- key species arable
Fewer than 1 key species on average in all arable plots!
(>3-4 key species = notable biodiversity)
Ave
rag
e n
um
be
r ke
y s
pe
cie
s
10
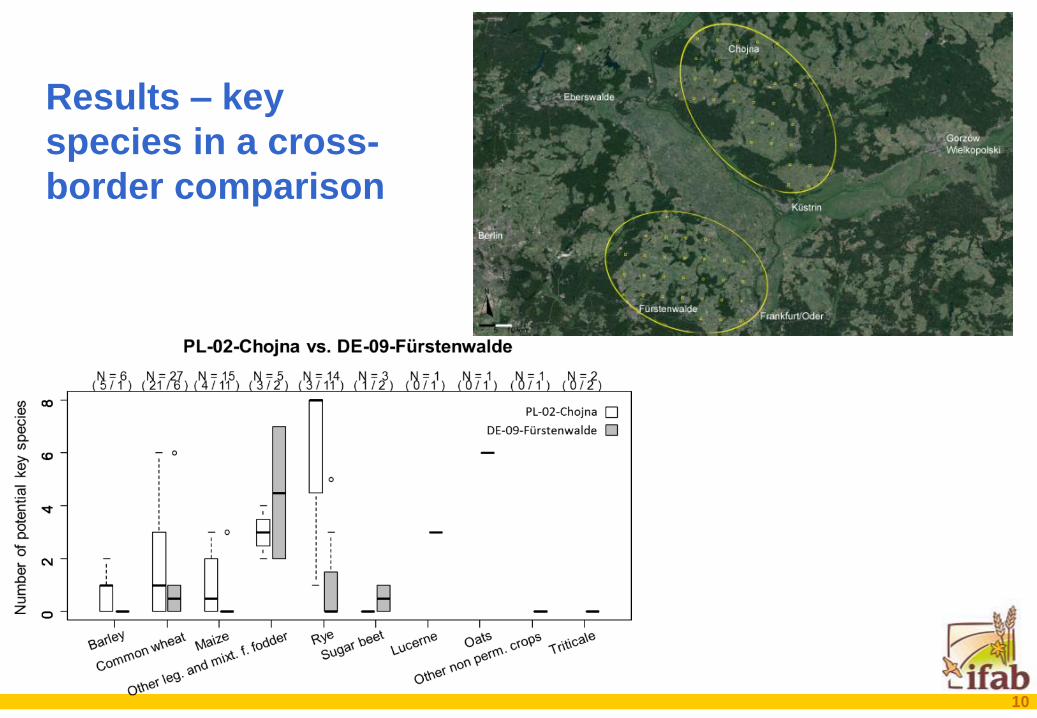
Results – key
species in a cross-
border comparison
11
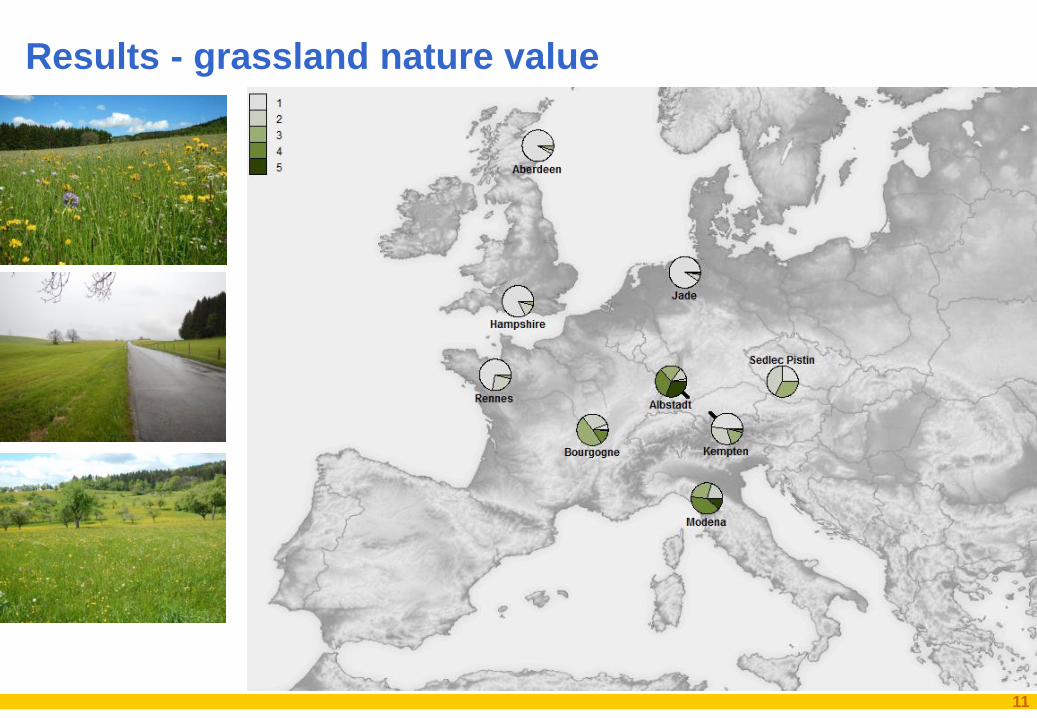
Results - grassland nature value
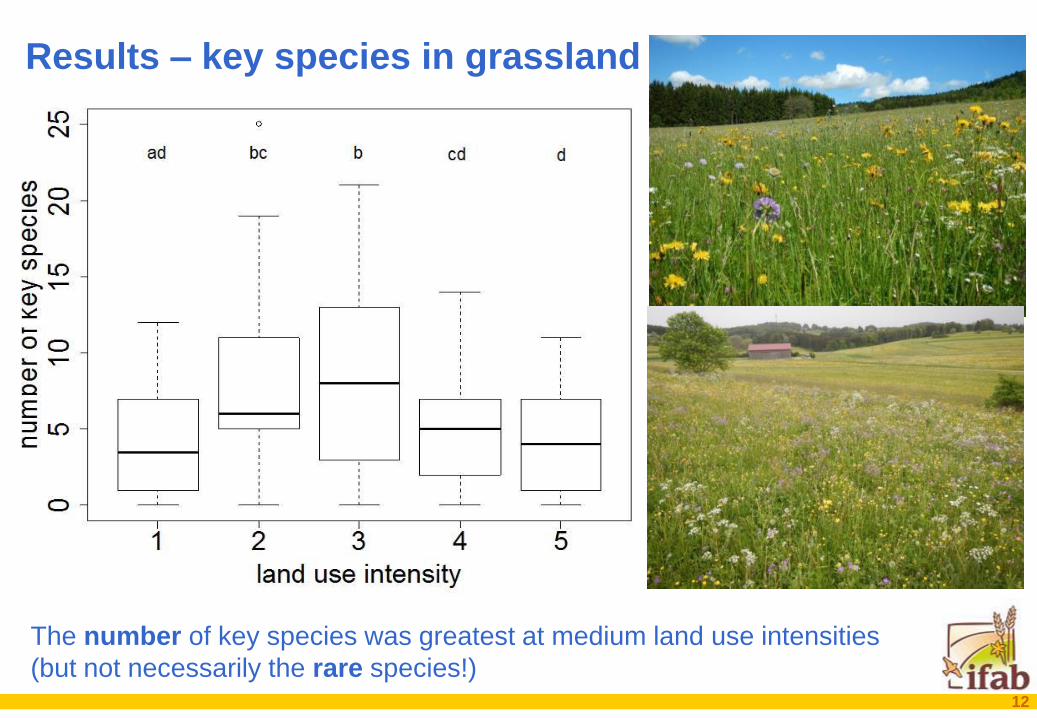
The number of key species was greatest at medium land use intensities
(but not necessarily the rare species!) 12
Results – key species in grassland
13
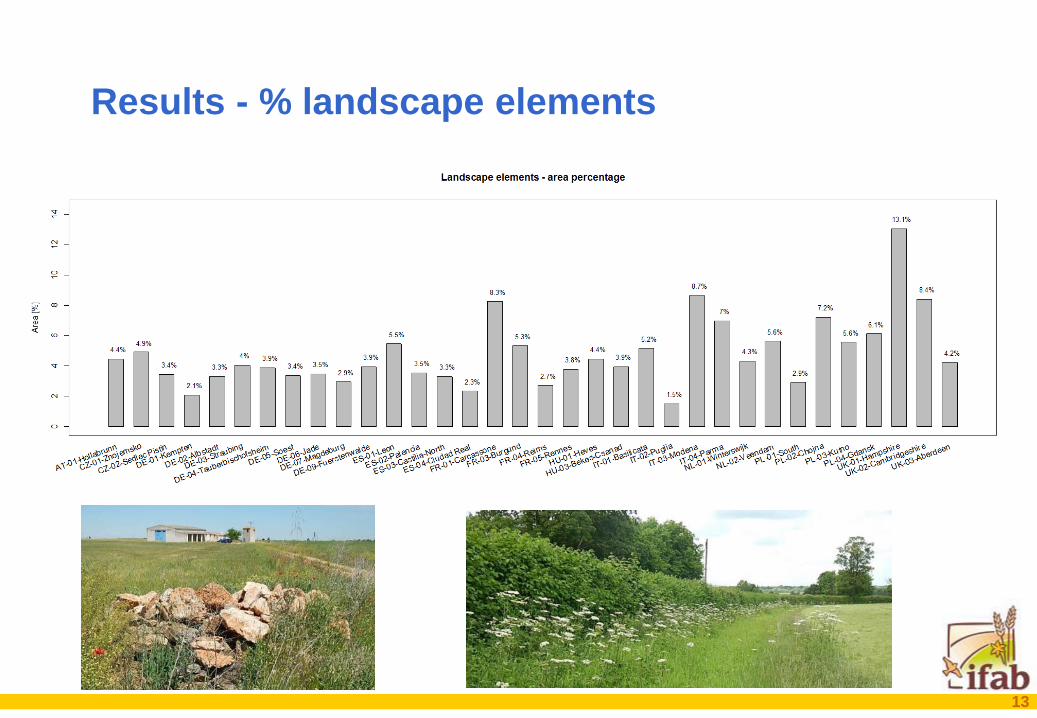
Results - % landscape elements
14
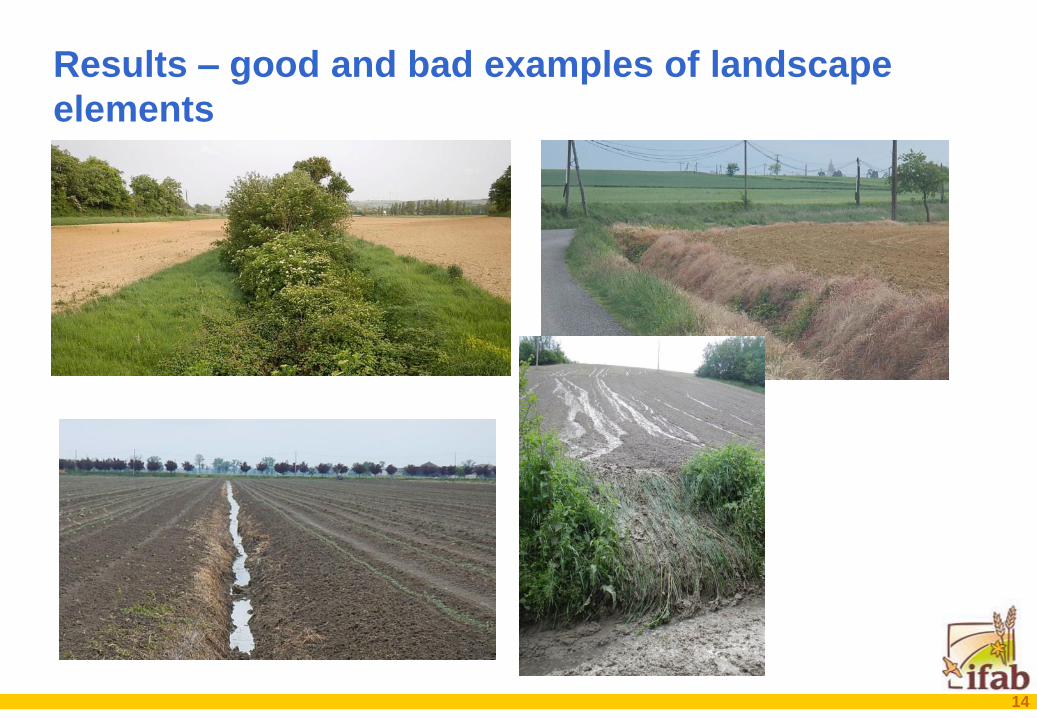
Results – good and bad examples of landscape
elements
15
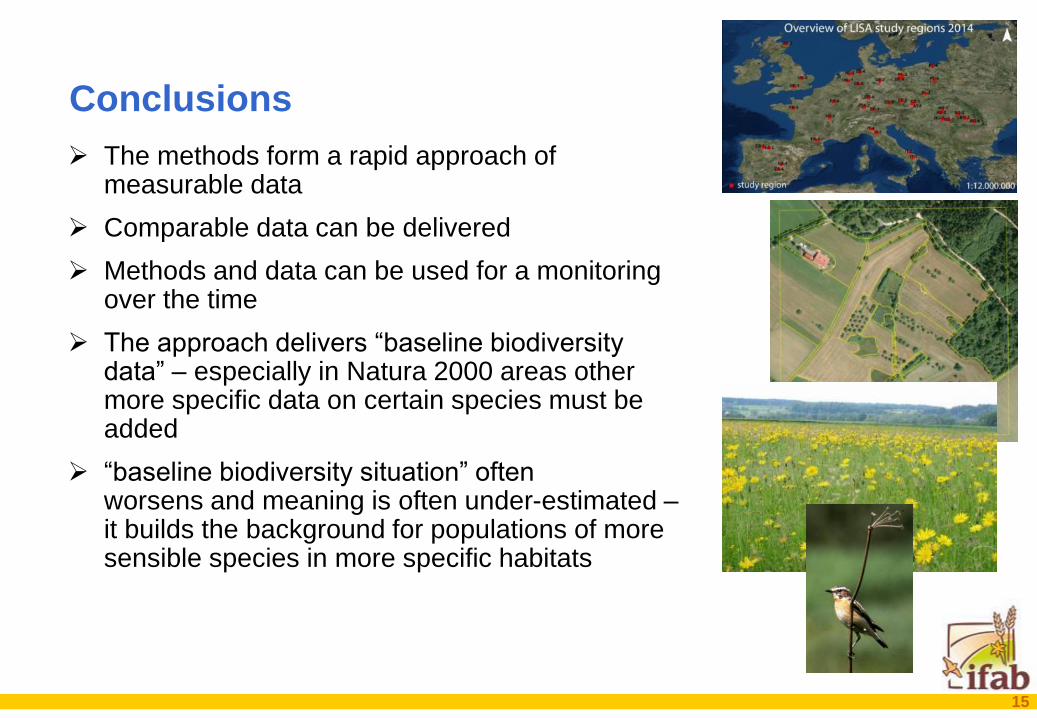
The methods form a rapid approach of measurable data
Comparable data can be delivered
Methods and data can be used for a monitoring over the time
The approach delivers “baseline biodiversity data” – especially in Natura 2000 areas other more specific data on certain species must be added
“baseline biodiversity situation” often worsens and meaning is often under-estimated – it builds the background for populations of more sensible species in more specific habitats
Conclusions
16
Thank you for your attention!
Institute for Agroecology and Biodiversity (IFAB)
Böcklinstr. 27, D-68163 Mannheim
Dr. Rainer Oppermann, Richard Bleil, Anja Eirich, Julian Lüdemann, Laura Sutcliffe