eciv 301 programming & graphics numerical methods for engineers lecture 24 regression...
Post on 21-Dec-2015
217 views
TRANSCRIPT

ECIV 301
Programming & Graphics
Numerical Methods for Engineers
Lecture 24
Regression Analysis-Chapter 17

LAST TIME Splines

LAST TIME Splines
Piecewise smooth polynomials

tscoefficien n3
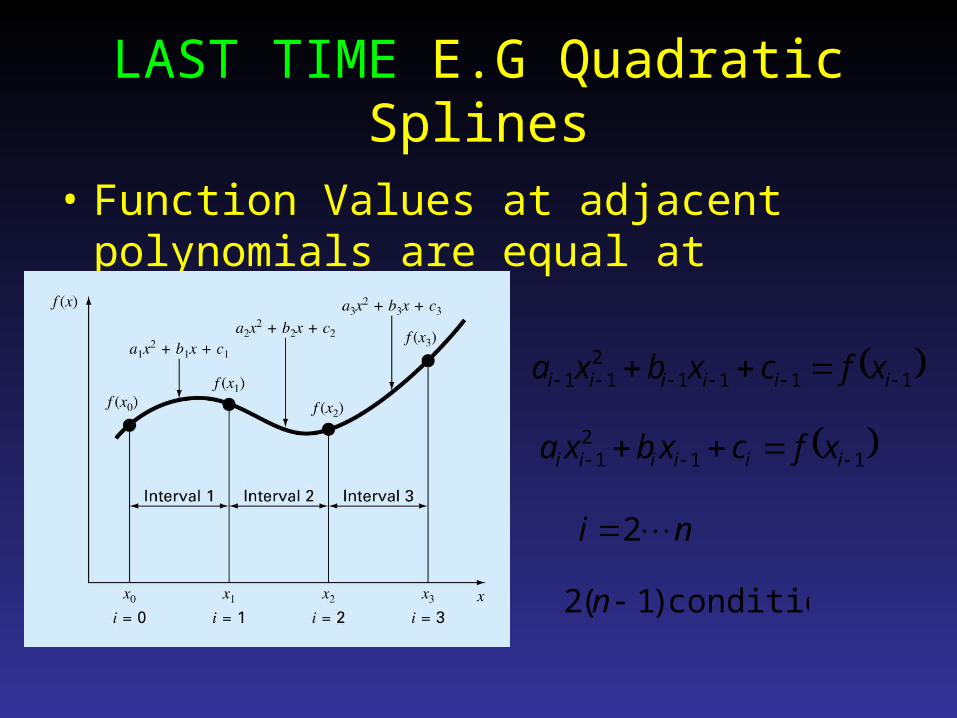
LAST TIME E.G Quadratic Splines
• Function Values at adjacent polynomials are equal at interior nodes
11112
11 iiiiii xfcxbxa
112
1 iiiiii xfcxbxa
ni 2
conditions )1(2 n

LAST TIME E.G Quadratic Splines
• First and Last Functions pass through end points
011201 xfcxbxa i
nnnnnn xfcxbxa 2
conditions )1(2 nconditions 2
conditions 2n
ni 2

LAST TIME E.G Quadratic Splines
• First Derivatives at Interior nodes are equal
baxxf 20
ni 2
conditions )1(2 nconditions 2
conditions 13 n
iii
iii
bxa
bxa
1
111
2
2
conditions 1-n

LAST TIME E.G Quadratic Splines
• Assume Second Derivative @ First Point=0
02 10 axf
conditions )1(2 nconditions 2
conditions 3n
conditions 1-nconditions 1

LAST TIME E.G Quadratic Splines
• Assume Second Derivative @ First Point=0
conditions 3n
tscoefficien edundetermin 3n
Solve 3nx3n system of Equations
baC
ix on based )( and
)( on based
xf
xf

LAST TIME Spline Interpolation
Polynomial InterpolationPolynomial Interpolation
Spline InterpolationSpline InterpolationPolynomial InterpolationPolynomial Interpolation
Polynomial InterpolationPolynomial Interpolation

Curve Fitting
Often we are faced with the problem…
x y0.924 -0.003880.928 -0.00743
0.93283 0.005690.93875 0.00188
0.94 0.01278
-0.01
-0.005
0
0.005
0.01
0.015
0.92 0.925 0.93 0.935 0.94 0.945
what value of y corresponds to x=0.935?

-0.01
-0.005
0
0.005
0.01
0.015
0.92 0.925 0.93 0.935 0.94 0.945
Curve Fitting
Question 1: Is it possible to find a simple and convenient formula that reproduces the points exactly?
-0.01
-0.005
0
0.005
0.01
0.015
0.92 0.925 0.93 0.935 0.94 0.945
e.g. Straight Line ?
-0.01
-0.005
0
0.005
0.01
0.015
0.92 0.925 0.93 0.935 0.94 0.945
…or smooth line ?
…or some other representation?
Interpolation

Curve FittingQuestion 2: Is it possible to find a simple and convenient formula that represents data approximately ?
-0.01
-0.005
0
0.005
0.01
0.015
0.92 0.925 0.93 0.935 0.94 0.945
e.g. Best Fit ?
Approximation

Experimental Measurements
Strain
Str
ess

Experimental Measurements
Strain
Str
ess

BEST FIT CRITERIA
Strain
y S
tres
s
xaaxl 10)(
ii
iii
xaay
xlye
10
)(
Error at each Point
n
iii
n
ii
xaay
e
110
1
Total Error

Best Fit => Minimize Error
n
iii
n
ii
xaay
e
110
1
Not a Good Choice
Not a Unique Best Fit
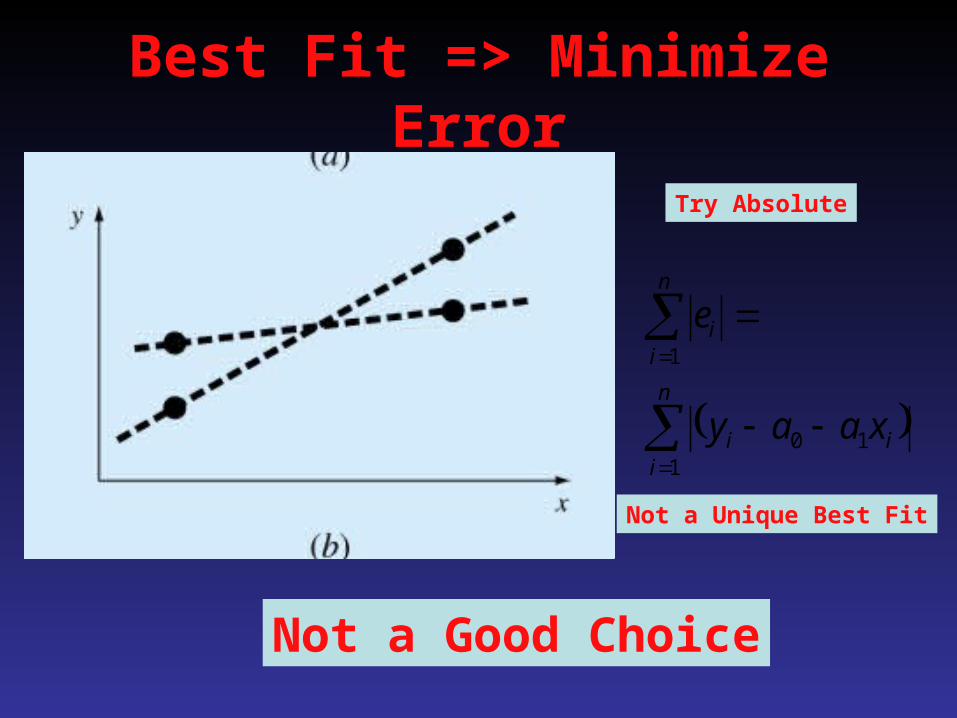
Best Fit => Minimize Error
n
iii
n
ii
xaay
e
110
1
Try Absolute
Not a Good Choice
Not a Unique Best Fit

Best Fit => Minimize Error
n
iii
n
ielimeasuredi
n
ii
xaay
yye
1
210
1
2mod,,
1
2
Best Strategy

Best Fit => Minimize Error
n
iii
n
ii xaaye
1
210
1
2
Objective:
What are the values of ao and a1
that minimize ?
n
iie
1
2
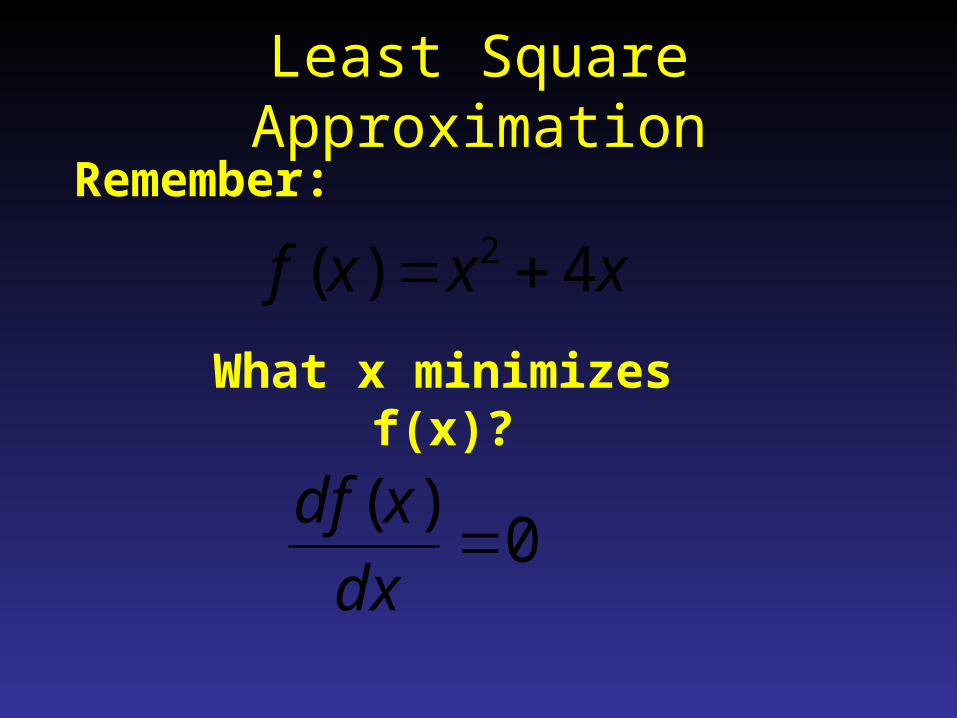
Least Square Approximation
xxxf 4)( 2 What x minimizes f(x)?
Remember:
0)(
dx
xdf

Least Square Approximation
101
210
1
2 ,aaSxaaye r
n
iii
n
ii
In our case
Since xi and yi are known from given data
02,
110
0
10
n
iii
r xaaya
aaS
02,
110
1
10
n
iiii
r xxaaya
aaS

Least Square Approximation
n
ii
n
i
n
ii
r xaaya
aaS
11
10
10
10 ,
n
ii
n
ii
n
iii
r xaxaxya
aaS
1
21
10
11
10 ,

Least Square Approximation
n
ii
n
ii
n
ii
n
i
n
ii
yxana
xaay
1110
11
10
1
0
Least Square Approximation
n
iii
n
ii
n
ii
n
ii
n
ii
n
iii
xyxaxa
xaxaxy
11
21
10
1
21
10
1
0

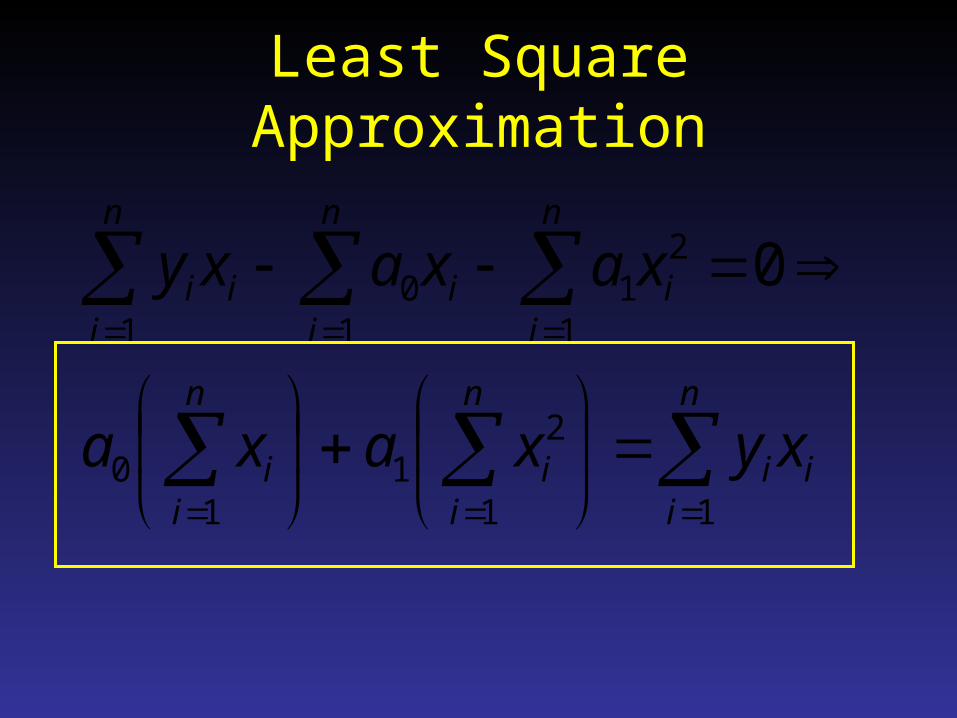
Least Square Approximation
n
iii
n
ii
n
ii xyxaxa
11
21
10
n
ii
n
ii yxana
1110
2 Eqtns 2 Unknowns
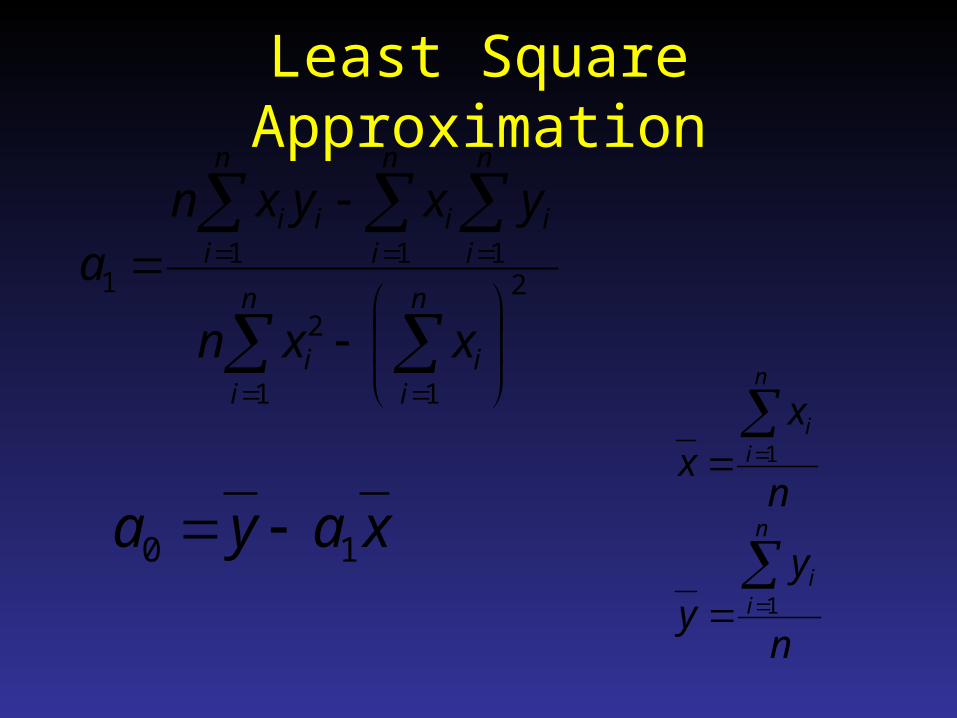
Least Square Approximation
xaya 10
2
11
2
1111
n
ii
n
ii
n
ii
n
ii
n
iii
xxn
yxyxna
n
xx
n
ii
1
n
yy
n
ii
1

Example
x y xy x2
1 0.5 0.5 1 a1= 0.839
2 2.5 5 4 a0= 0.0714
3 2 6 9
4 4 16 16
5 3.5 17.5 25
6 6 36 36
7 5.5 38.5 49
28 24 119.5 140

Example
y = 0.8393x + 0.0714
0
1
2
3
4
5
6
7
0 2 4 6 8
Series1
Linear (Series1)