eciv 301 programming & graphics numerical methods for engineers lecture 26 regression...
Post on 20-Dec-2015
223 views
TRANSCRIPT
ECIV 301
Programming & Graphics
Numerical Methods for Engineers
Lecture 26
Regression Analysis-Chapter 17
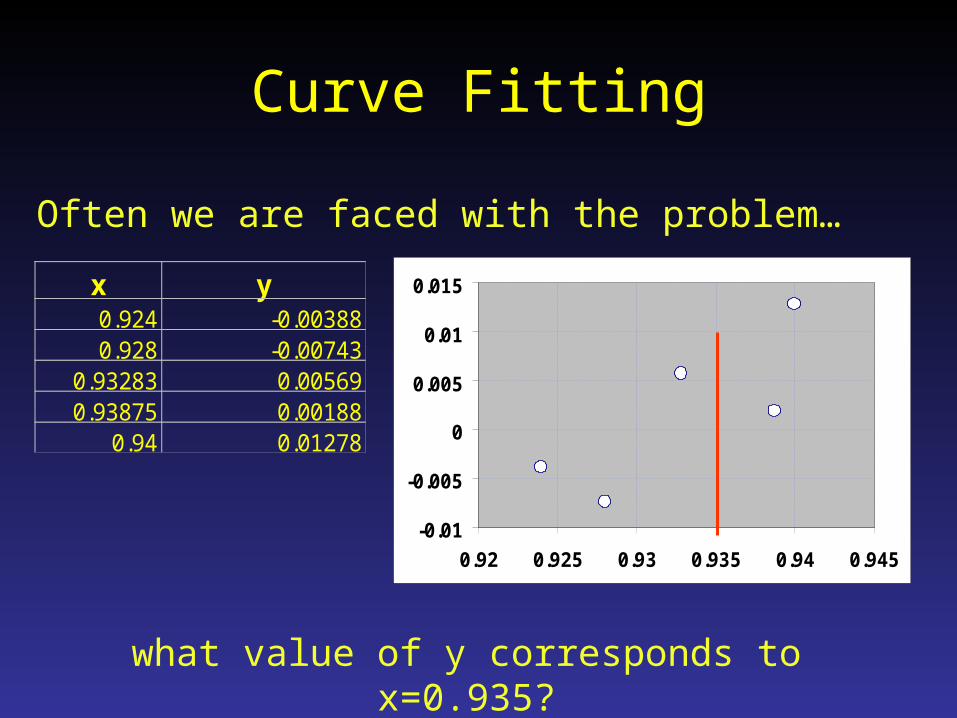
Curve Fitting
Often we are faced with the problem…
x y0.924 -0.003880.928 -0.00743
0.93283 0.005690.93875 0.00188
0.94 0.01278
-0.01
-0.005
0
0.005
0.01
0.015
0.92 0.925 0.93 0.935 0.94 0.945
what value of y corresponds to x=0.935?
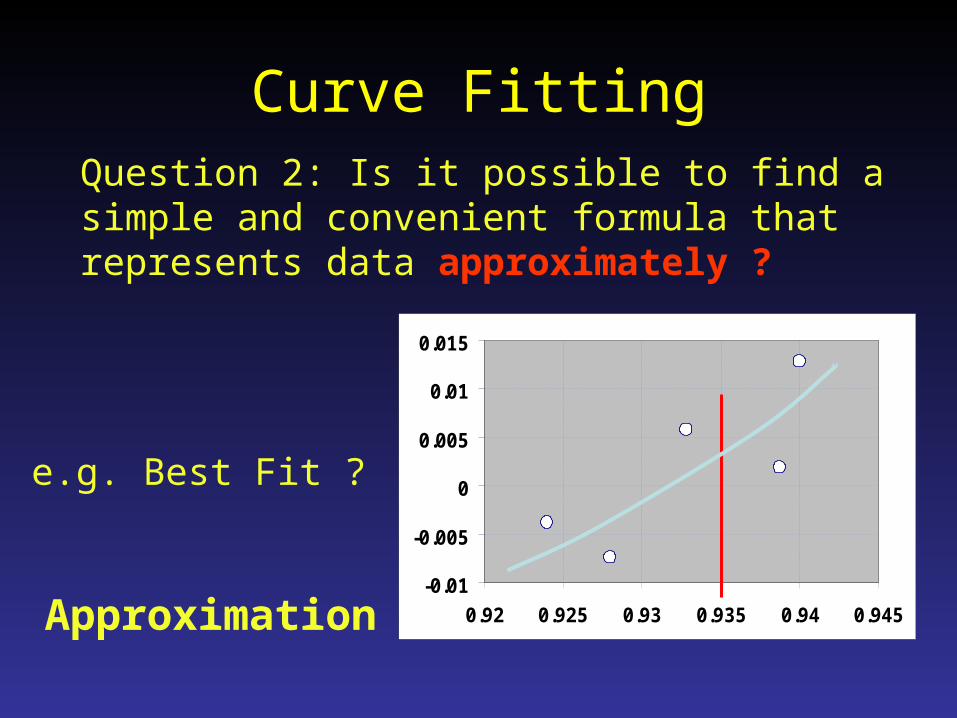
Curve FittingQuestion 2: Is it possible to find a simple and convenient formula that represents data approximately ?
-0.01
-0.005
0
0.005
0.01
0.015
0.92 0.925 0.93 0.935 0.94 0.945
e.g. Best Fit ?
Approximation
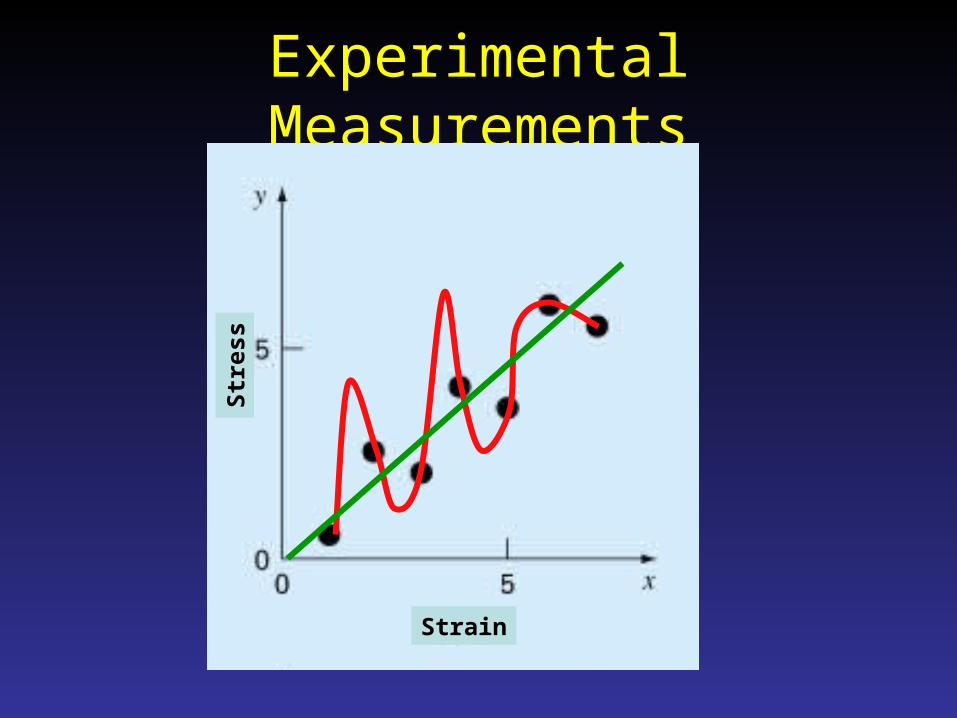
Experimental Measurements
Strain
Str
ess

Experimental Measurements
Strain
Str
ess

BEST FIT CRITERIA
Strain
y S
tres
s
xaaxl 10)(
ii
iii
xaay
xlye
10
)(
Error at each Point
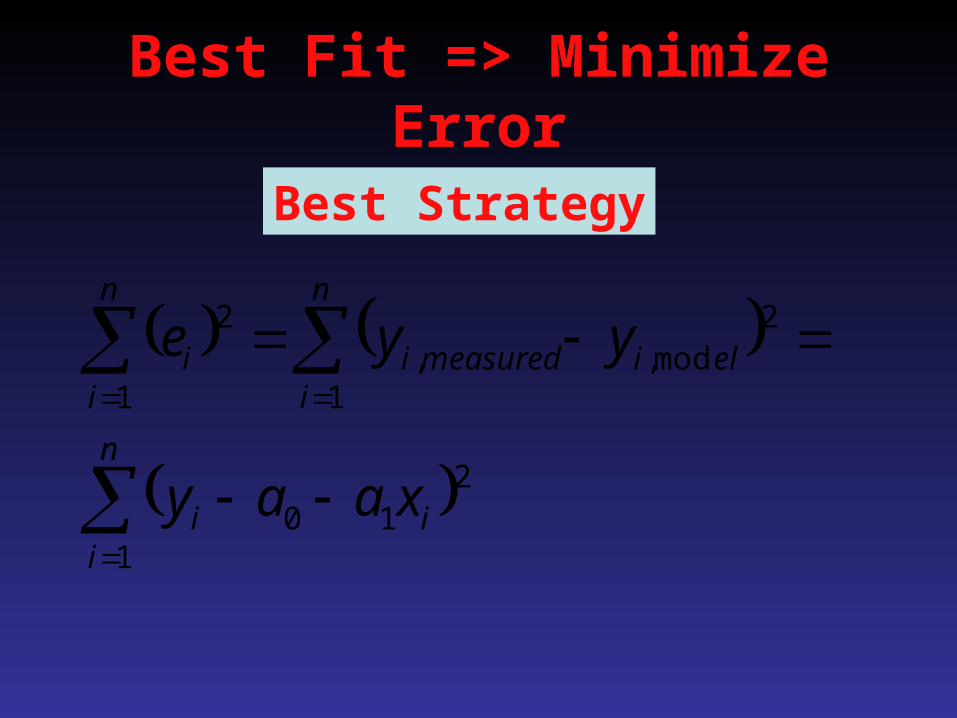
Best Fit => Minimize Error
n
iii
n
ielimeasuredi
n
ii
xaay
yye
1
210
1
2mod,,
1
2
Best Strategy
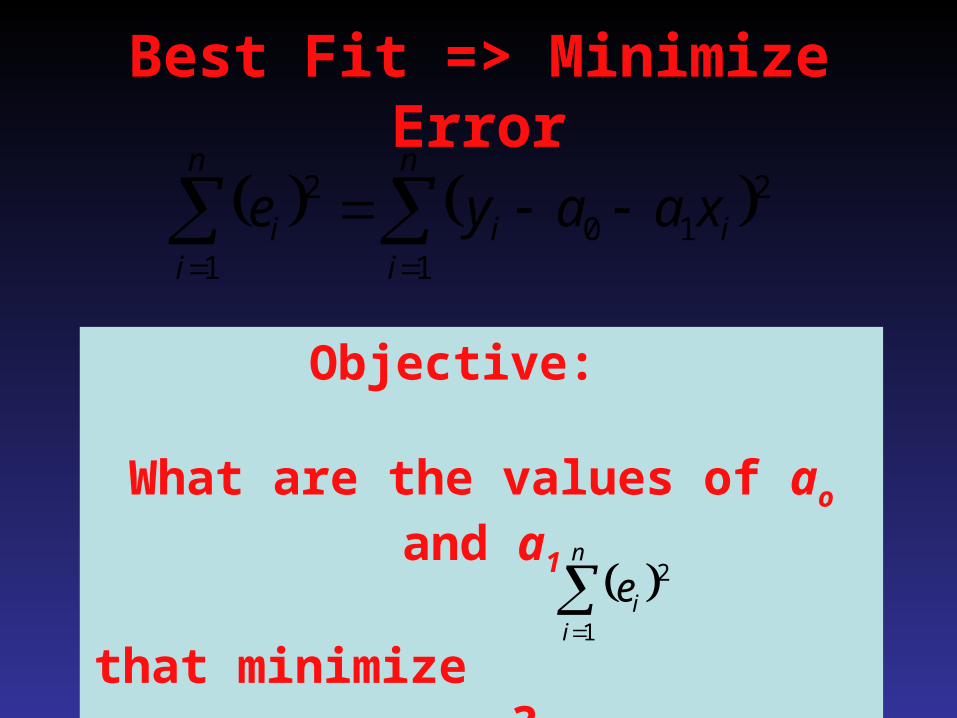
Best Fit => Minimize Error
n
iii
n
ii xaaye
1
210
1
2
Objective:
What are the values of ao and a1
that minimize ?
n
iie
1
2
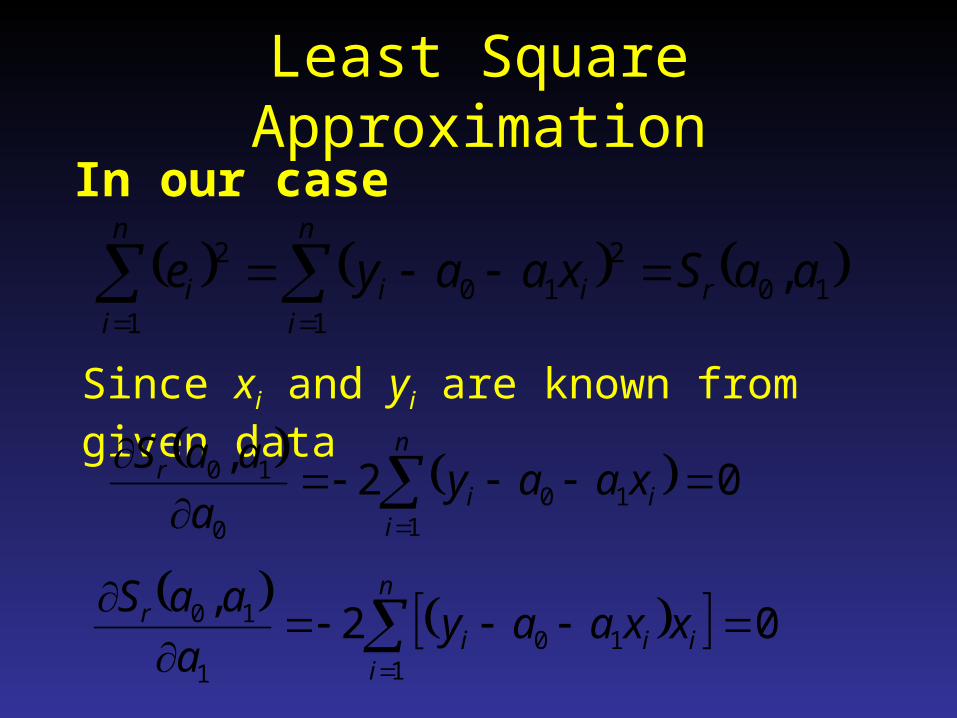
Least Square Approximation
101
210
1
2 ,aaSxaaye r
n
iii
n
ii
In our case
Since xi and yi are known from given data
02,
110
0
10
n
iii
r xaaya
aaS
02,
110
1
10
n
iiii
r xxaaya
aaS
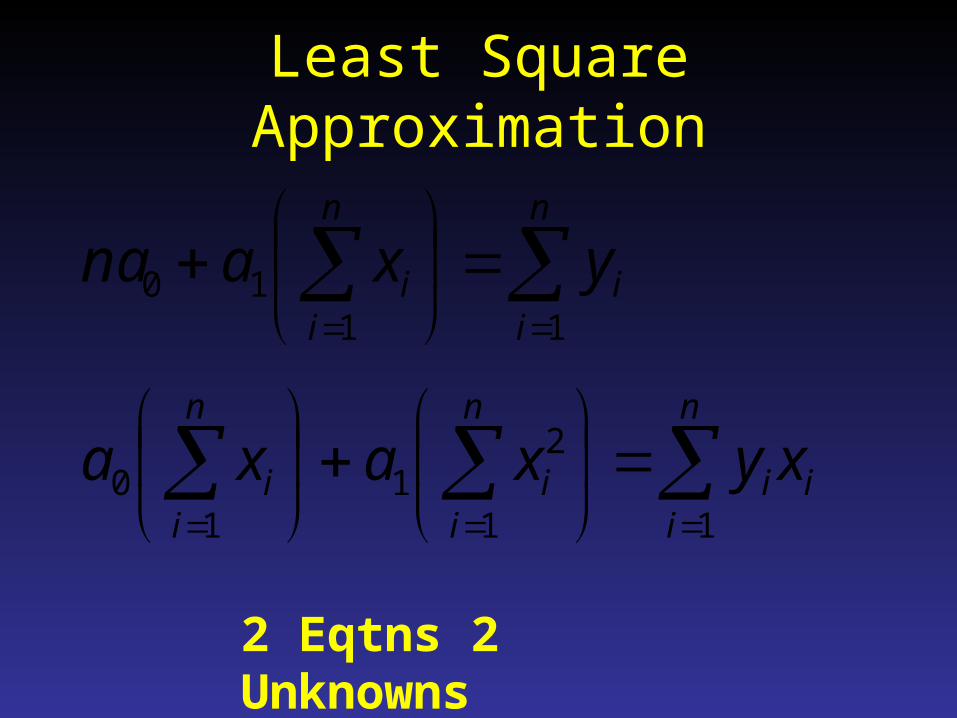
Least Square Approximation
n
iii
n
ii
n
ii xyxaxa
11
21
10
n
ii
n
ii yxana
1110
2 Eqtns 2 Unknowns

Least Square Approximation
xaya 10
2
11
2
1111
n
ii
n
ii
n
ii
n
ii
n
iii
xxn
yxyxna
n
xx
n
ii
1
n
yy
n
ii
1
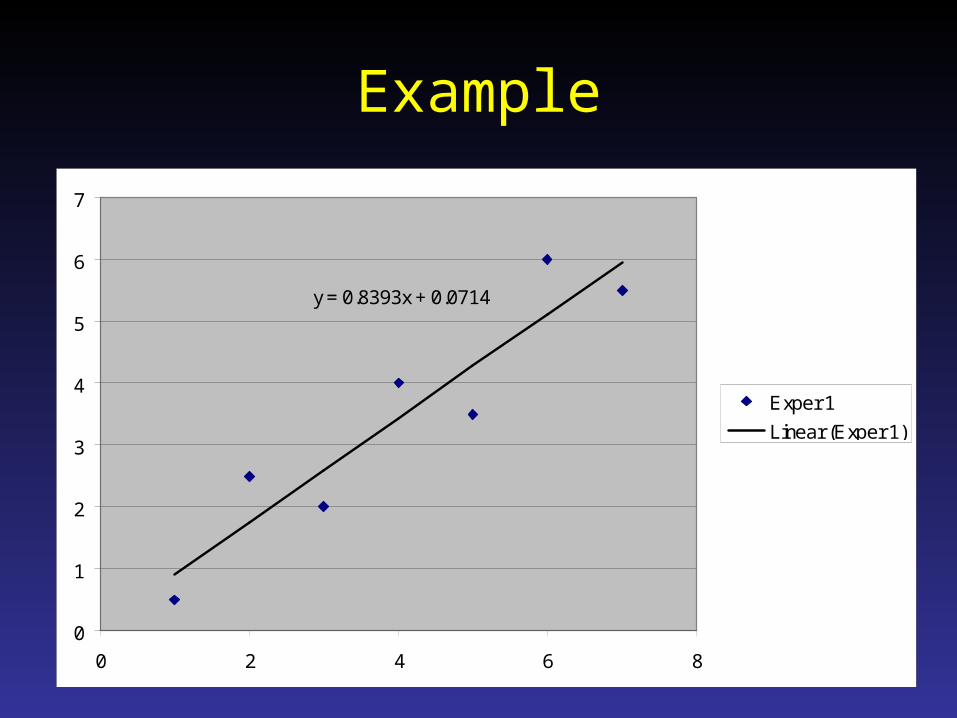
Example
y = 0.8393x + 0.0714
0
1
2
3
4
5
6
7
0 2 4 6 8
Exper 1
Linear (Exper 1)
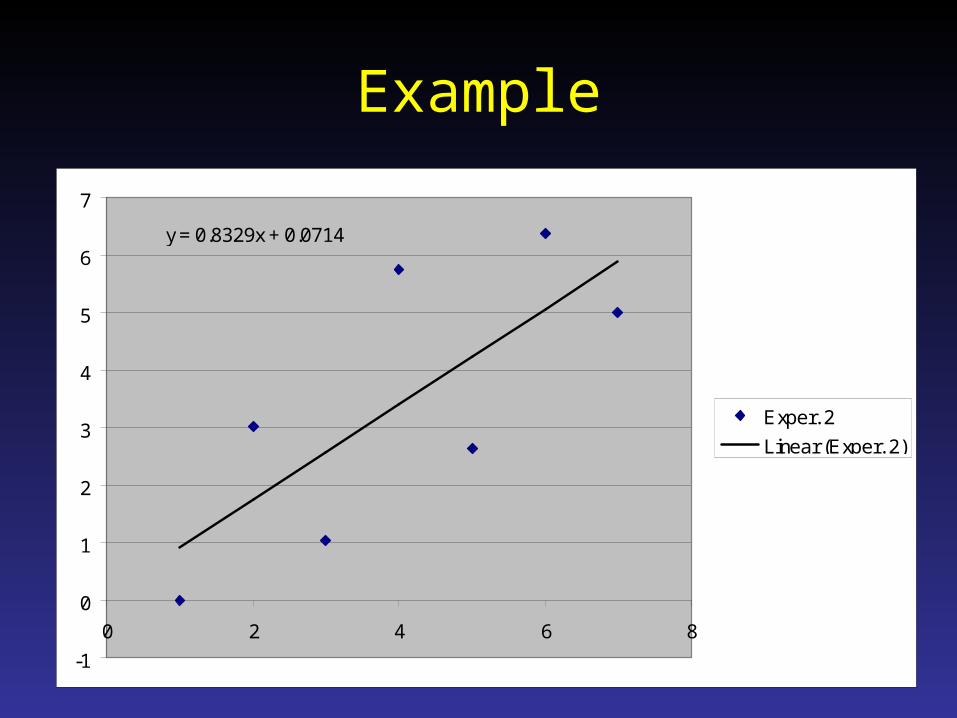
Example
y = 0.8329x + 0.0714
-1
0
1
2
3
4
5
6
7
0 2 4 6 8
Exper. 2
Linear (Exper. 2)

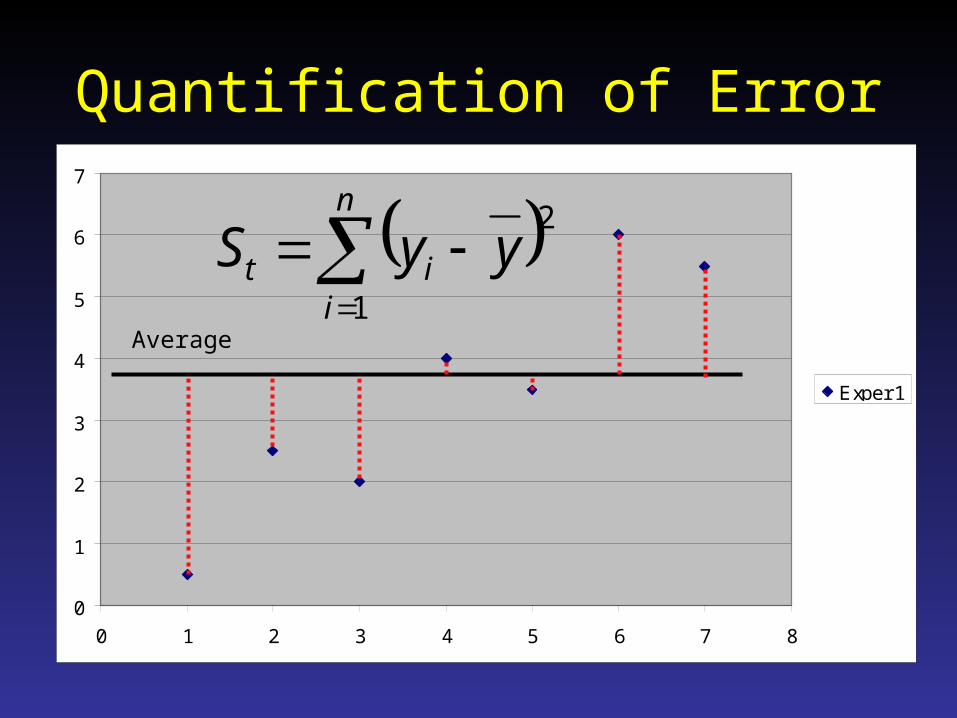
Quantification of Error
0
1
2
3
4
5
6
7
0 1 2 3 4 5 6 7 8
Exper 1
Average
42.37
241
n
yy
n
ii
Quantification of Error
0
1
2
3
4
5
6
7
0 1 2 3 4 5 6 7 8
Exper 1
Average
n
iit yyS
1
2

Quantification of Error
0
1
2
3
4
5
6
7
0 1 2 3 4 5 6 7 8
Exper 1
Average
n
iit yyS
1
2
1n
Ss ty

Quantification of Error
n
iit yyS
1
2
1n
Ss ty
0
1
2
3
4
5
6
7
0 1 2 3 4 5 6 7 8
Exper 1
Average
Standard Deviation Shows Spread Around mean Value
y = 0.8393x + 0.0714
0
1
2
3
4
5
6
7
0 2 4 6 8
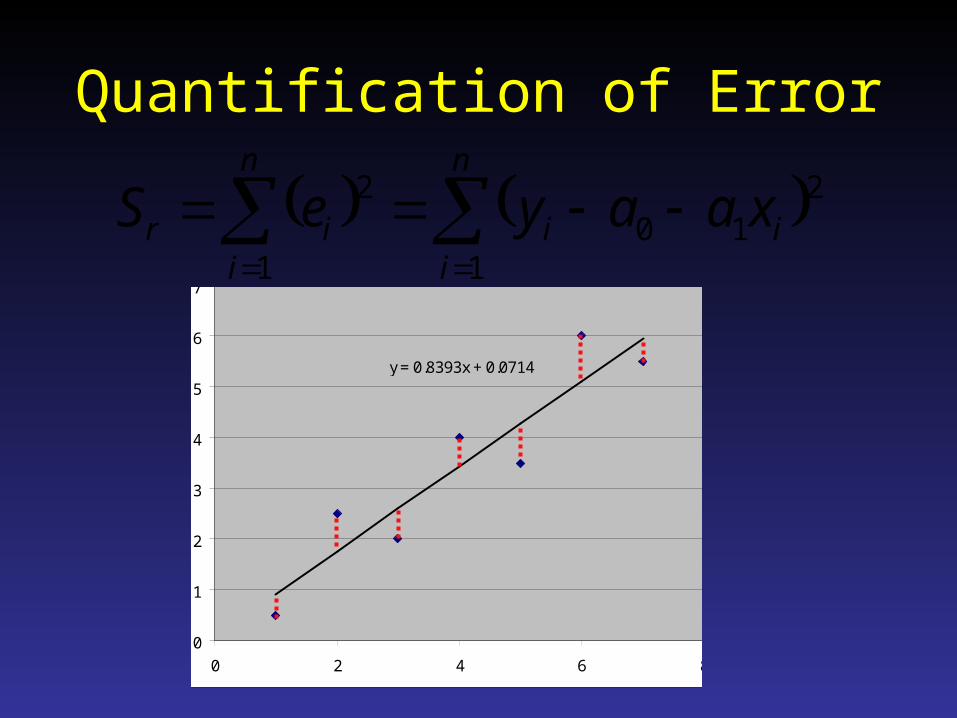
Quantification of Error
n
iii
n
iir xaayeS
1
210
1
2

Quantification of Error
n
iii
n
iir xaayeS
1
210
1
2
2/ n
Ss r
xy
“Standard Deviation” for Linear Regressiony = 0.8393x + 0.0714
0
1
2
3
4
5
6
7
0 2 4 6 8

Quantification of Error
0
1
2
3
4
5
6
7
0 1 2 3 4 5 6 7 8
Exper 1
Average
n
iit yyS
1
2
y = 0.8393x + 0.0714
0
1
2
3
4
5
6
7
0 2 4 6 8
n
iiir xaayS
1
210Better Representation
Less Spread

Quantification of Error
0
1
2
3
4
5
6
7
0 1 2 3 4 5 6 7 8
Exper 1
Average
n
iit yyS
1
2
y = 0.8393x + 0.0714
0
1
2
3
4
5
6
7
0 2 4 6 8
n
iiir xaayS
1
210
t
rt
S
SSr
2
Coefficient of Determination
t
rt
S
SSrr
2
Correlation Coefficient
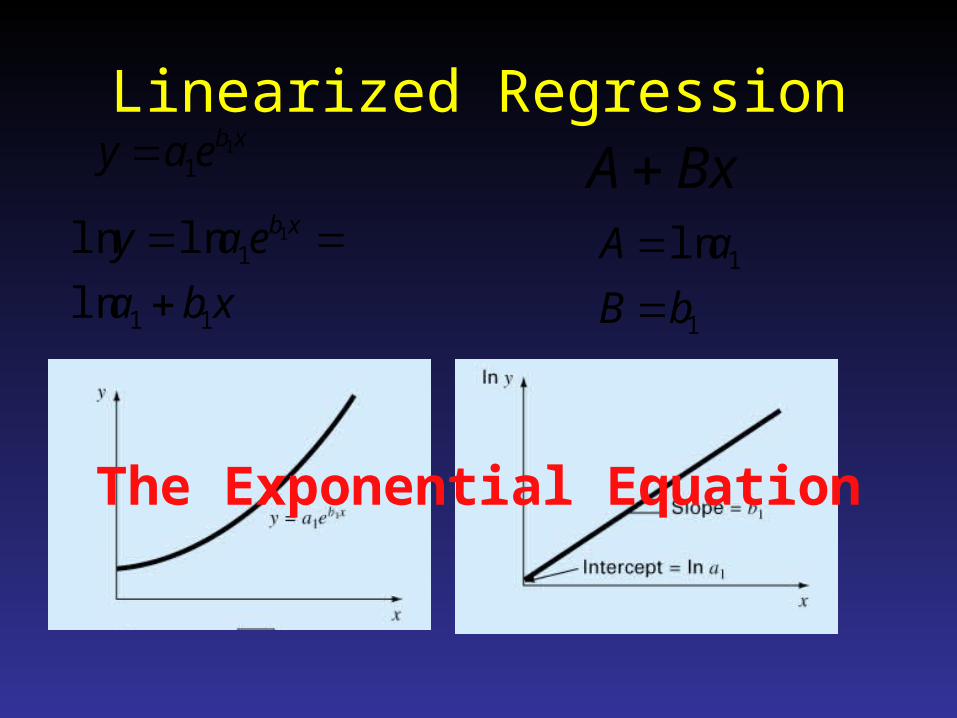
Linearized Regressionxbeay 1
1
xba
eay xb
11
1
ln
lnln 1
BxA
1
1ln
bB
aA
The Exponential Equation
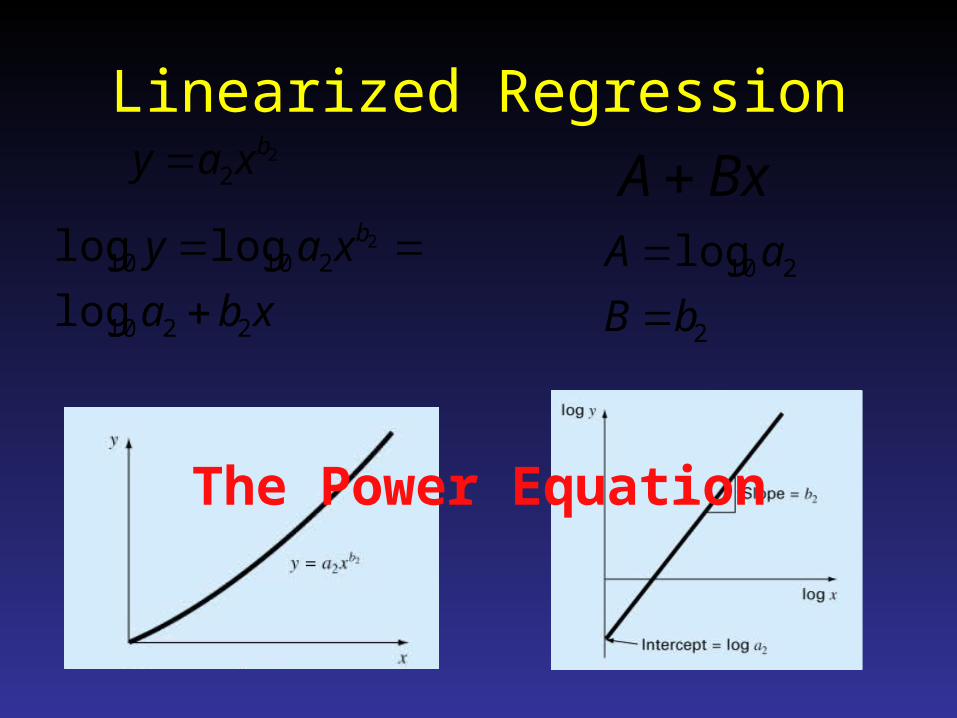
Linearized Regression2
2bxay
xba
xay b
2210
21010
log
loglog 2
BxA
2
210log
bB
aA
The Power Equation
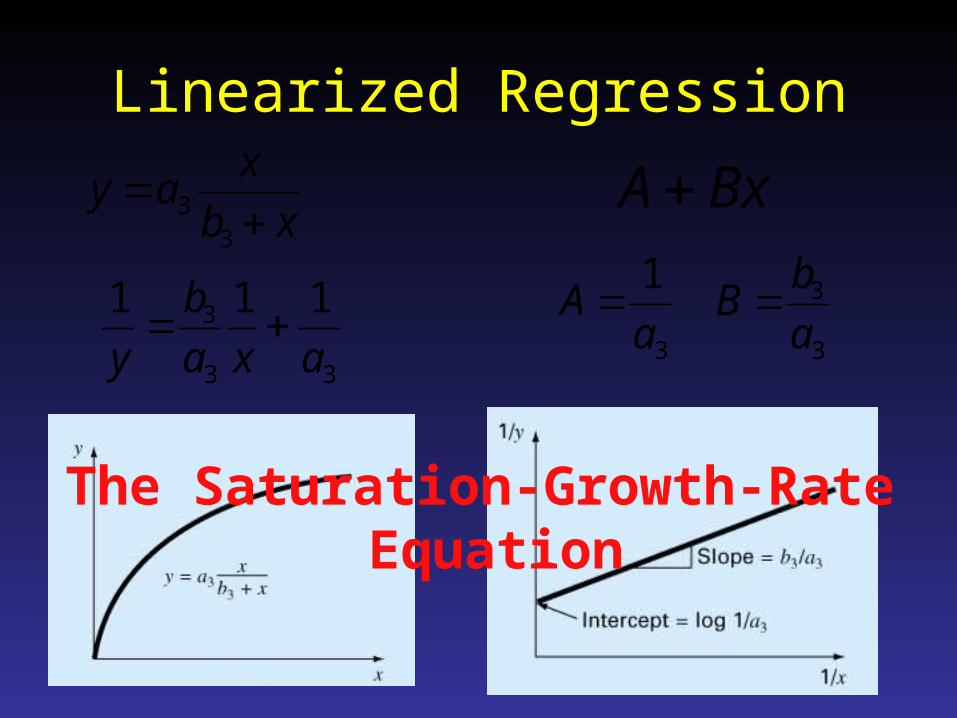
Linearized Regression
xb
xay
33
33
3 111
axa
b
y
BxA
3
3
3
1
a
bB
aA
The Saturation-Growth-Rate Equation

Polynomial Regression
exaxaay 2210
A Parabola is Preferable
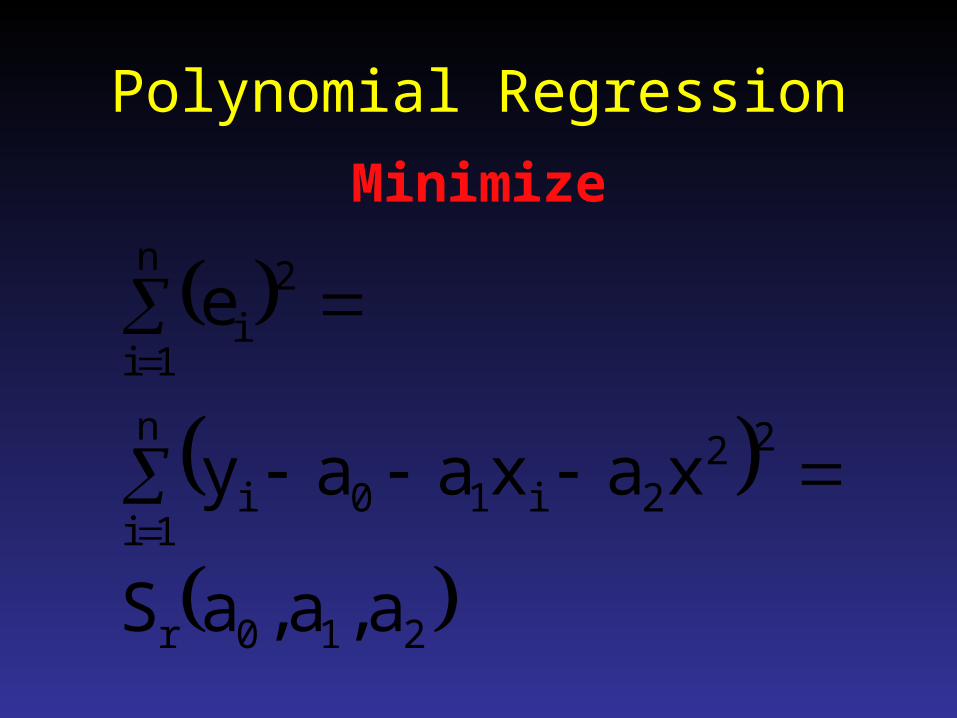
Polynomial Regression
210r
n
1i
222i10i
n
1i
2i
a,a,aS
xaxaay
e
Minimize

Polynomial Regression
0xaxaay2a
a,a,aS n
1i
2i2i10i
0
210r
0xxaxaay2a
a,a,aS n
1ii
2i2i10i
1
210r
0xxaxaay2a
a,a,aS n
1i
2i
2i2i10i
2
210r
Polynomial Regression
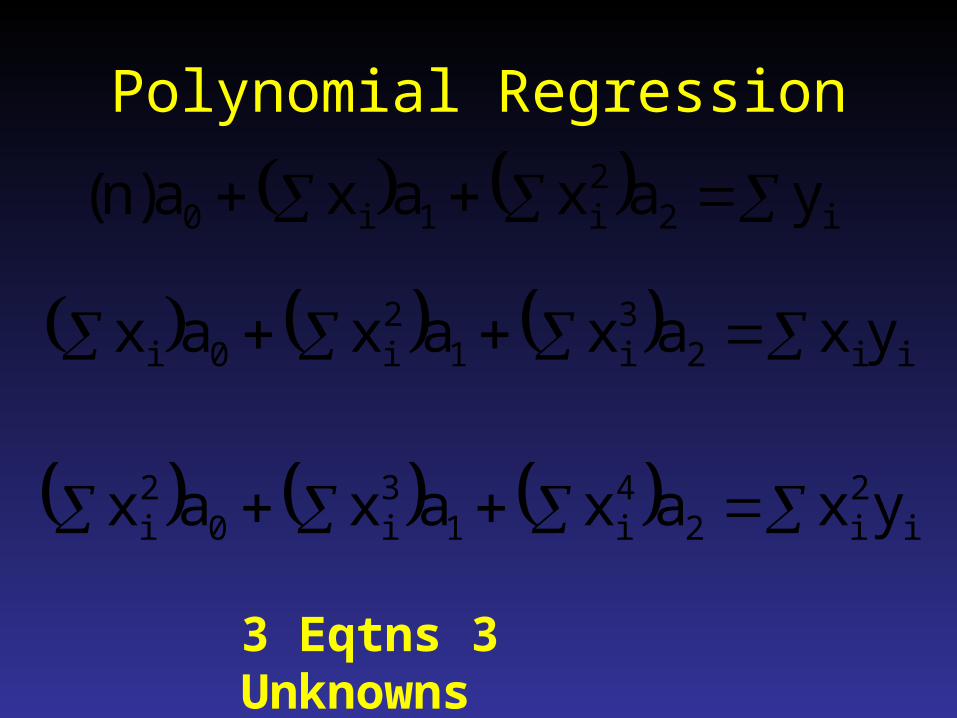
i22i1i0 yaxaxa)n(
ii23i1
2i0i yxaxaxax
i2i2
4i1
3i0
2i yxaxaxax
3 Eqtns 3 Unknowns
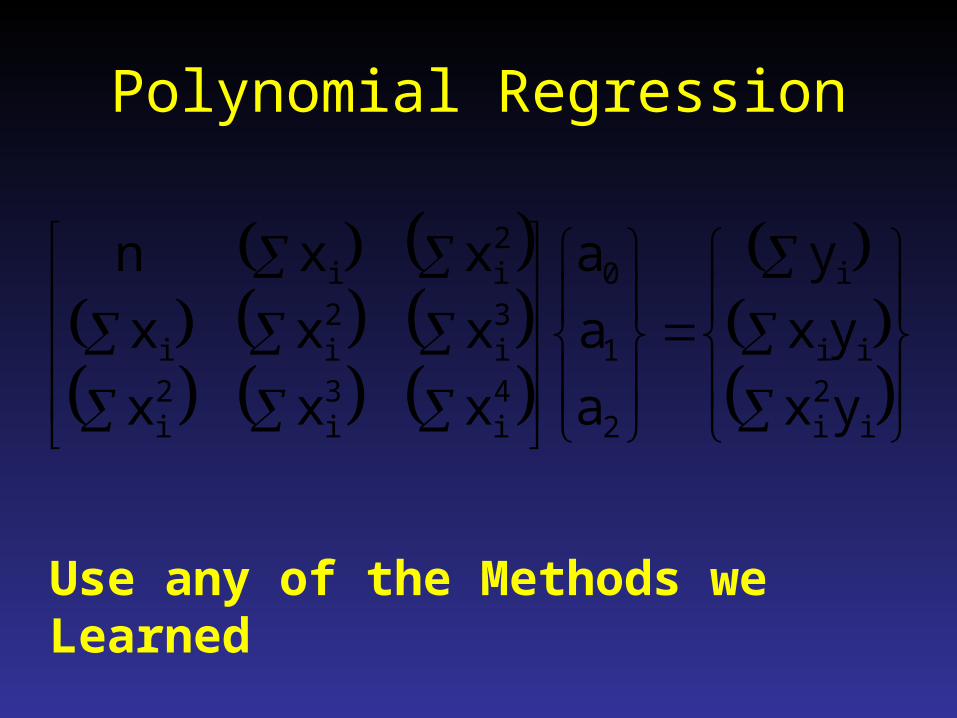
Polynomial Regression
i2i
ii
i
2
1
0
4i
3i
2i
3i
2ii
2ii
yx
yx
y
a
a
a
xxx
xxx
xxn
Use any of the Methods we Learned
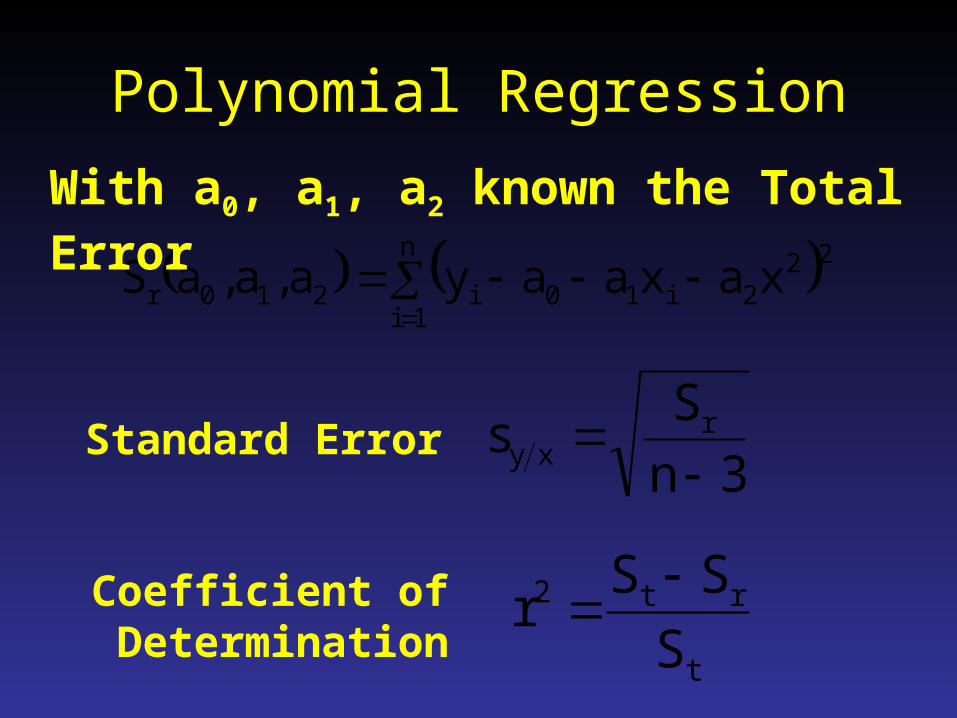
Polynomial Regression
n
1i
222i10i210r xaxaaya,a,aS
With a0, a1, a2 known the Total Error
3n
Ss r
xy Standard Error
t
rt2
S
SSr
Coefficient of
Determination

Polynomial Regression
n
1i
2mmi10im10r xaxaaya,a,aS
For Polynomial of Order m
1mn
Ss r
xy Standard Error
t
rt2
S
SSr
Coefficient of
Determination