ecipe occasional paper • 07/2015 disentangling the …
TRANSCRIPT

Disentangling the Flows of Data: Inside or Outside theMultinational Company?By Erik van der Marel Senior Economist at ECIPE
ECIPE OCCASIONAL PAPER • 07/2015

2
ecipe occasional paper — no. 07/2015
Abstract
This article aims to investigate the patterns of flows in data around the world. It does so by starting from the proposition that data are used as inputs into the production of services and goods in the economy. Using new BEA input output tables in which data usage has a specific mention, this paper computes data intensities of all 6-digit downstream industry sector activities inside the US. This paper finds that not only are sectors such as telecoms and data processing in-dustries using data most intensively, but that in addition data are heavily used as an input within multinational companies with regards to management decisions and with the aim of administer-ing, overseeing and operating establishments across countries. These results are surprising insofar as most of the policy debate to date has focused on the cross-border movement of personal data which is obtained from the interaction between companies and consumers and not so much on companies using business data that are not necessarily personal. This paper also traces who in the world are the biggest traders of these data-intensive management services and provides a first es-timate of how much value-added are traded in management services. In addition, this paper also provides an analysis of which type of countries actually have comparative advantage in trading management services. Finally, a discussion is given on the policy implications regarding the usage of data-intensive services inside firms.
1 Introduction
In today’s world, the flows of data across countries are an additional force of globalisation be-sides the flows of goods, services, people and capital. Although the notion of data is relatively new, many companies use some kind of data in their production process that adds value to their daily activities as part of the so-called digital economy. Economic activities in the digital econ-omy span a wide diversity of goods and services which can vary from digital products to online services and e-commerce to pure cross-border data flows or traditional telecom services and software. The common feature of all these sectors is that value is put to data in their production processes, either as inputs or as output.
However, where exactly are data used and produced inside the economy? Moreover, as data are utilised in the many production activities of firms, where are these data traded across countries? And who has a comparative advantage in trading data? These are some of the issues that this paper tries to uncover by using various data sets currently available.
To date not much is known about the flows of data and only a small set of papers have looked into this area of research. One set of papers investigates the role of the various regulations in data flows and their associated cost effects such as Bauer et al. (2013; 2014) and Christensen et al. (2013). The conclusions of these papers point to the fact that regulatory barriers in the transfer of data across borders are likely to have a detrimental effect on trade, output and employment. Another set of papers looks into the so-called data-enabled trade in services (Meltzer, 2014) or looks into the specific links between data and the role of e-commerce (Martens, 2013). However, none of these papers offers detailed analyses of where data is produced and used.
Therefore, this paper provides an answer to the above-mentioned questions by investigating the role of data produced and used by goods and services industries, and consequently looks at where these goods and services are traded across countries around the world. It does so by first using detailed input-output information that traces to a highly disaggregated level how much value of data input goes into each downstream industry sector covering 6-digits goods and services inside the US economy. Interestingly, we conclude that although many data are unsurprisingly used in sectors such as telecommunications and data processing services, an equally big share of data are actually employed for management purposes inside multinational companies. Secondly, this paper investigates the patterns of trade in management and other data-intensive services using the most recently available data on international trade in services.

3
ecipe occasional paper — no. 07/2015
In addition, since gross figures of trade tell us only one side of the story, this paper also comes up with preliminary calculations that ‘guesstimate’ the amount of value added that is produced and exported regarding these management and other data-intensive services for a typical European country like France. These simple computations show us that although management services themselves do represent only a smaller share of the entire value-added exported in services, they nonetheless can be of equal importance to other services such as finance. However, not all coun-tries tend to specialise in data-intensive management services. Therefore, this paper also tries to uncover what actually determines the fact that some countries have comparative advantage in data-intensive services, including management services, whilst others do not. Finally, a short discussion on the policy implications regarding management services that use data within mul-tinational companies is given at the end of the paper.
This paper is organised as follows. The next section sets out a framework through which one can see the use and production of data in the economy from, respectively, an input (upstream) and output (downstream) perspective. The third section calculated the so-called data intensities of sector by analysing the extent to which data is used as an input in the production of these downstream industries. Next, the fourth section tries to match these data-intensive industries with trade data in an attempt to examine which countries are the main traders of data. Finally, as our results show that a high amount of data is traded inside multinational companies, a policy discussion based on these findings is given in the conclusion of the paper.
2 Where is Data Located?
Data is widely used in all sectors. As products and services become increasingly digitalised, so do their production processes. The way data should be viewed in the production function is still open to much debate. On the one hand, data is provided as an output embodied into a digital product or service such as an online services. On the other hand, data can also be used as a sheer input for many sectors as part of the production, development and delivery of an off-line good or service. Even though in the case of online services the data is directly provided by companies, many other goods and services of the digital economy are in essence non-digital at first sight. However, these non-digital goods and services are much dependent on data which forms the component that is transformed into a valuable contribution in the production process. Without the data, the good or service would economically have less value. One example includes logistics and delivery input services that could not be efficiently supplied without storage, documentation or software data. (Kommerskollegium, 2015). For this reason this paper considers data either as an input or output within the wider economy of goods industries and service sectors, as outlined in Figure 1.
FIGURE 1: DATA USAGE IN THE WIDER ECONOMY
Source: author’s illustrations

4
ecipe occasional paper — no. 07/2015
Figure 1 presents schematically where data is located within the wider economy. It is a simple representation of where sectors that produce and use data for their business practices are placed. Figure 1 shows that data is located both upstream and downstream affecting both input goods and goods as well as final output goods and services as part of the digital economy which is marked in blue. The size of the blue boxes indicates the importance of data in the overall econo-my. Data can be seen as an input in both upstream and downstream industries (above or below the dashed line), and is therefore placed behind the three squares that represent the entire goods and services economy (both upstream and downstream). The paper takes the proposition that once the data is embodied in a good or service, value is created. Only then, data becomes a pro-ductive item in the company’s value chain and becomes part of the digital economy.
As the figure shows, data can be allocated as an input into other input goods in the upstream part of the economy. From this point in the production process, these intermediate input goods are processed further downstream in the economy so that eventually data is embodied in final goods. Examples of this part of the digital economy are for instance intermediate inputs covered by the WTO’s International Technology Agreement (ITA). The ITA Agreement contains industries (or HS-lines) which can be assessed as final goods or as intermediate inputs. For instance, Miroudot et al. (2013) show that around 56.3 percent of the Electrical Machinery and Apparatus industry (ISIC 31) are intermediate input as defined by the Harmonized Systems (HS) classification of trade. Other industries where many intermediate inputs are present which are covered by the ITA Agreement include products in Radio, Television and Communication Equipment, or the Other Non-Metallic Mineral Products. On average, the authors estimate that around 41 percent of the products covered by the ITA Agreement are intermediate inputs.
A second set of data that is integrated into goods and forms part of the digital economy are products which consist of the final output goods or form part of the downstream economy. This means that although some intermediate inputs which use data can be further processed into downstream industries, a significant part of data is also directly used in goods that the downstream industry produces. In large part these are the final goods represented in the ITA Agreement. For instance, a majority of the products produced in the Machinery and Equipment industry are actually final (downstream) goods. In a similar manner, many final goods as covered by the ITA Agreement can also be found in the Medical, Precision and Optical Instruments industry. Together, Miroudot et al. (2013) estimate that around 60 percent of the items covered by the ITA Agreement can be considered final products.
A significant amount of data are also used in services. Examples include data used in the tele-com services sector or in the computer and information services sector. Many of these services are used as inputs for further production into downstream goods industries, which is indicated by the cornered arrow in Figure 1. Services that use a lot of data and which are located rather upstream in the economy vary widely from telecoms, data processing services, financial services (including insurance), IT consulting, to data storage and system integration services, but also marketing research services, etc. These services are often used in the production process of down-stream companies which in turn produce final goods or services. As a matter of fact, a substantial amount of intermediate services are actually used in final services themselves. For a typical devel-oped country this number increases up to around 60 across all services sectors.
In addition, upstream services which are produced can at the same time also be consumed as a final output service. For instance, next to being used as an input in the production chain a sub-stantial part of the telecom services sector are also used by final consumers. Personal services such as educational services which are consumed by final consumers also use a large amount of data in their production and delivery. Moreover, there are other services sectors as part of the digital economy which have emerged over the last decade. These services vary from online services, to web portals, search engines, internet or Over The Top (OTT) services, e-commerce, or software services. They are often consumed by users directly, but can also be used in the production pro-cess of other downstream goods and services firms.
The common ground of each of the three blue blocks in Figure 1 is that each goods or services item used or produced data so that value is added into the wider economy. It is in the process that data forms a productive element in the production processes of companies providing these goods and services.

5
ecipe occasional paper — no. 07/2015
3 Who Are the Producers and Users of Data?
3.1 Who are the Producers?
As the previous section showed, there are many users of data which vary from producers of goods, services, and agricultural products. However, not all companies use data to an equal extent and large variation exists in the usage of data across sectors. This section will investigate which sectors are the main producers and hence users of data in the wider economy. This part of the analysis will rely on the Bureau of Economic Analysis (BEA) Input Output Use data tables which provide detailed information on which disaggregated sector uses how much input value from other sectors, including data and data services. By doing so we select a small sub-set of sectors which have as their main activity producing and developing data, which can therefore be assessed as core-sectors which provide data as a final output. In order to get a precise picture, these sectors are selected at the most detailed level provided by the BEA, namely at 6-digit level as provided in Table 1. Admittedly, since all categories are services, they exclude goods covered under the ITA. Yet, as discussed in the next section, manufacturing and agricultural goods are mainly users of data and not producers.
TABLE 1: SECTORS COVERING PRODUCERS OF THE DIGITAL ECONOMY
Source: Bureau of Economic Analysis (BEA)
Table 1 shows that only eight sectors are selected as key sectors providing data and which are therefore considered as the main producers of data in the digital economy. As such, they pro-vide inputs (or final output) to other downstream users or final output industries. These digital sectors vary from software publishers to internet publishing or web search portals, or telecom-munication carriers. Undoubtedly, there are more sectors that develop data in the domestic economy but preference is given to holding on to a stringent selection of core data sectors as the majority of tasks inside each of these 6-digit industries is actually dedicated to developing and therefore producing data. For instance, in Table 1 software publishers are companies engaged with the design, development and publishing of computer software with the use of data. These companies have as a primary business goal to carry out operations necessary for the production and distribution of software. This sector includes items such as games, operating systems soft-ware, programming languages as well as compiler software publishers, amongst other software publishing items.1
1 The explanations below provide descriptions of the 6-digit sector as given in Table 1 and follow closely the US Census explanations of the NAICS classifications system.
IO code Sector description
511200 Software publishers517110 Wired telecommunications carriers517210 Wireless telecommunications carries (except satellite)518200 Data processing, hosting, and related services519130 Internet publishing and broadcasting and Web search portals541511 Custom computer programming services541512 Computer systems design services541513 Other computer related services, including facilities management

6
ecipe occasional paper — no. 07/2015
The telecommunications sector is divided into two segments, namely wired and wireless. The former holds activities related to the operation and/or provision of access to transmission facili-ties or other infrastructure. These transmission facilities and infrastructure are owned by the tele-com companies for sending voice, data, text, sounds, and video using wired telecom networks. In addition, the telecom companies operate and use the network to provide a wide range of services such as wired telephone services, VoIP services, audio and video programming distribution, plus wired broadband internet services. This category also includes online access service providers using their own operated wired telecom infrastructure. The wireless telecom category entails activities which are related to operating and maintaining switching and transmission facilities in order to provide communications services via the airwaves. Having obtained so-called spectrum licences companies can provide services using this spectrum, which include phone services, pag-ing services, wireless internet access, and wireless video services.
Both Data processing, hosting and data-related services in addition to Internet publishing and broadcasting including web search portals services cover a wide variety of data-related services. The Data processing, hosting and related services sector is engaged in providing infrastructure for hosting or data processing. Companies in this sector provide web hosting, streaming services or application hosting in addition to application service provisioning. They also include operations such as the provision of complete processing and specialised reports from data supplied by cli-ents or the delivery of automated (including electronic) data processing and data entry services. Internet publishing and broadcasting (including web search portals) are separated into those activities which are publishing and broadcasting content exclusively on the internet whereas web search portals are websites that use a search engine to generate and maintain extensive databases of internet addresses and content in an easily searchable format. The Internet publishing and broadcasting companies do not provide non-internet versions of content services, but provide text, audio and/or video content through the internet only. Web search portals can in addition provide other services such as e-mail, auctions, news, and connections to other websites.
The last category under which the last three sectoral activities fall covers all tasks that provide expertise in the field of information technology through (a) writing, modifying, testing, and supporting software, (b) designing computer systems that integrate hardware, software and com-munication technologies, (c) onsite management and operations of clients’ computer systems and/or data processing facilities, and finally (d) other technical computer-related services. These sectors include a host of other services such as software analysis, webpage design services, and programming services, computer-aided design, engineering and manufacturing (CAD, CAE, CAM) systems integration design services, local area network (LAN) computer systems integra-tion design services, or data processing facilities management and operation services.
3.2 Who are the Users?
Through selecting these producers of data it is possible through the use of the BEA input-output table to examine who are the users and how much they use the data-related services as defined in Table 1. National input-output tables give a good measure of how many units of input from each of these data services are used by every downstream goods and services industry sector in an economy. Although ideally input-output information of all countries should be analysed, in reality this is not possible as most national tables are too aggregated in its classification and most often provide different classification schemes. Therefore, the US national input-output tables from the BEA are selected for this exercise. Two reasons stand out for this choice. The most important reason is that these tables are the most detailed worldwide which does include the disaggregated data sectors as described above. The second reason is because the tables’ industry classification fits perfectly with the NAICS classification of sector description which can easily be matched with trade data in the next section.2
2 Note that using US input-output tables for calculating any kind of intensities (such as capital, labour or insti-tutional intensities) so as to provide prediction of other countries is a common exercise in the empirical trade literature.

7
ecipe occasional paper — no. 07/2015
For performing the calculations, the 6-digit input use table is selected against producers’ prices value from the Economic Accounts of the BEA which provides input use figures for 389 industry groups, including both services and goods sectors as well as agriculture and mining. These de-tailed industry groups are further sorted according to 71 3-digit combined industry groups and also higher up into 15 aggregated 2-digit industry groups. The share value of data usage as part of their total input usage from the data-producing sectors in Table 1 is calculated for each 6-digit disaggregated industry sector. Then, in order to aggregate these detailed sector classifications into higher group sectors (either 3-digit or 2-digit), an unweighted average is computed. Figure 2 summarises the results by each 2-digit sector and hence shows the main users of the services provided by data producers.
FIGURE 2: SECTORS COVERING USERS OF THE DIGITAL ECONOMY
Source: author’s calculations, using BEA
Unsurprisingly, sectors which use data most intensively are precisely those sectors which are also the producers of data services as part of their output production. Figure 1 shows that telecoms and data processing services, internet publishing and web portals, together with publishing ser-vices (including software) and motion pictures services is the sector category that absorbs the greatest share of data. In other words, those who produce data are also the ones that use data. On average this amounts to a data input usage of almost 14 percent. However, a more surprising result from Figure 2 is that many of these data services actually appear to be used for man-agement purposes inside companies. This is visible by the fact that in Figure 2 the category of management of companies and enterprises accounts also for a high share of data usage, namely 13.1 percent. Moreover, this number is almost equal to the data usage of data services sectors themselves. It indicates that data plays a crucial role in the process and development of firms’ management strategies and execution of their affiliates and establishments (see Box 1).

8
ecipe occasional paper — no. 07/2015
Other sectors which are important users of data are administrative services which includes ser-vices such as office administrative services, employment services or business support services. These services are also essential for the workings of a firm, but are most likely outsourced and then provided by external services suppliers and do not constitute an important factor in the management decision of companies. The data input usage of these sector totals an average num-ber of almost 10 percent. Next are business and professional services, which use data up to around 7 percent. These types of services are different from office administrative services in the sense that they cover professional services. Examples include legal services, computer systems de-sign and related services, and services such as accounting, engineering, management consultancy services, but also market research and research and development services. These services are also usually provided to the company from an external source.
A second somewhat surprising result is that Educational services is also a big user of data, even bigger than the Financial and insurance sector. The Education sector absorbs a close to 6 percent of data as part of the total input use whereas the Financial sector’s data usage is 5.4 percent. This is unexpected in the sense that so far the policy literature has emphasised the critical role of data in the development of the Financial services sector. It seems according to Figure 1 that data is likely to play an equally important role in the development of the educational sector. Included in this category of educational services are Colleges, universities and professional schools, but also business schools and computer and management training, and elementary schools and junior colleges.
The next categories that use data somewhat intensively are Real estate, renting and leasing activ-ities, Wholesale trade, Retail Trade, Arts and recreational services, together with Warehousing and storage services, General merchandise stores and Utilities. Most of these services use data as an input that varies more or less between 2 to 4 percent. On the whole, all these sectors which report a high level of data usage are services and the first goods sector listed in Figure 1, namely the Metals, machinery and electronics sector uses on average only 1.4 percent. Some disaggre-gated industry sectors, however, are rather data intense such as the support activities for printing (NAICS 323120) with a usage of 9.1 percent or the upholstered household furniture manufac-turing (NAICS 337121) with an input intensity of 5.3, but these goods sectors are rare. Across all detailed manufacturing sector, the data input usage is 1.2 percent as Table A1 in the Annex shows. Furthermore, Table A2 in the annex gives a list of the 20 disaggregated 6-digit sector categories that use data most.
Box 1: Management of Companies and Enterprises
The BEA’s input output tables are classified under their own approach which precisely fol-lows he NAICS classification system, i.e. NAICS 55000. Under this category two separate groupings are comprised, namely (1) establishments that hold shares or securities of compa-nies and enterprises. The purpose of holding these securities is to influence management de-cisions or owning a controlling interest; and (2) establishments that administer, oversee, and manage affiliates of the company or enterprise. These establishments undertake the strategic and/or organisational planning and decision-making role of the company or enterprise. The establishments under (2) may also hold the shares or securities of the company or enterprise.
The purpose of this output sector is to consolidate the performance of essential activities in-house so that economies of scale can be achieved. Economies of scale are achieved through management and organisational decisions that will lead to a long-term average cost reduction of the company. In other words, the cost per unit of output of the company or enterprise will decrease due to an increase of scale so that fixed costs can be spread out over many unit outputs. These cost advantages due to economies of scale arise because of the efficient orga-nisation of the firm whilst increasing its scale or size.
Source: BEA, Bureau of Labor Statistics, author’s explanations.

9
ecipe occasional paper — no. 07/2015
4 Where in the World are Data-intensive Services Flowing?
4.1 Who Holds the Largest Trade Shares in Data-intensive Services?
Since most of the data intensities are to be found in services, we make use of the World Bank’s new services trade database called Trade in Services (TIS) database to explore which sectors hold the biggest shares of trade in data-intensive services. This database is the most advanced source of information on services trade across the world bringing together data from various databases. Using mirror techniques, the TIS database has come up with a coherent collection of bilateral trade flows from the OECD, Eurostat, the UN and the IMF. As such, it provides a consolidated and reconciled version of multiple sources of bilateral data in trade in services, and currently is the best of its kind (see Saez et al. (2015) for further insights).
As Meltzer (2014) points out, a lot of the services trade in the world takes place across the Atlan-tic. This is also visible in Table 2, which uses the TIS data and reports trade data in gross values for both the EU and the US in addition to the rest of the world (ROW). Table 2 sorts out the various sector classifications for which there is trade data available for the data-intensive services sectors given in Figure 2. Note that services trade data is not available for all sectors mentioned in Figure 2. As a result, Table 2 is restricted to services sectors only, which can be justified by the fact that goods industries only use a small share of data in their input structure as shown in the previous section. Moreover, although the TIS database does report flows on personal services such as educational services or art, entertainment and recreation services, it is extremely hard for statisticians to actually collect trade data for these services. Therefore, some data in these services sectors may be omitted so that trade shares may appear to be low.
Table 2 indeed shows that most of the trade in data-intensive services sectors are captured by the EU and the US, but large differences arise. In fact, the US only holds a smaller trade share of these sectors. For instance, the highest US share in world trade is Publishing, Motion, Telecom and Data processing, which is in line with what we would expect as the US holds one of the world’s largest multinationals in this field. Yet, the US share is less than the world share held by the EU which shows a trade share of 40.2. Other sectors in which the US holds a large world trade share are administrative services, business services and financial services. But here too, these figures are also lower compared to the EU. Therefore, an additional robustness check is per-formed in Table 2 in that the mean share of all three regions are compared with aggregate services trade data provided by the World Bank’s World Development Indicators. Table 2 shows however that differences between these two sources are relatively small, and hence the low trade shares of the US relative to the EU seem to be consistent across the two databases. Taken together, the figures point to the fact that on average a much larger share of sectors using data most intensively are actually captured by the EU.
An interesting case in point is the trade share capture in Management services between related enterprises. Table 2 shows that also in this sector the EU captures a much bigger trade share than the US. This category of trade in Management services between related enterprises is the closest definition that follows the BEA’s IO classification of Management of companies and enterprises as in Figure 2 and can therefore offer some insights into the trading patterns of this data-in-tensive sector. As Box 2 explains, this category includes services flowing from the parent to the affiliate enterprise company and vice versa and relates to the planning, organisation, and control of these enterprises, i.e. management services. Hence, these are flows of services activities which are taking place inside multinational companies, and which are on average very data intensive as outlined in the previous section. Box 2 below provides a more detailed discussion of what type of services are included in this category within the TIS database.

10
ecipe occasional paper — no. 07/2015
TABLE 2: TRADE SHARES BY EU, US AND ROW (REST OF WORLD) (2012)
Source: TIS and WDI, EU figures are based on extra-EU trade with the world.
What kinds of tasks are involved in management services? To gain further insight in this area, the US Bureau of Labor Statistics (BLS) gives a more precise picture of what the occupations inside this services sector actually are. The Occupational Employment Statistics database of the BLS is part of the US Department of Labor and records the share of occupations for each 6-digit NAICS category that matches exactly with the management services sector category in Figure 2. It therefore provides a clearer picture of which specific services tasks are actually traded inside the sector of management services. Among the major tasks grouped together in this sector, they relate to (in percentage terms of total amount of occupations) Business and financial operations (21.8%), Management occupations (20%), Computer Occupations (10.5%), or Administrative support services (25.8%), which together comprises almost 80 percent of all occupations in this sector. Interestingly one can see activities are closely related to business services activities recorded in Table 2 but are now traded within related companies. On a more detailed level, these in-house business activities include occupations such as Bookkeeping, Accounting and Auditing Clerks, Financial managers, as well as First-line supervisors / Managers of office and administra-tive support workers. They also cover General and occupational managers and Business opera-tions specialists together with Market research analysts and Marketing specialists, Management analysis, and even Human resources activities.
IO code 2-digit Industry description EU US ROW
51 Publishing, Motion, Telecom, and Data processing 40.2 29.6 30.2
55 Management of companies and enterprises 66.6 12.0 21.3
56 Administrative support services, incl waste man 35.5 25.8 38.7
54 Professional and business services 30.1 22.7 47.2
61 Educational services 76.8 4.5 18.7
52 Financial and insurance services 39.1 25.4 35.5
42 Wholesale trade / Distribution 43.1 2.5 54.4
62 Health care and social assistance 57.0 7.5 35.5
71 Arts, entertainment and recreation services 49.9 5.8 44.3
72 Accommodation and food services 16.8 19.3 63.9
48 Transportation services 29.9 10.7 59.5
23 Construction 25.3 3.5 71.2
Mean 42.5 14.1 43.4
Mean WDI 39.8 13.2 47.0
11
ecipe occasional paper — no. 07/2015
Box 2: Services Transactions between Related (affiliated) Enterprises
The Manual on Statistics of International Trade in Services 2010 (MSITS2010) states that trade in services transactions between related enterprises are recorded separately from unrela-ted enterprises. In the Extended Balance of Payments Services Classification (EBOPS2010), which is consistent with the balance of payments classification but is more detailed, this category of transactions between related enterprises are recorded under the 3-digit code 285.
The category of trade in services between related enterprises therefore provides information on the value of services which are flowing between affiliated companies or enterprises in which a direct investment has taken place. It includes payments from the parent company to the affiliate establishment and vice versa, which are related to the planning, organisation, and control of the company establishments, subsidiaries, associates or parent company. The-se payments hence related to the general management costs of the related enterprises.
As such this category sums up all types of services transactions, and is not recorded for each services sector separately. Neither are contracts to another (specialist) company that provides services which were previously supplied in-house involved, i.e. so-called outsourcing. These latter types of services are usually recorded in the appropriate sector classification within EBOPS according to the type of services.
Source: MSITS2010, author’s explanations
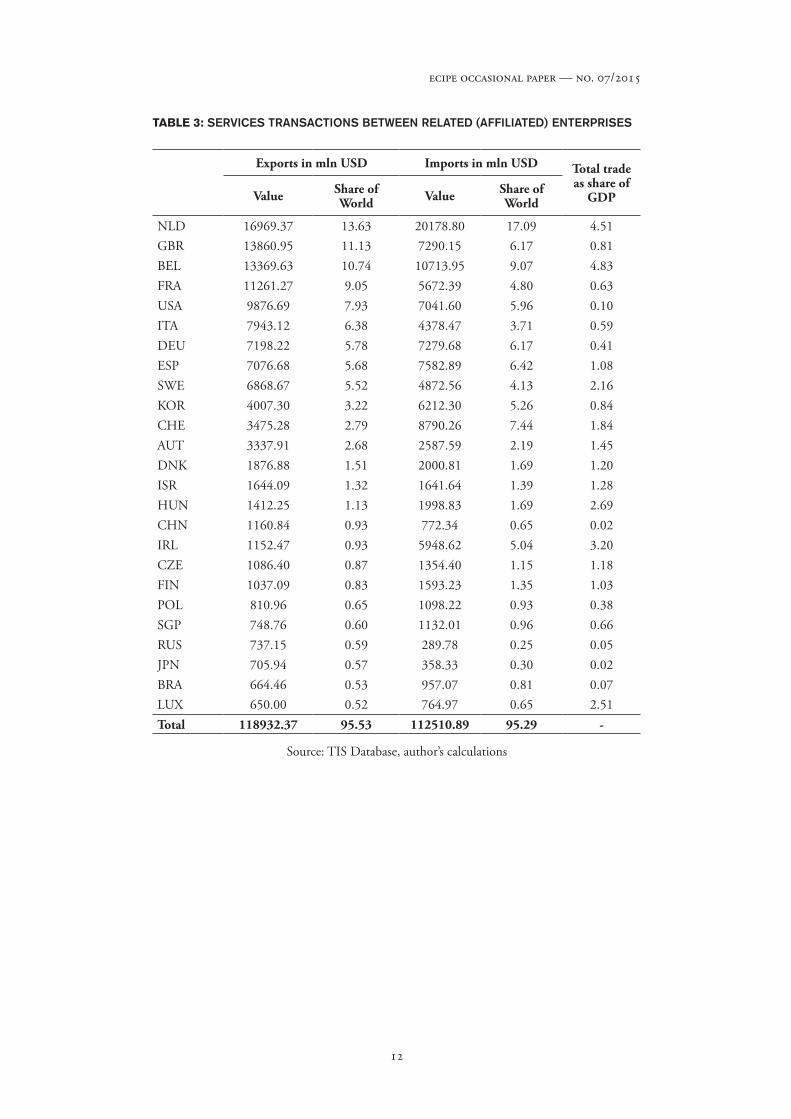
Consequently, the trade flows across countries in these occupations between affiliated enterprises are recorded within the category as outlined in Box 2 using the TIS database. Table 3 gives an overview of which countries are the biggest traders in this field both from the import as well as the export side. The table summarises a list of countries which together represent around 95 percent of the total trade in management services between related enterprises worldwide. As the table shows, most countries are developed countries, but some emerging countries are also listed such as China, Russia and Brazil. The largest traders in this services sector are the Netherlands, Great Britain and Belgium with respectively 13.6, 11.1 and 10.7 percent shares in the world. For smaller countries such as the Netherlands and Belgium, the total trade share (including im-ports) is more sizable and represents respectively 4 to 5 percent of their national Gross Domestic Product (GDP). Other countries for which the services trade between related affiliates form a significant part of their domestic economies are also relatively small, such as Ireland, Hungary and Luxembourg.
Among the larger countries, some European countries such as France, Italy and Spain have shares of services trade in affiliated enterprises which are also relatively large compared to their econom-ic size, particularly compared to other large economies such as the US or Germany. These latter two countries (and especially the US) show low shares relative to their economies although their nominal figures remain strong. One potential explanation for the high average share of European countries compared to the US is the world distribution of outward FDI stocks: whereas the EU holds a stake of around 40 percent, the US has a relatively smaller share of outward stock in the world of around 24 percent (UNCTAD, 2014). Hence, this may well be reflected in the US holding a lower share in services within multinationals worldwide. Yet, both smaller and bigger countries capture a large share of world flows in management services within companies. This points to the fact that other factors apart from the structural determinants such as market size play a role in facilitating the data-intensive flows of these services. One obvious candidate is the digital infrastructure that helps companies to transmit data-intensive services. The next section will analyse this question in greater detail.
12
ecipe occasional paper — no. 07/2015
TABLE 3: SERVICES TRANSACTIONS BETWEEN RELATED (AFFILIATED) ENTERPRISES
Source: TIS Database, author’s calculations
Exports in mln USD Imports in mln USD Total trade as share of
GDPValue Share of World Value Share of
World
NLD 16969.37 13.63 20178.80 17.09 4.51GBR 13860.95 11.13 7290.15 6.17 0.81BEL 13369.63 10.74 10713.95 9.07 4.83FRA 11261.27 9.05 5672.39 4.80 0.63USA 9876.69 7.93 7041.60 5.96 0.10ITA 7943.12 6.38 4378.47 3.71 0.59DEU 7198.22 5.78 7279.68 6.17 0.41ESP 7076.68 5.68 7582.89 6.42 1.08SWE 6868.67 5.52 4872.56 4.13 2.16KOR 4007.30 3.22 6212.30 5.26 0.84CHE 3475.28 2.79 8790.26 7.44 1.84AUT 3337.91 2.68 2587.59 2.19 1.45DNK 1876.88 1.51 2000.81 1.69 1.20ISR 1644.09 1.32 1641.64 1.39 1.28HUN 1412.25 1.13 1998.83 1.69 2.69CHN 1160.84 0.93 772.34 0.65 0.02IRL 1152.47 0.93 5948.62 5.04 3.20CZE 1086.40 0.87 1354.40 1.15 1.18FIN 1037.09 0.83 1593.23 1.35 1.03POL 810.96 0.65 1098.22 0.93 0.38SGP 748.76 0.60 1132.01 0.96 0.66RUS 737.15 0.59 289.78 0.25 0.05JPN 705.94 0.57 358.33 0.30 0.02BRA 664.46 0.53 957.07 0.81 0.07LUX 650.00 0.52 764.97 0.65 2.51Total 118932.37 95.53 112510.89 95.29 -
13
ecipe occasional paper — no. 07/2015
4.2 Where are Data-intensive Services Flowing?
Although the ranking in Table 2 is dominated by European countries and the US, some non-transatlantic countries are also included in the list. One can see that for instance Korea holds an important share of Management services compared to some other European countries. Moreover, other emerging countries such as China, Russia, Brazil and Israel also appear to be countries which capture a sizable share of imports and exports in management services between affiliated enterprises despite the fact that the share of GDP is still comparatively low. On the whole, it therefore looks as if smaller countries are in a better position in holding world shares of trade in this type of services. On the other hand, however, smaller countries are generally more catered towards specialisation in services in general as a large majority of their economic activities are comprised of this sector. This also counts for other data-intensive services such as business and administrative services. Seeing the specialisation pattern in this light, services between re-lated enterprises is just a part of the overall services sector and therefore finds a natural place in smaller economies.
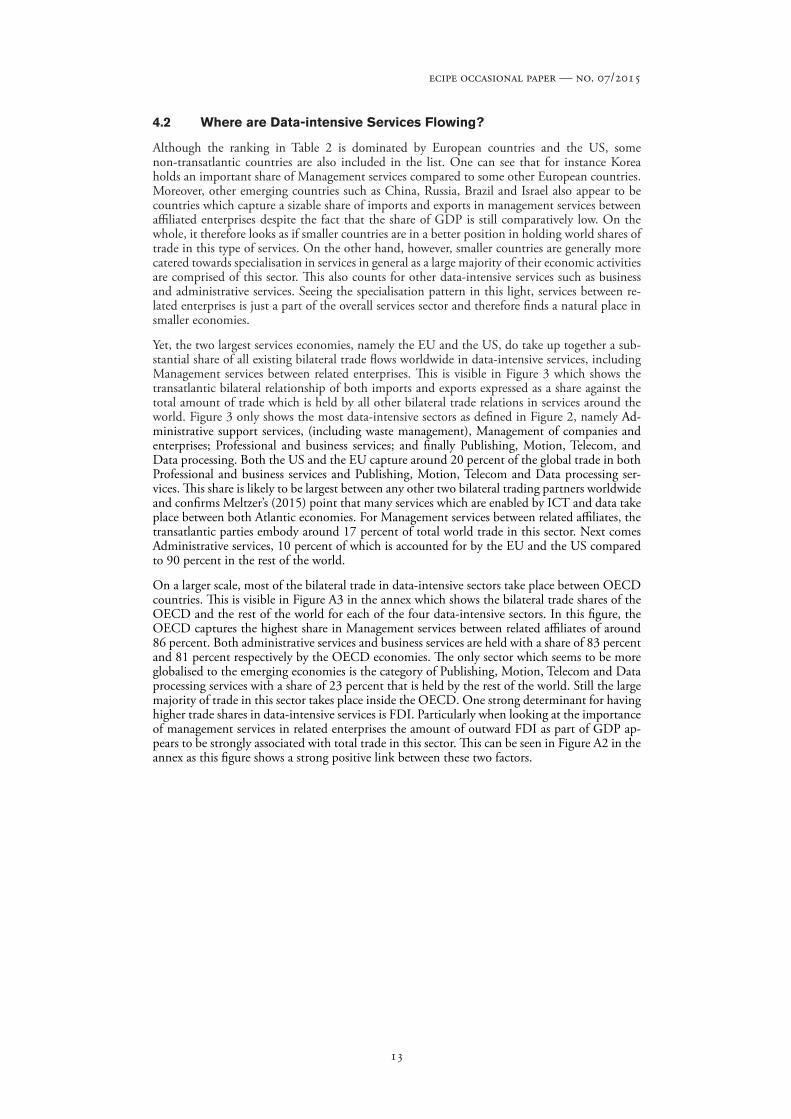
Yet, the two largest services economies, namely the EU and the US, do take up together a sub-stantial share of all existing bilateral trade flows worldwide in data-intensive services, including Management services between related enterprises. This is visible in Figure 3 which shows the transatlantic bilateral relationship of both imports and exports expressed as a share against the total amount of trade which is held by all other bilateral trade relations in services around the world. Figure 3 only shows the most data-intensive sectors as defined in Figure 2, namely Ad-ministrative support services, (including waste management), Management of companies and enterprises; Professional and business services; and finally Publishing, Motion, Telecom, and Data processing. Both the US and the EU capture around 20 percent of the global trade in both Professional and business services and Publishing, Motion, Telecom and Data processing ser-vices. This share is likely to be largest between any other two bilateral trading partners worldwide and confirms Meltzer’s (2015) point that many services which are enabled by ICT and data take place between both Atlantic economies. For Management services between related affiliates, the transatlantic parties embody around 17 percent of total world trade in this sector. Next comes Administrative services, 10 percent of which is accounted for by the EU and the US compared to 90 percent in the rest of the world.
On a larger scale, most of the bilateral trade in data-intensive sectors take place between OECD countries. This is visible in Figure A3 in the annex which shows the bilateral trade shares of the OECD and the rest of the world for each of the four data-intensive sectors. In this figure, the OECD captures the highest share in Management services between related affiliates of around 86 percent. Both administrative services and business services are held with a share of 83 percent and 81 percent respectively by the OECD economies. The only sector which seems to be more globalised to the emerging economies is the category of Publishing, Motion, Telecom and Data processing services with a share of 23 percent that is held by the rest of the world. Still the large majority of trade in this sector takes place inside the OECD. One strong determinant for having higher trade shares in data-intensive services is FDI. Particularly when looking at the importance of management services in related enterprises the amount of outward FDI as part of GDP ap-pears to be strongly associated with total trade in this sector. This can be seen in Figure A2 in the annex as this figure shows a strong positive link between these two factors.

14
ecipe occasional paper — no. 07/2015
FIGURE 3: THE BILATERAL SHARE OF TRANSATLANTIC TRADE IN SERVICES AND THE REST OF THE WORLD (2012)
Source: TIS Database, author’s calculations; Administrative stands for Administrative support services, incl waste management; Management stands for Management of companies and
enterprises; Professional stands for Professional and business services; and finally Publishing stands for Publishing, Motion, Telecom, and Data processing
4.3 Where is the Value-added in Data-intensive Services?
As stated by the OECD (2013), trade figures as presented in the previous figures are based on gross terms and would therefore miss out the real value-added of exports. This is because gross trade includes double-counting of trade flows and does not measure the exports of what is actu-ally domestically produced. Countries more often produce services at home which are then used as an input into other downstream goods (and services) production in order to be (indirectly) exported. Counting in gross terms would hence understate the importance of services, includ-ing data services. This is why the OECD has come up with a new data set measuring the exact value-added of goods and services which are produced and hence directly or indirectly exported. Overall, this means that on the basis of value-added in the US for instance, the significance of services increases to almost 50 percent with particular importance to US downstream sectors such as Wood and Paper, Transport Equipment or Food Products. In the EU this share lies cur-rently above 50 percent where services value-added are an important ingredient for Transport Equipment and Food Products in addition to Electrical Equipment and Textile and Apparel.
However, how much value-added of data-intensive services is carried along through the up-stream and downstream economy? To take stock of most of the important data-intensive services as defined in the previous analysis, Figure 4 presents a breakdown of the value-added of services (of which data-intensive services are a part) for a typical European country, namely France. Based on gross trade figures from the TIS database and using value-added figures from the TiVA database, a rough estimate can be calculated and presented that reflects the share of manage-ment services between affiliates as part of the overall Business services sector. Such an estimate

15
ecipe occasional paper — no. 07/2015
is obtained through a simple back-of-the-envelope calculation in which the ratio of value-added against gross values of the same service category are taken and computed. Admittedly, this is a crude measure but it is only a first step for the purposes of this paper to provide an approxima-tion on the importance of management services. Note that the TiVA database sums up other sectors together such as transport and telecom services which are not in Figure 4 separated from each other. Other sectors such as distribution and financial services are also taken into account in the TiVA database.
FIGURE 4: VALUE ADDED SHARE OF VARIOUS DATA-INTENSIVE SERVICE FOR FRANCE (2009)
Source: TiVA database; TIS database, author’s calculations
Figure 4 sets out the results and shows that for a country like France its total economy takes up a value-added share of services of more than 40 percent which is close to the OECD’s average of 48 percent. Within this services sector, one can see that Business services take up the largest share of value-added at around 15 percent. Other large services sectors that produce and export value-added are the distribution sector together with the transport and telecom sector. Note that the latter sector together with Business services (which also accounts for administrative support and professional services) are considered data-intensive sectors. Management services between related affiliates has a share of 2.4 percent which is more or less comparable with the amount of value-added the Financial services in France produces and brings forward in the entire French economy. As such, this sector forms a non-negligible part of the value-added production in the French economy and which, together with all other services sectors that are intensive in data, shows the importance of data as an enabler to reap value-added from these sectors. Of course, the importance of each of these sectors varies between different economies. Yet, in most devel-oped countries, sectors such as business services, telecoms, finance and management are much dependent on data and form an important factor for their economies.

16
ecipe occasional paper — no. 07/2015
In sum, both the producers of data services and users of data services are situated everywhere across the globe, and so are flows of data. Both the EU and the US, and especially developed OECD countries overall, capture a large market share when it comes to trade in services which produce or use data, the so-called data-intensive services or digital services. In fact, both the US and EU countries capture the majority of these very data-intensive services trade. Together the transatlantic economy shares around 20 percent of the total data trade that is flowing between their respective markets. Surprisingly, the data tell us that a second important services sector that is using a lot of data in its production process is management services between related enterpris-es, i.e. transactions between related affiliates, which are so far perhaps overlooked in the litera-ture. When looking at these categories, both smaller as well as bigger countries are large traders of data-intensive services, although the importance of these services tend to increase adversely with the size of the economy.
5 Who has Comparative Advantage in Data-intensive Sectors?
5.1 Who is Revealed to Have Comparative Advantage in Data-intensive
Services?
The fact that the economic importance of services, and also data-intensive services, increases for smaller countries does not necessarily mean that they have comparative advantage in these digital services. Comparative advantage is defined as the relative productivity premium that countries have in producing and trading a particular sector because they can provide the right institutions, endowments, institutional or investment climate on which industries can capitalise so as to increase the efficiency of their production processes. In other words, there is a right ‘match’ between what a country can provide and what an industry or sector needs in terms of input components. This can come in many forms. Some sectors need a strong rule of law because their sectors are sensitive to hold-up problems and therefore require strong contract enforcement mechanisms, other sectors are dependent on the availability of high-skilled or technological la-bour, and other sectors are likely to settle in countries with flexible labour markets because their way of production demands easy employment adjustments. These determinants of comparative advantage also have a bearing on data-intensive sectors.
When taking a first look at these data-intensive sectors, Table 4 provides a simple attempt at showing who has a comparative advantage between the EU and the US and the rest of the world in these sectors using a commonly used measure called revealed comparative advantage (RCA).3 Although this index is subject to some critique, it nevertheless provides an easy way of defining the relative productivity and trade specialisation patterns of countries in a certain sector.4 Table 4 tells us that the EU has strong comparative advantage in some data-intensive sectors such as management of companies and enterprises, educational services and wholesale and retail trade when using figures from the TIS database. In addition, the EU also holds comparative advan-tage in the category covering telecom and data processing services, but the US appears to have a stronger comparative advantage in these sectors. Similarly, for Professional and business services, and Administrative support services, and financial services the US appears have a stronger po-sition when it comes to export productivity differences between sectors despite the fact that in some of these sectors the EU also has comparative advantage.
3 The revealed comparative advantage (RCA) index is an indicator that compares the share of a sector’s exports in a country’s total exports with the share of exports of all countries in the same sector in total world exports. The higher the ratio, which can range from zero to infinity, the more competitive the country is in the sector. The RCA index is calculated as follows: RCAik=(xik/Xi) / (xwk/Xw) where xik are country i’s exports of sector k, Xi are total exports of country I, xwk are world exports of sector k, and Xw are total world exports.4 One critique is that this measure is not insensitive to policies altering the patterns of trade which will then be tak-en up in the comparative advantage indicator. As such it would not provide a neutral indicator. For example, policy variables such as regulation could affect comparative advantage although other policies such as subsidies aim to increase the export volumes rather than exploit productivity differences. See Siggel (2006).

17
ecipe occasional paper — no. 07/2015
TABLE 4: REVEALED COMPARATIVE ADVANTAGE OF DATA-INTENSIVE SECTORS (2012)
Source: Author’s calculations, TIS Database
5.2 Who is Best Placed to Have Comparative Advantage in Data-intensive
services?
The RCA indictor does not yet provide the country-wide factors that influence the performance of data-intensive industries and sectors and their difference in productivity across countries. In other words, the figures in Table 4 do not yet reveal what actually constitutes a true determining factor as to why countries trade more or less of a services that is data-intensive. As mentioned above, the match between what a country can provide in terms of endowment structure and the needs of a specific sector defines the source of comparative advantage. If a sector is high-skilled intense it will most likely settle its production in a country which provides a high level of skilled labour force. By similar token, if an industry is prone to many hold-up problems in the supply chain, companies are likely to produce in this sector where the country can pro-vide a strong rule of law so that contracts can be enforced.5 Countries vary in the ability to provide these factors or institutional endowments. As for sectors using lots of data, some of them use more data than others, as Figure 2 has shown, because of the way they produce the good or service. Therefore, companies that produce data-intensive services are more likely to settle where the ‘digital infrastructure’ is best so that data is readily and abundantly available.
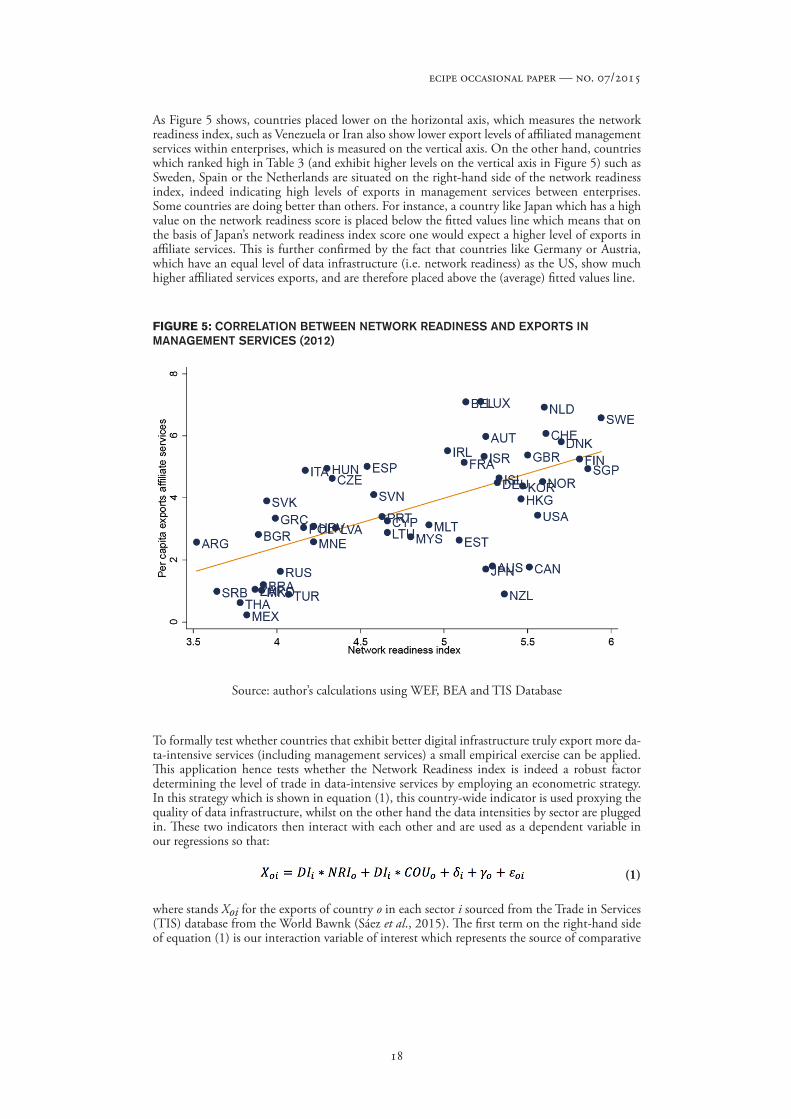
The World Economic Forum’s Network Readiness index is one indicator that forms a good proxy of the availability of good data infrastructure. As the index explains, it measures the extent to which an economy is prepared to apply the benefits of information and communications tech-nologies (ICTs) in order to promote economic growth and well-being. Included in this measure are factors such as the amount of broadband and internet subscriptions in a country, whether countries have the latest technologies available, whether firms absorb technology, or if multina-tionals bring new technologies into the domestic economy. These sub-indicators of the Network Readiness index all signify in one way or another whether data can be moved efficiently within each country. This will have an effect on the productivity term of the data-intensive industry and the match between a country that can provide good digital infrastructure and the level of trade in data-intensive services sectors, i.e. comparative advantage. Figure 5 indeed shows that for instance countries with a higher index value of Network Readiness exhibit greater exports of management services between affiliates, which is as previously shown a sector that is extremely data-intensive. This correlation also holds for the other data-intensive sectors.
5 See Chor (2012) and van der Marel and Shepherd (2013) for further insights on comparative advantage.
IO code 2-digit Industry description EU US ROW
51 Publishing, Motion, Telecom, and Data processing 1.2 1.7 0.655 Management of companies and enterprises 1.9 0.6 0.356 Administrative support services, incl waste man 1.0 1.3 0.654 Professional and business services 1.1 1.3 0.961 Educational services 2.2 0.3 0.452 Financial and insurance services 1.0 1.4 0.642 Wholesale trade 1.3 0.1 1.062 Health care and social assistance 1.9 0.3 0.471 Arts, entertainment and recreation services 1.6 0.4 0.972 Accommodation and food services 0.8 1.1 1.248 Transportation services 0.9 0.5 0.923 Construction 0.9 0.2 1.4
18
ecipe occasional paper — no. 07/2015
As Figure 5 shows, countries placed lower on the horizontal axis, which measures the network readiness index, such as Venezuela or Iran also show lower export levels of affiliated management services within enterprises, which is measured on the vertical axis. On the other hand, countries which ranked high in Table 3 (and exhibit higher levels on the vertical axis in Figure 5) such as Sweden, Spain or the Netherlands are situated on the right-hand side of the network readiness index, indeed indicating high levels of exports in management services between enterprises. Some countries are doing better than others. For instance, a country like Japan which has a high value on the network readiness score is placed below the fitted values line which means that on the basis of Japan’s network readiness index score one would expect a higher level of exports in affiliate services. This is further confirmed by the fact that countries like Germany or Austria, which have an equal level of data infrastructure (i.e. network readiness) as the US, show much higher affiliated services exports, and are therefore placed above the (average) fitted values line.
FIGURE 5: CORRELATION BETWEEN NETWORK READINESS AND EXPORTS IN MANAGEMENT SERVICES (2012)
Source: author’s calculations using WEF, BEA and TIS Database
To formally test whether countries that exhibit better digital infrastructure truly export more da-ta-intensive services (including management services) a small empirical exercise can be applied. This application hence tests whether the Network Readiness index is indeed a robust factor determining the level of trade in data-intensive services by employing an econometric strategy. In this strategy which is shown in equation (1), this country-wide indicator is used proxying the quality of data infrastructure, whilst on the other hand the data intensities by sector are plugged in. These two indicators then interact with each other and are used as a dependent variable in our regressions so that:
(1)
where stands Xoi for the exports of country o in each sector i sourced from the Trade in Services (TIS) database from the World Bawnk (Sáez et al., 2015). The first term on the right-hand side of equation (1) is our interaction variable of interest which represents the source of comparative

19
ecipe occasional paper — no. 07/2015
advantage regarding data usage and data infrastructure (NRI) from the WEF. This is hence the variable that connects the data intensities of all sectors present in our data (both data-intensive as well as non-data-intensive) with the Network Readiness index. The third term is also an in-teraction term using data intensities, but controls for various other determinants of comparative advantage found in the literature with which data intensity might correlate. These include a better quality of education or the quality of domestic institutions. Once these are added into the regression, the true marginal importance of the network readiness indicator as a determinant will be revealed. We also control for all other issues that may be found collinear at the level of exporter, γo, and sector, δi,which are the so-called fixed effects. Last, the term εoi stands for the error term satisfying the usual assumptions. The year 2012 is chosen for all our variables and services sectors are used only because of data inconsistencies, which may otherwise occur if we use goods trade from other data sets.
The results of our regression are presented in Table 5. In this table, column 1 shows the data intensity share of all sectors interacted with the Network Readiness index. The results show that not only is the coefficient positive and very significant, the coefficient size is also quite large. The large coefficient size indicates that there is a considerable effect of this source of comparative advantage on a country’s trade patterns in data-intensive services sectors. Hence, countries that indeed provide a better digital infrastructure also reveal high levels of data-intensive exports. Next, column 2 adds in a separate entry the interaction term where data-intensity is multiplied with a measure of human capital, namely the quality of education from the WEF. It shows this interaction variable becomes positive but insignificant, and that the original term with the net-work readiness remains robustly positive and significant.
TABLE 5: REGRESSION OUTPUT FOR DATA-INTENSIVE SERVICES AND COUNTRY-WIDE FACTORS (2012)
Source: author’s calculations using WEF, BEA and TIS Database; Robust standard errors in parentheses clustered by country. *** p<0.01, ** p<0.05, * p<0.1.
(1) (2) (3) (4) (5)EXP EXP EXP EXP EXP
Data-intensity * NRI 5.596*** 4.546** 5.249*** -3.319 -4.414
(1.720) (1.932) (1.949) (6.716) (6.626)Data-intensity * HC 3.063 -0.786 0.205 0.507
(4.331) (4.294) (4.165) (4.164)Data-intensity * K 2.830*** 3.273*** 2.987***
(1.042) (1.060) (1.131)Data-intensity * Rulaw 7.227 7.354
(5.306) (5.570)Data-intensity * GDPpc 1.488
(4.974)
Observations 1,279 1,133 1,007 1,007 983R-squared 0.759 0.764 0.763 0.763 0.763RMSE 2.225 2.193 2.173 2.171 2.173

20
ecipe occasional paper — no. 07/2015
This remains true when we add in a separate entry (column 3), the country-wide variable of the availability of capital from the Conference Board although this term also becomes positive and significant. It indicates that next to the network readiness measure, the amount of capital a coun-try has is probably in addition a factor that influences trade in data-intensive services. Finally, we also include two other factors that may influence the significance of the previous variables. These are the quality of institutions (i.e. rule of law) from the World Bank’s Governance Database and GDP per capita from the World Development Indicators. Although the NRI interaction term loses its significance, the outcome of this variable actually becomes negative. The switch of sign and significance indicates that there are some collinearity issues in the regression. The reason for this is that both GDP per capita and the quality of rule of law are highly collinear with each other and with the NRI indicator. On the other hand, the interaction terms with the quantity of capital stock remain significant and robust.
6 Conclusion and Policy Implications
This paper has made a first attempt to disentangle the flows of data by first setting out where in the wider economy data is mostly produced and used, and then looking at which countries cap-ture most of the trade in data-intensive services, and finally determining what is a strong factor in a country’s success in exporting data-intensive services. Unsurprisingly, most data are used in services such as telecom services, sound recording services, data processing and hosting services, and web portal services. These are also to a large extent the producers of data services. Most developed countries hold a large share of trade in these sectors, although emerging countries do also capture a sizable part of the trade in data-intensive services sectors.
One surprising result of the paper is that not only is data much used in the aforementioned ser-vices sectors, but also in services that flow between affiliates of the same enterprise, which are the so-called management services. These are services that relates to the supervision, control and or-ganisation of related subsidiaries or affiliates within the same enterprise. Many tasks within these services between affiliates are comprised of financial planning services, management monitoring, bookkeeping services and many other business and Administrative support services. This catego-ry of services may have been overlooked in the existing literature, but using detailed input-out-put tables shows that this sector absorbs a data share that is almost equal to the data-producing industries such as telecoms or data processing services. Moreover, trade in these data-intensive services are substantial across developed as well as emerging economies.
This finding has without doubt some consequences for policy. Current policy initiatives around the world regarding the flow of data aim to secure the transfer of so-called personal data. Many firms active in the data-intensive sector are dealing with data that a consumer has provided to them during transactions varying from a bank account transfer to booking travel arrangements online. Yet, this type of data is only part of the story as this paper has shown that many services using a lot of data also include services inside the firm. Although in part this data also covers personal data such as clients’ information used for marketing strategies or information of em-ployees used for human resource proposes of multinationals, many other services traded between affiliates will have less direct links with personal information. As previously said, many of the tasks these affiliated services cover deal with finance, bookkeeping and the overall control (man-agement) of the enterprise.
Nonetheless, personal data inside the firm is also regulated in many countries. The fact that this paper finds that many data-intensive services are related to management services between affil-iates will put a natural policy emphasis on the way data is treated inside a multinational firm. Current frameworks dealing with this intra-firm data are Binding Corporate Rules (BCR) which are legally enforceable internal rules within a corporate group that require a uniform level of regulation for all affiliates across the countries in which the multinational firm operates.

21
ecipe occasional paper — no. 07/2015
To the extent to which this type of regulatory framework seems appropriate for data-intensive services between affiliates, they would not apply to inter or intra-industry data flows between non-affiliated firms. For that end, some countries have implemented or proposed various regula-tory policies for the transfer of data to third parties such as consent requirement, the Safe Harbor Framework between the EU and US, or standard contractual clauses. New initiatives include the APEC’s cross-border privacy rules that like BCRs allow for a compliance programme for data transmissions inside firms, but also to third parties. A final policy proposal that deals with intra-company and third-party data flows are ‘privacy seals’ given out by regulators after approval that a company is fit to abide by a certain set of rules. Hence, it would allow data to flow between importers and exporters which are only certified. Some countries such as the UK are organising this by sector, which for data-intensive services may be an efficient way of dealing with the issue as most of these services fall into the same sector category, namely business services.
Finally, this paper has also made a first effort to look in more detail into the factors that may influence the success of exporting data-intensive services, i.e. sources of comparative advantage. One factor explaining the extent to which countries are relatively strong in exporting these data services is the digital-related infrastructural climate, in addition to a country’s capital stock. This means that countries with a greater quality of data infrastructure and capital stock will find it easier to export services which use a lot of data.

22
ecipe occasional paper — no. 07/2015
References
Bauer, M., F. Erixon and H. Lee-Makiyama (2013) The Economic Importance of Getting Data Protection Right: Protecting Privacy, Transmitting Data, Moving Commerce, European Centre for International Political Economy, Brussels: ECIPE.
Bauer, M., H. Lee-Makiyama, E. van der Marel and B. Verschelde (2014) The Costs of Data Localization: A Friendly Fire on Economic Recovery, ECIPE Occasional Paper, No 3/2014, European Centre for International Political Economy, Brussels: ECIPE.
Chor, D. (2011) ‘Unpacking Sources of Comparative Advantage: A Quantitative Approach’, Journal of International Economics, Vol. 82, No. 2, pages 152-167.
Christensen, L., A. Colciago, F. Etro and G. Rafert (2013) The Impact of the Data Protection Regulation in the EU. Intertic Policy Paper, Intertic.
Kommerskollegium (2015) No Transfer, No Production: A Report on Cross-border Data Trans-fers, Global Value Chain, and the Production of Goods, KommersKollegium 2015:4.
Martens, B. (2013) What Does Economic Research Tell us About Cross-Border E-commerce in the EU Digital Single Market?, JRC-IPTS Working Paper on Digital Economy, No. 2013-05, Institute of Prospective Technologies Studies, Joint Research Centre.
Melzer, J.P. (2014) The Importance of the Internet and Transatlantic Data Flows for US and EU Trade and Investment, Global Economy and Development Working Paper 79, Washington DC: Brookings Institute.
Miroudot, S., D. Rouzet and F. Spinelli (2013) Trade Policy Implications of Global Value Chains: Case Studies, OECD Trade Policy Papers, No. 161, Paris: OECD Publishing.
OECD (2013) OECD-WTO Database on Trade in Value-added First Estimates, Paris: OECD Publishing.
OECD (2014) FDI in Figures: International Investment Stumbles into 2014 after ending 2013 Flat, Paris: OECD Publishing.
Saez, S. D. Taglioni, E. van der Marel, C. Hollweg and V. Zavacka (2015) Valuing Services in Trade: A Toolkit for Competitiveness Diagnostics, Washington DC: The World Bank.
Siggel, E. (2006) International Competitiveness and Comparative Advantage: A Survey and Proposal for Measurement, Journal of Industry, Competition and Trade, Vol. 6, No. 2, pages 137-159.
Van der Marel, E. and B. Shepherd (2013) ‘International Tradability Indices for Services’, World Bank Policy Research Paper Series No. 6712, Washington DC: World Bank.
WEF (2012) The Global Information Technology Report 2012: Living in a Hyperconnected World, Davos: World Economic Forum.
WEF (2013) The Human Capital Report, Davos: World Economic Forum.

23
ecipe occasional paper — no. 07/2015
Annex
TABLE A1: SUMMARY STATISTICS OF DATA USAGE, AVERAGES OF 6-DIGIT SECTOR
Source: Bureau of Economic Analysis (BEA)
TABLE A2: TOP 20 OF 6-DIGIT SECTORS DATA USAGE
Source: Bureau of Economic Analysis (BEA)
SectorData intensity
Mean Max Min IQR Std
Manufacturing 0.012 0.091 0.000 0.011 0.010Distribution 0.035 0.044 0.023 0.011 0.009Transport 0.017 0.030 0.009 0.013 0.008Finance 0.047 0.131 0.000 0.029 0.045Business 0.096 0.306 0.001 0.082 0.074Personal 0.034 0.102 0.000 0.015 0.021
IO code Data intensity Industry description
517400 0.449 Satellite, telecommunications resellers, and all other telecom517110 0.306 Wired telecommunications carriers511200 0.306 Software publishers517210 0.253 Wireless telecommunications carriers512200 0.200 Sound recording industries519130 0.170 Internet publishing and broadcasting and Web search Portals518200 0.169 Data processing, hosting, and related services561400 0.168 Business support services561500 0.150 Travel arrangement and reservation services550000 0.131 Management of companies and enterprises523900 0.131 Other financial investment activities561600 0.130 Investigation and security services533000 0.120 Lessors of nonfinancial assets523100 0.115 Securities and commodity contracts intermediation and brokerage519110 0.113 New syndicates, libraries, archives and other info services541910 0.108 Marketing research and other prof, scientific, and tech services611400 0.102 Other educational services541513 0.100 Other computer related services, incl facilities management561100 0.099 Other administrative services561300 0.091 Employment services

24
ecipe occasional paper — no. 07/2015
FIGURE A1: THE BILATERAL SHARE OF OECD TRADE IN SERVICES AND THE REST OF THE WORLD (2012)
Source: TIS Databases
FIGURE A2: CORRELATION BETWEEN FDI AND TRADE (IMPORTS AND EXPORTS) IN MANAGEMENT SERVICES (2012)
Source: TIS Database and OECD