ec 2 simulation lab manual
TRANSCRIPT

7/29/2019 Ec 2 Simulation Lab manuAL
http://slidepdf.com/reader/full/ec-2-simulation-lab-manual 1/56
www.Vidyarthiplus.in
© Copyright 2011-2015 – Vidyarthiplus.in (VP Group) Page 1
Document Name: Electronics Circuits II andSimulation Lab Manual
www.Vidyarthiplus.in
Facebook: www.facebook.com/vidyarthiplus
Twitter: www.twitter.com/vidyarthiplus

7/29/2019 Ec 2 Simulation Lab manuAL
http://slidepdf.com/reader/full/ec-2-simulation-lab-manual 2/56
www.Vidyarthiplus.in
© Copyright 2011-2015 – Vidyarthiplus.in (VP Group) Page 2
ELECTRONICS CIRCUITS II AND SIMULATION LAB
LIST OF EXPERIMENTS
CYCLE I
1. SERIES AND SHUNT FEED BACK AMPLIFIERS
2. DESIGN OF WEIN BRIDGE OSCILLATOR
3. DESIGN OF TRANSISTOR RC PHASE SHIFT OSCILLATOR
4. DESIGN OF LC – HARTLEY AND COLPITTS OSCILLATOR
5. CLASS C TUNED AMPLIFIER
6. INTEGRATORS AND DIFFERENTIATORS
7. CLIPPERS AND CLAMPERS
8. DESIGN OF MONOSTABLE MULTIVIBRATOR
9. DESIGN OF ASTABLE MULTIVIBRATOR
10. DESIGN OF BISTABLE MULTIVIBRATOR
CYCLE II - SIMULATION USING PSPICE
1. DIFFERENTIATE AMPLIFIER
2. ACTIVE FILTER : BUTTERWORTH II ORDER LPF
3. ASTABLE,MONOSTABLE AND BISTABLE MULTIVIBRATOR –
TRANSISTOR BIAS
4. D / A and A/D CONVERTER ( SUCCESSIVE APPROXIMATION )
5. ANALOG MULTIPLIER
6. CMOS INVERTOR , NAND AND NOR

7/29/2019 Ec 2 Simulation Lab manuAL
http://slidepdf.com/reader/full/ec-2-simulation-lab-manual 3/56
www.Vidyarthiplus.in
© Copyright 2011-2015 – Vidyarthiplus.in (VP Group) Page 3
1. FEED BACK AMPLIFIER
AIM:
To design and test the current series and voltage shuntFeedback Amplifier and to calculate the following parameters withand without feedback.
1. Mid band gain.2. Bandwidth and cutoff frequencies.3. input and output impedance.
APPARATUS REQUIRED:
S.NO ITEM RANGE Q.TY
1 TRANSISTOR BC 107 12 RESISTOR 13 CAPACITOR
4 CRO (0-30 )MHz 15 RPS (0-30) V 16 FUNCTION
GENERATOR(0 – 1 )MHZ 1
CURRENT SERIES FEEDBACK
DESIGN: (Without Feedback ):
Given data : Vcc = 15V , β = 0.9, fL = 1kHz, Ic=1mA.
Stability factor = [2-10], Rs = 680ΩΩΩΩ,Av = 50dB , IE = 1.2mA .
Gain formula is given byAv = -hfe RLeff / Z i
Assume, VCE = Vcc / 2RLeff = Rc RL
re = 26mV / IEhie = β re where re is internal resistance of the
transistor.hie = hfe re
VE = Vcc / 10

7/29/2019 Ec 2 Simulation Lab manuAL
http://slidepdf.com/reader/full/ec-2-simulation-lab-manual 4/56
www.Vidyarthiplus.in
© Copyright 2011-2015 – Vidyarthiplus.in (VP Group) Page 4
On applying KVL to output loop,
Vcc = IcRc + VCE + IERE
VE = IERE
Rc = ?
Since IB is very small when compared with IC
Ic approximately equal to IE
RE = VE / IE = ?
VB = VBE + VE
VB = VCC . RB2 / RB1 + RB2
S = 1+ (RB /RE )RB = ?
RB = RB1 RB2
Find
Input Impedance , Zi = ( RB hie )
Coupling and bypass capacitors can be thus found out.
Input coupling capacitor is given by , Xci = Z i / 10
Xci = 1/ 2ππππfCi
Ci = ?
output coupling capacitor is given by ,
Xco=(Rc RL) / 10
Xc0 = 1/ 2ππππfCo
Co = ?
By-pass capacitor is given by ,XCE = 1/ 2ππππfCE
CE = ?
Design ( With feedback ) :
Remove the emitter capacitance ( CE )

7/29/2019 Ec 2 Simulation Lab manuAL
http://slidepdf.com/reader/full/ec-2-simulation-lab-manual 5/56
www.Vidyarthiplus.in
© Copyright 2011-2015 – Vidyarthiplus.in (VP Group) Page 5
β = -1 / RE
Gm = - hfe/ [(hie + RE ) RB]
D = 1+ β Gm
Gmf = Gm / D
Zif = Z iD
Zof = ZoD
CIRCUIT DIAGRAM: WITHOUT FEEDBACK:
+VCC
R1 Rc CoCinB
BC107E RL
VoCE
Vin R2 REF = 1 KHz
CRO
7/29/2019 Ec 2 Simulation Lab manuAL
http://slidepdf.com/reader/full/ec-2-simulation-lab-manual 6/56
www.Vidyarthiplus.in
© Copyright 2011-2015 – Vidyarthiplus.in (VP Group) Page 6
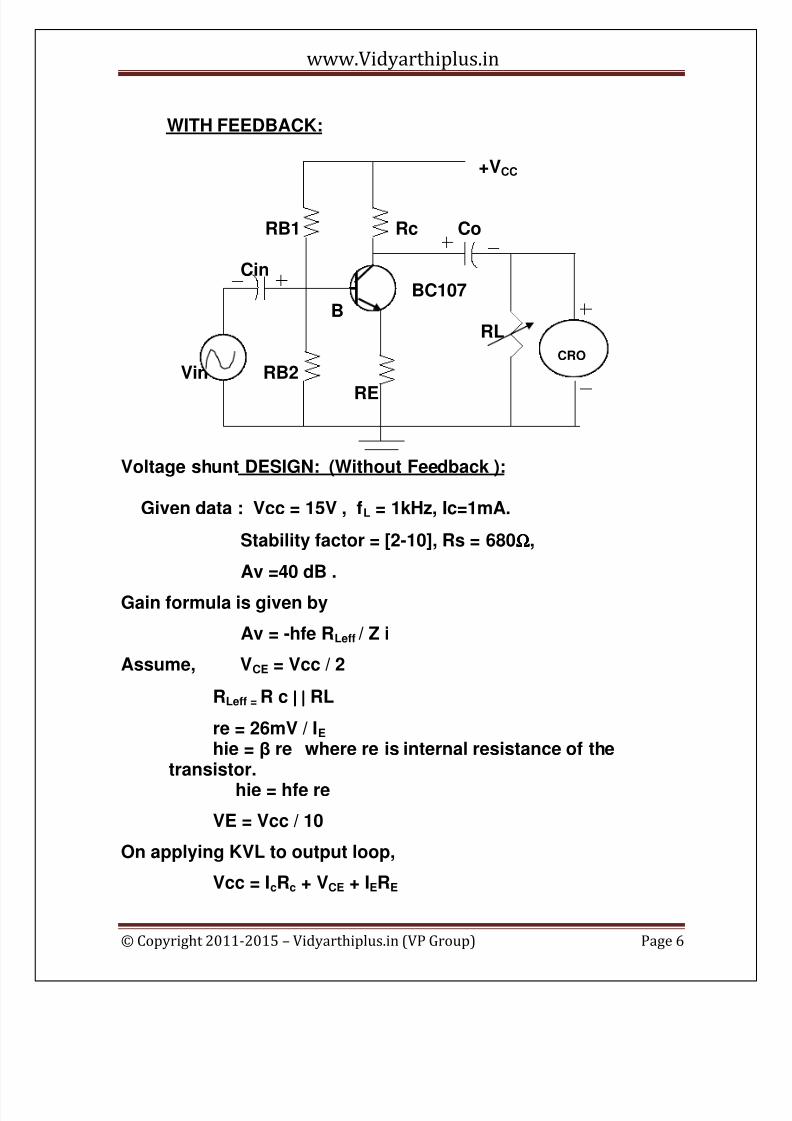
WITH FEEDBACK:
+VCC
RB1 Rc Co
CinBC107
BRL
Vin RB2
RE
Voltage shunt DESIGN: (Without Feedback ):
Given data : Vcc = 15V , fL = 1kHz, Ic=1mA.
Stability factor = [2-10], Rs = 680ΩΩΩΩ,
Av =40 dB .
Gain formula is given by
Av = -hfe RLeff / Z i
Assume, VCE = Vcc / 2
RLeff = R c |||| |||| RL
re = 26mV / IEhie = β re where re is internal resistance of the
transistor.hie = hfe re
VE = Vcc / 10
On applying KVL to output loop,
Vcc = IcRc + VCE + IERE
CRO

7/29/2019 Ec 2 Simulation Lab manuAL
http://slidepdf.com/reader/full/ec-2-simulation-lab-manual 7/56
www.Vidyarthiplus.in
© Copyright 2011-2015 – Vidyarthiplus.in (VP Group) Page 7
VE = IERE
Rc = ?
Since IB is very small when compared with Ic
Ic approximately equal to IE
RE = VE / IE = ?
VB = VBE + VE
VB = VCC . RB2 / RB1 + RB2
S = 1+ RB / RE
RB =?
RB = RB1|||||||| RB2 Find
Input Impedance, Zi = (RB |||||||| hie )
Coupling and bypass capacitors can be thus found out.
Input coupling capacitor is given by , Xci = Z i / 10
Xci = 1/ 2ππππf Ci
Ci = ?
output coupling capacitor is given by ,
X co=(Rc | | RL) / 10
Xc0 = 1/ 2ππππf Co
Co =?
By-pass capacitor is given by, XCE = 1/ 2ππππf CE
CE =?
Design ( With feedback ) :
Connect the feedback resistance (Rf) and feedback
capacitor (Cf) as shown in the figure.
Xcf = Rf / 10
7/29/2019 Ec 2 Simulation Lab manuAL
http://slidepdf.com/reader/full/ec-2-simulation-lab-manual 8/56
www.Vidyarthiplus.in
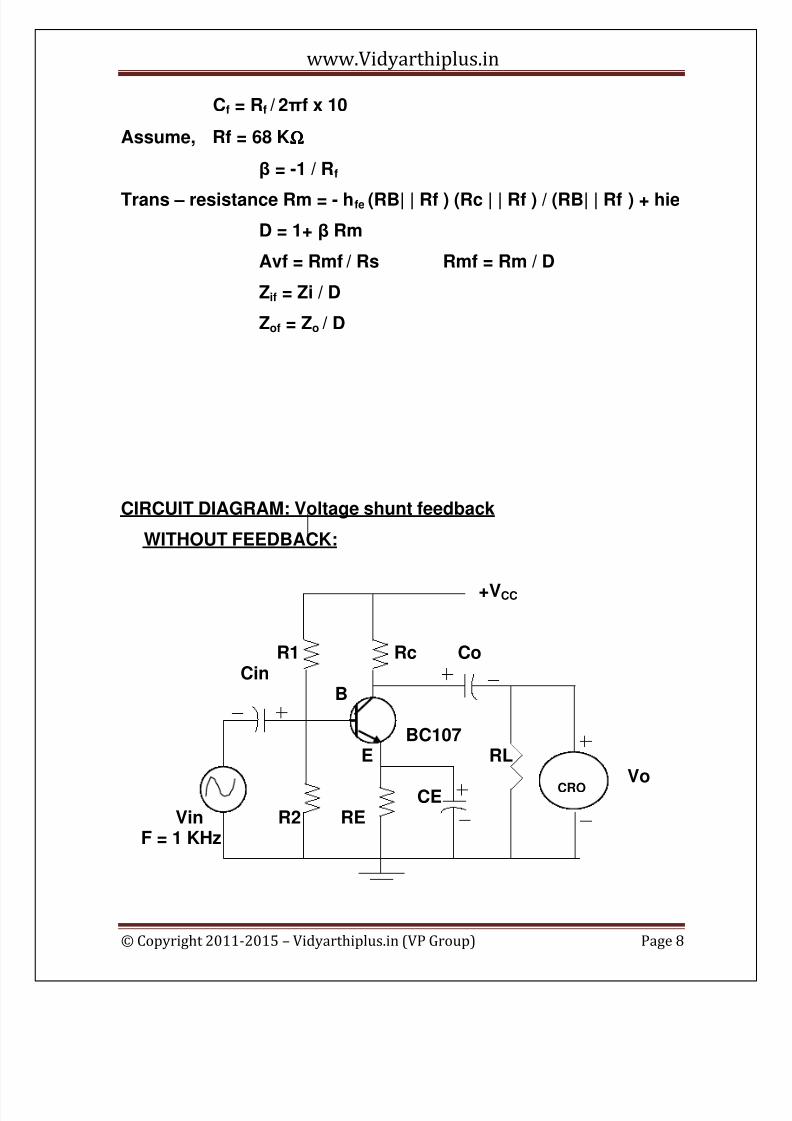
© Copyright 2011-2015 – Vidyarthiplus.in (VP Group) Page 8
Cf = Rf / 2πf x 10
Assume, Rf = 68 KΩΩΩΩ
β = -1 / Rf
Trans – resistance Rm = - hfe (RB| | Rf ) (Rc | | Rf ) / (RB| | Rf ) + hie
D = 1+ β Rm
Avf = Rmf / Rs Rmf = Rm / D
Zif = Zi / D
Zof = Zo / D
CIRCUIT DIAGRAM: Voltage shunt feedback
WITHOUT FEEDBACK:
+VCC
R1 Rc CoCin
B
BC107E RL
VoCEVin R2 RE
F = 1 KHz
CRO

7/29/2019 Ec 2 Simulation Lab manuAL
http://slidepdf.com/reader/full/ec-2-simulation-lab-manual 9/56
www.Vidyarthiplus.in
© Copyright 2011-2015 – Vidyarthiplus.in (VP Group) Page 9
WITH FEEDBACK:+VCC
RB1 RF Rc Co
RS CinBC107
BRL
Vin RB2RE
MODEL GRAPH(WITH & WITHOUT FEEDBACK)
Without feedback
3 dBGAIN
(db) 3dB With feedback
f3 f1 f2 f4 f(Hz)
f2 – f1 = Bandwidth of without feedback circuitf4 – f3 = Bandwidth of with feedback circuitTHEORY:
An amplifier whose function fraction of output is fedback to the input is called feed back amplifier. Dependingupon whether the input is in phase or out of phase with thefeed back signal, they are classified in to positive feed back
CRO

7/29/2019 Ec 2 Simulation Lab manuAL
http://slidepdf.com/reader/full/ec-2-simulation-lab-manual 10/56
www.Vidyarthiplus.in
© Copyright 2011-2015 – Vidyarthiplus.in (VP Group) Page 10
and negative feed back. If the feed back signal is in phasewith the input, then the wave will have positive gain. Thenthe amplifier is said to have a positive feed back.
If the feed back signal is out of phase with the input
,then the wave will have a negative gain. The amplifier issaid to have a negative feed back. The values of voltagegain and bandwidth without feed back.
PROCEDURE:
The connections are made as shown in the circuit. Theamplifier is checked for its correct operation .Set the inputvoltage to a fixed value. Keeping the input voltage Vary the
input frequency from 0Hz to 1MHz and note down thecorresponding output voltage. plot the graph : gain (dB) vsfrequency .Find the input and output impedances. Calculatethe bandwidth from the graph. Remove RE and follow thesame procedure.
OBSERVATION:WITH OUT FEEDBACK
Vin = ------------ VoltsS.NO FREQUNCY O/PvoltageVo
Gain
Av=20 log Vo/Vi
WITH FEEDBACKS.NO FREQUNCY O/P
voltage Av=20 log Vo/Vi

7/29/2019 Ec 2 Simulation Lab manuAL
http://slidepdf.com/reader/full/ec-2-simulation-lab-manual 11/56
www.Vidyarthiplus.in
© Copyright 2011-2015 – Vidyarthiplus.in (VP Group) Page 11
RESULT:
Theoritical Practical
With F/B Without
F/B
With F/B Without
F/B
Input Impedance
Output
impedance
Bandwidth
Transconductance(gm)

7/29/2019 Ec 2 Simulation Lab manuAL
http://slidepdf.com/reader/full/ec-2-simulation-lab-manual 12/56
www.Vidyarthiplus.in
© Copyright 2011-2015 – Vidyarthiplus.in (VP Group) Page 12
2. WEIN BRIDGE OSCILLATOR
Aim : To Design and construct a Wein – Bridge Oscillator for a
given cut-off frequency .
APPARATUS REQUIRED:
S.NO ITEM RANGE Q.TY1 TRANSISTOR BC107 22 RESISTOR3 CAPACITOR
4 CRO - 1
5 RPS DUAL(0-30) V 1

7/29/2019 Ec 2 Simulation Lab manuAL
http://slidepdf.com/reader/full/ec-2-simulation-lab-manual 13/56
www.Vidyarthiplus.in
© Copyright 2011-2015 – Vidyarthiplus.in (VP Group) Page 13
CIRCUIT DIAGRAM:
R1 RC! CC2R3 Rc2
+ -
Cc
R2
R4 RE2
CE
R
C
DRB
R
C
GND

7/29/2019 Ec 2 Simulation Lab manuAL
http://slidepdf.com/reader/full/ec-2-simulation-lab-manual 14/56
www.Vidyarthiplus.in
© Copyright 2011-2015 – Vidyarthiplus.in (VP Group) Page 14
MODEL GRAPH:
Design
Given : Vcc = 12V , fo = 2 KHz, Ic1= Ic2 = 1mA.; Stability
factor = [0-10],
fL = 100Hz
When the bridge is balanced,
fo = 1/ 2πRC
Assume, C = 0.1F
Find, fo = ?
Given data : Vcc = 15V , fL = 50Hz, Ic1= Ic2 = 1mA.; AvT = 3 ;
Av1 =2; Av2 = 1;
Stability factor = [10]
Gain formula is given by
Av = -hfe RLeff / Zi
RLeff = R c2 |||| |||| RL

7/29/2019 Ec 2 Simulation Lab manuAL
http://slidepdf.com/reader/full/ec-2-simulation-lab-manual 15/56
www.Vidyarthiplus.in
© Copyright 2011-2015 – Vidyarthiplus.in (VP Group) Page 15
hfe2 = 200 (from multimeter )
re2 = 26mV / IE2 = 26hie2 = hfe2 re 2 = 200 x 26 = 5.2kW
From dc bias analysis , on applying KVL to the outer loop, we get
Vcc = Ic2Rc2 + VCE2+VE2
VcE2 = Vcc/2 ; VE2 = Vcc / 10 ; Ic2 = 1mA
Rc2 = ?
Since IB is very small when compared with Ic
Ic approximately equal to IE
Av2 = -hfe2 RLeff / Zi2
Find RL|| Rc2 from above equationSince Rc2 is known , Calculate RL.
VE2 = IE2RE2
Calculate RE2
S = 1+ RB2 / RE2
RB 2 =?
RB 2 =R3 || R4
VB2 = VCC . R4 / R3 + R4
VB2 = VBE2 + VE2
R3 =?
Find R4
Zi2 = (RB2 |||||||| hie2 )
Zi2 = ?
Rleff1 = Zi2|||||||| Rc1
Find Rleff1 from the gain formula given above
Av1 = -hfe1 RLeff 1/ Zi1
RLeff1 = ?

7/29/2019 Ec 2 Simulation Lab manuAL
http://slidepdf.com/reader/full/ec-2-simulation-lab-manual 16/56
www.Vidyarthiplus.in
© Copyright 2011-2015 – Vidyarthiplus.in (VP Group) Page 16
On applying KVL to the first stage, we get
Vcc = Ic1 Rc1 + VCE1 +VE1
VCE1 = VCC / 2 ; VE1 = VCC / 10
Rc1 = ?
Find Ic1 approximately equal to IE1
R6 = RE1=?
S = 1+ RB1 / RE1
RB 1 =?
RB 1 =R1 || R2
VB1 = VCC . R2 / R1 + R2VB1 = VBE2 +VE2
Find R1 = ?
Therefore find R2 = ?
Zi1 = (RB1 |||||||| hie1 )
R5 = RL – R6
Coupling and bypass capacitors can be thus found out.
Input coupling capacitor is given by , Xci = Z i / 10
Xci = 1/ 2ππππf Ci
Ci = ?
output coupling capacitor is given by ,
X co=(Rc2 | | RL2) / 10
Xc0 = 1/ 2ππππf Co
Co =?
By-pass capacitor is given by, XCE = RE2 / 10
XCE 1/ 2ππππf CE2
CE =?

7/29/2019 Ec 2 Simulation Lab manuAL
http://slidepdf.com/reader/full/ec-2-simulation-lab-manual 17/56
www.Vidyarthiplus.in
© Copyright 2011-2015 – Vidyarthiplus.in (VP Group) Page 17
THEORY:
In wein bridge oscillator, wein bridge circuit is connected
between the amplifier input terminals and output terminals. Thebridge has a series rc network in one arm and parallel network inthe adjoining arm. In the remaining 2 arms of the bridge resistorsR1and Rf are connected . To maintain oscillations total phaseshift around the circuit must be zero and loop gain unity. Firstcondition occurs only when the bridge is balanced . Assumingthat the resistors and capacitors are equal in value, the resonantfrequency of balanced bridge is given by
Fo = 0.159 RC
PROCEDURE:
1. The circuit is constructed as per the given circuitdiagram.
2. Switch on the power supply and observe the output onthe CRO( sine wave)
3. Note down the practical frequency and compare it withthe theoretical frequency.

7/29/2019 Ec 2 Simulation Lab manuAL
http://slidepdf.com/reader/full/ec-2-simulation-lab-manual 18/56
www.Vidyarthiplus.in
© Copyright 2011-2015 – Vidyarthiplus.in (VP Group) Page 18
RESULT :
Theoritical PracticalFrequency f = 1 / 2 ΠΠΠΠ RC

7/29/2019 Ec 2 Simulation Lab manuAL
http://slidepdf.com/reader/full/ec-2-simulation-lab-manual 19/56
www.Vidyarthiplus.in
© Copyright 2011-2015 – Vidyarthiplus.in (VP Group) Page 19
3. TRANSISTOR PHASE SHIFT OSCILLATORAIM:
To design and construct the transistor Phase shift oscillator.
APPARATUS REQUIRED:
S.NO ITEM RANGE Q.TY1 TRANSISTOR BC 107 12 RESISTOR3 CAPACITOR4 CRO ( 0 – 30 ) MHz 15 RPS (0-30) V 16 FUNCTION
GENERATOR(0-1 )MHz 1
CIRCUIT DIAGRAM:

7/29/2019 Ec 2 Simulation Lab manuAL
http://slidepdf.com/reader/full/ec-2-simulation-lab-manual 20/56
www.Vidyarthiplus.in
© Copyright 2011-2015 – Vidyarthiplus.in (VP Group) Page 20
MODEL GRAPH:
DESIGN:Given : Vcc = 12V , fo = 1 KHz,C = 0.01µF; IE = 5mA.;
Stability factor = 10
f = 1/ 2πRC Find R
R1 = (Ri – R)
R >> Rc
Βeta = -1 / 29
Amplifier Design :
Gain formula is given by
Av = -hfe RLeff / hie ( Av = 29, design given )
Assume, VCE = Vcc / 2
RLeff = R c |||| |||| RL
re = 26mV / IE

7/29/2019 Ec 2 Simulation Lab manuAL
http://slidepdf.com/reader/full/ec-2-simulation-lab-manual 21/56
www.Vidyarthiplus.in
© Copyright 2011-2015 – Vidyarthiplus.in (VP Group) Page 21
hie = β re where re is internal resistance of thetransistor.
hie = hfe re
VE = Vcc / 10
On applying KVL to output loop,
Vcc = IcRc + VCE + IERE
VE = IERE
Rc = ?
Since IB is very small when compared with Ic
Ic approximately equal to IE
RE = VE / IE = ?
VB = VBE + VE
VB = VCC . RB2 / RB1 + RB2
S = 1+ RB / RE
RB =?
RB = RB1|||||||| RB2
Find RB1 & RB2Input Impedance, Zi = (RB |||||||| hie )
Coupling and bypass capacitors can be thus found out.
Input coupling capacitor is given by , Xci = Z i / 10
Xci = 1/ 2ππππf Ci
Ci = ?
output coupling capacitor is given by ,
Xc0 = 1/ 2ππππf Co
Co =?
By-pass capacitor is given by, XCE = 1/ 2ππππf CE
CE =?

7/29/2019 Ec 2 Simulation Lab manuAL
http://slidepdf.com/reader/full/ec-2-simulation-lab-manual 22/56
www.Vidyarthiplus.in
© Copyright 2011-2015 – Vidyarthiplus.in (VP Group) Page 22
THEORY:
The Transistor Phase Shift Oscillator produces a sine waveof desired designed frequency. The RC combination will give a
60°°°° phase shift totally three combination will give a 180°°°° phase
shift. . The BC107 is in the common emitter configuration.Therefore that will give a 180°°°° phase shift totally a 360°°°° phaseshift output is produced. The capacitor value is designed in orderto get the desired output frequency. Initially the C and R areconnected as a feedback with respect to input and output and thiswill maintain constant sine wave output. CRO is connected at theoutput.PROCEDURE:
1. The circuit is constructed as per the given circuit diagram.
2. Switch on the power supply and observe the output on theCRO( sine wave)3. Note down the practical frequency and compare it with the
theoretical frequency.
RESULT :Theoritical Practical
Frequency f = 1 / 2 ΠΠΠΠ RC √√√√6RC

7/29/2019 Ec 2 Simulation Lab manuAL
http://slidepdf.com/reader/full/ec-2-simulation-lab-manual 23/56
www.Vidyarthiplus.in
© Copyright 2011-2015 – Vidyarthiplus.in (VP Group) Page 23
4. LC OSCILLATOR – HARTLEY and COLPITT OSCILLATOR
AIM :To Design and construct the given Oscillator at the given
operating frequency.APPARATUS REQUIRED:S.NO ITEM RANGE Q.TY1 TRANSISTOR BC 107 12 RESISTOR 1
3 CAPACITOR4 CRO (0 – 30)MHZ 15 RPS (0-30) V 1
6 FUNCTIONGENERATOR
(0- 1 ) MHz 1
7 DlB, DRB 1
CIRCUIT DIAGRAM :+VCC
RB1 Rc Co
CCin B
BC107E
RLRB2
RE CE
+ L1 - - L2 +
CRO
7/29/2019 Ec 2 Simulation Lab manuAL
http://slidepdf.com/reader/full/ec-2-simulation-lab-manual 24/56
www.Vidyarthiplus.in
© Copyright 2011-2015 – Vidyarthiplus.in (VP Group) Page 24
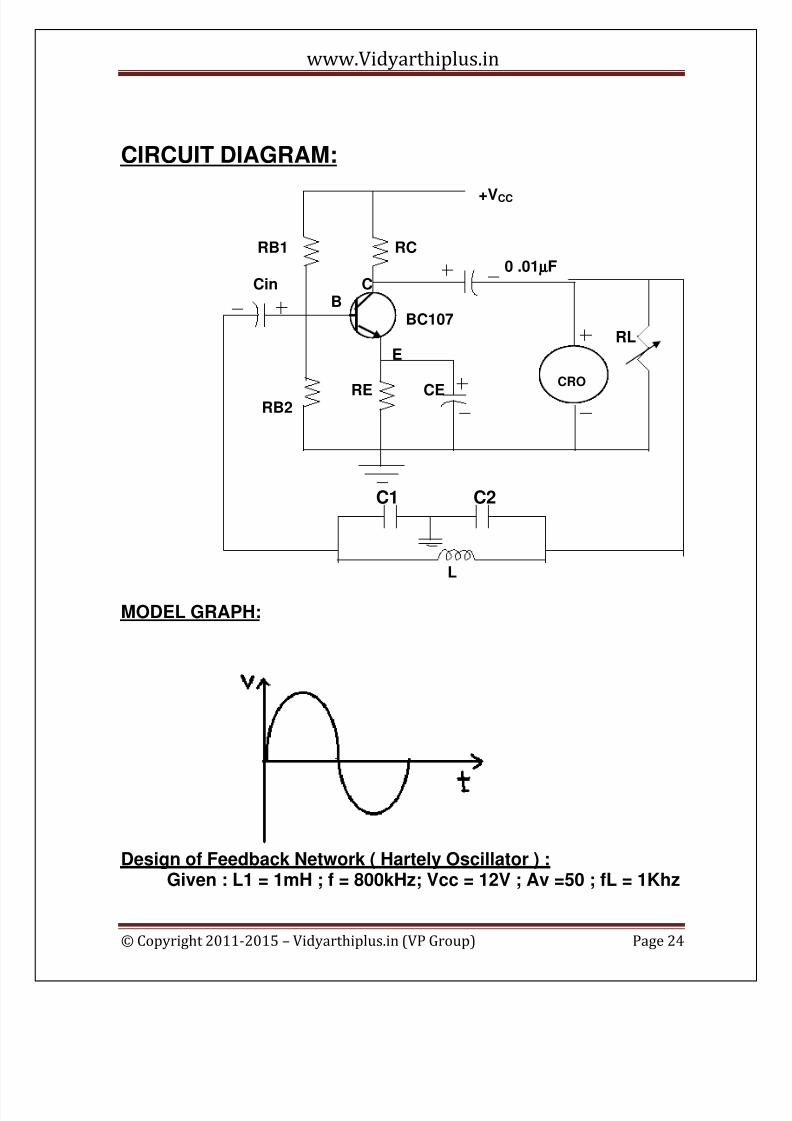
CIRCUIT DIAGRAM:
+VCC
RB1 RC
0 .01µµµµFCin C
BBC107
RLE
RE CERB2
C1 C2
L
MODEL GRAPH:
Design of Feedback Network ( Hartely Oscillator ) :Given : L1 = 1mH ; f = 800kHz; Vcc = 12V ; Av =50 ; fL = 1Khz
CRO

7/29/2019 Ec 2 Simulation Lab manuAL
http://slidepdf.com/reader/full/ec-2-simulation-lab-manual 25/56
www.Vidyarthiplus.in
© Copyright 2011-2015 – Vidyarthiplus.in (VP Group) Page 25
Av = 1 / β = -L1 / L2
F = 1/2π√(L1 + L2)C; C = ?
Design of Feedback Network ( Colpitt Oscillator ) :
Given : C1 = 0.1F;f =800kHz; Vcc = 12V ; Av = 50 ; S = 10
IE = 5mA; fi = 1kHz
Av = Av = 1 / β = C2 / C1
f = 1/2π√(C1 + C2) / LC1C2
L = ?
Amplifier Design :
Gain formula is given by
Av = -hfe RLeff / hie ( Av = 29, design given )
Assume, VCE = Vcc / 2
RLeff = R c |||| |||| RL
re = 26mV / IEhie = β re where re is internal resistance of the
transistor.
hie = hfe reVE = Vcc / 10
On applying KVL to output loop,
Vcc = IcRc + VCE + IERE
VE = IERE
Rc = ?;RL = ?
Since IB is very small when compared with Ic
Ic approximately equal to IE
RE = VE / IE = ?
VB = VBE + VE
VB = VCC . RB2 / RB1 + RB2

7/29/2019 Ec 2 Simulation Lab manuAL
http://slidepdf.com/reader/full/ec-2-simulation-lab-manual 26/56
www.Vidyarthiplus.in
© Copyright 2011-2015 – Vidyarthiplus.in (VP Group) Page 26
S = 1+ RB / RE
RB =?
RB = RB1|||||||| RB2
Find RB1 & RB2
Input Impedance, Zi = (RB |||||||| hie )
Coupling and bypass capacitors can be thus found out.
Input coupling capacitor is given by , Xci = Z i / 10
Xci = 1/ 2ππππf Ci
Ci = ?
output coupling capacitor is given by ,
Xc0 = (Rc RL) / 10
Xc0 = 1/ 2ππππf Co
Co =?
By-pass capacitor is given by, XCE = RE / 10
XCE = 1/ 2ππππf CE
CE =?THEORY:
LC oscillator consisting of a tank circuit for generatingsine wave of required frequency. Rectifying Barkhausen
criteria Aββββ for a circuit containing reactance Aββββ must bepositive and greater than or equal to unity.
PROCEDURE :1. The circuit connection is made as per the circuit
diagram.
2. Switch on the power supply and observe the outputon the CRO(sine wave ).3. Note down the practical frequency and compare it
with the theoretical frequency.THEORETICAL FREQUENCY FOR HARTLEY OSCILLATOR:
7/29/2019 Ec 2 Simulation Lab manuAL
http://slidepdf.com/reader/full/ec-2-simulation-lab-manual 27/56
www.Vidyarthiplus.in
© Copyright 2011-2015 – Vidyarthiplus.in (VP Group) Page 27
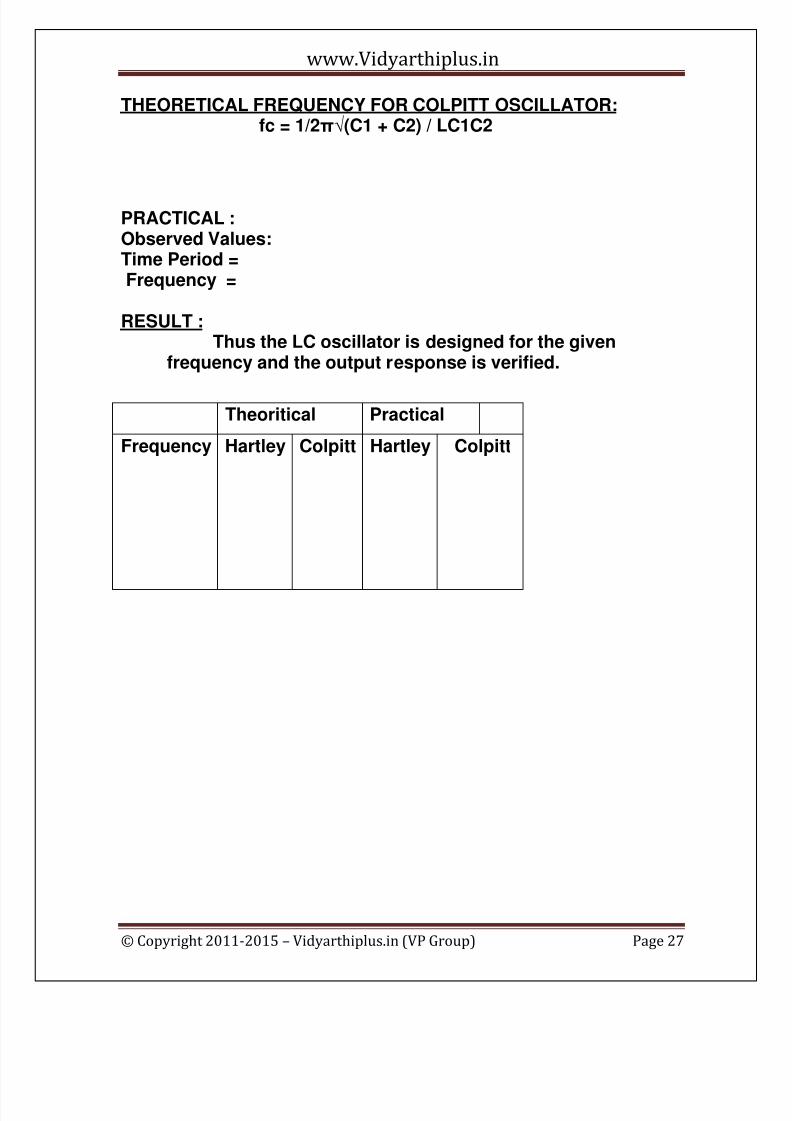
THEORETICAL FREQUENCY FOR COLPITT OSCILLATOR:fc = 1/2π√(C1 + C2) / LC1C2
PRACTICAL :Observed Values:Time Period =Frequency =
RESULT :Thus the LC oscillator is designed for the given
frequency and the output response is verified.
Theoritical Practical
Frequency Hartley Colpitt Hartley Colpitt

7/29/2019 Ec 2 Simulation Lab manuAL
http://slidepdf.com/reader/full/ec-2-simulation-lab-manual 28/56
www.Vidyarthiplus.in
© Copyright 2011-2015 – Vidyarthiplus.in (VP Group) Page 28
5. CLASS C SINGLE TUNED AMPLIFIERAIM:
To study the operation of class c tuned amplifier.
APPARATUS REQUIRED:
S.NO ITEM RANGE Q.TY1 TRANSISTOR BC 107 12 RESISTOR 4.2KΩΩΩΩ, 500ΩΩΩΩ, 197KΩΩΩΩ, 2.2KΩΩΩΩ, 1
3 CAPACITOR 0.1µµµµf
0.001µµµµf, 100µµµµf
21
4 CRO - 15 RPS (0-30) V 16 FUNCTION
GENERATOR- 1
+VCC = 10 V
CIRCUIT DIAGRAM:
10µµµµF
10KΩΩΩΩ
47KΩΩΩΩ
47µµµµF C
B 100KΩΩΩΩ BC107
E
Vin = 1 V 120KΩΩΩΩ 2.2kΩΩΩΩ +
F = 1 KHz 100µµµµF-
CRO

7/29/2019 Ec 2 Simulation Lab manuAL
http://slidepdf.com/reader/full/ec-2-simulation-lab-manual 29/56
www.Vidyarthiplus.in
© Copyright 2011-2015 – Vidyarthiplus.in (VP Group) Page 29
MODEL GRAPH:
THEORY:The amplifier is said to be class c amplifier if the Q Point and the
input signal are selected such that the output signal is obtainedfor less than a half cycle, for a full input cycle Due to such aselection of the Q point, transistor remains active for less than ahalf cycle .Hence only that much Part is reproduced at the outputfor remaining cycle of the input cycle the transistor remains cutoff and no signal is produced at the output .the total
Angle during which current flows is less than 180.
.This angle iscalled the conduction angle, Qc
PROCEDURE:1.The connections are given as per the circuit diagram.2. Connect the CRO in the output and trace the waveform.3.calculate the practical frequency and compare with the
theoretical Frequency4.plot the waveform obtained and calculate the bandwidth
RESULT:Thus a class c single tuned amplifier was designed and its
bandwidth is Calculated.

7/29/2019 Ec 2 Simulation Lab manuAL
http://slidepdf.com/reader/full/ec-2-simulation-lab-manual 30/56
www.Vidyarthiplus.in
© Copyright 2011-2015 – Vidyarthiplus.in (VP Group) Page 30
6. INTEGRATOR USING OP-AMPAIM:
To study the output waveform of integrator using op-amp.
APPARATUS REQUIRED:
APPARATUS NAME RANGE QUANTITY
AUDIO OSCILLATOR
CRO
RESISTORS
CAPACITOR
OP-AMP
BREADBOARD
RPS
1K,10K
0.1µµµµF
IC741
1
1
1
1
1
THEORY:A simple low pas RC circuit can also work as an integrator when
time constant is very large. This requires very large values of R and
C.The components R and C cannot be made infinitely large because of
practical limitations. However in the op-amp integrator by MILLER’s
theorem, the effective input capacitance becomes Cf (1-Av), where Av is
the gain of the op-amp. The gain Av is the infinite for an ideal op-amp, so
the effective time constant of the opamp integrator becomes very largewhich results perfect integration.
PROCEDURE:
1.Connections are given as per the circuit diagram.
2.The resistance Rcomp is also connected to the (+) input terminal
to minimize the effect of the input bias circuit.
3.It is noted that the gain of the integrator decreases with
increasing frequency.4.Thus the integrator circuit does not have any high frequency
problem.

7/29/2019 Ec 2 Simulation Lab manuAL
http://slidepdf.com/reader/full/ec-2-simulation-lab-manual 31/56
www.Vidyarthiplus.in
© Copyright 2011-2015 – Vidyarthiplus.in (VP Group) Page 31
CIRCUIT DIAGRAM: 0.1µµµµF
10kΩΩΩΩ
+Vcc=12V
2 7
-
3 IC741
+
4
-Vee=-12V
1kΩΩΩΩ
CRO

7/29/2019 Ec 2 Simulation Lab manuAL
http://slidepdf.com/reader/full/ec-2-simulation-lab-manual 32/56
www.Vidyarthiplus.in
© Copyright 2011-2015 – Vidyarthiplus.in (VP Group) Page 32
MODEL GRAPH:
Vi
t (msec)
Vo t(msec)
RESULT:- Thus the integrator using op-amp is studied.
7/29/2019 Ec 2 Simulation Lab manuAL
http://slidepdf.com/reader/full/ec-2-simulation-lab-manual 33/56
www.Vidyarthiplus.in
© Copyright 2011-2015 – Vidyarthiplus.in (VP Group) Page 33
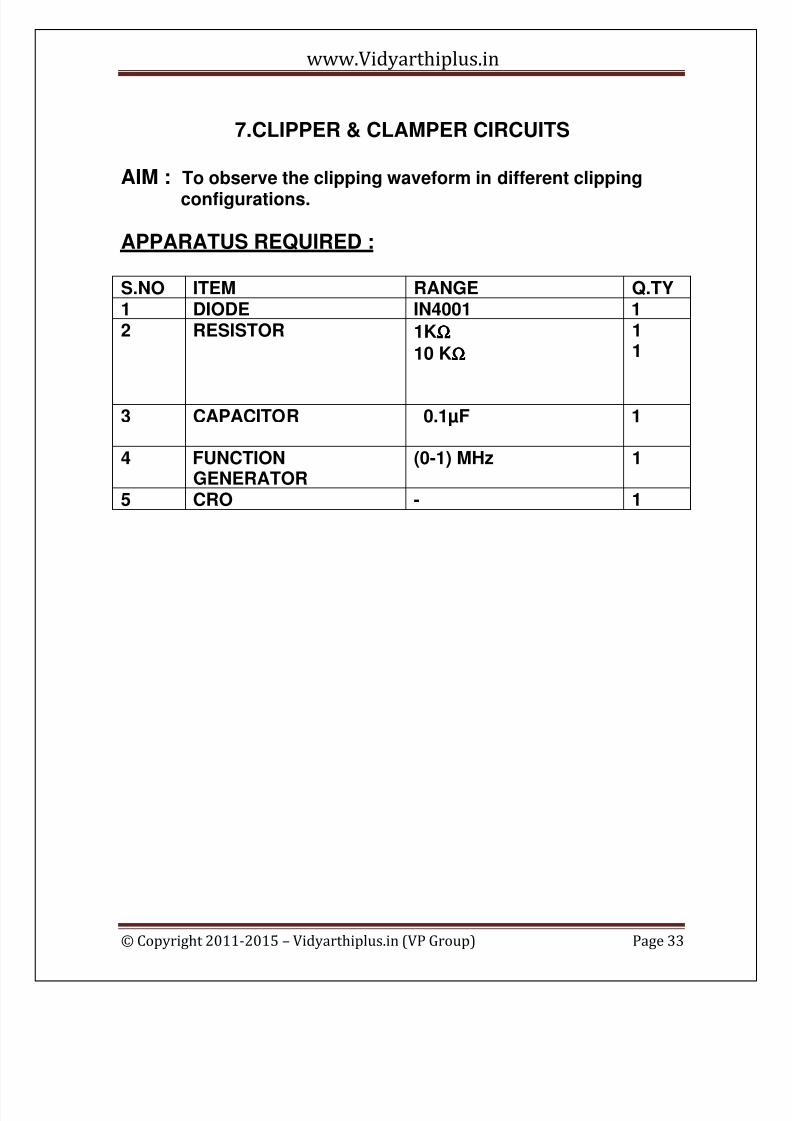
7.CLIPPER & CLAMPER CIRCUITS
AIM : To observe the clipping waveform in different clipping
configurations.
APPARATUS REQUIRED :
S.NO ITEM RANGE Q.TY1 DIODE IN4001 12 RESISTOR 1KΩΩΩΩ
10 KΩΩΩΩ
11
3 CAPACITOR 0.1µF 1
4 FUNCTIONGENERATOR
(0-1) MHz 1
5 CRO - 1
7/29/2019 Ec 2 Simulation Lab manuAL
http://slidepdf.com/reader/full/ec-2-simulation-lab-manual 34/56
www.Vidyarthiplus.in
© Copyright 2011-2015 – Vidyarthiplus.in (VP Group) Page 34
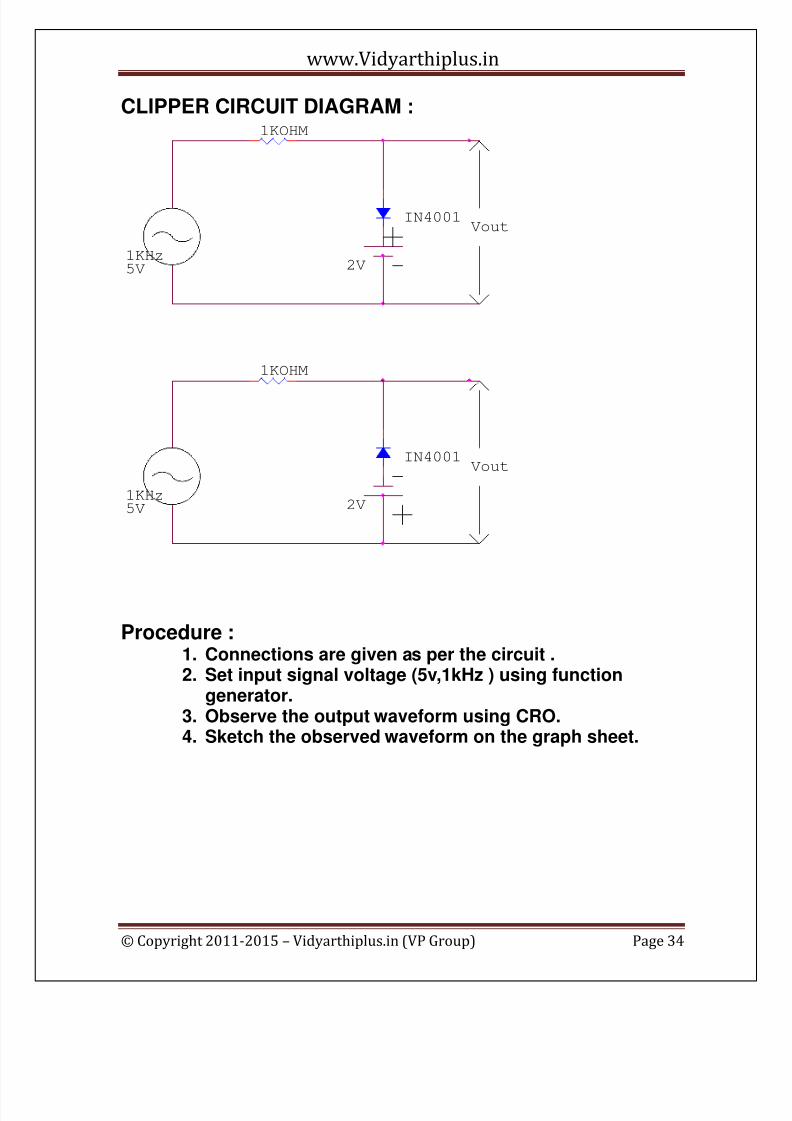
CLIPPER CIRCUIT DIAGRAM :
Vout
2V
IN4001
1KHz
5V
1KOHM
IN4001
1KHz
5V
1KOHM
2V
Vout
Procedure :1. Connections are given as per the circuit .2. Set input signal voltage (5v,1kHz ) using function
generator.3. Observe the output waveform using CRO.4. Sketch the observed waveform on the graph sheet.

7/29/2019 Ec 2 Simulation Lab manuAL
http://slidepdf.com/reader/full/ec-2-simulation-lab-manual 35/56
www.Vidyarthiplus.in
© Copyright 2011-2015 – Vidyarthiplus.in (VP Group) Page 35
CLAMPING CIRCUITS
Aim:
To study the clamping circuits(a). Positive clamper circuit (b) Negative clamper circuit
APPARATUS REQUIRED :
S.NO ITEM RANGE Q.TY1 DIODE IN4001 12 RESISTOR 1KΩΩΩΩ
10 KΩΩΩΩ
11
3 CAPACITOR 0.1µF 1
4 FUNCTIONGENERATOR
(0-1) MHz 1
5 CRO - 1
DESIGN :
Given f = 1kHzT = 1 / f = 1x 10- 3 Sec RC
Assuming, C = 0.1µF
R = 10 KΩΩΩΩ

7/29/2019 Ec 2 Simulation Lab manuAL
http://slidepdf.com/reader/full/ec-2-simulation-lab-manual 36/56
www.Vidyarthiplus.in
© Copyright 2011-2015 – Vidyarthiplus.in (VP Group) Page 36
Circuit Diagram : Positive clamperC =0.1µF
I/P IN4001 10K o/p Vo
Negative clamper
C = 0.1µF
I/P IN4001 10K o/p Vo
Procedure :1.Connections are given as per the circuit .
2. Set input signal voltage (5v,1kHz ) using functiongenerator.
3. Observe the output waveform using CRO.4. Sketch the observed waveform on the graph sheet.

7/29/2019 Ec 2 Simulation Lab manuAL
http://slidepdf.com/reader/full/ec-2-simulation-lab-manual 37/56
www.Vidyarthiplus.in
© Copyright 2011-2015 – Vidyarthiplus.in (VP Group) Page 37
Result :Thus the waveforms are observed and traced .for clipperand clamper circuits .

7/29/2019 Ec 2 Simulation Lab manuAL
http://slidepdf.com/reader/full/ec-2-simulation-lab-manual 38/56
www.Vidyarthiplus.in
© Copyright 2011-2015 – Vidyarthiplus.in (VP Group) Page 38
8. MONOSTABLE MULTI VIBRATOR
AIM:To Design the monostable multivibrator and plot the
waveform.
APPARATUS REQUIRED:
S.NO ITEM RANGE Q.TY1 IC NE555 12 RESISTOR 9KΩΩΩΩ 1
3 CAPACITOR 0.01µµµµF
0.1µµµµF
11
4 RPS (0-30) V 15 CRO - 1
THEORY:A monostable multivibrator has one stable state
and a quasistable state. When it is triggered by anexternal agency it switches from the stable state toquasistable state and returns back to stable state. Thetime during which it states in quasistable state isdetermined from the time constant RC. When it istriggered by a continuous pulse it generates a squarewave. Monostable multi vibrator can be realized by a pairof regeneratively coupled active devices, resistance
devices and op-amps.

7/29/2019 Ec 2 Simulation Lab manuAL
http://slidepdf.com/reader/full/ec-2-simulation-lab-manual 39/56
www.Vidyarthiplus.in
© Copyright 2011-2015 – Vidyarthiplus.in (VP Group) Page 39
DESIGN :Given Vcc = 12V ; VBB = - 2 V; Ic = 2 mA; VCE(sat) = 0.2 V ; h FE =
200 ;
f = 1kHz.
RC = VCC – VCE(sat) / IC = 12 – 0.2 / 2x 10 –3 = 5. 9 KΩΩΩΩ
IB 2(min) = Ic2 / hfe = 2mA / 200 = 10 µµµµA
Select IB 2 > IB 1(min) (say 25 µµµµA )
Then R = VCC – VBE(sat) / I B 2 = 12 – 0.7 / 25 x 10 -6 = 452 KΩΩΩΩ
T = 0.69 RC
1x10-3 = 0.69 x 452 x 10 3 C
C = 3.2 nF
VB1 = VBB R1 / R1 + R2 + VCE(sat) R2 / R1+R2
Since Q1 is off state, VB1 less than equal to 0.
Then VBB R1 / R1 + R2 = VCE(sat) R2 / R1+R2
VBB R1 = VCE(sat) R2
2R1 = 0.2R2
Assume R1 = 10 KΩΩΩΩ. Then R2 = 100 KΩΩΩΩ
C1 = 25pF( Commutative capacitor )
procedure :
1. Connect the circuit as per circuit diagram.2. Switch on the regulated power supply and observe the
output waveform at
the collector of Q1 and Q2 and plot it.

7/29/2019 Ec 2 Simulation Lab manuAL
http://slidepdf.com/reader/full/ec-2-simulation-lab-manual 40/56
www.Vidyarthiplus.in
© Copyright 2011-2015 – Vidyarthiplus.in (VP Group) Page 40
3. Trigger the monostable multivibrator with a pulse and
observe the change in waveform.
4. Plot the waveform and observe the changes before and
after triggering the input to the circuit.
CIRCUIT DIAGRAM :
+ VCC = +12v
5.9K 452k 5.9k10k
3.2nf
22pfC C
B B B
Vo1 BC107 BC107 VO2
E 100k E
-VBB
PROCEDURE:
The connections are made as per the diagram.
The value of R is chosen as 9kΩΩΩΩ. The DCB is set to the
designed value. The power supply is switched on and setto +5V.The output of the pulse generator is set to the desiredfrequency. Here the frequency of triggering should begreater than width of ON period (i.e.) T >W. The output isobserved using CRO and the result is compared with the

7/29/2019 Ec 2 Simulation Lab manuAL
http://slidepdf.com/reader/full/ec-2-simulation-lab-manual 41/56
www.Vidyarthiplus.in
© Copyright 2011-2015 – Vidyarthiplus.in (VP Group) Page 41
theoretical value. The experiment can be repeated fordifferent values of C and the results are tabulated.
OBSERVATION
C (uf) Theoritical(T=1.095 RC(ms))) PracticalT(ms)
RESULT: Thus the monostable multivibrator using IC555 isdesigned and its output waveform is traced.

7/29/2019 Ec 2 Simulation Lab manuAL
http://slidepdf.com/reader/full/ec-2-simulation-lab-manual 42/56
www.Vidyarthiplus.in
© Copyright 2011-2015 – Vidyarthiplus.in (VP Group) Page 42
9.ASTABLE MULTIVIBRATORAIM :
To design a astable multivibrator and study thewaveform.
APPARATUS REQUIRED :
S.NO ITEM RANGE Q.TY1 TRANSISTOR BC107 22 RESISTOR 980KΩΩΩΩ
4.9KΩΩΩΩ
22
3 CAPACITOR 0.74nF 2
4 RPS (0-30) V 15 CRO - 1
THEORY :
Astable multivibrator has no stable state, but has twoquasi – stable states. The circuit oscillates between thestates (Q1 ON , Q2 OFF) and (Q2 ON , Q! OFF). The outputat the collector of each transistor is a square wave.Therefore this circuit is applied as a square wavegenerator. Refer to the fig each transistor has a biasresistance RB and each base is capacitor coupled to thecollector of other transistor. When Q1 is ON and Q2 isOFF, C1 is charged to ( Vcc – VBE1) positive on the rightside. For Q2 ON and Q! OFF, C2 is charged to (Vcc – VBE2)positive on the left side.

7/29/2019 Ec 2 Simulation Lab manuAL
http://slidepdf.com/reader/full/ec-2-simulation-lab-manual 43/56
www.Vidyarthiplus.in
© Copyright 2011-2015 – Vidyarthiplus.in (VP Group) Page 43
CIRCUIT DIAGRAM : + VCC = +10v
4.9KΩΩΩΩ 980KΩΩΩΩ 980KΩΩΩΩ 4.9KΩΩΩΩ
0.74nF 0.74nF
C C
B BVo1 BC107 BC107 VO2
E E
DesignGiven Vcc = 10V ; Ic = 2 mA; h FE = 200 ; f = 1 kHz
R ≤≤≤≤ h FE Rc
RC = VCC – VC2(sat) / IC = 10 – 0.2 / 2x 10 –3 =4. 9 KΩΩΩΩ
R ≤≤≤≤ 200 x 4.9 x 103 = 980 KΩΩΩΩ
T = 1.38 RC
1 x 10-3 = 1.38 x 980 x 103 x C
C =0.74 nF

7/29/2019 Ec 2 Simulation Lab manuAL
http://slidepdf.com/reader/full/ec-2-simulation-lab-manual 44/56
www.Vidyarthiplus.in
© Copyright 2011-2015 – Vidyarthiplus.in (VP Group) Page 44
Waveforms :
PROCEDURE :1. The connections are given as per the circuit
diagram.2. Switch on the power supply.3. Observe the waveform both at bases andcollectors
of Q1 and Q2.4. Connect the CRO in the output of Q1 and Q2 and
trace the square waveform.

7/29/2019 Ec 2 Simulation Lab manuAL
http://slidepdf.com/reader/full/ec-2-simulation-lab-manual 45/56
www.Vidyarthiplus.in
© Copyright 2011-2015 – Vidyarthiplus.in (VP Group) Page 45
RESULT :
Thus the square wave forms are generated usingastable multivibrator.

7/29/2019 Ec 2 Simulation Lab manuAL
http://slidepdf.com/reader/full/ec-2-simulation-lab-manual 46/56
www.Vidyarthiplus.in
© Copyright 2011-2015 – Vidyarthiplus.in (VP Group) Page 46
10.BISTABLE MUITIVIBRATOR
AIM:To design a bistable multivibrator and study the output
waveform.
Apparatus Required:
S.NO ITEM RANGE Q.TY1 TRANSISTOR BC 107 12 RESISTOR 4.7KΩΩΩΩ
22KΩΩΩΩ
22
3 CAPACITOR 0.022µµµµf10µµµµf100Pf
222
4 CRO - 15 RPS (0-30) V 16 FUNCTION
GENERATOR- 1
THEORY:The bistable multivibrator is a switching circuit with a
two stable state either Q1 is on and Q2 is off (or)Q2 is on and Q1is off. The circuit is completely symmetrical. load resistors RC1
and RC2 all equal and potential
Divider (R1,R2)and (R1′′′′ and′′′′R2 ′′′′) from identical bias Network at thetransistor bases. Each transistor is biased from the collector ofthe otherDevice when either transistor is ON and the other transistor isbiased OFF.C1andC2 operate as speed up capacitors or memorycapacitors.
Design :

7/29/2019 Ec 2 Simulation Lab manuAL
http://slidepdf.com/reader/full/ec-2-simulation-lab-manual 47/56
www.Vidyarthiplus.in
© Copyright 2011-2015 – Vidyarthiplus.in (VP Group) Page 47
Given Vcc = 12V ; VBB = -12v; Ic = 2mA; VC(sat) = 0.2 V
VBE(sat) = 0.7V
Assume Q1 is cut-off Vc1 = VCC(+12V)
Q2 is in saturation (ON) Vc2 = Vc(sat) (0.2 V)
Using superposition principle,
VB1 = VBB[ R1 / R1 + R2 ] + Vc2[ R2 / R1+R2 ] << 0 .7
Let us consider VB1 = -1V
Then -1 = [-12R1/R1+R2 ] + [ 0.2R2 / R1+R2 ]
Assume R1 = 10KΩΩΩΩ such that it ensures a loop gain in excess of unity
during the transition between states. The inequalityR1 < hfe Rc
R2 = 91.67 KΩΩΩΩ
Test for conditions : Q1 = cut-off (Vc1 = 12V )
Q2 = Saturation / (ON) (VC2 = 0.2V)
Minimum base current, IB (min) must be less than the base current (IB)
i.e.,
IB (min) < IB
Calculate hfe from multimeter (say = 200)
IB 2(min) = Ic2 / hfe
Ic2 = Ic – I3
Ic2 = ( 2 – 0.12 )mA = 1.88 mA
IB 2(min) = 1.88mA / 200 = 9.4 µµµµA
IB 2 = I1 – I2
IB 2 = (0.71 – 0.14 )mA = 0.57 mA
Since IB 2 > IB 2(min) ,Q2 is ON
C1 = 25 pF ( Commutative capacitor )

7/29/2019 Ec 2 Simulation Lab manuAL
http://slidepdf.com/reader/full/ec-2-simulation-lab-manual 48/56
www.Vidyarthiplus.in
© Copyright 2011-2015 – Vidyarthiplus.in (VP Group) Page 48
IC = VCC – Vc2 / RC
RC = VCC – Vc2 / IC = 12 – 0.2 / 2x 10–3
= 5.9 KΩΩΩΩ
I3 = Vc2 - VBB / R1 + R2 = 0.2 + 12 / ( 10 + 91.6 )K = 0.12mA
I1 = Vc1 - VBE / RC + R1 = 12 – 0.7 / ( 5.9 + 10 ) K = 0.71mA
I2 = VBE - VBB / R2 = 0.7 + 12 / 91.6K = 0.14 mA
Procedure :
1. Connect the cir cuit as per circuit diagram.
2. Switch on the regulated power supply and observe the output
waveform at the collector of Q1 and Q2.
3. Sketch the waveform.4. Apply a threshold voltage and observe the change of states of Q1
and Q2.
5. Sketch the waveform.

7/29/2019 Ec 2 Simulation Lab manuAL
http://slidepdf.com/reader/full/ec-2-simulation-lab-manual 49/56
www.Vidyarthiplus.in
© Copyright 2011-2015 – Vidyarthiplus.in (VP Group) Page 49
CIRCUIT DIAGRAM :+ Vcc = +12 V
5.9KΩΩΩΩ 5.9KΩΩΩΩ I1 I3
10 KΩΩΩΩ 10KΩΩΩΩ
50pF 50pF
C CB B
BC10722 BC107
91.67k E
10 E I4 I2 91.67k 10µµµµF
TRIGGERTRIGGER IP
-VBB
OBSERVATION :
VOLTAGE Time Period Frequency AmplitudeVC1
Vc2
RESULT:
Thus the bistable multivibrator is designed and thesquare waveforms are generated at the output.
CRO
CRO

7/29/2019 Ec 2 Simulation Lab manuAL
http://slidepdf.com/reader/full/ec-2-simulation-lab-manual 50/56
www.Vidyarthiplus.in
© Copyright 2011-2015 – Vidyarthiplus.in (VP Group) Page 50
CYCLE IISIMULATION LAB
1. Differential Amplifier
Aim : Calculate the dc voltage gain , the input resistanceand theoutput resistance of a differential amplifier with a transistorcurrent source.Specifications: The input voltage is 0.1v. The model parametersof the bipolar transistors are BF = 50,RB = 70, RC = 40.
Circuit Diagram :
0
0
0
Q1A
R1
1.5k
R2
10K
R3
10K
R4
150 K
R5
150K
R6
1.5K
R7
20K
V1
Q1A
Q1A
Q1A Q1A
V2
12v
V3
12v

7/29/2019 Ec 2 Simulation Lab manuAL
http://slidepdf.com/reader/full/ec-2-simulation-lab-manual 51/56
www.Vidyarthiplus.in
© Copyright 2011-2015 – Vidyarthiplus.in (VP Group) Page 51
Program :
Vcc 11 0 12v
VEE 0 10 12vVIN 1 0 DC 0.25vRC1 11 3 10kRC2 11 5 10kRE1 4 12 150RE2 7 12 150RS1 1 2 1.5kRS2 6 0 1.5kRx 11 8 20k
Q1 3 2 4 QNQ2 5 6 7 QNQ3 12 8 9 QNQ4 9 9 10 QNQ5 8 9 10 QN
. TF V (3,5) VINEND
The results of the transfer – function analysis by the .TF
commands are given below

7/29/2019 Ec 2 Simulation Lab manuAL
http://slidepdf.com/reader/full/ec-2-simulation-lab-manual 52/56
www.Vidyarthiplus.in
© Copyright 2011-2015 – Vidyarthiplus.in (VP Group) Page 52
ACTIVE LOW BUTTER FILTER
1VAC 0VDC VIN
VCC
VEE
0
0
0
0
0
uA741
3
2
7
4
6
1
5+
-
V +
V -
OUT
OS1
OS2
R1
1k
1K R3
0.586 RF
1K R2
C1
1n
C2
1n12VDC
12VDC
PROGRAM:
LOW PASS FILTER
VCC 6 0 DC 12V
VEE 0 7 DC 12V
VIN 1 0 AC 1V
R1 4 0 1K
R2 1 2 1K
R3 2 3 1K
RF 4 5 0.586KC2 2 5 0.079 UF
C3 3 0 0.079UF
X1 4 3 6 7 5 UA 741
.LIB NOB .LIB
.AC DEC 10HZ 100HZ 1MEGHZ
.PROBE
.END

7/29/2019 Ec 2 Simulation Lab manuAL
http://slidepdf.com/reader/full/ec-2-simulation-lab-manual 53/56
www.Vidyarthiplus.in
© Copyright 2011-2015 – Vidyarthiplus.in (VP Group) Page 53
PROGRAM FOR FREE RUNNING MULTIVIBRATOR
VCC 6 0 DC 12V
VEE 0 7 DC 12V
R1 1 0 100K
R2 2 3 100K
R3 2 3 10K
C1 3 0 0.1 UF IC = -5V
XA1 1 3 6 7 2 UA741
.LIB EVAL .LIB
.TRANS 10US 4MS UIC
.PROBE
.END
VCC
VEE VOT
0
0
0
U2
AD741
3
2
7
4
6
1
5
+
-
V
+
V -
OUT
OS1
OS2
100K R2
100K R1
10K R3
0.1 UF C1
12V
-12V
7/29/2019 Ec 2 Simulation Lab manuAL
http://slidepdf.com/reader/full/ec-2-simulation-lab-manual 54/56
www.Vidyarthiplus.in
© Copyright 2011-2015 – Vidyarthiplus.in (VP Group) Page 54
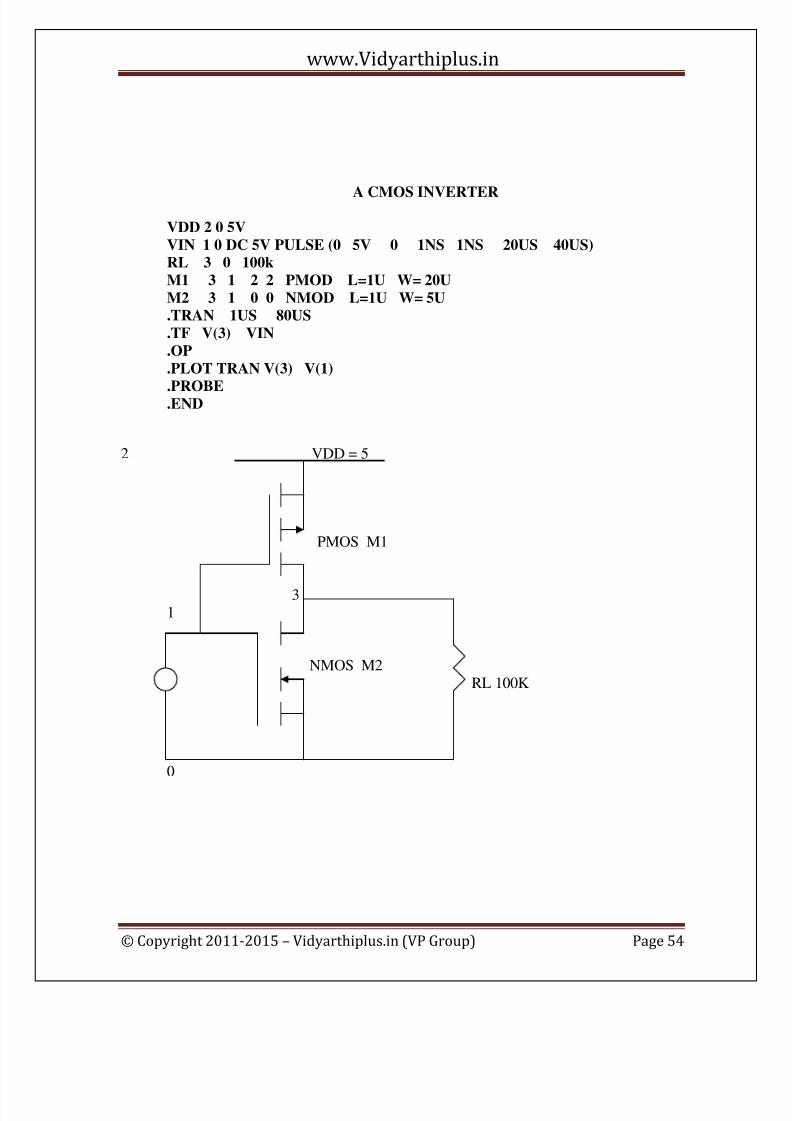
A CMOS INVERTER
VDD 2 0 5V
VIN 1 0 DC 5V PULSE (0 5V 0 1NS 1NS 20US 40US)
RL 3 0 100k
M1 3 1 2 2 PMOD L=1U W= 20U
M2 3 1 0 0 NMOD L=1U W= 5U
.TRAN 1US 80US
.TF V(3) VIN
.OP
.PLOT TRAN V(3) V(1)
.PROBE
.END
2 VDD = 5
PMOS M1
3
1
NMOS M2
RL 100K
0

7/29/2019 Ec 2 Simulation Lab manuAL
http://slidepdf.com/reader/full/ec-2-simulation-lab-manual 55/56
www.Vidyarthiplus.in
© Copyright 2011-2015 – Vidyarthiplus.in (VP Group) Page 55
ANALOG MULTIPLIER
V1 1 0 1V
V2 4 0 1V
R1 1 2 1K
R2 4 5 1K
R3 3 7 1K
R4 6 7 1K
R5 7 8 1K
R6 10 0 1K
D1 2 3 DA
D2 5 6 DA
D3 8 9 DA
.MODEL DA D
X1 2 0 3 IOP
X2 5 0 6 IOP
X3 7 0 8 IOP
X4 9 0 10 IOP
.SUBCKT IOP M P V0
RI M P 1G
E V0 0 P M 2E5
.ENDS
.DC V1 -1 1 0.1
.PROBE
.END

7/29/2019 Ec 2 Simulation Lab manuAL
http://slidepdf.com/reader/full/ec-2-simulation-lab-manual 56/56
www.Vidyarthiplus.in
0
0
0
0
0 0
0
U2
AD741
3
2
7
4
6
1
5+
-
V +
V -
OUT
OS1
OS2
R17
1kR26
1k
V8
0V
U2
AD741
3
2
7
4
6
1
5+
-
V +
V -
OUT
OS1
OS2
R17
1kV8
0V
U2
AD741
3
2
7
4
6
1
5+
-
V +
V -
OUT
OS1
OS2D1
1N4376
1 2
R26
1k
U2
AD741
3
2
7
4
6
1
5+
-
V +
V -
OUT
OS1
OS2
R27
1k