east asian trade - productivity commission
TRANSCRIPT

INDUSTRY COMMISSION
Strategic Trade Theory: The East Asian Experience
RM'ATI PAPER
NOVEMBER 1990
Canberra
© Commonwealth of Australia 1990
This work is copyright. The Copyright Act 1968 permits fair dealing for study, research, news reporting, criticism or review. Selected passages, tables or diagrams may be reproduced for such purposes provided acknowledgment of the source is included.
ISBN 0 642 15737 5
Inquiries should be direct to:
The Publications Officer Industry Commission PO Box 80
Benjamin Offices Chan Street Belconnen ACT Belconnen ACT 2616
Telephone: 06 264 1144 Facsimile: 06 253 1186 Telex: AA 62283
Graphics and layout by the Centre for International Economics, Canberra.
Printed in Australia by Pine Printers Sales Pty Ltd, Fyshvvick ACT.

PREFACE
International trade theory has been revitalised in recent years by the development of ideas whichsuggest that under certain conditions government intervention can improve national economicwelfare. The new theories, known as 'strategic trade theories', have been offered as intellectualsupport for policies which target assistance to key sectors of the economy. The ideas behindthese theories are not totally new. They combine old ideas and newer analytical methods,adapted from the economics of industrial organisation literature. They constitute a freshpresentation, often with a clearer theoretical focus. Strategic trade theories were reviewed in the1988-89 annual report of the Industries Assistance Commission. A recent assessment of theirpolicy relevance is provided by Grossman (1990).
A careful examination of strategic trade theories shows, however, that they are often eitherbased on fragile assumptions or unworkable because of implementation problems. Keyassumptions can be described as fragile since they do not easily hold in practice and slightchanges can produce very different results. Implementation problems arise because it is sodifficult to determine when the key assumptions are being met. The adoption of such policiesalso encounters 'moral hazard' problems in that there is a strong possibility that a 'hand-out' or'rent seeking' mentality will be generated, with a consequent waste of resources and loss ofdynamism.
Although strategic trade theories might be theoretically fragile, there are many advocates ofgovernment intervention who argue that in practice there is good evidence that targeting, as wellas more broadly drawn government intervention, works. The example which is generallyoffered is the role that targeting has played in the success of several Asian economies.However, before government intervention could be convincingly accepted as an essentialingredient in the impressive performance of these economies, it is necessary to show that otherfactors were of minor importance. In other words the debate should ideally explore the state ofthese economies in the absence of government intervention.
In line with the general policy guidelines of Section 22 of the Commission's Act — concerningthe relationship between assistance and international competitiveness — this paper examines therelevance of industry-specific interventions to the success of five East Asian economies andconsiders the lessons from this for Australia. It attempts to put in perspective the role ofgovernment intervention in contributing to the exceptional economic performance of Japan andthe Dynamic Asian Economies (DAEs) of Korea, Taiwan, Hong Kong and Singapore. Such anevaluation is very difficult given the complexity of the economies, but it should be worthwhilein view of the casual observations that are often made about industry policy and its effects onthese and other economies.
Research for the paper was undertaken by John Fallon, Agnes Walker and Chris Bell.
UI


CONTENTS
PREFACE
SUMMARY 1
1. ECONOMIC PERFORMANCE OF JAPAN AND THE DAEs 3
2. JAPAN 6 The initial conditions for rapid growth 6 Technological catch-up 7 Government intervention 9
3. THE DYNAMIC ASIAN ECONOMIES 18 Korea 19 Taiwan 26 Hong Kong 28 Singapore 29
4. COMMON FACTORS 32 Social consensus, commitment to economic growth and strong government 32 The 'catch-up' factor 33 Outward orientation and international competitiveness 37 A liberal trading environment 40 Labour markets 41 Saving 46 Other factors: infrastructure, research and development, human capital and
marketing assistance 51
5. SUCCESSES AND FAILURES OF STRATEGIC TRADE POLICIES 53 Strategic trade policies and industry performance 53 The costs of rapid growth 59
6. LESSONS FOR AUSTRALIA 61 Growth and international competitiveness 61 Relevance of East Asian experiences 61 Conclusions 64
V

APPENDIXES A Technological catch-up and the initial conditions for growth 65
B Revealed comparative advantage 68
C International competitiveness 72
D The motor vehicle industry in Japan — a case study 73
E Japan's MITI and Ministry of Finance 85 F Economic indicators: Australia, Japan, Korea, Taiwan, Hong Kong, Singapore 88
REFERENCES 94
BOX D1 Sources of labour productivity 83
FIGURES 1 Growth of real gross national product per person 5
2 Revealed comparative advantage 35 3 Shares of major exports in total exports 36
4 Competitiveness indicators, Japan and Australia 38
5 Market orientation indicators 39
6 Growth in the value of merchandise trade 41
7 Employee productivity trends 44 8 Labour force indicators 45
9 Industrial efficiency indicators 45 10 Saving and investment as shares of GNP 48
11 Research and development expenditure 51
12 Educational enrolments 52 D1 Motor vehicle production 73
D2 Labour productivity and output in the motor vehicle industry 79 D3 Productivity and quality at assembly plant level 81
D4 Fixed assets per employee, Chrysler and Toyota 82
TABLES 1 Economic indicators 4 2 Comparative productivity growth 5 3 Total subsidies as a share of GDP 9 4 Industrial subsidies as a share of industry value added 10 5 Government-financed R&D expenditure in the enterprise sector 10 6 Receipts from customs and import duties as a share of imports 10 7 Import coverage indexes 11
8 Net tax/subsidy rates on capital and labour 11 9 Income distribution in various countries 21

10 Effective rates of protection and effective export subsidies 23 11 Trade policy reforms in Korea 24 12 Export and curb market lending interest rates in Korea 24 13 Competitiveness rankings DAEs 38 14 Various indicators of labour market characteristics 42 15 Total compensation in manufacturing 43 16 Trends in labour market characteristics in Korea 46 17 Personal sector saving rates, by age of family head: Japan and the United States 47 18 Mortgage and consumer credit as a share of GNP: Japan and the United States 49 19 Annual growth in Japan's real output, by industry 54 20 Government intervention and performance in Japan 55 21 Annual growth in Korea's real output, by industry 56 22 Government intervention and performance in Korea 56 23 Merchandise trade performance in 1979 and 1989 62 Al Dispersion of GDP per person among 24 OECD countries 65 A2 Sources of Asian economic growth 66 A3 Sources of economic growth in various OECD economies and Korea 67 B1 Revealed comparative advantage index 68 B2 Description of comparative advantage categories 69 B3 Exports of selected commodities, as a share of total exports 70 Cl Explanation of categories used by the World Economic Forum 72 D1 Government interventions in Japan's motor vehicle industry 74 D2 Hourly compensation costs for production workers in the motor vehicle industry 77 D3 Investment as a share of output 81 Fl Economic indicators: Australia 88 F2 Economic indicators: Japan 89 F3 Economic indicators: Korea 90 F4 Economic indicators: Taiwan 91 F5 Economic indicators: Hong Kong 92 F6 Economic indicators: Singapore 93
VII


SUMMARY
In Australia, manufacturing industry has traditionally received strong government support. Although assistance is on the decline, there are still some who challenge the view that freeing up the economy is a key to better economic performance. Recently, manufacturing has been once again cited as requiring special assistance.
Several arguments have been put forward in favour of policies which target particular sectors of the economy, with one strand relying on the new 'strategic trade theories'. Some have claimed that there is good evidence that policies based on these theories have worked well in practice and have contributed to the impressive growth performance of certain East Asian economies.
The Commission has studied the experiences of Japan and the Dynamic Asian Economies (DAEs) of Korea (Republic of), Taiwan, Hong Kong and Singapore in an attempt to understand better the role of strategic interventions in their exceptional economic success. Key economic, social and institutional features were considered in order to identify common factors that supported growth and to assess the lessons for Australia.
The available evidence suggests that it is naive to argue that the success of Japan and the DAEs can be explained principally by governments providing industry-specific assistance. The extent and form of government intervention varied considerably among these economies. Hong Kong is the outstanding example of the benefits of free markets, in an environment that protects private property and provides public safety, while Japan and the other DAEs have at times implemented policies which involved considerable intervention. But, where success was observed, any specific support was broadly market conforming and was normally withdrawn within a relatively short period of time.
Japan and each of the DAEs have faced a number of common factors:
• Each economy experienced a period of crisis or rapid and widespread change before the rapid growth phase.
• The crisis contributed to the emergence of a strong social consensus in favour of growth and provided a flexible and responsive economic environment.
• In all five East Asian economies, governments were strong in the sense that they were able to ensure that the legal, social and institutional frameworks necessary for the effective operation of markets were in place — including relatively free exchange, public security and the ability to resist special interest pleas. Acceptance of strong government was facilitated by a relatively even distribution of economic gains.
• There was an unusual historical opportunity to exploit the 'catch-up' factor in the use of technology and production methods. When starting from a low base it is possible to grow
1
STRATEGIC TRADE THEORY
quickly if countries have the basic economic and social characteristics to absorb and adopt modern production methods.
., Once rapid growth began it was sustained by vigorous competition either domestically (Japan) or internationally (DAEs) and by high investment and high saving rates.
• The competitive environment was underpinned by a plentiful, flexible and competitive labour supply.
Thus, there were a number of important common factors other than any government targeting of key sectors. As well, the nature and extent of interventions varied considerably, so there is no convincing evidence that targeting was crucial to good economic performance. Some industries succeeded with government intervention but, because of the many other factors involved, it is difficult to isolate its contribution. Also, there were assisted industries that failed and unassisted industries that succeeded.
Overall, rapid growth in the five East Asian economies seems to have been made possible by the presence, at the right time, of certain key social and economic factors. Strategic trade policies were neither a necessary nor a sufficient condition for success.
Australia has very different characteristics from those of Japan and the DAEs. Most Australians would not wish to face a period of substantial crisis, and the opportunities for achieving growth through the 'catch-up' process — as for developed countries generally — are limited. The East Asian experience does, however, still offer some valuable insights for Australia.
First, industry-specific assistance is far from being a prerequisite for success and is likely to be harmful, especially if it is extensive and maintained over long periods of time.
Second, policies which encourage competition in product markets should be vigorously pursued if Australia's economic performance is to be improved, as competitiveness is the key to successful upgrading and innovation.
Third, the operation of labour markets needs to be improved. This does not necessarily mean longer hours and lower wages. It is possible to have more leisure and income if productivity is higher. This could be achieved through greater flexibility, greater effectiveness of workers while on the job, less industrial unrest, and an increased willingness to retrain, undertake new tasks and accept labour-saving technology. It is also important to have employment conditions that are responsive to changes in economic circumstances.
Fourth, because of Australia's geographic isolation it is all the more important to have a well-functioning and efficient transport and communications system.
2

ECONOMIC PERFORMANCE OF JAPAN AND THE DAES
Economic performance, in terms of the growth of real gross national product (GNP) per person, was exceptional for Japan in the 1950s and 1960s and for the DAEs from about the early to mid-1960s (figure 1).
In Japan annual real economic growth was sustained at an average of around 10 per cent in the 1950s and 1960s, with total factor productivity growth being more than twice the OECD average (tables 1 and 2). A general slowdown in output and productivity growth occurred after the oil price rises of 1973-74, but Japan still managed to achieve a better performance in relation to OECD countries through the 1970s and 1980s.
With the exception of Hong Kong, where rapid growth was evident throughout the 1960s, the growth spurt generally began in the DAEs in the mid-1960s (figure 1). Their performance has been reflected in high labour productivity growth and more recently in the accumulation of large current account surpluses. From the mid-1970s to the mid-1980s the four DAEs recorded labour productivity growth which was on average about 4 percentage points higher than in Australia (table 2). Their current account surpluses ranged between 3 and 16 per cent of GNP by the period 1985 to 1988, compared with a deficit of some 5 per cent for Australia. The current account surpluses of Korea and Taiwan decreased considerably by 1989 — and are still falling — reflecting a substantial loss of competitiveness since 1987 (tables 1 and F3, F4 in appendix F).
Japan's general reliance on the domestic market is highlighted by the relatively low share of trade in its GNP over the past three decades. For the DAEs, made (both exports and imports) was a much more important contributor to growth (table 1). Exports as a share of GNP in Korea increased from a few per cent in the 1950s to around 40 per cent by 1988, and in Taiwan quadrupled over the same period. In Hong Kong and Singapore trade — which already made up a very large part of the economy in the 1970s — became even more important in the 1980s.
In Japan, high saving rates (29-37 per cent of GNP since the mid-1950s compared with 20-24 per cent in Australia) helped sustain high investment. In the DAEs, saving and investment rates were similar to those in Japan by 1988, but were relatively low in the early years of their rapid growth periods (table 1).
All five East Asian economies are poor in natural resources and their limited land base has led to high population densities. Given their poor natural resource base, exceptional growth in these economies was made possible through the effective use of their human resources.
3

STRATEGIC TRADE THEORY
Table 1: Economic indicators
Population (dium) Population density (pc:mom/1=2)
Hong Singa- Aust- HongDSinga- Aust-
Japan Korea TaiwanDKong pore ralia Japan KoreaDTaiwanDKongDpore ralia
10 3 na 10 241 229 271 2572 no 11955-59 91 23 98 28 12 4 2 11 260 284 346 3429 3008 11960-69
292 352 446 4150 3622 21970-79 110 35 16 4 2 14 5 2 15 313 397 512 4979 4000 21980-84 118 39 18
422 544 5329 4206 21985-88 122 42 20 6 3 16 322
1988 122 43 20 6 3 17 324 430 553 5430 4270 2
Real GNP° (average annual growth, per can) Real GNP° per person (average annual growth, ',ocean)
HongDSinga- Aust- HongDSinga-DAust-
Japan Korea Taiwan Kong pore ralia Japan Korea Taiwan Kong pore ralia
no 1.71955-59 8.4 4.3 5.9 6.5 na 4.0 7.4 1.5 23 0.5 7.2 5.6 3.21960-69 10.9 7.5 9.2 10.2 83 53 9.8 4.7 5.8
3.5 4.1 7.4 8.2 6.9 7.5 1.81970-79 53 9.4 10.3 9.5 9.1 0.91980-84 3.9 6.1 6.9 7.8 9.0 23 3.1 45 5.1 6.2 7.8
83 5.6 43 2.01985-88 43 113 9.5 7.0 5.5 35 3.7 9.9 1988 5.7 12.2 73 7.2 10.8 3.2 5.4 10.9 6.1 6.0 9.7 1.6
8.1 3.31989 4.9 6.1 7.4 2.5 9.2 4.9 4.6 4.8 6.2 1.4
EXpOrtSb (per cent of GNP) illIportsb (per cent of (INP)
Hong Singa- Aust- Hong Singa- Aust-
Japan Korea Taiwan Kong pore ralia Japan Korea Taiwan Kong pore ralia
18 no no 171955-59 9 1 13 na na 16 9 11 120 15 10 18 22 n a 141 16
1970-79 13 26 44 87 146 15 12 32 42 85 165 15
1980-84 16 37 53 93 200 16 15
1960-69 10 8 19 na
40 48 95 208 18
1985-88 14 40 57 122 164' 17 11 34 42 116 170' 19
1988 13 41 56 144 175d 17 10 33 45 138 181d 18
Saving tpercentofesrP) Investment (per cent of GNP)
Hong Singa- Aust- Hong Singa- Aust-
Japan Korea Taiwan Kong pore ralia Japan Korea Taiwan Kong pore ralia
1955-59 29 4 12 6 na 21 29 na 17 15 10 23
1960-69 37 10 18 10 13 23 37 13 21 21 20 26
1970-79 36 22 31 28 28 24 35 27 30 23 43 26
31 24 32 29 40 21 30 29 27 31 48 251980-84 1985-88 32 34 36 3V 41 20 29 30 20 26 38 25
42 21 31 30 26 31' 35 261988 34 38 35 33d
Current account (par cent of GNP) Relative unit labour coste (1987.400)
Hong Singa- Aust- Hong Singa- Attst-Japan Korea Taiwan Kong pore ralia Japan Korea Taiwan Kong pore ralia
1955-59 0.1 noD-5.3 -8.4 na -25 no no no no no no no no no no no1960-69 0.1 -2.6 -2.2 -105 -7.6 -3.0 no
1970-79 0.8 -5.1 15 45 -15.0 -1.8 80 107 70 137 97 128
1980-84 0.9 -4.6 4.9 -2.2 -7.8 -43 74 108 92 133 124 135
1985-88 3.6 4.9 16.1 45 3.1 -5.2 93 106 100 113 117 108
1988 2.8 8.4 85 5.6 6.7 -4.8 103 120 113 103 103 112
1989 2.0 2.5 7.7 83 5.6 -5.6 93 150 130 109 114 124
a GDP for Hong Kong. b Goods and non-factor services. Export and import shares may be above 100 per cent due to a substantial
proportion of imports being re-exported (see figure 6). c 1985-87. d 1987. c Relative to major competitors in US dollars. na Not
available.
4

ECONOMIC PERFORMANCE
Figure 1: Growth of real gross national product per person Average annual rate of growth
12 Korea El Taiwan
10
8
6
2
1955-59 1960-64 1965-69 1970-74 1975-79 1980-84 1985-88 1989
12 Li Hong Kong 0 Singapore10 8 6 4 2
Sources: World Bank (1988 and previous years); OECD (1990a and data provided on request); IMF (1989 and previous years); Chen (1979).
Table 2: Comparative productivity growth Average annual rate of growth
OECD HongProductivity average Australia Japan Korea TaiwanDKong Singapore
% % % % %D% % 1960-73
Labour 4.1 2.7 8.6 Capital -0.4 -0.4 -2.5 Total factor 2.9 1.7 6.0
1973-79 1975-79 Labour 1.4 3.02.2 6.3 7.1 5.5 3.0 Capital -1.5 -1.8 -3.1 Total factor 0.6 0.8 1.5
1979-88 1979-87 Labour 1.6 1.1 3.2 4.8 4.5 4.5 5.8Capital -0.8 -0.6 -1.7 Total factor 0.9 0.5 2.0 Notes: Business sector figures for OECD average, Japan, Australia. Total economy figures for Korea, Hong Kong and Singapore. Manufacturing figures for Taiwan. Sources: OECD (1990a); Englander and Mittelstadt (1988); World Economic Forum and IMEDE (1989).
5
2. JAPAN
The initial conditions for rapid growth
After World War 11 the Japanese people developed a strong, shared motivation to rebuild their economy and regain national pride. Emphasis on education and the existence of a manufacturing and business base that had been developed before the war by the Zaibatsu (large vertically integrated business organisations) meant that the country had the technological capability and business experience to assimilate and improve on advanced technology from the United States (see Minami 1984 and Ohkawa and Rosovsky 1973).
Administrative guidance and rationing of finance to key sectors were prevalent, but the underlying commitment, consensus and capability were fundamentally important. The growth consensus was frequently emphasised in policy pronouncements and views expressed by political leaders and the bureaucracy (Yamamura 1987, p. 171).
In the aftermath of the war it was obvious that survival and prosperity demanded hard work and the defeat meant that old leadership groups and numerous coalition arrangements were pushed aside. There was little distributional conflict and pressure group activity because of the shared commitment to work in the national interest. Three scholars at the University of Tokyo (Sato, Kumon and Murakatni 1977, p. 82) 1 succinctly summarised attitudes in the
rapid growth period:
There was no politics in the sense of the competitive advocacy of the fundamental goal of society ...
[because rapid economic growth was] ... a war to be won, the first total war in Japanese history for which
all of the nation's resources were mobilized voluntarily.
Japanese social characteristics also played a role in reinforcing the social consensus. The sparseness of natural resources had always engendered a concern for security and flexibility.
As well the Japanese people had traditionally been characterised by their respect for group objectives. These traditions reinforced the social commitment to achieve economic success but it is not clear that they were critical.
It is often said that the Japanese people have special cultural characteristics which ensure their economic success. But this view emerged in their most successful phase. A careful examination of Japanese history reveals that like most other societies, when Japan enjoyed a
long period of stability, as in the Tokugawa era, its economic performance deteriorated as
markets became cartelised, powerful guilds (Za) emerged and trade was restricted. The restoration of the Meiji family to the throne in 1868 was followed by the abolition of most of the restrictions that had emerged in the earlier era and provided a more liberal trading environment. Trade flourished and economic growth was very rapid and sustained in the 1880s and 1890s. In time the new order developed its own rigidities, but in the aftermath of
Also see Nakamura (1981, pp. 80-91).
6
JAPAN
World War II Japan's 'proper order of things' was destroyed and a newer, less restrictive economic environment emerged again (Ohkawa and Rosovsky 1973, p. 228; Olson 1982, p. 151).
Technological catch-up
An important feature of rapid growth in Japan was the adaptation and refinement of technology and organisational and production methods used in more industrialised economies. This process is known as 'technological catch-up'. It is a very effective means of achieving growth since it avoids the expensive research costs of expanding technological capabilities. When starting from a low base there is scope to grow very rapidly (appendix A).
Abramovitz (1990) estimates that the catch-up factor could explain up to 70 per cent of the difference between labour productivity growth in Japan and the United States in the 1960 to 1973 period. This estimate of the catch-up factor encompasses advances in knowledge, reallocative effects, some scale and capital-labour substitution effects and a residual. Social and institutional factors would affect the residual, but it is clear that such factors were not persistently changing in a substantive way in the period 1960 to 1973, while Japan was very active in adopting and refining the production methods of more advanced countries. Many countries other than Japan (and the DAEs) have had the opportunity of realising rapid growth through technological catch-up but have not been as successful because their social and economic conditions have not been as favourable to the effective transfer of technology.
Abramovitz (1989,1990) describes various conditions that are necessary for the successful adoption of leading technology. These conditions define the social, economic and technological capability of a country to receive and exploit new technology. They include a social consensus in favour of growth, technical competence, business experience and the mobility and flexibility of factors of production.
Experience has shown that many of the Abramovitz conditions are often not sufficient by themselves and that it usually takes some kind of crisis or structural shock to motivate change. The importance of major shocks in inducing subsequent rapid growth has been emphasised by Olson (1982) who focuses on the extent to which special interest groups or 'distributional coalitions' gradually emerge in stable periods and engage in distributional activity which reduces the flexibility and productive capacity of economies by, for example, restricting trades and new ventures. Olson further contends that a major crisis or a series of shocks will lead to a substantial reduction in the power of special interest groups, or motivate such groups to act in a more encompassing manner, focusing for example on objectives with benefits for the wider community.
The war and its aftermath provided the crisis for Japan and created a new environment that was conducive to the effective transfer of technology and the achievement of rapid growth. The Korean War facilitated the process, not only because the United States used Japan as a
7
STRATEGIC TRADE THEORY
supply base, which provided a technological and financial boost, but also because the war generated a large and rapidly growing export market for Japanese manufactures (appendix D).
Once the process of rapid catch-up is initiated — Abramovitz (1990) points out — a number of positive feedback effects may strengthen the potential for catch-up and the pace of realising that potential. For example, when physical capital is acquired and new organisational methods are adopted, learning by doing occurs; a greater awareness and confidence can develop about supplying markets and exploiting further technological opportunities; and it becomes easier to make the next step. As the returns from investment in both physical and human capital are realised and become more apparent to more people, further investment and the desire for self-improvement are encouraged, the supply of capital and skilled people increases and the productive capacity expands further.
Eventually, however, these positive feedback effects may be offset by other factors as the political consensus for growth weakens. The gap between total factor productivity growth in Japan and the OECD average has narrowed from more than 3 percentage points in the 1960 to 1973 period to around 1 percentage point in the 1979 to 1988 period (table 2). Some of this convergence undoubtedly reflects the reduced opportunities for catch-up as 'best practice' techniques have been adopted in more and more activities, but it also reflects the increasing demands in Japan for improvements in the quality of life, which was neglected in achieving rapid growth (chapter 5).
Nevertheless growth in Japan in the 1980s continued to be persistently higher than the OECD average — an outcome which appears to be related to the continued pressure associated with fierce competition in domestic and foreign markets, and labour markets where work effort and hours worked were still high and unit labour costs were very competitive (chapter 4).
The role of the government in setting the general industry and trade policy environment is considered later. The more specific actions that the government has taken which relate directly to technology transfer are considered here.
In Japan both government agencies and private companies were involved in scouring the technical literature to identify suitable technologies. However, Woronoff (1986) and Kikuchi (1983) argue that the exercise was only a success because of extensive private sector input, which was necessary to provide better assessment of the commercial possibilities of new technology. Government agencies overlooked valuable technologies, for example in transistors until Sony's involvement, and Woronoff argues that technology acquisition became much more successful when companies could simply license technology with less regulation and direction. One example is the motor vehicle industry which experienced an accelerated flow of foreign technology and capital as IVIITI's controls over foreign licensing agreements and foreign investment were relaxed. Its most spectacular output growth occurred during the liberalisation phase of the 1960s and 1970s, with production rising from around 0.5 million units in 1960 to around 10 million units in 1980 (appendix D).
8

JAPAN
Although successive governments overlooked valuable technologies, they did encourage and direct technology transfer into profitable sectors. In explaining this success, Yamamura (1987) and Hirono (1988) suggest that during the reconstruction phase after World War II, the Korean War boom and even in the rapid growth phase of the 1960s, the 'winners' could easily be discerned by observing growth patterns in the West. The strong social consensus, vigorous entrepreneurial efforts of the private sector, well-trained bureaucrats and favourable international economic conditions, facilitated the process.
Government intervention
It is widely believed that the Japanese government provided extensive industry assistance and 'administrative guidance'. But the evidence presented here shows that, in the 1970s and 1980s, financial assistance and fonnal trade barriers have been generally small relative to those in other countries.
In the 1950s, quantitative import restrictions, administered through the allocation of scarce foreign exchange, played a major role and there was tight control of direct foreign investment. The government also implemented various export promotion measures in the 1950s and 1960s including priority allocation of foreign exchange, tax concessions, interest subsidies, export insurance and marketing assistance.
Most of the subsidies and import restrictions were phased out in the 1970s.
Assistance in the 1970s and 1980s
For the past 15-20 years subsidies as a share of gross domestic product in Japan have been low compared with those in other OECD countries (table 3). Industrial subsidies as a share of industry value added have been even lower, reflecting the heavy support of agriculture in Japan (table 4).
Table 3: Total subsidies as a share of GDP National Accounts definition
Total OECD United OECD Europe States Japan Germany France Australia
% % % % % % %
1970-74 1.2 1.9 0.5 1.2 1.8 2.1 1.1 1975-79 1.5 2.5 0.4 1.3 2.1 2.5 1.3 1980-84 1.6 2.7 0.5 1.4 2.0 2.8 1.7 1985-88 1.6 2.7 0.7 1.1 2.2 3.0 1.5 1988 1.5 2.5 0.6 0.9 2.3 2.5 1.2 Source: OECD 09890.
9

STRATEGIC TRADE THEORY
Government support to private research and development has also been very small in relation to support in other major OECD countries and especially so in most manufacturing sectors (table 5).
Nominal tariff levels in Japan were about the same as the OECD average from 1975 to 1985 (table 6) although the dispersion of tariff rates across industries in Japan could make effective rates higher. But there is no reason to believe that the dispersion across industries in Japan is so different from that in other developed countries that average nominal tariff rates would be a very poor indicator of effective assistance. Also, unlike in many European countries and the
Table 4: Industrial subsidies' as a share of industry value added National Accounts definition
United United States Japan Germany France Italy Kingdom Australia
% % % % % % % 1970-74 0.3 0.5 1.6 1.0 1975-79 0.4 0.8 1.9 3.0 2.3 2.7 1.2 1980-84 0.5 1.1 1.8 3.2 2.6 2.6 1.6 1985-86 0.5 1.0 1.8 1.9 1.6 'Total subsidies excluding subsidies to agriculture and food processing.
Source: OECD (1989a).
Table 5: Government-financed R&D expenditure in the enterprise sector as a share of total R&D expenditure, 1985
Total United United OECD States Japan Germany France Italy Kingdom
% % % % Electrical 26.8 40.3 1.0 15.6 32.6 18.9 29.6 Chemical 5.5 8.5a 0.8 3.3 5.2 6.7 0.8 Machinery 11.4 13.8 0.6 7.9 14.2 19.6 21.0 Aerospace 73.3 76.2 9.3 62.0b 62.0 42.2 62.7 Other transport 9.8 14.3a 4.4 2.5 3.2 15.0 3.8 Chemical linked 7.1 11.1' 0.7 9.1 2.3 2.9 4.7 Basic metal 14.0 26.4b 1.3 19.0 3.9 10.9 6.2 Services 29.8 52.1 3.8 43.5 11.8 12.4 11.0 Total 23.7 33.9 1.6 15.3 23.8 16.9 23.0 * 1980. b 1983.
Source: OECD (1989a).
Table 6: Receipts from customs and import duties as a share of imports OECD United
Average States Japan Germany France Australia % % %
1965 6.5 6.8 7.6 4.6 6.1 9.0 1975 3.1 4.4 3.0 2.4 1.4 12.2 1980 2.3 3.1 2.5 1.8 1.1 10.1 1985 2.3 3.5 2.4 1.3 0.9 9.8 Sources: OECD (1982, 1987b, 1988).
10

JAPAN
United States the coverage of non-tariff barriers in Japan did not increase in the 1981 to 1986 period (table 7).
There is also evidence that either implicitly or explicitly the United States and the United Kingdom have used tax policy more than has Japan to favour manufacturing industries. In 1973 effective tax rates on labour and capital in Japan showed less variation across manufacturing sectors than in the United States and, in particular, the United Kingdom. The respective coefficients of variation in manufacturing were, for capital, 0.33 for Japan compared with 0.37 for the United States and 0.63 for the United Kingdom and, for labour, 0.09 for Japan compared with 0.12 for the United States and 0.15 for the United Kingdom (table 8).
In the mid-1970s MITI (Ministry of International Trade and Industry) began to encourage knowledge-intensive industries. But again the scale of government involvement was small. Saxonhouse (1983b) refers to the criticisms that have been made in relation to the Japanese government's computer and semiconductor industry programs. In 1982, assistance amounted to US$48 million in the form of contracts, grants and subsidies - some 6-7 per cent of total
Table 7: Import coverage indexes' Base: 1981 = 100
United European States Japan Community Totalb
1982 105.5 99.2 105.7 104.6 1983 105.6 99.2 110.9 107.1 1984 112.1 99.2 113.9 110.2 1985 119.2 99.2 120.8 115.3 1986 123.0 98.6 118.3 115.8 a The import coverage ratios (the sum of the value of a country's import groups affected by non-tariff barriers divided by the total value of its imports of these groups) have been computed using 1981 import trade weights. Computations have been made at thc tariff-line level and results aggregated to relevant product group levels. The data cover a broad range of non-tariff barriers, including para-tariff measures (for example, variable levies, seasonal tariffs and countervailing and antidumping duties), quantitative restrictions (including prohibitions, quotas, non-automatic licensing, state monopolies, voluntary export restraints, and restraints under the Multi-Fibre Agreement and similar textile arrangements), import surveillance (including automatic licensing), and price control measures. Standards to comply with health and technical regulations as well as excise taxes are not included because the data base information coverage is not even for all countries. b Total comprises United States, Japan, European Community, Austria, Canada, Finland, New Zealand, Norway and Switzerland. Source: World Bank (1987).
Table 8: Net tax/subsidy rates on capital and labour, 1973
_United States - -United Kingdom - Japan Sector-a Capital Labour CapitalDLabour CapitalDLabour
Agriculture, forestry fishing and mining 9 to 34 7 to 10 -56 to 6 8 to 10 14 to 40 4 to 19
Manufacturing 20 to 178 8 to 13 6 to 390 8 to 13 32 to 77 8 to 12 Services 21 to 187 3 to 1 1 -47 to 275 7 to 13 13 to 42 9 to 16 Coefficient of variation - all sectors 0.47 0.19 0.87 0.17 0.36 0.24 - manufacturing 0.37 0.12 0.63 0.15 0.33 0.09 • By ISIC industry. Source: Deardorff and Stem (1983).
11
STRATEGIC TRADE THEORY
research and development spending on computers and development in that year. By comparison, the US and West German governments were spending around US$90 million and US$230 million a year in this area respectively. The US government funded an additional US$300 million a year for computer related research as part of its defence, space and general scientific programs.
MITI also attempted to coordinate the research programs of large firms. But cooperation did not come easily. For example, one of the largest Mill sponsored R&D projects was into VLSI (very large-scale integration) electronic chips. The project started in 1976 and in addition to 100 per cent first year write-off of all fixed assets used in research, US$133 million was provided in direct subsidies over four years (Saxonhouse 1983a, p. 295). Krugman (1984, p. 82) notes, however, that, in the case of the VLSI chips, Japan's financial subsidies have been small — about the same magnitude as those provided by the Department of Defense to US firms. Nippon Electric, Toshiba, Hitachi, Fujitsu and Mitsubishi Electric were involved in the MITI project. Despite the maintenance of a joint research laboratory, each project was handled by teams almost entirely drawn from the same company. Of the more than 1000 patents developed at the joint laboratory, only 30 were held jointly. Saxonhouse also notes that the giant Nippon Telephone and Telegraph company chose not to participate, presumably to protect its lead in integrated circuit technology. Similarly in the areas of flexible manufacturing systems and fifth generation computers the leading firms, Yamazald Seiko and Fujitsu, have been very reluctant to be involved in cooperative research.
Saxonhouse argues that the push for cooperative research is there because the prevalence of permanent employment for professionals and lack of professional training outside the workplace makes for parochial and insulated research and development staff. In comparison, professionals in the United States move more often between firms and exchange information regularly in journals and at professional conferences. In Japan, professional training may be better suited to a firm's needs at a point in time but tends then to be too narrow in scope and lacking theoretical basis or orientation. This system was very productive in the catch-up phase, but where original research is required the freer, more scholarly oriented Western method may dominate.
Although today the Japanese economy is not as open as it could be — due to the tradition of forming industry groups (keiretsu), distribution problems and certification procedures — it is generally agreed that the significance of overt trade restrictions as a tool of Japanese industry policy has declined considerably. The remaining barriers — often deriving their effectiveness as much from custom as from policy — are much less susceptible to political or bureaucratic manipulation (Eads and Yamamura 1987, p. 454). In its survey of Japan the OECD (1989c) notes that, although change has been slow, these practices are gradually being relaxed.
Certain cultural and institutional factors are now being seen by trading partners as important trade bathers. The complex, multilayered distribution system with a preponderance of small retail outlets has, in recent times, been focused on as a special hindrance to foreigners. But this system is also costly for the Japanese and if simplified would lead to an improvement in
12

JAPAN
their productive capacity as well as an increase in imports. Cultural and language differences do constitute a barrier to success in the Japanese market but Japanese exporters face similar barriers overseas. For example, some Japanese manufacturers faced considerable losses for some time after the war because they were ignorant of American trading practices. They then studied foreign trading practices and improved their market positions (Okano 1978).
Assistance in the 1950s and 1960s
The current low rates of assistance are somewhat misleading, because they do not capture the extent of selective protection and nurturing which occurred in the 1950s and 1960s as many industries were getting started (chapter 5). In that period the government drew up specific plans, or 'visions' for targeted sectors, but left implementation to the private sector (Bergsten and Cline 1987, p. 69).
Estimates of the extent of assistance in that period are scant. However, the few studies that have been carried out suggest that, in financial terms, government support was relatively low. For example, the financial significance of export assistance in the form of tax incentives and other short term financial incentives in the 1950s and 1960s was modest — estimated to have been around 4 per cent of export value (Nagaoka 1989). According to Allen (1978) the measures used by Japan did not differ, except in detail, from those introduced by many other countries to assist exporters — for example, Japanese subsidies to industries such as shipbuilding, cars, motor cycles and steel were small relative to those granted by the British government. The United States Federal Trade Commission (1977) arrived at similar conclusions. For example, the inherent annual subsidies to steel in Japan between 1951 and 1975 — through government loans, the construction of port facilities, tariffs, taxes, export measures and an allowance for the industry's 'priority status' — were found to be less than 0.3 per cent of the value of output
It is probably impossible to assess the extent to which the policies of selective protection have contributed to rapid growth in Japan — some targeted industries were successful, but there were several notable failures as well, and several successes developed in spite of intervention (chapter 5).
Although the formal interventions may have been small or no bigger than in many other industrialised countries, it is often argued that MITI was successful because it had considerable informal influence. By acting as a focal point for coordination and consultation in a society that is characterised by great efforts in consensus building, M1'1'1 is seen to have played an important role (Okimoto 1989, pp. 231-2). It is difficult to deny this argument but it is also interesting to observe that the process of consensus promotion in the bureaucracy was able to avoid many of the costs of appeasing special interest groups. As long as the government objectives satisfied the basic goals and were broadly market conforming there was evidence of success (Yamamura 1987).
13

STRATEGIC TRADE THEORY
Assistance was temporary and competition fierce
A key characteristic of industry policy in Japan was that the government created a firm impression that assistance would be temporary and the eventual aim was higher living standards through export success (Yamamura 1987; Nagaoka 1989). Nagaoka argues that a widespread expectation of liberalisation was engendered after government announcement of general guidelines for liberalisation in 1960. Johnson (1982, pp. 317-8) argues that this characteristic helped Japan "avoid the deadening hand of state control and the inevitable inefficiency, loss of incentives, corruption, and bureaucratism that it generates".
Antimonopoly reform measures were taken during the period of occupation in the late 1940s and this provided an initial basis for competitive behaviour in the domestic market. The expectation that assistance would be withdrawn put further pressure on Japanese enterprises to be fiercely competitive.
The impression of non-accommodating protection and the existence of competition in the domestic market are evident in the views of an executive of a Japanese automobile company when recalling the fierce marketing competition that started in the early 1960s (Nagaoka 1989, p. 21). He said:
The domestic car makers competed fiercely for market shares among themselves. There was common recognition among the Japanese automobile producers that liberalisation of direct foreign investment would follow the liberalisation of imports, and such expectation contributed to the highly aggressive nature of competition.
The importance of domestic rivalry in the Japanese market was a major finding in Porter's (1990b) recent study. With a team of 30 researchers he conducted a four year study of ten important trading nations: Denmark, Germany, Italy, Japan, Korea, Singapore, Sweden, Switzerland, the United Kingdom and the United States. The study selected a sample of over 100 industries for detailed consideration of the history of competition, including the process by which competitive advantage was sustained or lost.
The results of Porter's study emphasise that a nation's competitiveness depends on its capacity to upgrade and innovate and that the process is sustained by pressure and challenge. Porter argues that Japan has perfected the process of upgrading technology in several manufacturing sectors. Automobile manufacture is a good example. Initially the Japanese manufacturers specialised in small, cheap cars of adequate quality, taking advantage of their low cost, hard working labour force. They continued investing in large plants and automation, pioneered just-in-time production and perfected many quality monitoring and productivity practices. The continued improvements led to secure market positions and the upgrading of products to compete in more prestigious markets. Automobile manufacturers in Japan have had little government assistance for many years and developed along a very different course to that preferred by MITI (chapter 5 and appendix D).
Among the major factors that lead to competitive advantage Porter suggests that domestic rivalry was the most important in the countries he studied. This was clearly true in the case of
14

JAPAN
industries where Japan exhibited global dominance, with the number of rival films usually being in double digit figures. Porter (1990b, p. 412) argues that in Japan:
Competitors are studied carefully, and moves are rapidly matched. Companies invest aggressively in large-scale capacity additions, often all at the same time. Industry leadership shifts frequently. There have been three different market share leaders in the facsimile industry in the last three years, for example, and two different leaders in cameras. Hit products produce major swings in domestic market share in short periods of time, because of the desire of Japanese consumers for the latest and best model. A success by one firm kicks off vigorous responses by others.
Porter concludes that the level of competition in the internationally successful Japanese industries is unmatched in any nation, and that, for leading Japanese companies, competing with foreign rivals often seems a relief. He also notes, however, that competition is all but absent in many other sectors of the Japanese economy, and sees this as a serious challenge to Japan's continued advancement.
Intervention was market conforming
Although during the rapid growth phase the Japanese government was involved in the direction of resources and the selection of 'winners', it provided an environment with relatively free exchange and public security. Evidence that markets were operating effectively can be found in the recognition of the fierce domestic rivalry among many Japanese firms. Also, as was seen earlier, the government did not offer peitnanent protection and policies were guided, with few exceptions, by market signals.
The fact that the government was able to reduce support to industry significantly over a relatively short period also suggests that it retained considerable autonomy from the demands of special interest groups (the major exception being agriculture).
Policies were formulated in the context of intense consultation between the government and industry and competitiveness in international markets was normally a key consideration. As the motor vehicle example shows, the consultative process was conducive to considerations of commercial realities through the active participation of industry representatives (appendix D). When the aims of 'guidance' were in line with market imperatives, such as helping firms take advantage of learning curve effects, industry supported Mill's proposals. Otherwise Mill's suggestions often met with opposition and did not come to fruition.
There were of course exceptions and policies did not adhere absolutely to market signals (Eads and Yamamura 1987, pp. 433-4), but it is suggested that government policies were associated with good performance when they were broadly market conforming (Haley 1986).
Main intervention was through the financial system
In Japan, one major area where market mechanisms were interfered with was the financial system. For most of the postwar period the capital market has been underdeveloped and
15

STRATEGIC TRADE THEORY
highly regulated relative to other major industrialised economies. The Ministry of Finance had control of loan capital and the interest rate structure of the largest banks. MITI also had financial leverage in the implementation of industrial policy because it controlled the allocation of scarce foreign exchange which was important for acquiring modern imported technologies. Extensive credit rationing through the Bank of Japan, the Ministry of Finance and the Japan Development Bank involved selective allocation of financial resources to industries designated as strategic.
Control of the financial system was feasible not only because the Japanese capital market was undeveloped, but also because it was insulated from world money markets. As in Korea, this seems to have encouraged the development of large firms and high gearing (Sakakibara, Feldman and Harada 1982; Yamamura 1987). But government involvement in the allocation of finance should not be taken to mean total government control. Primary responsibility for initiating and operating businesses lay in the private sector.
Since the Japanese market was large, the possibility existed of rapidly achieving large scale economies, particularly by adopting more advanced foreign technology. As argued by Yamamura (1987) there was an accompanying risk that excessive investment would occur as firms tried to outcompete each other with large investments. MITI played a role by ensuring, in several instances, that such a situation did not emerge.
Intervention through the allocation of finance was facilitated by the existence of a large pool of well defined technological opportunities which made it easier to decide on priorities. The pro-growth political consensus left the well trained and capable bureaucracy considerable scope to influence outcomes free of political and pressure group activity.
As the pro-growth consensus in Japan weakened and its capital markets developed, MITI and other Japanese institutions had less control and influence (see, for example, Yamamura 1987).
Effect of interventions relatively unimportant
A number of empirical studies have addressed the question of the importance of government interventions relative to other factors. Those recently reviewed by Saxonhouse and Stern (1989) include six econometric studies covering nine to sixty countries and spanning the 1959 to 1983 period. The six studies were Saxonhouse (1983b), Leamer (1984), Lawrence (1987), Bergsten and Cline (1987), Balassa (1986) and Noland (1987).
The study by Saxonhouse (1983b) is considered here because it covered the rapid growth period in Japan (from 1959 to 1973). It found that in general Japan's trade — and thus industry structure — could be well explained by the factors suggested by standard trade theory. Once differences in the capital stock, labour force, educational attainment and natural resources were allowed for, there was little left over for industry policy to explain. Trade in only 17 of 109 commodities studied was found to have been significantly influenced by factors such as government support. These 17 commodities comprised food products, glass,
16

JAPAN
aluminium and zinc, footwear, aircraft, and photographic, medical and musical instruments — none of them known for having received particularly high levels of assistance in Japan.
Five of the six analyses were carried out by researchers in the United States. They arose in relation to a series of US complaints in the GAT1 regarding Japan's industry policies. The researchers used various model specifications, covering numerous (but different) countries and different time periods. Yet, the conclusion was generally the same — that for most commodities, a country's trade and industry structure could be generally explained by its factor endowments and that policies affecting manufacturing have tended to play a negligible role.
17
THE DYNAMIC ASIAN ECONOMIES
Until the phenomenal success of the DAEs the traditional growth process in developing economies was based on the export of food and raw materials with a gradual move to basic manufactured goods. The DAEs bypassed this slow process by achieving dramatic growth of manufactured exports. They all exploited the 'catch-up' factor — importing foreign technology and know-how and adapting it to take full advantage of their abundant, competitive labour (chapter 4).
Technological advances, which have facilitated technology transfer through the decomposition of production processes into simpler tasks, and improvements in transport and communications have provided new opportunities for countries to grow rapidly and underpinned the export success of the DAEs (Frobel, Heinrichs and Kreye 1981; Rodan 1989). But, as in Japan, the DAEs were characterised by special domestic factors which enabled them to be particularly effective in exploiting the benefits of the catch-up factor.
To start with, the periods of difficult political and economic circumstances prior to their takeoff were not favourable to the development of powerful coalitional arrangements. As observed by Olson (1982, p. 150):
Korea and Taiwan did not have the freedom to develop independent interest groups while they were colonies of Japan, Singapore had little to gain from lobbies when it was run by Britain and Hong Kong is still a colony run along nineteenth-century British free-trade lines.
As in the case of Japan, each of the DAEs faced a period of crisis or widespread change prior to their rapid growth phase. In one way or another this contributed to the emergence of a strong social consensus in favour of growth. And it provided a flexible and expansive economic environment which facilitated the 'catch-up' process.
The technological capability of these economies at their time of take-off was less than in Japan but their basic level of education and exposure to business was higher than in many other poor countries. Japan had promoted the importance of education in Korea and Taiwan, while Singapore and Hong Kong had been entrepots for many years.
Since the DAEs began their rapid growth phase from a lower level of technical ability than Japan they had to rely more heavily on foreign technology. Trade became the channel to achieve technology transfer. Foreign aid was initially important for Korea and Taiwan, and borrowing provided some finance, but these sources of foreign exchange were limited and a recognition developed that an outward-oriented trade regime provided the most secure means of ensuring sustained technical progress and economic growth.
18
THE DYNAMIC ASIAN ECONOMIES
Korea
Initial conditions for rapid growth 2
Korea was a Japanese colony from 1905 to 1945. The Japanese provided the basis for subsequent industrialisation by building a transport and communications infrastructure, developing an industrial sector, and placing emphasis on basic education. During the Pacific War the economy was run down. The departure of the Japanese and the division of the country into Soviet (North) and US (South) zones led to very difficult times. The industrial base had been located in the North and the South had to rely on its poor agrarian base. Only 30 per cent of the land area is arable in the South.
The bitter Korean War in the early 1950s further impoverished South Korea causing much physical devastation. The large influx of refugees left the country with a population density almost twice that of the United Kingdom. Through the 1950s South Korea was heavily dependent on US aid. The government under President Rhee emphasised political concerns and was characterised by an autocratic style with the frequent use of police powers. Wade (1988, p. 159) notes that, until recently, the labour movement was virtually non-existent in Korea, partly because of government repression.
The acceptance of strong government may have been made easier for a while by the existence of a Confucian heritage which stressed the virtue of obedience and subservience to the established hierarchy. Despite this, the period of economic stagnation exacerbated political conflict and a military coup occurred in 1961. The new government under President Park focused on economic goals which matched the demands of most of the population.
The earlier period of unrest did, however, lay the foundations for subsequent growth. The difficult times meant that a great levelling process occurred. Land reform began as early as 1947, under US influence, and continued through the 1950s, leading to a more even distribution of income. Aside from improving productivity directly, the reforms reduced the political strength of the landlord class, and the possibility that the countryside would mount a political challenge became more remote. The long period of military conflict, political tensions and meagre living standards were also conducive to the moulding of a social consensus for economic advancement.
When Park became President the country was poorly equipped with business people and entrepreneurs but the population was well educated and disciplined. In the period of colonisation, the Japanese had dominated industry and, during the Rhee era of the 1950s, business success was often associated with government connections and privileged access to sheltered markets (Jones and Sakong 1980). Large US aid had buttressed the political position of the government (Haggard 1986, p. 348). Business people were not well respected, and after
2 Most of this section is based on Little (1981) and de Franco, Eguren and Baughman (1988).
19
STRATEGIC TRADE THEORY
the military coup some of the most visible ones were arrested and their fortunes confiscated
(Woronoff 1986, P. 101).
The government was in a hurry to achieve economic success and became involved in the
development and implementation of economic plans. It selected promising entrepreneurs to
run larger operations. This contributed to the development of some very large conglomerates.
Smaller firms concentrated on light manufacturing and services where scale was less
important.
Many experts have stressed that a strong cohesive leadership, a highly motivated well-trained
civil service and clear national economic goals were crucial in explaining the success of
Korea (Whang 1987; Rhee, Ross-Larson and Purse11 1984). Porter (1990b, p. 474) also
concludes that governments have enjoyed unusual power and continuity in Korea and have
been blessed for decades with a national consensus on the importance of economic growth.
The leadership provided by President Park was demonstrated by several personal initiatives.
He left no doubt about the government's commitment to export success, making public
speeches emphasising the need to achieve rapid access to imported inputs at world prices and
presiding over monthly meetings with leading business people (de Franco, Eguren and
Baughman 1988).
The involvement of the President clearly had a strong impact (Snape 1988). As described by
Hong (1979, p. 58):
Not only [do] the Korean exporters always get immediate and close attention of the president, but the
successful ones are regularly honoured with honour medals. As a result anyone who has accumulated
wealth via export activities is almost considered a patriot and he is assured that he has the blessing of the
government. This has an immense psychological impact in a society which still carries remnants of
traditional Confucianism.
The government therefore had great influence and played an important role in developing and
channelling the Korean people's efforts toward achievement of rapid economic development.
In its most successful growth phase the Korean government had effective political control. It
could be pragmatic and flexible because policy makers received considerable autonomy from
the societal demands of pressure groups.
An important contributing factor was that the population received a relatively fair share of the
economic gains. The concentration on labour-intensive products and the land reforms helped
to ensure an income distribution with relatively little income inequality (table 9). There was
no increase in inequality in the period of most rapid growth (Adelman and Robinson 1978).
The importance of a reasonably fair income distribution is illustrated by the experiences of
Brazil and Mexico. The absence (or limited extent) of land reforms in these countries has
been identified as an important factor supporting their skewed income patterns (Haggard and
Moon 1983; Haggard 1986). Because a high proportion of the population did not benefit from
economic gains, it was difficult to achieve social consensus and a productive environment.
20

THE DYNAMIC ASIAN ECONOMIES
Table 9: Income distribution in various countries
United HongAustraliaDJapan States Kong Korea Taiwan Brazil Mexico
1976D1979 1980 1980 1976 1986 1972 1977 %D% % % % % % %
Percentage of household income going toLowest 20% 5.4 8.7 5.3 5.4 5.7 8.3 2.0 2.9Highest 20% 47.1 37.5 39.9 47.0 45.3 37.7 66.6 57.7
United Hong Singa-GermanyDJapan States Kong Korea Taiwan pore Mexicob
Gini coefficients'(mid-1970s) 0.40 0.34 0.40 0.44 0.38 0.27 0.45 0.54 2 Gini coefficient of 0 (1) implies complete equality (inequality). b 1963.Sources: World Economic Forum and LMD (1990) for household income distribution; Bronfenbrenner and Yasuba (1987, p. 111) forOECD country Gini coefficients; Fields (1984) for the Gini coefficients of the DAEs; Pankett (1973) for Gini coefficient of Mexico.
These and other Latin American economies, with similar characteristics, have experiencedserious social and economic problems through the past decade or so.
Technology transfer
Korea had accumulated good technological capability in a number of manufacturing sectorsbefore the end of World War II and although many factories were destroyed the experienceprovided the basis for effective technology transfer, at least in several key sectors, when otherconditions permitted (Rhee et al. 1984, p. 44).
In a recent extensive review of technology transfer, based on case studies of Asian and Pacificdeveloping countries, Enos (1989) highlights a common finding that technical capability andlocal effort are the most significant factors in the effective and rapid transfer of technology.Of the countries surveyed, Korea was the outstanding example of swift and effectivetechnology transfer.
In the early stages of its rapid growth phase, Korea was characterised by almost exclusivegovernment involvement in the selection of technologies, with a special Ministry of Scienceand Technology being established to evaluate technologies. The history of war and colonialdomination meant that there was limited familiarity with markets for manufacturing processesand products and, even more so than in Japan, the most able and qualified people were ingovernment. Private companies became more involved over time (Woronoff 1986).
Licensing (for example, for diesel engines, iron and steel and power plants) and direct foreigninvestment were important in Korea to begin the process of technology transfer. But localfirms quickly mastered new technologies, applied it in other areas, made simple developmentsand gradually expanded their technological capabilities. It was also the case that, for mostindustries, technology for products and processes was not proprietary — the mechanicalindustries offer many examples where processes had been copied (Rhee et al. 1984, p. 47).
21

STRATEGIC TRADE THEORY
Today, nearly all Korean industries still compete on cost. The country has yet to build the demand-side advantages and the related industries necessary for competing on the basis of innovation and product differentiation (Porter 1990b, p. 453).
Competition
Through its export-led growth, Korea was widely exposed to international competition — in the decade to 1989, the value of its exports more than quadrupled. However, an essential characteristic of its successful industries was the fierce, and even cut-throat rivalry in the domestic market. Today, there are in Korea over 2000 firms producing fabrics and garments, 250 operating in shipbuilding, 26 making TV sets and 3 producing motor vehicles (Porter 1990b, p. 473). Porter notes that the exception is steel, where the state-owned POSCO company is the only producer.
Industry policies
A series of economic plans was developed in Korea. They were generally indicative in form in the 1960s. However, extensive measures to assist exports were adopted, mainly in the period 1964 to 1971. These included export financing and subsidies, tax advantages and tariff rebates on imported inputs used in producing exports. Exports were initially based on labour-intensive products, such as textiles, clothing and footwear. Major changes in macroeconomic policy were also made at the beginning of Park's administration. The nominal exchange rate was devalued by 65 per cent in 1964 (table F3) and nominal interest rates were doubled from 15 per cent to 30 per cent to stimulate savings. The importance of these macroeconomic policies should not be overlooked as they had a significant impact on the profitability of exporting and the availability of finance (de Franco et al. 1988, p. 3).
Tariff exemptions for exporters helped to curtail the economic distortions and losses associated with the array of import restrictions. Effective rates of protection for export industries strongly favoured producing for export as opposed to domestic markets (table 10).
Where export potential was high, exports were favoured and protection of the domestic market was low. But where export potential was limited, protection of the domestic market was high. For example, the manufacturing, import competing sector received an effective rate of protection some 60 percentage points higher when producing for the domestic as opposed to export markets. The assistance structure in Korea contrasts sharply with that of countries like Argentina where production for export markets was clearly penalised.
From 1972 to 1979 the government undertook a heavy industrialisation drive, focusing on heavy and chemical industries. This constituted a major change from the earlier phase when the government's role had been mainly confined to the management of macro prices (inflation, exchange rates and interest rates) and the administration of the complex export incentives scheme. While the earlier scheme provided a general incentive structure, the new strategy was one of 'picking the winners'.
22

THE DYNAMIC ASIAN ECONOMIES,
Targeted industries included naphtha cracking, steel, metal products, shipbuilding, machineryand automobiles. The dominant method of intervention was through the control of credit. Inthe 1970s between 43 per cent and 50 per cent of total bank lending went for 'preferentialfinance' (World Bank 1986, p. 39). The chaebol (giant conglomerates) received furtherpreferential treatment.
The heavy and chemical industries drive is now generally seen as having been a failure(chapter 5). Two key features contributed to this. First, there was a sharp real appreciation ofthe won. Inflation accelerated from around 12 per cent in 1973 to 30 per cent in 1974 whilethe nominal exchange rate depreciated only slightly against the United States dollar (table F3,appendix F).
Second, changes in the protective regime reversed the incentives which favoured exports.Tariff concessions granted to exporters were eliminated or reduced on a wide range ofproducts. In addition, other imports were more restricted and local content requirements wereincreased. Protection came to be viewed as an instrument which could be closely focused.
Some analysts may argue that in some cases the policies implemented during the heavy andchemical industries drive were eventually successful (for example, iron and steel). However,much of the subsequent success of Korea in the 1980s can be related to the growth of exports
Table 10: Effective rates of protection against imports and effective export subsidies inKorea (1968), Singapore (1967) and Argentina (1969)
Korea Singapore ArgentinaProtection Protection Protection
against Export against Export against Exportimports subsidies Difference imports subsidies Difference imports subsidies Difference
(1) (2) (2) - (1) (3) (4) (4) - (3) (5) (6) (6) - (5)
Export • -26 9 35 8 6 -2 -9 -14 -5Primary -55 -5 50 13 13 0 -10 -14 -4Manufacturing -15 16 31 -1 -1 0 71 -20 -91 Export and Import competing 52 8 _44 9 -2 -11 112 -32 -144Primary 17 3 -14 15 -3 -18 76 -10 -86Manufacturing 55 9 -46 6 -1 -7 120 _44 -164 Import competinge 83 31 -52 15 -3 -18 130 -59 -189Primary 72 2 -70 72 0 -72 32 0 -32Manufacturing 100 39 -61 -1 -4 -3 131 -59 -190 Other' 4 7 3 -6 -3 3 107 -40 -147Primary 8 9 1 -6 -3 3 46 -62 -108Manufacturing -14 2 16 -6 -3 3 111 -42 -153All Industries 10 9 -1 1 8 7 55 -17 -72Primary 11 o -11 15 4 -11 4 -15 -19Manufacturing 7 14 7 4 -1 -5 116 -29 -145aMore than 10 per cent of production exported. less than 10 per cent of consumption imported. bMore than 10 per cent of productionexported, more than 10 per cent of consumption irnported.cLeas than 10 per cent of production exported, more than 10 per cent ofconsumption imported dLess than 10 per cent of production exported, less than 10 per cent of consumption imported.
Note: Effective rates of protection have been calculated by the Saimaa method.Source: Balassa and Associate./ (1982, table 2.5).
23

STRATEGIC TRADE THEORY
to US markets. Buoyant US demand was supported by expansionary US fiscal policy and a
decline in personal savings — factors which would have been difficult for the Korean
government to anticipate. In addition, much of the growth of exports has been in light
manufactures such as electronic equipment and computer related products, not in heavy
manufacturing. Finally the government itself has come to realise that the increasing
complexity of the economy places limits on the nature and extent of the interventions that can
be used. As argued by the World Bank (1986):
This realization stems in good measure from the HCI (heavy and chemical industry) program which
substituted bureaucratic judgment for market tests, was costly, and left scars on the economy in terms of
distorted credit markets, overly-indebted rums and a very high concentration of industrial power.
Because of concern that government intervention had impaired economic efficiency and
flexibility, the 1982-86 economic plan emphasised liberalisation. Substantial trade
liberalisation was pursued in the 1980s (table 11). In recent years them has been an increasing
emphasis on promoting free and fair competition in an open economy. However, a new export promotion drive has been announced in 1990, with some loans being made conditional on export performance (Australian Financial Review, 3 October 1990, pp. 33, 36).
Agriculture is still heavily protected but elsewhere the government is attempting to restrict its role to the provision of information and broad functional support— the latter being designed to deal with market failures and distortions rather than targeting specific sectors.
Intervention in Korea has involved extensive government control over the financial system. Bank loans, at especially low subsidised rates, were explicitly earmarked for export-oriented activities. The difference between loans for export activities and the rate in the unofficial 'curb' market was 22-25 percentage points from 1969 to 1974 (table 12)?
3 The curb market is an informal (often illegal and above official) credit market (Buffie 1984).
Table 11: Trade policy reforms in Korea
PeriodDAssistance change
Mid-1970s Measures in direct support of exports
1978-85
1986-88
1989
gradually dismantled. Export incentives as a percentage of export value declined from 30.3% in 1971 to 16.5% in 1979.
Average nominal tariff reduced from 41% to 21%. Imports not automatically approved for entry reduced from 31% (1980) to 12% (1985).
Average nominal tariff level further reduced to 18%. Imports not automatically approved for entry further reduced to 4.6%.
Overall tariffs further reduced to 12.7% and planned to decline to 7.9% by 1993.
Source: Bhattacharya and Linn (1988).
Table 12: Export and curb market lending interest rates in Korea
1969-74 1980 1984
Exports 6-9 12 10 Curb market rate 28-34 45 25
Difference 22-25 33 15 Source: World Bank (1986).
24

THE DYNAMIC ASIAN ECONOMIES
The government's extensive involvement in financing operations encouraged the development of the chaebol which today dominate the industrial structure. The chaebol and the financial sector are now the main targets of deregulation. However, the tradition of government involvement in allocating credit and the financial muscle of the chaebol make liberalisation a difficult task. Many large companies and public corporations are highly leveraged and bank balance sheets are dominated by loans to customers inherited from the days of government intervention. Constrained by the precarious state of finances, the financial sector continues to be reluctant to assess risks, take decisions and establish genuine market interest rates (World Bank 1986).
Conclusions
In Korea, general support to achievement of economic success enabled the government to be generally flexible and pragmatic in the conduct of both macroeconomic and industry policies. Because of the earlier period of difficult times the population was willing to accept a strong government and to work hard. This social commitment was broadly maintained by rising living standards and a relatively even income distribution, although there appears to have been a breakdown in consensus in recent years (chapter 5).
In the high growth phase, export incentives were successful because they corrected for the anti-export bias of the protective import competing regime. When intervention became more widespread and focused more on 'picking the winners' the failures mounted. There is now a recognition that the government's encouragement of the chaebol and its close control of the financial system have left Korea with bigger problems than in the other DAEs where government involvement has been less extensive. The economy is now too large and complex to be effectively controlled by the government. Reforms are proceeding to liberalise trade further, to encourage the growth of smaller companies, to restrict the powers of the chaebol and to liberalise the financial system.
Historical and social circumstances provided a special opportunity that does not emerge easily or regularly in other societies. The social characteristics and economic conditions that are conducive to a strong role for the government are not well understood nor accepted in many other societies. Bhattacharya and Linn (1988) claim that the experience of interventionist episodes in Indonesia, Malaysia, the Philippines and Thailand demonstrates that the success of planning and targeting in Korea cannot be readily repeated elsewhere. The experience in the Philippines is an especially stark reminder of this proposition (also see Snape 1988).
25

STRATEGIC TRADE THEORY
Taiwan 4
Initial conditions for rapid growth
Taiwan was a Japanese colony from 1895 to 1945 and was largely developed as an agricultural appendage to Japan. The Japanese built ports, railways and power systems and concentrated on primary education as in Korea.
The economy suffered severely during World War II with some 75 per cent of the industrial capacity destroyed.
From 1946 to 1948 trade was cut off with the main trading partner, Japan, by an edict of the US military and nearly all trade was then with mainland China. In this period the economy was also affected by the civil war on the mainland, evident in the rapid inflation (around 100 per cent a year in the late 1940s). Trade with the mainland was cut off after the fall of Shanghai in May 1949 which also induced a large influx of refugees.
Political failure on the mainland jolted the Taiwanese government into a more developmentalist outlook, and the policy debates of the 1950s were more over the means of achieving rapid growth than growth itself (Haggard 1988, p. 282). Although martial law operated from 1949 to 1987 (Australian Financial Review, 10 October 1990, p. 38), the government sector usually kept its distance from commerce and ensured economic freedom (Kasper 1989, p. 40).
Taiwan's exceptionally even distribution of income relative to other countries (table 9) was also important in initiating and sustaining growth. It was partly achieved by the land reforms of the period 1949 to 1953 (Haggard 1988, p. 275). However, relatively open markets and the absence of favouritism also helped to promote greater equality of opportunity, thereby fostering community-wide commitment to economic growth.
Industrialisation and technology transfer
Kasper (1989, p. 40) argues that Taiwan is the classic example of an economy that rejected 'export pessimism'. In giving up its traditional colonial exports of rice and sugar, Taiwan created a better terms of trade for itself by pioneering new exports, relying on its low cost and increasingly skilful labour.
Although the government used fiscal and financial means to attract promising technologies from abroad and to promote research and development, its openness to foreign capital goods and foreign firms also facilitated the transfer of much embodied technology. In recent years the government has actively promoted 'science and technology parks' and attracted Chinese scientists and engineers from the United States.
4 Most of this section is based on Little (1979), Scott (1979) and Park (1990).
26
THE DYNAMIC ASIAN ECONOMIES
Industry policies
Park (1990) concludes that in general the Taiwanese government confined its role to providing social and physical infrastructure. Although the government uses medium term economic plans, these are indicative only, with planners having no access to policy instruments such as control over credit and budgetary allocation for development purposes. State ownership in industry — which was close to 50 per cent in the early 1950s — has been scaled down, and was less than 15 per cent by the late 1980s (Kasper 1989, p. 40).
Unlike in Korea, where the huge, heavily indebted chaebol dominate manufacturing, in Taiwan the manufacturing sector is mainly made up of small and medium sized, lightly indebted firms (The Economist, 14 July 1990, p. 18). Because this structure does not readily lend itself to industry or firm-specific intervention, government support in Taiwan has tended to take the form of more uniform incentives. It should be recognised as well that the development of smaller firms was made easier by a large pool of entrepreneurs and traders from the mainland, and the ability and willingness of the government to isolate itself from rent seeking arrangements and adopt uniform support measures as opposed to specific interventions (Kasper 1989, p. 40).
In the 1950s import substitution policies were adopted in the form of high tariffs and strict import controls. Manufacturing production doubled between 1952 and 1958 but the growth of real gross national product per person was not spectacular and the country continued to rely heavily on US aid to finance persistently large current account deficits.
Scott (1979) argues that foreign (mostly US) aid was important in controlling inflation in the early 1950s and this was essential for achieving political stability. Jacoby (1966) estimated that without aid the growth rate between 1951 and 1964 would have been halved.
Under US and International Monetary Fund influence a realisation developed in the Taiwan economic ministries that an outward-oriented strategy would be more productive. In 1955 a system of rebating commodity taxes and duties paid on inputs into the production of exports was established. By 1971 rebates for the average manufacturing establishment engaged in exporting amounted to some 75 per cent of value added (Scott 1979, p. 325). Probably of greater importance in the second half of the 1950s were substantial exchange rate devaluations for exports of manufactures. As the devaluations were accompanied by considerable import liberalisation there was only modest inflationary pressure. As a result unit labour costs in US dollars declined by more than 50 per cent between 1954 and 1959 (Scott 1979, p. 328).
Further liberalisation occurred in the 1960s along with the creation of other export incentives such as export processing zones. These had the advantage of eliminating the heavy administration costs of the duty exemption scheme. Foreign aid was wound back substantially by 1965. The liberalisation measures were followed by a marked acceleration of growth in the 1960s.
27

STRATEGIC TRADE THEORY
As in the case of Korea the export incentives policy regime in Taiwan was characterised by
swift access to duty free imported inputs, through administrative innovations. Keesing (1988,
p. 41) emphasises the flexible response capability of private manufacturing firms in both
Korea and Taiwan, particularly their astonishing ability to make quick copies of the latest
designs for a wide variety of manufactured products. This fast-reaction capability is thought
not to occur in other developing economies because these do not have comparable speed of
access to competitive imported inputs. As described by Keesing (1988, pp. 5-6), there are
certain export sectors or regions (for example, export processing zones in Mexico, China and
Malaysia) where there is rapid access to competitive inputs, but no other developing countries
offer similar access for the entire economy.
In the early 1970s the government attempted to expand its role by investing in ten major
public sector projects. These projects were not generally regarded as successful but the extent
of government involvement was less extensive than in Korea and the government managed to
scale back its involvement more easily (chapter 5). Kasper (1989, p. 41) notes that when
assisted industries turned out not to be profitable — including public sector enterprises —
assistance was wound back and rationalisation promoted.
Conclusions
The government in Taiwan has clearly been less interventionist than in Korea. It has adopted
a supportive role, concentrating on the provision of public infrastructure. Although economic
plans have been drawn up since the early 1950s they have generally been of a very broad
indicative form. There has been no institutional network linking the public and private
sectors. Export incentives have been provided but they have generally not been used to target
particular sectors.
The development experience in Taiwan contrasts most markedly with that in Korea in the
operation of the financial system. In Taiwan the market was largely allowed to determine
interest rates and the allocation of credit. Planners were not involved in the selection of large
scale technologies or their financing as in Korea. The debt and financial problems present in
Korea have not been evident in Taiwan.
Hong Kong Hong Kong was the first DAE to experience rapid growth and is an outstanding example of
the benefits of liberal economic policies. Its experience provides convincing evidence of the
weakness of the link between government intervention and economic success.
Hong Kong has negligible mineral wealth, only 11 per cent of the land is arable and water
shortages have posed severe difficulties. It must import most of its food and capital equipment
and nearly all of its industrial raw materials (Rabushka 1979). The lack of natural resources
28

THE DYNAMIC ASIAN ECONOMIES
has meant that Hong Kong has had to rely on manufactured and service exports to achieve prosperity.
Initial conditions for rapid growth
As a result of mass deportation and flight of the population, Hong Kong was left in a derelict state immediately after World War II (Little 1979, pp. 455-6). But trade was rapidly reestablished, former residents returned and refugees from the mainland contributed to very rapid population growth. In the early 1950s Hong Kong was also affected by UN imposed trade embargoes on China when the latter entered the Korean War.
The influx of refugees from mainland China provided a substantial pool of labour, capital and entrepreneurial skills. With entrepot trade being restricted against a backdrop of extremely limited natural resources, liberal economic policies and favourable trading conditions in industrial countries, rapid industrialisation proceeded through labour-intensive manufactured exports.
The most rapid growth phase occurred in the 1960s (table 1).
The development of Hong Kong was so dramatic that between 1938 and 1956 it had successfully absorbed a doubling of the population.
Liberal policies
For the past forty years the role of the government has been mainly limited to the provision of social infrastructure. Generous public housing has been a key element. Prosperity has been achieved with low taxes. The reality of a high degree of dependence on external markets has constrained the role of the government and led to ready acceptance of government decisions (Rabushka 1979, p. 64). And the constitutional status of Hong Kong has given public officials the ability to respond to economic forces in a flexible manner rather than being constrained by special interest groups. A succession of well-respected British financial secretaries with market-oriented philosophies ensured that the economic environment in Hong Kong was as liberal as possible.
Singapore
Initial conditions for rapid growth
Difficult political and economic circumstances paved the way for a pro-growth social consensus and a strong government. The collapse of the union with Malaysia in 1965 was the turning point, eventually forcing a reconsideration of trade policy. The period of political instability and the migrant character of much of the population meant that Singaporeans were willing to embrace change and set a premium on hard work (Hassan 1976 as quoted in
29

STRATEGIC TRADE THEORY
Roberts 1988, P. 8). The government's housing program was a key element in promoting social cohesiveness. It could be regarded as the major social benefit that was used for achieving harmony and it enabled the government to enact comprehensive labour legislation entailing wide powers to settle strikes.
The strong support shown for the incoming Lee Kuan Yew government during the 1959 elections facilitated the implementation of the State Development Plan, 1961-64, which closely followed World Bank advice. The Plan was about the industrialisation of Singapore — traditionally an entrepot and banking economy — with the government establishing the necessary infrastructure (electric power, water, gas and transport). The thoroughness and high standard of integrity with which government policies were implemented have been seen by some to have made a significant contribution to Singapore's success (Roberts 1988, p. 5; Rodan 1989, pp. 58-64).
Industry policies
As in Japan, Korea and Taiwan, an awareness developed in Singapore, especially in the civil service, that an export-oriented strategy could promote greater competitiveness, reap economies of scale and earn foreign exchange to purchase essential imports. Food security and protection of agriculture are issues in many countries, both developed and developing. But in Singapore the limited opportunities for agriculture have contributed to an awareness that self-sufficiency in food is not a viable option. Food is imported and security is achieved by maintaining friendly international relations and healthy financial reserves.
Decision making has been highly centralised for a democratic system and as in the other DAEs the government was staffed by an administrative elite with a pro-business attitude.
Rodan (1989) argues that substantial change was possible because of the lack of any significant coalition between industrial groups and a civil service which was largely corruption free. The major political party was also not closely affiliated with militant unions, making it easier for a more decisive government to emerge. The experience contrasts with developments in Indonesia where bureaucratic and industrial power groups successfully resisted export-oriented strategies (Rodan 1989).
General liberalisation of imports occurred from 1968 to 1973 and was accompanied by the active promotion of exports. Since the late 1960s assistance has been quite selective, but support services involved in setting up an industry have been more important than direct financial incentives (Rodan 1989, p. 131).
As in Japan the government has been very successful in conveying the message that assisted ventures had to make enough profits or go bankrupt. An important example is provided by the experience with Singapore's motor vehicle assembly plants — all the plants were closed by 1980 when it became clear they could not survive without sustained assistance (Roberts 1988, pp. 120-1,132).
30

THE DYNAMIC ASIAN ECONOMIES
The current role of the government can be summed up as follows: it is interventionist but runs things on a profit making basis. Intervention is mainly in the form of advice and implicit pressure. There are now no export promoting subsidies in Singapore (Snape 1988).
31

COMMON FACTORS
Although the circumstances and experiences of Japan and the DAEs differ in many respects, there are common factors which have been important in explaining their economic success.
Social consensus, commitment to economic growth and strong government
As shown in the foregoing sections, the rapid growth phase in each society was preceded by very difficult times. From this emerged an environment with a strong consensus for growth. People were not only willing to work hard and embrace new tasks, but also accepted a strong government or at least effective political control. Reynolds (1983) argued — after studying the development experiences of 42 countries over a 100 year period — that the single most important explanatory variable in economic development was political organisation and the administrative competence of government. He also found that the first turning point in economic growth was almost always associated with some significant political event which motivated change. These findings accord with the thesis presented here.
Domestic political and social factors are often neglected by economists in assessing the alternative paths to industrialisation. Such factors are difficult to assess but it is clear that the social commitment to achieve economic growth was very firm in Japan and the DAEs and that their historical context is neither easily replicated nor in all cases desirable.
As argued by Garnaut (1990) and Kasper (1991) the effective operation of the market requires a strong and effective government — a government able to ensure the necessary legal, social and institutional frameworks are in place to support free exchange and maintain public security. They argue that the governments of Japan and the DAEs were successful in providing these basic elements which are necessary for the effective operation of markets.
The effective operation of markets also requires a government to have enough autonomy to be able to resist the pleas of special interest groups who might waste considerable resources in diverting income rather than in creating it. Gamaut (1990, p. 10) reminds us that Adam Smith was well aware that:
Individuals have incentives to break the rules that are necessary to make a market economy work — to corrupt the legal basis of market exchanges, to collude in anti-competitive ways, to misrepresent the nature of assets which are the subject of contracts.
In all four DAEs legislatures were historically weak or non-existent and channels of political access were tightly controlled. This insulated the policy making process from competing political pressures, enhancing the ability of policy makers to sustain reforms which delivered impressive economic growth (Haggard 1988; Olson 1982).
32

COMMON FACTORS
According to Haggard (1986, p. 344) in his earlier assessment of the DAEs:
without autonomy or 'insulation' from the demands of particular social groups, the pursuit of policies such as land reform, lowering of real wages, raising of interest rates, devaluation or lifting of subsidies or protection would be impossible.
It has been argued that in several of the DAEs the greatest control was exercised over labour markets and made unions (Garnaut 1990, P. 10). Bhagwati (1987) suggests that the DAEs have used authoritarian methods to keep trade unions under control and this facilitated the achievement of low inflation (see also Fields 1984). In Singapore the enactment of legislation to control labour was directly connected with the change in policy toward an export-oriented strategy and the attraction of foreign investment (Deyo 1981). In Hong Kong a steady stream of refugees and liberal policies meant that labour markets remained competitive. Governments were perhaps able to sustain effective control over labour because the development strategy produced a relatively even income distribution and rapidly rising income standards (table 9).
Okimoto (1989, pp. 232-3) argues that in Japan Mill had unusual leeway to formulate a comparatively non-politicised and adaptable set of policy measures due to three key factors: the long period of Liberal Democratic Party domination, the weakness of labour-based political parties and the lightness of Japan's defence burden. He adds that the muted power of labour-based parties had insulated Japanese policy makers from the pressures that prevailed in countries such as Great Britain and Italy — pressures to accommodate labour demands for massive subsidies, protect declining sectors, maintain employment in depressed regions and introduce incomes policies in line with the wage expectations of organised labour.
Overall, there were many important factors, other than strategic interventions, that have helped create the necessary initial conditions for rapid growth. In relation to government's role, Kasper (1989, p. 32) concludes that general economic and social policies have been more important to the success of East Asian economies than industry-specific policies:
Otherwise one would not have observed the same industrial performance on the basis of greatly differing approaches to these-specific policies.
The 'catch-up' factor
Each economy had the basic capability to exploit a large pool of technological and market opportunities that were available because of historical circumstances. The technological capability of the DAEs at their time of take-off was less than in Japan but their basic level of education and/or exposure to business and foreign markets was higher than many other poor countries. Japan had promoted education in Korea and Taiwan, and Singapore and Hong Kong had been entrepots for many years. US aid and involvement were key ingredients in getting the growth process started in Japan, Korea and Taiwan, while Hong Kong and Singapore benefited from contact and colonial ties with Britain.
33

STRATEGIC TRADE THEORY
Processes and phases of technology transfer
The rapid development in Japan and the DAEs initially began with the use of abundant and cheap labour and basic technology. As incomes rose and market and technological opportunities became more apparent, products and processes were persistently upgraded.
Japan and the DAEs used a variety of means to acquire technology. These included the purchase of patents, the careful study of scientific papers, the importation of capital goods with new technology embodied and 'reverse engineering' involving the dismantling and reproduction of the technology (Enos 1989; Nagaoka 1989; Hirono 1988; and Peck 1976).
As shown earlier, the authorities in Japan and especially Korea were closely involved in the selection and acquisition of technology. They were fearful about foreign investment, and adopted extensive policies on foreign ownership, although joint ventures did occur sometimes — examples are motor vehicles, petrochemicals and synthetic fibres in Korea (Enos 1989). Taiwan, Hong Kong, and Singapore adopted a less dirigiste approach with technology largely being acquired by businesspeople with their own funds and foreign investment being more prevalent (Little 1979; Woronoff 1986). In these economies foreign investment was largely responsible for the development of synthetic fibres, petrochemicals, electronics and machinery. In Taiwan's rapid growth phase the top twenty exporting firms all exported electrical or electronic goods and all were foreign affiliates or joint ventures (MM 1986). In Singapore, some 75 per cent of manufacturing output and exports comes from wholly foreign-owned firms or joint ventures ono 1988, p. 247).
In a detailed study of economic growth in Japan and the DAEs, over the period 1955 to 1974, Chen (1979) found convincing empirical evidence of a relationship between productivity and imported technology (embodied in imported capital goods) for Taiwan, Hong Kong and Singapore. In the case of Korea, technical progress was found to be largely related to foreign aid in this period. In Japan learning-by-doing effects were found to be of primary importance. With the exception of Singapore, learning-by-doing effects were of little importance in the DAEs. Thus Japan, rather than relying predominantly on the technology embodied in imported capital goods, made greater use of patents and its greater technical heritage in exploiting catch-up potential.
Korea, Taiwan, Hong Kong and Singapore had one advantage not available to Japan in exploiting the catch-up factor. They were able to achieve part of their success by using Japan as a model and adopting the methods and processes it applied in the catch-up phase.
Japan and the DAEs initially concentrated on manufacturing products which were intensive in the use of unskilled labour, such as textiles, clothing and footwear. As wages and living standards have increased, the comparative advantage of these economies has shifted more toward industries that are intensive in the use of human capital, technology and physical capital. These shifts are illustrated by measures Of revealed comparative advantage for manufacturing exports over the period 1970 to 1985 (figure 2 and appendix B).
34

COMMON FACTORS
The diversity of the development experiences of these economies shows that there is no single recipe for success. Textiles, clothing and footwear featured widely in the initial export growth
Figure 2: Revealed comparative advantage RCA indexa
1970 1985 1970 1985 1970 1985 970 1985 1970 1985 1970 1985 1970 1985 1970 1985 Un.skilled Human Technology Phyxical Unskilled Human Technology Phylical
labour capital intensive capital labour capital intensive capital intensive intensive intensive intensive intensive intensive
Korea
1970 1985 1970 1485 1970 1985 1970 1985 1970 1985 1970 1985 1970 1985 1970 1985 Unskilled
labour intensive
Human
capital intensive
Technology intensive
Physical
capital intensive
Unskilled
labour intensive
Human
capital intensive
Technology
intensive
Physical
capital intensive
a RCA (mvealed comparative advantage) indexes are constructed from data on actual trade performance and compare the share of an industry's exports in the country's total exports with the !hare of the particular good in world exports. They are calculated as (LSWEV(WI/W) where E his =port of product i by country h, W is the world total capons of product i, and W ts the world total exports.
An index of greater than one is interpreted to reveal a comparative advantage in the production of a class of goods for the country under consideration relative to the rest of the world.
Source: Table BI in appendix
35

STRATEGIC TRADE THEORY
phase of these economies, and Japan and Korea showed some further similarities in the move to vehicle production. But motor vehicle production was a failure in Singapore where technology-intensive industries such as electronic equipment were in the ascendency (figure 3). As traders, Hong Kong and Singapore also have large internationally oriented service sectors. The importance of trading activity in these two economies is shown by the fact that, in 1989, re-exports accounted for 61 per cent of the exports of Hong Kong, and 37 per cent of the exports of Singapore.
Figure 3: Shares of major exports in total exports
Electrical and electronic equipment
Textiles, clothing footwear
Chemicals and related
Mineral feels
Food and crude rubber
1966 1971 1976 1981 1985 1987
Textiles, clothing and footwear
Electrical and electronic equipment
Toys, 'potting goals, Road vehicles clocks and misc. manufactures Iron and steel Textiles, clothing and footwear Ships
Food, crude materials and wood pnulucts
Source: United Nations (1989 and previous years).
36

COMMON FACTORS
One of the major strengths of the five East Asian economies was the flexible way in which they have managed to shift out of industries in which they initially held a comparative advantage into the next phase of development. For example, in Japan, when the initially successful synthetic fibre industry experienced difficulties, capacity was wound back. Unlike some rapidly growing Latin American economies which allowed their development to falter after the initial phase, the five East Asian economies adjusted successfully to the changes in comparative advantage that inevitably accompany rapid growth.
Outward orientation and international competitiveness A major common factor among the DAEs was the adoption of an outward oriented-strategy. The benefits of such a strategy have been emphasised in numerous World Bank reports. In a study of Indonesia, Korea, Malaysia, the Philippines and Thailand the most important ingredient for export success was found to be the ready access to inputs, including capital, at world market prices (Bhattacharya and Linn 1988).
Once the DAEs adopted the strategy of outward orientation, they were faced with competitive pressure in world markets, which meant continual efforts to improve on the various factors that affect overall competitiveness. In Japan, domestic competition was identified as more important in developing the ability to succeed subsequently in export markets. As shown earlier, after Japanese firms honed their competitive edge in the domestic market, they successfully competed in export markets and this provided additional pressure to continue to upgrade and remain competitive.
The broadest and most meaningful definition of competitiveness for a country is national productivity since productivity improvements are the key to improved living standards. The achievement of high productivity involves adding maximum value to inputs not only by obtaining them at least cost, but also by producing a quality output efficiently.
On most criteria, Japan and the DAEs have been shown to have highly competitive economies. Probably the most comprehensive evidence is provided in the annual survey by the World Economic Forum, which assesses competitiveness according to some 300 criteria (appendix C).
The World Economic Forum and IMD (1990) study judged Japan and the DAEs to be the most competitive economies among the OECD and newly industrialised economies groups respectively (figure 4 and table 13). Australia, by comparison, ranked thirteenth in the OECD group. All five East Asian economies were found to be strong in outward orientation, human resources, financial dynamism, industrial efficiency and dynamism of the economy (see table Cl in appendix C for a description of these categories). The scores in relation to natural endowments were low (figure 4). The factors nominated by the World Economic Forum as being important to the competitive strengths of Japan and the DAEs were also emphasised by Porter (1990b).
37

STRATEGIC TRADE THEORY
Fig= 4: Competitiveness indicators Japan and Australia
The numbers on the bars represent ranking in the OECD group
M Japan D Australia
2Human resources
Financial dynamism 14
Natural endowment utilisation 18
Industrial efficiency 5
Future orientation 12 I
International orientation 1
Dynamism of the economy 13
Market orientation ,„1 313 f
Impact of the state
Sociopolitical stability IL-
-0.4 -0.2 0 0.2 0.4 0.6 0.8 1 1.2 1.4
Standard deviations from mean of the OECD group
Source: World Economic Forum and 1MD (1990).
Table 13: Competitiveness rankings — DAEsa
Korea Singapore Taiwan Hong Kong
Human resources 3 1 2 4 Financial dynamism 4 1 3 2 Natural endowment utilisation 7 10 8 6 Industrial efficiency 6 1 4 3 Future orientation 3 2 1 8 International orientation 5 1 3 2 Dynamism of the economy 2 3 1 4 Market orientation 5 2 3 1 Impact of the state 7 2 6 1 Sociopolitical stability 6 1 4 2 Overall 4 1 2 3 'Rank order of perfonnance among ten newly industrialised economies in the World Economic Fotum report.
Source: World Economic Forum and IMD (1990).
38

COMMON FACTORS
Australia — and similarly resource-rich Norway — scored well below Japan and the DAEs on most indicators of competitiveness. Exceptions were indicators of natural resources, levels of formal education and stability of institutions of government and the law.
It is interesting to note that the most successful developing economies have all been poor in natural resources. In this context Naya (1988, p. 93) argues that:
It is ironic that, to some degree, wealth in natural resources in labour-abundant countries, such as those in Southeast Asia, makes it more difficult to adopt policies that promote growth with equity through labour absorption in an outward-looking manufacturing sector. Resource wealth (outside of agricultural crops) tends to have concentrated ownership as well as a requirement for capital-intensive technologies for development. The effect of natural resource booms on non-resource sectors capable of producing exports is often negative because of 'Dutch Disease' effects. Often the sectors that are adversely affected are labour-intensive.
Market orientation was one of the key factors in which Japan and the DAEs excelled. All five East Asian economies scored above Australia for product quality, and on-time delivery (figure 5). Porter (1990b) notes that, in Japan, a national program was put in place in the 1950s and 1960s to upgrade product quality and overcome the image of 'cheap' Japanese goods. Since then, demand pressures ensured that the intense concern for product quality continued.
As argued by Kasper (1989), attention to aspects of competitiveness like quality improvement is a characteristic of a competitive as opposed to a 'rent seeking' environment.
Figure 5: Market orientation indicators
Survey score Product quality(higher score
indicates greater On-time delivery of products competitiveness) After-sales service
Source: World Economic Forum and IMD (1990).
39

STRATEGIC TRADE THEORY
A liberal trading environment The key reason that export assistance was warranted in the DAEs in the early stages was to counteract the protection biases against imports — until it was socially acceptable to remove them.
Although an argument can be made emphasising the links between external trade and technological diffusion, with export promotion policies playing an important part in stimulating trade, it is also clear that to further promote outward orientation and competition, general liberalisation has proved beneficial. While Japan and some of the DAEs clearly did use measures to protect domestic markets or assist exports in the early stages of their development, they wound back such measures as exports became competitive or in order to make exports more competitive — a feature which is normally missing when similar policies are applied elsewhere.
In essence, government interventions in Japan and the DAEs were broadly market conforming. Industry assistance policies were combined with competition measures and intervention-induced distortions to prices were not allowed to go on indefinitely. While many factors other than the effective operation of markets have contributed to the success of Japan and the DAEs, success would not have been possible had prices not been broadly market driven. As Timmer (1973, as quoted in Riedel 1988) put it:
'Getting relative prices right' is not the end of economic development. But 'getting prices wrong' frequently is.
Ensuring access to competitive inputs by using explicit export assistance measures such as access to duty free imports is a considerable administrative burden. In the case of Korea, highly disaggregated, up-to-date input coefficients were required for its duty exemption scheme. Schemes also need to be developed to ensure that indirect exporters (sectors providing inputs to exporters) also have access to inputs at world prices. When this is taken to the extreme, complete trade liberalisation would normally be the outcome.
It follows that there are limits to what export promotion policies can achieve and that such policies are not, in the end, an alternative to trade liberalisation. Numerical general equilibrium analysis which incorporates the features of imperfectly competitive behaviour, economies of scale and product differentiation, has shown that Korean national income might have been 7 per cent higher had less distorting policies been adopted (Gunasekera and Tyers 1988).
That liberalisation did occur in the DAEs is amply demonstrated by their trade performance. Between 1979 and 1989, the values of both their exports and imports grew by 200-300 per cent (figure 6) compared with around 50 per cent for Australia. Such remarkable growth could not have occurred had tight trade restrictions limited access to the imported inputs which were essential to the DAEs' exporting industries.
40

COMMON FACTORS
Figure 6: Growth in the value of merchandise trade, 1979 to 1989
Exports
350 Pm:enrage
Developed economies Dynamic Asian economics*
change
300
250
200
150
100
II Australia United Germany Japan Hong Taiwan Korea Singapore
States Kong
Im ports
350 Percentage
Developed economies Dynamic Asian economies
change
300
250
200
150
100
50
Australia United Germany Japan Hong Taiwan Korea Singapore States Kong
'Includes substantial re-exports for Hong Kong and Singapore. In 1989, re-exports accounted for 61 per cent of wtal exports from HongKong, and 37 per cent from Singapore. Source: GATT (1990).
Labour markets
The labour markets of Japan and the DAEs have been very effective in responding to new opportunities and in making rapid adjustments to adverse circumstances. Compared with other major industrialised countries, Japan suffers the least absenteeism and labour turnover, has considerably less industrial unrest and has a highly flexible and motivated workforce (table 14).
41

STRATEGIC TRADE THEORY
Table 14: Various indicators of labour market characteristics United United Hong Singa-
Australia States Germany France Kingdom Japan Korea Taiwan Kong pore
Working week° (hours) 38 41 40 39 42 42 54 48 45 49 Industrial unrest" (days lost
per 1000 population) 90 62 .. 13 53 2 56 na
A higher score* indicates higher competitiveness Absenteeism° 45 55 60 48 54 82 42 49 74 74 Labour cost flexibilityd Worker motivation°
42 42
81 56
45 68
48 51
64 50
57 84
39 58
64 57
85 68
77 70
Worker flexibility 38 64 ito 29 40 68 50 58 71 61 Worker tumovea-8 49 49 66 61 55 76 41 48 33 53 Labour-saving technology" 48 66 55 55 55 75 50 71 82 84 Vocational training' 45 48 69 51 33 79 47 51 50 68 * Score: 0 to 100. Result of World Economic Forum questionnaire survey of business, media and labour representatives in each country. a 1988. b 1986_58 ,,,,,,,, gc. c Extent to which absentr ,ism adversely affects enterprises . d Flexibility of enterprises to adjust employment and compensation levels to economic realities. e Willingness to identify with corporate objectives and priorities. I Willingness of labour
force to relocate, retrain and/or assume new work functions. g Extent to which work force turnover adversely affects enterprises. It
Workers' acceptance of labour-saving technology. i Extent to which vocational training meets the requirements of a competitive economy. na Not available... Less than one.
Source: World Economic Forum and DAD (1990).
There is a perception that the Japanese labour market is characterised by a cradle-to-grave approach where workers are very well looked after, thereby promoting industrial harmony, a sense of loyalty and the incentive to work hard. However, the truth is somewhat different.
First, as Hirono (1988, p. 245) notes, for most of the workforce there were no lifetime opportunities and no employment security — particularly for the female workers who dominated industrial employment in the early years of industrialisation. Security of tenure was mainly a feature for males in elite industrial firms which together employed less than 30 per cent of the male workforce (Galenson and Odalca 1976, p. 615). Whether these characteristics were still prevalent once the rapid growth period ended is not clear. However, statistics collected by Japan's Ministry of Labour suggest that the cradle-to-grave approach was not a general feature of the Japanese labour market in the late 1970s either. Between 1975 and 1978, medium sized Japanese firms (100 to 1000 employees) had laid off through redundancy 30 per cent of their staff on average, and large firms (above 1000 employees) 20 per cent (Koike 1987, p. 310).
Second, a key ingredient which is often overlooked is that unions in Japan are enterprise based, making it easier to develop a commitment to the firm and promoting flexibility in the elite enterprise sector. In the rest of the economy, flexibility has been enhanced by the availability of resource pools of temporary workers — for example, in the 1960s, 42 per cent of Toyota workers were temporary (Johnson 1982, p. 12) — women on low rates of pay and small businesses, many of which contract their services to large firms at lower wage rates.
Another factor contributing to flexibility is the Japanese bonus system. In many companies workers receive large lump-sum payments twice a year. The average ratio of bonuses to employee compensation was in the range 15-20 per cent from the mid-1960s to the mid-
42

COMMON FACTORS
1980s (Hayashi 1986). The bonus system Table 15: Total compensation inmanufacturingallows companies to reduce labour costs more
easily in difficult times rather than sack 1987 1988 workers. All of these factors together with a US$/hr US$/hr rigorous education contribute to a highly Australia 9.17 11.05
United States 13.44 13.92motivated, flexible and well-trained work- Germany 16.87 18.03force in Japan. Japan 11.14 12.72
United Kingdom 8.96 10.49The DAEs also have a highly flexible, Korea 1.79 2.52competitive and hard working labour force. Taiwan 2.19 2.72
Hong Kong 2.12 2.44This has been an important common factor in Singapore 2.37 2.67their export success and although incomes per Sources: World Economic Forum (1989, 1990).
person, on average, have risen rapidly up toten times above neighbouring developingcountries, by 1987 the DAEs' wages were still only a fraction of those in the more highlyindustrialised economies where their exports are focused (World Economic Forum and IMD1990, and table 15). Kasper (1991) argues that people in East Asia realised that they had aperipheral location in relation to the major markets of North America and Europe and thattransport costs had to be borne by the locals, if their industries were to become internationallycompetitive.
The large wage differences in relation to industrialised countries have enabled them to remainhighly competitive. Continuous upgrading of products and processes has occurred, however,providing the productivity gains to support rising wages without a deterioration in profits. TheWorld Economic Forum and IMD (1990) study shows that over the period 1982 to 1988,employee productivity grew in Japan by more than 3 per cent a year, compared with less than2 per cent in Australia and the United States. In the DAEs, employee productivity grew onaverage by close to 6 per cent a year over the same period (figure 7).
Various characteristics of the labour market and industrial conditions in the DAEs provide aformidable base on which to achieve persistent overall improvements in competitiveness.Work weeks are long in relation to levels in Australia (table 14) and the workforce generallyexhibits a high degree of motivation, labour cost flexibility, willingness to relocate, retrainand undertake new tasks, and accept labour saving technology (figures 8 and 9).
Over the period 1982 to 1988 Korea achieved the most impressive productivity improvements, with growth in employee productivity being close to 8 per cent a year (figure 7). Themost striking feature of its labour market is the long hours of work (an average of 54 hours aweek) at wage rates that in 1987 were still very low relative to those in industrialisedcountries (tables 14 and 15) (de Franco et al. 1988). However, as the benefits of economicgrowth are felt through improved material well-being, Korean workers seem no longer willingto accept their previous employment conditions. Although the hours worked are still high,labour cost flexibility in Korea has declined considerably since the mid-1980s, as a result ofsignificant wage rises. From 1987 to 1989, unit labour costs relative to competitors (in
43

STRATEGIC TRADE THEORY
common currency) rose by 50 per cent (table F3 in appendix F). Worker flexibility, workers' acceptance of new technology, labour turnover and absenteeism deteriorated and industrial unrest escalated (table 16). Similar changes appear to be occurring in Taiwan where, over the period 1986 to 1989, unit labour costs relative to competitors increased by over 40 per cent (table F4 in appendix F) and labour turnover and absenteeism deteriorated significantly (EMF Foundation 1986; World Economic Forum 1989, 1990).
In Hong Kong, labour is highly mobile and in the face of an economic downturn it is customary to accept less hours of work. Given that Hong Kong must import most of its food, raw materials and capital equipment, its overall growth prospects are tightly constrained since external price changes and real shocks are quickly transmitted to the internal price—cost structure, with wages free to be determined by market forces (Rabushka 1979).
Historical circumstances and institutional features have contributed to the labour market characteristics of Japan and the DAEs. In Hong Kong the free market dominates, while in their rapid growth phases, trade union activity in Korea, Taiwan and Singapore was closely restricted by government policy (Riedel 1988). Riedel (p. 34) notes that although unions in Hong Kong were free to organise and strike, they received little support from workers.
Whether by social means, free-market ideology or government intervention, all five East Asian economies had a flexible, competitive and hard working labour force during their rapid growth phases.
Figure 7: Employee productivity trends, 1982 to 1988
Source: World Economic Fon= and END (1990).
44

100
COMMON FACTORS
Figure 8: Labour force indicators
Survey score (higher score indicates greater competitiveness)
Japan Korea Taiwan
Source: World Economic Forum and IMD (1990). Sec table 14 for explanation of categories.
Figure 9: Industrial efficiency indicators
100 Survey score (higher sense indicates greater competitiveness)
Japan Korea Taiwan Hong Kong Singapore
Source: World Economic Forum and EViD (1990). See table 14 for explanation of categories.
45

D
STRATEGIC TRADE THEORY
Table 16: Trends in labour market characteristics in Korea
Labour-Working IndustrialD Labour costDWorkerDWorkerDsaving
week Dunrest Absenteeism Dflexibility Dflexibility Dturnover technology Hours Days lost
per 1000 A higher score means higher competitiveness* population
.. b1985 52' 73 60 67 60 67 1986 520 4d 84 59 65 65 69 1989 540 421 77 54 53 59 61 1990 548 561, 42 39 50 41 50 • Score: 0 to 1CO. Result of World Economic Forum questiormaire survey of business, media and labour representatives in each osamtry.
1983. 1981-83 average. c 1984. d 1982-84 average. e 1987. 1 1984-87 average. 8 1988. h 1986-88 average. - Less than one. Source: EMF Foundation (1985, 1986) and World Economic Fon= (1989, 1990).
It is also worth recalling that the labour market policies in Japan and the DAEs have been accompanied by low to moderate income inequality (table 9). This could be evidence that wages were close to their market clearing levels. If workers receive market clearing wages, inequality is likely to be less than in the situation where some are paid above the market clearing wage and others are unemployed (Fields 1984, p. 81). In any case, low income inequality would have been an important force in achieving the social commitment to economic growth.
Saving It is generally believed that high savings at some time or another have been a major contributing factor to the success of the East Asian economies.
In Japan the national saving rate has averaged more than 30 per cent of gross national product since 1955 after being around 14 per cent between 1946 and 1949 and 26 per cent between 1950 and 1954 (Sato 1987, p. 138). By contrast, the saving rates in the DAEs were quite low in the 1950s and early 1960s (figure 10). Japan, Korea, Taiwan and Singapore were very dependent on foreign aid in the early years of their rapid growth phase, while in Hong Kong foreign aid was negligible throughout. In recent years sizeable current account surpluses have emerged in Japan and the DAEs, largely because investment has declined relative to saving.
High saving rates facilitated growth by providing ample finance for investment. In the takeoff phase it was important to generate export revenue to finance imported technology and raw materials. Although capital inflow can finance investment, in the 1950s to the mid-1970s international capital flows were small — considerably more constrained than in the 1980s (Dean, Durand, Fallon and Hoeller 1990).
In conventional growth theory a striking prediction is that the long term equilibrium rate of output growth is independent of the rate of saving and investment. An increase in the rate of investment increases the level of the capital stock and the level of output, increasing the
46

COMMON FACTORS
growth rate for a time but as the capital stock expands relative to the labour force its marginal product declines to a point where growth per person equals the rate of depreciation, and the given technological advancement. However, newer theories emphasise the embodiment of technical progress in physical and human capital, supporting the evidence of the importance of technology transfer for Japan and the DAEs. In these theories an increase in the growth rate leads to external benefits so that the marginal product of capital depends on the total factors of production employed and would not necessarily diminish as the ratio of capital to labour increases.
Because saving finances growth through capital accumulation and because higher incomes generate the potential for higher saving, it is difficult to isolate the underlying forces that determine saving. It seems that much of the growth in saving can be explained by rapid growth of incomes, but other institutional and economic factors provided strong motives to save.
The predominant modern theory of saving behaviour suggests that economies with faster growth in incomes per person should have a higher aggregate saving rate. That is because younger generations will have a higher lifetime income and their saving will offset the dissaving of older generations. However, the saving rates in Japan are broadly constant across age groups, contrasting with the considerable variation across age groups in the United States (table 17).
Table 17: Personal sector saving rates, by age of family head: Japan and the United States
Age group <24 25-34 35-44D45-54 55-64 65+ Average
Per cent of income Japan (1974) 25 21 21 21 21 21 21 United States (1972-73) -15 5 10 17 20 13 12 Source: Hayashi (1986).
For Japan, many other factors have been suggested as contributing to the high saving rates. The major ones are: frugal social security benefits, favourable tax treatment, limited availability of credit and mortgage finance and the importance of bequests.
In the 1950s and 1960s the Japanese social security system was underdeveloped relative to the benefits provided in other industrialised economies, but expanded rapidly in the 1970s. The average annual old age benefit per person, provided by the largest public program for those employed in the private sector, increased in real terms by 53 per cent between 1974 and 1983 (Hayashi 1986). The gross national saving rate declined in the 1980s relative to that in the period 1960 to 1973. However, much of this can be explained by methods of compiling statistics which do not take account of holding gains and losses arising from inflation. When these are allowed for, there is less variation in saving, and saving rates adjusted for inflation in the 1980s are higher than in the 1960s (Dean et al. 1990). It seems that limited social
47

STRATEGIC TRADE THEORY
Figure 10: Saving and investment as shares of GNP
1955-59 1960-69 1970-79 1980-84 1985-88 1955-59 1960-69 1970-79 1980-84 1985-88
1955-59 1960-69 1970-79 1980-84 1985-88 1955-59 1960-69 1970-79 1980-84 1985-88
1955-59 1960-69 1970-79 1980-84 1985-88 1955-59 1960-69 1970-79 1980-84 1985-88
Source: See table I.
48

D
COMMON FACTORS
security may have been a major factor driving saving incentives, yet there is little evidence tosupport a strong change in saving behaviour following the expansion of the social securitysystem (see also Hayashi 1986 and Sato 1987).
The tax system in Japan was geared to encourage higher saving through generous exemptionof personal sector interest income for most of the past four decades (Kawasaki 1990).However, econometric evidence from one study suggests that tax incentives for saving havehad little impact, by themselves, on saving behaviour (Hayashi 1986).
As incomes have risen it seems that the major factors contributing to personal savings havebeen the bequest motive and the limited availability of credit (Sakakibara et al. 1982; Hayashi1986; Dean et al. 1990). Hayashi argues that it is important to couple the bequest motive withthe fact that Japan started with such a low level of wealth after the war. Thus an importantsaving motive has been the desire to improve the welfare of children - saving for children'seducation is usually identified as an important motive in surveys.
The bequest motive provided the incentive, but the most important constraint which promotedsaving was the limited availability of mortgage and consumer credit. In 1965 mortgage andconsumer credit was only around 2 per cent of gross national product in Japan compared with61 per cent in the United States (table 18). By 1978 the respective figures were 18 per centand 68 per cent - still a sizeable difference.
Table 18: Mortgage and consumer credit as a share of GNP: Japan and the United States Japan United States D
ConsumerD ConsumerMortgagesDcreditDTotalDMortgagesDcreditDTotal
% % % % % %1965 0.1 2.2 2.3 47.6 13.2 60.81970 1.0 3.6 4.6 46.3 13.1 59.41975 9.7 2.4 12.1 52.4 11.3 63.71978 14.8 2.7 17.5 55.1 13.0 68.1Source: Sakakibura et al. (1982).
In Korea, as in Japan, much of the growth in saving resulted from higher savings byhouseholds and the dominant influence was rapid growth of incomes (World Bank 1984,1986). But there were other factors at work as well. The chaotic and impoverished state of theeconomy in the 1950s was not conducive to saving and investment. Both private and publicsaving were very low and there was sometimes dissaving. In 1956 gross national saving wasnegative, being -1.4 per cent of gross domestic product. Chronic government deficits were acontinual drain. US aid provided crucial support in this period.
The government doubled nominal interest rates in 1965 (from 15 per cent to 30 per cent forone year, fixed term deposits). National savings increased from an average of 4 per cent in thefirst half of the 1960s to around 18 per cent in the period 1970 to 1974 . After steadying
49

STRATEGIC TRADE THEORY
through the 1970s the saving rate continued to rise in the 1980s. By 1988 it was 38 per cent — higher than in Japan, Taiwan and Hong Kong and almost twice the rate of Australia. Although saving rapidly increased, investment was higher from the mid-1960s to the mid1980s, so that in this period Korea ran current account deficits which averaged about 5 per cent of gross national product (table 1 and figure 10). As a result, external debt accumulated from 22 per cent of gross national product in 1970 to 39 per cent in 1985 (World Bank 1990). It is only in recent years that sizeable current account surpluses have emerged.
Once incomes were higher and there were opportunities to accumulate wealth, other institutional features encouraged saving. Although financial instruments for saving were attractive, consumer credit and mortgage finance were very limited, the social security system was non-existent and there was a strong desire to accumulate saving to finance education. The disintegration of extended families also diminished the importance of the support network so that private savings had to be large to provide for old age (World Bank 1984, p. 16).
In Taiwan gross national saving averaged close to 12 per cent of gross national product in the second half of the 1950s and increased rapidly through the 1960s and 1970s. The accelerated growth of export income seems to have been the most important factor (Lin 1973, p. 125). However, the marked rise in saving which occurred in 1960 and continued more steadily after 1963 may have been associated with a number of government policies that had a strong psychological impact. In particular there was a strong anti-inflation campaign in 1960 (Lin 1973, p. 125). Before 1960 there was considerable activity in unofficial credit markets but heightened credit control in 1960 led to a number of major bankruptcies. This diverted considerable funds from the unofficial sector to the banks. High positive real interest rates — which, for 3 month term deposits, had risen from –2.0 per cent in 1960 to an average of around 7.5 per cent in the ensuing three years (Lin 1973, p. 82) — and rising incomes ensured a steady growth of saving.
In Singapore high savings have been achieved through compulsory contributions to the Central Provident Fund — in the early 1980s compulsory contributions amounted to 50 per cent of wages and salaries, 25 per cent each from employer and employee (Roberts 1988, p. 25). This was a factor which, along with wage rises, contributed to the downturn in the mid-1980s. The most striking feature in the Singapore investment and saving figures is the very large current account deficit in the early 1970s (table 1 and figure 10). In this period the current account deficit averaged around 22 per cent of gross domestic product and in the decade before and the decade after the average was 7.5 per cent. As in the case of Korea and Taiwan, it is only in recent years that persistently large surpluses have emerged.
Although high saving rates have been important in maintaining high investment, it seems that the growth of profits and rising incomes, as a result of export success, have done the most to raise the saving rates in the DAEs. Econometric analyses of saving behaviour in Korea uniformly show the highest explanatory power for income and growth variables (Yusuf and Peters 1984). In addition there is general evidence that the variability of exports in developing economies is closely associated with national savings (Mikesell and Zinser 1973).
50

COMMON FACTORS
Other factors — infrastructure, research and development, humancapital and marketing assistance Public infrastructure in the form of good transport and communication systems, research anddevelopment effort, investment in human capital and export market assistance have beenidentified as important in some cases. However, they do not appear to constitute majorcommon factors in the success of Japan and the DAEs.
Infrastructure is excellent in the case of Singapore. A study of ASEAN ports found thatsavings of some US$1.2 billion a year could occur in member countries if container berthproductivity could be raised to levels found in Singapore (Peters 1986). In contrast Taiwanhas achieved considerable success despite complaints about its infrastructure (Little 1979,p. 488). The lack of adequate infrastructure is, however, now regarded as an importantconstraint.
Likewise, for research and development, Japan has expended considerable sums (mostlyprivate) while Taiwan and Singapore have not spent as much (figure 11).
Although there are clearly benefits from having sufficient education to exploit technologicalcatch-up, the manufacturing success of the DAEs has been based largely on unskilled or semiskilled labour. Australia's secondary school and higher education enrolment rates are similarto those in Japan and Korea and higher than in the other DAEs (figure 12).
Figure 11: Research and development expenditure, 1988 As a percentage of GDP
3.0 Government funded R&D
Privately fundod R&D Total R&D2.5
2.0
13
1.0
Australia United Germany France United Japan Korea Taiwan SingaporeStates Kingdom
Source: World Economic Forum and IMD (1990).
51
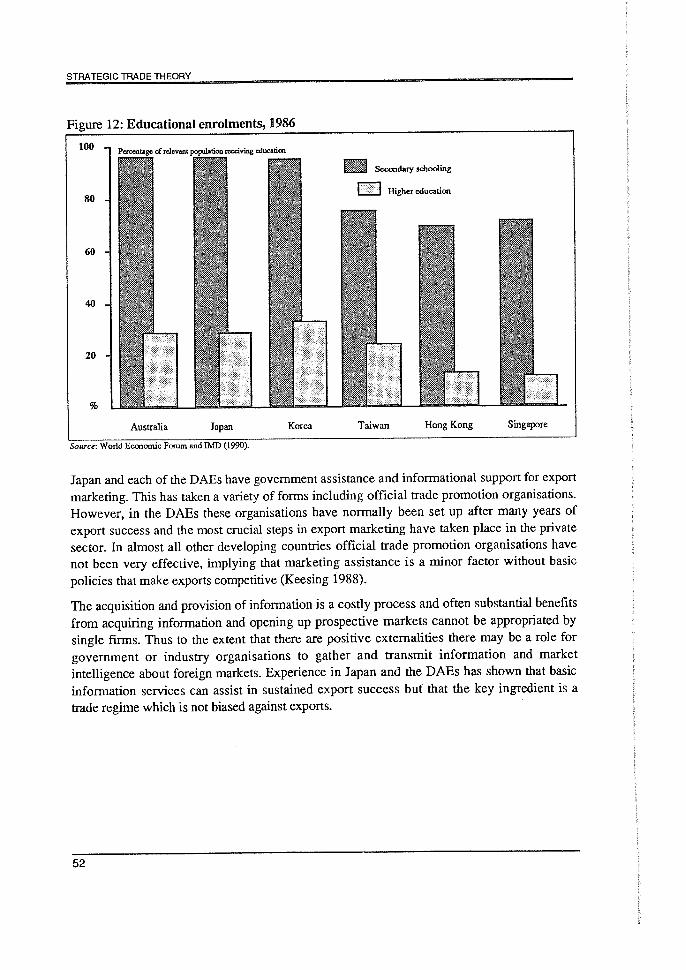
STRATEGIC TRADE THEORY
Figure 12: Educational enrolments, 1986
Source: World Economic Forum and WO (1990).
Japan and each of the DAEs have government assistance and informational support for export
marketing. This has taken a variety of forms including official trade promotion organisations.
However, in the DAEs these organisations have normally been set up after many years of
export success and the most crucial steps in export marketing have taken place in the private
sector. In almost all other developing countries official trade promotion organisations have
not been very effective, implying that marketing assistance is a minor factor without basic
policies that make exports competitive (Keesing 1988).
The acquisition and provision of information is a costly process and often substantial benefits
from acquiring information and opening up prospective markets cannot be appropriated by
single firms. Thus to the extent that there are positive externalities there may be a role for
government or industry organisations to gather and transmit information and market
intelligence about foreign markets. Experience in Japan and the DAEs has shown that basic
information services can assist in sustained export success but that the key ingredient is a
trade regime which is not biased against exports.
52

SUCCESSES AND FAILURES OF STRATEGIC TRADE POLICIES
Strategic trade policies and industry performance
As noted earlier, a competitively oriented strong state is generally seen as having been essential to the success of the five East Asian economies — a state that is able to maintain security and ensure that markets operate effectively. However, in four of these economies governments, at times, have gone beyond such basic 'minimum' requirements and attempted to pick potential 'winners'. Since there is no lack of experience with targeted industrial policies in the East Asian economies, it is natural to ask: have these worked in practice?
1Crugman (1987) discusses the reasons why finding an answer to this question is not simple. First, just ascertaining what a country's industry policies have been is often quite difficult. This is particularly so when broadly based and hard-to-measure instruments (for example, credit allocation, procurement policies, recession cartels and red-tape barriers to imports) had been used. 1Crugman suggests that even officials administering the programs often did not know how much support they were providing. Second, even when a country is known to have targeted a particular industry, there is no simple way of identifying what contribution the policy had made to growth in national income. The undulate test is whether the industry eventually generates enough extra national income to compensate for the costs associated with its targeting and earns a rate of return for the economy at least equal to the opportunity cost of the resources tied up. This is, however, hard to test. Also, while the phasing out of assistance over a relatively short period is generally seen as having had economy-wide benefits, the issue of whether the granting of industry-specific assistance itself has had a positive impact economy-wide remains unresolved (Riedel 1988, p. 37).
The primary aim of providing assistance to potential winners was usually to facilitate their growth. For example, for Japan, Yamamura (1987, p. 172) notes that the goal of MITI and the Ministry of Finance was to promote industries "that were to act as the engine of rapid economic growth". To assess empirically whether this aim had been achieved requires comprehensive data and the use of complex models. As seen earlier, the econometric studies carried out by Leamer, Saxonhouse and others, covering nine to sixty countries over the period 1960 to 1985, concluded that once differences in factor endowments were allowed for, there was little left for industry policy to explain (chapter 2).
Another way of assessing success would be to establish that the industries chosen by governments as potential 'winners' have grown following intervention more rapidly than industries not subject to special treatment. This would test the ability of governments to 'pick winners' — as opposed to their ability to make industries grow more rapidly than otherwise.
53

STRATEGIC TRADE THEORY
In this regard, the available broadly based statistics for Japan and Korea suggest a mixed picture, with some outstanding output growth in both targeted and non-targeted industries, and with below average growth rates in some of the targeted industries (tables 19 to 22).
In Japan, for example, the output of the machinery industry - which includes the targeted computer and motor vehicle industries - grew at rates well above the manufacturing average in the 1950s and 1960s (table 19). 5 However, the example of metal fmished goods shows that good performance was also possible without government targeting, while the example of iron and steel - which was targeted in the 1950s and experienced a growth rate below the manufacturing average in that decade - indicates that government assistance did not guarantee success (tables 19 and 20).
The available broadly based statistics for Korea show that several of the industries that were targeted during the heavy and chemical industries drive in the 1970s were already growth leaders in the 1960s (for example, transport equipment and iron and steel). UN statistics on shipbuilding and motor vehicles show that these were the main industries in the transport equipment category, each accounting for around 25 per cent of the value of the output of the industry in 1963. Since the shares of shipbuilding and motor vehicles each increased to around 40 per cent by the mid-1970s, these industries clearly experienced more rapid growth
Table 19: Annual growth in Japan's real output, by industry*
1950-62 1963-73 1974-78 1958-78
AU industry
Public utilities Mining and manufacturing Mining
All manufacturing
lion and steel Non-ferrous metals Metal finished goods Machinery Ceramics and cement Chemicals Petroleum and coal products Pulp and paper Textiles Wood and wood products Food a Exponential trend rates of growth. al958 to 1962. Source: Mainichi Shimbun Sha (1980, p.457).
14.7 123 3.4 10.2
10.4 10.6 5.6 9.5 15.0 12.4 3.3 10.2 4.0 -1.4 0.3 -1.1
15.9 12.6 33 10.4
14.8 13.9 -0.4 11.3 13.6 13.0 6.0 10.6 18•9b 15.1 4.2 11.5 23.3 16.2 4.5 13.8 12.4 10.0 2.1 8.5 15.5 13.8 5.2 11.3 21.4 15.7 0.4 13.1 15.8 9.7 2.7 8.4 11.5 7.4 1.0 5.7 4.6 4.1 0.0 2.7 9.9 5.5 2.2 5.9
According to UN statistics, over the period 1967 to 1986, the computer and motor vehicle industries (which in 1986 accounted for 7 per cent and 26 per cent, respectively, of the machinery industry) grew in terms of value of gross ouput (current prices) at 20 per cent and 15 per cent a year respectively, compared with 13 per cent for the machinery category overall.
5
54

SUCCESSES AND FAILURES
than transport equipment overa11. 6 However, while growth in the transport equipment and steel industries was boosted further following the introduction of extensive targeting — with rates of growth over 30 per cent a year not being uncommon in the 1970s — similarly high
Table 20: Government intervention and performance in Japan Industry performance a
High
High
High
Low (1950s and mid-1970s)
High (1963-73)
Low (1974-78)
Low
High (1960s)
Low (mid1970s onwards)
Low
Description of intervention
Motor vehicles Targeted in 1952 receiving loans, grants, tax incentives, help in developing export markets, home market protection through prohibitive tariffs (until mid-1970s); import quotas (until mid-1960s), restrictions on foreign investment (until early 1970s).
Computers Government involvement since industry's beginning in mid-1950s; home market protection (import and investment restrictions) and government coordination of technology agreement important until mid1970s.
Electronics and electrical appliances Received relatively little 'guidance'; but import protection, barriers to entry and price fixing allowed firms to raise domestic prices above world prices for some products (eg, TV sets).
Iron and steel Subject to two rationalisation plans during 1950s (low interest loans, tax benefits, home market protection, technology assistance permission to form cartels); however, extent of inherent subsidies between 1951 and 1975 estimated to have been small. Government assistance declined to virtually nil by 1970s.
Synthetic fibres Targeted in mid-1950s. Competitive without government involvement in 1960s and 1970s; however, no longer competitive when petrochemical (raw materials) costs rose in the 1970s. Industry designated as 'structurally depressed', qualifying for financial assistance and antitrust exemption.
Shipbuilding Designated as 'strategic' in 1950s (low interest loans, tax benefits). In the 1960s, serious stagnation followed the Suez crisis; special legislation introduced for 'reconstruction'. Support gradually withdrawn over 1970s. In 1978, industry designated as 'structurally depressed'. By early 1980s, the restructured industry was the most efficient in the world. Government support was discontinued.
Petroleum refining and petrochemicals Both designated 'strategic' in early postwar years. In 1949 government promoted onshore refining. Industry highly regulated since then. Petrochemical industry required by law to purchase higher priced domestically produced inputs.
Extent of government involvement b
High (1950s to 1960s)
High (1950s to 1970s)
Low
High (19505)
High (mid-to-late 1950s) Low (1960s to mid-1970s) Medium (mid-1970s onwards)
High (1950s and 1960s) Low (1970s) High (1978-80) Low (beyond 1980)
High (since 1949)
a High, medium, low according to above, equal to or below the average manufacturing growth. UN statistics on output and table 19 were used for assessing performance. b Based on a judgement of the extent of government interest and assistance relative to other sectors. As noted in chapter 2, in financial terms assistance to manufacturing in Japan has been relatively small and is declining. Sources: Hudson Institute (1982); Johnson (1982); US International Trade Commission (1983); Yamamura (1987).
6 UN statistics show that over the period 1963 to 1972 the motor vehicle industry grew (in terms of value in current prices) by 55 per cent a year compared with 34 per cent for the transport equipment category.
55

STRATEGIC TRADE THEORY
growth was also achieved in the same period by industries not included in the heavy and chemical industries drive, such as leather products, footwear, fabricated metal products, and electrical and scientific equipment (tables 21 and 22).
The experiences of Japan's iron and steel industry highlight the difficulties of assessing whether or not targeting has been successful. Krugman (1987, pp. 287-8) argues that although Japan's targeting of steel is most widely cited as an example of successful industrial policy (because of Japan's emergence as a major exporter of steel in the 1960s and early
Table 21: Annual growth in Korea's real output, by industry
ISIC no.DDescriptionD 1963-72 1973-79 1980-88
GNP 8.7 10.3 8.4
Selected manufacturing industries 321 Textiles 27.7 17.2 6.6 323 Leather products 14.4 43.0 12.0 324 Leather footwear 15.9 37.4 8.4 332 Furniture and fixtures 7.6 28.8 15.0 354 Petroleum and coal products 13.4 14.7 7.8 356 Plastic products na 32.4 13.4 371 Iron and steel 23.2 30.9 9.8 372 Non-ferrous metals 7.6 34.6 17.2 381 Fabricated metal products 10.8 42.2 11.3 383 Electrical machinery, etc. 27.9 38.7 28.0 384 Transport equipment 22.4 36.3 22.3 385 Professional and scientific equipment 24.1 34.2 16.3
' Exponential trend rates of growth. na Not available. Sources: For GNP, World Bank (1988 and previous years). For manufacturing output, UNIDO (1988 and previous years).
Table 22: Government intervention and performance in Korea
IndustryD DescriptionD Extent of government IndustryD performanceaDof interventionb D involvementa
Shipbuilding ) Targeted between 1972 and 1979; High (1972-79) Motor vehicles )High (1963-88) investment funds channelled Steel ) preferentially to conglomerates; low
interest loans; high protective barriers; tolerance of monopolies; incentives for R&D
Non-ferrous metals ) Low (1963-72) ) High (1973-88) Since 1980, new policies;
elimination of subsidised loans to Petrochemicals ) High (1963-79) preferred industries and end of
) Low (1980-88) cartel arrange-ments; floating the exchange rate; lowering tariffsd; financial liberalisation
I High medium, low according to: above, equal to or below GNP growth. UN statistics on output and table 21 were used for assessing
performance. b Relates to all industries listed. c Based on a judgment of the extent of government interest, not the level of assistance.
01 See table 11 for details.
Sources: Dombusch and Park (1987); de Franco et al. (1988).
56

SUCCESSES AND FAILURES
1970s), the policy was actually a failure when judged by more appropriate criteria. One such criterion is the rate of return achieved by the industry. For steel this was low, with the heavy investments between 1965 and 1972 yielding a rate of return of 11 per cent in 1971 compared with 18 per cent for manufacturing overall.
Japan's motor vehicle and computer industries are also often cited as examples of the 'success' of targeting. Both received significant government support in the 1950s and became major producer—exporters, initially by following developed country practices. Government involvement has declined considerably since the 1960s, but these industries continued to develop and grow.
The extent to which government involvement contributed to the performance of the Japanese motor vehicle industry is not clear since this industry developed along very different lines to the 'single people's model produced by a single firm' outcome preferred by MTH. Firms like Honda managed to enter and be successful in the industry despite strong opposition from MITI, which was intent on consolidating the Japanese motor vehicle industry (appendix D). Also, other equally successful industries, such as consumer electronics, received little government attention and few subsidies (Yamamura 1987), suggesting that targeting was not essential to achieving high output growth. A well known example is Sony's success in the commercial application of transistor technology — the success occurring despite Mill's view that the venture was unpromising and despite MITI's direct hindrance of Sony in the late 1950s in the procurement of transistors. As Kasper (1991) notes:
names like Sony, Honda, Canon or YICK owe nothing whatever to bureaucratic promotion, but everything to innovation, rivalry and low cost.
Perhaps the lack of correlation between specific interventions and industry performance is best illustrated by those targeted industries which never became internationally competitive. In Japan the clearest examples of 'failure' are the petroleum and petrochemical industries. In the early postwar years both were earmarked as 'strategic', probably for security of supply reasons. The petroleum industry has been heavily regulated since, with government control over refinery entry, capacity and production, crude oil imports and domestic pricing. The upstream petrochemical industries, despite strong protests, are still forced by government to purchase the higher priced domestically produced naphtha. These all-pervasive and continued regulations have resulted in a highly fragmented industry, plagued by overcapacity and needing continued assistance.
In Korea, as for Japan, there appear to have been successes with and without intervention as well as failures among the targeted industries. As suggested by Porter (1990b, pp. 474-5), the most significant general successes were substantial investments in education and infrastructure, and the elevation of international success to the level of national priority. However, in Korea, success led to problems when, in the early 1970s, the government grew overconfident of its own planning ability and initiated a strategy of heavy industrialisation through 'picking winners' (chapter 3).
57

STRATEGIC TRADE THEORY
Clear failures of the heavy and chemical industries drive are segments of the petrochemical industry such as fertilisers. These are a prime example of overinvestment in an import-intensive industry. In 1980, Korean urea production costs were five times as high as in the United States and ten times as high as in the Middle East. Substantial capacity had to be scrapped. Steel production is seen by some as a success since Korea's integrated iron and steel firm, POSCO, is now considered one of the world's most efficient producers. However, because it was developed with highly subsidised capital, it may not be efficient in an economic sense. Examples of success without intervention are branches of the consumer electronics industry — especially assembly of imported components and small scale manufacturing (World Bank 1986, pp. 45-6).
Because investment in heavy industries far outstripped the country's resource capabilities, investments in light manufacturing had to be sacrificed and export incentives reduced. The problems that became evident included duplicated investments, excess capacity and bankruptcies. But the realisation that the policies were a mistake came too late — the sheer scale of the projects was such that the investments could not be easily discontinued. In 1980 the Korean economy was in recession — real GNP declined by 5 per cent.
In Taiwan the government announced plans to invest US$6 billion (at 1974 prices) in the early 1970s in ten major public sector projects. Six of the projects involved transport infrastructure — including road, rail, harbours and international airports. Nuclear power plants constituted another project. The three remaining projects were an integrated steel mill, a large shipyard and several petrochemical plans (Galenson 1979). Some enterprises did well but serious problems emerged in most of the non-infrastructure type projects. The shipbuilding venture was particularly affected. Some of these ventures were closed down in the early 1980s when sector-specific interventions were wound back. An important exception at this time, however, was ambitious targeting which continued in the automotive sector (Woronoff 1986, p. 70). In the 1960s the government encouraged foreign investment in car factories through large tax incentives and a 75 per cent tariff. Although tariffs will be reduced to 30 per cent by the end of 1990, currently there are seven companies assembling motor vehicles and 500 films producing parts in Taiwan — with a population of only 20 million people. A drastic shake-out is expected to take place within the next few years (Australian Institute of Business Centre 1990, appendix; Far Eastern Economic Review 1990).
In Singapore the high growth rates achieved in the 1960s and 1970s came to a halt in the mid1980s. The government wanted to make Singapore a centre of excellence for technology, manufacturing and services. The main mechanism was a substantial increase in wages in an attempt to encourage value adding manufacturing. In 1985, gross national product per person declined by 1 per cent and in 1986 it barely made up the lost ground. In response, the government lowered wages and taxes, made exchange rate adjustments and growth recovered.
In considering the question of the effectiveness of targeting, it is important to bear in mind that many countries, other than the dynamic Asian economies, have been supporting their industries. Among the numerous industries receiving assistance in Britain and France, steel
58

SUCCESSES AND FAILURES
and aircraft have been assisted for several decades, but without success. Europe's high technology conglomerate effort, the Airbus project, has been subsidised now for some twenty years, and profits are not expected until the mid 1990s, although world demand for aircraft has been extremely buoyant in recent years (statement by Airbus managing director, reported in Financial Times, 18 April 1990). The present value of the implicit subsidy to the project between 1979 and 1988 has been estimated to be of the order of US$1.5 billion (1974 dollars) (Baldwin and Krugman 1988). Additional subsidies worth US$2.2 billion were approved by the European Commission on 8 March 1989 (Aviation Week & Space Technology 1989; Financial Times, 22 March 1989).
Compared with the dynamic Asian economies, where governments tended to exhibit speed and flexibility in bringing about capacity reductions in non-commercially viable manufacturing activities, governments in the United States, the European Community and Australia have more often delayed than encouraged inevitable structural adjustments.
So, while some assisted industries became international successes, others failed. And some industries succeeded without government intervention. Probably the most outstanding example of economy-wide success without targeting was Hong Kong. In this country rapid growth was achieved with the government restricting its activities to supporting the market, mainly through the provision of infrastructure.
Overall, the available evidence suggests that government intervention is neither a necessary nor a sufficient condition for achievement of above average growth rates.
The costs of rapid growth Rapid economic growth comes at a cost. This cost was accepted by Asian communities in the early days of their industrialisation, because of their general commitment to growth. Rapid growth meant having to work extremely hard and, in many cases, putting up with rising levels of pollution and congestion. Also, because some government funds were channelled toward targeted industries, there were generally less funds for such things as public infrastructure, housing and the social 'safety net'.
Table 19 shows that in Japan the public utilities category grew below average during the 1950s and 1960s. The Japanese people had to wait until the early 1970s before facilities essential to everyday life could be noticeably improved, but changes to date have not been substantial. Yamamura (1987, pp. 202-5) adds that pollution of air and water rose considerably and social welfare programs were neglected. Social security benefits in Japan are not expected to reach 29 per cent of national income — similar to the levels available in Western Europe in the mid-1980s — before 2010 (Ministry of Health and Welfare 1987).
As living standards have risen, there has been less and less acceptance of such costs, and the Japanese people have begun to weigh carefully the gains from industrial policies against their costs. The government is now placing emphasis on measures to improve the quality of life,
59

STRATEGIC TRADE THEORY
with MITI (1990) advocating a shorter working week, a shift toward an individual, rather than a company-oriented society, increased leisure opportunities, and greater attention to environmental issues.
In Korea, the side effects of the targeting policies of the 1970s have been generally recognised as underdevelopment of light industries. There was also neglect of social infrastructure, lack of competition associated with the dominance of the chaebol and a fragile financial structure. Prior to 1987, Korea had virtually no industrial relations system and there were very few strikes (chapter 4). However, following the government's announcement of democratisation initiatives in 1987, strikes erupted across a wide range of industries. In 1987 and 1988, the average number of work days lost due to strikes was 175 times the average for the preceding five years (Australian Financial Review, 3 October 1990, p. 38) and strike action continued in 1989 (Australian Financial Review, 28 May 1990, pp. 1, 12). As seen earlier, wages also rose very rapidly in Korea over the same period.
In Taiwan, pollution and congestion are very high. These have generally been seen in recent years as major problems, together with labour shortages, lack of research and development and China—Taiwan relations. Currently, slower economic growth due to wage rises moving ahead of productivity, and the relocation of Taiwanese industries offshore due to high wages, an escalating crime rate and anti-pollution protests, are seen as major problems. The government responded to rising environmental concerns by introducing in 1990 a new Environmental Impact Assessment Act, under which projects that could have an adverse impact on the quality of life in Taiwan will need official approval before they are able to proceed (Australian Financial Review, 10 October 1990, p. 38).
The pattern in the five East Asian economies has been that, as the benefits of high economic growth were felt through improved material well-being, the people became less and less tolerant of the some of the costs of rapid industrialisation.
60

6. LESSONS FOR AUSTRALIA
Growth and international competitiveness
Australia's economic perfolinance has been poor relative to other countries for a very long time. In contrast Japan achieved outstanding economic growth for most of the past forty years while the DAEs have grown rapidly since about the mid-1960s (chapter 1).
Successive World Economic Forum reports have found that Australia's performance on most competitiveness measures has been ordinary while Japan has consistently excelled and the DAEs have fared impressively. According to the overall measure of international competitiveness presented in the latest report, Australia slipped from tenth position in 1988 to thirteenth in 1990 among OECD countries. While the World Economic Forum survey focuses on manufacturing, which is not the main area of Australia's comparative advantage, Australia also slipped in terms of its position as an exporter: from sixteenth in the world in 1987 in terms of the value of its exports to nineteenth by 1989. Exports from Korea, Taiwan, Hong Kong and Singapore have grown so rapidly that they have overtaken Australia in terms of their ranking and share of world exports (table 23). As shown earlier, exports in these countries increased by 200-300 per cent over the period 1979 to 1989 (figure 6).
Relevance of East Asian experiences
A study of Australia by a team of nine North American economists described the distinguishing characteristics of Australia as: a small population relative to a large land mass, rich natural resources, geographic remoteness from trading partners, political stability, endorsement of egalitarianism and a generally high standard of living. Other distinguishing features were seen to be a distrust of markets, a history of protectionism and the development of many working arrangements and government-induced barriers which are 'rent-seeking' in nature (Caves and Krause 1984).
Government assistance, regulations and controls in Australia are extensive. Manufacturing protection has been high since Federation and remains among the highest of the OECD and rapidly developing economies. The country's natural isolation, history of protection and lack of competitive pressure have fostered a host of uncompetitive and inefficient practices. State regulations and controls and the existence of regulated government business enterprises have further segmented markets and restricted competition. Lobbying to maintain and expand assistance and to seek licences and favourable treatment has been encouraged by the prospect of sharing in artificially created economic rents.
In Japan and the DAEs, an important factor underlying the social consensus to industrialise has been the realisation that meagre natural resources provided limited alternatives for
61

STRATEGIC TRADE THEORY
Table 23: Merchandise trade performance in 1979 and 1989
Exports (value) Imports (value) Rank (as share of Share of Rank (as share of Share of
world exports) world exports world imports) world imports
Country 1979 1989 1989 1979 1989 1989
% %
Australia 16 19 1.2 19 19 1.3 United States 1 1 11.8 1 1 15.4 Germany 2 2 11.0 2 2 8.4 Japan 3 3 8.9 3 3 6.6 Korea 27 13 2.0 15 13 1.9 Taiwan 22 12 2.1 25 16 1.6 Hong Kong' 26 11 2.4 22 11 2.3 Singapore' 30 17 1.4 20 17 1.6 • Includes substantial re-exports. For Hong Kong, re-exports accounted for 61 per cent of total exports in 1989, and for Singapore the corresponding figure was 37 per cent_ Source: GATT (1990).
improving living standards. By contrast, Australians have been able to attain high living standards because of the richness of the country's natural resources.
It is generally argued that industrial development tends to be frustrated in nations exporting resource-based commodities. In countries like Australia, natural wealth supports much higher real wages and therefore a higher exchange rate. This creates a natural disadvantage for manufactured exports but not one which government targeting should address (see for example Naya 1988 and Jacobs 1986).
Reasons for Australia's poor performance are highlighted in the World Economic Forum surveys, which show that Australia's competitive strengths and weaknesses are, in the main, antithetical to those of the East Asian economies. While — as would be expected — Australia scored well in natural resources in the 1990 World Economic Forum study, it was at or generally below the OECD group average for the characteristics which are the main strengths of Japan and the DAEs: dynamism of the economy, industrial efficiency, future orientation, market orientation and international orientation (chapter 4).
An area which stands in stark contrast to those in Japan and the DAEs is Australia's labour market. The weakness of the craft-based union structure and the myriad of restrictions in the workplace are now being more exposed by the persistently inferior productivity performance of Australian industry (chapter 4).
In the World Economic Forum Surveys, Australia has generally scored well below Japan and the DAEs for absenteeism, worker motivation, vocational training and willingness to relocate, retrain and accept new functions and labour-saving technology. Also, Australia's ability to adjust wages and employment conditions to economic circumstances was low relative to that of Japan, Taiwan, Hong Kong and Singapore (chapter 4). In 1988, the average working week
62
LESSONS FOR AUSTRALIA
in Australia was 38 hours, compared with around 50 hours in the DAEs. In the same year, wages of production workers, at around US$11 an hour, were four times higher than in the four dynamic Asian economies. These characteristics suggest the need for exceptional productivity performance if Australia is to be internationally competitive.
In relation to governments' role in the success of the East Asian economies, the evidence suggests a mixed picture. At one time or another the governments of four of the five economies made use of strategic trade policies. However, the available evidence — in the form of both econometric analyses and general observations — suggests that there is not a convincing link between governments targeting a particular industry and the performance of that industry. There were successes but there were also failures, and there were successes in spite of intervention.
Overall, the evidence points to strategic interventions being unimportant in explaining success compared with a number of other factors — such as social commitment to achieve economic success, an effective role for the government in ensuring that the basics of markets were in place and in particular that special interest pleas were generally resisted, technological 'catchup', vigorous competition in product markets and a highly flexible and competitive labour force.
When strategic interventions were used, these were in most cases introduced on the understanding that assistance would be temporary. In practice, most measures were either significantly reduced or withdrawn within a decade. By contrast, in Australia, several industries have received significant and sustained government assistance for two decades or more. The best known examples are textiles, clothing and footwear and motor vehicles.
Hong Kong provides the most convincing evidence that exceptional economic performance can be achieved without the help of strategic trade policies. As noted earlier, Hong Kong is arguably the most outstanding and robust example of the benefits of free markets — operating within a system that provides public safety and protects private property. Over the past forty years governments in Hong Kong have limited their activities to maintaining law and order and providing social infrastructure. Yet in Hong Kong — an economy with no strategic interventions — growth rates of real gross domestic product per person averaged around 7 per cent a year from 1960 to 1988.
As was seen earlier, in Japan and the dynamic Asian economies growth came at a cost. There was high pollution, neglect of social security, and there were family sacrifices arising from long hours of hard work. However, as living standards have risen, there has been less and less acceptance of such costs. The Japanese government is now planning to introduce a series of measures with a view to improving the quality of life significantly (chapter 5). It seems unlikely that Australians would accept such costs. Living standards in Australia are generally seen as already high and the quality of life is in many respects considerably higher than in Japan and the DAEs.
63

STRATEGIC TRADE THEORY
Conclusions
The major common factors identified as important to the success of Japan and the dynamic Asian economies are not present in this country. Apart from the lack of significant 'catch-up' opportunities because of Australia's developed country status, key ingredients that are missing are: a strong social consensus to achieve growth; acceptance of the costs which accompany rapid growth; and effective operation of markets including vigorous competition in product markets.
However, Australia can learn some valuable lessons from the experiences of these Asian economies.
First, industry-specific assistance is far from being a prerequisite for success and is likely to be harmful, especially if it is extensive and maintained over long periods of time.
Second, policies which encourage competition in product markets should be vigorously pursued if Australia's economic performance is to be improved, as competitiveness is the key to successful upgrading and innovation.
Third, the operation of labour markets needs to be improved. This does not necessarily mean longer hours and lower wages. It is possible to have more leisure and income if productivity is higher. This could be achieved through greater flexibility, greater effectiveness of workers while on the job, less industrial unrest, and an increased willingness to retrain, undertake new tasks and accept labour-saving technology. It is also important to have employment conditions that are responsive to changes in economic circumstances.
Fourth, because of Australia's geographic isolation it is all the more important to have a well-functioning and efficient transport and communications system.
64

Appendix A: TECHNOLOGICAL CATCH-UP AND THE INITIAL CONDITIONS FOR GROWTH
It has long been recognised that technological change is a major determinant of sustained economic growth and it is not surprising to find that it has been of primary importance in explaining the success of Japan and the DAEs in the postwar period. These economies have been particularly successful in adapting and refining the technology and production and organisational methods used in more developed economies. This process is known as 'technological catch-up' and is a very effective means of achieving growth since it avoids the expensive research costs of expanding technological capabilities. Until the phenomenal success of the DAEs the traditional growth process in developing economies was based on the export of food and raw materials with a gradual move to basic manufactured goods. The DAEs bypassed this slow process by achieving dramatic growth of manufactured exports. Technological advances which have facilitated the decomposition of production processes into simpler tasks and improvements in transport and communications have provided new opportunities for countries to grow rapidly and underpinned the export success of the DAEs (Frobel et al. 1981; Rodan 1989).
Many other countries have had the opportunity of realising rapid growth through technological catch-up but have not been as successful because their social and economic conditions have not been as favourable to the effective transfer of technology (chapter 2).
The nature and potential size of technological catch-up
After the war there was a large pool of proven technology, production and organisational methods which many countries were able to exploit to rapidly improve living standards. Among OECD countries rapid convergence in per person income levels was clearly evident from 1950 to 1973, with more limited convergence occurring after 1973 (table Al).
Technological catch-up is, however, not offered as the sole explanator of the rapid convergence amongst OECD countries. For some countries postwar reconstruction and generous aid was initially important, and the general factor which seemed to underpin rapid growth was a move to greater liberalisation of product and factor markets — which engendered confidence, improved flexibility, promoted competition and encouraged investment (OECD 1987a).
Table Al: Dispersion of GDP per person among 24 OECD countries Dispersion measure 1950 1960 1973 1985 Coefficient of variation 0.51 0.44 0.35 0.33 Source: Dowrick and Nguyen (1989, p. 1013).
65

STRATEGIC TRADE THEORY
Nevertheless, there is a consensus in the literature that some countries, particularly Japan and Germany, took great advantage of this favourable economic environment by exploiting the potential for technological catch-up more successfully than others (Abramovitz 1990). The DAEs are offered as more recent examples of the successful exploitation of technological catch-up.
The potential contribution of technological catch-up can be gauged by undertaking growth accounting calculations. Such calculations apportion growth according to the contributions of labour, capital and a broad measure of technological and reallocative improvements described as total factor productivity. The latter is essentially a residual which can be further apportioned according to the contributions of advances in knowledge, scale economies, reallocative effects, changes in regulations and other factors which might affect productivity. Since total factor productivity is a residual it also encompasses the impact of social and institutional factors on growth.
It is a difficult task to identify the contribution of social factors other than in a qualitative sense, but it is clear that social and institutional factors were not persistently changing in the period under study and that Japan and the DAEs were very active in adopting and refining production methods of more advanced countries.
Growth accounting calculations confirm the importance of total factor productivity for various countries in rapid growth periods (tables A2 and A3). In Japan total factor productivity growth accounted for some 60 per cent of growth in real gross domestic product over the period 1955 to 1970, with advances in knowledge contributing more than 20 per cent.
Table A2: Sources of Asian economic growth Average annual growth rate
Japan Korea Taiwan Hong Kong Singapore 1955-70 1955-70 1955-70 1955-70 1957-70
Real GDP 10.1 8.8 8.0 9.3 6.6
Contributions from: Labour input 1.0 (9.9) 1.7(19.3) 1.7(213) 1.9(20.4) 1.5 (22.7)
Capital input 2.8 (27.7) 2.1(23.9) 2.0(24.9) 3.1 (33.3) 1.5 2z7)
Total factor productivity 6.4 (63.4) 5.0(56.8) 4.3(53.6) 4.3(46.2) 3.6 (54.5) Of which: Reallocation of resources 1.0 (9.9) 1.5(17.0) 1.1(13.8) 0.2 (2.2) 0.2 (3.0)
Note: Figures in brackets are percentage contribution to GDP. Source: Chen (1979).
66

A: TECHNOLOGICAL CATCH-UP AND THE CONDITIONS FOR GROWTH
Table A3: Sources of economic growth in various OECD economies and Korea Average annual growth rate
OECD United average States Germany France Japan Korea
1960-73 1948-69 1950-62 1950-62 1953-71 1963-82
% % % % % %
Real GDP 5.2 4.0 6.3 4.7 8.8 8.1
Contributions from: Labour input 0.6 1.3 1.4 0.4 1.8 3.3 Capital input 1.8 0.8 1.4 0.8 2.1 1.6 Total factor productivity 2.8 1.9 3.5 3.5 4.9 3.2
Of which: Improved resource allocation 0.3 1.0 1.0 1.0 0.6 Scale economies 0.4 1.6 1.0 1.9 1.5 Advances in knowledge and other factors 1.2 0.9 1.5 2.0 1.1
Sources: United States, Japan, Germany, France: Denison and Chung (1976); OECD average: Englander and MiueLstadt (1988); Korea: Westphal (1986, pp. 245-7).
67

Appendix B: REVEALED COMPARATIVE ADVANTAGE
Table Bl: Revealed comparative advantage indexa
Year Japan Hong Kong
Republic of Korea Singapore Taiwan
Unskilled labour intensive 1970 1976 1980 1985
2.61 1.38 1.17 0.89
7.10 6.91 6.48 5.74
5.43 6.06 5.63 4.18
0.94 0.94 0.93 0.72
na na
6.14 5.58
Human capital intensive 1970 1976 1980 1985
1.62 2.25 2.42 2.10
0.45 0.70 1.23 0.87
0.20 0.76 1.19 1.84
0.39 0.61 0.51 0.43
na na
0.81 0.78
Technology intensive 1970 1976 1980 1985
2.46 2.10 2.13 2.08
1.59 2.06 1.59 1.45
0.62 1.39 1.46 1.16
0.63 1.75 1.80 1.19
na na
1.81 1.44
Physical capital intensive 1970 1976
1.37 1.68
0.13 0.18
1.16 0.39
0.26 0.45
na na
1980 1985
1.80 1.50
0.23 0.44
0.74 0.53
0.56 0.59
0.43 0.48
a RCA index is (Elh/Ehy(WW) where gh is export of product i by country h, Wt is the world total exports of product i, and W is the
world total exports. Thus an index of greater than one reveals a comparative advantage in the production of a class of goods for the country
under consideration relative to the rest of the world. na Not available.
Source: Chen (1989, p. 37).
68

B: REVEALED COMPARATIVE ADVANTAGE
Table B2: Description of comparative advantage categories
SITC class'DDescription
Unskilled labour intensive 65 Textile yarn, fabrics, made-up articles nes, and related products 664 Glass 665 Glassware 666 Pottery 81 Sanitary, plumbing, heating and lighting fixtures and fittings, nes 82 Furniture and parts thereof 83 Travel goods, handbags and similar containers 84 Articles of apparel and clothing accessories 85 Footwear 89 Miscellaneous manufactured articles, nes (except 8% and 897) Human capital intensive 55 Essential oils and perfume materials; toilet, polishing and cleansing preparations 62 Rubber manufactures, nes 64 Paper, paperboard, and articles of paper pulp, of paper or of paperboard 69 Manufactures of metal, nes 775 Household type, electrical and non-electrical equipment, nes 78 Road vehicles (including air cushion vehicles) 79 Other transport equipment 885 Watches and clocks 896 Works of art, collectors' pieces and antiques 897 Jewellery, goldsmiths' and silversmiths' wares, and other articles of precious or semi-precious
materials
Technology intensive 54 Medicinal and pharmaceutical products 56 Fertilisers, manufactured 57 Explosives and pyrotechnic products 58 Artificial resins and plastic materials, and cellulose esters and ethers 59 Chemical materials and products, nes 88 Photographic apparatus, equipment and supplies and optical goods, nes (except 885) 87 Professional, scientific and controlling instruments and apparatus, nes 752 Automatic data processing machines and units thereof; magnetic or optical readers, other machines
for transcribing and processing data, nes 76 Telecommunications and sound recording and reproducing apparatus and equipme,M. 77 Electrical machinery, apparatus and appliances, nes and electrical parts thereof (except 775) Physical capital intensive 682Non-ferrous metals 672Iron and steel 512Organic chemicals 522Inorganic chemicals 712Power generating machinery and equipment 722Machinery specialised for particular industries 732Metal working machinery 742General industrial machinery and equipment, nes and machine parts, nes 7512Office machines
SITC classification refers to revision 2. nes Not elsewhere specified
69

STRATEGIC TRADE THEORY
Table B3: Exports of selected commodities, as a share of total exports
S1TC classa Commodity
Japan 5 Chemicals and related products 65 Textile yarn, fabrics etc. 67 Iron and steel 69 Metal manufactures nes 72 Machines for special industries 74 General industrial machinery nes 75 Office machines, ADP equipment 76 Telecommunications, sound equipment 77 Electrical machinery nes 781 Passenger motor vehicles 784 Motor vehicle parts and accessories 793 Ships and boats 84 Clothing and accessories 88 Photographic, optical equipment 89 Misc, manufactured goods nes
Total
Korea 0 Food and live animals 1 Beverages and tobacco 2 Crude materials excl fuels 5 Chemicals and related prods 63 Wood, cork manufactures nes 65 Textile yarn, fabrics etc. 67 Iron and steel 69 Metal manufactures nes 75 Office machines, ADP equipment 76 Telecommunications, sound equipment 775 Household equipment nes 776 Transistors, valves etc. 78 Road vehicles 793 Ships and boats etc. 84 Clothing and accessories 851 Footwear 89 Misc, manufactured goods nes
Total
1966
6.8 13.0 13.2 3.7 0.6 5.2 0.5 7.8
10.8 1.8 1.9 8.4 3.5 1.8 4.6
83.7
16.5 2.8
18.6 0.3
12.2 13.8 3.2 1.7 0.0 1.3 0.0 0.0 0.3 0.1
13.3 2.2 7.6
93.8
1971
6.2 8.6
14.8 3.4 0.8 7.8 1.6 9.9
12.0 7.5 0.8 7.7 1.9 2.4 2.8
88.2
6.5 1.4 8.9 1.4
12.1 12.9 2.3 1.3 0.5 1.0 0.2 4.5 0.2 0.7
28.5 3.5 8.6
94.6
1976
5.6 4.9
15.6 3.0 1.1 8.9 1.5
10.7 14.3 9.0 0.5
10.5 0.6 3.2 1.7
91.1
6.6 1.0 2.5 1.5 4.7
12.4 4.8 2.9 0.0 2.6 0.5 4.1 0.3 3.6
23.9 5.2 6.3
83.0
1981 1985 1987
4.4 4.3 5.0 3.9 2.8 2.4
11.0 7.7 5.5 2.9 2.0 1.6 3.9 4.2 4.6 5.8 4.5 4.5 2.8 6.0 7.9
10.6 12.2 11.0 7.0 8.4 9.6
12.1 14.4 15.6 1.8 3.1 4.8 4.8 3.4 1.9 0.4 0.4 0.3 3.7 3.4 3.4 2.7 3.0 2.9
77.8 79.8 81.1
6.2 3.7 5.1 0.6 0.3 0.2 1.3 1.0 1.1 3.0 3.1 3.2 2.1 0.2 0.2
11.6 8.4 10.0 8.7 6.0 5.7 5.2 5.0 3.9 0.4 1.9 3.9 6.0 6.5 12.1 0.5 1.0 2.2 2.5 3.8 5.8 2.2 3.2 8.7 6.6 16.6 2.8
18.2 14.7 18.4 4.8 5.1 6.7 3.9 4.8 7.6
83.8 85.3 97.8 (Continued on next page)
70

B: REVEALED COMPARATIVE ADVANTAGE
Table B3 (continued)
STTCclass' Commodity 1966 1971 1976 1981 1985 1987
Hong Kong2 Crude materials excl. fuels 3.7 2.2 2.9 3.5 3.0 2.95 Chemicals and related products nes 4.1 4.1 3.4 3.5 4.0 4.765 Textile yarn, fabrics etc. 16.8 10.7 9.7 10.1 10.1 11.766 Non-metal mineral manufactures nes 4.8 5.1 3.7 2.6 1.7 4.069 Metal manufactures nes 2.6 2.3 2.3 2.4 2.0 2.075 Office machines, ADP equipment 0.0 0.1 1.0 2.8 4.6 3.876 Telecommunications, sound equipment 3.4 5.2 5.9 6.3 6.8 7.1775 Household type equipment nes 0.0 0.3 1.0 2.6 2.6 2.1776 Transistors, valves etc. 0.0 1.4 1.9 2.9 3.0 3.1831 Travel goods, handbags 0.8 1.3 1.7 1.6 1.6 2.084 Clothing and accessories 27.0 31.2 34.1 24.9 22.3 22.1851 Footwear 2.5 2.1 0.9 1.0 0.8 1.0885 Watches and clocks 1.1 2.1 4.5 7.9 5.2 4.8894 Toys, sporting goods 6.2 7.5 5.9 6.3 55 5.8899 Other manufactured goods 5.9 7.0 2.5 2.3 1.9 2.1
Total 78.9 82.5 81.4 80.8 75.1 79.1
Singapore 0 Food and live animals 12.3 10.0 5.8 4.8 4.4 4.523 Crude rubber 20.6 17.7 12.3 5.5 3.0 2.63 Mineral fuels etc. 15.9 25.7 29.7 32.0 27.1 16.15 Chemicals and related 3.2 3.5 3.7 3.5 5.4 6.265 Textile yarn, fabrics etc. 3.5 4.1 2.7 1.7 1.5 2.269 Metal manufactures nes 1.7 1.4 1.1 1.3 1.1 2.274 General industrial machinery nes 3.2 3.3 3.4 2.5 2.6 3.075 Office machines, ADP equipment 0.0 0.2 1.1 0.9 6.0 11.776 Telecommunications, sound equipment 0.3 1.7 4.0 6.6 6.3 9.9772 Switchgear etc. 0.4 0.3 0.6 1.3 3.1 2.3776 Transistors, valves etc. 0.0 0.4 7.1 5.2 6.1 8.3778 Electrical machinery nes 0.8 4.1 1.3 0.9 0.1 1.178 Road vehicles 3.5 2.6 1.4 1.1 0.1 0.7793 Ships and boats 0.0 0.6 3.9 2.6 0.1 1.184 Clothing and accessories 1.4 2.6 2.8 2.2 2.3 1.889 Misc, manufactured goods nes 1.4 2.0 1.2 2.0 2.1 3.4
Total 68.2 80.3 82.1 74.1 71.3 77.1a SITC classification refers to revision 2. Data for 1966 to 1976 classified by earlier revisions have been reaggregated to reflect asaccurately as possible the current classifications. net Not elsewhere specified.Source: United Nations (1989 and previous years).
71

Appendix C: INTERNATIONAL COMPETITIVENESS
The World Economic Forum survey The World Economic Forum publishes an annual report on international competitiveness which it defines as "the ability of entrepreneurs to design, produce and market goods and services, the price and non-price qualities of which form a more attractive package than that of competitors".
The 1990 report includes some three hundred competitiveness indicators and covers 23 OECD countries and ten newly industrialised economies. Most indicators are quantitative but many are derived from a comprehensive survey of business people and economic opinion leaders in each country. The indicators are presented under ten categories indicative of 'factor inputs', 'the transformation process' and 'the supporting environment' for each economy under scrutiny (table Cl).
Table Cl: Explanation of categories used by the World Economic Forum
Broad category FactorD Explanation
Factor inputs Human resources Examines the competitive advantages in the skills, motivation, flexibility, age structure and state of health of a country's work force.
Financial dynamism Covers facets of the financial environment of the government and private sectors and the interaction between them.
Natural endowment Examines the possession and use of natural resources. Sample utilisation indicators: measures of agricultural and energy production,
electricity generation and consumption, mineral deposits, resource imports and exports, recycling.
Transformation Industrial efficiency Measures the success with which economic resources are process efficiently used.
Future orientation Covers the degree of innovativeness of products, services, techniques and management and the success of market forces in redeploying resources into new areas.
International Measures the degree to which a country's products and enterprises orientation are present in foreign markets and receptiveness to imports.
Supporting Dynamism of the Scans criteria related to the macroeconomic environment and environment economy infrastructure. Sample indicators: measures of growth, outlook,
industry performance, communications.
Market orientation Reviews the health, structure and sophistication of markets and the strategies adopted by firms.
Impact of the state Measures the types of interference considered ultimately detrimental to competitiveness.
Sociopolitical stability Assesses the national climate for business and investment in terms of political stability, reliability of judicial system, crime etc.
Source: World Economic Forum and 1MD (1990).
72
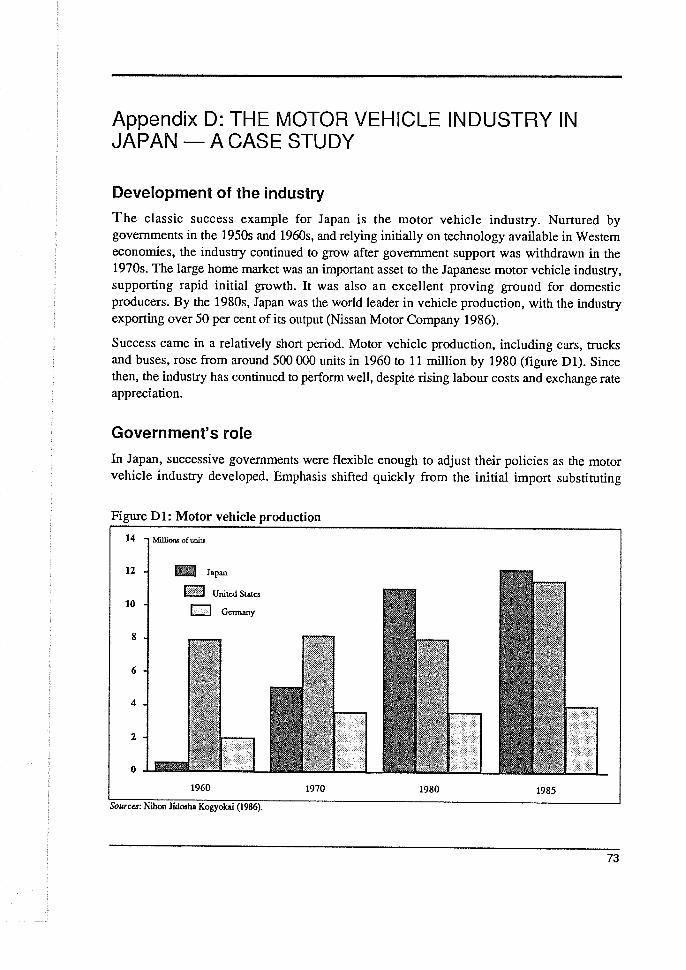
Appendix D: THE MOTOR VEHICLE INDUSTRY IN JAPAN — A CASE STUDY
Development of the industry The classic success example for Japan is the motor vehicle industry. Nurtured by governments in the 1950s and 1960s, and relying initially on technology available in Western economies, the industry continued to grow after government support was withdrawn in the 1970s. The large home market was an important asset to the Japanese motor vehicle industry, supporting rapid initial growth. It was also an excellent proving ground for domestic producers. By the 1980s, Japan was the world leader in vehicle production, with the industry exporting over 50 per cent of its output (Nissan Motor Company 1986).
Success came in a relatively short period. Motor vehicle production, including cars, trucks and buses, rose from around 500 000 units in 1960 to 11 million by 1980 (figure D1). Since then, the industry has continued to perform well, despite rising labour costs and exchange rate appreciation.
Government's role
In Japan, successive governments were flexible enough to adjust their policies as the motor vehicle industry developed. Emphasis shifted quickly from the initial import substituting
Figure Dl: Motor vehicle production
Sources: Nihon Jidosha Kogyolui (1986).
73

STRATEGIC TRADE THEORY
measures to policies facilitating exports. As the industry approached maturity, government involvement virtually ceased.
In the 1930s the Government, for military and foreign exchange reasons, passed a law that forced the market leaders — General Motors and Ford — out of Japan. At the same time it provided incentives for Toyota and Nissan to enter the industry. In 1949 Toyota had to be saved from bankruptcy by the Bank of Japan. The Bank, favouring the 'theory of comparative advantage', opposed the development of the industry. The Ministry of International Trade and Industry (Mill) favoured the development and protection of the industry on the basis of the 'infant industry' argument. The Korean War helped to resolve the issue by creating a large and rapidly growing export market for Japanese produced cars.
Assistance in the 1950s and 1960s
In the 1950s and 1960s, governments played a significant role in the motor vehicle industry through control of foreign investment, technology transfer, protection of domestic industry, and financial and export assistance (table D1). There were also various (failed) attempts by MITI to consolidate the industry into a few giant companies, to reduce competition within it.
In terms of measured assistance, tariffs and quotas were important. For passenger motor vehicles these were prohibitive in the 1950s. The effects of MITI's control over direct foreign
Table Dl: Government interventions in Japan's motor vehicle industry
Form of interventionD Description Timing
Foreign investment MITI discouraged foreign investment, while leaving the 1950s and 1960s door open for joint ventures with selected foreign producers — those with superior technology.
Technology transfer MIT1 controlled all foreign licensing agreements. 1952 to 1960 Remittance of royalties was guaranteed only if 90 per cent of the licensed parts were produced in Japan within five years.
Protection Quantitative restrictions on passenger car imports. 1950s to 1965 Tariffs of 30-40 per cent. 1950s to 1968 Tariffs reduced to 6 per cent. 1973 Zero tariff. Since 1978
Financial assistance Loans accounting for about 9 per cent of car producers' 1950s total investment; accelerated depreciation permitting up to 50 per cent depreciation in the first year; subsidies to vehicle producers of around US$1 million and subsidies to specific parts producers.
Export assistance Subsidies for the preparation of catalogues written Early 1950s in English. Export credit. 1950s and 1960s Establishment of Chicago Automotive Parts Centre 1965 as an export promotion exercise. Export related tax concessions. 1950s to 1972
Sources: Magazines and Flout (1980); Altshuler and Roos (1984); and correspondence with the Japanese Em hussy. Canberra.
74

D: THE MOTOR VEHICLE INDUSTRY IN JAPAN
investment and foreign licensing agreements are more difficult to assess. The requirement that 90 per cent of licensed parts be produced in Japan within five years from the date of granting the licence ensured that car production would not be limited to a series of assembly plants. The 90 per cent requirement, the selection of the technologies to be transferred, and the prohibition of direct foreign investment have helped the Japanese 'catch-up' rapidly with Western know-how, although the experience of other Asian and Western economies suggests this could have been also achieved in a more liberal environment.
Phasing out of assistance
The important point about Japan's motor vehicle industry is that assistance, which was high in the 1950s, was significantly reduced by the mid-1960s and eliminated by the 1970s. The flexibility, and eventual liberalisation of Japan's policies have allowed market forces to shape the motor vehicle industry. The experience of the motor vehicle industry was in line with one of the most important characteristics of government intervention in Japan and other East Asian economies in their successful growth phases: the creation of a firm impression that assistance would be temporary and that support measures would be wound back within a relatively short period.
The impression of non-accommodative protection and the existence of strong competition in the domestic market for motor vehicles are evident in the views of an executive of a Japanese automobile company when recalling the fierce marketing competition that started in the early 1960s (see Nagaoka 1989, p. 21). He said:
The domestic car makers competed fiercely for market shares among themselves. There was common recognition among the Japanese automobile producers that liberalization of direct foreign investment would follow the liberalization of imports, and such expectation contributed to the highly aggressive nature of competition.
The phasing out of government support for the motor vehicle industry occurred relatively rapidly. Financial assistance was withdrawn by the end of the 1950s. MITI's control over foreign licensing agreements for technology transfer ceased by 1960. Quantitative restrictions were phased out by 1965 and most forms of export assistance were eliminated by 1972. Tariffs were reduced to 6 per cent by 1973 and to zero by 1978 (table D1).
Limits of MITI's influence
MITI was aware of the inevitability of liberalisation. There was pressure from trading partners and, in becoming a member of the OECD in 1964, Japan had given a commitment to liberalise restrictions on foreign capital investment. There was a concern that a fragmented industry may not survive once protection had declined — a concern that was behind MIT1's attempts to consolidate the motor vehicle industry and limit competition within it.
However, while MITI's control over border protection measures, foreign investment and technology agreements may have been important in shaping the early development of the
75
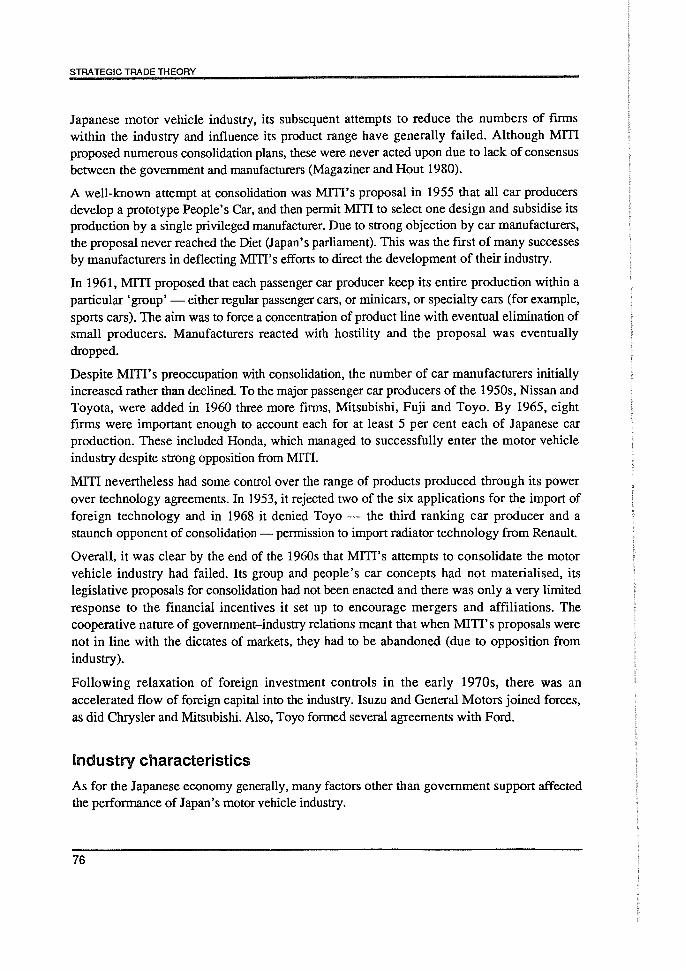
STRATEGIC TRADE THEORY
Japanese motor vehicle industry, its subsequent attempts to reduce the numbers of firms within the industry and influence its product range have generally failed. Although Mf11 proposed numerous consolidation plans, these were never acted upon due to lack of consensus between the government and manufacturers (Magaziner and Hout 1980).
A well-known attempt at consolidation was MITI's proposal in 1955 that all car producers develop a prototype People's Car, and then permit MITI to select one design and subsidise its production by a single privileged manufacturer. Due to strong objection by car manufacturers, the proposal never reached the Diet (Japan's parliament). This was the first of many successes by manufacturers in deflecting MITI's efforts to direct the development of their industry.
In 1961, MITI proposed that each passenger car producer keep its entire production within a particular 'group' — either regular passenger cars, or minicars, or specialty cars (for example, sports cars). The aim was to force a concentration of product line with eventual elimination of small producers. Manufacturers reacted with hostility and the proposal was eventually dropped.
Despite MITI's preoccupation with consolidation, the number of car manufacturers initially increased rather than declined. To the major passenger car producers of the 1950s, Nissan and Toyota, were added in 1960 three more firms, Mitsubishi, Fuji and Toyo. By 1965, eight firms were important enough to account each for at least 5 per cent each of Japanese car production. These included Honda, which managed to successfully enter the motor vehicle industry despite strong opposition from MM.
MM nevertheless had some control over the range of products produced through its power over technology agreements. In 1953, it rejected two of the six applications for the import of foreign technology and in 1968 it denied Toyo — the third ranking car producer and a staunch opponent of consolidation — permission to import radiator technology from Renault.
Overall, it was clear by the end of the 1960s that M111's attempts to consolidate the motor vehicle industry had failed. Its group and people's car concepts had not materialised, its legislative proposals for consolidation had not been enacted and there was only a very limited response to the financial incentives it set up to encourage mergers and affiliations. The cooperative nature of government–industry relations meant that when MITI's proposals were not in line with the dictates of markets, they had to be abandoned (due to opposition from industry).
Following relaxation of foreign investment controls in the early 1970s, there was an accelerated flow of foreign capital into the industry. Isuzu and General Motors joined forces, as did Chrysler and Mitsubishi. Also, Toyo formed several agreements with Ford.
Industry characteristics
As for the Japanese economy generally, many factors other than government support affected the performance of Japan's motor vehicle industry.
76

D: THE MOTOR VEHICLE INDUSTRY IN JAPAN
Importance of competition
One of the key characteristics of Japan's motor vehicle industry is that it has been, from its inception, highly competitive. In the mid-1960s, when there were eight reasonably sized domestic producers and when exports still represented less than 15 per cent of production, internal competition was crucial to the successful development of the industry.
Motor vehicle firms in Japan became rivals in improving product design and the production process; in increasing reliability through tighter tolerances and extensive preproduction testing; in designing high volume automated facilities which, when operating close to capacity, were low cost by world standards; and in making an effort to market abroad — in the United States initially — once the domestic market neared saturation (Magaziner and Hout 1980). Apart from Volkswagen, other overseas manufacturers were unwilling to parallel Japan's heavy investment in marketing their motor vehicles in the United States. And US manufacturers were not even interested in considering the production of right-hand drive vehicles for the Japanese market.
As noted earlier, MITI feared that the industry would find it hard to survive with lower assistance. However, following liberalisation in the late 1960s, output grew and exports expanded as foreign multinationals became involved. By 1976, exports accounted for almost 50 per cent of output. The pressure from foreign firms combined with the fierce rivalry in the domestic market to make the Japanese industry even more competitive.
Low wages
One of the key factors in the success of Japan's motor vehicle industry — as in other industries — was low wages relative to competitors. In 1975, wages of production workers in the motor vehicle industry were less than US$4 per hour, compared with over US$9 in the United States. Although wages of these production workers increased to close to US$8 by 1981, they were still less than half of those in the United States (table D2). In recent years relative unit labour costs in Japan increased generally due mainly to exchange rate changes (table F2, appendix F), but productivity improvements have been sufficient for the Japanese to maintain their competitiveness at high levels.
Table D2: Hourly compensation costs for production workers in the motor vehicle industry
Japan United States Germany US$/hr US$/hr US$/1u
1975 3.6 9.4 7.7 1981 7.7 17.6 12.3 Source: Altsbulcr and Roos (1984, P. MS).
77
STRATEGIC TRADE THEORY
Flexibility and resilience
Over its relatively short existence, the Japanese motor vehicle industry has shown great flexibility and resilience. Not only has it adapted quickly and successfully to an assistance-free regime since the early 1970s, but it has also rearranged its complex internal structure when that structure inhibited further development.
The initial structure of the motor vehicle producing sector in Japan was like a series of pyramids, with products flowing from the bottom to the top. At the top were the vehicle producers — Toyota, Nissan etc. — designing and assembling vehicles and manufacturing engines. Each assembler was supplied by an affiliated group of primary parts manufacturers. These firms — some 300 in number — usually sold exclusively to one assembler. The bottom layer comprised the small parts subcontractors who supplied the primary parts firms. There were several thousand small subcontractors, many of whom were affiliated through ownership or technology agreements with parts manufacturers or the assemblers themselves (Magaziner and Hout 1980). The extensive subcontracting provided great flexibility when demand fluctuations occurred — by reducing their costs, hours of work and employment, adverse shocks were more easily absorbed in the industry as a whole.
As design improvements required more advanced parts technologies, the small size of the primary parts manufacturers became a problem. Low production volumes precluded scale economies and the introduction of modem production techniques. Many of the firms were financially weak. In the early to mid-1950s, MITI arranged financial assistance to the parts industry. Between 1956 and 1966, an Auto Parts Committee — comprising parts manufacturers, car producers and MITI — oversaw the restructuring of the parts industry. Facilities were modernised and production became concentrated among fewer manufacturers. However, since numerous subcontractors still remained, the benefits of Japan's flexible system have been retained.
Between 1960 and 1965, the prices of car parts declined by an average of around 30 per cent a year. These price reductions were critical to Japan's subsequent penetration of the US market.
Because the production of a motor vehicle requires several thousand parts, the consolidation and modernisation of parts suppliers was essential to the emergence of a world competitive industry. The fact that Japanese producers were able to achieve this within the relatively short period is a testimony to their flexibility and adaptability.
Rapidly increasing labour productivity
Improvements in Japan's labour productivity through technological change, scale economies, reorganisation of the parts industry and better work practices are evident horn the available statistics (figure D2). While the total hours of employment required to produce one vehicle were over 250 in 1970, they declined to 140 a decade later. By comparison, the hours required remained relatively stable in the US at around 180 per vehicle.
78

D: THE MOTOR VEHICLE INDUSTRY IN JAPAN
Figure D2: Labour productivity and output in the motor vehicle industry
300
280
260
240
220
200
180
160
140
120
100
1970 1971 1972 1973 1974 1975 1976 1977 1978 1979 1980
United States 300 Hours per vehicle - 14Millions of units
280 -13Millions of un7
2,60 •
240
220
200 •
180 Hours ver vchicle 8 160 7
140 6
120 5
100
1970 1971 1972 1973 1974 1975 1976 1977 1978 1979 1980
Sources: Nihon Jidosha Kogyokai (1981); Akshular and Roos (1984).
Improved labour productivity in Japan was associated with rapid and persistent increases in output — from around 5 million vehicles in 1970 to 11 million in 1980. In the United States, production has varied between 8 million and 13 million units (with an average of about 11 million units from 1970 to 1980).
Several reasons have been proposed for the spectacular improvements in Japan's labour productivity. Factors often cited — apart from technological 'catch-up' including the exploitation of scale economies — include high growth in private sector research and development expenditures and harmony between management and unions.
79

STRATEGIC TRADE THEORY
Unlike trade unions in Western countries, company unions in Japan allow the level of worker benefits to be linked to company performance — with a consequent low level of strikes. Also, the nationwide Jidosha Soren (Automotive Labour Union Association) organises and oversees efficiency improving activities, such as the quality circle system.
In relation to research and development, Urata (1990) notes that aggressive research and development and export strategies were pursued mainly by smaller firms. For example, Honda's extensive research and development activities led to the successful introduction of the CVCC engine which excels in fuel efficiency and pollution control. Such innovation, coupled with active sales effort overseas and the increased popularity of fuel efficient engines, resulted in Honda increasing its share of Japanese car exports from 2 per cent to 16 per cent between 1965 and 1980.
Altshuler and Roos (1984), reporting on the Massachusetts Institute of Technology's International Automobile Program, describes how the Japanese motor vehicle producers developed a new approach to the social organisation of the factory and the production chain. The new approach contributed to the Japanese industry requiring fewer hours of labour by factory workers, designers, technicians and managers than the industry of any other nation. In addition, the Japanese industry had, in the early 1980s, one of the highest levels of manufacturing accuracy, and the lowest levels of wages and in-process inventories among the Program countries.
Producers in other countries were, by then, having to take steps to 'catch up' with the new production system developed by the Japanese. The International Motor Vehicle Program recently completed by the Massachusetts Institute of Technology, covering 80 motor vehicle plants and 24 assemblers in 16 countries, has clearly established the superiority of the Japanese in terms of the simultaneous achievement of high productivity and high quality. It found that only four plants in their entire volume-producer sample achieved world class performance — and that all four were Japanese parent plants(figure D3). The Massachusetts Institute of Technology study has also found that the performance of Japanese plants overseas (for example, in North America and Europe) is superior to those of local plants (that is, the plants with local parents).
High investment and its effect on productivity Within Japan's motor vehicle industry investment levels were high, with gross fixed capital formation as a share of value added ranging from 14 to 20 per cent over the period 1963 to 1986. This was higher than in Australia and the United States (10-14 per cent and 6-12 per cent respectively). In all three countries, investment in relation to output in the motor vehicle indusiry was in most periods higher than in manufacturing generally (table D3). Sustained high levels of investment have resulted in Japanese operations becoming considerably more capital intensive than elsewhere. For example, while in 1965 fixed assets per employee were similar in the US Chrysler and the Japanese Toyota companies (around US$30 000 in 1983
80

D: THE MOTOR VEHICLE INDUSTRY IN JAPAN
Figure D3: Productivity and quality at assembly plant level, 1989 Productivity
(houra per vehicle) High quality 50
45
ao -
35 —
A A
World class
20 — .61
15 — span
[ 10
20 40 60 80
Source: Massachuseus Institute of Technology (1989).
Table D3: Investment as a share of output
Motor vehicle? Manufacturing
Japan 1963-73 20 17 1973-79 14 11 1979-86 16 10 United States 1963-73 6 7 1973-79 9 8 1979-86 12 8 Australia 1963-73 14 13 1973-79 10 9 1979-86 11 10 8 151C 3843, including three-wheeled vehicles and motorcycles. Note: Investment was measured an gross fixed capital formation and output as value added, both in current prices. Source: United Nations (1988 and previous years).
Low quality
Australia a [a]
0
CI
A
A A
United States [A] A
100 120 140 160
Quality (assembly defects per 100 vehiclea)
prices), by 1983 they had doubled for Chrysler and increased by a factor of five for Toyota (US$62 000 and US$151 000 respectively — see figure D4). These developments were typical of US and Japanese firms. Fixed assets per employee for General Motors and Ford were similar to those of Chrysler throughout the period, and the figures for Nissan were similar to those for Toyota (Cusumano 1985, p. 401).
With such high levels of investment, capital to labour substitution must have been a major contributor to the exceptionally high labour productivity growth rates achieved by Japan's motor vehicle industry.
81

STRATEGIC TRADE THEORY
Figure D4: Fixed assets per employee, Chrysler and Toyota At 1983 prices
Improvements in labour productivity can be achieved through total factor productivity gains or the use of more capital relative to labour (box D1). Total factor productivity is a broad measure which encompasses technical progress, reallocative effects, scale economies and social and institutional changes. Technical progress often constitutes the major single component of total factor productivity but scale and real locative effects can also be important.
Japan's labour productivity growth has been superior to Australia's by a wide margin for the past 30 years or more. For the business sector as a whole this has been achieved through both total factor productivity gains and persistent increases in capital intensity.
In the rapid growth period from 1960 to 1973 large gains were derived mainly from total factor productivity growth. In this period Japan grew rapidly through the process of 'technological catch-up' adopting the technology and production methods of more advanced economies, especially the United States. There is great potential to grow rapidly when a country starts from a low base and can exploit a large pool of technological opportunities.
As this pool of opportunities was quickly exploited the gains from total factor productivity declined substantially. After 1973 the relative contribution of capital—labour substitution became a more important source of labour productivity gains for the business sector in Japan. However there are limits of the extent to which continued capital—labour substitution can contribute to a strong overall performance for Japanese business because of the effect on capital productivity.
Capital productivity in the business sector in Japan has declined on average by over 2 per cent a year over the period 1960 to 1988 (OECD 1990a, p. 126). This compares with a decline of 0.8 for Australia over the same period. The pressure to earn a rate of return that is not
82

D: THE MOTOR VEHICLE INDUSTRY IN JAPAN
Box DI: Sources of labour productivity
Labour productivity growth, — can be expressed as the sum of total factor productivity growth and capital—labour substitution
— 11-P + 0(k —1.-) ( 1 )
where
is the growth in real value added.
is the growth in labour inputs (measured as employees).
is the growth in total factor productivity. `171) is a broad indicator of technical progress, scale and reallocative effects.
is the share of capital in value added.
is thc growth in capital inputs (measured as net capital stock at constant prices
136( f.) is the contribution from capital—labour substitution.
Labour productivity and its components: Japan and Australia, total business sector Average annual percentage change
Capital—labour Labour productivityDTotal factor productivityDsubstitution
Japan Australia Japan Australia Japan Australia 1960-73 8.6 2.7 6.0 1.7 2.6 1.0 1973-79 3.0 2.2 1.5 0.8 1.5 1.4 1979-88 3.2 1.1 2.0 0.5 1.2 0.6 Source: OECD (1990a, p.
persistently out of line with real, risk-adjusted international averages places a limit on declines in capital productivity. 6
Because capital intensity in the motor vehicle industry is so high (table D3 and figure D4) it is likely that the broad story for productivity, evident in the data for the business sector as a whole in Japan, is also true for the motor vehicle industry. Combining all the evidence the implications are as follows:
• In the high growth phase rapid productivity growth was achieved by technological catch-up which encompassed technology transfer and scale effects.
6 It should be noted that total factor productivity is a weighted average of labour and capital productivity, and although capital/labour substitution increases labour productivity it diminishes capital productivity. Generally, however, total factor productivity continues to grow because of the contribution from technical progress.
83

STRATEGIC TRADE THEORY
Most of these opportunities have now been exhausted. The Japanese motor vehicle industry is the world leader in production — competitors are now trying to 'catch-up" and adopt the methods of the Japanese.
The sheer size of the Japanese industry and its capital intensity suggest that the large and rapid gains that have occurred through scale economies and capital–labour substitution will not persist. Future gains will be more dependent on technological improvements emanating from the leaders, amongst which Japan is foremost. Since it is more difficult to innovate than to imitate, the growth of the Japanese motor vehicle industry is likely to be slower in the future.
Taking account of the persistent declines in capital productivity and the growth of wages in Japan and the international mobility of capital, it was natural for the Japanese to be seeking foreign investment opportunities. These trends have been encouraged in the past decade by Japan's 'voluntary' motor vehicle export restraints (for example, to the United States and Canada). Direct Japanese investment in motor vehicle production facilities — mainly in the United States, United Kingdom and Europe — has been growing rapidly.
All the evidence points to a slowing but still above-average growth performance for Japanese manufacturing, including motor vehicle production. The tradition of hard work, investment effort and competitive pressure will help the Japanese to maintain a strong position. But it is unlikely that their domestic production performance will be as impressive as in the past.
Concluding remarks
For the motor vehicle industry, it was the focus on investment, product development and quality that ensured industry's progress beyond the 'cheap imitation' stage. MM, through its import-replacement policies had some influence over the development of the industry during the 1950s and 1960s. However, MITI's many attempts to consolidate the industry, and to restructure and limit competition within it, invariably failed. Competition is now seen as a crucially important reason for the success of Japan's motor vehicle industry, and it could be said that the industry — or at least the smaller firms within it — succeeded in spite of MI i 1. The phasing out of government intervention was important, in that it allowed foreign competition to invigorate further Japan's already competitive motor vehicle industry.
Overall it is most likely that the major factors in the success of the motor vehicle industry were a continued highly competitive environment, high levels of investment and the flexibility and resilience of the industry in adapting to changing circumstances.
Declining capital productivity and increasing wage costs suggest that the Japanese will not exert the same pressures as in the past although they might still be substantial. The Japanese model is now being exported through Japanese investment in foreign production facilities. Although other competitors may be emerging, the direct competitive pressure from Japanese imports in Western economies may ease over the next decade.
54
Appendix E: JAPAN'S MITI AND MINISTRY OF FINANCE
The key bureaucracies influencing industry policy in Japan were the Ministry of International Trade and Industry (MITI) and the Ministry of Finance. Although MITI's policy initiatives have generally received greater attention, the influence of the Ministry of Finance — through its control over funds — has also been significant.
Tradition of an elite bureaucracy In Japan, there is a strong tradition of bureaucrats overseeing industry development. In the 19th century, an elite central bureaucracy had responsibility for developing and implementing Japan's industry policies (Magaziner and Hout 1980, p. 30). Later, between the 1930s and the 1940s, the shift in industry structure away from textiles and toward metals, machines and chemicals was in line with the plans set out by the Ministry of Industry and Commerce (Johnson 1982, p. 154). Over time an intricate pattern of interaction has developed among bureaucrats, businesses and banks. This interaction in developing Japanese industrial policy is often referred to as 'informal consensus building'.
MITI
MITI was formed in 1949 through the merger of the Ministry of Industry and Commerce and the Board of Trade. It has almost all major industries under its jurisdiction. It has been responsible not only for developing emerging industries, but also for facilitating the decline of ailing sectors.
Although MITI has been able to consider a very wide range of policy instruments — tax, antitrust, price and capacity controls, export and import measures, special lending, raw materials, price setting, dislocation subsidy and regional policy — it is not autonomous in policy setting. Neither is MILE able to finance its own programs. The Diet (Japan's Parliament), Fair Trade Commission (similar to Australia's Trade Practices Commission), the Bank of Japan and the Ministry of Finance all have an influence on policy outcomes. Firms within industries, and the banks which finance their investments, also have a say through the informal consensus building process.
MITT has been influential because it coordinates the process of consultation and consensus formation.
85

STRATEGIC TRADE THEORY
Ministry of Finance The Ministry of Finance has played an important role in industry development through its control over Japan's few large banks. Unlike in most other industrialised countries, where direct equity financing of corporate assets is important, in Japan the external financing of assets traditionally occurred through bank loans.
Since the banks, as well as household savings were closely regulated by the Ministry of Finance, the Ministry was able to influence industry development through both the channelling of savings and the sectoral allocation of loans. In this context it is often argued that Japanese industrial policy has been a substitute for — and not an unfair complement to — the market allocation of capital (Saxonhouse 1983a, pp. 259, 270).
Instruments during the rapid growth phase
After the war the government provided assistance to selected industries in an effort to bring about rapid economic growth. MITI played an important role in the selection process. Between 1953 and 1955, 83 per cent of the Japan Development Bank's contributions went to industries designated by MITI as being of strategic importance (Johnson 1982, pp. 211-20). Among the industries targeted in the 1950s were electric power, ships, steel, coal, synthetic fibres, synthetic rubber, plastics, motor vehicles and computers.
In the 1950s MITI:
• denied access to foreign exchange to any firm it saw as wasting valuable resources;
• suppressed imports of finished goods which competed with locally made products;
• sought modern technology — but (where possible) without foreign ownership, patent rights or foreign managers;
• channelled low-cost capital to growing and innovative large firms; and
• arranged, with the Ministry of Construction, for the building of infrastructure at public expense (ports, highways, railways, electric power grids and industrial parks) (Johnson 1982, pp. 217-18; Yamamura 1987).
The 'liberalisation' phase
By the early 1960s, MITI was aware of the inevitability of liberalisation. Success in export markets generated pressure from trading partners to eliminate tariffs and quotas. Also, when becoming a member of the OECD in 1964, Japan had given a commitment to liberalise restrictions on foreign capital investment.
MM has been generally quick to adapt to the significant economic and social changes that occurred over its forty year existence. After the initial phase when postwar reconstruction and
86

E: JAPANS MM AND MINISTRY OF FINANCE
the absence of a capital market facilitated strong guidance and coordination, MITI was instrumental in exposing Japanese firms, already subject to strong competitive pressure domestically, to export markets.
As the social consensus toward economic growth faded and the costs of rapid industrialisation were no longer generally accepted, MITI responded by shifting its attention away from industrialisation and toward measures to improve the quality of life. Mill's vision for the 1970s focused on knowledge-intensive industries. However, for the 1990s its vision is also improved housing, a better social security system, increased leisure opportunities, encouraging an individual rather than a company-oriented society, and providing a generally more pleasant living environment (chapter 5).
Conclusions Overall MITI and the Ministry of Finance are now seen to have played an important coordinating role — MITI by facilitating the process of consultation and consensus formation and the Ministry of Finance by filling the role normally played by capital markets. As the Japanese industrial base became more complex, assistance was lowered, Western-style capital markets developed, and the influence of these two Ministries gradually declined.
87

Appendix F: ECONOMIC INDICATORS: AUSTRALIA, JAPAN, KOREA, TAIWAN, HONG KONG, SINGAPORE
Table Fl: Economic indicators: Australia
Change in real GNP
per person Change in real GNP
Relative unit labour cost a
Change in exchange rate
relative to US$ Change in
GDP deflator Current account
balance I GNP
% % 1987 = 100 % % %
1964 4.0 6.1 146 0.0 3.6 -2.1 1965 3.9 6.0 150 0.0 2.1 -4.7 1966 0.9 3.2 120 0.0 3.3 -2.8 1967 5.0 6.4 120 0.0 2.7 -3.3 1968 4.3 6.2 124 0.0 3.5 -4.4 1969 4.6 6.9 121 0.0 4.3 -2.6 1970 3.7 5.7 114 0.0 4.1 -2.1 1971 1.6 5.1 118 0.0 6.7 -2.0 1972 1.0 2.9 119 --4.1 8.4 1.0 1973 5.1 6.8 135 -8.8 12.0 0.7 1974 -0.7 1.8 143 -2.6 16.7 -3.3 1975 0.1 1.3 142 -3.6 17.3 -1.2 1976 2.5 3.5 148 11.4 13.8 -2.0 1977 -0.2 1.0 131 10.3 9.0 -3.1 1978 2.3 3.5 121 -3.0 7.3 -4.1 1979 2.6 3.7 113 2.5 9.6 -2.1 1980 1.3 2.5 115 -2.0 11.3 -3.0 1981 1.3 3.0 132 -0.9 9.6 -5.1 1982 -2.1 -0.4 140 13.5 11.0 -4.8 1983 -1.4 -0.1 139 12.5 8.2 -3.7 1984 5.4 6.6 147 2.9 6.4 -4.8 1985 3.4 4.8 117 25.5 6.2 -52 1986 0.7 2.1 101 4.5 7.2 -5.8 1987 2.3 4.1 100 -4.5 73 -4.9 1988 1.6 3.2 112 -10.4 9.0 -4.8 1989 3.3 4.9 124 -1.2 7.8 -5.6 1990 (forecast) na na 121 5.3 5.8 na 1991 (forecast) na na 125 0.6 6.1 na
Relative to major competitors in USS. na Not available. Sources: World Bank (1988 and previous years) OECD (1990a and data provided on request).
88

F: ECONOMIC INDICATORS
Table F2: Economic indicators: Japan Change in Change in real GNP Change in Relative unit exchange rate Change in Current account
per person real GNP labour cost' relative to US$ GDP deflator balance l GNP
% % 1987 = 100 9'0 % %
1964 10.4 11.6 61 0.0 5.3 -0.6 1965 4.7 5.9 65 0.0 5.1 1.0 1966 9.7 10.7 64 0.0 5.0 1.2 1967 10.1 11.1 60 0.0 5.5 -0.1 1968 12.5 12.8 62 0.0 4.9 0.7 1969 10.2 12.5 61 0.0 4.4 1.2 1970 9.5 10.8 59 0.0 6.5 1.0 1971 3.0 4.4 63 -3.0 5.5 2.5 1972 7.0 8.5 72 -13.2 5.7 2.2 1973 7.0 7.9 82 -10.4 12.9 0.0 1974 -3.3 -1.4 83 10.1 20.8 -1.0 1975 1.0 2.7 84 -0.8 7.7 -0.1 1976 4.0 4.8 82 -0.1 7.2 0.7 1977 4.3 5.3 88 -9.5 5.8 1.6 1978 4.2 5.2 100 -21.6 4.8 1.7 1979 4.4 5.3 87 4.1 3.0 -0.9 1980 3.5 4.3 75 3.5 3.8 -1.0 1981 2.9 3.7 80 -2.7 3.2 0.4 1982 2.4 3.1 68 12.9 1.9 0.6 1983 2.5 3.2 73 -4.6 0.8 1.8 1984 4.4 5.1 73 0.0 1.2 2.8 1985 4.3 4.9 72 0.4 1.4 3.7 1986 1.9 2.5 98 -29.4 1.8 4.4 1987 4.0 4.5 100 -14.2 -0.2 3.6 1988 5.4 5.7 103 -11.4 0.4 2.8 1989 4.6 4.9 93 7.7 1.5 2.0 1990 (forecast) na na 79 13.0 2.7 na 1991 (forecast) na na 77 1.7 2.6 na
a Relative unit labour cost and relative manufacturing export values are relative to major competitors in US$. na Not available. Sources: World Bank (1988 and previous years); OECD (1990a and data provided on request).
89
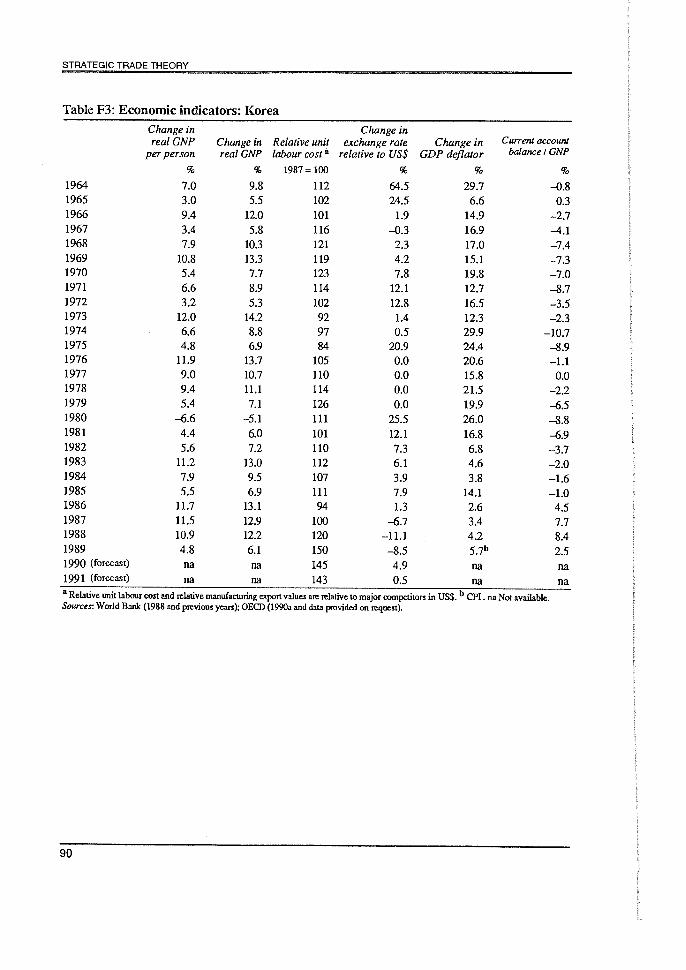
STRATEGIC TRADE THEORY
Table F3: Economic indicators: Korea
Change in real GNP
per person Change in real GNP
Relative unit labour costa
Change in exchange rate
relative to US$ Change in
GDP deflator Current account
balcuice I GNP
% % 1987 = 100 %
1964 7.0 9.8 112 64.5 29.7 -0.8 1965 3.0 5.5 102 24.5 6.6 0.3 1966 9.4 12.0 101 1.9 14.9 -2.7 1967 3.4 5.8 116 -0.3 16.9 -4.1 1968 7.9 10.3 121 2.3 17.0 -7.4 1969 10.8 13.3 119 4.2 15.1 -7.3 1970 5.4 7.7 123 7.8 19.8 -7.0 1971 6.6 8.9 114 12.1 12.7 -8.7 1972 3.2 5.3 102 12.8 16.5 -3.5 1973 12.0 14.2 92 1.4 12.3 -2.3 1974 6.6 8.8 97 0.5 29.9 -10.7 1975 4.8 6.9 84 20.9 24.4 -8.9 1976 11.9 13.7 105 0.0 20.6 -1.1 1977 9.0 10.7 110 0.0 15.8 0.0 1978 9.4 11.1 114 0.0 21.5 -2.2 1979 5.4 7.1 126 0.0 19.9 -6.5 1980 -6.6 -5.1 111 25.5 26.0 -8.8 1981 4.4 6.0 101 12.1 16.8 -6.9 1982 5.6 7.2 110 7.3 6.8 -3.7 1983 11.2 13.0 112 6.1 4.6 -2.0 1984 7.9 9.5 107 3.9 3.8 -1.6 1985 5.5 6.9 111 7.9 14.1 -1.0 1986 11.7 13.1 94 1.3 2.6 4.5 1987 11.5 12.9 100 -6.7 3.4 7.7 1988 10.9 12.2 120 -11.1 4.2 8.4 1989 4.8 6.1 150 -8.5 5•13 2.5 1990 (forecast) na na 145 4.9 na na 1991 (forecast) na na 143 0.5 na na ' Relative unit labour cost and relative manufacturing export values are relative to major compositors in US$• b CPI. na Not available. Sources: World Bank (1988 and previous years); OECD (1990a and data provided on request).
90

F: ECONOMIC INDICATORS
Table F4: Economic indicators: Taiwan
Change in real GNP
per person Change in real GNP
Relative unit labour cost 8
Change in exchange rate
relative to US$ Change in
GDP deflator Current account
balance I GNP
% % 1987 = 100 % % %
1964 9.0 12.4 63 0.0 3.3 1.6
1965 8.0 11.2 62 0.0 0.0 -2.0 1966 6.1 9.2 62 0.0 3.2 1.0 1967 8.2 10.7 62 0.0 3.1 -1.6 1968 6.3 9.1 66 0.0 9.1 -2.8 1969 3.9 9.1 67 0.0 5.6 -0.7 1970 9.0 11.6 64 0.0 2.6 0.0 1971 10.9 13.3 62 0.0 2.6 2.6 1972 11.4 13.6 59 0.0 5.0 6.5 1973 11.0 13.0 63 -5.0 16.7 5.3 1974 -0.4 1.4 79 0.0 30.6 -7.8 1975 1.9 3.8 74 0.0 3.1 -3.9 1976 11.4 13.8 74 0.0 4.6 1.6 1977 8.1 10.1 78 0.0 7.3 4.2 1978 12.0 14.2 68 -2.4 5.4 6.2 1979 6.4 8.5 77 -3.0 10.3 0.6 1980 5.3 7.2 85 0.0 16.3 -2.2 1981 3.8 5.8 91 2.8 12.0 1.1 1982 1.2 3.0 92 5.4 3.6 4.7 1983 6.4 7.9 87 2.8 1.7 8.6 1984 8.9 10.5 103 -1.2 0.9 12.3 1985 3.5 4.9 98 0.5 0.8 15.3 1986 9.8 10.9 90 -5.0 3.3 22.5 1987 13.7 14.9 100 -15.6 0.0 18.1 1988 6.1 7.3 113 -10.3 0.8 8.5 1989 6.2 7.4 130 -8.0 4.4b 7.7 1990 (forecast) na na 132 0.0 na na 1991 (forecast) na na 131 0.4 na na a Relative unit labour cost and relative manufacturing export values are relative to major competitors in US$. b CPI. na Not available. Sources: World Bank (1988 and previous years); OECD (1990a and data provided on request).
91

STRATEGIC TRADE THEORY
Table F5: Economic indicators: Hong Kong Change in Change in real GDP Change in Relative unit exchange rate Change in Current account
per person real GDP labour cost a relative to US$ GDP deflator balance I GNP % % 1987 = 100 % % %
1964 6.0 9.4 113 0.0 2.7 na 1965 12.2 15.1 113 0.0 -0.1 na 1966 1.2 3.4 113 0.0 -0.7 na 1967 -0.4 1.3 117 0.6 5.9 na 1968 1.8 3.1 114 5.5 3.1 na 1969 11.0 12.1 113 0.0 5.0 na 1970 9.2 9.7 112 0.0 8.8 na 1971 5.7 7.5 109 -1.4 7.3 2.4 1972 8.5 10.6 115 -5.6 8.7 6.6 1973 11.1 13.4 134 -8.8 14.2 5.1 1974 0.9 3.1 138 -2.2 11.6 3.7 1975 -2.5 -0.3 142 -1.9 4.0 6.0 1976 14.9 17.1 162 -0.6 9.1 10.2 1977 10.8 12.5 153 -5.0 3.2 5.7 1978 7.2 9.2 156 0.5 7.6 -0.4 1979 3.7 12.3 147 6.8 18.1 0.9 1980 9.7 11.0 147 -0.5 15.5 -4.6 1981 6.9 8.7 138 12.3 10.0 -5.5 1982 2.5 4.2 138 8.6 9.6 -3.5 1983 4.3 6.0 120 19.7 4.6 -1.9 1984 7.6 9.4 120 7.6 9.5 4.4 1985 -6.5 -5.1 138 -0.3 5.1 5.6 1986 10.3 11.9 111 0.2 2.9 4.0 1987 12.3 13.9 100 -0.1 7.6 2.6 1988 6.0 7.2 103 0.1 7.6 5.6 1989 1.4 2.5 109 -0.1 10.1b 8.3 1990 (forecast) na na 107 0.0 na na 1991 (forecast) na na 106 -0.1 na na
14 Relative unit labour cost and relative manufacturing export values are relative to major competitors in US$. b CPL na Not available. Sources: World Bank (1988 and previous years); OECD (1990a and data provided on request).
92

F: ECONOMIC INDICATORS
Table F6: Economic indicators: Singapore
Change in Change in real GNP Change in Relative unit exchange rate Change in Current account
per person real GNP labour cost' relative to US$ GDP deflator balance I GNP
% % 1987 = 100 % % %
1964 -6.1 -3.7 74 0.0 1.8 -6.0 1965 4.1 6.7 71 0.0 2.2 -5.9 1966 8.2 10.9 71 0.0 1.6 0.1 1967 10.8 13.3 72 0.0 -0.1 -5.5 1968 10.4 12.3 76 0.0 0.8 -9.2 1969 11.2 12.9 92 0.0 2.7 -11.5 1970 10.8 12.5 89 0.0 2.0 -29.9 1971 9.2 11.2 87 -0.3 4.8 -32.3 1972 11.1 13.2 91 -7.8 5.8 -17.0 1973 7.0 9.0 102 -12.6 12.5 -12.7 1974 4.3 6.1 108 -0.8 15.2 -20.3 1975 6.4 8.1 108 -2.7 2.5 -10.2 1976 4.2 5.5 101 4.2 1.7 -9.6 1977 5.6 7.1 97 -1.3 1.6 -4.5 1978 8.4 9.7 94 -6.8 2.4 -5.8 1979 7.7 9.1 96 -4.4 5.3 -7.8 1980 4.8 6.2 98 -1.5 11.5 -13.8 1981 7.9 9.2 104 -1.3 6.7 -11.0 1982 6.8 8.1 126 1.3 4.2 -8.7 1983 9.5 10.8 143 -1.3 4.0 -3.5 1984 9.8 11.0 150 0.9 0.7 -2.0 1985 -1.0 0.1 157 3.1 -1.3 0.0 1986 0.8 1.9 108 -1.0 -3.6 3.0 1987 7.9 9.0 100 -3.3 1.1 2.7 1988 9.7 10.8 103 -4.4 3.0 6.7 1989 8.1 9.2 114 -3.1 2.4" 5.6 1990 (forecast) na na 132 -3.9 na na 1991 (forecast) na na 142 0.0 na na 'Relative unit labour cost and relative manufacturing export values are relative to major competitors in LISS. b CPI. na Not available, Sources: World Bank (1988 and previous years); OECD (1990a and data provided on request).
93

REFERENCES
Abramovitz, M. 1989, 'Notes on postwar productivity growth: the play of potential and realization', Seminar on the Contributions of Science and Technology, Organisation for Economic Co-operation and Development (OECD), Paris, June.
1990, 'The catch-up factor in postwar economic growth', Economic Inquiry, January, pp. 1-18.
Adelman, I. and Robinson, S. 1978, Income Distribution Policy in Developing Countries — A Case Study of Korea, OxfordUniversity Press.
Akamatsu, K. 1961, 'A theory of unbalanced growth in the world economy', Weltwirtschafliclzes Archiv, vol. 86, no. 2.
Allen, G.C. 1978, How Japan Competes, Institute of Economic Affairs, London.
Altshuler, A. and Roos, D. 1984, The Future of the Automobile: the Report of Massachusetts Institute of Technology's International Automobile Program, Allen and Unwin, London.
Australian Institute of Business Centre 1990, Australia's Competitiveness: National and International Perspectives, University of Queensland, Brisbane.
Aviation Week and Space Technology 1989, 'Commission approves subsidies for Airbus', 13 March.
Balassa, B. 1986, 'Japan's trade policies', Weltwirtschaftliches Archly, vol. 122, no. 4, pp. 745-90.
and Associates 1982, Development Strategies in Semi industrial Economies, Johns-
Hopkins University Press for the World Bank, Baltimore.
Baldwin, R.E. and Krugman, P.R. 1988, 'Industrial policy and international competition in wide-bodied aircraft', in Baldwin, R.E. (ed.) Trade Policy Issues and Empirical Analysis, National Bureau of Economic Research, University of Chicago Press.
Bergsten, C. and Cline, W. 1987, The United States Japan Economic Problem, Institute for–
International Economics, Washington, DC.
Bhagwati, J.N. 1987, 'Protectionism: old wine in new bottles', in Salvatore, D. (ed.), The New Protectionist Threat to World Welfare, North Holland, New York.
Bhattacharya, A. and Linn, J.F. 1988, Trade and Industrial Policies in the Developing Countries of East Asia, World Bank Discussion Papers, No. 27, Washington, DC.
Bronfenbrenner M. and Yasuba, Y. 1987, 'Economic welfare', in Yamamura, K. and Yasuba Y. (eds), The Political Economy of Japan, vol. 1, Stanford University Press.
94

REFERENCES
Buffie, E.F. 1984, 'Financial repression, the new structuralists and stabilization policy in semi-industrialized economies', Journal of Development Economics, vol. 14, no. 3, pp. 305-22.
Caves, R.E. and Krause, L.B. 1984, The Australian Economy: A View from the North, Allen and Unwin, Sydney.
Chen, E.K.Y. 1979, Hyper Growth in Asian Economies, Macmillan, London.
1989, 'Hong Kong's Role in Asian and Pacific Economic Development', Asian Development Review, vol. 7, no. 2.
Cusumano, M. 1985, The Japanese Automobile Industry, Harvard University Press, Cambridge, Massachusetts.
de Franco, S., Eguren, A. and Baughman, D. 1988, Korea's Experience with the Development of Trade and Industry, Economic Development Institute, World Bank, Washington, DC.
Dean, A., Durand, M., Fallon, J. and Hoeller, P. 1990, 'Saving trends and behaviour in OECD countries', OECD Economic Studies, Paris, no. 14, pp. 7-58.
Deardorff, A. and Stern, R. 1983, The effects of domestic tax/subsidies and import tariffs on the structures of protection in the United States, United Kingdom and Japan', in Black, J. and Winters, L.A. (eds), Policy and Performance in International Trade, Macmillan, London.
Denison, E.F. and Chung, W.K. 1976, 'Economic growth and its sources', in Patrick H. and Rosovsky, H. (eds), Asia's New Giant, Brookings Institution, Washington, DC.
Deyo, F. 1981, Dependent Development and Industrial Orders — An Asian Case Study, Praeger, New York.
Dornbusch, R. and Park, Y.C. 1987, 'Korean growth policy', Brookings Papers on Economic Activity, vol. 2, pp. 389-444.
Dowrick, S. and Nguyen, D. 1989, 'OECD comparative economic growth 1950-85: catch-up and convergence', American Economic Review, vol. 79, no. 5, pp. 1010-30.
Eads, G.C. and Yamamura, K. 1987, 'The future of industrial policy', in Yamamura, K. and Yasuba, Y. (eds), Political Economy of Japan, vol. 1, Stanford University Press.
EMF Foundation 1985, Report on International Competitiveness, Switzerland.
1986, World Competitiveness Report, Switzerland.
Englander, A.S. and Mittelstadt, A. 1988, 'Total factor productivity and structural aspects of the slowdown', OECD Economic Studies, Paris, no. 10.
Enos, J.L. 1989, 'Transfer of technology', Asian–Pacific Economic Literature, vol. 3, no. 1, pp. 3-37.
95

REFERENCES
Far Eastern Economic Review 1990, 'Taiwan carmalcers face glut despite boom', 21 June, pp. 76-8.
Fields, G. 1984, 'Employment, income distribution and economic growth in seven small open economies', Economic Journal, vol. 94, pp. 74-83.
Frobel, F., Heinrichs, J. and ICreye, 0. 1981, The New International Division of Labour, Cambridge University Press.
Galenson, W. 1979, Economic Growth and Structural Change in Taiwan, Cornell University Press, Ithaca.
and Odaka, K. 1976, 'The Japanese labor market', in Patrick, H. and Rosovsky, H. (eds), Asia's New Giant, Brookings Institution, Washington, DC.
Garnaut, R. 1989, Australia and the Northeast Asian Ascendancy, Report to the Prime Minister and the Minister for Foreign Affairs and Trade, AGPS, Canberra.
1990, The market and the state in economic development: some questions from East Asia and Australia, Sham Memorial Lecture.
Gastil, R. 1973, 'The new criteria of freedom', Freedom at Issue, vol. 17, pp. 3-23.
1984, 'The comparative survey of freedom 1984', Freedom at Issue, vol. 76, pp. 3-15.
GAIT (General Agreement on Tariffs and Trade) 1990, Newsletter, Geneva, April.
Grossman, G.M. 1990, 'Promoting new industrial activities: a survey of recent arguments and evidence', OECD Economic Studies, Paris, no. 14, pp. 87-126.
Gunasekera, D. and Tyers, R. 1988, Imperfect competition and returns to scale in a newly industrialising economy: a general equilibrium analysis of Korean trade policy, Paper presented at the Australian Economics Congress, Australian National University, Canberra.
Haggard, S. 1986, 'The newly industrializing countries in the international system', World Politics, vol. 38, no. 2, pp. 343-70.
1988, 'The politics of industrialization in the Republic of Korea and Taiwan', in Hughes, H. (ed.), Achieving Industrialization in East Asia, Cambridge University Press, pp. 260-82.
and Moon, C. 1983, 'The South Korean state in the international economy', in Ruggie, J.G. (ed.), The Antinomies of Interdependence: National Welfare and the International Division of Labor, Columbia University Press, New York.
Haley, J.0. 1986, 'Administrative guidance vs. formal regulation: resolving the paradox of industrial policy', in Saxonhouse, G. and Yamamura, K. (eds), Law and Trade Issues of the Japanese Economy: American and Japanese Perspectives,University of Washington Press.
96

REFERENCES
Hassan, R. 1976, 'Symptoms and syndrome of the development process', in Hassan, R. (ed.), Singapore: Society in Transition, Oxford University Press, Kuala Lumpur.
Hayashi, F. 1986, 'Why is Japan's saving rate so apparently high?', in Fischer, S. (ed.), NBER Macroeconomics Annual 1986, MIT Press, Cambridge, Massachusetts.
Hirono, R. 1988, 'Japan: model for East Asian industrialization?', in Hughes, H. (ed.), Achieving Industrialization in East Asia, Cambridge University Press, pp. 241-59.
Hong, W. 1979, Trade Distortions and Employment Growth in Korea, Korea Development Institute, Seoul.
Hudson Institute 1982, Japanese Industrial Development in the 1980s: Implications for US Trade and Investment, Report for US Department of State, Washington, DC, October.
Industry Commission 1990, Annual Report 1989-90, AGPS, Canberra (chapter 4 and appendix 4).
International Monetary Fund (IMF) 1989, International Financial Statistics,Washington, DC (and previous years).
Jacobs, J. 1986, Cities and the Wealth of Nations, Viking, London.
Jacoby, N.H. 1966, US Aid to Taiwan: A Study of Foreign Aid, Self-help and Development, New York.
Johnson, C. 1982, MITI and the Japanese Miracle: The Growth of Industrial Policy, 1925— 1975 , Stanford University Press.
Jones, L. and Salcong, I. 1980, Government, Business and Entrepreneurship in Economic Development: The Korean Case, Harvard University Press, Cambridge.
Kasper, W. 1989, Accelerated Industrial Evolution in East Asia: Some Lessons, Economics and Management Discussion Paper No. 1, University of New South Wales, Sydney, July.
1991, 'Competition and economic growth: the lessons of East Asia', in Conference Papers, Egon Sohmen Foundation, 31 August — 2 September 1990, Springer Publishers, New York (forthcoming).
Kawasaki, K. 1990, The Saving Behaviour of Japanese Households, OECD Working Paper No. 73, Paris.
Keesing, D.B. 1988, The Four Successful Exceptions: Official Export Promotion and Support for the Export Marketing in Hong Kong, Singapore, the Republic of Korea and Taiwan, China, Trade Policy Division, World Bank, Washington, DC, September.
Kikuchi, M. 1983, Japanese Electronics: A Worm's Eye View of its Evolution, Simul Press, Tokyo.
97
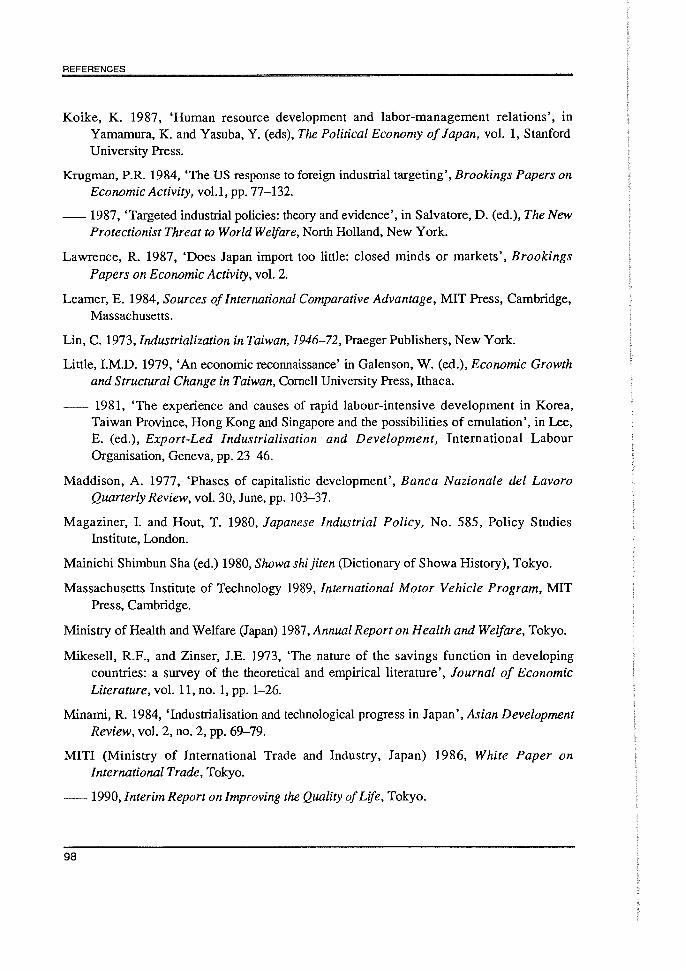
REFERENCES
Koike, K. 1987, 'Human resource development and labor-management relations', in Yamamura, K. and Yasuba, Y. (eds), The Political Economy of Japan, vol. 1, Stanford University Press.
Krugman, P.R. 1984, 'The US response to foreign industrial targeting', Brookings Papers on Economic Activity, vol.1, pp. 77 132.-
1987, 'Targeted industrial policies: theory and evidence', in Salvatore, D. (ed.), The New Protectionist Threat to World Welfare, North Holland, New York.
Lawrence, R. 1987, 'Does Japan import too little: closed minds or markets', Brookings Papers on Economic Activity, vol. 2.
Learner, E. 1984, Sources of International Comparative Advantage, MIT Press, Cambridge, Massachusetts.
Lin, C. 1973, Industrialization in Taiwan, 1946 72, Praeger Publishers, New York.-
Little, I.M.D. 1979, 'An economic reconnaissance' in Galenson, W. (ed.), Economic Growth and Structural Change in Taiwan, Cornell University Press, Ithaca.
1981, 'The experience and causes of rapid labour-intensive development in Korea, Taiwan Province, Hong Kong and Singapore and the possibilities of emulation', in Lee, E. (ed.), Export-Led Industrialisation and Development, International Labour Organisation, Geneva, pp. 23-46.
Maddison, A. 1977, 'Phases of capitalistic development', Banca Nazionale del Lavoro Quarterly Review, vol. 30, June, pp. 103-37.
Magaziner, I. and Hout, T. 1980, Japanese Industrial Policy, No. 585, Policy Studies Institute, London.
Mainichi Shimbun Sha (ed.) 1980, Showa shi jiten (Dictionary of Showa History), Tokyo.
Massachusetts Institute of Technology 1989, International Motor Vehicle Program, MIT Press, Cambridge.
Ministry of Health and Welfare (Japan) 1987, Annual Report on Health and Welfare, Tokyo.
Mikesell, R.F., and Zinser, J.E. 1973, 'The nature of the savings function in developing countries: a survey of the theoretical and empirical literature', Journal of Economic Literature, vol. 11, no. 1, pp. 1-26.
Minami, R. 1984, 'Industrialisation and technological progress in Japan', Asian Development Review, vol. 2, no. 2, pp. 69-79.
MITI (Ministry of International Trade and Industry, Japan) 1986, White Paper on International Trade,Tokyo.
1990, Interim Report on Improving the Quality of Life, Tokyo.
98
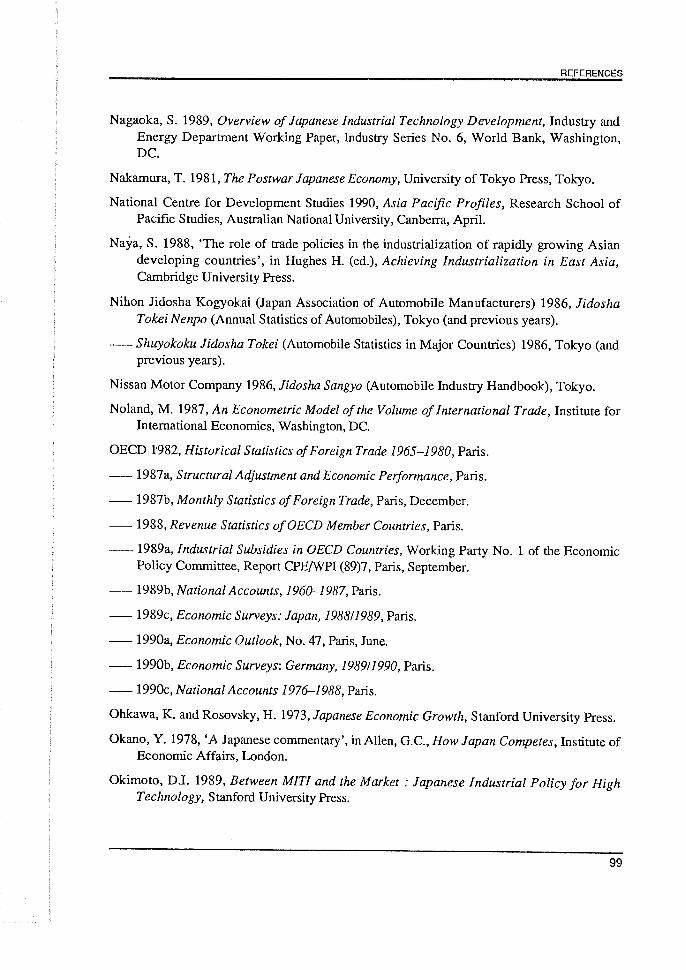
REFERENCES
Nagaoka, S. 1989, Overview of Japanese Industrial Technology Development, Industry and Energy Department Working Paper, Industry Series No. 6, World Bank, Washington, DC.
Nakamura, T. 1981, The Postwar Japanese Economy, University of Tokyo Press, Tokyo.
National Centre for Development Studies 1990, Asia Pacific Profiles, Research School of Pacific Studies, Australian National University, Canberra, April.
Nay. a, S. 1988, 'The role of trade policies in the industrialization of rapidly growing Asian developing countries', in Hughes H. (ed.), Achieving Industrialization in East Asia, Cambridge University Press.
Nihon Jidosha Kogyokai (Japan Association of Automobile Manufacturers) 1986, Jidosha Tokei Nenpo (Annual Statistics of Automobiles), Tokyo (and previous years).
DShuyokoku Jidosha Tokei (Automobile Statistics in Major Countries) 1986, Tokyo (and previous years).
Nissan Motor Company 1986, Jidosha Sangyo (Automobile Industry Handbook), Tokyo.
Noland, M. 1987, An Econometric Model of the Volume of International Trade, Institute for International Economics, Washington, DC.
OECD 1982, Historical Statistics of Foreign Trade 1965-1980, Paris.
1987a, Structural Adjustment and Economic Performance, Paris.
1987b, Monthly Statistics of Foreign Trade, Paris, December.
— 1988, Revenue Statistics of OECD Member Countries, Paris.
1989a, Industrial Subsidies in OECD Countries, Working Party No. 1 of the Economic Policy Committee, Report CPE/WPI (89)7, Paris, September.
1989b, National Accounts, 1960-1987, Paris.
1989c, Economic Surveys: Japan, 198811989, Paris.
1990a, Economic Outlook, No. 47, Paris, June.
1990b, Economic Surveys: Germany, 198911990, Paris.
1990c, National Accounts 1976-1988, Paris.
Olikawa, K. and Rosovsky, H. 1973, Japanese Economic Growth, Stanford University Press.
Okano, Y. 1978, 'A Japanese commentary', in Allen, G.C., How Japan Competes, Institute of Economic Affairs, London.
Okimoto, D.I. 1989, Between MITI and the Market : Japanese Industrial Policy for High Technology, Stanford University Press.
99

REFERENCES
— and Saxonhouse, G.R. 1987, 'Technology and the future of the economy', in Yamamura, K. and Yasuba, Y. (eds), The Political Economy of Japan, vol. 1, Stanford University Press, pp. 385 122.
Olson, M. 1982, The Rise and Decline of Nations: Economic Growth, Stagflation and Social Rigidities, Yale University Press, New Haven.
Pankert, F. 1973, 'Income distribution at different levels of development: a survey of evidence', International Labour Review, vol. 108, no. 2-3, pp. 97-125.
Park, Y.C. 1990, 'Development lessons from Asia: the role of government in South Korea and Taiwan', American Economic Review, vol. 80, no. 2, pp. 118-21.
Patrick, H. 1983, Japanese Industrial Policy and its Relevance for United States Industrial Policy, Statement prepared for the Joint Economic Committee of the US Congress, 15 July.
and Rosovsky, H. (eds) 1976, Asia's New Giant: How the Japanese Economy Works, Brookings Institution, Washington, DC.
Peck, M.J. 1976, 'Technology', in Patrick, H. and Rosovsky, H. (eds), Asia's New Giant: How the Japanese Economy Works, Brookings Institution, Washington, DC, pp. 525-86.
Peters, H.J. 1986, 'Trends in global and Pacific trades and shipping', Lectures & Contributions, no. 43, Institute for Shipping Economics and Logistics, Bremen.
Porter, M.E. 1990a, 'The competitive advantage of nations', Harvard Business Review, vol. 90, no. 2, pp. 73-93.
1990b, The Competitive Advantage of Nations, Macmillan, London.
Rabuslika, A. 1979, Hong Kong: A Study in Economic Freedom, University of Chicago.
Reynolds, L.G. 1983, 'The spread of economic growth to the third world: 1850-1980', Journal of Economic Literature, vol. 21, no. 3, pp. 941-80.
Rhee, Y.W., Ross-Larson, B. and Pursell, G. 1984, Korea's Competitive Edge, World Bank, Washington, DC.
Riedel, J. 1988, 'Economic development in East Asia: doing what comes naturally?', in Hughes, H. (ed.), Achieving Industrialization in East Asia, Cambridge University Press, pp. 1-38.
Roberts, B. 1988, The Timing and Sequencing of a Trade Liberalization Policy: The Case of Singapore, World Bank, Washington, DC, July.
Rodan, G. 1989, The Political Economy of Singapore's Industrialization: National State and International Capital, Macmillan, London.
100

REFERENCES
Salcakibara, E., Feldman, R. and Harada, Y. 1982, The Japanese Financial System in Comparative Perspective, Joint Economic Committee Congress of the United States, Washington, DC.
Sato, K. (ed.) 1980, Industry and Business in Japan.
D1987, 'Saving and investment', in Yamamura, K. and Yasuba, Y. (eds), The Political Economy of Japan, vol. 1, Stanford University Press.
Sato, S., Kumon, S. and Murakami, Y. 1977, `Datsu-hokaku jidai no torai' (The arrival of the post-conservative versus progressive period), Chuo Korot!, February.
Saxonhouse, G. 1983a, 'What is all this about industrial targeting in Japan?', World Economy, vol. 6, no. 3, pp. 253-73.
1983b, 'The micro- and macroeconomics of foreign sales to Japan', in Cline ,W. (ed.), Trade Policy in the 1980s, Institute for International Economics, Washington, DC, pp. 259-304.
— and Stern, R. 1989, 'An analytical survey of formal and informal barriers to international trade and investment in the United States, Canada and Japan', in Stern, R. (ed.), Trade and Investment Relations among the United States, Canada and Japan, University of Chicago Press.
Schultz, C.L. 1983, 'Industrial policy: a dissent', Brookings Review, Fall, pp. 3-12.
Scott, M. 1979, 'Foreign trade', in Galenson, W. (ed.), Economic Growth and Structural Change in Taiwan, Cornell University Press, Ithaca.
Snape, R.H. 1988, 'East Asia: the trade reform experience in Korea and Singapore', in Shepherd, G. and Lanyon, C.G. (eds), Trade Reform in Developing Countries: Lessons for Brazil.
Summers, R. and Heston, A. 1984, 'Improved international comparisons of real product and its composition 1950-1980', Review of Income and Wealth, vol. 30, no. 2, pp. 207-62.
1988, 'A new set of international comparisons of real product and price levels estimates for 130 countries', Review of Income and Wealth, vol. 34, no. 1, pp. 1-25.
Timmer, C.P. 1973, 'Choice of technique in rice milling in Java', Bulletin of Indonesian Economic Studies, vol. 9, no. 2, pp. 57-76.
Tresize, P.H. 1983, 'Industrial policy is not the major reason for Japan's success', Brookings Review, 15 June, pp. 13-18.
Uekusa, M. and Ide, H. 1986, 'Industrial policy in Japan', in Hiromichi, M. (ed.), Industrial Policies for Pacific Economic Growth, Allen and Unwin, Sydney.
UNIDO 1988, Industrial Statistics, Indexes of Industrial Production.
101
REFERENCES
United Nations 1988, Industrial Statistics Yearbook 1986, New York (and previous years).
1989, Yearbook of International Trade Statistics 1987, New York (and previous years).
United States Federal Trade Commission 1977, The US Steel Industry and its International Rivals, Washington, DC.
United States International Trade Commission 1983, Foreign Industrial Targeting and its Effects on US Industries, Phase I: Japan, Washington, DC.
Urata, S. 1990, 'The development of the motor vehicle industry in post-Second World War Japan', Industry and Development, no. 24, pp. 1-33.
Vernon, R. 1966, 'International investment and international trade in the product cycle', Quarterly Journal of Economics, vol. 80, no. 2, pp. 190-207.
Wade, R. 1988, 'The role of government in overcoming market failure: Taiwan, Republic of Korea and Japan', in Hughes, H. (ed.), Achieving Industrialization in East Asia, Cambridge University Press, pp. 129-63.
Westphal, L.E. 1986, Book review of 'Sources of economic growth in Korea: 1963-82', Kim K.S. and Park J.K., Journal of Economic Literature, vol. 24, September, pp. 1245-7.
Whang, I. 1987, 'The role of government in economic development: the Korean experience', Asian Development Review, vol. 5, no. 2, pp. 70-80.
World Bank 1984, Korea's Development in a Global Context, Washington, DC.
1986, Korea Managing the Industrial Transition, Washington, DC.
1987, World Development Report 1987, Washington, DC.
1988 World Tables, Washington, DC (and previous years).
1989, Overview of Japanese Industrial Technology Development, Industry Series Paper No. 6, Washington, DC.
1990, World Debt Tables 198911990, Washington, DC.
World Economic Forum and IMEDE 1989, The World Competitiveness Report 1989, Switzerland.
World Economic Forum and IMD 1990, The World Competitiveness Report 1990, Switzerland.
Woronoff, J. 1986, Asia's Miracle Economies, Sharpe Inc., New York.
Yamamura, K. 1987, 'Caveat emptor: the industrial policy of Japan', in Krugman, P.R. (ed.), Strategic Trade Policy and the New International Economics, MIT Press, Cambridge, Massachusetts, pp. 169-209.
102

REFERENCES
Yamamura, K. and Yasuba, Y. (eds) 1987, The Political Economy of Japan, vol. 1, Stanford University Press.
Yusuf, S. and Peters, K. 1984, Saving Behaviour and Its Implications for Domestic Resource Mobilization: The Case of Republic of Korea, World Bank Staff Working Paper, No. 628, Washington, DC.
103