asian trade and global linkages
TRANSCRIPT

Asian Trade and Global Linkages
Douglas H. Brooks and Changchun Hua
December 2008
ADB Institute Working Paper No. 122

2
The Working Paper series is a continuation of the formerly named Discussion Paper series; the numbering of the papers continued without interruption or change. ADBI’s working papers reflect initial ideas on a topic and are posted online for discussion. ADBI encourages readers to post their comments on the main page for each working paper (given in the citation below). Some working papers may develop into other forms of publication.
Suggested citation:
Brooks, D. and H. Changchun. 2008. Asian Trade and Global Linkages. ADBI Working Paper 122. Tokyo: Asian Development Bank Institute. Available: http://www.adbi.org/working-paper/2008/12/04/2761.asian.trade.global.linkages/
Asian Development Bank Institute Kasumigaseki Building 8F 3-2-5 Kasumigaseki, Chiyoda-ku Tokyo 100-6008, Japan Tel: +81-3-3593-5500 Fax: +81-3-3593-5571 URL: www.adbi.org E-mail: [email protected] © 2008 Asian Development Bank Institute
Douglas H. Brooks is a senior research fellow at the Asian Development Bank Institute (ADBI). Changchun Hua is a manager in the External Department of the Hong Kong Monetary Authority in Hong Kong, China.
The views expressed in this paper are the views of the authors and do not necessarily reflect the views or policies of ADBI, the Asian Development Bank (ADB), its Board of Directors, or the governments they represent. ADBI does not guarantee the accuracy of the data included in this paper and accepts no responsibility for any consequences of their use. Terminology used may not necessarily be consistent with ADB official terms.

ADBI Working Paper 122 Brooks and Hua
1
Abstract
In the run-up to the 2008 global financial crisis, there was frequent discussion of Asia having decoupled from economic shock transmission originating in Europe or North America. Much of the basis for these arguments was related to the rapid expansion of intraregional trade in Asia. This paper examines the trade linkages among Asian countries and between Asia and other regions, paying particular attention to the role of production sharing processes diversified across geographically diffuse networks. While Asia’s intraregional trade is high, most of it consists of parts and components; however, a large share of the region’s final goods exports is still destined for extra-regional markets and subject to fluctuations in demand from those markets. The central role of the People’s Republic of China (PRC) in many of the production networks points to a role for the PRC in mitigating the transmission of economic shocks to Asia through trade with other regions.
JEL Classification: F15, F42, O19, O24

ADBI Working Paper 122 Brooks and Hua
2
Contents
I. Introduction 1
II. Macroeconomic Trade Links and Business Cycle Synchronicity 1 1. Recent Trends of Aggregate Trade and Openness 2 2. Trade Balance 4 3. Trade Intensity and Interdependence 7
III. Asia’s Trade and the Significance of the People’s Republic of China 14 1. Recent Patterns in Asia’s Trade Flows 29 2. Distance and Destination 29 3. Production Fragmentation 29
IV. Implications of Trade Developments for Future Linkages 31 1. Timing 31 2. PRC Mediation 32
V. Conclusions 33
References 34

ADBI Working Paper 122 Brooks and Hua
1
I. INTRODUCTION
The reemergence of Asia as manifested in its growing share of global economic power has drawn attention, particularly within the region, to the possibility of the area decoupling its vulnerability from sharp impacts created by business cycle fluctuations in other parts of the world, particularly in North America. An increasing sense of self-reliance has been reinforced by the rise of intra-regional trade within Asia’s export profile. At the same time, the region’s growing share of world trade, the importance of trade to Asia’s growth, and the close connection between globalization and the region’s participation in geographically fragmented production chains are strengthening trade links between developing Asia and the Group of Three (G3) economies.1 The opposition of these two countervailing influences has called their relative balance into question.
Initially, international trade connects countries through the flow of goods and services and the compensatory flow of finance to pay for those goods and services.2 Trade also connects countries through transfers of capital goods to substitute for or produce traded goods. In addition, traded goods and their production often involve the international extension of externalities such as transfer of information or impacts on demand for substitutes or complements. At the aggregate level, the terms of trade, exchange rates, and macroeconomic balances or growth rates may be influenced.
This paper presents a brief overview of the ways in which international trade links trading partner economies and how these linkages have changed in recent decades. It looks first on the macroeconomic linkages where trade enters economic models primarily through one or two lines in the balance of payments. It then explores changes in the microeconomic foundations of trading patterns to see how demand patterns, changes in product characteristics, transportation technology, and general trading environment influence the transmission mechanisms through which macroeconomic trade linkages operate. Two particular factors of great importance for Asia—the reemergence of the People’s Republic of China (PRC) and production fragmentation—are discussed in greater detail.
II. MACROECONOMIC TRADE LINKS AND BUSINESS CYCLE SYNCHRONICITY
Classic trade theories such as the Heckscher-Ohlin model and Ricardian principles of comparative advantage suggest that with trade countries can benefit when they specialize in industries that are to their comparative advantage. Higher interindustry specialization would cause the industrial structures of trading countries to diverge, potentially weakening global linkages. However, international trade may cause demand or supply spillovers across countries. When demand shocks drive consumption or investment booms in one country, the effects may spill over into its trading partners through increased demand for imports, which in turn boosts other economies.
Furthermore, as noted by Shin and Wang (2004), international trade may affect macroeconomic policies (e.g., exchange rate, fiscal, and monetary policies) of some countries. More specifically, trade may lead to either policy coordination or beggar-thy-neighbor policies among countries, which, in turn, affect global economic links. For instance, to gain international market share for exported goods, countries that export similar products may compete with each other by depreciating their currencies. For their mutual benefit, trading partners or countries in production chains may need to coordinate with each other in setting policies relevant to trade.
1 The G3 includes the European Union, Japan, and United States (US). 2 For the purposes of this paper, the term goods, unless otherwise specified, should hereafter be considered as
including both goods and services.
ADBI Working Paper 122 Brooks and Hua
2
While many economists agree that trade can play a crucial role in linking economies and transmitting disturbances, the impact of trade linkages on the degree of business cycle synchronization is ambiguous (Kose, Prasad, and Terrones 2003; Shin and Wang 2004; Baxter and Kouparitsas 2005; Rana 2007a, 2007b). On the one hand, specialization in the style of Ricardian or Heckscher-Ohlin principles may mitigate comovements between economies. When countries are more specialized in industries in which they have a comparative advantage, higher trade openness may lead to decreased business cycle correlation if shocks are sector-specific. On the other hand, trade may act as a conduit for the transmission of shocks that affect all industries, which, in turn, reinforces the links among economies and correlations among business cycles (Baxter and Kouparitsas 2005). Furthermore, intraindustry trade (vertical specialization) as a result of production sharing or outsourcing may increase international business cycle comovements (Shin and Wang 2004; Burstein, Kurz, and Tesar 2008). Finally, trade spillovers across countries and resulting policy coordination or competition can cause business cycles across countries to move more closely.
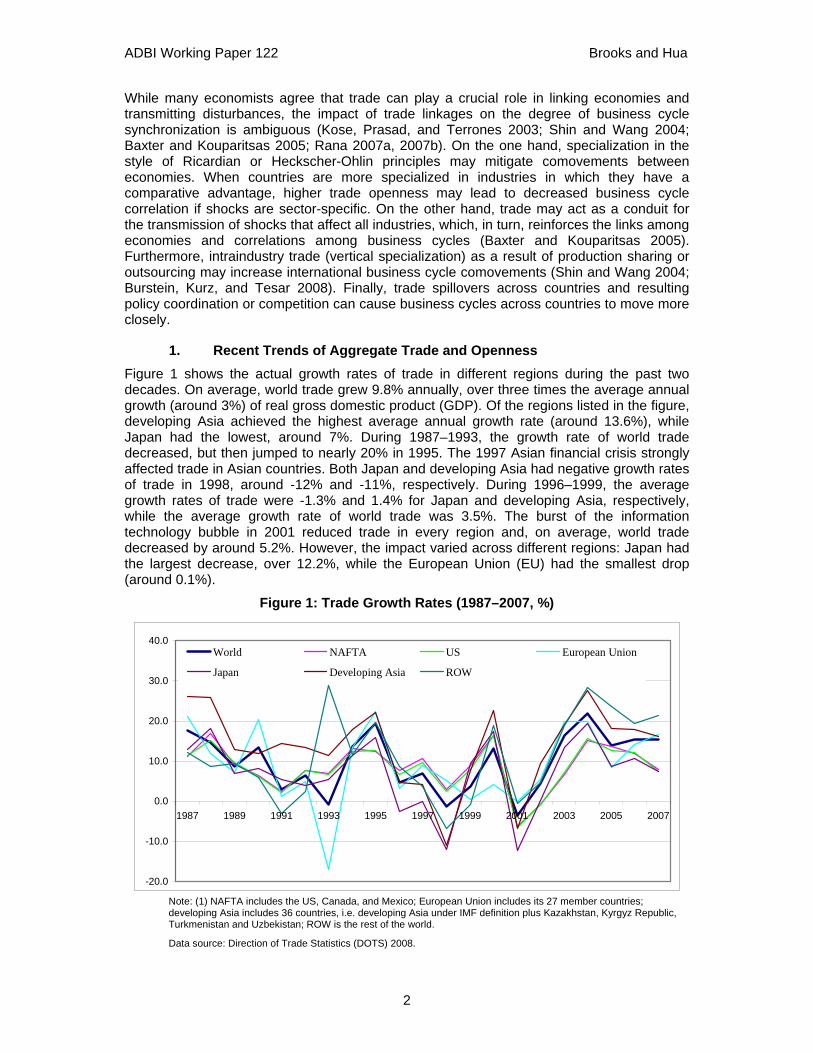
1. Recent Trends of Aggregate Trade and Openness Figure 1 shows the actual growth rates of trade in different regions during the past two decades. On average, world trade grew 9.8% annually, over three times the average annual growth (around 3%) of real gross domestic product (GDP). Of the regions listed in the figure, developing Asia achieved the highest average annual growth rate (around 13.6%), while Japan had the lowest, around 7%. During 1987–1993, the growth rate of world trade decreased, but then jumped to nearly 20% in 1995. The 1997 Asian financial crisis strongly affected trade in Asian countries. Both Japan and developing Asia had negative growth rates of trade in 1998, around -12% and -11%, respectively. During 1996–1999, the average growth rates of trade were -1.3% and 1.4% for Japan and developing Asia, respectively, while the average growth rate of world trade was 3.5%. The burst of the information technology bubble in 2001 reduced trade in every region and, on average, world trade decreased by around 5.2%. However, the impact varied across different regions: Japan had the largest decrease, over 12.2%, while the European Union (EU) had the smallest drop (around 0.1%).
Figure 1: Trade Growth Rates (1987–2007, %)
-20.0
-10.0
0.0
10.0
20.0
30.0
40.0
1987 1989 1991 1993 1995 1997 1999 2001 2003 2005 2007
World NAFTA US European Union
Japan Developing Asia ROW
Note: (1) NAFTA includes the US, Canada, and Mexico; European Union includes its 27 member countries; developing Asia includes 36 countries, i.e. developing Asia under IMF definition plus Kazakhstan, Kyrgyz Republic, Turkmenistan and Uzbekistan; ROW is the rest of the world.
Data source: Direction of Trade Statistics (DOTS) 2008.

ADBI Working Paper 122 Brooks and Hua
3
As shown in Figure 1, trade in different regions has moved to a large extent in the same manner, especially since 2002. To further illustrate this trend, Table 1 lists the correlation coefficients between trade changes in each region and the world average, and with changes in United States (US) trade, respectively. During 1987–2007, the correlations between changes in trade in the EU and North American Free Trade Agreement (NAFTA) and the world average were above 0.7. When examining each subperiod, a noteworthy fact is that the correlation between each region and the world average has become very high (around 0.95) since 2002 (except for the EU whose coefficient was 0.87). As for the correlations with changes in US trade, the EU had the highest correlation coefficient (0.49) during 1987–2007. The table also suggests that the recent correlations between changes in US trade with other regions have increased sharply since 2002.
Table 1: Correlations of Trade Growth Rates with World Average and the US
Data source: DOTS 2008.
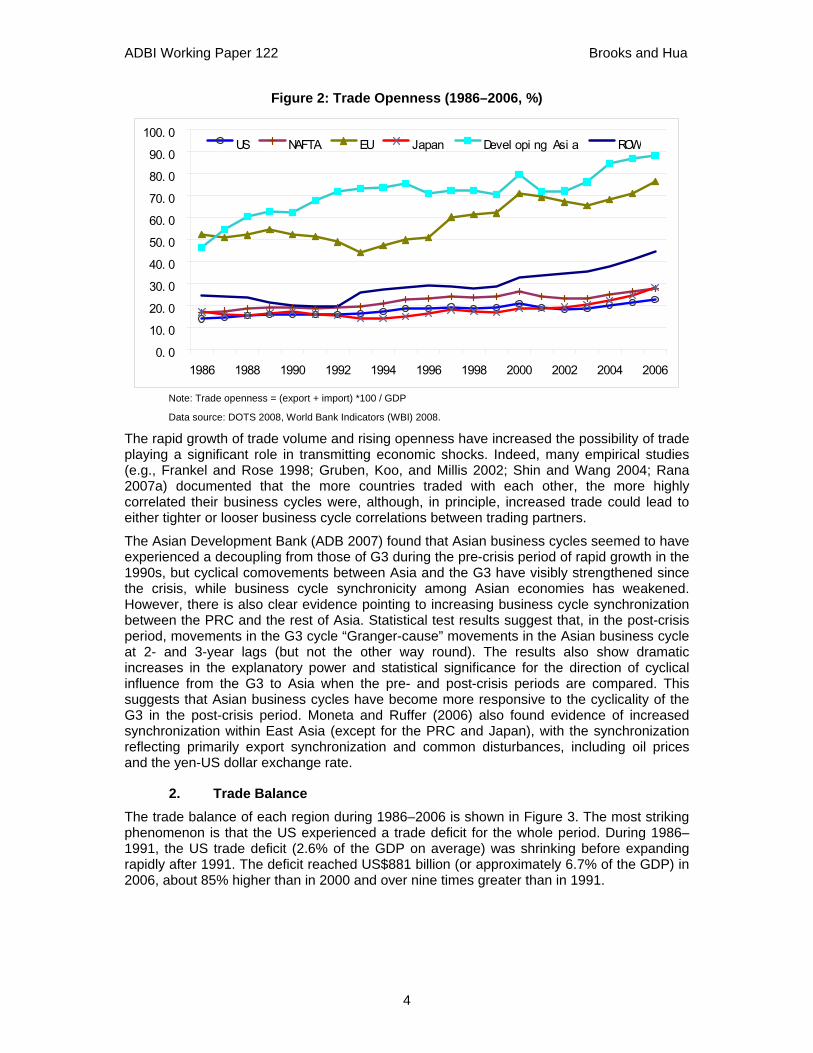
Kose and Yi (2001, 2006) showed that in a standard model of international business cycles, trade has a very small effect on overall cross-country GDP correlations given the small shares of trade in GDP for most countries. But as a result of rapid growth in trade and mild growth of GDP during the past two decades, trade openness has increased globally, especially in developing Asia and the EU. This has led to expanded global economic interdependence and the possibility of increasingly synchronized business cycles across and within regions. As shown in Figure 2, for developing Asia, the total trade volume rose from around 46% of GDP in 1986 to 88% in 2006. Trade openness in developing Asia grew rapidly during 1986–1990 (7.7% per year on average), followed by slow growth during the following decade (only 1.7% per year on average). During 2001–2006, trade openness grew on average of around 3.7% per year. The growth of trade openness reflects increasing regional integration and expanding People's Republic of China (PRC) trade, in particular. The EU recorded the highest trade volume and its openness (of around 76% of the GDP) ranked second. Trade openness in the US (or NAFTA, in general) and Japan has been relatively stable.
World US
1987–1991
1992–1996
1997–2001
2002–2007
1987–2007
1987–1991
1992–1996
1997–2001
2002–2007
1987–2007
US 0.98 0.73 0.66 0.93 0.69
NAFTA 0.98 0.60 0.70 0.96 0.70 1.00 0.99 1.00 1.00 0.99 European Union 0.98 0.87 0.96 0.87 0.76 0.95 0.44 0.74 0.66 0.49
Japan 0.78 0.75 0.66 0.98 0.57 0.69 0.27 -0.13 0.96 -0.03 Developing Asia 0.62 0.05 0.57 0.96 0.40 0.54 0.08 -0.08 0.83 0.11
ROW 0.26 0.49 0.66 0.99 0.51 0.33 -0.01 0.16 0.96 0.26
ADBI Working Paper 122 Brooks and Hua
4
Figure 2: Trade Openness (1986–2006, %)
0. 0
10. 0
20. 0
30. 0
40. 0
50. 060. 0
70. 0
80. 090. 0
100. 0
1986 1988 1990 1992 1994 1996 1998 2000 2002 2004 2006
US NAFTA EU Japan Devel opi ng Asi a ROW
Note: Trade openness = (export + import) *100 / GDP
Data source: DOTS 2008, World Bank Indicators (WBI) 2008.
The rapid growth of trade volume and rising openness have increased the possibility of trade playing a significant role in transmitting economic shocks. Indeed, many empirical studies (e.g., Frankel and Rose 1998; Gruben, Koo, and Millis 2002; Shin and Wang 2004; Rana 2007a) documented that the more countries traded with each other, the more highly correlated their business cycles were, although, in principle, increased trade could lead to either tighter or looser business cycle correlations between trading partners.
The Asian Development Bank (ADB 2007) found that Asian business cycles seemed to have experienced a decoupling from those of G3 during the pre-crisis period of rapid growth in the 1990s, but cyclical comovements between Asia and the G3 have visibly strengthened since the crisis, while business cycle synchronicity among Asian economies has weakened. However, there is also clear evidence pointing to increasing business cycle synchronization between the PRC and the rest of Asia. Statistical test results suggest that, in the post-crisis period, movements in the G3 cycle “Granger-cause” movements in the Asian business cycle at 2- and 3-year lags (but not the other way round). The results also show dramatic increases in the explanatory power and statistical significance for the direction of cyclical influence from the G3 to Asia when the pre- and post-crisis periods are compared. This suggests that Asian business cycles have become more responsive to the cyclicality of the G3 in the post-crisis period. Moneta and Ruffer (2006) also found evidence of increased synchronization within East Asia (except for the PRC and Japan), with the synchronization reflecting primarily export synchronization and common disturbances, including oil prices and the yen-US dollar exchange rate.
2. Trade Balance The trade balance of each region during 1986–2006 is shown in Figure 3. The most striking phenomenon is that the US experienced a trade deficit for the whole period. During 1986–1991, the US trade deficit (2.6% of the GDP on average) was shrinking before expanding rapidly after 1991. The deficit reached US$881 billion (or approximately 6.7% of the GDP) in 2006, about 85% higher than in 2000 and over nine times greater than in 1991.

ADBI Working Paper 122 Brooks and Hua
5
Figure 3 Trade balance (1986–2006, %)
- 8. 0
- 6. 0
- 4. 0
- 2. 0
0. 0
2. 0
4. 0
6. 0
1986 1988 1990 1992 1994 1996 1998 2000 2002 2004 2006
Uni t ed St at es
NAFTA
Eur opean Uni on
Japan
Devel opi ngAsi aROW
Note: Trade balance = (export - import) *100 / GDP
Data source: DOTS 2008, WDI 2008.
Given the weight strength of the US in world trade and the global economy, an important feature of past U.S. recessions has been that import growth turned sharply negative during every recession. US imports are strongly procyclical, reflecting the relatively high import share of cyclically sensitive components of domestic final demand, such as consumer durables and investment goods. Not surprisingly, countries with the greatest export exposure to the US suffer the largest declines in output gaps (International Monetary Fund [IMF] 2007).
Regarding the magnitude of the US current account deficit and the patterns of global imbalance, Eichengreen (2006) reviewed four competing views: the deficient US savings view, the new economy view, the global savings glut perception, and the Sino-American codependency view. The deficient US savings view holds that the global imbalance stems primarily from twin deficits in the US, while the new economy view emphasizes the attractiveness of the US for investment. The global savings glut perception argues that high savings rates in the rest of the world are mainly responsible for low interest rates in and capital flows to the US, and therefore, for the global imbalance. The Sino-American codependency view attributes the global imbalance to macroeconomic policies and low investments in risk-averse Asian countries.
No matter which cause actually accounts for the trade imbalance, it generally affects global linkages and business cycles through three channels. First, trade imbalances (or net exports) are a component of aggregate demand for domestically produced goods and therefore directly contribute to GDP growth. In this regard, the fluctuations in trade imbalances clearly link economies. Second, trade imbalances can affect capital flows through trade transactions and the expectation of exchange rate movements. A large trade imbalance (surplus or deficit) in a country may trigger the market to reassess that country’s currency and form certain expectations of exchange rate movements (appreciation or depreciation). This, in turn, causes short-term international capital flows. Finally, trade imbalances can transmit macroeconomic policies from some countries—especially those growth engines—to other countries. Given these linkages, when trade occurs in a more balanced manner, economic growth is more subject to a country’s domestic shocks. However, if trade occurs in a highly imbalanced manner, disturbances could arise both domestically and internationally.
ADBI Working Paper 122 Brooks and Hua
6
For instance, during the 1980s, Japan had a large surplus in its bilateral trade with the US (Figure 3) and the market expected that the Japanese yen would appreciate strongly against the US dollar. However, the Japanese government resisted the appreciation and resorted to a forced expansionary monetary policy for an extended period. The government attempted to liberalize imports of goods and services; however, these measures were not sufficient to eliminate the upward pressure on the yen in the foreign exchange market. Finally, after the 1985 “Plaza Agreement,” the Japanese yen appreciated by 70% in three years. To avert declining exports, the Japanese government further implemented expansionary monetary and fiscal policies during this period. The expansionary monetary policy led in part to an asset bubble in Japan during the late 1980s (Kuroda 2004).
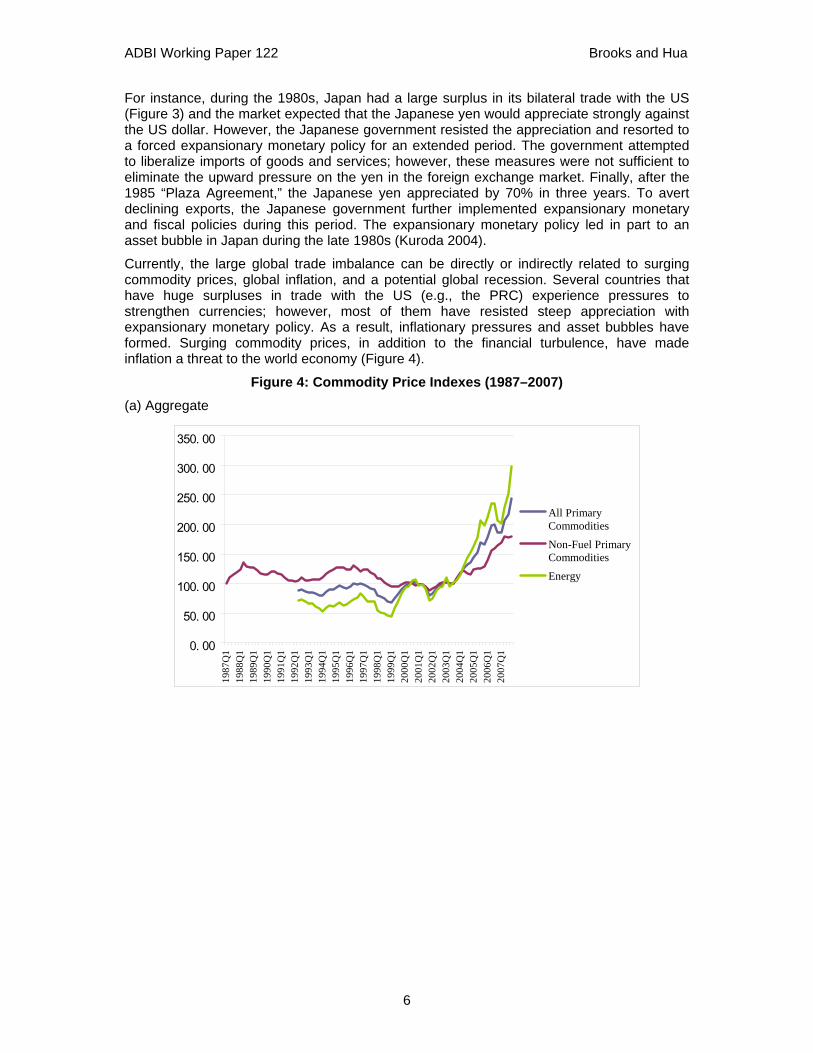
Currently, the large global trade imbalance can be directly or indirectly related to surging commodity prices, global inflation, and a potential global recession. Several countries that have huge surpluses in trade with the US (e.g., the PRC) experience pressures to strengthen currencies; however, most of them have resisted steep appreciation with expansionary monetary policy. As a result, inflationary pressures and asset bubbles have formed. Surging commodity prices, in addition to the financial turbulence, have made inflation a threat to the world economy (Figure 4).
Figure 4: Commodity Price Indexes (1987–2007) (a) Aggregate
0. 00
50. 00
100. 00
150. 00
200. 00
250. 00
300. 00
350. 00
1987
Q1
1988
Q1
1989
Q1
1990
Q1
1991
Q1
1992
Q1
1993
Q1
1994
Q1
1995
Q1
1996
Q1
1997
Q1
1998
Q1
1999
Q1
2000
Q1
2001
Q1
2002
Q1
2003
Q1
2004
Q1
2005
Q1
2006
Q1
2007
Q1
All PrimaryCommodities
Non-Fuel PrimaryCommodities
Energy

ADBI Working Paper 122 Brooks and Hua
7
(b) Price Indexes of Petroleum, Metals, Food, and Agricultural Raw Materials
0. 00
50. 00
100. 00
150. 00
200. 00
250. 00
300. 00
350. 00
1987
Q119
88Q1
1989
Q119
90Q1
1991
Q119
92Q1
1993
Q119
94Q1
1995
Q119
96Q1
1997
Q119
98Q1
1999
Q120
00Q1
2001
Q120
02Q1
2003
Q120
04Q1
2005
Q120
06Q1
2007
Q1
Petroleum
Metals
Food
AgriculturalRaw Materials
Note: 2000=100
Data source: International Financial Statistics (IFS) 2008.
3. Trade Intensity and Interdependence Figure 5 shows changes in trade structures for each region during the four periods. A common trend is that intraregional trade has been increasing and has become the most important part of the total trade of each region. Among all the regions, the share of intraregional trade in the EU has been the largest, above 70% of its total trade. In terms of export size, Figure 6 shows that the intraregional exports of the EU have also been the largest. From a dynamic point of view, intraregional trade in Asia is the most dynamic and has increased greatly. As shown in Figure 6, East Asia has been the fastest growing region in intraregional trade since 1988 and, as a result, the share of East Asian intraregional trade in world trade has increased by 5.6 percentage points. %. Table 2 also shows a similar trade pattern.

ADBI Working Paper 122 Brooks and Hua
8
Figure 5: Trade Structure of Each Region (a) NAFTA
0%
20%
40%
60%
80%
100%
1987- 1991 1992- 1997 1998- 2002 2003- 2007
Tr ade wi t h ROW
Tr ade wi t h Devel opi ngAsi aTr ade wi t h Japan
Tr ade wi t h EU
I nt r ar egi onal t r ade
(b) European Union
0%
10%
20%
30%
40%
50%
60%
70%
80%
90%
100%
1987- 1991 1992- 1997 1998- 2002 2003- 2007
Tr ade wi t h ROW
Tr ade wi t h Devel opi ngAsi aTr ade wi t h Japan
I nt r ar egi onal t r ade
Tr ade wi t h NAFTA

ADBI Working Paper 122 Brooks and Hua
9
(c) Japan
0%
10%
20%
30%
40%
50%
60%
70%
80%
90%
100%
1987- 1991 1992- 1997 1998- 2002 2003- 2007
Tr ade wi t h ROW
I nt r ar egi onalt r adeTr ade wi t h EU
Tr ade wi t h NAFTA
(d) Developing Asia
0%
20%
40%
60%
80%
100%
1987- 1991 1992- 1997 1998- 2002 2003- 2007
Tr ade wi t h ROW
I nt r ar egi onalt r adeTr ade wi t h Japan
Tr ade wi t h EU
Tr ade wi t h NAFTA

ADBI Working Paper 122 Brooks and Hua
10
(e) The Rest of the World (ROW)
0%
20%
40%
60%
80%
100%
1987- 1991 1992- 1997 1998- 2002 2003- 2007
Tr ade wi t h ROW
Tr ade wi t h Devel opi ngAsi aTr ade wi t h Japan
Tr ade wi t h EU
Tr ade wi t h NAFTA
Note: Intra-regional trade for Japan is the trade between Japan and Developing Asia.
Data source: DOTS 2008.
Figure 6: Intra-regional Trade of Major Regions (1988–2007)
0.00
4.00
8.00
12.00
16.00
20.00
-6.00 -4.00 -2.00 0.00 2.00 4.00 6.00 8.00
Change in the world market share of intra-regional exports (1988-2007)
Ave
. ann
ual g
row
th ra
te o
f int
ra-r
egio
nal
expo
rt (1
998-
2007
)
Notes: 1. The EU includes its 27 members; NAFTA includes its three members; NAFTA includes its three members; East Asia includes ASEAN 10 plus Japan; Republic of Korea; Mongolia; Hong Kong, China; Macau; and Taipei,China; Mercado Común del Sur (MERCOSUR) includes its 4 members and 1 becoming member, which are Argentina, Brazil, Paraguay, Uruguay, and Venezuela.
2. The value of merchandise exports is used in all the calculations.
Data source: DOTS 2008 and the government of Taipei,China
EU
NAFTA
East Asia ASEAN
MERCOSUR
9.5%-world trade growth
(1988-2007)
Bubble size indicates the value of intra-regional exports in 2007

ADBI Working Paper 122 Brooks and Hua
11
Table 2: Direction of Trade Flows among Different Regions (over total export, %)
To From NAFTA European
Union Japan Developing Asia ROW
1987-1991 NAFTA 43.1 21.6 10.4 12.7 12.3 European Union 9.5 73.6 2.1 5.0 9.8 Japan 37.1 20.5 31.4 11.0 Developing Asia 26.2 17.1 15.2 33.3 8.2 ROW 15.0 42.2 9.1 20.8 12.9
1992-1997 NAFTA 48.1 17.2 8.4 14.1 12.3 European Union 8.8 72.7 2.2 7.0 9.3 Japan 31.5 16.9 41.4 10.3 Developing Asia 22.1 15.8 12.7 41.0 8.4 ROW 13.4 34.7 7.8 30.2 14.0
1998-2002
NAFTA 55.9 16.0 5.9 11.8 10.5 European Union 10.9 73.5 1.8 5.7 8.2 Japan 33.4 17.4 40.0 9.2 Developing Asia 23.3 16.6 11.5 40.1 8.5 ROW 16.1 33.9 6.9 28.4 14.6
2003-2007 NAFTA 55.3 15.5 4.5 13.4 11.3 European Union 9.6 74.7 1.4 6.3 7.9 Japan 25.7 15.4 49.0 9.8 Developing Asia 19.3 16.5 9.1 45.2 9.9 ROW 15.5 33.8 6.7 29.3 14.7
Note: (1) NAFTA includes the US, Canada, and Mexico; European Union includes its 27 member countries; developing Asia includes 36 countries, i.e. developing Asia under IMF definition plus Kazakhstan, Kyrgyz Republic, Turkmenistan, and Uzbekistan; ROW is the rest of the world.
Data source: DOTS 2008.
Shin (2008) examined how export and import intensities have evolved over time in Europe and East Asia. The export and import intensities are defined as
t
bt
Xx
1
1intensityexport =
t
bt
Mm
1
1intensityimport =
where ibtx denotes total nominal exports (US$ value) from country i to bloc b (b=US, EU, and East Asia) during period t; ibtm denotes total nominal imports (US$ value) from bloc b to country i during period t; and itX and itM denote total global exports and imports of country i during period t. The result is similar for both European and East Asian countries and the results for East Asia are shown in Table 3. The export intensity index also suggests that intraregional trade occupied the highest share of the trade of all the East Asian countries shown. The intraregional trade share was around 60% for Hong Kong, China; Indonesia;

ADBI Working Paper 122 Brooks and Hua
12
Malaysia; Singapore; and Taipei,China; and near 50% for the PRC, Japan, and the Republic of Korea (hereafter Korea) in Period 3. The simple and weighted average export shares in Period 3 of the East Asia bloc were 53.7% and 49.7%, respectively.
Table 3: Trade Intensity of East Asian Countries
Country Period Trade (export) integration with Trade (import) integration with
US EU EA US EU EA
PRC
1 0.14 0.11 0.595 0.117 0.145 0.461 2 0.211 0.143 0.472 0.104 0.135 0.4413 0.212 0.16 0.418 0.078 0.111 0.465
Hong Kong, China
1 0.227 0.146 0.457 0.076 0.095 0.789 2 0.227 0.13 0.499 0.066 0.084 0.851 3 0.167 0.116 0.58 0.052 0.07 0.846
1 0.135 0.132 0.614 0.121 0.201 0.481 Indonesia 2 0.137 0.127 0.57 0.102 0.127 0.508
3 0.119 0.109 0.599 0.064 0.093 0.587 1 0.291 0.165 0.367 0.228 0.139 0.312
Japan 2 0.301 0.15 0.395 0.191 0.125 0.394 3 0.233 0.131 0.464 0.136 0.112 0.417
1 0.22 0.121 0.403 0.221 0.127 0.38 Korea 2 0.209 0.13 0.44 0.175 0.101 0.424
3 0.157 0.125 0.484 0.124 0.098 0.46 1 0.19 0.135 0.558 0.162 0.139 0.568
Malaysia 2 0.207 0.13 0.535 0.167 0.113 0.592 3 0.192 0.113 0.539 0.139 0.112 0.612
1 0.37 0.173 0.375 0.192 0.103 0.489 Philippines 2 0.28 0.181 0.5 0.198 0.083 0.567
3 0.186 0.159 0.606 0.185 0.076 0.587 1 0.197 0.137 0.465 0.159 0.128 0.541
Singapore 2 0.168 0.13 0.569 0.157 0.114 0.55 3 0.113 0.112 0.579 0.124 0.111 0.503
Taipei,China
1 0.274 0.142 0.443 0.219 0.122 0.465 2 0.232 0.138 0.507 0.176 0.098 0.544 3 0.16 0.106 0.613 0.122 0.08 0.553
1 0.205 0.287 0.429 0.114 0.143 0.53 Thailand 2 0.207 0.206 0.457 0.114 0.106 0.528
3 0.159 0.15 0.489 0.08 0.086 0.55
East Asia Average
1 0.225 0.155 0.471 0.161 0.134 0.502 2 0.218 0.147 0.494 0.145 0.109 0.54 3 0.17 0.128 0.537 0.11 0.095 0.558
East Asia Weighted Average
1 0.238 0.15 0.44 0.171 0.13 0.475 2 0.234 0.142 0.468 0.145 0.112 0.522 3 0.187 0.132 0.497 0.104 0.1 0.528
Note: Period 1: 1990:I–1996:IV; Period 2: 1999:I–2002:IV; Period 3: 2003:I–2006:IV.
Data source: Shin 2008.
To a large extent, the increased intraregional trade is due to fragmented regional production chains, especially in East Asia. Table 4 shows the trade structure in machinery and transport equipment and suggests that trade in parts and components (either exports or imports) occupies almost half of the total trade in many regions. In terms of trade dynamism,

ADBI Working Paper 122 Brooks and Hua
13
developing East Asia and the ASEAN Free Trade Area (AFTA) achieved fast growth in the share of parts and components in total trade during the period from 1989–1990 to 2005–2006. The share of export in parts and components in total export increased by around 5 percentage points in developing East Asia and around 12 percentage points in AFTA. In terms of imports, developing East Asia, especially the PRC, has dramatically increased its share of parts and components, as shown in Table 4.
Table 4: World Trade in Machinery and Transport Equipment (1989/90 and 2005/06)
Exports
Regional/Country composition (%) Share of parts and components in total trade (%) Total Trade Parts and
Components Final Goods
1989/ 90
2005/ 06
1989/ 90
2005/ 06
1989/ 90
2005/ 06 1989/90 2005/
06 NAFTA 22.4 18.1 24.5 19.7 21.0 16.7 44.9 48.4 EU-15 35.3 35.4 32.5 31.1 37.3 38.9 37.9 38.9 Japan 19.1 11.4 17.8 11.3 19.9 11.5 38.5 43.9 Developing East Asia 15.4 26.1 16.5 28.4 14.7 24.2 43.9 48.2
Korea 2.4 4.3 2.9 4.1 2.1 4.4 49.0 42.8 Taipei,China 3.3 3.8 3.6 5.4 3.1 2.5 45.0 63.8 PRC 2.3 9.3 1.4 7.3 3.0 10.9 24.5 34.8 Hong Kong, China 1.0 0.7 1.4 1.0 0.8 0.5 55.6 60.4 AFTA-6 6.3 8.0 7.2 10.5 5.7 6.0 46.7 58.4 South Asia 0.1 0.2 0.1 0.3 0.1 0.2 49.5 53.0 World (%) 100 100 100 100 100 100 41.1 44.3 (US$ Billion) 1379 3110 567 1378 812 1732
Imports
1989/ 90
2005/ 06
1989/ 90
2005/ 06
1989/ 90 2005/06 1989/90 2005/06
NAFTA 27.2 25.2 28.2 22.3 26.5 27.5 42.6 39.2 EU-15 33.7 35.4 33.1 32.0 34.2 38.2 40.4 40.0 Japan 3.4 3.7 3.5 4.2 3.3 3.3 42.0 49.9 Developing East Asia 21.3 22.6 24.0 32.4 19.3 14.8 46.5 63.5
Korea 2.4 2.2 2.9 3.0 2.0 1.6 49.5 59.7 Taipei,China 2.4 2.0 3.2 2.8 1.8 1.4 55.3 62.1 PRC 3.5 7.2 2.5 9.8 4.2 5.1 29.0 60.4 Hong Kong, China 3.9 4.0 3.8 5.7 3.9 2.7 40.3 62.5 AFTA-6 9.2 7.2 11.7 11.2 7.4 4.0 52.6 68.8 South Asia 0.5 0.8 0.6 0.6 0.4 0.9 47.2 36.0 World (%) 100 100 100 100 100 100 41.1 44.3 (US$ Billion) 1379 3110 567 1378 812 1732
Note: AFTA-6 includes Indonesia, Malaysia, Philippines, Singapore, Thailand, and Vietnam.
Source: Compiled from the UN COMTRADE Database by Athukorala and Hill 2008.
Regional trade integration may not necessarily take place at the cost of extraregional trade. In contrast, most emerging countries still depend largely on industrial countries, especially the US, for the final demand market. For example, ADB (2007) found that 61% of total Asian exports are eventually consumed in the US, Japan, and the EU and that intraregional trade dynamics are tightly associated with the US non-oil import cycle. The IMF (2007) found that, if a country’s total trade with the US rises by 10 percentage points of its GDP, then the impact of a 1 percentage point increase in US growth was about a 0.1 percentage point rise in the domestic growth of the country. There is also some evidence that the magnitude of spillovers from US growth is significantly larger in those countries that are more financially integrated with the US. Spillovers have become larger over time with increased trade and

ADBI Working Paper 122 Brooks and Hua
14
financial integration. Developing Asia is affected significantly by US growth, but not by growth in Japan.
Compared with the euro area and Japan, the US has seen a larger increase in trade with emerging market and other developing countries in general, not just with countries in the Western hemisphere. Export exposure to the US—the share of exports to the US as a percentage of GDP—has generally continued to increase, even for countries where the US’ share of total exports has declined, as trade openness has increased everywhere. Export exposure to the US also tends to be larger than that to the euro area and Japan, except in neighboring regions (IMF 2007).
Shin (2008) also showed that the two largest economies in East Asia (Japan and the PRC) depend heavily on the US market, 23.3% and 22.7%, respectively. Overall, Asia’s reliance on external demand remains strong. Asia’s export-to-GDP ratio has continued to trend upward, reaching nearly 55% of GDP in 2005 compared with the world average of 28.5%, and the incremental export-to-GDP ratio has also been on an upward trend. Although the share of G3 markets in Asia’s total exports is on a decline, the relationship in growth rates rather than levels has strengthened over time. Thus, the dependence of Asian production on overseas markets strengthened rather than weakened. Decadal correlations between growth rates of US non-oil imports and Asian exports confirm that this link has been even closer in the first years of the current century (ADB 2007).
The ADB (2007) correlation analysis of the components of business cycles showed that the correlations of Asian cycles increased markedly both with each other and with the G3 cycle, between the pre- and post-crisis periods. The trend for international business cycle comovements also revealed generally high synchronicity between the Asian business cycle and the G3 cycle in the post-crisis period, after having been negative prior to the crisis.
These macroeconomic studies suggested that East Asia depends on the US and European markets through the PRC as an assembling factory base for intermediate goods from the rest of East Asia. In short, regionalization of economic activities has gained strong momentum through progress in sharing production processes across the region. Increased vertical specialization and the rise in intra-industry trade have led to strong ties among many regional economies, but this regional integration remains structurally linked to final demand from major industrial countries.
III. ASIA’S TRADE AND THE SIGNIFICANCE OF THE PEOPLE’S REPUBLIC OF CHINA
While the macroeconomic balances display some statistical relationships between trade and synchronicity of business cycles among trading partners, developments more at the microeconomic level yield greater insights into the nature and evolution of those linkages. For instance, after conducting a correlation analysis to gauge the degree of integration among the PRC’s provinces, Tang (1998) noted that treating the PRC as a single macroeconomy may be misleading in analyzing its business cycles. This can be expected to change over time, but looking at spillovers between emerging trading partners may require more detailed analysis than has been common in looking at trade linkages between Europe, Japan, and the US. Starting from the fundamentals, a closer look at trade itself may be useful.
This section first examines changes in the direction of trade flows, then turns to factors influencing their composition. Relevant characteristics of trade shipments include the content of shipments (and how those have been changing in weight and value over time), the length of shipments in both time and distance (and trade costs more generally) and how the shipments are being influenced by technology and modal interoperability, and the certainty or reliability of delivery. The significance of evolving production sharing or vertical offshoring

ADBI Working Paper 122 Brooks and Hua
15
arrangements, which have been especially prominent in Asia, is also considered. The PRC is seen to play a central role in the region’s trade development.
Table 5 reports values of imports and exports (in billions of 2000 US$) for 11 Asian countries in 1995 and 2005 from the United Nations’ Commodity Trade Statistics (COMTRADE) database. The countries are roughly grouped with the emerging markets above and the more developed Asian markets below. Aggregate trade volumes are seen to have been growing rapidly in Asia.

ADBI Working Paper 122 Brooks and Hua
16
Table 5: Trade Growth (1995–2005)
Country Exports (Billion 2000 US$) Import (Billion 2000 US$) Annual growth in exports to (%)
1995 2005 Annualized growth rate (%) 1995 2005 Annualized
growth rate (%) Export share to China (2005) China World less
China PRC 161.0 674.0 15.4 142.0 583.0 15.2
Indonesia 47.9 75.9 4.7 42.5 51.2 1.9 7.8 12.2 4.3
India 33.9 90.8 10.4 37.0 132.0 13.6 6.6 32.5 9.7
Malaysia 78.1 123.0 4.6 80.1 99.8 2.2 6.6 14.5 4.2
Philippines 21.6 36.6 6.0 36.7 41.6 1.4 9.9 31.6 5.0
Thailand 60.5 96.3 4.8 74.1 104.0 3.4 8.4 16.3 4.2
Hong Kong,
China 186.0 259.0 3.4 209.0 266.0 2.4 44.7 6.6 1.3
Japan 469.0 505.0 0.7 354.0 450.0 2.4 13.4 11.3 -0.2
Korea 136.0 252.0 6.4 147.0 232.0 4.7 21.8 18.7 4.6
Singapore 126.0 196.0 4.5 134.0 176.0 2.8 8.8 19.7 3.8
Taipei,China 128.0 167.0 3.4 114.0 160.0 4.3 21.7 64.9 0.4
Notes: First year of Philippines data is 1996. First year of Taipei,China data is 1997.
Source: COMTRADE Database as reported in Hummels (forthcoming 2009)
ADBI Working Paper 122 Brooks and Hua
17
The export and import growth rates in the PRC and India have been exceptional. From 1995 to 2005, the PRC’s exports grew at an average of 15.4% per year, while Indian exports grew at 10.4% per year. Similarly, growth in PRC imports averaged 15.2% per year and Indian imports averaged 13.6%. The result was that, in just 10 years, Indian trade tripled and PRC trade quadrupled—with the PRC becoming the largest trader in Asia, surpassing Japan’s trade by a significant margin. The other countries also increased trade, but at rates generally near or below the worldwide average of 4.9% per year for this period.
Many countries have sizeable merchandise trade imbalances. The PRC had a merchandise surplus in 2005 equal to 15.6% of imports, while India’s merchandise trade deficit was equivalent to 45.4% of exports. Trade imbalances are normally thought to be a concern only insofar as they reflect problems with exchange rates or with domestic savings and investment rates and, subsequently, employment. But from a broader, long-term perspective, they also matter for infrastructure and transport planning purposes, which, in turn, will affect the strength of future links between countries.
The reemergence of the PRC as a major world trading economy merits particular attention and may be most easily seen by comparing Asian trade with and without the PRC. The far right columns of Table 5 report the PRC's share in exports for each country in 2005, as well as the growth in exports to the PRC and to the rest of the world. As a destination, the PRC represents less than 10% of exports for the emerging market economies, but much more for the developed economies—over 13% for Japan, just under 22% for Korea and Taipei,China, and almost 45% of Hong Kong, China’s exports. Note that these are larger shares of larger export flows from the more developed Asian economies, since exports to the PRC grew very rapidly, with rates as high as 65% per year for Taipei,China. Even the modest 6.6% annual growth for Hong Kong, China’s exports to the PRC represents a very large US dollar growth given that those exports started from an already high base in 1995.
For the emerging markets and Singapore, exports to the PRC are growing fast but still represent less than 10% of aggregate exports. The consequence is that if the PRC were eliminated from the aggregate growth totals, the initial effect would be small for these economies, typically lowering export growth by one percentage point a year or less. For the remaining, more developed economies, the PRC is a major export destination, and so after netting out growth in exports to the PRC from their overall trade growth, Hong Kong, China’s and Taipei,China’s exports would barely grow at 1.3% and 0.4% per year, and Japan’s exports would actually decline. Asia’s trade with the PRC is thus seen to be important in aggregate, but its importance varies by country. More microeconomic developments will be considered below.
Table 6 shows five countries or regions increasing in world market share and five regions decreasing in world market share between 1990 and 2005. The exports of East Asia and the PRC prominently gained world market share (8.7 percentage points and 5.8 points respectively). The exports from East Asia to the PRC gained 2 percentage points of world market share from 1990 to 2005, with a rapid annual growth rate of 17.8% during this period. The exports of the US, Japan, and the EU experienced decreasing world market shares in the same period.

ADBI Working Paper 122 Brooks and Hua
18
Table 6: World Market Share Changes of Exports for Selected Regions/Countries: 1990–2005
Group
Value Share in World Trade (%) Share Change (%) Annual Growth Rate (%)
1990 1995 2000 2005 1990 –2000
2000 –2005
1990 –2005
1990 –2000
2000 –2005
1990 –2005
Increasing in world market share
East Asia (15) 13.0 17.9 19.2 21.7 6.2 2.5 8.7 11.1 12.3 11.5 PRC 1.9 3.1 4.0 7.7 2.1 3.7 5.8 14.9 25.0 18.2 East Asia Intra-regional Trade 4.2 7.1 7.3 9.1 3.1 1.8 4.9 12.9 14.6 13.4
East Asia Extra-regional Trade 8.7 10.8 11.8 12.5 3.1 0.7 3.8 10.1 10.9 10.4
East Asia to PRC 0.8 1.6 1.7 2.9 1.0 1.1 2.1 16.2 21.0 17.8
Declining in world market share
European Union (15) 45.8 41.4 35.2 36.4 -10.6 1.1 -9.4 4.0 10.3 6.1 Europe Union (15) Intra-regional Trade 30.2 25.7 21.5 21.7 -8.6 0.2 -8.4 3.3 9.8 5.4
US 12.2 12.0 12.5 9.2 0.3 -3.3 -3.0 7.1 3.0 5.7 Japan 8.9 9.1 7.7 6.0 -1.2 -1.7 -2.9 5.3 4.4 5.0 NAFTA (3) 16.9 17.6 19.6 15.0 2.7 -4.6 -1.9 8.4 3.9 6.9 WORLD EXPORTS 100 100 100 100 - - - 6.8 9.6 7.7
Source: Calculated from UN COMTRADE data (S2, items-total).
ADBI Working Paper 122 Brooks and Hua
19
Table 7 presents the export value and shares of intra-regional and extra-regional trade for East Asia and regional trade agreements in other regions. The EU and NAFTA experienced slightly lower growth rates (6.1% and 6.9%, respectively) than the annual growth rate (7.7%) of world exports between 1990 and 2005. All regions in the table experienced an increasing dependence on intra-regional trade except the EU15 which saw a slight decline in the share of intra-regional trade in its total exports.3
3 European Union-15 (EU-15) refers to the European Union member countries prior to 1 May 2004: Austria, Belgium, Denmark, Finland, France, Germany, Greece, Ireland, Italy, Luxembourg, Netherlands, Portugal, Spain, Sweden, and the United Kingdom.

ADBI Working Paper 122 Brooks and Hua
20
Table 7: Intraregional Trade of Major Regions: 1990–2005
Group Total Exports (US$ billion) Share of Regional
Exports to World (%) World Market Share (WMS)
Change (%) Annual
Growth Rate (%)
1990 1995 2000 2005 1990 1995 2000 2005 1990–2005 1990–2005 East Asia (15) to World 417.8 870.4 1,193.9 2,136.6 100 100 100 100 8.7 11.5 Intra-regional Trade 136.1 344.7 456.4 901.7 32.6 39.6 38.2 42.2 4.9 13.4 Extra-regional Trade 281.7 525.7 737.4 1,234.8 67.4 60.4 61.8 57.8 3.8 10.4 EU (15) to World 1,476.8 2,010.3 2,196.2 3,585.5 100 100 100 100 -9.4 6.1 Intra-regional Trade 972.6 1,247.5 1,342.7 2,140.8 65.9 62.1 61.1 59.7 -8.4 5.4 Extra-regional Trade 504.2 762.7 853.5 1,444.7 34.1 37.9 38.9 40.3 -1.0 7.3 NAFTA (3) to World 546.1 853.6 1,223.6 1,478.7 100 100 100 100 -1.9 6.9 Intra-regional Trade 225.8 392.9 681.6 824.4 41.3 46.0 55.7 55.8 1.4 9.0 Extra-regional Trade 320.4 460.7 542.1 654.3 58.7 54.0 44.3 44.2 -3.3 4.9 MERCOSUR (4) to World 46.4 70.5 84.8 161.3 100 100 100 100 0.2 8.7 Intra-regional Trade 4.1 14.5 17.7 21.1 8.9 20.5 20.9 13.1 0.1 11.5 Extra-regional Trade 42.3 56.0 67.0 140.2 91.1 79.5 79.1 86.9 0.1 8.3 ASEAN (10) to World 141.3 311.3 420.9 607.6 100 100 100 100 1.8 10.2 Intra-regional Trade 26.8 77.4 96.7 155.6 19.0 24.9 23.0 25.6 0.7 12.4 Extra-regional Trade 114.5 234.0 324.2 452.0 81.0 75.1 77.0 74.4 1.0 9.6 WORLD EXPORTS 3224.8 4853.9 6233.1 9859.0 - - - - - 7.7
Source: Calculated from UN COMTRADE data (S2, items-total).

ADBI Working Paper 122 Brooks and Hua
21
Intra-regional trade for East Asia accounted for 42.2% of its exports in 2005, and increased marginally more rapidly than extra-regional trade. Its annual growth rate from 1990 to 2005 was 13.4% versus 10.4% for extra-regional trade. The growth rate for intra-regional trade in East Asia also far exceeded growth of intra-regional trade for NAFTA (9.0%), EU15 (5.4%), and Mercado Común del Sur (MERCOSUR) (11.5%). Indeed, the rapid increase in intra-regional trade flows formed a solid basis for the high synchronization of business cycles in East Asia (Shin and Wang 2004).
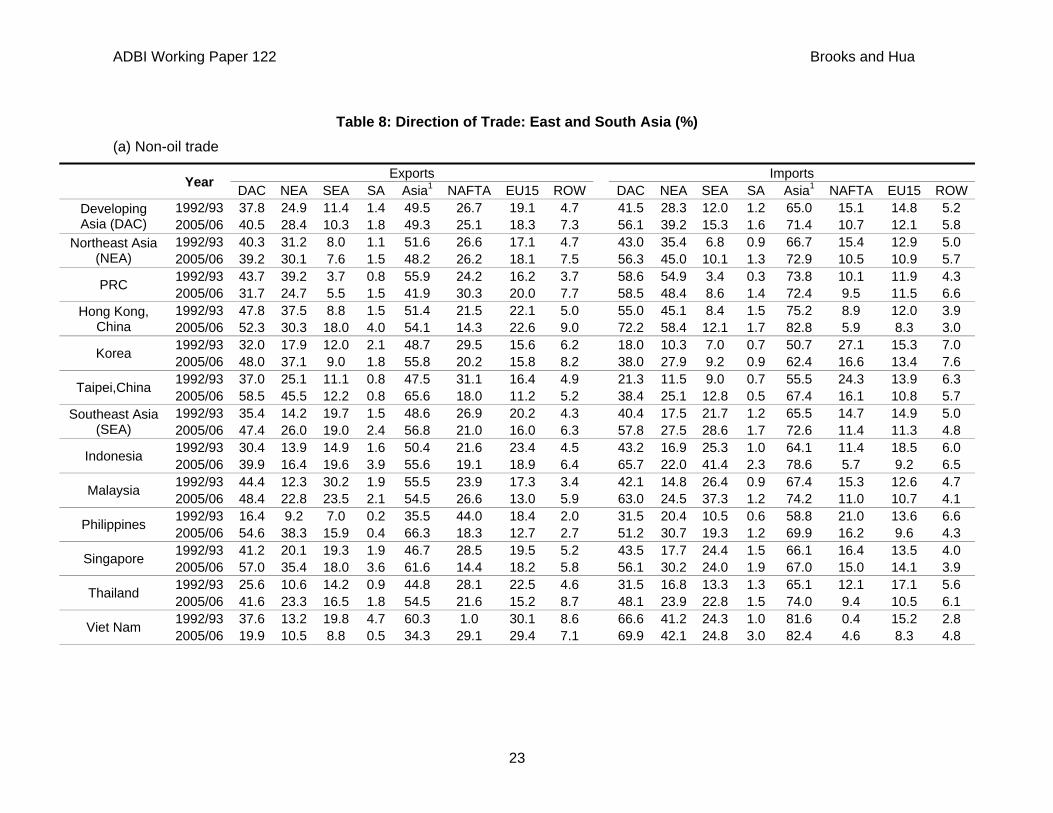
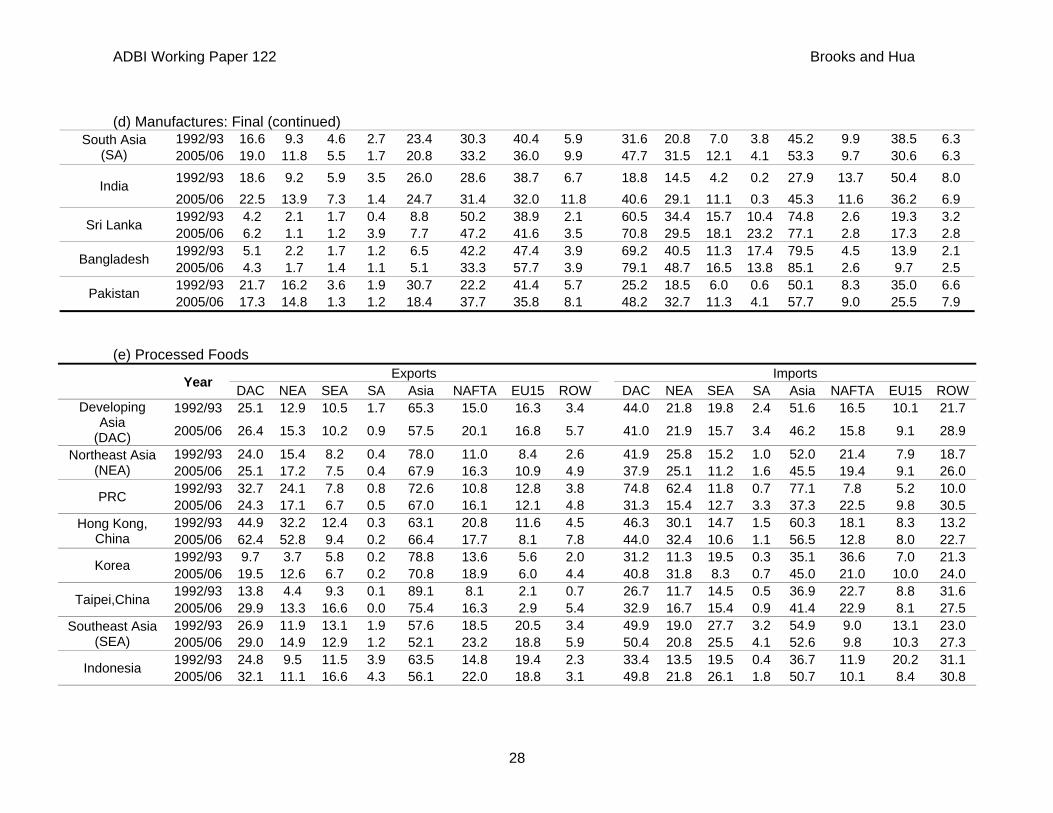
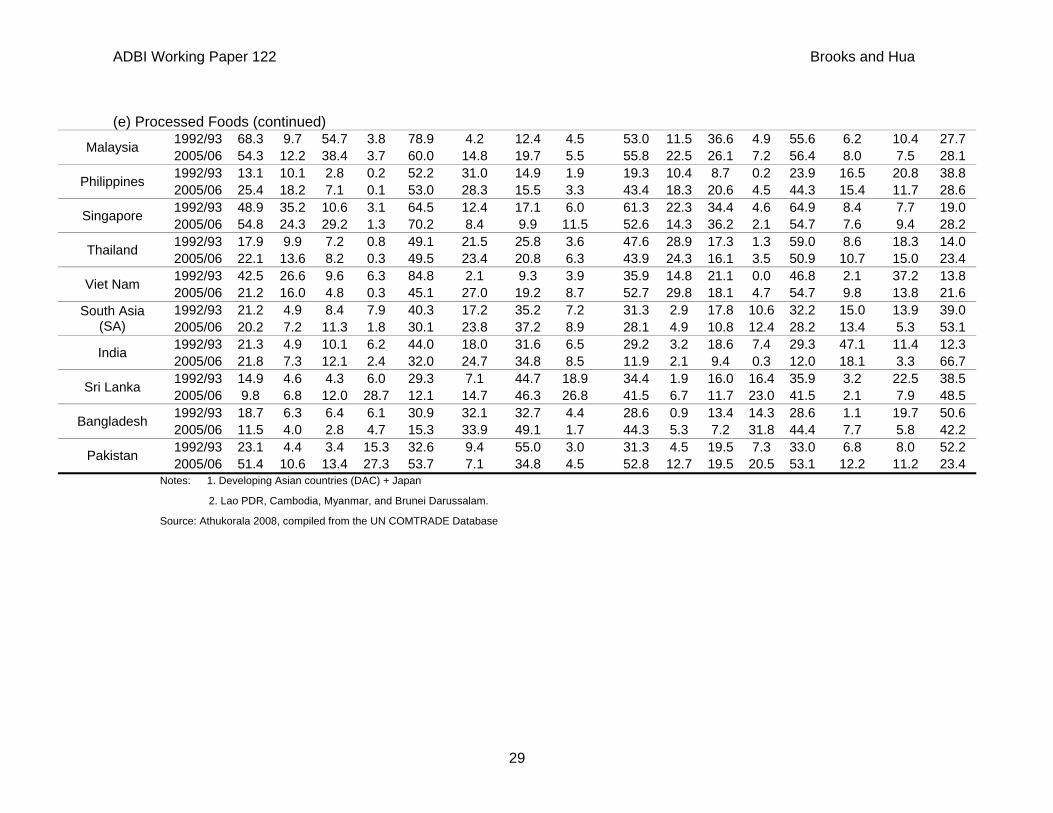
As for Asia’s manufacturing trade, however, the intra-regional share of final manufacturing exports in developing Asia actually declined from 35.8% to 31.8% between 1992/1993 and 2005/2006 (Table 8 and Athukorala 2008). This decline was driven by the PRC, whose intra-regional export share declined from 42.9% to 25.8% in this period, reflecting its rising role as a final goods assembler for extra-regional markets. Most other Asian countries have exhibited a mild increase in intra-regional trade, but still rely on extra-regional markets for more than 50% of their final manufacturing exports. While the difference between intra-regional shares of total trade and final goods trade is observable for both exports and imports, the magnitude of the difference is much larger on the export side. The difference in magnitude between regional trade shares estimated in gross and net terms is much larger for countries in Southeast Asia than for the entire region. Unlike in East Asia (or developing East Asia and AFTA), the estimated intra-regional trade shares for NAFTA, the EU, and the other regional groupings are remarkably resilient to including or excluding trade in components.
The estimates for different developing Asian sub-regions clearly show that intra-regional trade within Association of Southeast Asia Nations (ASEAN) is rather low compared to the average for broader Asia (including or excluding Japan). In 2005/2006, of the total manufacturing exports of ASEAN, only 19.4% were to markets in the subregion. The comparable figure for imports was 28.5%. When parts and components are excluded, these figures decline to 19.5% and 25.4%, respectively. Among the 6 major ASEAN countries, Viet Nam has the lowest intra-regional trade share. Even the three newer ASEAN member countries (Myanmar, Cambodia, and Lao PDR, reported as “Other SEA” in Table 8), appear to rely heavily on extraregional markets for both export and import trade, despite their strong cross border trade flows with Thailand. In 2005/2006, trade within ASEAN accounted for only 26.7% and 37.2% of their total non-oil exports and imports.4
Interestingly, a comparison of intra-regional import and export shares reveals a startling asymmetry in the degree of measured trade integration among developing Asian countries. Unlike the EU and NAFTA, in East Asia, the increase over time in the intra-regional trade ratio has resulted largely from the rapid increase in intra-regional imports; intra-regional export expansion has lagged consistently behind. In 2005/2006 intra-regional import flows amounted to 58.6% of total manufacturing imports of developing Asia, up from 41.5% in 1992/93. The intra-regional share in total regional exports was, however, significantly lower: 37.7% in 1992/1993 and 40.0% in 2005/2006. In other words,
4 Note that unofficial trade between neighboring countries may equal or exceed official trade, particularly
between developing countries. Official export statistics, however, are likely to be more complete than import statistics.
ADBI Working Paper 122 Brooks and Hua
22
the region is much more heavily dependent on extra-regional trade for its growth dynamism than is suggested by the total regional trade share, and this dependence has remained virtually unchanged for the last decade. The magnitude of this asymmetry remains virtually unchanged when we remove parts and components from total trade (see section d of Table 8). In other words, the widely reported aggregate (exports plus imports) intra-regional trade shares deflect attention from the continuing importance of extra-regional trade for growth dynamism in East Asia.
ADBI Working Paper 122 Brooks and Hua
23
Table 8: Direction of Trade: East and South Asia (%) (a) Non-oil trade
Year Exports Imports DAC NEA SEA SA Asia1 NAFTA EU15 ROW DAC NEA SEA SA Asia1 NAFTA EU15 ROW
Developing Asia (DAC)
1992/93 37.8 24.9 11.4 1.4 49.5 26.7 19.1 4.7 41.5 28.3 12.0 1.2 65.0 15.1 14.8 5.2 2005/06 40.5 28.4 10.3 1.8 49.3 25.1 18.3 7.3 56.1 39.2 15.3 1.6 71.4 10.7 12.1 5.8
Northeast Asia (NEA)
1992/93 40.3 31.2 8.0 1.1 51.6 26.6 17.1 4.7 43.0 35.4 6.8 0.9 66.7 15.4 12.9 5.0 2005/06 39.2 30.1 7.6 1.5 48.2 26.2 18.1 7.5 56.3 45.0 10.1 1.3 72.9 10.5 10.9 5.7
PRC 1992/93 43.7 39.2 3.7 0.8 55.9 24.2 16.2 3.7 58.6 54.9 3.4 0.3 73.8 10.1 11.9 4.3 2005/06 31.7 24.7 5.5 1.5 41.9 30.3 20.0 7.7 58.5 48.4 8.6 1.4 72.4 9.5 11.5 6.6
Hong Kong, China
1992/93 47.8 37.5 8.8 1.5 51.4 21.5 22.1 5.0 55.0 45.1 8.4 1.5 75.2 8.9 12.0 3.9 2005/06 52.3 30.3 18.0 4.0 54.1 14.3 22.6 9.0 72.2 58.4 12.1 1.7 82.8 5.9 8.3 3.0
Korea 1992/93 32.0 17.9 12.0 2.1 48.7 29.5 15.6 6.2 18.0 10.3 7.0 0.7 50.7 27.1 15.3 7.0 2005/06 48.0 37.1 9.0 1.8 55.8 20.2 15.8 8.2 38.0 27.9 9.2 0.9 62.4 16.6 13.4 7.6
Taipei,China 1992/93 37.0 25.1 11.1 0.8 47.5 31.1 16.4 4.9 21.3 11.5 9.0 0.7 55.5 24.3 13.9 6.3 2005/06 58.5 45.5 12.2 0.8 65.6 18.0 11.2 5.2 38.4 25.1 12.8 0.5 67.4 16.1 10.8 5.7
Southeast Asia (SEA)
1992/93 35.4 14.2 19.7 1.5 48.6 26.9 20.2 4.3 40.4 17.5 21.7 1.2 65.5 14.7 14.9 5.0 2005/06 47.4 26.0 19.0 2.4 56.8 21.0 16.0 6.3 57.8 27.5 28.6 1.7 72.6 11.4 11.3 4.8
Indonesia 1992/93 30.4 13.9 14.9 1.6 50.4 21.6 23.4 4.5 43.2 16.9 25.3 1.0 64.1 11.4 18.5 6.0 2005/06 39.9 16.4 19.6 3.9 55.6 19.1 18.9 6.4 65.7 22.0 41.4 2.3 78.6 5.7 9.2 6.5
Malaysia 1992/93 44.4 12.3 30.2 1.9 55.5 23.9 17.3 3.4 42.1 14.8 26.4 0.9 67.4 15.3 12.6 4.7 2005/06 48.4 22.8 23.5 2.1 54.5 26.6 13.0 5.9 63.0 24.5 37.3 1.2 74.2 11.0 10.7 4.1
Philippines 1992/93 16.4 9.2 7.0 0.2 35.5 44.0 18.4 2.0 31.5 20.4 10.5 0.6 58.8 21.0 13.6 6.6 2005/06 54.6 38.3 15.9 0.4 66.3 18.3 12.7 2.7 51.2 30.7 19.3 1.2 69.9 16.2 9.6 4.3
Singapore 1992/93 41.2 20.1 19.3 1.9 46.7 28.5 19.5 5.2 43.5 17.7 24.4 1.5 66.1 16.4 13.5 4.0 2005/06 57.0 35.4 18.0 3.6 61.6 14.4 18.2 5.8 56.1 30.2 24.0 1.9 67.0 15.0 14.1 3.9
Thailand 1992/93 25.6 10.6 14.2 0.9 44.8 28.1 22.5 4.6 31.5 16.8 13.3 1.3 65.1 12.1 17.1 5.6 2005/06 41.6 23.3 16.5 1.8 54.5 21.6 15.2 8.7 48.1 23.9 22.8 1.5 74.0 9.4 10.5 6.1
Viet Nam 1992/93 37.6 13.2 19.8 4.7 60.3 1.0 30.1 8.6 66.6 41.2 24.3 1.0 81.6 0.4 15.2 2.8 2005/06 19.9 10.5 8.8 0.5 34.3 29.1 29.4 7.1 69.9 42.1 24.8 3.0 82.4 4.6 8.3 4.8

ADBI Working Paper 122 Brooks and Hua
24
(a) Non-oil trade (continued)
Other SEA2 1992/93 --- --- --- --- --- --- --- --- --- --- --- --- --- --- --- ---
2005/06 48.5 16.7 26.7 5.1 62.2 17.9 14.5 8.8 67.2 30.1 37.2 3.2 72.1 15.2 9.3 4.4
South Asia (SA)
1992/93 21.1 9.8 7.3 4.0 30.4 26.0 37.4 6.2 31.4 17.4 9.7 4.3 43.6 13.4 34.8 8.3 2005/06 25.6 16.6 6.5 2.5 28.5 29.1 32.9 9.5 46.5 26.2 15.8 4.6 51.9 10.1 28.1 10.0
India 1992/93 23.0 10.0 8.9 4.1 33.8 24.3 35.4 6.6 19.7 12.5 6.4 0.7 29.4 17.0 44.9 8.7 2005/06 29.6 19.8 8.1 1.7 32.9 27.2 29.2 10.7 40.7 25.0 15.1 0.6 45.3 11.5 32.3 10.9
Sri Lanka 1992/93 7.5 2.8 2.3 2.4 13.7 40.7 39.8 5.8 56.6 28.1 16.2 12.3 68.6 6.4 19.2 5.8 2005/06 14.1 2.2 2.3 9.7 17.3 39.3 38.2 5.2 65.8 23.5 20.4 21.8 71.0 4.9 17.3 6.8
Bangladesh 1992/93 8.3 2.6 2.8 2.9 11.0 39.8 44.6 4.6 62.5 32.8 13.0 16.7 71.3 8.1 14.4 6.2 2005/06 5.9 2.2 1.6 2.1 7.2 32.7 56.3 3.8 72.8 37.2 18.8 16.8 77.9 4.1 10.9 7.1
Pakistan 1992/93 26.8 16.1 6.4 4.3 35.8 19.3 38.9 6.0 29.2 15.9 11.6 1.7 47.9 11.9 30.9 9.2 2005/06 19.9 15.5 2.2 2.2 21.1 34.9 35.0 9.0 47.4 26.2 15.5 5.7 56.5 9.7 24.8 9.0
(b) Manufactures: Total Year Exports Imports DAC NEA SEA SA Asia NAFTA EU15 ROW DAC NEA SEA SA Asia NAFTA EU15 ROW
Developing Asia (DAC)
1992/93 37.7 25.4 11.1 1.2 46.7 29.0 19.7 4.7 41.5 29.4 11.2 0.9 67.3 13.9 15.4 3.4 2005/06 40.0 28.3 10.1 1.6 48.1 26.0 18.6 7.3 58.6 42.3 15.2 1.1 75.2 9.8 12.6 2.5
Northeast Asia (NEA)
1992/93 40.0 31.2 7.7 1.1 49.2 28.2 17.7 4.9 43.9 37.1 6.0 0.8 69.8 13.7 13.5 3.1 2005/06 38.9 29.9 7.5 1.5 47.3 26.7 18.4 7.6 59.7 48.8 10.0 0.9 77.5 9.2 11.2 2.2
PRC 1992/93 43.6 40.1 2.8 0.7 53.8 26.1 16.4 3.7 59.5 56.9 2.4 0.2 75.9 8.9 12.8 2.5 2005/06 31.4 24.6 5.4 1.4 40.9 31.0 20.3 7.8 63.1 54.3 8.3 0.6 78.5 7.6 12.0 1.9
Hong Kong, China
1992/93 46.2 36.0 8.7 1.5 49.5 22.2 23.0 5.2 55.7 46.1 8.1 1.5 77.1 8.1 11.6 3.2 2005/06 51.3 29.1 18.2 4.1 53.0 14.5 23.2 9.2 73.5 59.6 12.3 1.7 84.4 5.6 8.0 2.1
Korea 1992/93 31.8 17.7 12.2 2.0 46.5 30.8 16.3 6.4 16.0 9.9 5.4 0.7 55.1 24.2 17.6 3.1 2005/06 47.5 36.8 8.9 1.8 54.8 20.6 16.3 8.4 39.1 29.3 9.1 0.6 66.5 15.9 14.6 3.0
Tapei,China 1992/93 37.2 25.6 10.9 0.8 44.3 33.0 17.5 5.2 20.2 11.2 8.3 0.7 59.0 22.8 14.6 3.6 2005/06 58.3 45.3 12.2 0.8 64.9 18.3 11.5 5.3 40.2 26.8 13.1 0.4 71.5 15.3 10.9 2.3
Southeast Asia (SEA)
1992/93 35.7 13.6 21.0 1.0 44.9 30.6 20.6 3.8 39.2 17.5 20.9 0.8 66.6 14.6 15.3 3.5 2005/06 47.7 26.4 19.4 1.9 55.8 22.2 16.0 6.0 58.8 28.9 28.5 1.3 74.6 11.3 11.6 2.5

ADBI Working Paper 122 Brooks and Hua
25
(b) Manufactures: Total (continued)
Indonesia 1992/93 33.8 15.4 17.0 1.4 49.2 22.7 23.8 4.3 44.2 17.1 26.6 0.5 67.1 9.7 19.6 3.5 2005/06 39.1 14.7 22.7 1.6 51.1 22.3 19.9 6.7 70.5 23.6 45.1 1.8 84.8 3.3 9.4 2.5
Malaysia 1992/93 42.9 10.0 32.5 0.4 49.6 30.1 17.6 2.6 40.9 15.0 25.3 0.6 68.3 16.0 12.9 2.7 2005/06 47.5 22.2 23.9 1.4 53.5 28.6 12.4 5.5 63.8 25.7 37.3 0.8 75.7 11.4 11.3 1.6
Philippines 1992/93 15.6 7.5 7.9 0.2 25.9 52.3 19.7 2.1 31.7 21.1 10.0 0.5 62.7 19.3 14.2 3.8 2005/06 55.7 39.3 16.0 0.4 65.8 18.5 12.9 2.7 51.9 32.9 18.1 0.9 72.5 15.7 10.1 1.7
Singapore 1992/93 40.3 19.3 19.4 1.6 45.3 29.8 20.1 4.8 41.1 17.5 22.6 1.0 65.5 17.3 13.8 3.4 2005/06 56.8 35.7 17.6 3.6 61.1 14.7 18.6 5.7 55.7 31.3 22.8 1.7 67.1 15.6 14.1 3.2
Thailand 1992/93 26.3 9.3 16.3 0.8 41.2 31.8 22.9 4.1 30.3 16.7 12.7 0.8 66.7 11.6 17.4 4.4 2005/06 42.3 23.5 16.9 1.8 53.9 22.1 15.5 8.6 49.3 24.8 23.3 1.2 77.3 8.9 10.7 3.0
Viet Nam 1992/93 11.5 7.7 3.6 0.2 34.4 0.7 59.0 5.9 65.6 40.3 24.2 1.0 81.9 0.4 15.6 2.2 2005/06 15.9 8.6 7.0 0.3 30.2 32.0 32.0 5.8 71.5 45.8 24.1 1.7 85.6 3.7 8.6 2.0
South Asia (SA)
1992/93 17.1 9.2 5.1 2.8 23.8 29.9 40.3 6.0 29.6 19.2 7.0 3.3 43.6 11.5 38.9 6.0 2005/06 19.0 11.6 5.8 1.6 20.9 33.1 36.0 10.0 46.8 29.8 13.6 3.5 53.1 9.8 31.1 5.9
India 1992/93 19.3 9.1 6.6 3.6 26.4 28.2 38.5 6.9 17.7 12.8 4.7 0.2 28.4 15.4 48.8 7.3 2005/06 22.2 13.4 7.4 1.3 24.4 31.5 32.3 11.8 41.4 27.9 13.2 0.3 46.7 11.5 35.4 6.4
Sri Lanka 1992/93 4.8 2.2 2.1 0.4 9.8 48.9 39.0 2.3 58.1 32.4 15.6 10.0 72.4 3.5 20.7 3.5 2005/06 7.1 1.3 1.7 4.0 8.8 46.0 41.5 3.7 68.6 28.1 18.8 21.8 74.9 3.2 19.0 2.9
Bangladesh 1992/93 5.2 2.2 1.7 1.3 6.7 42.1 47.4 3.9 67.6 39.8 11.1 16.7 78.4 4.8 14.7 2.1 2005/06 4.4 1.8 1.4 1.2 5.6 33.1 57.5 3.9 75.6 45.7 16.9 13.0 81.9 2.9 12.6 2.6
Pakistan 1992/93 21.7 16.1 3.6 2.0 30.6 22.1 41.6 5.7 24.9 18.7 5.7 0.5 47.8 9.5 36.7 6.0 2005/06 17.3 14.7 1.3 1.2 18.4 37.6 35.9 8.1 45.4 30.2 11.9 3.3 56.4 9.0 27.7 7.0
(c) Manufacturers: Parts and Components Year Exports Imports DAC NEA SEA SA Asia NAFTA EU15 ROW DAC NEA SEA SA Asia NAFTA EU15 ROW
Developing Asia
(DAC)
1992/93 46.7 24.9 21.1 0.7 54.0 27.5 15.2 3.4 37.2 22.0 15.0 0.2 66.8 18.0 13.6 1.6
2005/06 59.3 41.9 16.5 0.9 67.0 16.6 11.5 4.9 64.3 44.2 19.9 0.2 79.2 10.1 9.4 1.3
Northeast Asia (NEA)
1992/93 46.1 31.4 14.0 0.7 53.5 27.6 14.7 4.3 37.4 29.3 8.1 0.1 68.7 17.6 12.3 1.3 2005/06 58.6 44.8 13.0 0.8 66.7 16.9 11.0 5.3 67.3 52.9 14.4 0.1 82.5 8.4 7.9 1.2

ADBI Working Paper 122 Brooks and Hua
26
(c) Manufacturers: Parts and Components (continued)
PRC 1992/93 56.3 48.4 6.1 1.9 64.4 20.6 12.6 2.4 60.3 58.8 1.5 0.0 72.4 9.8 16.6 1.2 2005/06 52.4 41.5 9.9 1.0 61.3 19.9 12.9 5.8 71.4 61.5 9.8 0.1 84.4 5.8 8.6 1.1
Hong Kong, China
1992/93 68.1 51.7 15.8 0.5 71.1 14.5 10.9 3.4 48.2 33.8 14.3 0.1 75.2 12.8 10.5 1.5 2005/06 73.2 43.6 28.3 1.4 74.7 4.8 13.5 7.1 75.6 55.3 20.3 0.1 88.0 5.8 5.2 0.9
Korea 1992/93 33.8 15.8 17.2 0.7 46.2 34.4 14.1 5.2 13.6 8.7 4.9 0.0 57.7 28.4 12.4 1.6 2005/06 61.0 47.4 12.6 1.0 68.9 16.2 9.3 5.6 47.2 31.9 15.1 0.2 69.3 18.1 10.7 2.0
Tapei,China 1992/93 38.4 24.3 13.7 0.3 44.3 32.8 18.0 4.8 22.4 11.9 10.4 0.0 67.1 21.9 10.0 1.1 2005/06 66.3 49.2 16.9 0.2 74.3 13.8 8.3 3.7 52.0 31.3 20.7 0.1 75.5 15.7 7.9 0.8
Southeast Asia (SEA)
1992/93 47.7 16.4 30.7 0.6 55.0 27.5 15.4 2.1 38.4 14.5 23.6 0.2 67.1 18.3 12.9 1.7 2005/06 62.0 36.7 24.4 1.0 68.9 15.4 11.9 3.8 59.5 27.0 32.3 0.3 74.5 14.0 10.3 1.3
Indonesia 1992/93 41.3 8.0 33.0 0.4 57.2 16.5 21.9 4.4 42.2 8.3 33.6 0.3 69.8 10.2 17.8 2.1 2005/06 62.2 12.4 49.1 0.7 74.3 11.1 9.9 4.6 71.4 14.7 56.4 0.3 88.4 2.7 7.3 1.7
Malaysia 1992/93 48.3 13.3 34.8 0.2 53.4 27.9 17.6 1.1 37.9 11.8 25.8 0.2 66.6 20.3 12.1 1.0 2005/06 58.9 30.1 28.2 0.5 63.3 21.4 12.0 3.4 62.6 22.1 40.3 0.2 73.0 14.9 11.3 0.8
Philippines 1992/93 24.7 9.1 15.4 0.1 37.2 48.4 13.6 0.8 20.1 12.2 7.7 0.2 55.1 28.3 15.2 1.4 2005/06 64.5 44.7 19.5 0.3 73.4 13.1 11.4 2.1 47.9 31.5 16.3 0.1 68.2 22.4 8.6 0.7
Singapore 1992/93 51.9 22.9 27.8 1.2 56.2 26.3 14.7 2.8 44.1 19.3 24.5 0.3 67.3 19.6 11.5 1.6 2005/06 67.0 48.1 17.0 1.9 70.6 11.2 13.9 4.4 61.6 35.1 26.2 0.3 71.2 15.2 12.0 1.6
Thailand 1992/93 48.0 9.1 38.7 0.2 65.1 19.3 12.5 3.0 30.2 11.5 18.6 0.2 71.2 14.0 12.0 2.8 2005/06 56.9 30.1 25.5 1.3 69.2 14.9 9.9 6.0 50.5 20.2 30.0 0.3 80.1 11.2 7.2 1.6
Viet Nam 1992/93 76.9 64.2 12.6 0.0 83.8 0.0 14.3 1.9 46.7 28.3 17.9 0.4 54.2 0.4 41.9 3.6 2005/06 39.0 10.3 28.1 0.5 86.1 6.4 4.2 3.4 62.4 29.1 32.8 0.6 83.6 3.2 11.8 1.4
South Asia (SA)
1992/93 34.2 5.6 22.5 6.1 37.5 16.7 36.7 9.1 19.8 11.6 7.1 1.1 36.1 18.8 40.8 4.3 2005/06 18.5 8.5 9.1 0.9 22.3 30.6 35.7 11.3 43.2 22.3 20.0 0.9 52.3 10.1 33.3 4.4
India 1992/93 36.1 5.6 23.9 6.5 37.3 18.7 34.5 9.5 13.0 5.9 7.0 0.0 30.5 22.6 42.2 4.7 2005/06 18.2 8.7 9.0 0.5 21.4 31.7 35.4 11.5 44.2 23.3 20.9 0.1 52.0 10.8 32.5 4.7
Sri Lanka 1992/93 23.9 5.7 17.6 0.5 46.9 1.9 43.2 8.1 36.9 15.2 14.5 7.2 50.9 11.0 32.8 5.4 2005/06 27.5 6.6 13.9 7.0 33.1 18.1 39.9 8.9 51.3 16.4 24.5 10.3 57.3 5.9 32.9 3.9
Bangladesh 1992/93 14.8 7.6 2.9 4.3 56.8 1.1 39.6 2.5 50.5 32.3 9.8 8.4 66.5 7.5 23.1 2.9 2005/06 21.7 3.6 7.2 11.0 68.6 3.4 25.6 2.4 47.2 20.8 19.9 6.5 55.1 5.2 36.6 3.1
Pakistan 1992/93 15.3 4.4 2.7 8.2 16.2 2.0 79.1 2.7 24.0 19.8 4.0 0.2 38.0 14.7 44.0 3.4 2005/06 10.8 3.3 6.4 1.1 11.2 13.4 63.1 12.4 34.0 19.6 14.2 0.2 50.9 8.9 36.8 3.3

ADBI Working Paper 122 Brooks and Hua
27
(d) Manufactures: Final Year Exports Imports DAC NEA SEA SA Asia NAFTA EU15 ROW DAC NEA SEA SA Asia NAFTA EU15 ROW
Developing Asia (DAC)
1992/93 35.8 25.5 9.0 1.3 45.2 29.3 20.6 4.9 43.0 32.0 9.8 1.2 67.5 12.4 16.1 4.0 2005/06 31.8 22.6 7.4 1.9 40.0 29.9 21.7 8.4 54.8 40.9 12.0 1.8 72.4 9.5 14.7 3.3
Northeast Asia (NEA)
1992/93 38.9 31.2 6.6 1.2 48.5 28.3 18.2 5.0 45.8 39.4 5.4 1.0 70.1 12.5 13.8 3.6 2005/06 31.4 24.2 5.4 1.7 39.9 30.4 21.2 8.5 54.4 46.0 7.1 1.4 74.0 9.7 13.4 2.9
PRC 1992/93 42.9 39.6 2.6 0.6 53.2 26.4 16.6 3.8 59.4 56.5 2.6 0.2 76.7 8.7 11.9 2.8 2005/06 25.8 20.1 4.2 1.5 35.5 33.9 22.2 8.3 56.6 48.6 7.0 0.9 73.7 8.9 14.8 2.6
Hong Kong, China
1992/93 40.6 31.9 6.9 1.8 44.0 24.2 26.1 5.7 57.3 48.8 6.7 1.8 77.5 7.1 11.8 3.6 2005/06 41.7 22.7 13.8 5.3 43.6 18.8 27.5 10.1 72.2 62.3 7.1 2.8 82.0 5.4 9.7 2.8
Korea 1992/93 31.4 18.1 11.0 2.3 46.6 29.9 16.8 6.7 16.9 10.4 5.6 0.9 54.0 22.4 19.8 3.8 2005/06 40.2 31.1 6.9 2.2 47.1 23.0 20.1 9.9 34.9 27.9 6.1 0.9 65.1 14.8 16.6 3.5
Taipei,China 1992/93 36.9 25.9 10.1 0.9 44.3 33.0 17.4 5.3 19.1 10.8 7.4 0.9 55.3 23.2 16.7 4.8 2005/06 51.3 41.9 8.2 1.2 56.8 22.3 14.2 6.7 33.0 24.0 8.4 0.5 69.0 15.1 12.8 3.1
Southeast Asia (SEA)
1992/93 31.1 12.6 17.4 1.1 41.0 31.8 22.7 4.5 39.6 19.1 19.5 1.0 66.4 12.7 16.5 4.4 2005/06 37.5 19.0 15.9 2.6 46.5 27.0 19.0 7.6 58.2 30.5 25.4 2.2 74.7 9.1 12.7 3.5
Indonesia 1992/93 33.5 15.6 16.4 1.5 48.9 22.9 23.9 4.3 44.9 20.2 24.2 0.5 66.1 9.6 20.3 4.0 2005/06 34.7 15.2 17.7 1.8 46.6 24.4 21.8 7.1 70.0 28.0 39.5 2.5 83.1 3.6 10.4 2.9
Malaysia 1992/93 40.1 8.3 31.2 0.5 47.7 31.3 17.6 3.4 43.0 17.2 25.0 0.8 69.6 13.0 13.5 4.0 2005/06 36.6 14.6 19.8 2.3 44.2 35.5 12.8 7.4 65.2 30.0 33.8 1.5 78.7 7.4 11.3 2.6
Philippines 1992/93 10.9 6.6 4.0 0.3 20.0 54.4 22.9 2.8 37.3 25.4 11.1 0.7 66.4 14.9 13.8 4.9 2005/06 37.5 28.0 9.0 0.5 50.2 29.8 16.1 4.0 56.7 34.5 20.3 1.9 77.6 7.8 11.9 2.7
Singapore 1992/93 34.1 17.4 14.9 1.8 39.5 31.7 22.9 5.9 39.2 16.4 21.4 1.4 64.4 15.8 15.3 4.5 2005/06 48.2 25.2 18.1 4.9 53.1 17.7 22.5 6.8 49.7 27.4 19.3 3.1 62.9 16.0 16.3 4.7
Thailand 1992/93 20.3 9.3 10.0 0.9 34.6 35.3 25.7 4.4 30.3 18.9 10.3 1.1 64.8 10.5 19.6 5.0 2005/06 36.4 20.8 13.5 2.0 47.8 24.9 17.7 9.6 48.6 27.7 19.1 1.8 75.6 7.5 13.0 3.9
Viet Nam 1992/93 10.5 6.9 3.4 0.2 33.7 0.7 59.7 5.9 67.5 41.6 24.8 1.1 84.6 0.4 13.0 2.0 2005/06 13.3 8.4 4.5 0.3 23.8 35.0 35.1 6.1 73.4 49.1 22.3 1.9 86.1 3.8 8.0 2.1
ADBI Working Paper 122 Brooks and Hua
28
(d) Manufactures: Final (continued) South Asia
(SA) 1992/93 16.6 9.3 4.6 2.7 23.4 30.3 40.4 5.9 31.6 20.8 7.0 3.8 45.2 9.9 38.5 6.3 2005/06 19.0 11.8 5.5 1.7 20.8 33.2 36.0 9.9 47.7 31.5 12.1 4.1 53.3 9.7 30.6 6.3
India 1992/93 18.6 9.2 5.9 3.5 26.0 28.6 38.7 6.7 18.8 14.5 4.2 0.2 27.9 13.7 50.4 8.0 2005/06 22.5 13.9 7.3 1.4 24.7 31.4 32.0 11.8 40.6 29.1 11.1 0.3 45.3 11.6 36.2 6.9
Sri Lanka 1992/93 4.2 2.1 1.7 0.4 8.8 50.2 38.9 2.1 60.5 34.4 15.7 10.4 74.8 2.6 19.3 3.2 2005/06 6.2 1.1 1.2 3.9 7.7 47.2 41.6 3.5 70.8 29.5 18.1 23.2 77.1 2.8 17.3 2.8
Bangladesh 1992/93 5.1 2.2 1.7 1.2 6.5 42.2 47.4 3.9 69.2 40.5 11.3 17.4 79.5 4.5 13.9 2.1 2005/06 4.3 1.7 1.4 1.1 5.1 33.3 57.7 3.9 79.1 48.7 16.5 13.8 85.1 2.6 9.7 2.5
Pakistan 1992/93 21.7 16.2 3.6 1.9 30.7 22.2 41.4 5.7 25.2 18.5 6.0 0.6 50.1 8.3 35.0 6.6 2005/06 17.3 14.8 1.3 1.2 18.4 37.7 35.8 8.1 48.2 32.7 11.3 4.1 57.7 9.0 25.5 7.9
(e) Processed Foods Year Exports Imports DAC NEA SEA SA Asia NAFTA EU15 ROW DAC NEA SEA SA Asia NAFTA EU15 ROW
Developing Asia
(DAC)
1992/93 25.1 12.9 10.5 1.7 65.3 15.0 16.3 3.4 44.0 21.8 19.8 2.4 51.6 16.5 10.1 21.7
2005/06 26.4 15.3 10.2 0.9 57.5 20.1 16.8 5.7 41.0 21.9 15.7 3.4 46.2 15.8 9.1 28.9
Northeast Asia (NEA)
1992/93 24.0 15.4 8.2 0.4 78.0 11.0 8.4 2.6 41.9 25.8 15.2 1.0 52.0 21.4 7.9 18.7 2005/06 25.1 17.2 7.5 0.4 67.9 16.3 10.9 4.9 37.9 25.1 11.2 1.6 45.5 19.4 9.1 26.0
PRC 1992/93 32.7 24.1 7.8 0.8 72.6 10.8 12.8 3.8 74.8 62.4 11.8 0.7 77.1 7.8 5.2 10.0 2005/06 24.3 17.1 6.7 0.5 67.0 16.1 12.1 4.8 31.3 15.4 12.7 3.3 37.3 22.5 9.8 30.5
Hong Kong, China
1992/93 44.9 32.2 12.4 0.3 63.1 20.8 11.6 4.5 46.3 30.1 14.7 1.5 60.3 18.1 8.3 13.2 2005/06 62.4 52.8 9.4 0.2 66.4 17.7 8.1 7.8 44.0 32.4 10.6 1.1 56.5 12.8 8.0 22.7
Korea 1992/93 9.7 3.7 5.8 0.2 78.8 13.6 5.6 2.0 31.2 11.3 19.5 0.3 35.1 36.6 7.0 21.3 2005/06 19.5 12.6 6.7 0.2 70.8 18.9 6.0 4.4 40.8 31.8 8.3 0.7 45.0 21.0 10.0 24.0
Taipei,China 1992/93 13.8 4.4 9.3 0.1 89.1 8.1 2.1 0.7 26.7 11.7 14.5 0.5 36.9 22.7 8.8 31.6 2005/06 29.9 13.3 16.6 0.0 75.4 16.3 2.9 5.4 32.9 16.7 15.4 0.9 41.4 22.9 8.1 27.5
Southeast Asia (SEA)
1992/93 26.9 11.9 13.1 1.9 57.6 18.5 20.5 3.4 49.9 19.0 27.7 3.2 54.9 9.0 13.1 23.0 2005/06 29.0 14.9 12.9 1.2 52.1 23.2 18.8 5.9 50.4 20.8 25.5 4.1 52.6 9.8 10.3 27.3
Indonesia 1992/93 24.8 9.5 11.5 3.9 63.5 14.8 19.4 2.3 33.4 13.5 19.5 0.4 36.7 11.9 20.2 31.1 2005/06 32.1 11.1 16.6 4.3 56.1 22.0 18.8 3.1 49.8 21.8 26.1 1.8 50.7 10.1 8.4 30.8
ADBI Working Paper 122 Brooks and Hua
29
(e) Processed Foods (continued)
Malaysia 1992/93 68.3 9.7 54.7 3.8 78.9 4.2 12.4 4.5 53.0 11.5 36.6 4.9 55.6 6.2 10.4 27.7 2005/06 54.3 12.2 38.4 3.7 60.0 14.8 19.7 5.5 55.8 22.5 26.1 7.2 56.4 8.0 7.5 28.1
Philippines 1992/93 13.1 10.1 2.8 0.2 52.2 31.0 14.9 1.9 19.3 10.4 8.7 0.2 23.9 16.5 20.8 38.8 2005/06 25.4 18.2 7.1 0.1 53.0 28.3 15.5 3.3 43.4 18.3 20.6 4.5 44.3 15.4 11.7 28.6
Singapore 1992/93 48.9 35.2 10.6 3.1 64.5 12.4 17.1 6.0 61.3 22.3 34.4 4.6 64.9 8.4 7.7 19.0 2005/06 54.8 24.3 29.2 1.3 70.2 8.4 9.9 11.5 52.6 14.3 36.2 2.1 54.7 7.6 9.4 28.2
Thailand 1992/93 17.9 9.9 7.2 0.8 49.1 21.5 25.8 3.6 47.6 28.9 17.3 1.3 59.0 8.6 18.3 14.0 2005/06 22.1 13.6 8.2 0.3 49.5 23.4 20.8 6.3 43.9 24.3 16.1 3.5 50.9 10.7 15.0 23.4
Viet Nam 1992/93 42.5 26.6 9.6 6.3 84.8 2.1 9.3 3.9 35.9 14.8 21.1 0.0 46.8 2.1 37.2 13.8 2005/06 21.2 16.0 4.8 0.3 45.1 27.0 19.2 8.7 52.7 29.8 18.1 4.7 54.7 9.8 13.8 21.6
South Asia (SA)
1992/93 21.2 4.9 8.4 7.9 40.3 17.2 35.2 7.2 31.3 2.9 17.8 10.6 32.2 15.0 13.9 39.0 2005/06 20.2 7.2 11.3 1.8 30.1 23.8 37.2 8.9 28.1 4.9 10.8 12.4 28.2 13.4 5.3 53.1
India 1992/93 21.3 4.9 10.1 6.2 44.0 18.0 31.6 6.5 29.2 3.2 18.6 7.4 29.3 47.1 11.4 12.3 2005/06 21.8 7.3 12.1 2.4 32.0 24.7 34.8 8.5 11.9 2.1 9.4 0.3 12.0 18.1 3.3 66.7
Sri Lanka 1992/93 14.9 4.6 4.3 6.0 29.3 7.1 44.7 18.9 34.4 1.9 16.0 16.4 35.9 3.2 22.5 38.5 2005/06 9.8 6.8 12.0 28.7 12.1 14.7 46.3 26.8 41.5 6.7 11.7 23.0 41.5 2.1 7.9 48.5
Bangladesh 1992/93 18.7 6.3 6.4 6.1 30.9 32.1 32.7 4.4 28.6 0.9 13.4 14.3 28.6 1.1 19.7 50.6 2005/06 11.5 4.0 2.8 4.7 15.3 33.9 49.1 1.7 44.3 5.3 7.2 31.8 44.4 7.7 5.8 42.2
Pakistan 1992/93 23.1 4.4 3.4 15.3 32.6 9.4 55.0 3.0 31.3 4.5 19.5 7.3 33.0 6.8 8.0 52.2 2005/06 51.4 10.6 13.4 27.3 53.7 7.1 34.8 4.5 52.8 12.7 19.5 20.5 53.1 12.2 11.2 23.4
Notes: 1. Developing Asian countries (DAC) + Japan
2. Lao PDR, Cambodia, Myanmar, and Brunei Darussalam.
Source: Athukorala 2008, compiled from the UN COMTRADE Database

ADBI Working Paper 122 Brooks and Hua
29
1. Recent Patterns in Asia’s Trade Flows Key characteristics of Asia’s trade are changing over time, with implications for the strength of shock transmission and the mechanisms through which that transmission operates. Notable among these characteristics are the trade content, costs (as influenced by length in time, distance, and their interaction), and reliability of delivery. The role of production fragmentation and the significance of the PRC in this process have important implications.
Closely related to changes in the composition of trade have been changes in transportation technology, most notably in air freight and containerization. Multimodal shipping and improvements in logistics services have facilitated trade expansion to more destinations in less time, often at lower monetary cost (Brooks and Hummels forthcoming 2009). Hummels (2007) estimated that increasing the share of containerized trade lowers shipping costs from 3% to 13%. However, these savings were outweighed in the 1970s by sharp increases in fuel and port costs, and again in recent years by increasing fuel costs and port congestion in countries with rapidly growing trade volumes
Following changes in technology, production, and consumption, the balance of trade between merchandise and services is shifting. More generally, the weight-to-value ratio of trade is declining, both within merchandise trade and in trade more generally. The telecommunications and internet revolution has led to growing trade in information and technology, services outsourcing, and migration of highly skilled professionals. The declining weight-to-value-of-trade ratio is a primary factor in influencing transport modal choice, length and destination of trade flows, and production processes.
2. Distance and Destination Roughly a quarter of world trade takes place between countries sharing a common border and half of world trade occurs between partners less than 3,000 kilometers apart (Berthelon and Freund 2004). For air shipping, advances in technology have propelled a sharp decline in costs: average revenue per ton-kilometer shipped dropped by a factor of 10 between 1955 and 2004 (Hummels 2007). As air transport costs drop relative to ocean transport costs, long distance trade becomes relatively more attractive, and diversification of export destinations becomes broader. As the weight-to-value ratio of traded goods becomes lower (and, similarly, for the ad valorem share of trade costs in delivered goods prices) this pattern is reinforced.
Asia’s trade is expanding at both the extensive and intensive margins. Consider PRC exports, where the number of shipments and mean shipment size are growing rapidly, as are 90th percentile shipments, while median shipment sizes are falling. Although the PRC has experienced tremendous growth in new shipments, these tend to be very small. At the same time, established flows that were already sizeable in 1995 have grown larger still, increasing the mean shipment size. The pattern across other countries is similar—median shipment sizes are falling while mean shipment sizes are rising (or in some cases, both are falling, but medians are falling faster) (Hummels forthcoming 2009). Diversification is rising at the extensive margin, but susceptibility to shocks is not necessarily declining due to the growth at the intensive margin.
Still, the development of new, small trade flows is encouraging. Besedes and Prusa (2003, 2004) used survival analysis to show that new trade flows suffer high failure rates, but those that do survive go on to increasing trade shares. Creative destruction is alive and well in international trade.
3. Production Fragmentation As discussed above, greater trade is positively correlated with greater synchronization of business cycles. But when trade is indirect, involving multiple countries in the production of a final good, the relationship becomes more complex. Recent decades have seen rapid growth

ADBI Working Paper 122 Brooks and Hua
30
in international vertical specialization, a process by which firms separate the stages of production (research and development, component production, and assembly) across countries according to comparative advantage. This production sharing accounted for more than one-third of world export growth between 1970 and 1995 (Hummels, Ishii, and Yi 2001) and may have deepened the linkages between economies.
In an examination of US-Mexico trade involving maquiladora production fragmentation, Burstein, Kurz, and Tesar (2008) focused on manufacturing industries which have higher trade shares; they showed that increasing trade has a bigger impact on GDP correlations in the presence of production-sharing trade. The authors found that business cycles are more synchronized between pairs of countries with a higher share of international trade in inputs utilized in the production of vertically integrated goods than between pairs of countries where trade was dominated by inputs used to produce horizontally differentiated goods. They interpreted the difference between these two correlations as evidence that firms engaging in production sharing exhibit a lower elasticity of substitution between home and foreign inputs relative to other firms. This complementarity in the production of vertically integrated goods dampens substitution effects stemming from aggregate shocks to relative costs across countries. A key assumption in this model is that the elasticity of substitution between home and foreign intermediate goods is relatively lower if there is a production-sharing arrangement between locations.
Trade related quantity effects are accompanied by changes in relative prices, but as might be expected, the effects are not symmetric. Bergin, Feenstra, and Hanson (2007) demonstrated the higher volatility of production-sharing industries in host economies relative to source economies.
Although production-sharing arrangements across Asia have given a strong impetus to regional integration since the 1990s, such integration is structurally linked to the business networks of multinational corporations. Decomposition of changes in trade shows that more than 70% of intra-Asian trade consists of intermediate goods used in production, and of this, half is driven by final demand outside Asia. Consequently, about 61% of total Asian exports (instead of 43% of total exports, as indicated by the more aggregated data) is eventually consumed in the G3 (ADB 2007).
Developing Asia’s rapid growth in intra-regional trade over the past decade or so, driven largely by trade in parts and components within regional production networks, takes place mostly among the region’s high-performing economies (and feeds back into that high performance), with much of it linked to the PRC. Trade in final goods originating in these production networks is driven predominantly by extra-regional demand. In other words, extra-regional trade is still essential for continued growth dynamism in East Asia, both including and excluding Japan (Athukorala 2008).
For all East Asian countries, the share of components in both intra-regional exports and imports have increased at a much faster rate than in extra-regional exports and imports. These patterns are in sharp contrast to those observed for NAFTA and the EU15 (as well as total global trade). In both regions, the shares of intra-regional trade in total manufacturing trade (on both the export and import sides) and in component trade imports remain broadly similar in magnitude.
Athukorala (2008) demonstrated East Asia’s heavy reliance on international exchange based on production fragmentation. In 2005/2006 intra-regional exports accounted for 40% of total manufacturing exports. The comparable figure for intra-regional component exports was 60% of total component exports. The intra-regional share in component imports is even larger. These component import and export shares are much higher than those in NAFTA and the EU15 (as well as in overall global trade). Moreover the intra-regional shares in total component imports and exports grew faster between 1992/1993 and 2005/2006 than those in total imports and exports. The increase in component intensity has been particularly noticeable in Southeast Asia’s trade with other developing East Asia economies, the PRC in

ADBI Working Paper 122 Brooks and Hua
31
particular. Korea and Taipei,China are also involved in sizable cross-border trade with other countries in the region.
Kimura, Takahashi, and Hayakawa (2007) found that geographical distance penalizes machinery parts and components trade much less in East Asia than in Europe. This implies that service link costs for fragmentation are substantially lower in East Asia than in Europe, contributing to large differences between the two regions in the development of international production and distribution networks, and differences in the transmission of business cycle influences.
IV. IMPLICATIONS OF TRADE DEVELOPMENTS FOR FUTURE LINKAGES
Countries that engage in production sharing are more likely to experience common shocks, as they specialize in similar industrial sectors. Technological shocks may also be more easily transmitted from one country to another when firms operate transnationally. Moreover, if production sharing tends to be concentrated in sectors that are more affected by cyclical fluctuations such as consumer goods or auto parts and production, the transmission will be amplified. Burstein, Kurz, and Tesar (2008) found that the extent of US-Mexico production sharing and its connection to the business cycle highlights three noticeable effects. First, trade flows associated with production sharing are more correlated with US manufacturing output than are trade flows that are not associated with production sharing. Second, for a large cross section of countries that host US affiliates, those with larger production sharing trade links with the US also have higher manufacturing output correlations with the US. Third, for those countries, the extent of production sharing in trade is at least as important as the total volume of trade in accounting for a positive, bilateral synchronization of manufacturing output between the countries.
In the case of Asia, the importance of production sharing, largely connected with the PRC, suggests higher intra-regional correlations than in other regions. It also points to growing transmission linkages between the PRC and other Asian countries, particularly those in Southeast Asia. Roughly 9.5% of PRC exports in 2000 consisted of imported inputs, up from 2.2% in 1980. The importance of vertical specialization is the greatest for Malaysia; Philippines; Singapore: Taipei,China: and Thailand; whose exports include from 26% to 37% foreign content (Hummels forthcoming 2009).
While production fragmentation related business cycle synchronization between developing Asia and the G3 has strengthened, the relationship between Asia’s private domestic demand and Asian imports has weakened, despite rising intra-regional trade. ADB (2007) showed that the correlation between Asia’s private demand and its imports has trended downward. Therefore, the value added in production sharing appears to be strengthening linkages through exports to shock-affected markets, while weakening shocks passing through the import transmission mechanism. More recent data, including oil and other commodity price shocks, may help to test this apparent dichotomy.
1. Timing Depending on its nature, strong regional economic integration could spread shocks rapidly across regional economies or help dampen shock transmission. Some trading linkages have their full effect within the lifetime of a typical business cycle. Others, influenced by fixed costs, irreversible investments, or liberalizing policy reforms, play out over a longer horizon. Changes in the lengths of these impacts and the transmission mechanisms by which they operate may affect the synchronization of business cycles. For example, air shipments arriving within a few days (or even overnight) may transmit shocks (and conversely, transmit mitigating influences) much more quickly than sea shipments averaging several weeks and frequently involving much greater variability in the amount of time the shipment process takes.

ADBI Working Paper 122 Brooks and Hua
32
As the composition of trade has shifted from commodities to more complex manufactured goods and services, sensitivity to the length of time for delivery increases, as does pressure on manufacturers to adapt production patterns and processes quickly and flexibly. Some factors such as the location of plants and assembly lines do not respond to shocks at business cycle frequencies, maintaining production chain reliance on inputs from a particular source. Other factors prominent in fragmented production, such as the adaptation of production processes and substitutability of local for imported inputs, are more likely to be responsive in the medium-term. When shocks are large and persistent (for example, during trade liberalization reforms or changes in taxation of foreign corporations), footloose multinational corporations may shift their production operations across countries. These relocations are mostly at lower frequencies in time, at which shocks are more easily managed, mitigating (or in some cases, compounding) higher frequency business cycle synchronization between countries.
Rising flexibility in the time involved for these substitution effects (timing in shipping, locating, and adapting production) to operate can imply that an increase in international trade may lead to lower international business cycle correlations. The exact extent of coupling and decoupling will depend on the nature of the shock, the degree of production sharing between the economies involved, the responsiveness of economic agents to market signals and other information, and the flexibility of adjustments.
As fragmented production processes respond to and provoke changes in spatial and temporal relations, business cycle transmission mechanisms both between economies and over time are affected. Similarly, the need to respond to uncertainty in a timely way creates an important force for agglomeration, locating firms producing industrial inputs near the downstream firms that use those inputs. Increased use of air freight to backstop uncertainties in sea shipment and port congestion has been entering the production-location equation, affecting the agglomeration/fragmentation balance. Location and relocation effects are also influencing regional trends. In Asia, the huge market and production platform of the PRC has had an especially strong effect since its openness to external markets and suppliers has increased.
2. PRC Mediation In the two decades spanning 1985 to 2005, the PRC’s exports grew from US$27 billion to US$762 billion and its imports from US$43 billion to US$660 billion. The basic pattern of PRC trade can be characterized as increasing exports to the global economy, while increasing imports of intermediate goods from the rest of Asia. Both before and after the Asian crisis, the average output correlation for countries within Asia, excluding the PRC, was higher than that for Asia including the PRC, reflecting the country’s relative independence from the cyclical behavior of the rest of the region. Interestingly, however, the average correlation grew much faster among Asian economies including the PRC than excluding the PRC, indicating that the PRC business cycle is evolving to increasingly move in tandem with the rest of Asia (ADB 2007).
Asian business cycles are much more synchronized with those of the G3 in the postcrisis period than precrisis. To the extent that the PRC functions as an assembly and production center for the rest of Asia, the trade linkages are more direct and stronger between the PRC and members of the rest of Asia than the relationships between themselves. Indeed, for the 5-year period from 2002–2006, the average correlation for Asia including the PRC was higher than that of Asia (excluding the PRC). The correlations of the PRC cycle with both regional and international economies are low, although both correlations have become positive in the postcrisis period, reflecting the increasing integration of the PRC with the regional and global economies.
Hummels (forthcoming 2009) found that most, but far from all, PRC export growth between 1995 and 2005 came from an increase in the number of unique shipments, rather than from

ADBI Working Paper 122 Brooks and Hua
33
an increase in average value per shipment. He contrasted this mixed growth with Thailand and Malaysia, where almost all growth arose from an increase in the number of shipments rather than an increase in the average shipment value. Conversely, almost all growth for Hong Kong, China and Japan came from an increase in average shipment size rather than an increase in the number of unique shipments. Thus, while the average PRC export shipment is rising in value, and even more so in Hong Kong, China and Japan, raising the potential for strengthened international transmission, the same may be less true for Thailand or Malaysia.
The role of the PRC in assembling components imported from other parts of Asia and exporting the final products to G3 markets places it in a unique position to intermediate shocks emanating from the G3 toward developing Asia. Exchange rate policy and use of foreign reserves are commonly discussed channels for such action, but trade and production adjustments to the structural links may have more lasting effects.
V. CONCLUSIONS
The fast-growing Asian region and its potentially enormous economic power raise the hope that its own growing demand may help it both weather the adverse consequences of a US slowdown and ease the impact of a global downturn. At the same time, trade is growing, and growing lighter; exports are expanding primarily by reaching new markets with smaller shipments; and fragmented production networks are becoming the norm. All of these changes put a premium on speed, flexibility, and information, increasing the potential for the transmission of shocks between trading partners.
Much intra-Asian trade is conducted by multinational corporations and their affiliates in the form of intra-firm and intra-industry trade that involves fragmentation of production. The production networks in Asia respond to demand from consumers outside the region rather than being independent of them. Therefore, the G3 economies are still an important source of external demand for Asia, and the region remains vulnerable to shocks from major trading partners. Analysis of business cycle comovements, both within Asia and between the G3 and Asia, and examination of production fragmentation structures generally affirms the linkage between growth in the G3 and Asia.
There is clear evidence pointing to increasing business cycle comovements among Asian economies, particularly between the PRC and the rest of Asia. But there is no mutual exclusivity between intra- and inter-regional economic integration—it is not one or the other. In fact, deepening regional integration appears to reinforce Asia’s integration into the world economy. For this reason, Asia remains exposed to cyclical downturns in other regions.
In recent years, there has been little or no evidence that Asia has decoupled from G3 business cycles. In the post-crisis period, strengthening regional ties appear to reinforce business cycle comovements between Asia and the G3, despite the fact that intra-regional trade and financial linkages have, in general, risen more rapidly than extra-regional ones. Underlying this regional interdependence is the structure of rising intra-Asian trade, which is centered on the PRC as a production platform. At the center of multinational corporation regional supply networks, the PRC is important in boosting both intra- and inter-regional trade. But this central role has deepened economic interdependence between the PRC and the rest of Asia as well as between the PRC and the G3.
An important task for future research is to assess the robustness of these observations using detailed data on production sharing, including arms-length transactions, and with more information on the extent of substitutability between production processes and inputs from alternative sources. Greater analysis of the extent to which shock transmission occurs asymmetrically between import and export channels may also help to enhance our understanding of how Asian trade affects global linkages.

ADBI Working Paper 122 Brooks and Hua
34
REFERENCES
ADB. 2007. Asian Development Outlook 2007. Manila.
Athukorala, P-C., and H. Hill 2008. Asian Trade and Investment: Patterns and Trends. Research Workshop Program on Emerging Trends and Patterns of Trade and Investment in Asia. Ninth Global Development Network Conference, Brisbane.
Athukorala, P-C. 2008. Recent Trends in Asian Trade and Implications for Infrastructure Development. Background paper for Flagship Study on Infrastructure and Regional Cooperation. ADBI: Tokyo.
Baxter, M., and M. A. Kouparitsas. 2005. Determinants of Business Cycle Comovement: A Robust Analysis. Journal of Monetary Economics 52: 113–157.
Besedes, T., and T. Prusa. 2003. On the Duration of Trade. National Bureau of Economic Research (NBER) Working Paper 9936. NBER.
Besedes, T., and T. Prusa. 2004. Surviving the US Import Market: The Role of Product Differentiation. NBER Working Paper 10319. NBER.
Bergin, Paul R., Feenstra, Robert C. and Hanson, Gordon H. Outsourcing and Volatility. NBER Working Paper No. W13144. NBER.
Berthelon, M., and C. Freund. 2004. On the Conservation of Distance in International Trade. World Bank Policy Research Working Paper 3293. World Bank.
Brooks, D.H. and D. Hummels. Forthcoming 2009. Infrastructure’s Role in Lowering Asia’s Trade Costs: Building for Trade, Cheltenham, UK: Edward Elgar Publishing.
Burstein, A., C. Kurz, and L. Tesar. 2008. Trade, Production Sharing, and the International Transmission of Business Cycles. NBER Working Paper 13731. NBER.
Eichengreen, B. 2006. The Blind Men and the Elephant. Issues in Economic Policy No 1. The Brookings Institution.
Frankel, J. A., and A. K. Rose. 1998. The Endogeneity of the Optimum Currency Area Criteria. The Economic Journal 108: 1009–1025.
Gruben, W. C., J. Koo, and E. Millis. 2002. How Much Does International Trade Affect Business Cycle Synchronization? Research Department Working Paper 0203. Dallas: Federal Reserve Bank of Dallas.
Hummels, D., J. Ishii, and K.-M. Yi. 2001. The Nature and Growth of Vertical Specialization in World Trade. Journal of International Economics 51: 75–96.
Hummels, D. 2007. Transportation Costs and International Trade in the Second Era of Globalization. Journal of Economic Perspectives 21: 131–154.
———. Forthcoming 2009. Trends in Asian Trade: Implications for Transport Infrastructure and Trade Costs. In Infrastructure’s Role in Lowering Asia’s Trade Costs: Building for Trade, edited by D. H. Brooks, and D. Hummels. Cheltenham: Edward Elgar Publishing.
International Monetary Fund (IMF). 2007. Decoupling the Train? Spillovers and Cycles in the Global Economy. World Economic Outlook: 121–160.
Kose, M. A., and K.-M. Yi. 2001. International Trade and Business Cycles. American Economic Review 91: 371–375.
Kose, M. A., E. S. Prasad, and M. E. Terrones. 2003. How Does Globalization Affect the Synchronization of Business Cycles? American Economic Review 93: 57–62.

ADBI Working Paper 122 Brooks and Hua
35
Kose, M. A., and K.-M. Yi. 2006. Can the Standard International Business Cycle Model Explain the Relation between Trade and Comovement? Journal of International Economics 68: 267–295.
Kuroda, H. 2004. The “Nixon Shock” and the “‘Plaza Agreement”: Lessons from Two Seemingly Failed Cases of Japan's Exchange Rate Policy. China & World Economy 12: 3–10.
Moneta, F., and R. Ruffer. 2006. Business Cycle and Synchronisation in East Asia. European Central Bank Working Paper No. 671. European Central Bank, Frankfurt.
Rana, P. B. 2007a. Economic Integration and Synchronization of Business Cycles in East Asia. Journal of Asian Economics 18: 711–725.
Rana, P. B. 2007b. Trade Intensity and Business Cycle Synchronization: The Case of East Asia. Working Paper Series on Regional Economic Integration No. 10. ADB, Manila.
Shin, K. 2008. Global and Regional Shocks: Challenges to Asian Economies. ADBI Discussion Paper No. 120. Tokyo: Asian Development Bank Institute.
Shin, K., and Y. Wang. 2004. Trade Integration and Business Cycle Synchronization in East Asia. Asian Economic Papers 2: 1–20.
Tang, K.K. 1998. Economic Integration of the Chinese Provinces: A Business Cycle Approach. Economics Division Working Papers 98/1. Australian National University.