east africa 2016 business and market outlook
DESCRIPTION
Outlook of 2016 economy of Kenya.cytonn.comTRANSCRIPT

Cytonn 2016 Business and Market Outlook11th January, 2016

22
Table of Contents
I. Introduction to Cytonn
II. Global Markets Review
III. Kenya Macroeconomic Review
IV. Fixed Income Market Review and Outlook
V. Kenya Equities Review and Outlook
VI. Private Equity Review and Outlook
VII. Real Estate Review and Outlook

33
I. Introduction to Cytonn

44
Client Focus drives the TeamCytonn Investments Management Limited Team Members
2011
2012
2013

55
Introduction to Cytonn InvestmentsCytonn Investments is an independent investments management company
2011
2012
2013
• Our mission is that “we work to deliver innovative & differentiated financial solutions thatspeak to our clients needs”
• Cytonn Investments is differentiated in several respects:
1. Independence & Investor Focus: Cytonn is solely focused on serving the interest of clients,which is best done on an independent investment management platform to minimize conflicts ofinterest
2. Alternative Investments: Specialized focus on alternative assets - real estate, private equity,and structured products
3. Partnerships with Global Institutional Investors: Such as Taaleritehdas of Finland
4. Strong Alignment: Every staff member participates in ownership. When clients do well, the firmdoes well; and when the firm does well, staff do well

66
Cytonn’s Corporate Structure – Kshs 50 bn Under Mandate
• Financial Services• Education • Technology
• Diaspora platform connecting investors in the diaspora with opportunities in the East African Region
• Development affiliate providing investment grade real estate development solutions
Cytonn Investments
Cytonn Investments
LtdCytonn Real
EstateCytonn
DiasporaCytonn
Investments LLC
• Independent investment management company, serving HNW & institutional clients
• US advisory and investment management company
Kenya United States
Private Equity

77
Board of DirectorsThe board is comprised of 9 members from diverse backgrounds, each bringing unique skill-sets
Professor Daniel Mugendi Njiru serves as the Chairman of the Board of Directors
Edwin H. Dande,Managing Partner & CEO
Elizabeth N. Nkukuu,Partner & CIO
Patricia N. Wanjama,Partner & Head of Legal
Prof. Daniel Mugendi,Chairman
Antti – Jussi Ahveninen,Non-executive Director
Madhav Bhalla,Non-executive Director
Nasser Olwero,Non-executive Director
James Maina,Non-executive Director
Mike Bristow,Non-executive Director

88
Strong Management Team With Diverse, Global & Local ExperienceDiverse experience in investments, finance, real estate and legal, with deep commitment to client servicing*
Elizabeth N. Nkukuu,Partner & CIO
Shiv Arora,Head of Private Equity Real Estate
Patricia N. Wanjama,Partner & Head of Legal
Johnson Denge,Real Estate Services Manager
Beverlyn Naliaka,PR & Communication
Edwin H. Dande,Managing Partner & CEO
Maurice Oduor,Investment Manager
*For Bios of the Team, visit http://cytonn.com/the-team
Boniface W. Gichimu,Finance Manager
Robert M Mwebi,Project Manager
Winfred Ndung'u,Business Administration Manager
Gaurang ChavdaHead of Private Wealth Management

99
Cytonn Investment SolutionsWe offer differentiated investment solutions in four main areas
2011
2012
2013
High Yield Solutions
� The Team’s expertise and market knowledge enable us to offer investors higher yields than the
market average� Regular credit analysis, quick dealing capability and the large banking spread in the market
allow the team to capitalize on investment opportunities
� Our unique strategic partnerships with Cytonn Real Estate, our development affiliate, enables us
to find, evaluate, structure and deliver world class real estate investment products for investors� Our platform connects global capital seeking attractive return with institutional grade
development opportunities in the East African region
� Cytonn seeks to unearth value by identifying potential companies and growing them through
capital provision and partnering with their management to drive strategy� We primarily invest in the Financial Services, Education and Technology sectors
Private Regular
Investment Solutions
Private Equity
Real Estate Investment Solutions
� We understand that investors have varying financial goals. Our highly customized and simple to
understand investment products will enable you to achieve your investment objective� We offer solutions to both local investors, and those in the diaspora interested in the
investment opportunities back in Kenya and the region
1010
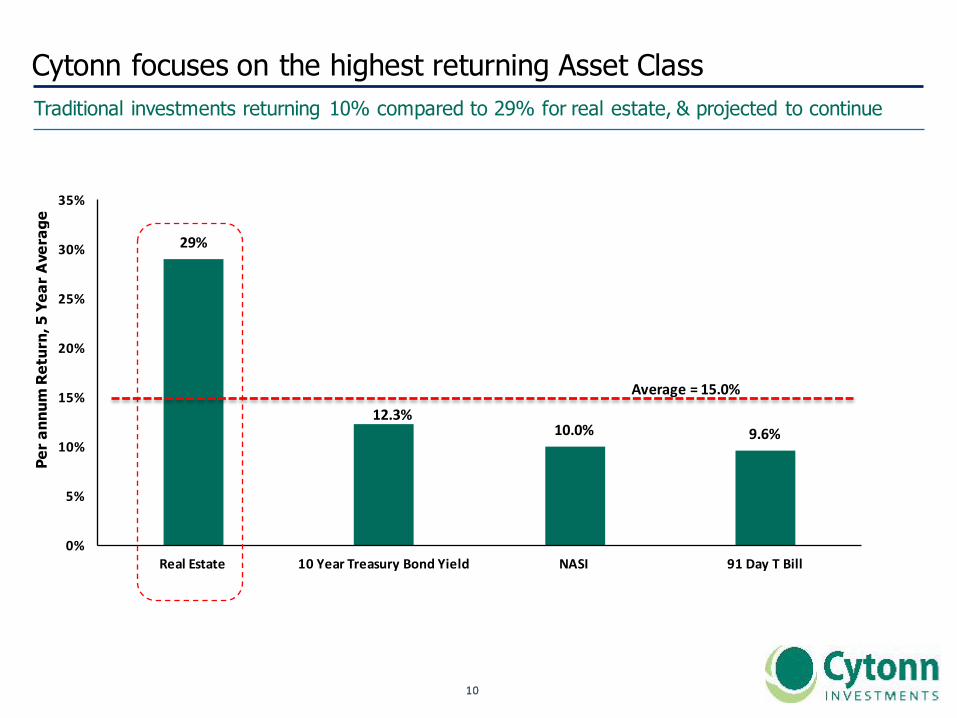
Cytonn focuses on the highest returning Asset ClassTraditional investments returning 10% compared to 29% for real estate, & projected to continue
Per a
nnum
Ret
urn,
5 Y
ear A
vera
ge
29%
12.3%10.0% 9.6%
0%
5%
10%
15%
20%
25%
30%
35%
RealEstate 10YearTreasuryBondYield NASI 91DayTBill
Average =15.0%
1111
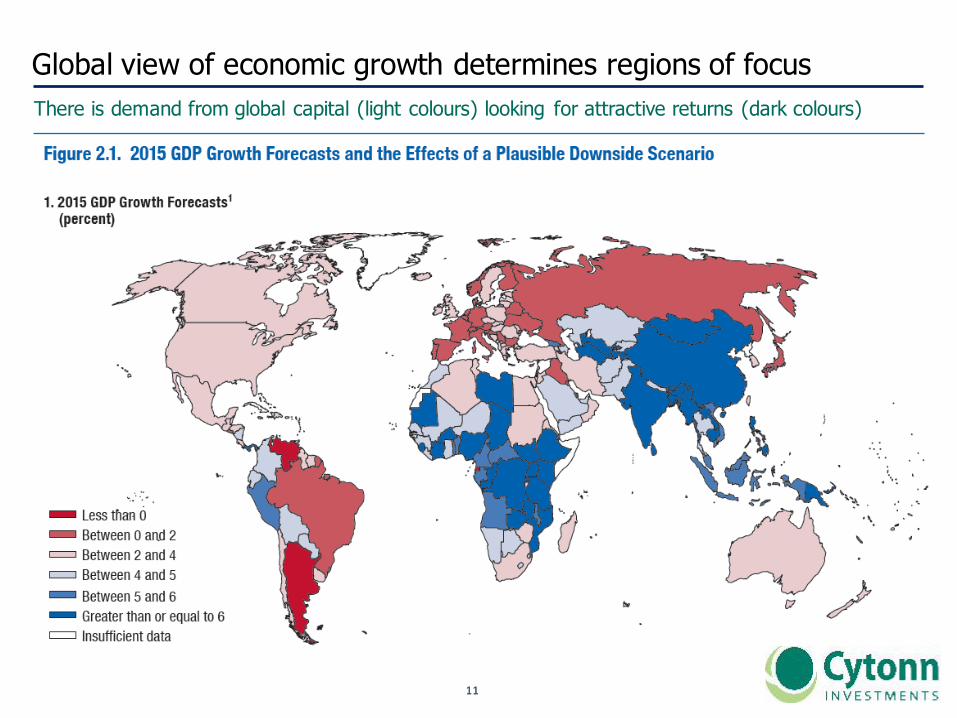
Global view of economic growth determines regions of focusThere is demand from global capital (light colours) looking for attractive returns (dark colours)

1212
Key Themes driving our Property DevelopmentA large housing deficit, growth of the middle class and demographic trends are just a few on the factors driving our thematicinvestments in Real Estate
KEY THEME REAL ESTATE SECTOR PROVIDING EXPOSURE TO KEY THEME
Master Planned Communities
CommercialOffice Parks
CommercialMixed-Use
Suburban Malls
Three Star Hotels
1. Large Housing Deficit P P
2. Growth of Middle Class P P P P P
3. Demographic Trends P P P P P
4. Improved Infrastructure P P P P P
5. Political Decentralization P P P P P
6. Kenya as a Regional Hub P P P P P

1313
Cytonn’s strategy brings three key pillars together
Landowners
1. CreatingJobs
2. GrowingtheEconomy
3. Improvingthestandardsofliving
Development CapabilityFinancing Capability

1414
Deal pipeline overview – 85% to low and mid-income housing
Kshs49BillionDealPipeline
PrimeResidentialandMixed-use15%
Lowtomid-incomeHousing85%
• Masterplanned Development
• Comprehensive Development
• Low to mid-income Modular Housing
• High Density Integrated Mixed-use
• Gated Communities

1515
Kshs 49 billion Deal pipeline details
allvaluesinKshsMillionsunlessstatedProjects Concept ProjectSizeSET1AmaraRidge Gatedcommunity 625.0SituVillage Gatedmasterplannedcommunity 3,050.0TheAlma Middle-classresidentialdevelopment 1,600.0Sub- Total 5,275.0
SET2ProjectMombasa Highdensitymixed-usedevelopment 3,750.0ProjectJuja Middle-classgatedcommunity 3,832.0ProjectMountKenya Masterplanneddevelopment 1,200.0ProjectMavoko Lowtomidincomemasterplannedcity 12,500.0ProjectLukenya Lowtomidincomemasterplannedcity 22,500.0Sub- Total 43,782.0
TOTAL 49,057.0
• Set 1: Real estate projects where the design, concept, agreements and funding are all secured, and have ground broken or in
the process of ground breaking• Set 2: Real estate projects where the Cytonn Real Estate team is in advanced stages of negotiations with the landowners, and
where consultants have been appointed to begin market research and concept design

1616
II. Global Markets Review

1717
An overview of the economic data released during the month of December
Global Market Summary
TradeBalance inUSDbns EuroArea U.S U.K China Japan Kenya
CurrentA/C*(% ofGDP) 2.1% (2.4%) (5.5%) 2.1% 0.5% (6.9%)
TradeBalance** 21.8 (42.4) (4.6) 51.9 3.2 (2.1)
ManufacturingPMI*** 53.2 51.2 51.9 48.2 52.6 55.5
Unemployment Rate 10.5% 5.0% 5.2% 4.1% 3.3% 40.0%
Inflation 0.2% 0.5% 0.1% 1.6% 0.3% 8.0%
GDP Growthrate 1.6% 2.1% 2.1% 6.9% 1.0% 5.8%
CentralBankRate 0.05% 0.5% 0.5% 4.35% 0.10% 11.5%
* Current A/C- is the sum of trade balance, earnings on foreign investments minus payments made to foreign investors and net cash transfers
** Trade Balance- is the difference between a country’s imports and exports
*** PMI- Purchasing Managers Index- economic indicators derived from monthly surveys of private sector companies to show manufacturing output. Above 50 indicates expansion in the sector
Source – KNBS, tradingeconomics

1818
Factors That Will Affect Global Markets in 2016Monetary policy divergence set to disrupt global markets in 2016
1. Monetary Policy Divergence: Globally, the large developed markets are divided by;
i. The direction of monetary policy, as the US tightens by raising rates, and the Eurozone embarks on another phase of
zero rates and quantitative easing, with both policies aimed at spurring growth and inflation in their economies
ii.divided by region and sector, with the greatest signs of recovery in large, consumer driven markets such as the United
States
2. Declining oil prices: The Organization of the Petroleum Exporting Countries (OPEC) meeting in December was a key
highlight in 2015, as members failed to agree on reduction of oil supply. In as much as the decline in oil prices is
driven by over-supply, global demand has faltered in 2015 and showing no signs of recovery in 2016, largely
dominated by reduced Chinese manufacturing output, which has repercussions throughout the world
3. China’s slowdown: A recent report by the IMF estimated that each 1% decrease in China’s investment growth could
reduce global growth by 0.1%, 5 times greater than in 2000, showing the increased dependence on the world’s largest
economy by population. The biggest losers are expected to be (i) Eurozone economies who depend so largely on China
as a market for their manufactured capital goods products and services, (ii) Middle-East and West African countries who
depend on China as one of the largest consumers of oil

1919
Regional OutlooksUS expected to continue on a monetary tightening path
United States:
US economy is strong and expected to remain on the policy tightening path, however (i) tighter financial conditions when it
comes to credit disbursement, (ii) weak global demand, and (iii) the strengthening US Dollar will probably keep GDP growth
in the low 2% area
Eurozone
The Eurozone growth is estimated to come in at 1.5% for 2015, and 2016 growth prospects are looking up on the back of (i)
increased stimulus by the European Central Bank (ECB), (ii) an increase in private investment, (iii) the notable strong growth
in the peripheral countries of Spain and Italy, and (iv) the increase in domestic demand given higher consumer confidence
and falling oil prices, which increase consumption expenditure.
China
China witnessed a significant slowdown in the industrial side of the economy in 2015, a trend that is expected to continue
into 2016, as the economy transitions to a services based economy, causing disinflationary effects on the global economy.
The services sector is expected to account for a much larger share of GDP, driving GDP growth in 2016 to estimates of 6.5%

2020
III. Kenya Macroeconomic Review

2121
Kenya Macroeconomic ReviewThe Political environment is set to have a major impact on the economy in 2016
2011
2012
2013
• 2015 was a year characterized by a challenging macroeconomic environment, which saw GDP growth downgrades by
the IMF, World Bank and the Treasury from 6.9%, 6.0% and 6.9% to 5.6%, 5.4% and 6.0%, respectively
• This growth was ambitious and based on high government spending on infrastructural developments. However, during
the year, the growth was deemed unachievable and hence the respective downgrades
• 2016, being a unique year as it precedes the Kenyan General Elections of 2017, the politics is bound to take the center
stage and be among the key determinants of spending and policy
• We expect high level of government activities in their infrastructural developments as they race to make strides, which
they can leverage for votes. This includes roads, railways and airports at a national and a county level in Kenya, where
devolution has taken centre stage and placed the onus on county leaders to drive development in their elected areas

2222
GDP ForecastKenya’s 2016 GDP is expected at between 5.5%-6.0% supported by the Construction and ICT sector
2011
2012
2013
• We expect 2016 GDP growth to be between 5.5%-6.0% supported by;
• The commissioning of the 280 MW of geothermal and 20.4 MW of wind power• The government stepping up their infrastructural developments as a “campaign move” The switch from analogue to digital
which has led to a flurry of broadcasting licenses being issued
• The tourism sector which is improve owing to government initiatives to eradicate extremism
• Agriculture and Financial Intermediation, which contribute to 24.9% and 5.4% to GDP, respectively, will grow at a slower
pace than 2015 given (i) the expectations of drought, which usually comes after an El – Nino phenomenon, and (ii) theexpectation of a volatile interest rate environment which will affect the operations of the sector
4.6%
5.7%5.3% 5.4%
5.8%
0.0%
1.0%
2.0%
3.0%
4.0%
5.0%
6.0%
7.0%
2012 2013 2014 2015E 2016P
GDPGrowth
2323
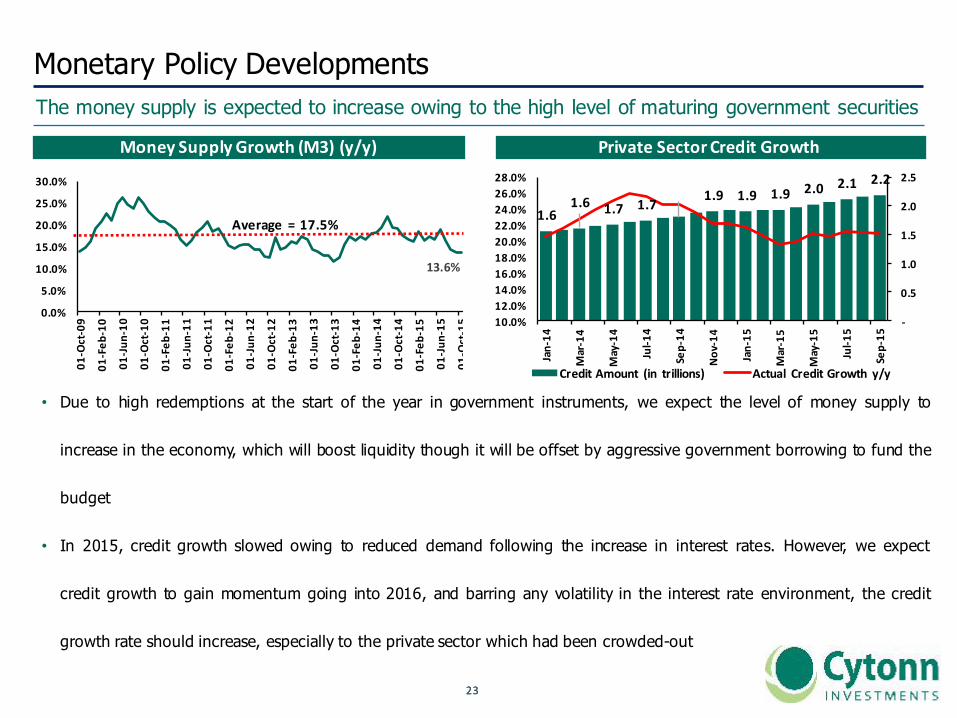
Monetary Policy DevelopmentsThe money supply is expected to increase owing to the high level of maturing government securities
• Due to high redemptions at the start of the year in government instruments, we expect the level of money supply to
increase in the economy, which will boost liquidity though it will be offset by aggressive government borrowing to fund the
budget
• In 2015, credit growth slowed owing to reduced demand following the increase in interest rates. However, we expect
credit growth to gain momentum going into 2016, and barring any volatility in the interest rate environment, the credit
growth rate should increase, especially to the private sector which had been crowded-out
MoneySupplyGrowth(M3)(y/y) PrivateSectorCreditGrowth
13.6%
0.0%
5.0%
10.0%
15.0%
20.0%
25.0%
30.0%
01-Oct-09
01-Feb
-10
01-Jun
-10
01-Oct-10
01-Feb
-11
01-Jun
-11
01-Oct-11
01-Feb
-12
01-Jun
-12
01-Oct-12
01-Feb
-13
01-Jun
-13
01-Oct-13
01-Feb
-14
01-Jun
-14
01-Oct-14
01-Feb
-15
01-Jun
-15
01-Oct-15
Average =17.5%1.6
1.6 1.7 1.7… 1.9 1.9 1.9 2.0 2.1 2.2
-
0.5
1.0
1.5
2.0
2.5
10.0%12.0%14.0%16.0%18.0%20.0%22.0%24.0%26.0%28.0%
Jan-14
Mar-14
May-14
Jul-1
4
Sep-14
Nov-14
Jan-15
Mar-15
May-15
Jul-1
5
Sep-15
CreditAmount (in trillions) Actual CreditGrowth y/y

2424
Inflation Forecast Kenya’s Rate of Inflation is expected to be above the 7.5% CBK upper bound in 2016
2011
2012
2013• Inflation has been stable during 2015, only spiking to a 16 month high in December owing to increase in food, beer and
cigarette prices due to the Excise Duty Bill
• The major drivers of Kenya’s inflation during the year 2016 will be: (i) El-Nino effects that will continue to be felt in
Q1’2016 and the expected drought thereafter will have an adverse effect on food prices and (ii) the expected 16% VAT
to be levied on all petroleum products as from September 2016
• We expect the inflation rate in 2016 to rise and remain above the 7.5% upper bound
Kenya’s Inflation Rate vs the 91 Day T Bill
19.7%
8.0%
20.6% 21.7%
10.1%
0.0%
5.0%
10.0%
15.0%
20.0%
25.0%
Jan'10
Mar'10
May'10
Jul'1
0Sept'10
Nov'10
Jan'11
Mar'11
May'11
Jul'1
1Sept'11
Nov'11
Jan'12
Mar'12
May'12
Jul'1
2Sept'12
Nov'12
Jan'13
Mar'13
May'13
Jul'1
3Sept'13
Nov'13
Jan'14
Mar'14
May'14
Jul'1
4Sept'14
Nov'14
Jan'15
Mar'15
May'15
Jul'1
5Sep'15
Nov'15
Inflation 91-dayT- bill

2525
Kenya Shilling The Kenya Shilling is expected to remain under pressure due to a strong dollar globally
2011
2012
2013
• Having depreciated by 13.0% in 2015, The Kenya Shilling is expected to be under pressure in 2016 from:
• Strong dollar in the global market, and,
• Given the current account deficit declining to 6.9% owing to reduced import bill due to low oil prices, we expect
the deficit to widen in 2016 given a large import bill as a result of the ongoing government infrastructural projects
Kenya Shilling against the dollar
90.6
102.42
80
85
90
95
100
105
110
31-Dec-14
28-Ja
n-15
25-Feb
-15
25-M
ar-15
22-Apr-15
20-M
ay-15
17-Ju
n-15
15-Ju
l-15
12-Aug-15
9-Sep-15
7-Oc
t-15
4-No
v-15
2-De
c-15
30-Dec-15
2626
IV. Fixed Income Market Outlook and Macroeconomic Summary

2727
Secondary Bond Market Activity2015 saw market turnover decline
Source – CBK
• Following the rise in rates, bond activity in the secondary market was subdued as evidenced by the decline in turnover
by 39.1%. We expect further subdued activities this year as we expect the volatility in interest rates to prevail
BondTurnover(intrillions)
0.450.37
0.42
0.50
0.31
0.00
0.10
0.20
0.30
0.40
0.50
0.60
2011 2012 2013 2014 2015
Average=0.41 tn

2828
Corporate Bond Market Activity2015 saw 6 corporates raise capital from the debt market
Source – CBK
• 2015 saw 6 corporates come into the bond market to raise capital, cumulatively raising Kshs. 21.5 bn. We expect
subdued activity in the primary corporate bond market due to the uncertainty in the interest rates, as raising capital in
such an environment will be detrimental to the companies
Companiesthatraisedbonds
Company Date BondValueKESbnsCentum 15-Jun-15 6.0ImperialBank 25-Aug-15 2.0ChaseBank 10-Jun-15 4.8FamilyBank 26-Oct-15 2.0RealPeople 10-Aug-15 1.6EABL 23-Mar-15 5.0Total 21.5

2929
Market Liquidity and Government BorrowingLiquidity set to increase in 2016 on increased Treasury maturities
Source – Central Bank of Kenya
GovernmentDomesticBorrowingProgramme
• Liquidity in the money market is set to improve in 2016
owing to high maturities of Kshs. 310.3 bn in the 2nd
half of the 2015/2016 FY. The Government borrowing is
on track, having borrowed Kshs. 116.5 bn. Since the
beginning of the fiscal year, the government has
borrowed Kshs. 436.1 bn with redemptions of Kshs.
319.6 bn
32.5 38.4
56.2 50.137.2 33.4
63.8 61.6
28.6 30.0 34.4
2.317.9 15.0
25.3 22.1 23.5 25.2
9
-
20.0
40.0
60.0
80.0
100.0
Jul-15 Aug-15 Sep-15 Oct-15 Nov-15 Dec-15 Jan-16 Feb-16 Mar-16 Apr-16 May-16 Jun-16
KshsBn
T-BillTotalMaturity BondsTotalMaturity I-BondsPartialRedemption
2015AverageMonthlyBorrowing=Kshs.71.3bn 2016AverageTargetMonthlyBorrowing=Kshs.66.5bn
Interbank&RepoRates
24.0% 25.84%
5.66%0.0%
5.0%
10.0%
15.0%
20.0%
25.0%
30.0%
1-Jul
15-Ju
l
29-Ju
l
12-Aug
26-Aug
9-Sep
23-Sep
7-Oct
21-Oct
4-Nov
18-Nov
2-De
c
16-Dec
30-Dec
InterbankRate RepoRate
3030
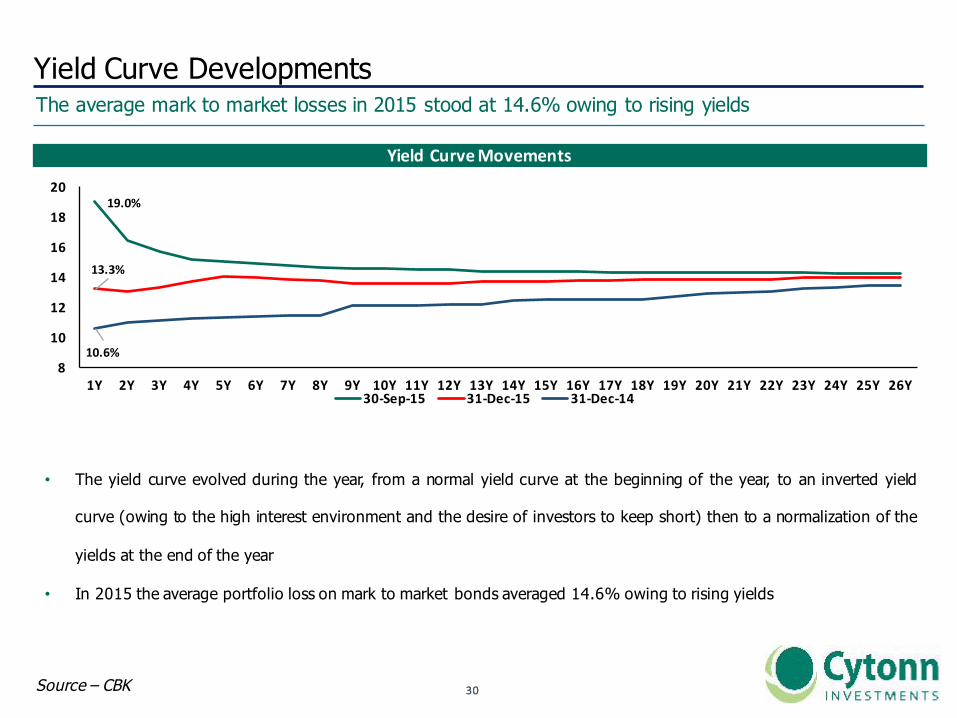
Yield Curve DevelopmentsThe average mark to market losses in 2015 stood at 14.6% owing to rising yields
Source – CBK
• The yield curve evolved during the year, from a normal yield curve at the beginning of the year, to an inverted yield
curve (owing to the high interest environment and the desire of investors to keep short) then to a normalization of the
yields at the end of the year
• In 2015 the average portfolio loss on mark to market bonds averaged 14.6% owing to rising yields
YieldCurveMovements
19.0%
13.3%
10.6%8
10
12
14
16
18
20
1Y 2Y 3Y 4Y 5Y 6Y 7Y 8Y 9Y 10Y 11Y 12Y 13Y 14Y 15Y 16Y 17Y 18Y 19Y 20Y 21Y 22Y 23Y 24Y 25Y 26Y30-Sep-15 31-Dec-15 31-Dec-14

3131
Fixed Income Market OutlookInvestors should remain short durations owing to uncertainty of interest rate movements
We maintain our recommendation that investors should be biased towards short-term fixed income
instruments due to uncertainty of rates in the current environment
• In 2016, we expect an upward pressure on interest rates as the government will be keen to meet their domestic
borrowing target and repay their obligations as they fall due
• Liquidity in the money market is expected to increase given the high amounts of maturities of government securities.
However, investors will continue to demand significant premiums to invest in Treasury instruments, thereby exerting
upward pressure on interest rates
3232
V. Kenya Equities Review
3333
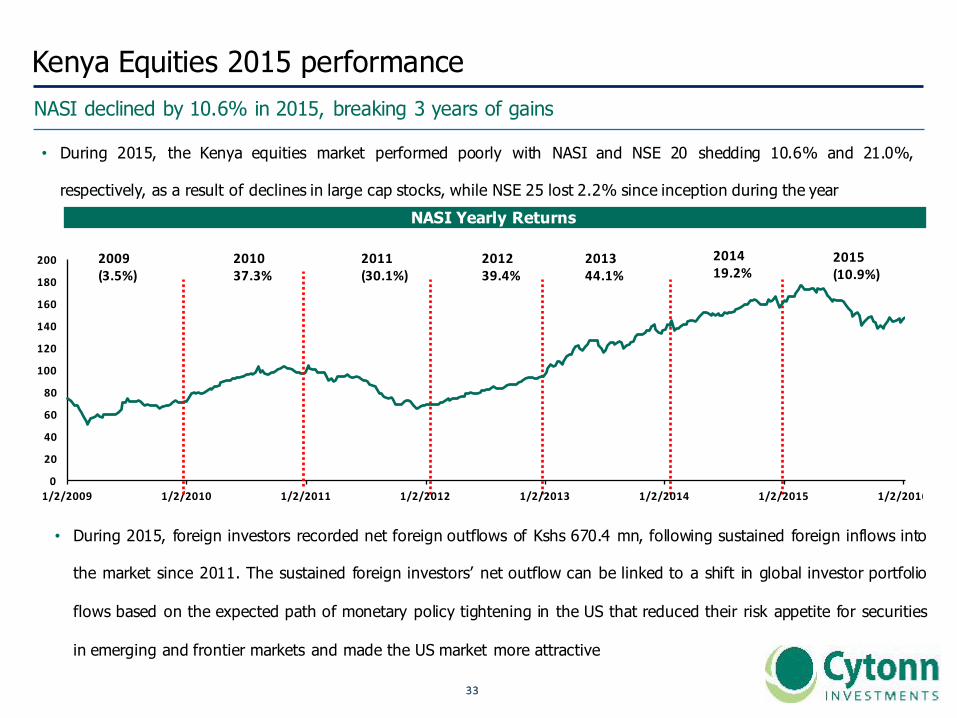
Kenya Equities 2015 performanceNASI declined by 10.6% in 2015, breaking 3 years of gains
• During 2015, the Kenya equities market performed poorly with NASI and NSE 20 shedding 10.6% and 21.0%,
respectively, as a result of declines in large cap stocks, while NSE 25 lost 2.2% since inception during the yearNASI Yearly Returns
0
20
40
60
80
100
120
140
160
180
200
1/2/2009 1/2/2010 1/2/2011 1/2/2012 1/2/2013 1/2/2014 1/2/2015 1/2/2016
2015(10.9%)
201419.2%
201344.1%
201239.4%
2011(30.1%)
201037.3%
2009(3.5%)
• During 2015, foreign investors recorded net foreign outflows of Kshs 670.4 mn, following sustained foreign inflows into
the market since 2011. The sustained foreign investors’ net outflow can be linked to a shift in global investor portfolio
flows based on the expected path of monetary policy tightening in the US that reduced their risk appetite for securities
in emerging and frontier markets and made the US market more attractive

3434
NSE All Share Index P/E
NSE All Share Index Historical Dividend Yield in %
NASI Price to Earnings and Dividend YieldNASI trades at a Lower PE than Historical average and dividend yield higher than historical average
2.9%
4.0%
0.0%
1.0%
2.0%
3.0%
4.0%
5.0%
6.0%
1/2/20
09
5/2/20
09
9/2/20
09
1/2/20
10
5/2/20
10
9/2/20
10
1/2/20
11
5/2/20
11
9/2/20
11
1/2/20
12
5/2/20
12
9/2/20
12
1/2/20
13
5/2/20
13
9/2/20
13
1/2/20
14
5/2/20
14
9/2/20
14
1/2/20
15
5/2/20
15
9/2/20
15
1/2/20
16
Average=3.3%
14.8x12.9x
0
5
10
15
20
25
1/2/20
09
5/2/20
09
9/2/20
09
1/2/20
10
5/2/20
10
9/2/20
10
1/2/20
11
5/2/20
11
9/2/20
11
1/2/20
12
5/2/20
12
9/2/20
12
1/2/20
13
5/2/20
13
9/2/20
13
1/2/20
14
5/2/20
14
9/2/20
14
1/2/20
15
5/2/20
15
9/2/20
15
1/2/20
16
Average=13.8x

3535
Factors That Will Affect the Equities Market in 2016Corporate earnings growth will have a profound impact on the direction of the equities market
1. Corporate Earnings: Corporate earnings are expected to remain subdued in 2016, owing to the high interest rate
environment, depreciating shilling, inflationary pressures and a slowdown in credit growth. Hence, we expect earnings
for listed firms to grow in the range of 7.5% to 10.0% during the year
2. Foreign Investor Sentiment: Foreign risk appetite for securities in emerging and frontier markets has reduced
following the expected path of monetary policy tightening in the US that has made the US market more attractive. As
these risks have already been priced in, we expect Kenya to attract the same levels of investor flows in 2016 as 2015
3. Interest Rates: We expect upward pressure on interest rates in 2016, which will result in a decline in private sector
credit growth, stifling business expansions and resulting in lower revenue for firms

3636
Factors That Will Affect the Equities Market in 2016 contd..REITs offering expected to increase asset allocation to the equities market
4. New Listings: We don’t expect any major listing at the Nairobi Securities Exchange in 2016. We expect an increase in
products offered, following the expected introduction of the futures exchange and derivatives trading at the bourse
5. Diversification of the Capital Markets: Following Stanlib Investments Kshs 3.6 bn REIT that started trading at the
NSE, we expect other property developers to issue more REITS in the future. This will thus increase asset allocation
towards the equities market

3737
Equities Market OutlookWe turn Neutral on equities outlook from Neutral with a bias to negative
We revise our recommendation to ‘‘NEUTRAL’’ from ‘‘neutral with a bias to negative’’ on equities as the market presents few pockets of value and valuations appear fair at 12.9x P/E
EquitiesMarketDrivers Outlook– 2016 Effect
Macro-economicenvironment
Keymetricsareexpectedtoberelativelyfavourable;inflationwithinsingledigit,5.5%-6.0%GDPgrowthandcurrency
withintherangebound.Neutral
CorporateearningsgrowthandValuations(P/E)
Stockmarketseemtobefairlyvalued, tradingataPEof12.9xcomparedtohistoricalaverageof13.8x.Assumption ofcorporateearningsgrowthrateofapproximately 10%givesaforwardP/Eof11.6x– 11.9xcomparedtohistoricalaverages.
Neutral
InvestorSentimentFlowsoutofKenyaas aresultof USratehikehavebeenpricedintothemarket andneutralstanceoncorporateearningsmeansnolargeforeigninvestorinflows expected
Neutral
Flows into the equities market will be supported by;
(i) Relatively high expected GDP growth rate for the year at 5.5%-6.0%(ii) Political stability in the country
(iii) An attractive valuation currently at a PE of 12.9x compared 14.8x at the same time last year

3838
VI. Private Equity Outlook
3939
Private Equity Outlook We expect increased activity in the Sub-Saharan Africa region and in particular, Kenya
• Private equity players have remained sector-focused all across their investments
• This is expected to remain the trend in 2016, with the key focus sectors being:
Financial Services:
• Financial services will be a key focus for most of the private equity funds. Despite a high level of financial inclusion in
Kenya, the sector still offers high growth opportunities driven by adaptions and innovation
• The focus on financial services sector is driven by
(i) a rapidly growing and entrepreneurial population and demand for credit in Kenya
(ii) growing financial services inclusion in the region
(iii) increased innovations around financial tools with the financial sector
(iv) increasing ease of exit in the financial services sector

4040
Private Equity Outlook We expect increased activity in the Sub-Saharan Africa region and in particular, Kenya
Healthcare
• Health remains a key area of focus in 2016. Kenya is currently underserved in healthcare driven by:
(i) low level of investment into the sector
(ii) relative high cost of medical services
(iii) failure of the Government to provide basic services which has created room for private capital to drive growth.
• Private equity involvement in this sector cuts across the whole value chain, from Dispensaries, Hospitals and Pharmacies.
Education
• Education sector remains a lucrative sector for investment in Kenya. There is an increased interest in the private sector to
provide education in the country given the high reliance on government / public schools.
• The growing middle class has remained supportive of the sector, with a desire to send their children to aspirational private
schools
4141
Private Equity Outlook We expect increased activity in the Sub-Saharan Africa region and in particular, Kenya
Information and Communications Technology
• This is also a sector of interest, driven by a young and dynamic Kenyan population. Kenya has registered rapid growth in
ICT, driven by entry of global brands, entrepreneurial business offering services and a supportive regulatory framework.
• We expect increased injection of private equity capital to drive further growth in this sector
We remain bullish on PE as an asset class given (i) the abundance of global capital looking for opportunities in
Africa, (ii) the attractive valuations in private markets compared to public markets, and (iii) better economic
growth in Sub Saharan Africa as compared to global markets.

4242
VII. Real Estate Outlook
4343
Real Estate Outlook - DriversWe expect the major basis for real estate market in 2016 to be the growing middle class
• As per the latest data released by KNBS, the real estate sector’s year on year growth as at Q3’2015 was 5.4% with the
overall sectoral contribution to GDP remaining flat at 8%
v Huge Housing Deficit: There is an effective housing deficit of over 200,000 units per annum to cater for the low to middle
income market with Nairobi and its metro accounting for over 50%
v Infrastructure: Increased development along key infrastructural nodes, which have been brought about by the development
bypasses e.g. Ruaka and Karen are now attractive real estate development zones. The SGR and LAPPSET corridors will also
experience the same effect
v Widespread Economic Growth: Increased need for real estate development in devolved units to offer accommodation to the
SMEs and the County staff. This is further increased through the rapid growth of SMEs which employ up to 85% of the work force
and require space for office use
v Demographic Trends: Youth bulge (21 to 35 years), as well as rapid urbanization, have created an opportunity for
development which caters to their needs e.g. middle-income housing, and their lifestyle e.g. suburban retail malls
v Devolution and Political Goodwill: Devolution is assisting real estate development as it is placing onus on the County
governments to improve the real estate landscape, which has led to reduced bureaucracy and investment in infrastructure
4444
Real Estate Outlook - SectorsCommercial Sector
• Office yields have remained stable over the last couple of years ranging between 8 and 9% for prime offices and 7% for
grade B Offices. We expect development of Grade A offices to increase in 2016 as demand increases, they will also fetch
higher rents and selling prices due to increase in land value
Retail Sector
• Retail developments have increased over the past few years driven by favorable demographic conditions. The average
uptake of retail space is 75%. In 2016 we expect to see a decrease in the rents as a result of increased supply. We
expect more international retail and investment groups to enter the Kenyan market as they explore attractive emerging
markets so as to tap into the growing middle class. We also expect to see an increase in the development of retail space
in the counties as well owing to the population increase brought about by devolution

4545
Real Estate Outlook - SectorsIndustrial Sector
• Most industrial premises are owner built and hence uptake has not really been an issue. We expect developers to
construct more in the dormitory towns. We also expect land transactions to start taking off along the LAPPSET project as
it continues to take shape. The rates and uptakes will also rise as demand for warehousing, logistical assembly parks
and factory building rise with increased industrialization, improved infrastructure and the growing demand from the
neighbouring landlocked east Africa Countries. We also expect higher quality warehousing and factory building as the
construction sector grows
Hotel Sector
• The industry’s performance is declining though at a slower rate and this is an indication that the industry is recovering
from its plunge in 2012
• Opportunities for hospitality industry are foreseeable as a result of:
(i) The expansion of BOMAS of Kenya to become the largest conference facilities in Africa
(ii) Expansion of the Malindi Airport to allow landing of larger planes and international flights
(iii) The proposed launch of direct flights to the USA by May 2016
(iv) Growth in local tourism and business travel
4646
Real Estate Outlook – Rental Yields
Location TypeRentalIncome
permonth(Kshs.)
SalePrice(Kshs.) Yield(%)
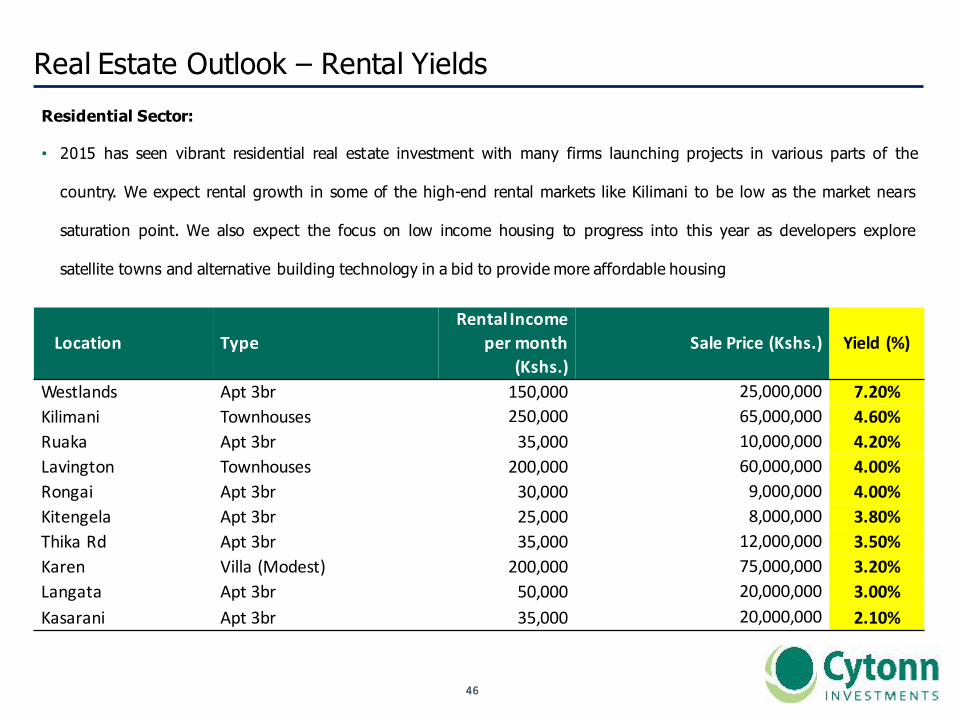
Westlands Apt3br 150,000 25,000,000 7.20%Kilimani Townhouses 250,000 65,000,000 4.60%Ruaka Apt3br 35,000 10,000,000 4.20%Lavington Townhouses 200,000 60,000,000 4.00%Rongai Apt3br 30,000 9,000,000 4.00%Kitengela Apt3br 25,000 8,000,000 3.80%ThikaRd Apt3br 35,000 12,000,000 3.50%Karen Villa(Modest) 200,000 75,000,000 3.20%Langata Apt3br 50,000 20,000,000 3.00%Kasarani Apt3br 35,000 20,000,000 2.10%
Residential Sector:
• 2015 has seen vibrant residential real estate investment with many firms launching projects in various parts of the
country. We expect rental growth in some of the high-end rental markets like Kilimani to be low as the market nears
saturation point. We also expect the focus on low income housing to progress into this year as developers explore
satellite towns and alternative building technology in a bid to provide more affordable housing
4747
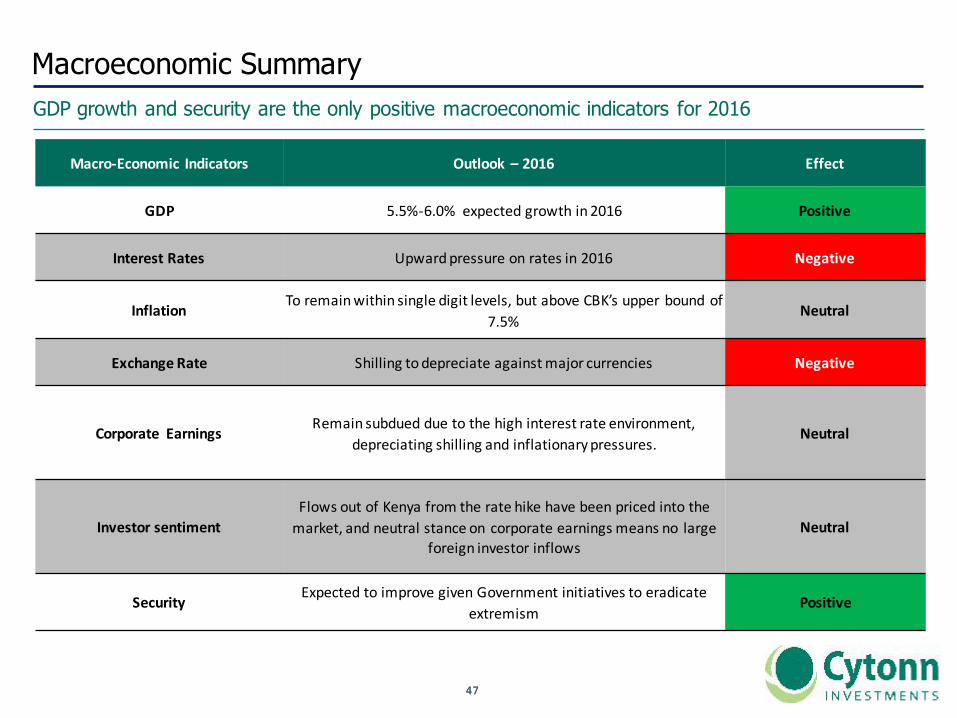
Macroeconomic SummaryGDP growth and security are the only positive macroeconomic indicators for 2016
2011
2012
2013
Macro-Economic Indicators Outlook– 2016 Effect
GDP 5.5%-6.0%expectedgrowthin2016 Positive
InterestRates Upwardpressureonratesin2016 Negative
Inflation Toremainwithinsingledigitlevels,butaboveCBK’supperboundof7.5%
Neutral
ExchangeRate Shillingtodepreciate againstmajorcurrencies Negative
Corporate Earnings Remainsubduedduetothehighinterestrateenvironment,depreciatingshillingandinflationarypressures.
Neutral
InvestorsentimentFlowsoutofKenyafromtheratehikehavebeenpricedintothemarket,andneutralstanceoncorporateearningsmeansno large
foreigninvestorinflowsNeutral
Security ExpectedtoimprovegivenGovernmentinitiativestoeradicateextremism
Positive

4848
Asset AllocationIn light of all the aforementioned factors, we recommend a balanced portfolio
2011
2012
2013
40%
30%
20%
10%
FixedIncome
Equities
AlternativeInvestments
Offshoreinvestments

4949
Q&A