early warning of impending flash flood based on aiot
TRANSCRIPT

Early Warning of Impending Flash Flood Based onAIoTWen-Tsai Sung
National Chin-Yi University of TechnologyIhzany Vilia Devi
National Chin-Yi University of TechnologySung-Jung Hsiao ( [email protected] )
Takming University of Science and Technology https://orcid.org/0000-0002-0723-1632
Research
Keywords: AIoT, LoRa, tilt sensor, rain gauge sensor, water �ow sensor
Posted Date: September 13th, 2021
DOI: https://doi.org/10.21203/rs.3.rs-850371/v1
License: This work is licensed under a Creative Commons Attribution 4.0 International License. Read Full License

Early Warning of Impending Flash Flood Based on AIoT
Wen-Tsai Sung1, Ihzany Vilia Devi1, and Sung-Jung Hsiao2*
1Department of Electrical Engineering, National Chin-Yi University of Technology, Taichung, 411030, Taiwan
2 Department of Information Technology, Takming University of Science and Technology, Taipei City, 11451, Taiwan
*Corresponding Author: Sung-Jung Hsiao. Email: [email protected]
Abstract: According to data from the Earth's Volcano and Geological Disaster
Reduction Center, a country like Indonesia has experienced many natural disasters,
one of which is flooding. Floods are an annual natural disaster, especially on
mountain slopes. Mountainous areas experience more dangerous than floods than
the urban areas because they can cause other natural disasters, such as landslides
and damage the hiking trails. The steep and winding roads minimize and limit the
number of officers working in the mountains. Therefore, flood detection and
monitoring equipment is needed. The proposed system based on AIoT technology
provides real-time flood analysis so that the authorities can monitor residents
around mountainous areas and provide early warning. This research focuses on the
flood observation system as an early warning system to effectively monitor the
flood-prone mountain slopes in real time while taking into account the cost, time
efficiency, and safety measurement. The proposed system design includes the
integration of sensors into the microcontroller, and the communication between
the posts using LoRa and SIM900 sends data to the cloud server via the Internet.
All sensor readings for each post are displayed on the app, and alerts are sent via
SMS and the app.
Keywords: AIoT; LoRa; tilt sensor; rain gauge sensor; water flow sensor.
1 Introduction
Due to the global greenhouse effect, the earth’s climate is abnormal, so this phenomenon has caused
continuous natural disasters around the world. In fact, many residents live in mountainous areas worldwide.
Among the many natural disasters occurring on the earth, flood is one of them. Flooding is a natural disaster
that often occurs on the earth; for instance, in Indonesia, it occurs not only in cities but also in mountainous
areas. One of the factors affecting flooding is rainfall. The greater the rainfall, greater is the flood flow
which the more serious the direct or indirect damage to the land. [1]. According to Pannagos et al., the
energy input of the earth's surface exposed to rainfall is one of the key factors in controlling water erosion
[2]. People living on hillsides in mountainous areas include dense population, high poverty rates, highly
dependent on climate-sensitive resources, lack of awareness of climate risks, unplanned urbanization and
poor infrastructure, and experience many other disadvantages. Most farmers, fishermen, small business
owners, and other communities living in low-lying waterlogged areas feel the brunt of widespread climate
change because of global warming and flooding in these areas, especially flash floods. Flash floods are
caused by the main and triggering factors that determine their location, frequency, and scale. High-intensity
rainfall is the main source of flash floods in hilly areas, especially landslides in areas with loose rocks [3].
Reducing the risk of flood disasters is carried out by constructing and structuring building facilities
and infrastructure and requires spatial planning based on disaster mitigation as an effort to improve life
safety and comfort and preserve the environment. Therefore, in this study, we aimed to analyze and monitor

flooding on the slopes of the mountains by measuring the height and velocity of the water and periodically
monitoring the rain using Artificial Intelligence Internet of Things (AIoT) technology. Disasters will not
stop just because of the use of IoT technology, but this technology can help predict early warning systems
and disasters such as floods [4]. The functioning of this tool is shown in Fig. 1. It works by coordinating
multiple nodes using long range (LoRa) communication technology. LoRa is one of the low-power wide-
area network (LPWAN) communication systems with long-distance transmission capabilities. Although
LoRa technology still has shortcomings in secure localization systems, ZigBee comparisons reveal that the
reliability for LoRa technology can be increased up to 45% so that it can meet the required system unit
specifications [5-6]. The communication between posts using LoRa and SIM900 sends data to a cloud
server via the internet. Furthermore, all sensor readings of each post are displayed on the App, and alerts
are sent via short message service (SMS) and via the App. Moreover, each node has sensors to measure
rainfall, water flow rate, and water velocity in determining the potential for flooding in an area connected
to LoRa, as shown in Fig.1.
Figure 1: A case model
The method of this paper is to use a fuzzy approach to implement various modes of intelligent control. The
proposed system uses a fuzzy algorithm to calculate which output control signal the input signal of each
environmental sensing device should correspond to. The system will execute various early warning
hardware or communication devices according to the output control signal. Therefore, the system will
achieve the protection goal of active sensing and intelligent early warning.
2 Method of Using Fuzzy
The proposed early warning system for flash floods is an architecture that uses a network of sensors
to integrate with the Internet. In this section, we describe the use of fuzzy methods to calculate and analyze
various environmental variables. In this method, the input and output variables of fuzzy control must be
specified, and the variable elements are set according to the optimal range of growth. The fuzzy set is shown
in Tab.1. There are four inputs and one output was used in this system. The first input is rainfall intensity,
water speed, water level, and steeper slopes or relief. The output on this system is a warning system which

is classified into three categories, namely normal, cautious, and dangerous. Tab. 2 shows the range of input
membership functions, wherein, we can see the size range of each existing prefix. The rules were generated
from logical reasoning and expert knowledge; some of these fuzzy rules are listed in Tab. 3.
Table 1: Input and output fuzzy sets
Prefix Description
Input
Rainfall Intensity (mm/d)
Small
Moderate
Heavy
Storm
Large Storm
Refers to the intensity of rainfall
measured by the rain gauge sensor
Water Speed (m/s)
Slow
Average
Fast
Refers to the speed of the
floodwaters measured by the water
flow sensor
Water Level (cm)
Low
Average
High
Refers to the level of the
floodwaters above ground level
measured by the water flow sensor
Steeper Slopes / Relief
Low
Average
High
Refers to the slope of the land that
affects waterflow speed.
Output Warning System
Normal (N)
Cautious (C)
Dangerous (D)
Table 2: The range of input
No Input Membership
Function (IMF)
The range of input membership
functions
1. Rainfall Intensity
Small 0 – 15 mm/d
Moderate 10 – 30 mm/d
Heavy 20 – 50 mm/d
Storm 40 – 75 mm/d
Large Storm 65 – 100 mm/d
2. Water Speed
Slow <40 m/s
Average 20 – 80 m/s
Fast >60 m/s
3. Water Level
Low < 4 cm
Average 2 – 8 cm
High >6 cm
4. Steeper Slopes
Low <40 %
Average 20 – 70 %
High >60 %

Table 3: Some formulas used in fuzzy rules
Rule
Number
Input Output
Rainfall Intensity
(RI)
Water Speed
(WS)
Water Level
(WL)
Steeper
Slopes (SS)
Warning
System
1 Small Very Slow Low Very Low Normal
2 Moderate Very Slow Low Very Low Normal
3 Moderate Slow Low Very Low Normal
4 Moderate Average Average Average Cautious
5 Heavy Average Average Average Cautious
6 Moderate Fast Average Average Cautious
7 Heavy Fast Average Average Cautious
8 Heavy Fast High High Dangerous
9 Storm Fast High High Dangerous
10 Large Storm Fast High High Dangerous
Each membership function has an important role in determining the potential for flooding in
mountainous areas of Indonesia. Because the intensity of rainfall has the greatest influence on flooding
(then in this prefix the variable is divided into five) if the rainfall intensity is abnormal, it triggers another
membership function.
3 Related Research
V. Babu et al. [7] proposed an alert system to monitor efficiently critical flood-prone and earthquake
areas on a real-time basis. They used a water level sensor, rain sensor, and MPU6050 sensor as the main
focus of their study and examined how the water level sensor detects floods and the vibration sensor detects
earthquakes simultaneously. In their system, the messages are sent via global system for mobile
communications (GSM), and when flood-prone areas occur, they provide solar energy through the solar
panel to charge the entire system. As a result, this system can send packet data to the ThingSpeak cloud
server via the internet, and the global positioning system (GPS) installation can track people who are
affected by floods and earthquakes. S. Shankar et al. [8] proposed a system to detect the impending flood
and monitor any other climate parameters, by the weather forecast and rain sensor. They use an ultrasonic
sensor, water level sensor, and water flow sensor in their study and tried to determine water level in dams,
rivers and kept track of the rate of flow of water, whose values are displayed on the liquid crystal display,
The data is then sent to the blynk App. Light-emitting diode (LED) and buzzer are for a dangerous situation,
and an alert message is sent through the blynk App and SMS through the GSM modem. As a result, their
parameter can be updated once every three hours to monitor the parameters that may cause flooding. In
their study, E. Devaraj Sheshu et al. [9] aimed to alert the authorities about an imminent flood by monitoring
the water level in the sewage system in urban areas. They used sensors to obtain the real-time data on water
level of water bodies and the flow rates. The data were transferred to the controller over Wi-Fi using
NodeMCU. The controller Raspberry Pi 3 will update the sensor data graph on the website and provide
weather data from the internet. The result is an alert will be provided if the values are not within the safe
levels. The sign includes a buzzer sound and also an SMS to the concerned authority using the Twilio
platform.
In the study by Y. Saragih et al. [10], the authors proposed an AIoT system that can monitor reservoirs.
They used an ultrasonic sensor as the primary focus of their study to assess the difference between the use
of an ultrasonic sensor and control using a stepper motor. The sensor used can measure water level and
water volume. The system was designed in real-time based on the AIoT with a web interface so that the
public could directly monitor it. The outcome was the installation of the ultrasonic sensor and the stepper
motor to determine water level activity from low to high levels with high output displayed on the serial
monitor and web server. Likewise, S. A. Ali et al. [11] proposed an early flood detection, warning, and
notification system. They used a flow sensor, sonar sensor, and rain detector as the main focus of their study
and examined real-time data collection on the riverbanks with onsite sensors. This telemetry data was sent
to an online platform for processing. The result is showed that this system is very efficient and very useful
in the practical by testing the water instantly, as shown in Fig.2.
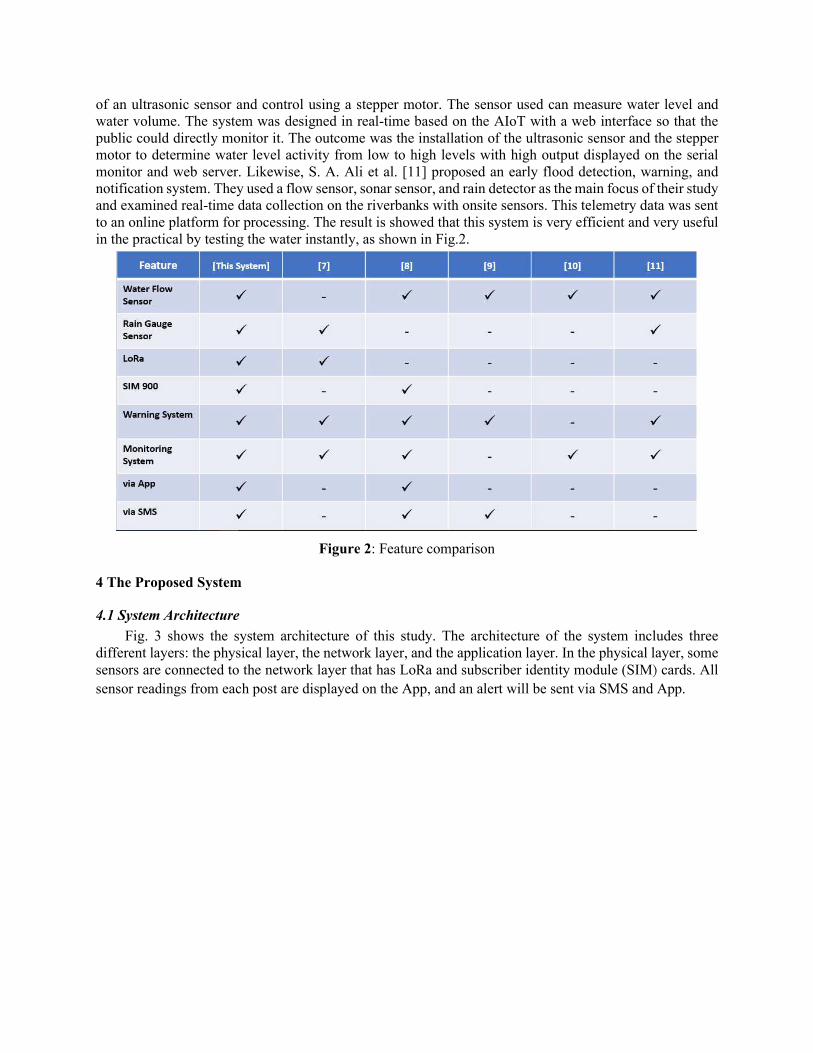
Figure 2: Feature comparison
4 The Proposed System
4.1 System Architecture
Fig. 3 shows the system architecture of this study. The architecture of the system includes three
different layers: the physical layer, the network layer, and the application layer. In the physical layer, some
sensors are connected to the network layer that has LoRa and subscriber identity module (SIM) cards. All
sensor readings from each post are displayed on the App, and an alert will be sent via SMS and App.

Figure 3: System architecture
4.2 Hardware
4.2.1 Heltec LoRa 32
LoRa has become a key enabler for multiple LPWAN technologies [12]. It is a modulation technique
derived from chirp spread spectrum (CSS) technology. While there are many types of LoRa, the one used
in this study was Heltec LoRa 32. It has three wireless features: Bluetooth 4.2, Wi-Fi 802.11, and the LoRa,
and all of this can be used simultaneously. This type of network with a reach of 3.6 km is through a simple
antenna. Fig.4 shows the hardware structure of the front Heltec LoRa 32.
Figure 4: Front Heltec LoRa 32
4.2.2 GSM SIM900
Fig.5 is the GSM SIM900 structure. SIM900 GSM/ general packet radio service (GPRS) shield is a
GSM modem that can be integrated into a significant number of AIoT projects, and this SIM900 GSM/
GPRS module can be used to transfer data to the server [13]. This one can connect to the internet over a
GPRS network, send and receive a message, and place and receive phone calls.

Figure 5: GSM SIM900
4.2.3 Rain Gauge Sensor
Fig.6 is a type of rain gauge which has a tipping bucket. Per tip is 0.053 inches or 1.346 mm of rain.
Furthermore, this rain gauge has a magnetic sensor, which works when the magnet attached to the tipping
- bucket moves a magnetic switch as a tipping bucket, thereby affecting each tip's momentary switch closure.
The rain data is saved in a data logger, which records the time of each tip. The devising of more inexpensive
mid-range and long-range radio systems for Wireless Sensors Networks (WSNs) makes this type of sensor
more practical and robust in studying rainfall over a wide geographic area [14].
Figure 6: Rain gauge sensor
4.2.4 Water Flow Meter Sensor
The water flow sensor consists of a copper body, a water rotor, and a hall-effect sensor. When water
flows through the rotor, the rotor rolls its speed changes with different flow rates and the hall-effect sensor
outputs the corresponding pulse signal. In this study used a water flow meter sensor Sub Robotics YF-S201
which can work up to 30 L of water per minute, work at temperatures of -25 to 80 °C, and at 35% to 80%
RH humidity. This water flow sensor will record the amount of water and all this data can then be sent to
the server via LoRa and SIM900 [15]. See fig.7, for hardware structure.

Figure 7: Water flow meter sensor
4.2.5 Tilt (Inclinometer) Sensor
Fig. 8 is a high-precision tilt sensor’s structure. The tilt sensor uses an accelerometer to measure tilt
angles between 0-180 degrees with a precision of 0.1 degrees. However, for detecting the slope on the slope,
it is only used between 0 - 45 degrees because the slope angle that exceeds the threshold can affect the flow
of water during flooding. This sensor is also equipped with an internal LoRa-based antenna which has a
very wide range. This sensor has a battery capacity of up to 5 - 10 years depending on usage; it can also
withstand temperatures between -40 to +70 °C during operation and +100°C when in storage.
Figure 8: Tilt sensor
4.3 Software
Fig. 9 is a flowchart that shows the working system. The sensor system detects the data by using the
fuzzy method that the system will determine the output variable in the system. The data is then be sent to
the cloud management platform for data processing and then to the application for real-live data and flood
early warning via SMS and Application.

Figure 9: System flowchart
5 Presentation of Result
As previously discussed, rainfall intensity has an important role in determining the potential for
flooding on mountain slopes in Indonesia. In the rules menu, we can set the desired result of the warning
system, but in the experimental example in this study, we used the default rules from Matlab. The results
are presented in Fig. 10(a) and (b). As shown in Fig. 10 (b), rainfall intensity has an important role in
determining the potential for flooding in mountainous areas in Indonesia. On the graph, the blue color
indicates a small rainfall so that it does not have much impact on the potential for flooding, followed by a
light blue color which indicates moderate rainfall, then is the color Tosca which indicates heavy rainfall,

and finally yellow color indicates storm rainfall and large storm. From this, we realize that the warning
from the system starts working on the light blue graph (moderate rainfall) and above.
(a) (b)
Figure 10: Graphic result (a) rules; (b) warning system (Z-axis) with the input parameter of water level
(Y-axis), and rainfall intensity (X-axis).
During trial and error, some abnormal data were obtained when incorrectly determining the rules in
this fuzzy method. As shown in Fig.11(a), this abnormal data occurs when incorrectly setting the rules
where the steeper slopes and water level rules seem to fluctuate which makes the system difficult to read
and determine the right output. On the other hand, according to Fig.11 (b), it looks normal from the rainfall
intensity side but an uphill water slope results in abnormal data, because the rainfall intensity has the most
influence in determining the potential for flooding, although here we can see the region of slow rainfall
intensity but with sudden uphill water slope. When the rainfall intensity is slow all input membership
functions should not be affected. That is why Fig. 11(b) is included in the abnormal graphic.
(a) (b)
Figure 11: Abnormal graphic result (a) warning system (Z-axis) with the input parameter of steeper slopes
(Y-axis) and water level (X-axis); (b) warning system (Z-axis) with the input parameter of rainfall intensity
(Y-axis) and water speed (X-axis).
6 Analysis of the mathematical model of this research
After field surveys and multi-stakeholder discussions, early warning methods were analyzed, based
on two parameters, namely the intensity of rainfall and flood timing.
6.1 Intensity of Rainfall
The Gumbel theory of distribution is used to distribution for intensity duration frequency (IDF)

analysis because it is suitable for modeling maxima. It is simple and used only when extreme events occur
(maximum values or peak rainfalls). The formula is as follows:
PT =Pave + KS (1)
In the formula,
PT : Frequency precipitation (in mm) for each duration with a specified return period T (in a
year)
Pave: Average of the maximum precipitation corresponding to a specific duration
K: Gumbel frequency factor
S: Standard deviation of P data
Where each factor is given by:
K = √6𝜋𝜋 �0.5772 + 𝑙𝑙𝑙𝑙 �𝑙𝑙𝑙𝑙 � 𝑇𝑇𝑇𝑇−1��� (2)
Pave = 1𝑛𝑛∑ 𝑃𝑃𝑃𝑃𝑛𝑛𝑖𝑖=1 (3)
S = � 1𝑛𝑛−1∑ (𝑃𝑃𝑃𝑃 − 𝑃𝑃𝑃𝑃𝑃𝑃𝑃𝑃)2𝑛𝑛𝑖𝑖=1 �1/2 (4)
The frequency factor (K) multiplied by the standard deviation gives the departure of desired return
period rainfall from the average. Then the rainfall intensity (IT) is obtained using the formula:
IT = 𝑃𝑃𝑃𝑃𝑇𝑇𝑇𝑇 (5)
In the formula,
PT: Frequency precipitation (in mm) for each duration with a specified return period T (in a
year)
Td: Duration in hours
6.2 Timing of Flood
To calculate the timing of flood/ concentration period, the formula is as follows:
tp = CA0.22re-0.35 (6)
In the formula,
tp : the timing of flood arrival (minute)
re: effective rainfall intensity (mm/hour)
A: Catchment area (km2)
C: Coefficient
Another equation that may be used is the Izzard equation, where some topographic factors are
considered as contributing factors (distance of stream surface, slope of the field, both forming a restriction
coefficient for the runoff flow and the concentration period). The formula is as follows: 𝑡𝑡𝑡𝑡 = �4𝐼𝐼𝐿𝐿1/3𝑖𝑖2/3 � �0.0007𝑖𝑖+𝑐𝑐𝑐𝑐𝑠𝑠1/3 � (7)
In the formula, 𝑡𝑡𝑡𝑡: Concentration time
L : Length of flow
I: Intensity of rainfall
cr : Coefficient of flow resistance
s = slope of the field
6.3 Steeper Slopes
A steeper slope is a line that describes the direction and the steepness of a line. Slope can be expressed
in angles, gradients, or grades.
a. Slope expressed as an angle
To calculate steeper slope expressed in angle, the formula is as follows: 𝑆𝑆𝑎𝑎𝑛𝑛𝑎𝑎𝑎𝑎𝑎𝑎 = tan−1(𝑦𝑦/𝑥𝑥) (8)

In the formula, 𝑆𝑆𝑎𝑎𝑛𝑛𝑎𝑎𝑎𝑎𝑎𝑎: angle (rad, degrees (°)) 𝑥𝑥: Horizontal run 𝑦𝑦: Vertical run
b. Slope expressed as the gradient
To calculate Steeper slope expressed in gradient, the formula is as follows: 𝑆𝑆𝑎𝑎𝑐𝑐𝑎𝑎𝑇𝑇𝑎𝑎 = (100%) 𝑦𝑦/𝑥𝑥
(9)
In the formula, 𝑆𝑆𝑎𝑎𝑐𝑐𝑎𝑎𝑇𝑇𝑎𝑎: grade (%)
𝑥𝑥: Horizontal run
𝑦𝑦: Vertical run
7 Discussion and analysis of experimental results
The result of this study is a prototype of the flood detection tool, its application, and the use of SMS.
This flood detection application is based on the android function, which can display rainfall data and water
velocity on a regular basis and display early warning notifications about flooding, which can be seen in the
bell sign on the home page. Fig. 12(a) shows the options for POST, Rainfall Data, and Water Flow Data.
Fig. 12(b) shows the water velocity and rainfall intensity in each post as a whole, while Fig. 12(c) shows
the water velocity data that has been recorded every 10 minutes, making it easier for users to monitor the
condition of the water in the river. Fig. 12(d) shows the rainfall amount and duration data on the rainfall
data page at every 10 minutes. All data collected from this monitoring will facilitate the system in detecting
impending floods.
(a) (b)

(c) (d)
Figure 12: Flood app display (a) home page; (b) POST page; (c) water flow data page; (d) rainfall data
page
This study also provides an early warning notification of flooding via SMS as shown in Fig.13, to
people around mountainous slopes who cannot use the application. Notification via SMS will not be stopped
until the user sends a reply message in the form of the word STOP. The notification consists of three levels
in early warning: yellow, orange, and red. The yellow sign indicates impending rainfall, the orange sign
indicates heavy rain and the potential for landslides, and the red sign indicates a possibility of flash flood.
Figure 13: Early Warning via SMS
This prototype consists of two parts, as shown in Fig.14 (a). The first one is for the cage as shown
in Fig.14 (b); the material used for the cage box for the bottom used concrete and for the cage used to
iron that has been painted with anti-rust coating. Fig.15 (a) shows the image of essential tools. An iron
box is used that has been painted with an anti-rust coating with red color, and the box can open. There is
an indicator light red button in the front compartment to turn the appliance on and off, yellow for error,
and green for correct. So, the condition of this tool can be assessed without the need for opening up the
box to see the contents of the devices. There are two sensors here. The first one is the rain gauge sensor

as shown in Fig.15 (a). This rain gauge sensor already has a hole in the box and cage so that the calculated
water can be expelled directly into the ground. This type of rain gauge has a tipping bucket, so when the
raindrop goes inside the sensor, the magnetic sensor moves a magnetic switch and affecting each tip
momentary switch closure.
(a) (b)
Figure 14: Prototype (a) the entire system; (b) the structure of the cage
(a) (b)
Figure 15: Prototype (a) essential tools in rain gauge sensor, (b) the water flow sensor
The rain data will be saved in a data logger, which records the time of each tip. The second part is the
water flow sensor as shown in Fig.15 (b). This sensor consists of a copper body, a water rotor, and a hall-
effect sensor. When the water flows through the rotor, the rotor rolls its speed changes with different flow
rates, giving a corresponding pulse signal. The flood disasters of mountain rivers due to rainfall and various
secondary disasters have become one of the main geological disasters faced by mountainous areas.
Mountain torrents have the characteristics of large flow, fast speed, strong scouring ability, and carry a
large amount of sand and rocks. Once a disaster occurs, it will have a huge impact on the life and property
safety of the local people. Thus, scientific and reasonable measures must be undertaken to protect the life
safety of the people and reduce property, making flood monitoring and early warning of rivers particularly
important and urgent. However, this study has a few limitations such as a complex regional geological
environment, wide monitoring range, inconvenient transportation, poor communication conditions, and
limited capital investment. At this stage, the commonly used flood monitoring and early warning methods
cannot solve the above problems simultaneously. In response to the above situation, this research designed

a special plan for flood monitoring and early warning in mountainous areas, and achieved the following
results:
(1) A complete research on key technologies for flood monitoring and early warning in mountainous
rivers.
(2) The flood monitor was successfully developed and used to realize remote real-time monitoring of
floodwater levels.
(3) A monitoring and early warning system were built to integrate flood level monitoring, regional
rainfall monitoring, remote wireless transmission, GSM conversion, and other technologies.
(4) The study involves electronics, geology, disasters, and other disciplines, reflecting the practice and
exploration of interdisciplinary research in the field of disaster monitoring and early warning.
(5) The research on key technologies of monitoring and early warning have been closely integrated
with practical applications, and the remote flood monitoring and early warning of the river basin
have been launched.
Fig. 16 (a) and (b) show that as the signal dwell time increases, fewer position updates are required.
The influence of the number of sensors on the cost of packet delivery is represented in Fig. 16 (a) and (b).
Fig. 16 (a) shows the ratio of the number of sensor nodes to the accuracy of the system’s position
calculations. The greater the number of sensors in the system, the higher the accuracy of its positioning.
The proposed system yielded accuracy at least 31% higher than the prevalent system. Fig. 16 (b) shows
whether the capacity for packet transmission decreased when more sensors were used. When the number
of sensor nodes increased, the capacity of packet transmission was higher than that reported in earlier
studies [7-11].
(a) (b)
Figure 16: (a) Accuracy of location versus the number of sensors; (b) pack delivery capacity
versus the number of sensors
8 Conclusions
This study focused on monitoring and providing early warnings about flooding on mountain slopes.
Floods are dangerous natural disasters because floods can also cause casualties and drown the victims'
property. In this study, we present a tool that can monitor and predict the occurrence of floods through SMS
and Applications, which is expected to help people evacuate them as early as possible. Due to internet
network issues in the mountains, this research focused more on using LoRa in sending messages between
devices. We used the fuzzy method to calculate and analyze various environmental variables. The results
of analysis in Indonesia indicate that the intensity of rainfall has an important role in determining the
potential for flooding on mountain slopes because it can affect other factors such as water velocity and
water level. The trial and error results led to some abnormal data when incorrectly determining the rules in
this fuzzy method. This abnormal data occurs when the rules are incorrectly set, wherein the steeper slopes

and water level rules seem to fluctuate, making the system difficult to read and determine the right output.
In the future, we hope that more parameters can be added and developed to provide more accurate analysis
results in detecting floods, especially on mountain slopes.
The accuracy of this research on the rainfall warning method is very high. Through the analysis of the
rainfall warning model of the mathematical model of this research, the research on related parameters of
flood monitoring such as soil saturation was added, and the advantages of the GSM sending module were
used for real-time transmission of all users. The communication network in this study uses the LoRa plus
GSM mode to carry out efficient and convenient data transmission even in the signal blind zone of the
mobile network and fully realize the wireless communication for monitoring and early warning.
Acknowledgments
This research was supported by the Department of Electrical Engineering, National Chin-Yi University of Technology.
The authors would like to thank the National Chin-Yi University of Technology, Takming University of Science and
Technology, Taiwan, for financially supporting this research.
Availability of data and materials
Data sharing not applicable to this article as no datasets were generated or analyzed during the current study.
Competing Interest
The authors declare that they have no conflicts of interest to report regarding the present study.
Funding Statement
The author(s) received no specific funding for this study.
Authors Contribution
W-T S. is responsible for research planning and providing improvement methods. I-V D. and S-J H. is responsible for
thesis writing and experimental verification.
Abbreviations
AIoT: Artificial intelligence Internet of things
LoRa: Long Range
LPWAN: Low-power wide-area network
SMS: Short Message Service
GSM: Global System for Mobile Communications
GPS: Global Positioning System
LED: Light-emitting diode
SIM: Subscriber identity module
CSS: Chirp spread spectrum
GPRS: General packet radio service
WSNs: Wireless Sensors Networks
IDF: intensity duration frequency

References
[1] G. Nagle and B. Cooke, “Option a freshwater – drainage basins,” in Geography, 2nd ed., Oxford University
Press, United Kingdom, pp 16-27, 2017.
[2] P. Panagos, P. Borrelli and K. Meusburger, “Global rainfall erosivity assessment based on high-temporal
resolution rainfall records,” Scientific Report, vol.7, pp. 4175, 2017.
[3] F. R, Shaw, A. Mallick and N. Islam, “Disaster risk reduction approaches in bangladesh,” In Disaster Risk
Reduction Approaches in Bangladesh, Disaster Risk Reduction 1st ed. Japan: Springer, pp. 165-189, 2013.
[4] H. N. Saha, "Disaster management using Internet of Things," 8th Annual Industrial Automation and
Electromechanical Engineering Conference (IEMECON), Bangkok, Thailand, pp. 81-85, 2017.
[5] W.-T. Sung, J.-S. Hsiao, S.-Y. Wang and J.-H. Chou, "LoRa-based internet of things secure localization system
and application," IEEE International Conference on Systems, Man and Cybernetics (SMC), Bari, Italy, pp.
1672-1677, 2019.
[6] A. Augustin, J. Yi, T. Clausen and W. M. Townsley, “A study of LoRa: long range & low power networks for
the internet of things”, Sensors, Switzerland, vol. 16, no. 9, pp. 1-18, 2016.
[7] V. Babu and V. Rajan, "Flood and earthquake detection and rescue using IoT technology," International
Conference on Communication and Electronics Systems (ICCES), Coimbatore, India, pp. 1256-1260, 2019.
[8] S. Shankar, J. J. Jijesh, D. R. Bolla, M. Penna, P. V. Sruthi et. al., "Early Detection of flood monitoring and
alerting system to save human lives," International Conference on Recent Trends on Electronics, Information,
Communication & Technology (RTEICT), Bangalore, India, pp. 353-357, 2020.
[9] E. D. Sheshu, N. Manjunath, S. Karthik and U. Akash, "Implementation of flood warning system using IoT,"
Second International Conference on Green Computing and Internet of Things (ICGCIoT), Bangalore, India,
pp. 445-448, 2018.
[10] Y. Saragih, J. H. P. Silaban, H. A. Roostiani and S. A. Elisabet, "Design of automatic water flood control and
monitoring systems in reservoirs based on internet of things (IoT)," 3rd International Conference on
Mechanical, Electronics, Computer, and Industrial Technology (MECnIT), Medan, Indonesia. pp. 30-35, 2020.
[11] S. A. Ali, F. Ashfaq, E. Nisar, U. Azmat and J. Zeb, "A prototype for flood warning and management system
using mobile networks," 17th International Bhurban Conference on Applied Sciences and Technology
(IBCAST), Islamabad, Pakistan, pp. 326-331, 2020.
[12] P. Edward, M. El-Aasser, M. Ashour and T. Elshabrawy, "Interleaved chirp spreading LoRa as a parallel
network to enhance LoRa capacity," IEEE Internet of Things Journal, vol. 8, no. 5, pp. 3864-3874, 2021.
[13] G. Tatar, O. Kılıç and S. Bayar, "FPGA based fault distance detection and positioning of underground energy
cable by using GSM/GPRS," International Symposium on Advanced Electrical and Communication
Technologies (ISAECT), Rome, Italy, pp. 1-6, 2019.
[14] O. Omoruyi, S. N. John, O. Chinonso, O. Robert, A. A. Adewale et al., "Wireless sensor network for rainfall
measurement using a tipping bucket rain gauge mechanism," International Conference on Computational
Science and Computational Intelligence (CSCI), Las Vegas, NV, USA, pp. 740-744, 2017.
[15] M. M. Srihari, "Intelligent water distribution and management system using internet of things," International
Conference on Inventive Research in Computing Applications (ICIRCA), Coimbatore, India, pp. 785-789, 2018.

Figure 1 A case model
All sensor readings of each post are displayed on the App, and alerts are sent via Short Message Service (SMS) and
via the App. Moreover, each node has sensors to measure rainfall, water flow rate, and water velocity in determining
the potential for flooding in an area connected to LoRa.
Figure 2 Feature comparison
This telemetry data was sent to an online platform for processing. The result is showed that this system is very efficient
and very useful in the practical by testing the water instantly.
Figure 3: System architecture
The architecture of the system includes three different layers: the physical layer, the network layer, and the application
layer. In the physical layer, some sensors are connected to the network layer that has LoRa and SIM cards.
Figure 4 Front Heltec LoRa 32
While there are many types of LoRa, the one used in this study was Heltec LoRa 32. It has three wireless features:
Bluetooth 4.2, Wi-Fi 802.11, and the LoRa, and all of this can be used simultaneously. This type of network with a
reach of 3.6 km is through a simple antenna.
Figure 5: GSM SIM900
SIM900 GSM/GRPS shield is a GSM modem that can be integrated into a significant number of AIoT projects, and
this SIM900 GSM/ GPRS module can be used to transfer data to the server.
Figure 6: Rain gauge sensor
Per tip is 0.053 inches or 1.346 mm of rain. Furthermore, this rain gauge has a magnetic sensor, which works when
the magnet attached to the tipping bucket moves a magnetic switch as a tipping bucket, thereby affecting each tip's
momentary switch closure.
Figure 7: Water flow meter sensor
This water flow sensor will record the amount of water and all this data can then be sent to the server via LoRa and
SIM900.
Figure 8 Tilt sensor
The tilt sensor uses an accelerometer to measure tilt angles between 0-180 degrees with a precision of 0.1 degrees.
However, for detecting the slope on the slope, it is only used between 0 - 45 degrees because the slope angle that
exceeds the threshold can affect the flow of water during flooding.
Figure 9 System flowchart
The sensor system detects the data by using the fuzzy method that the system will determine the output variable in the
system. The data is then be sent to the cloud management platform for data processing and then to the application for
real-live data and flood early warning via SMS and Application.
Figure 10 Graphic result (a) rules; (b) warning system (Z-axis) with the input parameter of water level (Y-axis), and
rainfall intensity (X-axis)
Rainfall intensity has an important role in determining the potential for flooding in mountainous areas in Indonesia.
On the graph, the blue color indicates a small rainfall so that it does not have much impact on the potential for flooding,
followed by a light blue color which indicates moderate rainfall, then is the color.

Figure 11 Abnormal graphic result (a) warning system (Z-axis) with the input parameter of steeper slopes (Y-axis)
and water level (X-axis); (b) warning system (Z-axis) with the input parameter of rainfall intensity (Y-axis) and
water speed (X-axis)
It looks normal from the rainfall intensity side but an uphill water slope results in abnormal data, because the rainfall
intensity has the most influence in determining the potential for flooding, although here we can see the region of slow
rainfall intensity but with sudden uphill water slope.
Figure 12 Flood app display (a) home page; (b) POST page; (c) water flow data page; (d) rainfall data
page
This flood detection application is based on the android function, which can display rainfall data and water
velocity on a regular basis and display early warning notifications about flooding, which can be seen in the
bell sign on the home page.
Figure 13 Early Warning via SMS
This study also provides an early warning notification of flooding via SMS to people around mountainous slopes who
cannot use the application.
Figure 14 Prototype (a) the entire system; (b) the structure of the cage
This prototype consists of two parts. The first one is for the cage; the material used for the cage box for the bottom
used concrete and for the cage used to iron that has been painted with anti-rust coating.
Figure 15 Prototype (a) essential tools in rain gauge sensor, (b) the water flow sensor
The first one is the rain gauge sensor. The rain data will be saved in a data logger, which records the time of each tip.
The second part is the water flow sensor.
Figure 16 (a) Accuracy of location versus the number of sensors; (b) pack delivery capacity versus the number of
sensors
That as the signal dwell time increases, fewer position updates are required. The influence of the number of sensors
on the cost of packet delivery is represented.