early increase in blood supply (eibs) is associated with
TRANSCRIPT

RESEARCH ARTICLE Open Access
Early increase in blood supply (EIBS) isassociated with tumor risk in theAzoxymethane model of colon cancerSarah Ruderman1†, Adam Eshein1† , Vesta Valuckaite2, Urszula Dougherty2, Anas Almoghrabi2, Andrew Gomes1,Ajaypal Singh3, Baldeep Pabla2, Hemant K. Roy4, John Hart2, Marc Bissonnette2, Vani Konda2 and Vadim Backman1*
Abstract
Background: The present study aimed to investigate the role of blood supply in early tumorigenesis in colorectalcancer. We leveraged the renin angiotensin system (RAS) to alter colonic blood supply and determine the effect ontumor initiation and progression.
Methods: To test the effect of blood supply on tumorigenesis, 53 male A/J mice were randomly assigned to one ofthree RAS modulation groups and one of two AOM treatments. The RAS modulation groups were I) water(RAS-unmodulated) as a control group, II) angiotensin-II and III) the angiotensin receptor blocker, Losartan.The mice in each group were then randomly split into either the saline control condition or the AOM-treatedcondition in which tumors were induced with a standard protocol of serial azoxymethane (AOM) injections. To monitormicrovascular changes in the rectal mucosa during the study, we used confocal laser endomicroscopy (CLE) withFITC-Dextran for in-vivo imaging of vessels and polarization-gated spectroscopy (PGS) to quantify rectal hemoglobinconcentration ([Hb]) and blood vessel radius (BVR).
Results: At 12 weeks post-AOM injections and before tumor formation, CLE images revealed many traditional hallmarksof angiogenesis including vessel dilation, loss of co-planarity, irregularity, and vessel sprouting in the pericryptal capillariesof the rectal mucosa in AOM-Water tumor bearing mice. PGS measurements at the same time-point showed increasedrectal [Hb] and decreased BVR. At later time points, CLE images showed pronounced angiogenic features includingirregular networks throughout the colon. Notably, the AOM-Losartan mice had significantly lower tumor multiplicity anddid not exhibit the same angiogenic features observed with CLE, or the increase in [Hb] or decrease in BVR measuredwith PGS. The AOM-AngII mice did not have any significant trends.
Conclusion: In-vivo PGS measurements of rectal colonic blood supply as well as CLE imaging revealed angiogenicdisruptions to the capillary network prior to tumor formation. Losartan demonstrated an effective way to mitigate thechanges to blood supply during tumorigenesis and reduce tumor multiplicity. These effects can be used in future studiesto understand the early vessel changes observed.
Keywords: Colorectal cancer, Early increase in blood supply, Angiogenesis, Renin angiotensin system, Field effect ofcarcinogenesis
* Correspondence: [email protected]†Sarah Ruderman and Adam Eshein contributed equally to this work.1Department of Biomedical Engineering, Northwestern University, Evanston,IL 60208, USAFull list of author information is available at the end of the article
© The Author(s). 2018 Open Access This article is distributed under the terms of the Creative Commons Attribution 4.0International License (http://creativecommons.org/licenses/by/4.0/), which permits unrestricted use, distribution, andreproduction in any medium, provided you give appropriate credit to the original author(s) and the source, provide a link tothe Creative Commons license, and indicate if changes were made. The Creative Commons Public Domain Dedication waiver(http://creativecommons.org/publicdomain/zero/1.0/) applies to the data made available in this article, unless otherwise stated.
Ruderman et al. BMC Cancer (2018) 18:814 https://doi.org/10.1186/s12885-018-4709-7

BackgroundColorectal cancer (CRC) remains the second leadingworldwide cause of cancer-related deaths across bothgenders despite being highly treatable in its early stages.CRC is generally a slow process spanning decades fromcancer initiation to diagnosis, and theoretically, providesconsiderable opportunity for early detection. Unfortu-nately, only 39% of patients are diagnosed at an earlystage of the disease when the 5-year survival rate is 90%.The 5-year survival rate drops to 14% in the late stagesof the disease when 21% of patients are diagnosed [1].Given the important survival implications, there is anemerging interest in identifying tissue changes duringthe earliest stages of colonic carcinogenesis to improvediagnostic detection and risk stratification.Primarily through neoangiogenesis, increased blood
supply is a ubiquitous hallmark of cancer [2]. Thephenomenon of early increase in blood supply (EIBS) incolon carcinogenesis has been demonstrated in both animalmodels and human trials [3–7]. In animal models, anincrease in microvascular blood supply in premalignantstages in both the azoxymethane (AOM)-treated rat andthe multiple intestinal neoplasia (MIN) mouse model ofcolonic tumorigenesis has been observed [3, 5–7]. Increasesin hemoglobin concentration ([Hb]) and density of redblood cells were quantified with polarization-gated spec-troscopy (PGS), a novel, depth-selective optical techniquedeveloped by our group [8]. Further studies using theAOM rat model demonstrated the role of nitric oxidesynthase (iNOS) a potent angiogenic factor [4], as well as ashift in balance favoring angiogenic over anti-angiogenicfactors in the premalignant stages [9]. Vasodilation andincreased microvascular density (MVD), quantified throughhistological examination, were also detected as underlyingcauses of augmented blood content at the pre-adenomastage [9]. These architectural and dynamic changes repre-sent field carcinogenesis (also referred to as field effect) thatcould be exploited to improve diagnostic detection. Geneticand environmental factors that result in a localized malig-nant colonic transformation are known to induce morewidespread biochemical and molecular changes throughoutthe colon [10]. Using PGS in vivo, we identified potentialfield carcinogenesis markers of blood supply and noted thatin the microscopically normal rectal mucosa of patientsharboring more proximal neoplasia, the superficialmicro-circulation (within 100 μm of colonic luminal sur-face) was increased, even at distances greater than 30 cmfrom the malignant lesion [4]. Additional studies have con-firmed markers of field carcinogenesis, including increasedblood supply in microscopically normal-appearing rectalmucosa of patients with advanced adenomas in the moreproximal colon [11–14].While the importance of increased blood supply and the
requirement for neoangiogenesis to support tumor growth
are unequivocal [2, 15], the stage at which the process isinitiated remains unclear. The classic “angiogenic switch”refers to the point at which tumor growth exceeds availableblood supply such that hypoxia-induced changes induce an-giogenic growth factors to promote neoangiogenesis [15].Experimental models have yet to elucidate how changes inblood supply might precede hypoxic stimuli and directlyshape subsequent tumorigenesis.There are a multitude of pathways that regulate
angiogenesis, including the renin-angiotensin system(RAS). Recent reviews have highlighted the emergingrole of the RAS in regulating tumor growth andangiogenesis in experimental cancer models as revealedby angiotensin-converting-enzyme (ACE) inhibitors [16]and angiotensin receptor blockers (ARBs) [17]. Thepro-angiogenic effects of angiotensin-II (AngII), includingneovascularization [18] and arteriolization [19], are medi-ated at least in part by stimulating the production ofgrowth factors, including vascular endothelial growthfactor (VEGF). VEGF-A is up-regulated in most humancancers and is one of the most specific and potent angio-genesis factors known [20, 21]. AngII induces angiogenesisby activating AT1 subtype receptor (AT1R), but not theAT2 subtype. AngII-AT1 effects are mediated at least inpart by the VEGF/eNOS-related pathway [22]. In a murinemodel of oxygen-induced retinal vascularization, AngIImodulated VEGF-driven sprouting angiogenesis via AT1R[23]. Further demonstrating the role for AT1R in tumorangiogenesis, Chen et al. demonstrated that AngII pro-motes cell proliferation and upregulates VEGF-A expres-sion in MCF-7 cells both in vitro and in vivo in a tumorxenograft murine model. They also reported a correlationbetween VEGF-A expression and increased microvasculardensity in human breast cancers [24]. Dougherty et al.showed that the RAS is up-regulated in a colitis model ofcolon cancer and that AngII stimulates colon cancer pro-liferation [25].In order to gain a better understanding of the role
of blood supply in shaping tumorigenesis, a methodto modulate colonic blood supply independent oftumorigenesis is needed. In this regard, the RAS con-trols blood flow. The link between the AngII/AT1Rsignaling pathway and angiogenesis in recent studies,moreover, provide evidence that the RAS plays a rolein colonic carcinogenesis. We exploited pharmaco-logical manipulations of the RAS to investigate therole of blood supply during early stages of carcino-genesis. For these studies, colonic carcinogenesis wasinduced in mice with azoxymethane (AOM), awell-established model of chemical carcinogenesis andthe RAS was modulated with either exogenousangiotensin-II or the angiotensin-II receptor (AT1)blocker, Losartan, to evaluate the effect of blood sup-ply changes on tumorigenesis.
Ruderman et al. BMC Cancer (2018) 18:814 Page 2 of 13

MethodsAnimal model and study designAnimal experimental protocols were reviewed and ap-proved by the Institutional Animal Care and Use Commit-tee (IACUC) at University of Chicago (protocol number72321). Mice were kept in IACUC approved and supervisedhousing in standard mouse plastic cages with bedding insocial living settings with no more than five mice per cage.No wire caged floors were used. Mice were kept in a 12-hlight/dark cycle. This study used 7–8 week old wild type A/J mice sourced from The Jackson Laboratory (USA) withsusceptibility to the AOM carcinogen for tumor inductionthat we have previously employed in AOM treated rats todetect morphological alterations associated with field car-cinogenesis [26, 27]. A total of 53 mice progressed in thestudy to be treated in one of three renin-angiotensin system(RAS modulation) groups: I) RAS-unmodulated control toserve as the baseline comparison for the other groups (18mice); II) AngII injections (18 mice); and III) the ARBLosartan (17 mice). The angiotensin-II peptide was admin-istered via injections (4 mg/kg of body weight i.p., 2× perweek cyclically, with 2 weeks on and 2 weeks off) to in-crease the amount of circulating AngII. Losartan was ad-ministered in the drinking water (0.1 μg/kg/day) andprovided ad libitum. It is an FDA approved drug in theclass of angiotensin-receptor blockers (ARB) that competeswith AngII for binding to the AT1 receptor and reducesthe effect of AngII. The dosage was selected after reviewingliterature and completing a short-term pilot study to evalu-ate the efficacy of drugs for each group (data not shown).The mice in each group were randomly assigned to
either the saline control condition (n = 6 miceRAS-unmodulated, 10 mice given AngII and 7 micegiven Losartan) or the AOM-treated condition (n = 12mice RAS-unmodulated, 8 mice given AngII and 10mice given Losartan). Tumors were induced with astandard protocol of serial AOM injections (7.5 mg/kg of body weight i.p.) administered weekly for6 weeks. RAS modulation (unmodulated, AngII injec-tions, or Losartan) was started 2 weeks prior to thefirst AOM injection and continued throughout thecourse of the experiment. All 53 mice were includedin all analysis and reported results.We examined microvascular changes using a com-
bination of techniques and mice were sedated withxylazine and ketamine (i.p.) for all procedures. PGSand confocal laser endomicroscopy (CLE) measure-ments were taken at the beginning of the study(0 weeks), immediately prior to AOM injections(2 weeks), and then continued every 4 weekspost-AOM injections (12 weeks until 24 weeks). Col-onoscopy was performed at the last 2 time-points(20 weeks and 24 weeks), when we expected to detecttumors based on previous studies.
Gross assessment by colonoscopyAt indicated time-points (20 and 24 weeks), a small ani-mal rigid colonoscope (Karl Storz, Germany) wasinserted per rectum under sedation and air injected via asyringe to insufflate the colon. The scope allowed visualexamination of the mouse colon and was advancedunder direct visualization at least 3 cm proximal to theanus. Still images were captured on withdrawal at 3, 2, 1,and 0.5 cm from the anal verge. Careful inspection fortumors or visible lesions was made on withdrawal. Allsuspicious lesions were photographed and noted with anestimate of tumor size and distance from the anal vergeand clock position, with 12 o’clock marking the tail.Mice were categorized into “Early tumor formers” and“Late tumor formers” based on the time-point when le-sions were detected on colonoscopy. “Early tumor for-mers” were mice with lesions detected at the 20-weekcolonoscopy examination. “Late tumor formers” weremice with lesions detected at the final colonoscopyexamination, at 24 weeks or at the time of sacrifice sincethey developed lesions at a later time-point.
Microvascular blood supply assessment by PGSPolarized-gated spectroscopy (PGS) has been described inprevious publications [4, 8, 11, 28]. The PGS fiber-opticprobe enables quantification of the blood supply withinthe pericryptal capillaries of the colonic mucosa (100 to200 μm mean penetration depth). Hemoglobin (Hb) con-tent was calculated from the PGS signal using an algo-rithm described previously [4, 8, 29]. This analysisquantified oxygenated and deoxygenated Hb concentra-tions, as well as average blood vessel radius (BVR) as in-direct measures of microcirculation. For measurementacquisition, the PGS probe was inserted per rectum andplaced in gentle contact with the normal-appearing muco-sal surface for 25 random measurements within the rec-tum. Each measurement was acquired from a uniquetissue site within the rectum. In mice with rectal tumors,measurements were acquired in rectal mucosa free of tu-mors. These data were analyzed separately from mice witha normal appearing rectum that harbored neoplasia inmore proximal areas of the colon. The latter were used toassess generalized changes in microvasculature related tothe field effect.
Microvascular structure assessment by CLEDynamic microscopic imaging was performed with a con-focal laser endomicroscopy (CLE) fiber-optic probe systemdeveloped by Mauna Kea Technologies (MKT, Cellvizio,Paris, France). Briefly, the probe is placed in contact withthe mucosa and combined with administration of a con-trast agent, delivers high quality real-time video images ofthe colonic mucosal microvessels [30]. The video rate is12 images/sec and the lateral resolution is 1 μm with an
Ruderman et al. BMC Cancer (2018) 18:814 Page 3 of 13

optical slice of 10 μm. In order to visualize vessels, micewere administered 100 μl FITC-D (70, 000 MW) as con-trast agent via tail vein injection prior to inserting the CLEprobe per rectum to capture video sequences at 3, 2, 1,and 0.5 cm from the anal verge. Representative static im-ages were selected from the recorded video sequences ateach time-point in each group and confirmed tumors andnormal appearing mucosa were also examined histologi-cally. Three investigators, blinded to treatment groups andconditions, performed offline analysis to score imagesusing the 10-point system we have previously described[31], based on loss of co-planarity, vessel dilation, sprout-ing, irregular vessel pattern and extravasation. The finalimage score was an average of the scores of the threeinvestigators.
Dil imagingBlood vessels were directly labeled by using an aqueoussolution containing 1,1′-dioctadecyl-3,3,3′,3′-tetramethy-lindocarbocyanine perchlorate (DiI) (D-282, Invitrogen/Molecular Probes; 42,364, Sigma-Aldrich) [32]. Sedatedmice were sacrificed by CO2 asphyxiation, followed bycervical dislocation. The abdominal cavity was opened viaa transverse incision and the distal abdominal aorta wasexposed. The proximal aorta was clamped in order toblock the flow to the upper body. The Dil solution wasinjected into the distal aorta using the perfusion device(consisting of two three-way stopcocks, a 30-gauge butter-fly needle and three 10-ml syringes). The perfusion orderincluded: 1) 5 ml of PBS at the rate of 1–2 ml/min; 2) 5–10 ml of the DiI solution at the rate of 1–2 ml/min; and 3)5–10 ml of the fixative at the rate of 1–2 ml/min. Afterperfusion, colon tissue was harvested and kept in 4% para-formaldehyde for 48 h. Stained and fixed, vessels werevisualized with a Leica confocal microscope.
Tissue acquisition and assaysAt 24–28 weeks after carcinogen administration, animalswere sacrificed. The entire colon (cecum to rectum) wasexcised and opened flat. Tumors were enumerated andsized and location was recorded in situ and lesions ex-cised via punch biopsy for histological analysis. A sectionof the distal colon tissue was harvested and subjected toreal-time PCR and Western blotting analysis forVEGF-A expression.
RT-PCRRNA was extracted and VEGF-A mRNA was quantifiedby real time PCR. RNA was extracted from snap frozentissue using Qiagen miRNeasy Mini Kit that capturestotal RNA including miRNA. Samples were homoge-nized with a Polytron and loaded onto an RNA-bindingspin column, washed, digested with DNase I and col-lected in 30 μl elution buffer. RNA samples were
examined by Agilent chip for RNA purity and quantifiedby Ribogreen. RNA (100 ng) was reverse transcribed intocDNA using high capacity reverse transcription kit in20 μL total volume. Incubation conditions were 25 °Cfor 10 min, 37 °C for 120 min, and 85 °C for 5 min. Theresulting first-strand complementary DNA (cDNA) wasused as template for quantitative PCR in triplicate usingfast SYBR green master mix kit. Oligonucleotide PCRprimer pairs were designed from published mousesequences in the GenBank database using Primer3 [33].The primer sequences are for forward VEGF-A F1:5’-AAF GAG GAG GGC AGA ATCAT-3′ and reverseVEGF-A R1: 5’-TCC AGG CCC TCG TCA TTG-3′. Re-verse transcribed cDNA (1:10 dilution) and primers weremixed with fast SYBR green master mixture in 20 μl. Re-actants were initially heated to 95 °C for 20 s followedby 40 cycles as follows: denaturation step at 95 °C for10 s, annealing step at 55 °C for 15 s and extension stepat 60 °C for 30 s. PCR amplification was verified by melt-ing curve analysis and predicted electrophoretic mobilityof the PCR amplicon on confirmed 3% agarose gel.There were no detectable amplifications in the negativecontrol samples (reactions lacking reverse transcriptaseor reactions without DNA template). The data were ana-lyzed using the comparative 2exp(-ΔΔCt) method, andmRNA abundance normalized to β-actin mRNA andexpressed as fold-control.
Western blot analysisProteins extracted in Laemmli buffer were assayed forVEGF-A by Western blotting. Freshly harvested colonswere placed in 2X sodium dodecyl sulfate–containingLaemmli buffer and sonicated for 1 min with a Bransonmicroprobe (Branson, Danbury, CT). After sonication,the samples were boiled for an additional 5 min andcentrifuged to remove insoluble material. Protein con-centrations were determined using RC-DC Protein Assay(BioRad Laboratories, # 500–90,119, Hercules, CA). Pro-teins were separated by glycine-based SDS-PAGE system(12% gel) and transblotted onto an Immobilon-P mem-brane (Millipore, Bedford, MA) at 75 mA overnightusing a minigel transfer apparatus (Hoefer, Holliston,MA). Membranes were stained with 0.05% India ink toassess comparable protein loading and transfer. Themembranes were blocked with Tris-buffered saline con-taining 0.05% Tween-20 and 5% dry milk and incubatedovernight with primary antibody (Santa Cruz Biotech-nology SC-7269 Monoclonal VEGF A, Dallas, TX) in 5%dry milk (pH 7.5) at a concentration of 1:150 overnightfollowed by incubation in secondary antibody (GEHealthcare ECL antimouse IgG NA931V, Marlborough,MA) at a concentration of 1:300 for 1 h at roomtemperature. Blots were re-probed for β- actin to assessloading (Sigma-Aldrich, St. Louis, MO). Densitometry
Ruderman et al. BMC Cancer (2018) 18:814 Page 4 of 13

was performed using the UN-Scan-it gel software pack-age V5.3. (Silk Scientific, Inc., Orem, UT).
Histology & Immunohistochemistry (IHC)Freshly harvested colons were fixed overnight in 4% formal-dehyde in PBS (pH 7.2), then processed and embedded inparaffin wax. 5 μm sections were mounted onVectabond-coated Superfrost Plus slides and stained withhematoxylin and eosin. An expert gastrointestinal patholo-gist reviewed all histology and identified gross and micro-scopic foci of tumors. VEGF was analyzed by IHC to assesscell of origin, including colonic epithelial cells, myofibro-blasts and endothelial cells. For VEGF-A staining sectionswere heated to 60 °C for 1 h, deparaffinized by three washesfor 5 min each in xylene, hydrated in a graded series ofethanol washes and rinsed in distilled water. Epitope re-trieval was performed by steaming for 15 min in 0.01 M cit-rate buffer (pH 6), followed by three washes for 2 min eachin Tris-buffered saline with 0.1% Tween-20 (TBST). En-dogenous peroxidase activity was quenched with methanol/H2O2 solution (0.5%). Sections were washed three times inTBST for 2 min each and blocked in protein block for20 min. Sections were incubated with primary antibody(1:50 dilution of anti-VEGF A antibody (Santa Cruz Bio-technology SC-152, Dallas, TX) for 1 h at roomtemperature. After three washes in TBST, slides were incu-bated at room temperature with 1:200 dilution of biotinyl-ated secondary antibodies for 30 min. Antigen–antibodycomplexes were detected using 3,3′-diaminobenzidine assubstrate and horseradish peroxidase–labeled DAKO EnVi-sion™ + system. After washing in distilled water, slides werecounterstained with Gill’s III hematoxylin, rinsed withwater, dehydrated in ethanol and cleared with xylene.
Statistical analysisFor non-parametric analysis, the Mann-Whitney testwas performed. For comparison of normally distributedcontinuous variables, the Student’s t-test was performed.Differences with p < 0.05 were considered statisticallysignificant. All statistically significant relationships ineach dataset are noted in figure captions as well as dis-cussed in the text.
ResultsTumorigenesisA total of 166 elevated lesions (from n = 30 mice) wereidentified and submitted for histology as presumptive tu-mors. Tumors were confirmed microscopically and inareas of extensive transformation efforts were made todistinguish single large lesions from colliding lesions. Atotal of 116 tumors were identified that comprised 72 ad-enomas and 44 carcinomas. Total tumor incidence was 9/12, 8/8 and 8/10 for AOM alone, AOM+AngII andAOM+ Losartan, respectively. As shown in Fig. 1, tumor
multiplicity trended such that mice receiving AOM+Losartan (2.9) had significantly lower multiplicity com-pared to the AOM alone group (6.3) with a p value of0.018. The AOM+AngII group was intermediate (4.5)with no statistically significant difference compared to theAOM alone group (p = 0.28).
Effects of RAS modulation and AOM treatment on VEGF-AproteinVEGF-A mRNA levels were quantified by real timePCR and all groups were normalized to the salinetreated (AOM vehicle) controls that comprised theRAS-unmodulated group (mice receiving no AngII orlosartan). Both RAS modulation and AOM-treatmentup-regulated VEGF-A in the colonic mucosa (Fig. 2a,ANOVA p = 0.004). Within the saline treated mice(no AOM), VEGF-A was up-regulated 1.7-fold in theAngII group, and 1.3-fold in the Losartan group com-pared to the RAS-unmodulated group. AOM treat-ment up-regulated VEGF-A in all of the RASmodulation groups: 2.8-fold in the AOM alone groupcompared to 2.7-fold in the AOM+AngII group, and1.5-fold in the AOM+ Losartan group (Fig. 2a). Thisgeneralized increased VEGF-A reflects a field effect inthe colonic mucosa. There was a trend, although notsignificant, for Losartan to down-regulate VEGF-Aamong the AOM-treated mice (2.8 vs. 1.5).In RAS-modulated mice without AOM, colonic
mucosal VEGF protein levels were greater than theRAS-unmodulated group without AOM as shown in arepresentative blot in Fig. 2b. Compared to RAS un-modulated mice without AOM, VEGF protein levelswere increased in the AOM alone and AOM+AngII
Fig. 1 Tumor multiplicity for each of the AOM-treated groups. TheAOM alone (no RAS modulation) group had the largest multiplicity(6.3), followed by AOM + AngII group (4.5), and AOM + Losartangroup with the lowest (2.9). The AOM + Losartan group wassignificantly lower than AOM alone (p = 0.018)
Ruderman et al. BMC Cancer (2018) 18:814 Page 5 of 13

groups. Interestingly, in the group given AOM+ Losar-tan, there was a decrease in VEGF protein levels com-pared to the AOM alone treated group.
Ex vivo vessel architecture as assessed by Dil stainingRepresentative images from the subset of mice randomlyselected for ex vivo blood vessel imaging with Dil stain-ing are shown in Fig. 3. As expected, the colon micro-vasculature from the saline animals (Fig. 3, left column)exhibited the uniform, honeycomb pattern observedwith in vivo CLE images (Fig. 6, left column) and re-ported in literature [34]. The AOM-treated mice exhib-ited abnormal vascular networks, both within tumorsand adjacent to tumors in normal-appearing mucosa. Inareas adjacent to tumors (Fig. 3, middle column), vesselsmaintained some aspects of the honeycomb structure,but varied in size, tortuosity and sprouting featuresgenerating irregular vascular patterns. The vascularnetwork within tumors (Fig. 3, right column) wascompletely disrupted, comprised of irregular vesselsof varying size and chaotic arrangements deviatingfrom the normal co-planar organization. These aber-rant vessels possess features described previously intumor neoangiogenesis [15].
PGS detects EIBS associated with tumor developmentMicrovascular perfusion in the rectal mucosa was mea-sured by PGS at multiple indicated time-points throughoutthe course of the study. At the beginning of the study (week0) all mice exhibited similar total Hb concentrations ([Hb])(ANOVA p = 0.98). Changes in total [Hb] were normalizedindividually for each mouse based on the total [Hb]recorded at wk. 0. Changes in [Hb] over time are shown inFig. 4. The RAS-unmodulated control mice (no AOM)maintained a consistent rectal [Hb] throughout the courseof the study (ANOVA p = 0.35). In order to assess bloodsupply as an indicator of tumor development,AOM-treated mice were categorized based on colonoscopyreports. Colonoscopy was performed on each mouse at 2time-points after study initiation: 20 wks and 24 wks (timeof sacrifice) and suspicious lesions were recorded. Based onthe earliest point when a lesion was noted, mice were di-vided into 2 categories: 1) early tumor formers, with sus-pected lesions prior to 20 wks; or 2) late tumor formers,with lesions noted after 20 wks.For the AOM alone group (Fig. 4a), mice in the “Early
tumor formers” subcategory exhibit an increase in bloodsupply as early as 10 weeks post-AOM injections (p =0.04) and these levels remain elevated throughout the
Fig. 2 a VEGF-A mRNA expression as assessed by RT-qPCR with data normalized to saline controls in the RAS-unmodulated group. Overall, RASmodulation and AOM-treatment up-regulated VEGF in colonic mucosa (ANOVA p= 0.004). AOM-treatment alone upregulated VEGF-A 2.8-fold in AOMalone group (p= 0.03), 2.7-fold in AOM+AngII group (p< 0.001), and 1.5-fold in AOM+ Losartan group (p= 0.08). Although not significant, there was atrend for Losartan suppressing VEGF-A expression in AOM-treated mice. Error bars represent standard error of the mean. b Representative Immunoblot ofVEGF-A protein levels for each group. Overall, RAS modulation increased VEGF-A protein levels compared to saline treated mice in the RAS-unmodulatedgroup. AOM-treatment also increased VEGF-A protein levels among the RAS-unmodulated and AOM+AngII groups. The AOM+ Losartan group exhibiteda decrease in VEGF-A compared to AOM alone or AOM+AngII
Ruderman et al. BMC Cancer (2018) 18:814 Page 6 of 13

course of the study. The mice in the “Late tumor for-mers” subcategory exhibited an increase in blood supplyat a later time-point. The most important observation isthat in both cases, the increase in blood supply is ob-served prior to the formation of any lesion. This data isconsistent with our previous studies involving theAOM-model [3, 9, 26] that demonstrated an early
increase in blood supply (EIBS) associated with risk ofneoplasia.In the AngII group (Fig. 4b), the saline-treated mice
(AOM controls) blood supply was elevated aboveRAS-unmodulated mice (Fig. 4a) indicating that the ex-ogenous AngII alone could potentially increase the rectalblood supply. The AOM+AngII mice did not display
Fig. 3 Ex vivo microvessel images with DiL staining. The saline-treated animals (AOM controls) in both RAS-unmodulated and Losartan groups(left column) exhibit the expected uniform, honeycomb structure. Adjacent to the tumor (middle column), there are minor disruptions to thevessel network, including tortuous and sprouting vessels. The vascular network within tumors (right column) is completely disrupted with vesselsof varying size and a chaotic structure
Fig. 4 Rectal microvascular perfusion measured by PGS at indicated times during tumorigenesis. Total [Hb] was individually normalized per mouse bydata recorded at week 0 for the (a) RAS-unmodulated; (b) AngII; and (c) Losartan groups. Mice were categorized based on colonoscopy reports ofsuspected lesions at 20 wks (Early tumor formers), 24 wks (Late tumor formers). The Early tumor formers in the (a) AOM alone group and (c) AOM+Losartan group exhibit an early increase in blood supply at wk. 12, a time-point preceding any visible tumors. Error bars represent standard error ofthe mean
Ruderman et al. BMC Cancer (2018) 18:814 Page 7 of 13

any significant trends in blood supply associated withtumor development.In the AOM+ Losartan group (Fig. 4c), mice that de-
veloped early lesions (prior to 20 wks) also demonstratedan early increase in blood supply similar to the AOMalone group with early tumors. In contrast an early in-crease in blood supply was not observed in the latetumor formers in this group.
PGS detects decrease in vessel radius associated withtumorigenesisAnother parameter assessed by PGS is the average vesselradius calculated from the spectra of the opticallyinterrogated tissue. Fig. 5 shows the average blood vesselradius measured by PGS for each of the 6 treatment groups(saline controls and AOM). For the RAS-unmodulatedgroup, as in the case of total [Hb], the saline controls donot show any significant blood vessel radius change overtime (ANOVA p = 0.35). However, the AOM alone mice re-veal a decrease in vessel radius, most significant at 16 wkspost-AOM injections (p = 0.01), which then, slowly in-creased to match saline-treated (AOM controls) in theRAS-unmodulated mice by the end of the study (Fig. 5a).This correlates with the small vessels observed in the CLEimages (shown in Fig. 6) and potentially indicates thesprouting of new vessels, or neoangiogenesis. In the AngIIgroup, the AOM+AngII mice also display a decreasingtrend in vessel radius throughout the study (Fig. 5b). Thesevessel size changes could reflect vasoconstriction due to theexogenous angiotensin-II and/or new vessel sprouting byVEGF induction. In the Losartan group, there are nosignificant changes over time among the Losartan aloneor AOM + Losartan mice (Fig. 5c). In the case of theAOM + Losartan mice, this could reflect the potentialanti-angiogenic properties of the ARB blocking theeffects of the carcinogen.
In-vivo microvessel architecture assessed longitudinallywith CLECLE video images revealed abnormalities in the peri-cryptal capillaries throughout tumorigenesis. At week 0,all CLE microvessel imaging depicted a uniform, honey-comb pattern expected in normal colon (similar to im-ages shown in left column of Fig. 6b). As early as week12 of the study (corresponding to 10 wks post-AOM in-jection) prior to any detectable tumors, vessel anomalieswere observed in the AOM-treated mice compared toRAS-unmodulated control group, including the presenceof tiny vessels (sprouting) and irregular or distorted pat-terns in the honeycomb structure. Fig. 6b illustratessome of the early alterations in the microvascular net-work at week 16 (prior to tumor formation) in micefrom RAS-unmodulated (top row) and Losartan (bottomrow) groups. In the RAS-unmodulated group, the micro-vessel abnormalities were more prevalent with dilationof vessels, increased sprouting and disruptions in thevascular network. The Losartan group maintained amore regular vessel network with little sprouting noted,potentially indicating the anti-angiogenic properties ofthe ARB. At later time-points, the CLE imaging withinand adjacent to tumors revealed microvascular alter-ations consistent with our previous studies on tumorangiogenesis (data not shown) [31]. Fig. 6a representsthe average CLE image scores for each group calculatedusing the semi-quantitative 10-point scoring system wedeveloped to assess microvessel features including lossof co-planarity, vessel dilation, sprouting, irregular vesselpattern and extravasation [31]. Among saline-treatedmice, the AngII group (P = 0.05), but not the Losartangroup (p = 0.2) exhibited more alterations in the micro-vascular network compared to the RAS-unmodulatedgroup. Furthermore, there was a significant differencebetween the saline-treated and AOM-treated mice in
Fig. 5 Average blood vessel radius (μm) measured by PGS. a Vessel radii in the saline (RAS-unmodulated, AOM control) group remain relativelyconstant over the study; whereas the AOM-treated mice develop a decrease in vessel radius, most pronounced at the 16 wks time-point. b TheAOM + AngII mice also show a decrease throughout the study. Decreasing vessel size may reflect sprouting new vessels. c The AOM + Losartanmice maintain a relatively constant vessel radius over the study duration. Error bars represent standard error of the mean
Ruderman et al. BMC Cancer (2018) 18:814 Page 8 of 13
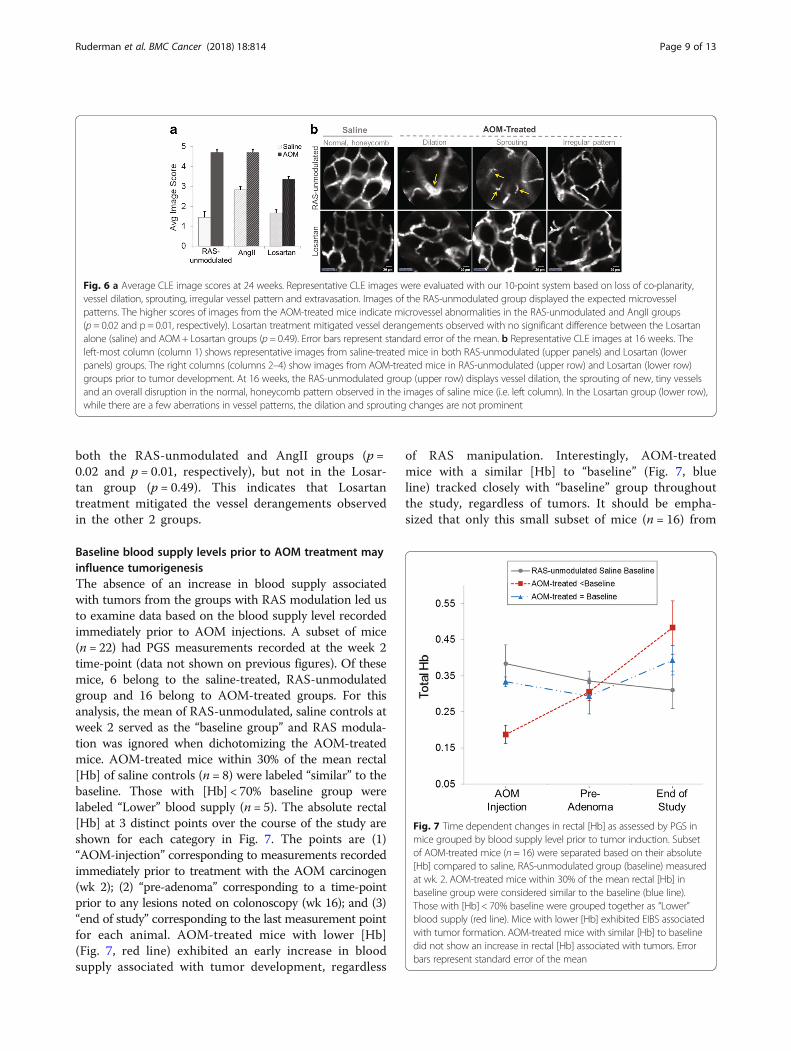
both the RAS-unmodulated and AngII groups (p =0.02 and p = 0.01, respectively), but not in the Losar-tan group (p = 0.49). This indicates that Losartantreatment mitigated the vessel derangements observedin the other 2 groups.
Baseline blood supply levels prior to AOM treatment mayinfluence tumorigenesisThe absence of an increase in blood supply associatedwith tumors from the groups with RAS modulation led usto examine data based on the blood supply level recordedimmediately prior to AOM injections. A subset of mice(n = 22) had PGS measurements recorded at the week 2time-point (data not shown on previous figures). Of thesemice, 6 belong to the saline-treated, RAS-unmodulatedgroup and 16 belong to AOM-treated groups. For thisanalysis, the mean of RAS-unmodulated, saline controls atweek 2 served as the “baseline group” and RAS modula-tion was ignored when dichotomizing the AOM-treatedmice. AOM-treated mice within 30% of the mean rectal[Hb] of saline controls (n = 8) were labeled “similar” to thebaseline. Those with [Hb] < 70% baseline group werelabeled “Lower” blood supply (n = 5). The absolute rectal[Hb] at 3 distinct points over the course of the study areshown for each category in Fig. 7. The points are (1)“AOM-injection” corresponding to measurements recordedimmediately prior to treatment with the AOM carcinogen(wk 2); (2) “pre-adenoma” corresponding to a time-pointprior to any lesions noted on colonoscopy (wk 16); and (3)“end of study” corresponding to the last measurement pointfor each animal. AOM-treated mice with lower [Hb](Fig. 7, red line) exhibited an early increase in bloodsupply associated with tumor development, regardless
of RAS manipulation. Interestingly, AOM-treatedmice with a similar [Hb] to “baseline” (Fig. 7, blueline) tracked closely with “baseline” group throughoutthe study, regardless of tumors. It should be empha-sized that only this small subset of mice (n = 16) from
Fig. 6 a Average CLE image scores at 24 weeks. Representative CLE images were evaluated with our 10-point system based on loss of co-planarity,vessel dilation, sprouting, irregular vessel pattern and extravasation. Images of the RAS-unmodulated group displayed the expected microvesselpatterns. The higher scores of images from the AOM-treated mice indicate microvessel abnormalities in the RAS-unmodulated and AngII groups(p = 0.02 and p = 0.01, respectively). Losartan treatment mitigated vessel derangements observed with no significant difference between the Losartanalone (saline) and AOM+ Losartan groups (p = 0.49). Error bars represent standard error of the mean. b Representative CLE images at 16 weeks. Theleft-most column (column 1) shows representative images from saline-treated mice in both RAS-unmodulated (upper panels) and Losartan (lowerpanels) groups. The right columns (columns 2–4) show images from AOM-treated mice in RAS-unmodulated (upper row) and Losartan (lower row)groups prior to tumor development. At 16 weeks, the RAS-unmodulated group (upper row) displays vessel dilation, the sprouting of new, tiny vesselsand an overall disruption in the normal, honeycomb pattern observed in the images of saline mice (i.e. left column). In the Losartan group (lower row),while there are a few aberrations in vessel patterns, the dilation and sprouting changes are not prominent
Fig. 7 Time dependent changes in rectal [Hb] as assessed by PGS inmice grouped by blood supply level prior to tumor induction. Subsetof AOM-treated mice (n = 16) were separated based on their absolute[Hb] compared to saline, RAS-unmodulated group (baseline) measuredat wk. 2. AOM-treated mice within 30% of the mean rectal [Hb] inbaseline group were considered similar to the baseline (blue line).Those with [Hb] < 70% baseline were grouped together as “Lower”blood supply (red line). Mice with lower [Hb] exhibited EIBS associatedwith tumor formation. AOM-treated mice with similar [Hb] to baselinedid not show an increase in rectal [Hb] associated with tumors. Errorbars represent standard error of the mean
Ruderman et al. BMC Cancer (2018) 18:814 Page 9 of 13

the total number of AOM-treated mice that survivedto the final time-point (n = 30) had data recorded atweek 2. These preliminary results, while provocative,should be interpreted with caution.
DiscussionIn this study, we used the AOM model that mimicsmany of the molecular and cellular changes observed inhuman colorectal cancer to evaluate changes duringtumor initiation and progression. We have shown anearly increase in rectal blood supply of AOM-treatedmice that developed colon tumors. We observed changeswithin the microvascular structure that occur prior totumor development. We have also demonstrated thatmodulating the RAS system with the ARB inhibitor,Losartan suppressed the changes in blood supply anddecreased tumor multiplicity. A novel aspect of thisstudy was our application of two independent technolo-gies to assess angiogenesis throughout the course of thestudy using minimally invasive methods. PGS quantifiedrectal hemoglobin concentration ([Hb]) and averageblood vessel radius (BVR) within the superficial mucosaas a measure of blood supply to the colon. CLE providedin-vivo dynamic imaging of the pericryptal microvascula-ture to assess derangements in vessel networks. To-gether these results agree with our previous reports ofan early increase in blood supply (EIBS) associated withcolonic neoplasia and support our hypothesis thatchanges in blood supply play an important causal roleduring the early stages of carcinogenesis.As noted earlier, field effects refer to widespread cellu-
lar and molecular changes in the colon resulting fromgenetic and environmental alterations that contribute tomalignant transformation [10]. Our previous studieshave established PGS as a sensitive tool to detect fieldchanges in rectal blood supply associated with concomi-tant colonic neoplasia [4, 11]. In the present study, PGSdetected EIBS in vivo prior to tumor formation. The‘Early tumor formers’ a subset of AOM-treated mice inthe AOM alone group had lesions on colonoscopy bywk. 20. However, these mice exhibited blood supplychanges as early as week 12, including a marked increasein rectal [Hb] (Fig. 4a), decrease in BVR (Fig. 5a) andaberrations in microvascular structure observed withCLE imaging (Fig. 6). In the CLE images, small, ectacticvessels resemble the neovascular sprouting we demon-strated in previous studies of tumor angiogenesis [31].Taken together, these results indicate that neoangiogen-esis in the mucosal microcirculation precedes tumor for-mation, demonstrating some of the earliest blood vesselchanges observed prior to tumor development.The neoplastic angiogenic switch is generally regarded
as occurring when a tumor outstrips the native blood sup-ply and thereby induces new vessel networks in response
to hypoxia [15]. However, the data presented here showthat vascular abnormalities mimicking neoangiogenesisprecede adenoma development. This indicates the angio-genic switch might actually be triggered in the earlieststages of tumor development, rather than later when thetumor exceeds its current blood supply. VEGF is animportant growth factor implicated in angiogenesis andwas shown to be up-regulated in the colonic mucosa as aresult of the RAS-modulation and AOM-treatment [21].While additional studies are needed to fully understandthe molecular mechanisms driving early neovasculariza-tion, these changes are consistent with the concept of fieldeffects preceding malignant transformation. Animalstreated with chemical carcinogen are predicted to developadenomas and, in that sense, they are “at risk” for neopla-sia. The microvascular changes shown in Fig. 6 are wide-spread throughout the normal appearing mucosa ofAOM-treated mice and arise prior to neoplastic lesions.Furthermore, rectal [Hb] is increased regardless of thelocation of focal malignant lesions. These widespread vas-cular changes that precede tumor development aremarkers of field effects. Further understanding of path-ways driving early vascular changes preceding tumoremergence could lead to improved diagnostic approachesand anti-angiogenic strategies to detect or prevent colonicneoplasia.The role of AngII in angiogenesis has been studied ex-
tensively and recent studies suggest a clinical potentialof the RAS as a druggable target for a wide range of can-cers [16, 23, 35]. However, only recently, the RAS link tocolon cancer has been investigated. In a murine modelof CRC liver metastasis, Neo et al. reported a significantdecrease in the number of tumors and tumor volumewith treatment using either an ARB or ACE inhibitor[36]. In a subsequent study with the same cancer model,these investigators demonstrated a distinct cancercell-associated RAS expression with increased expres-sion of AT1R, and again, ACE inhibitor treatment led toa reduced tumor volume and decrease in AT1R expres-sion [37]. In another murine model using AOM to in-duce colon carcinogenesis, Kubota et al. demonstratedthat administration of either ARBs or ACE inhibitorssignificantly reduced development of aberrant crypt foci(ACF) preneoplastic lesions in the AOM model [38]. Ina retrospective study focused on colon cancer andlong-term use of ACE inhibitors, Kedika et al. found areduction in the recurrence and development of new ad-vanced adenomatous polyps in patients who received afollow-up colonoscopy for a previously diagnosed aden-omatous polyp and were continuously receiving lisino-pril, an ACE inhibitor [39]. The present study showsthat the RAS inhibitor, Losartan, suppressed tumormultiplicity and down-regulated VEGF protein levels.Additionally, the AOM-treated mice receiving Losartan
Ruderman et al. BMC Cancer (2018) 18:814 Page 10 of 13

did not exhibit the same increase in rectal [Hb] for ‘Latetumor formers’ nor the extreme microvascular changesin varying vessel size and structure as the AOM alonegroup, pointing to the potential of ARBs to mitigatethese effects. These findings provide further support toinvestigate the anti-angiogenesis potential of the RAS in-hibition in colonic carcinogenesis.In addition to the critical time-point these studies un-
cover the potential importance of a critical blood supply“threshold” that is required to support the progressionof pre-dysplastic mucosa into tumors. Our data showthat AOM-treated mice with RAS manipulation did notexhibit the same EIBS trends associated with early tu-mors. This observation appears to support the hypoth-esis of the existence of a critical threshold. Sinceangiogenesis is required for unrestricted tumor growth,individuals that have pre-existing elevated blood supplyor overexpression of the key regulators (i.e. AngII orVEGF) may already have sufficient levels of blood supplyto foster tumor promotion without the pre-dysplasticmucosa having to trigger an early angiogenic switch. Inthis case, the tissue may not need to acquire an early in-crease in blood supply associated with neoplasia. Con-versely, if blood supply levels were depressed below thethreshold, angiogenic factors might need to be inducedin order for the tumor to grow and this might manifestas EIBS. This hypothesis might explain a previously re-ported observation that colon neoplasia is more fre-quently associated with EIBS in subjects and colonsegments which tend to have lower baseline levels ofblood supply such as proximal neoplasia in females. Thishypothesis will also be important for understanding EIBSin individuals who have preexisting gastrointestinal con-ditions which alter their baseline blood supply levels.The AOM+AngII group did not show the same in-
crease with the rectal [Hb] as the AOM alone group, yethad 100% (8/8) tumor incidence within the group. It ispossible that the vasoconstrictive properties of AngIIcoupled with the expected increase in angiogenesis fromAOM carcinogen masked changes in rectal [Hb]. Simi-larly, the complex interplay between the anti-angiogeniceffects of Losartan and tumor driven angiogenesis mayaffect field carcinogenesis in a completely different andstill unexplained manner than described for the standardAOM model used in previous studies. Rectal PGS mea-surements may not be able to detect these subtleties.Further studies will be needed to understand if add-itional biomarkers can enhance PGS detection. In part,these results stimulated the analysis of the change in[Hb] with respect to absolute values from week 2 (shownin Fig. 7). The mice demonstrating lower baseline [Hb]at the time of AOM treatment showed a rectal [Hb],that continued to increase over time as tumors devel-oped. In contrast, mice with [Hb] close to baseline
controls track with the RAS-unmodulated baselinegroup throughout the study. Perhaps the latter micehave sufficient blood supply for tumor growth, whichwould suggest that the [Hb] levels of RAS-unmodulatedsaline controls are sufficient to promote tumorigenesis.Characterizing the factors that determine an individualcritical threshold of blood supply that accurately predictsthe risk for developing a lesion could have clinical rele-vance for identifying these “high-risk” patients.There are several limitations in this study. For this
study we used a single model, the A/J strain specificallyfor its susceptibility to the AOM carcinogen andexpected tumor incidence. While the AOM carcinogenmodel is a widely used model for colorectal cancer, itwould be ideal to evaluate the role of blood supply inother murine and rodent strains or tumor modelsincluding the conditional Apc+/Min mouse model [5].In this longitudinal study, we measured only PGS andCLE at several time-points. Correlating the observedmicrovascular changes with other critical tissues changes(eg. dysplastic ACF development) could shed more lighton early angiogenic events as an indicator of tumor de-velopment. We limited our study to VEGF-A, but othermembers of the VEGF family may also be involved.There are also other angiogenic pathways beyond VEGFthat need to be explored including PDGF and matrixmetalloproteases. Furthermore, a detailed time course ofVEGF-A expression will be useful to better define thepotential causal relationship between VEGF-A andmicrovascular abnormalities. Despite these limitations,our initial promising results highlight the importance ofthe renin-angiotensin system during colonic tumorigen-esis and uncover new aspects of the role of the RAS onmicrovessel architecture in normal and transformingtissues.
ConclusionsIn conclusion, this study further supports the concept ofan early increase in rectal blood supply in associationwith the risk of developing colonic tumors. We demon-strated angiogenic alterations prior to tumor formationincluding changes in VEGF-A signaling, microvasculararchitecture, and microvascular blood supply. We alsodemonstrated that Losartan mitigated these angiogenicalterations, and lowered tumor multiplicity. This workshould stimulate further investigations into the molecu-lar mechanisms that regulate neovascularization anddrive tumor angiogenesis, which could ultimately deter-mine the risk of tumor development and the prognosisof tumor progression.
Abbreviations[Hb]: Hemoglobin concentration; ACE: Angiotensin-converting-enzyme;AngII: Angiotensin-II; ANOVA: Analysis of variance; AOM: Azoxymethane;ARB: Angiotensin receptor blocker; AT1R: AT1 subtype receptor; BVR: Blood
Ruderman et al. BMC Cancer (2018) 18:814 Page 11 of 13

vessel radius; CLE: Confocal laser endomicroscopy; CRC: Colorectal cancer;DIL: 1,1′-dioctadecyl-3,3,3′,3′-tetramethylindocarbocyanine perchlorate;EIBS: Early increase in blood supply; IACUC: Institutional Animal Care and UseCommittee; IHC: Immunohistochemistry; MIN: Multiple intestinal neoplasia;MVD: Microvascular density; NOS: Nitric oxide synthase; PGS: Polarizationgated spectroscopy; RAS: Renin angiotensin system; TBST: Tris-buffered salinewith 0.1% Tween-20; VEGF: Vascular endothelial growth factor
AcknowledgementsThe authors wish to thank the Animal Resources Center (ARC) at theUniversity of Chicago, which is responsible for the animal procurement,facilities, husbandry, and specialized veterinary services.
FundingThis study was supported by the National Institutes of Health under grantNos. R01CA183101 and R01CA165309. AE was supported by a NationalInstitutes of Health Predoctoral Fellowship award under grant No.F31 EB022414. The funding sources had no role in the design of the study,data collection, data analysis, interpretation of data or in writing themanuscript.
Availability of data and materialsThe datasets used in the current study are available from the correspondingauthor on reasonable request.
Authors’ contributionsSR and AE contributed equally to this article and wrote the manuscript. SR,AE, MB, VK and VB revised the manuscript. SR, VV, UD, AA and VKcontributed to the collection of the data. SR, AE, VV, UD, AA, AG, AS, BP, HKR,JH, MB, VK and VB contributed to the analysis and interpretation of the data.HKR, VK and VB designed and supervised the study. All authors have readand approved the final manuscript.
Ethics approval and consent to participateAnimal experimental protocols were reviewed and approved by theInstitutional Animal Care and Use Committee (IACUC) at University ofChicago (protocol number 72321).
Consent for publicationNot applicable.
Competing interestsDrs. Roy, and Backman are cofounders/shareholders of American BioOpticsLLC. The remaining authors declare no conflicts of interest.
Publisher’s NoteSpringer Nature remains neutral with regard to jurisdictional claims inpublished maps and institutional affiliations.
Author details1Department of Biomedical Engineering, Northwestern University, Evanston,IL 60208, USA. 2Center for Endoscopic Research and Therapeutics, Universityof Chicago Medicine, Chicago, IL 60637, USA. 3Department ofGastroenterology, Rush University, Chicago, IL 60612, USA. 4Department ofGastroenterology, Boston Medical Center, Boston, MA 02118, USA.
Received: 2 January 2018 Accepted: 31 July 2018
References1. Siegel RL, Miller KD, Fedewa SA, Ahnen DJ, Meester RGS, Barzi A, et al.
Colorectal cancer statistics, 2017. CA Cancer J Clin [Internet]. 2017;67:177–93.[cited 2017 Nov 15]. Available from: http://doi.wiley.com/10.3322/caac.21395.
2. Folkman J, Watson K, Ingber D, Hanahan D. Induction of angiogenesisduring the transition from hyperplasia to neoplasia. Nature [Internet]. 1989;339:58–61. [cited 2017 Nov 15]. Available from: http://www.nature.com/doifinder/10.1038/339058a0.
3. Wali RK, Roy HK, Kim YL, Liu Y, Koetsier JL, Kunte DP, et al. Increasedmicrovascular blood content is an early event in colon carcinogenesis. Gut[Internet]. BMJ Publishing Group; 2005 [cited 2017 Nov 15];54:654–60.Available from: http://www.ncbi.nlm.nih.gov/pubmed/15831911.
4. Roy HK, Gomes A, Turzhitsky V, Goldberg MJ, Rogers J, Ruderman S, et al.Spectroscopic Microvascular Blood Detection From the EndoscopicallyNormal Colonic Mucosa: Biomarker for Neoplasia Risk. Gastroenterology[Internet]. W.B. Saunders; 2008 [cited 2017 Nov 15];135:1069–78. Availablefrom: http://www.sciencedirect.com/science/article/pii/S0016508508011001.
5. Hinoi T, Akyol A, Theisen BK, Ferguson DO, Greenson JK, Williams BO, et al.Mouse model of colonic adenoma-carcinoma progression based onsomatic Apc inactivation. Cancer Res. [Internet]. American Association forCancer Research; 2007 [cited 2017 Nov 15];67:9721–30. Available from:http://www.ncbi.nlm.nih.gov/pubmed/17942902.
6. Ruderman S, Valuckaite V, Almoghrabi A, Hart J, Roy HK, Bissonnette M, etal. Early angiogenic changes associated with field carcinogenesis inexperimental colon cancer. Gastroenterology [Internet]. AGA Institute. 2015;148:S172. Available from: http://www.embase.com/search/results?subaction=viewrecord&from=export&id=L71884938.
7. Valuckaite V, Ruderman S, Almoghrabi A, Hart J, Abdyrakov A, Roy HK, et al. Anovel use of angiotensin II receptor blocker (ARB) losartan to inhibit AOMinduced tumorigenesis and neoangiogenesis in experimental colon cancer.Gastroenterology [Internet]. Elsevier; 2015 [cited 2018 Jul 27];148:S172.Available from: http://linkinghub.elsevier.com/retrieve/pii/S0016508515305746.
8. Turzhitsky VM, Gomes AJ, Kim YL, Liu Y, Kromine A, Rogers JD, et al.Measuring mucosal blood supply in vivo with a polarization-gating probe.Appl Opt [Internet]. 2008;47:6046–57. Available from: http://www.pubmedcentral.nih.gov/articlerender.fcgi?artid=2728617&tool=pmcentrez&rendertype=abstract.
9. Tiwari AK, Crawford SE, Radosevich A, Wali RK, Stypula Y, Kunte DP, et al.Neo-angiogenesis and the premalignant micro-circulatory augmentation ofearly colon carcinogenesis. Cancer Lett. 2011;306:205–13. [Internet]. Elsevier;[cited 2017 Nov 15]. Available from: http://www.sciencedirect.com/science/article/pii/S0304383511001571
10. Braakhuis BJM, Tabor MP, Kummer JA, Leemans CR, Brakenhoff RH. Agenetic explanation of Slaughter’s concept of field Cancerization. CancerRes. 2003;63:1727–30.
11. Gomes AJ, Roy HK, Turzhitsky V, Kim Y, Rogers JD, Ruderman S, et al. Rectalmucosal microvascular blood supply increase is associated with colonicneoplasia. Clin. Cancer Res. 2009;15:3110–7. [Internet]. American Associationfor Cancer Research [cited 2017 Nov 15]. Available from: http://www.ncbi.nlm.nih.gov/pubmed/19383816.
12. Roy HK, Gomes AJ, Ruderman S, Bianchi LK, Goldberg MJ, Stoyneva V, et al.Optical measurement of rectal microvasculature as an adjunct to flexiblesigmoidosocopy: gender-specific implications. Cancer Prev Res (Phila). 2010;3:844–51. [Internet]. American Association for Cancer Research; [cited 2017Nov 15]. Available from: http://www.ncbi.nlm.nih.gov/pubmed/20570881.
13. Radosevich AJ, Mutyal NN, Eshein A, Nguyen T-Q, Gould B, Rogers JD, et al.Rectal optical markers for in vivo risk stratification of premalignant colorectallesions. Clin Cancer Res [Internet] 2015;21:4347–55. Available from: http://clincancerres.aacrjournals.org/cgi/doi/10.1158/1078-0432.CCR-15-0136.
14. Wu W, Radosevich AJ, Eshein A, Nguyen T-Q, Yi J, Cherkezyan L, et al. Usingelectron microscopy to calculate optical properties of biological samples.Biomed Opt Express [Internet]. 2016;7:4749. Optical Society of America;[cited 2017 Nov 15]. Available from: https://www.osapublishing.org/abstract.cfm?URI=boe-7-11-4749.
15. Bergers G, Benjamin LE. Angiogenesis: Tumorigenesis and the angiogenic switch.Nat. Rev. Cancer [Internet]. 2003;3:401–10. Nature Publishing Group; [cited 2017Nov 15]. Available from: http://www.nature.com/doifinder/10.1038/nrc1093.
16. Deshayes F, Nahmias C. Angiotensin receptors: a new role in cancer? TrendsEndocrinol Metab. 2005;16:293–9. [Internet]. Elsevier Current Trends; [cited2017 Nov 15]. Available from: http://www.sciencedirect.com/science/article/pii/S1043276005001566.
17. Willis LM, El-Remessy AB, Somanath PR, Deremer DL, Fagan SC. Angiotensinreceptor blockers and angiogenesis: clinical and experimental evidence. ClinSci (Lond). 2011;120:307–19. [Internet]. Portland Press Limited; [cited 2017Nov 15]. Available from: http://www.ncbi.nlm.nih.gov/pubmed/21488224.
18. Fernandez LA, Twickler J, Mead A. Neovascularization produced byangiotensin II. J Lab Clin Med. 1985;105:141–5. [Internet]. [cited 2017 Nov15]. Available from: http://www.ncbi.nlm.nih.gov/pubmed/2579174.
19. le Noble FAC, Kessels-van Wylick LCGA, Hacking WJG, Slaaf DW, oudeEgbrink MGA, Struijker-Boudier HAJ. The Role of Angiotensin II andProstaglandins in Arcade Formation in a Developing Microvascular Network.J Vasc Res [Internet]. 1996;33:480–8. Karger Publishers; [cited 2017 Nov 15].Available from: https://www.karger.com/Article/FullText/159187.
Ruderman et al. BMC Cancer (2018) 18:814 Page 12 of 13

20. Hicklin DJ, Ellis LM. Role of the vascular endothelial growth factor pathwayin tumor growth and angiogenesis. J Clin Oncol [Internet]. 2005;23:1011–1027. American Society of Clinical Oncology; [cited 2017 Nov 15] Availablefrom: http://ascopubs.org/doi/10.1200/JCO.2005.06.081
21. Zhu Z, Zhong H, Zhou Q, Hu X, Chen D, Wang J, et al. Inhibition of PKRimpairs angiogenesis through a VEGF pathway. Am J Physiol - EndocrinolMetab [Internet]. 2015;308:E518–E524. Available from: http://ajpendo.physiology.org/lookup/doi/10.1152/ajpendo.00469.2014.
22. Tamarat R, Silvestre J-S, Durie M, Levy BI. Angiotensin II Angiogenic Effect InVivo Involves Vascular Endothelial Growth Factor- and Inflammation-RelatedPathways. Lab Investig [Internet]. 2002;82:747–56. Nature Publishing Group;[cited 2017 Nov 15] Available from: http://www.nature.com/doifinder/10.1097/01.LAB.0000017372.76297.EB.
23. Carbajo-Lozoya J, Lutz S, Feng Y, Kroll J, Hammes HP, Wieland T. Angiotensin IImodulates VEGF-driven angiogenesis by opposing effects of type 1 and type 2receptor stimulation in the microvascular endothelium. Cell Signal [Internet].2012;24:1261–9. [Pergamon; cited 2017 Nov 15]. Available from: http://www.sciencedirect.com/science/article/pii/S0898656812000629.
24. Chen X, Meng Q, Zhao Y, Liu M, Li D, Yang Y, et al. Angiotensin II type 1receptor antagonists inhibit cell proliferation and angiogenesis in breastcancer. Cancer Lett [Internet]. 2013;328:318–24. Elsevier; [cited 2017 Nov 15].Available from: http://www.sciencedirect.com/science/article/pii/S0304383512005940.
25. Dougherty U, Mustafi R, Sadiq F, Almoghrabi A, Mustafi D, Kreisheh M, et al.The renin-angiotensin system mediates EGF receptor-vitamin d receptorcross-talk in colitis-associated colon cancer. Clin Cancer Res [Internet]. 2014;20:5848–59. American Association for Cancer Research; [cited 2017 Nov 15]Available from: http://www.ncbi.nlm.nih.gov/pubmed/25212605.
26. Roy HK, Liu Y, Wali RK, Kim YL, Kromine AK, Goldberg MJ, et al. Four-Dimensional Elastic Light-Scattering Fingerprints as Preneoplastic Markers inthe Rat Model of Colon Carcinogenesis. Gastroenterology [Internet]. 2004;126:1071–81. W.B. Saunders; [cited 2017 Nov 15]. Available from: http://www.sciencedirect.com/science/article/pii/S0016508504000290.
27. Gomes AJ, Ruderman S, Dela Cruz M, Wali RK, Roy HK, Backman V. In vivomeasurement of the shape of the tissue-refractive-index correlationfunction and its applicationto detection of colorectal field carcinogenesis. JBiomed Opt [Internet]. 2012;17:47005. International Society for Optics andPhotonics; [cited 2017 Nov 15]. Available from: http://biomedicaloptics.spiedigitallibrary.org/article.aspx?doi=10.1117/1.JBO.17.4.047005.
28. Eshein A, Radosevich AJ, Gould B, Wu W, Konda V, Yang LW, et al. Fullyautomated fiber-based optical spectroscopy system for use in a clinicalsetting. J Biomed Opt. [Internet]. 2018;23:1. Available from: https://www.spiedigitallibrary.org/journals/journal-of-biomedical-optics/volume-23/issue-07/075003/Fully-automated-fiber-based-optical-spectroscopy-system-for-use-in/10.1117/1.JBO.23.7.075003.full.
29. Radosevich AJ, Eshein A, Nguyen T-Q, Backman V. Subdiffusion reflectancespectroscopy to measure tissue ultrastructure and microvasculature: modeland inverse algorithm. J Biomed Opt. 2015;20:097002.
30. Kiesslich R, Burg J, Vieth M, Gnaendiger J, Enders M, Delaney P, et al.Confocal laser endoscopy for diagnosing intraepithelial neoplasias andcolorectal cancer in vivo. Gastroenterology [Internet]. 2004;127:706–13. W.B.Saunders; [cited 2017 Nov 15]. Available from: http://www.sciencedirect.com/science/article/pii/S0016508504011825.
31. JAV Konda, Becker V, Ruderman S, Dougherty U, Hart J, Gonzalez Haba RuizM, et al. In Vivo Assessment of Tumor Vascularity Using Confocal LaserEndomicroscopy in Murine Models of Colon Cancer. Bentham SciencePublishers; [cited 2017 Nov 15]. Available from: http://www.ingentaconnect.com/content/ben/cag/2013/00000002/00000001/art00009.
32. Li Y, Song Y, Zhao L, Gaidosh G, Laties AM, Wen R. Direct labeling andvisualization of blood vessels with lipophilic carbocyanine dye DiI. NatProtoc. 2008;3:1703–8.
33. Livak KJ, Schmittgen TD. Analysis of Relative Gene Expression Data UsingReal-Time Quantitative PCR and the 2−ΔΔCT Method. Methods [Internet].2001;25:402–8. Academic Press; [cited 2017 Nov 15]. Available from: http://www.sciencedirect.com/science/article/pii/S1046202301912629.
34. Konerding MA, Fait E, Gaumann A. 3D microvascular architecture of pre-cancerous lesions and invasive carcinomas of the colon. Br J Cancer[Internet]. 2001;84:1354–1362. Nature Publishing Group; [cited 2017 Nov 15].Available from: http://www.nature.com/doifinder/10.1054/bjoc.2001.1809.
35. George AJ, Thomas WG, Hannan RD. The renin–angiotensin system andcancer: old dog, new tricks. Nat Rev Cancer [Internet]. 2010;10:745–59.
Nature Publishing Group; [cited 2017 Nov 15]. Available from: http://www.nature.com/doifinder/10.1038/nrc2945.
36. Neo JH, Malcontenti-Wilson C, Muralidharan V, Christophi C. Effect of ACEinhibitors and angiotensin II receptor antagonists in a mouse model ofcolorectal cancer liver metastases. J Gastroenterol Hepatol [Internet]. 2007;22:577–84. Blackwell Publishing Asia; [cited 2017 Nov 15]. Available from:http://doi.wiley.com/10.1111/j.1440-1746.2006.04797.x.
37. Neo JH, Ager EI, Angus PW, Zhu J, Herath CB, Christophi C. Changes in therenin angiotensin system during the development of colorectal cancer livermetastases. BMC Cancer [Internet]. 2010;10:134. BioMed Central; [cited 2017Nov 15] Available from: http://bmccancer.biomedcentral.com/articles/10.1186/1471-2407-10-134.
38. Kubota M, Shimizu M, Sakai H, Yasuda Y, Ohno T, Kochi T, et al. Renin–angiotensin system inhibitors suppress azoxymethane-induced colonicpreneoplastic lesions in C57BL/KsJ-db/db obese mice. Biochem Biophys ResCommun [Internet]. 2011;410:108–13. [cited 2017 Nov 15]. Available from:http://linkinghub.elsevier.com/retrieve/pii/S0006291X11008904.
39. Kedika R, Patel M, Pena Sahdala HN, Mahgoub A, Cipher D, Siddiqui AA.Long-term Use of Angiotensin Converting Enzyme Inhibitors Is AssociatedWith Decreased Incidence of Advanced Adenomatous Colon Polyps. J ClinGastroenterol [Internet]. 2011;45:e12–6. [cited 2017 Nov 15]. Available from:http://content.wkhealth.com/linkback/openurl?sid=WKPTLP:landingpage&an=00004836-201102000-00021.
Ruderman et al. BMC Cancer (2018) 18:814 Page 13 of 13