dynamics of the energy spectra of solar proton events observed in solar cycle 23
TRANSCRIPT

ISSN 0038�0946, Solar System Research, 2012, Vol. 46, No. 3, pp. 220–242. © Pleiades Publishing, Inc., 2012.Original Russian Text © I.S. Veselovsky, I.N. Myagkova, O.S. Yakovchouk, 2012, published in Astronomicheskii Vestnik, 2012, Vol. 46, No. 3, pp. 235–258.
220
INTRODUCTION
Background fluxes of suprathermal and energeticcharged particles on the Sun and in the heliosphere arealways present as the tails of velocity distribution func�tions. The protons and other ions can acquire particu�larly strong accelerations during solar flares due toelectrostatic and induction fields, as well as at the frontof shock waves propagating in the solar corona andinterplanetary space after powerful coronal mass ejec�tions (CMEs). These CMEs move at super�Alfve�nvelocities and can accelerate seed populations ofsuprathermal particles, which are always present;however we do not have, enough reliable informationon these particles so far. All these processes are com�plicated and diversified. They determine fluxes andcomposition of particles, their energy and angular dis�tribution both in the heliosphere and, particularly,close to the Earth. Such enhancements of protonfluxes exceed the threshold values chosen before arecalled “proton events”.
The importance to study the energy spectra of solarproton events is useful for identification the origins ofthe particles and for estimations the possible maxi�mum energies and fluxes (Getselev et al., 2004; Belovet al., 1995; Miroshnichenko, 1996; Miroshnichenkoet al., 2001, 2008). Currently, researchers are trying toestablish if there is a possibility of proton events fore�cast in order to have enough time to pursue practicalgoals, such as warning of radiation dangers in near�Earth and interplanetary space (Mavromikhalakiet al., 2009; Laurenza et al., 2009; Kane, 2011). Thebest�known feature of such a danger is a direct mag�netic coupling of the observation point to the place of
solar flares along the spiral estimated interplanetaryfield lines. Western flares for this reason are on averagemore effective.
The solar proton events observed in the heliosphereand magnetosphere, and related to flares and coronalmass ejecta, have a wide variety of energy spectra; thedynamics of their basic parameters hardly ever has anycommon features. Such variety and rapid evolution oftheir spectra in time are due to the acceleration andpropagation processes of energetic particles at allstages of the solar fllares development in the solarcorona and electromagnetic transients in the inhomo�geneous and nonstationary interplanetary solar windplasma, and inside the magnetosphere.
The assumption that the proton fluxes should beidentical at different points of the near�Earth space;generally, can lead to significant errors in the datainterpretation. It can be due to the angular distributionof particles, which is significant anisotropic in somecases. The anisotropy can cause the particles to focusin regions of stronger fields (if the angular distributionhas an elongated form relative to the magnetic field);or, if the angular distribution has an oblate form, theparticle fluxes can be reduced and reflected in regionsof the highest field intensity. The same processes maybe responsible for the observations of filled and emptysectors of the interplanetary magnetic field, as well asaccumulations (or absence of accumulations) in thevicinity to shock waves and discontinuities. Moreover,the variety of local particle acceleration mechanismscan play a significant role. The variety, complexity, andinsufficient knowledge concerning the solar corpuscu�lar radiation require to use statistical and stochasticmodels in practical applications, in particular, when it
Dynamics of the Energy Spectra of Solar Proton Events Observedin Solar Cycle 23
I. S. Veselovskya, b, I. N. Myagkovaa, and O. S. Yakovchouka
a Skobeltsyn Institute of Nuclear Physics, Moscow State University, Moscow, 119991 Russiab Space Research Institute, Russian Academy of Sciences, Moscow, 117997 Russia
Received December 15, 2011
Abstract—The proton energy spectra I(E, t) as functions of time were obtained and analyzed in the energyrange of a few tens of MeV on the basis of GOES observations of proton enhancements during solar cycle 23.The energy spectra were approximated by power�law functions. We found a wide variety of functions I(E, t)for studied events. The spectra cannot be described by a universal function of time, although three groups ofproton events seem to have some common features. This allows us to outline an approach to their empiricalclassification in future using a number of dimensionless scaling parameters. The regularities we observe maybe partly due to the dynamical processes occurring on the Sun, in the heliosphere, and magnetosphere.
DOI: 10.1134/S0038094612030033

SOLAR SYSTEM RESEARCH Vol. 46 No. 3 2012
DYNAMICS OF THE ENERGY SPECTRA OF SOLAR PROTON EVENTS 221
Lis
t pro
ton
eve
nts
acc
ordi
ng
to th
e G
OE
S d
ata
duri
ng
2001
–20
06. A
ny
exce
ss o
f the
pro
ton
flux
wit
h en
ergy
>10
0 M
eV a
bove
the
leve
l of 1
pfu
(1
prot
on/c
m2 s
sr)
is c
on�
side
red
as th
e “e
ven
t”. T
he c
olum
ns
are
as fo
llow
s: (
1) n
o. o
f the
sel
ecte
d ev
ent,
(2)
no.
of t
he e
ven
t acc
ordi
ng
to th
e da
taba
se o
f the
gro
und
leve
l en
han
cem
ents
of c
osm
icra
y fl
ux (h
ttp:
//w
ww.
wdc
b.ru
/stp
/dat
a/co
smic
.ray
/G%
20L
%20
E/A
_GL
E_
LIS
T/G
LE
BA
SE
S.T
XT
), (3
) dat
e of
the
even
t, (4
) beg
inn
ing
of th
e ev
ent (
day/
UT
), (
5) m
ax�
imum
(da
y/U
T),
(6)
en
d of
th
e ev
ent
(day
/UT
), (
7) m
axim
um f
lux
(in
pfu
for
th
e pr
oton
s w
ith
en
ergi
es >
100
MeV
), (
8) S
�cla
ss a
ccor
din
g to
th
e N
OA
A s
cale
, (9
)in
dex
of t
he
diff
eren
tial
spe
ctru
m a
t th
e m
axim
um o
f pr
oton
flu
x >
100
MeV
, (1
0) m
axim
um i
nde
x of
th
e di
ffer
enti
al s
pect
rum
of
prot
ons
in t
he
ener
gy r
ange
9–
165
MeV
, (1
1) d
ate
of t
he
sola
r fl
are,
(12
) un
iver
sal t
ime
of t
he
flar
e ev
ent,
(13
) X
�ray
cla
ss o
f th
e fl
are
and
its
grad
e in
opt
ics,
(14
) co
ordi
nat
es o
f th
e ac
tive
reg
ion
,an
d (1
5) n
o. o
f act
ive
regi
on a
ccor
din
g to
th
e N
OA
A c
lass
ific
atio
n
12
34
56
78
910
11 1
213
14
15
103
.04.
2001
03/0
1:20
03/0
7:40
03/2
0:50
5 3
–1.
8–
3.9
02.0
4.20
0121
:51
X20
N18
W82
9393
212
.04.
2001
12/1
3:05
12/1
7:25
12/2
0:10
1.5
2–
0.6
–3.
509
.04.
2001
15:2
0M
7.9/
2BS
21W
0894
15
360
15.0
4.20
0115
/14:
0515
/15:
2517
/05:
0514
6 2
––
2.5
15.0
4.20
0113
:50
X14
/2B
S20
W85
9415
461
18.0
4.20
0118
/02:
5518
/06:
0019
/03:
2513
2–
1.9
–2.
618
.04.
2001
02:1
4C
2S
20W
lim
b94
15
5
16.0
8.20
0116
/01:
0516
/03:
0517
/14:
0529
2
––
2.5
Far
sid
e of
th
e S
un
6
24.0
9.20
0124
/14:
4025
/07:
5525
/19:
4031
4
–1.
4–
3.6
24.0
9.20
0110
:38
X2/
2BS
16E
2396
32
762
04.1
1.20
0104
/16:
5006
/02:
2006
/23:
1525
34
–1
–3.
404
.11.
2001
16:2
0X
1/3B
N06
W18
9684
8
22.1
1.20
0122
/22:
5024
/02:
2524
/11:
554.
6 4
–2
–4.
622
.11.
2001
23:3
0M
9/2N
S15
W34
9704
963
26.1
2.20
0126
/05:
5526
/07:
2026
/19:
3550
2–
1.4
–3.
526
.12.
2001
05:4
0M
7/1B
N08
W54
9742
10
21.0
4.20
0221
/01:
5521
/10:
2522
/23:
3523
3
–0.
5–
3.3
21.0
4.20
0201
:51
X1/
1FS
14W
8499
06
11
22.0
8.20
0222
/03:
4022
/05:
1022
/06:
151
1–
1.7
–2
22.0
8.20
0201
:57
M5/
2BS
07W
6269
1264
24.0
8.20
0224
/01:
3024
/02:
1024
/18:
2529
2–
0.8
–3.
524
.08.
2002
01:1
2X
3/1F
S08
W90
69
1326
.10.
2003
*1
1–
3.7
–4
26.1
0.20
0318
:19
X1/
N1
N02
W38
484
1465
28.1
0.20
0328
/11:
5029
/00:
1531
/01:
4518
64
–1.
7–
3.6
28.1
0.20
0309
:51
X17
/4B
S16
E08
486
1566
29.1
0.20
0328
/11:
5029
/00:
1531
/01:
4518
6 4
–1.
8–
3.7
29.1
0.20
03
20:3
7X
10/2
BS
17W
10
486
1667
02.1
1.20
0302
/17:
4002
/19:
0503
/17:
2049
3–
0.8
–4
02.1
1.20
03
17:0
3X
8.3
S17
W63
486
17
05.1
1.20
0305
/05:
3505
/05:
4005
/07:
051
2–
0.7
–4
04.1
1.20
0319
:29
X28
/3B
S19
W83
486
18
01.1
1.20
0401
/06:
4101
/06:
4501
/08:
001
1–
1–
2.6
Far
sid
e of
th
e S
un
19
07.1
1.20
0410
/03:
2010
/03:
3011
/12:
552
2–
3.6
–4.
107
.11.
2004
16:0
6X
2N
09W
1769
6
2068
17.0
1.20
0517
/12:
1517
/17:
0018
/22:
0528
3–
1.5
–2.
215
.01.
2005
23:0
2X
2N
15W
0572
0
2169
20.0
1.20
0520
/06:
5020
/07:
1021
/18:
4565
23
––
2.5
20.0
1.20
0506
:36
X7
72
0
22
16.0
6.20
0516
/21:
2516
/23:
1517
/07:
303
1–
1–
1.3
16.0
6.20
0520
:22
M4
N09
W87
775
23
08.0
9.20
0508
/04:
0509
/19:
2011
/05:
458
3–
0.2
–3.
307
.09.
2005
17:4
0X
17/3
BS
06E
8980
8
24
06.1
2.20
0607
/01:
15 7
/16:
1009
/07:
3519
3
–1.
5–
2.6
05.1
2.20
0610
:35
X9/
2NS
07E
7993
0
2570
13.1
2.20
0613
/03:
0013
/05:
2514
/11:
5088
2
––
3.2
13.1
2.20
0602
:40
X3/
4BS
05W
2393
0
26
14.1
2.20
0614
/22:
5515
/00:
1514
/03:
252
22
213
.12.
2006
02:4
0X
3/4B
S05
W23
930
*E
ven
t 13
of O
ctob
er 2
6, 2
003
is t
oo w
eak
to d
eter
min
e th
e pa
ram
eter
s of
its
deve
lopm
ent
in t
ime.

222
SOLAR SYSTEM RESEARCH Vol. 46 No. 3 2012
VESELOVSKY et al.
1E+0
1E–554321 876
1E+1
1E–1
1E–2
1E–3
1E–4
April 2001
Flu
x of
sol
ar p
roto
ns,
1/(
сm2 s
sr
MeV
)
4
–100
APEV�21760
800
1100
0
Bx,
By,
nT
4020
0
–200
600
10
010
10010
10010
0–10
–10B,
Bz,
nT
T,
eVn,
cm
–3
V,
km/s
Dst
, n
TA
p
3
2
1 D
iffe
ren
tial
spe
ctra
l in
dex
Fig. 1. Event 1. Upper panel: geomagnetic indices Ap and Dst; velocity, density, and temperature of the solar wind; interplanetarymagnetic field B and its components Bz, Bx, and By between April 1 and 7, 2001. Lower panel: flux of solar protons and their dif�ferential spectral index in the energy range 9–165 MeV as function of time.
concerns the prediction of the radiation situation andvarious technical standards (Getselev et al., 2001).
The first indications of the energy spectra varietyand the intensity of solar proton events were obtainedlong ago due to comparsion of ground�based andstratospheric measurements after strong solar flares(Charakhch’yan et al., 1961). At that time, anexistance of relation between effects observed in cos�mic rays and the plasma dynamical conditions in the
heliosphere was proposed, in spite of there was nodirect evidence to support this hypothesis. The directproof was obtained when we qualitatively consideredthe satellite data for a number of the latest events,without detailed analysis of their energy spectra form(Veselovsky et al., 2011).
In this paper, we analyze quantitatively the energyspectra of proton events in more detail using theapproximation by a power�law function for each

SOLAR SYSTEM RESEARCH Vol. 46 No. 3 2012
DYNAMICS OF THE ENERGY SPECTRA OF SOLAR PROTON EVENTS 223
1E–5131211109 161514
1E–4
April 2001
Flu
x of
sol
ar p
roto
ns,
1/(
сm2 s
sr
MeV
)
5
–100
APEV�221200
800
1100
Bx,
By,
nT
1000
–200
600
10
10
B,
Bz,
nT
T,
eVn,
cm
–3
V,
km/s
Dst
, n
TA
p
3
2
1D
iffe
ren
tial
spe
ctra
l in
dex
200
200
–20
–20
1
4
1E–3
1E–2
1E–1
1E+0
1E+1
Fig. 2. The same as in Fig. 1; April 9–15, 2001.
event. The general conclusion is confirmed that thereare no standards in relations of the particle fluxes andenergy, or particle fluxes and time in the solar protonevents observed in the 23rd cycle of solar activity; thecauses of absence such regular relations are discussed,although the opposite assumptions still exist in the lit�erature. The conclusions are made based on the anal�ysis of the data registered on the GOES (Geostation�ary Operational Environmental Satellites) in solarcycle 23.
DATA ANALYSIS
There are several catalogues of proton events thatintegrate the data from spacecrafts, neutron monitors,muon detectors, riometers, and balloon observations(see, for example, Bazilevskaya et al., 1986; Shea andSmart, 1990; Miroshnichenko et al., 2001; Kurt et al.,2004; Belov et al., 2010).
In this paper, we use the data on solar proton fluxesmeasured onboard the GOES spacecraft (www.swpc.noaa.gov). We consider protons with energies

224
SOLAR SYSTEM RESEARCH Vol. 46 No. 3 2012
VESELOVSKY et al.
1E–51918171615 222120
1E–4
April 2001
Flu
x of
sol
ar p
roto
ns,
1/(
сm2 s
sr
MeV
)
4
–20
APEV�223140
0
Bx,
By,
nT
1006020
–60
500
10
10
20
100
–10
–20B,
Bz,
nT
T,
eVn,
cm
–3
V,
km/s
Dst
, n
TA
p
3
2
1
Dif
fere
nti
al s
pect
ral i
nde
x
1E–3
1E–2
1E–1
1E+0
1E+1
1E+2
1
400
1
–100
Fig. 3. The same as in Fig. 1; April 15–21, 2001.
Е > 10 MeV and E > 100 MeV; the fluxes are expressed inpfu (proton flux units), where 1 pfu = 1 proton/cm2 s sr.The events were selected on the basis of the proton fluxwith energies higher than 100 MeV using GOES obser�vations during the period 2001–2006. The “event” wasconsidered as occurred if the flux of protons with ener�gies higher than 100 MeV exceeded the unit level.According to the table, 26 events were recorded alto�gether, which corresponded to this criterion; 11 ofthese events caused ground level enhancements of cos�mic rays (GLE—Ground Level Event). Ordering
numbers of events are given in the second column ofthe table according to the database of ground level fluxenhancements.
We use as well the five�level scale (S1–S5) classifi�cation proposed by the NOAA (The National Oceanicand Atmospheric Administration) to classify theseevents (www. sec.noaa.gov/NOAAscales/). Class S1corresponds to the minor level of disturbances in thenear�Earth space with a flux of 10–100 pfu at energiesE > 10 MeV, class S2 to moderate perturbations with aflux of 100–1000 pfu, class S3 to strong perturbations

SOLAR SYSTEM RESEARCH Vol. 46 No. 3 2012
DYNAMICS OF THE ENERGY SPECTRA OF SOLAR PROTON EVENTS 225
1E–41817161514 212019
1E+0
August 2001
Flu
x of
sol
ar p
roto
ns,
1/(
сm2 s
sr
MeV
)
–40
APEV�236
60
10
0
Bx,
By,
nT
100
400
–80
400
1
10
20
20
0
–20
–20B,
Bz,
nT
T,
eVn,
cm
–3
V,
km/s
Dst
, n
TA
p
3
2
1
Dif
fere
nti
al s
pect
ral i
nde
x
1E–1
1E–2
1E–3
500
600
20
Fig. 4. The same as in Fig. 1; August 14–20, 2001.
and a flux of 1000—10000 pfu, class S4 to severe per�turbations and a flux of 10000—100000 pfu, and,finally, class S5 to the extreme situation with morethan 100000 pfu. Blackouts of radio communicationsare observed during events stronger than S2 and thereis a radiation risk for high�altitude flights, as well as forhealth of astronauts. S5�class events have not beenobserved so far, but we cannot exclude their appear�ance in future. It should be noted that there were noproton events meeting this criterion between Decem�
ber, 2006, and November, 2011 (the rising phase ofcycle 24); correspondingly, there were no ground levelenhancements of the cosmic ray flux.
Figures 1 to 20 show the experimental data analysisand the major results. The APEV database (http://dbserv.sinp.msu.ru/apev/) was used to describe the sit�uation in interplanetary space. Each figure includesthe upper and lower panels. The upper panel shows thefragments from the APEV database. The top�downdesignations in the figures are as follows: current Ap
226
SOLAR SYSTEM RESEARCH Vol. 46 No. 3 2012
VESELOVSKY et al.
1E–42625242322 292827
September 2001
Flu
x of
sol
ar p
roto
ns,
1/(
сm2 s
sr
MeV
)
–40
APEV�238
100
800
0
Bx,
By,
nT
6020
0
–80
600
20
20
0
–20
–20B,
Bz,
nT
T,
eVn,
cm
–3
V,
km/s
Dst
, n
TA
p
3
2
1D
iffe
ren
tial
spe
ctra
l in
dex
1E+0
41E–1
1E–2
1E–3
1E+1
1E+2
1E+3
10010
1
100
10
1
400
140
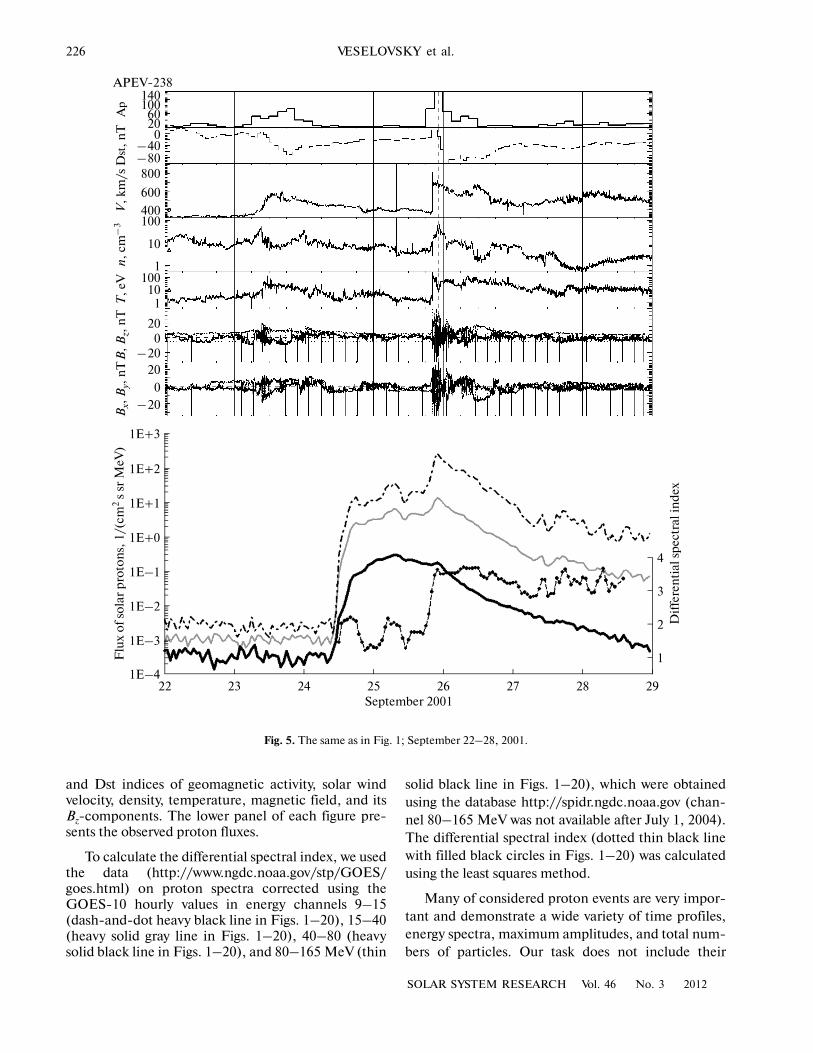
Fig. 5. The same as in Fig. 1; September 22–28, 2001.
and Dst indices of geomagnetic activity, solar windvelocity, density, temperature, magnetic field, and itsBz�components. The lower panel of each figure pre�sents the observed proton fluxes.
To calculate the differential spectral index, we usedthe data (http://www.ngdc.noaa.gov/stp/GOES/goes.html) on proton spectra corrected using theGOES�10 hourly values in energy channels 9–15(dash�and�dot heavy black line in Figs. 1–20), 15–40(heavy solid gray line in Figs. 1–20), 40–80 (heavysolid black line in Figs. 1–20), and 80–165 MeV (thin
solid black line in Figs. 1–20), which were obtainedusing the database http://spidr.ngdc.noaa.gov (chan�nel 80–165 MeV was not available after July 1, 2004).The differential spectral index (dotted thin black linewith filled black circles in Figs. 1–20) was calculatedusing the least squares method.
Many of considered proton events are very impor�tant and demonstrate a wide variety of time profiles,energy spectra, maximum amplitudes, and total num�bers of particles. Our task does not include their

SOLAR SYSTEM RESEARCH Vol. 46 No. 3 2012
DYNAMICS OF THE ENERGY SPECTRA OF SOLAR PROTON EVENTS 227
1E–576543 1098
November 2001
Flu
x of
sol
ar p
roto
ns,
1/(
сm2 s
sr
MeV
)
APEV�252300
Bx,
By,
nT
200100
0–100
600
–40
B,
Bz,
nT
T,
eVn,
cm
–3
V,
km/s
Dst
, n
TA
p
321
Dif
fere
nti
al s
pect
ral i
nde
x
1E+3
1E+2
1E+1
1E+0
1E–1
1E–2
1E–3
1E–4
45
40
0
–400
40
10
1
10
400
–200
Fig. 6. The same as in Fig. 1; November 3–9, 2001.
detailed analysis here. So, we confine ourselves to oneremark only.
It is sufficient to look at these limited data briefly tomake sure that there are no simple and standard regu�larities describing the evolution of proton eventsexcept their limited duration. This impressionbecomes even stronger if to consider a more completedata sets. The spectral index of considered eventschanges rather irregularly over a wide range, mainlybetween 1 and 3. So, the relation between the fluxes athigh and low energies varies appreciably.
It can be seen from the upper panel of Fig. 1 thatthere were no significant geomagnetic perturbations atthe middle latitudes during the proton event ofApril 3–5 in spite of the fact that the solar wind veloc�ity increased to 800 km/s in the afternoon of April 4.Since the Bz component remained positive during thattime, the geomagnetic perturbation did not develop.
Event 2 (April 12, 2001, numeration as in the table,according to the criteria proposed in this paper) is a partof the multiple proton event that began on April 12, 2001(Fig. 2). It was observed after the flare of M7.9/2B class

228
SOLAR SYSTEM RESEARCH Vol. 46 No. 3 2012
VESELOVSKY et al.
1E–52524232221 282726
November 2001
Flu
x of
sol
ar p
roto
ns,
1/(
сm2 s
sr
MeV
)
–100
APEV�253200100
Bx,
By,
nT
0
–200
600
100
B,
Bz,
nT
T,
eVn,
cm
–3
V,
km/s
Dst
, n
TA
p
6
4
2
Dif
fere
nti
al s
pect
ral i
nde
x
1E–3
1
3
5
1E–4
1E–1
1E–2
1E+1
1E+0
1E+3
1E+2
200
–20
–40
0
–40
10
1
10
400
8001000
Fig. 7. The same as in Fig. 1; November 21–27, 2001.
of April 9, 2001, and was accompanied by the 30�hourgeomagnetic storm with Dst = –271 nT associatedwith the halo coronal mass ejection, which left the Sunon April 10, 2001 (according to http://www.swpc.noaa.gov/ftpdir/indices/SPE.txt) and arrived at theEarth’s orbit. The abrupt softening of the proton spec�trum on April 13 was most likely due to the arrival ofthe shock wave (the solar wind velocity > 800 km/s).
Proton events 3 (April 15, 2001) and 4 (April 18,2001) were observed after the X�ray flares of X14 and
C2 (from beyond the limb) classes, correspondingly, inAR 9415, and caused GLE 60 and 61 (Fig. 3). Event 3occurred against a background of quiet geomagneticconditions and event 4 simultaneously with the geo�magnetic storm (Dst = –110 nT). We were not able todetermine the differential spectral index at the maxi�mum of the proton flux with >100 MeV because theoverloading may have been observed near this maxi�mum in the energy channel 9–15 MeV (GOES).

SOLAR SYSTEM RESEARCH Vol. 46 No. 3 2012
DYNAMICS OF THE ENERGY SPECTRA OF SOLAR PROTON EVENTS 229
Fig. 8. The same as in Fig. 1; December 22–28, 2001 (for the protons) and December 21–27, 2001 (there is no completely cor�responding time interval in the APEV database).
Proton event 5 (August 16, 2001) occurred after theflare from beyond the limb, which was accompaniedby the halo CME followed by the geomagnetic storm(maximum Dst = –100 nT) that started in the after�noon of August 17 and lasted more than 24 h. Figure 4(lower panel) clearly shows the softening of the solarproton spectrum to –2.5. It was impossible to deter�mine the differential spectral index at the maximumproton flux with >100 MeV due to the same reason asin event 3 (overloading of the lower energy channel).
The intense S4�class proton event 6 on September 24,2001 (the maximum flux was 12900 pfu for the protonswith energies E > 10 MeV) originated from the X2�classflare and yielded a moderate geomagnetic storm withDst = –102 nT that lasted 21 hours (maximum solarwind velocity was 700 km/s) (Fig. 5). However, thisevent, however, caused no GLEs. The softening of thesolar proton spectrum (approximately from –1.6 to –3.6)was associated with the low�energy protons arriving at
1E–52625242322 2927
December 2001
Flu
x of
sol
ar p
roto
ns,
1/(
сm2 s
sr
MeV
)–40
APEV�254B
x, B
y, n
T
30
100
600
10
10
B,
Bz,
nT
T,
eVn,
cm
–3
V,
km/s
Dst
, n
TA
p
3
2
1
Dif
fere
nti
al s
pect
ral i
nde
x
1E+0
4
1E–1
1E–2
1E–3
1E–4
1E+1
1E+2
–10
0
10
–100
10
1
500400
28

230
SOLAR SYSTEM RESEARCH Vol. 46 No. 3 2012
VESELOVSKY et al.
1E–52423222120 272625
April 2002
Flu
x of
sol
ar p
roto
ns,
1/(
сm2 s
sr
MeV
)
–100
APEV�266
500
Bx,
By,
nT
1408020
–140
400
B,
Bz,
nT
T,
eVn,
cm
–3
V,
km/s
Dst
, n
TA
p
4
2
1
Dif
fere
nti
al s
pect
ral i
nde
x
1E+0
1E–1
1E–2
1E–3
1E–4
1E+1
1E+2
3
–100
10
–100
10
110
10
600
–60–20
Fig. 9. The same as in Fig. 1; April 20–26, 2002.
the Earth orbit after acceleration on the shock wave inthe coronal mass ejection.
Event 7 (November 4, 2001) was one of the mostpowerful proton events (S4�class) of cycle 23 (maxi�mum flux was 31700 pfu for the protons with energiesE > 10 MeV). It was observed after the X1�class flare,which was accompanied by the coronal mass ejectionhaving a velocity about 1800 km/s (Fig. 6). The event
caused the GLE 62. The superposition of CMEsarrived to the Earth and caused the geomagnetic stormon November 6, 2001 (Dst = –280 nT) as well as addi�tional softening of the solar proton spectrum –3.4.
Event 8 (November 22, 2001) was another veryintense and long�lasting S4�class proton event of cycle 23(maximum flux was 18900 pfu for the protons with E >10 MeV), which caused no GLE (Fig. 7). The event

SOLAR SYSTEM RESEARCH Vol. 46 No. 3 2012
DYNAMICS OF THE ENERGY SPECTRA OF SOLAR PROTON EVENTS 231
Fig. 10. The same as in Fig. 1; August 19–25, 2002. The shift of the time intervals is due to the same cause as in Fig. 8.
was observed after the M9�class flare accompanied bytwo successive coronal mass ejections with velocitiesabout 1440 km/s. As in the previous event, the CMEsuperposition arrived at the Earth and caused thestrong geomagnetic storm (Dst = –221 nT, duration ofapproximately 30 hours) and additional softening of thesolar proton spectrum (from –3.5 to –4.6).
Event 9 (December 26, 2001) was a moderate�intensity S2�class proton event (maximum flux wasonly 779 pfu for the protons with E > 10 MeV) (Fig. 8).Nevertheless, it led to the GLE 63, the last groundlevel flux enhancement in 2001. Event 9 occurred dur�
ing quiet geomagnetic conditions; as a result, its dif�ferential energy spectrum was nearly constant andequal to –3 ± 0.5.
Event 10 (April 21, 2002) was the first of three pro�ton events in 2002 (the maximum flux was 2520 pfu forthe protons with E > 10 MeV, S3�class) (Fig. 9). It wasobserved after the X1�class flare that took place at theSun’s western limb (S14W84). This proton eventbegan after the magnetic storm of April 20 had ended.During the decline phase of the event (the first half ofApril 23), there was a moderate geomagnetic perturba�tion (Dst = –50 nT), which was associated with the
1E–52322212019 2624
August 2002
Flu
x of
sol
ar p
roto
ns,
1/(
сm2 s
sr
MeV
)
APEV�27880
600
Bx,
By,
nT
40
–80
500
B,
Bz,
nT
T,
eVn,
cm
–3
V,
km/s
Dst
, n
TA
p
3
2
1
Dif
fere
nti
al s
pect
ral i
nde
x
1E+1
4
1E+0
1E–1
1E–2
1E–3
1E–4
10
0
–10
–10
0
10
10
1
10
1
400
–400
25

232
SOLAR SYSTEM RESEARCH Vol. 46 No. 3 2012
VESELOVSKY et al.
1E–52524232221 282726
October 2003
Flu
x of
sol
ar p
roto
ns,
1/(
сm2 s
sr
MeV
)
–20
APEV�425100
Bx,
By,
nT
6020
–60
400
10
B,
Bz,
nT
T,
eVn,
cm
–3
V,
km/s
Dst
, n
TA
p
6
4
1 D
iffe
ren
tial
spe
ctra
l in
dex
1E+0
1E+1
1E+2
1E–3
1E–2
1E–1
1E–4
3
2
5
–20
200
–20
20
0
10
1
1
700600500
0
–40
Fig. 11. The same as in Fig. 1; October 21–27, 2003.
sharp increase in the solar wind velocity up to630 km/s, and simultaneous sharp softening of thesolar proton spectrum (from –2 to –3).
Events 11 (August 22, 2001) and 12 (August 24,2001) were observed after flares of M5 and X3 classesin AR 0069, correspondingly (Fig. 10). Event 12caused the GLE 64. Both events occurred on the back�ground of quiet level of geomagnetic conditions; event 11was observed at the recovery phase of the storm of August21, 2002 (Dst = –100 nT). The spectral index of event 11varied between –2 and –1 and event 12 between –0.7 and–3.5.
Event 13 (October 26, 2003) occurred before theseries of famous strong and complicated proton events(GLE 65–67) and was caused by the X1�class flare inAR 0484 (Fig. 11). The upper panel of Fig. 11 showsthat the Dst�variation decreased to –50 nT at the sec�ond peak of proton enhancement on October 27,although the auroral activity and Ap�index were low atthe time. The spectral index of this event has remainedconstant (–3.5) for more than 12 hours.
The most powerful proton events of cycle 23, events 14(October 28, 2003), 15 (October 29, 2003), and 16(November 2, 2003), caused the ground level

SOLAR SYSTEM RESEARCH Vol. 46 No. 3 2012
DYNAMICS OF THE ENERGY SPECTRA OF SOLAR PROTON EVENTS 233
1E–5131302928 432
October and November 2003
Flu
x of
sol
ar p
roto
ns,
1/(
сm2 s
sr
MeV
)
–100
APEV�429
800
Bx,
By,
nT
300
100
–300
600
10
1
B,
Bz,
nT
T,
eVn,
cm
–3
V,
km/s
Dst
, n
TA
p
4
2
1 D
iffe
ren
tial
spe
ctra
l in
dex
1E+1
1E+0
1E+2
1E+3
1E–3
1E–4
1E–2
1E–1
3
–200
20
–40
400
100
110
1000
Fig. 12. The same as in Fig. 1; October 28–November 3, 2003.
enhancements GLE 65, 66, and 67, correspondingly,and occurred during strong magnetic storms (the Dstamplitude was more than –300 nT) (Fig. 12). Thisseries of heliomagnetospheric events of October–November 2003 were carefully studied in many works(for example, Veselovsky et al., 2004).
Event 17 (November 5, 2003) originated from themost powerful X�ray flare (class X28) over the wholehistory of observations. However, it caused no groundlevel enhancement of the cosmic ray flux (Fig. 13).This proton event occurred at the recovery phase of a
moderate magnetic storm (maximum value of Dst =–70 nT) and was the last in the series of heliomagneto�spheric events of October–November 2003. Figure 13also shows proton event 16 (November 2, 2003) (seealso Fig. 12), which caused the ground level enhance�ment GLE 67.
Proton event 18 (November 1, 2004) occurredbefore the series of heliomagnetospheric events ofNovember 2004 and was caused by a flare from beyondthe limb (Fig. 14). The APEV database does notinclude the data around November 1, 2004, because

234
SOLAR SYSTEM RESEARCH Vol. 46 No. 3 2012
VESELOVSKY et al.
1E–454321 876
November 2003
Flu
x of
sol
ar p
roto
ns,
1/(
сm2 s
sr
MeV
)
–20
APEV�431
Bx,
By,
nT
1006020
–60
500
20
B,
Bz,
nT
T,
eVn,
cm
–3
V,
km/s
Dst
, n
TA
p
3
2
1
Dif
fere
nti
al s
pect
ral i
nde
x
1E+1
4
1E+0
1E–1
1E–2
1E–3
1E+2
–20
0
010
–10
101
10
1
700
Fig. 13. The same as in Fig. 1; November 1–7, 2003.
there were no significant perturbations in that period oftime; that is, the intensity and all three components of theinterplanetary magnetic field, temperature, density, solarwind velocity, Dst�variation, and Ap�index variedweakly.
Event 19 (November 10, 2004) was a complex mul�tiple proton event from the X2�class flare (Fig.15).The event belonged to the series of heliomagneto�spheric events of November 2004 and was accompa�nied by a powerful 90�hour geomagnetic storm with
Dst = –370 nT. This proton event occurred almost syn�chronously with the strong geomagnetic storm caused bythe previous flare (maximum Dst = –370 nT, maximumAp = 300). The solar wind velocity achieved 800 km/sbefore the beginning of this storm. This event was alsostudied in detail earlier (Yermolaev et al., 2005).
Proton events 20 (January 17, 2005) and 21 (Janu�ary 20, 2005) caused the ground level flux enhance�ments GLE 68 and 69, correspondingly, and occurreddue to the flares of January, 2005 (Fig. 16). The proton

SOLAR SYSTEM RESEARCH Vol. 46 No. 3 2012
DYNAMICS OF THE ENERGY SPECTRA OF SOLAR PROTON EVENTS 235
1E–4543231.10 76
November 2004
Flu
x of
sol
ar p
roto
ns,
1/(
сm2 s
sr
MeV
)
3
2
1
Dif
fere
nti
al s
pect
ral i
nde
x
5
1E+0
1E–1
1E–2
1E–3
1
4
Fig. 14. Proton event on November 1, 2004.
events took place on the background of magnetic per�turbations (the solar wind velocity was 1000 km/s andhigher); the data are partly missing in the APEV data�base for this period of time. The spectral index of event 20varied in range –2 and –1, event 21 in range –0.7 and–3.5. It was impossible to reconstruct the spectralindex at the maximum of the proton flux with energy>100 MeV due to overflow of the lower (9–15 MeV)energy channel.
Figure 17 shows the single proton event 22 (June 16,2005) that originated from the M4�class flare andoccurred simultaneously with the weak geomagneticperturbation (maximum Dst = –60 nT). The auroralperturbations were weak, the maximum Ap = 50. Thesolar wind velocity before the beginning of this stormachieved 700 km/s. The spectral index remainedalmost constant during this event (–1 ± 0.2).
Event 23 was a long�lasting proton event (Septem�ber 8, 2005) from the eastern X17�class flare with thecoordinates S06E89 (Fig. 18). This event was accom�panied with the magnetic storm that was caused bythe CME arrived to the Earth orbit (maximum Dst =–150 nT, maximum Ap = 170) and began 24 hourslater. Simultaneously with the beginning of the storm,the abrupt softening of the spectral index was observed(from –2 to –3) due to protons arriving at the Earthorbit after accelerations on the CME shock wave (thesolar wind velocity before the beginning of the stormexceeded 1000 km/s).
Proton event 24 (December 7, 2006) was the first ofthree events in the anomalous December series of 2006(Fig. 19). The powerful event from the X9�class X�ray
flare (coordinates S07E79) occurred at the recoveryphase of the weak geomagnetic perturbation (maxi�mum Dst = –45 nT, maximum Ap = 50). The eventcaused no geomagnetic storm. The data on the velocity,density, and temperature are not available for the consid�ered period. The spectral index varied weakly (–2 ± 0.5).
Proton events 25 (December 13, 2006) and 26(December 14, 2006) were the second and third partsof the complicated multiple event that had begun onDecember 13, 2006 (Fig. 20). Proton event 25 causedthe ground level flux enhancement (GLE 70), whichwas the last in cycle 23. Proton event 26 occurredsimultaneously with the geomagnetic storm (maxi�mum Dst = –140, maximum Ap = 220, solar windvelocity before the beginning of the storm reached900 km/s). The spectral index of event 25 increasedfrom –0.2 to 3, and during event 26 the indexremained almost constant (–2).
DISCUSSION
The described 26 proton events can be divided intogroups according to different criteria: power, duration,presence of the ground level enhancement of cosmicray flux, energy spectrum, etc. In present work we con�centrate on the spectral index dynamics of the differ�ential fluxes of protons (9–165 MeV) using the GOESdata measured in the geostationary orbit.
Analyzing the behavior of spectral index variationsfor different events and during each event separately,the following conclusions can be made:

236
SOLAR SYSTEM RESEARCH Vol. 46 No. 3 2012
VESELOVSKY et al.
1E–41110987 141312
November 2004
Flu
x of
sol
ar p
roto
ns,
1/(
сm2 s
sr
MeV
)
APEV�503
Bx,
By,
nT
250150
50
–200
600
10
B,
Bz,
nT
T,
eVn,
cm
–3
V,
km/s
Dst
, n
TA
p
3
2
1 D
iffe
ren
tial
spe
ctra
l in
dex
1E+1
1E+0
1E–1
1E–2
1E–3
1E+2
4
5
–20
200
–40
0
401
10
1
400
800
0
Fig. 15. The same as in Fig. 1; November 7–13, 2004.
(1) The spectral index of proton fluxes can varyduring each event as strongly as between the events. Themaximum variation of spectral index from –0.7 to 4 wasobserved during the event of November 5, 2003, with thecharacteristic variation from –1 ± 0.5 to –3 ± 0.5.
(2) There were no essential differences in spectralvariations between the events that led to the groundlevel enhancements of cosmic rays and those thatcaused no such enhancements. The most remarkableexample is that the dynamics of proton flux variationsfor the events of September 24 (event 6), November 4
(event 7), and November 22, 2001 (event 8) was simi�lar; and as consequence, their spectral indices weresimilar too, although event 7 caused the GLE whiletwo other events did not (for details see Kuznetsovet al., 2003).
(3) We compared the dynamics of spectral indicesof protons, on the one hand, and the variations in theparameters of interplanetary magnetic field (IMF),solar wind (SW), and geomagnetic indices, on theother hand; this comparison allowed us to concludethat the sharp variations of spectral index in the geo�

SOLAR SYSTEM RESEARCH Vol. 46 No. 3 2012
DYNAMICS OF THE ENERGY SPECTRA OF SOLAR PROTON EVENTS 237
1E–52019181716 232221
January 2005
Flu
x of
sol
ar p
roto
ns,
1/(
сm2 s
sr
MeV
)
–40
APEV�515
800
Bx,
By,
nT
200
100
0
–80
600
100
B,
Bz,
nT
T,
eVn,
cm
–3
V,
km/s
Dst
, n
TA
p
4
2
1
Dif
fere
nti
al s
pect
ral i
nde
x
1E+2
1E+3
1E+1
1E+0
1E–2
1E–1
1E–3
1E–4
3
–20
20
20
–20
0
0
1000
10
1000
400
1
10
Fig. 16. The same as in Fig. 1; January 16–22, 2005.
stationary orbit are associated mostly with the varia�tions of the IMF and SW parameters and, correspond�ingly, geomagnetic indices. Solar flares, which pro�duce the proton events, are generally accompanied byCMEs arriving at Earth’s orbit and causing magneticstorms (Dst = –100 nT and greater); simultaneouslywith the development of the magnetic storm, i.e., 1–1.5 days after the peak of the proton event, the spectralindex softens by one or more. This softening occurs insharp discrete steps in most cases. Along with theabove�mentioned three events in the second half of2001, the following events were accompanied by mag�
netic storms: event 2 (April 12, 2001), event 10 (April 21,2002), events 14 and 15 (October 28 and 29, 2003),and event 23 (September 8, 2005); altogether, suchevents make up approximately one�third of the studiedrun. The cause of the spectral softening follows fromthe conclusions derived in (Kuznetsov, 2003), namely,the softening is associated with the low�energy protonsarriving at the Earth orbit after their accelerations onthe CME shock wave.
Other type of events, which can be described fromthe point of view of spectral index dynamics, areevents with a weakly varying (and slowly increasing in

238
SOLAR SYSTEM RESEARCH Vol. 46 No. 3 2012
VESELOVSKY et al.
1E–41716151413 201918
June 2005
Flu
x of
sol
ar p
roto
ns,
1/(
сm2 s
sr
MeV
)
–60
APEV�542
60
Bx,
By,
nT
20
–100
600
10
–10
B,
Bz,
nT
T,
eVn,
cm
–3
V,
km/s
Dst
, n
TA
p
3
2
1
Dif
fere
nti
al s
pect
ral i
nde
x
4
5
1E–1
1E+0
1E–2
1E–3
0
–10
100
10
1
10
500
400
–20
Fig. 17. The same as in Fig. 1; June 13–19, 2005.
some cases) spectral index. This can easily beexplained by the earlier arrival of the flare particleswith higher energies, which occurred during quietgeomagnetic situations. These events from our list arethe following: 3 (April 15, 2001), 9 (December 26,2001), 11 (August 22, 2002), 13 (October 26, 2003), 16(November 2, 2003), 17 (November 5, 2003), 18(November 1, 2004), 22 (June 16, 2005), and 24(December 7, 2006).
The remaining one�third of studied events are pre�dominantly series of events rather than single events;
such are the series of November 2004 and January2005, when, for example, the storm due to the CMEfrom the previous flare could occasionally and exactlycoincide in time with the maximum of the forthcom�ing proton event, as it happened in the last solar protonevent of cycle 23, namely, event 26 (December 14,2006) that caused the GLE 70. So, to reliably analyzethe dynamics of solar proton events, it is expedient toconsider the series of events in detail taking intoaccount the superposition of different factors. As forthe attempts to find the main physical factors respon�sible for the wide variety of time profiles of proton

SOLAR SYSTEM RESEARCH Vol. 46 No. 3 2012
DYNAMICS OF THE ENERGY SPECTRA OF SOLAR PROTON EVENTS 239
1E–41110987 141312
September 2005
Flu
x of
sol
ar p
roto
ns,
1/(
сm2 s
sr
MeV
)
–50
APEV�560
Bx,
By,
nT
150
500
–100
600
B,
Bz,
nT
T,
eVn,
cm
–3
V,
km/s
Dst
, n
TA
p
3
2
1
Dif
fere
nti
al s
pect
ral i
nde
x
1E+0
1E–1
1E–2
1E–3
1E+2
1E+1
4
5
–10
10
10
100
–100
0
10
1
1
10
400
8001000
Fig. 18. The same as in Fig. 1; September 7–13, 2005.
events, empirical data are being accumulated today tohelp for future simulations to be made (Rodríguez�Gasén et al., 2011).
The physical cause of the rich variety is clear. It isrelated to the complicated structure and dynamics ofelectromagnetic fields in regions of particle accelera�tion and propagation in the Sun and interplanetaryspace. It is impossible to create, an universal model torepresent and describe these events, even in the rangeof rough orders of magnitude and qualitative esti�mates. Geometrical parameters and patterns of per�turbations on the Sun and in the heliosphere cannot be
standardized a priori with the required accuracybecause they are very complicated, varied, and indi�vidual. The properties of different proton events areindividual as well.
The rapid variation of sufficiently strong magneticfluxes in the photosphere is a good messenger of pow�erful flares that is used in expert estimates and fore�casts of solar flare activity (Ishkov, 2008). To betterunderstand the proton events, it is necessary to use thetelescopic observations of the solar flares and CMEs,which occurred in the past, and to take into accounttheir position, measured magnetic fields, and plasma

240
SOLAR SYSTEM RESEARCH Vol. 46 No. 3 2012
VESELOVSKY et al.
1E–498765 121110
December 2006
Flu
x of
sol
ar p
roto
ns,
1/(
сm2 s
sr
MeV
)
–20
APEV�596
Bx,
By,
nT
4020
0
–40
600
B,
Bz,
nT
T,
eVn,
cm
–3
V,
km/s
Dst
, n
TA
p
4
2
1 D
iffe
ren
tial
spe
ctra
l in
dex
1E+0
1E+1
1E+2
1E–3
1E–2
1E–1
3
5
10
10
–10
–10
0
0
10
10
400
20
Fig. 19. The same as in Fig. 1; December 5–11, 2006.
velocities. Unfortunately, there are currently no spec�troscopic data available on electric fields, which wouldbe very useful and necessary, because the Stark effecton the Sun is three orders of magnitude smaller thanthe Zeeman effect; and thus it is extremely difficult tomeasure even during the eruptive processes when elec�tric fields must be especially great.
Electric fields on the Sun and in the heliosphere areof an inductive and potential (Coulomb) nature. It isworth emphasizing that the patterns of electric fieldscan differ even if the magnetic field has the same con�figuration and evolution. Thus, the knowledge of mag�
netic fields and plasma motions is necessary, but this isnot sufficient to make a successful dynamic forecastfor the development of acceleration processes,motions of plasma and energetic particles on the Sunand in the heliosphere. Equally, the class of an X�rayflare cannot be used to directly predict the protonevents in some cases, because there is no strong rela�tions between the power of X�ray flares and the num�ber of accelerated protons observed in interplanetaryspace. The relationship between the fractions of accel�erated electrons and protons in the flare events is not

SOLAR SYSTEM RESEARCH Vol. 46 No. 3 2012
DYNAMICS OF THE ENERGY SPECTRA OF SOLAR PROTON EVENTS 241
1E–41514131211 181716
December 2006
Flu
x of
sol
ar p
roto
ns,
1/(
сm2 s
sr
MeV
)
–80
APEV�598
800
Bx,
By,
nT
200100
0
–120
600
100
B,
Bz,
nT
T,
eVn,
cm
–3
V,
km/s
Dst
, n
TA
p
3
2
1
Dif
fere
nti
al s
pect
ral i
nde
x
1E–1
4
5
1E–2
1E–3
1E+1
1E+0
1
10
500
700
–40
–10
100
–10
101
Fig. 20. The same as in Fig. 1; December 11–17, 2006.
universal either, and depends on geometry, height inthe solar atmosphere, and other parameters.
CONCLUSIONS
To create an empirical classification of protonevents on the Sun, in the heliosphere and magneto�sphere, it is necessary to collect and analyze a largerdatabase. Today, we can state that there is an apprecia�ble diversity among the events, which is explained byfeatures of plasma and electrodynamic processes inthe domain of acceleration, accumulation, and prop�agation of energetic particles. First of all, it is the
power and geometric characteristics that vary withinvery large intervals. The first step in classificationincluding dimensionless parameter scaling was made.
This work was supported by the Ministry of Educa�tion and Science of the Russian Federation (nationalproject 07.514.11.4020).
REFERENCES
Bazilevskaya, G.A., Vashenyuk, E.V., Ishkov, V.N., et al.,Solnechnye protonnye sobytiya, katalog 1970–1979 gg.(Solar Proton Events. 1970–1979 Catalog),Logachev, Yu.I., Ed., Moscow: IZMIRAN, 1986.
242
SOLAR SYSTEM RESEARCH Vol. 46 No. 3 2012
VESELOVSKY et al.
Belov, A., Chertok, I., and Struminsky, A., Time Evolutionof Solar Proton Energy Spectra at the Earth’s Orbit andPossibility of Multi�Step Particle Acceleration, Proc.24th Int. Cosmic Ray Conf., Rome, 1995, vol. 4,pp. 127–130.
Belov, A.V., Eroshenko, E.A., Kryakunova, O.N., et al.,Ground Level Enhancements of Solar Cosmic Raysduring the Last Three Solar Cycles, Geomagn. Aeron.,2010, vol. 50, no. 1, pp. 21–33.
Charakhch’yan, A.N., Tulinov, V.F., and Charakhch’yan, T.N.,Intensity Flares of the Cosmic Rays in Stratosphere inNovember 1960, Geomagn. Aeron., 1961, vol. 1, no. 4,pp. 494–499.
Getselev, I.V., Zubarev, A.I., and Pudovkin, O.L., Radiat�sionnaya obstanovka na bortu kosmicheskikh apparatov(Radiation Conditions Onboard the Spacecrafts),Obninsk: TsIPK, 2001.
Getselev, I.V., Kuznetsov, N.V., Nymmik, R.A., et al.,Metody rascheta radiatsionnykh uslovii raboty kos�micheskikh apparatov i ikh sistem za schet deistviyazaryazhennykh chastits kosmicheskogo prostranstva est�estvennogo proiskhozhdeniya. Metodicheskoe posobie(Calculation Methods for Radiation Operating Condi�tions of Spacecrafts and Their Systems Caused by theImpact of Natural Charged Particles from the Space.Methodological Recommendations), Gromov, O.G.,Luk’yashchenko, V.I., and Panasyuk, M.I., Eds., Mos�cow: Kosmicheskie voiska vooruzhennykh sil RF, 2004.
Ishkov, V.N., Emerging Magnetic Fluxes and Flare Phe�nomena at the Sun, Cand. Sci. (Phys.�Math.) Disserta�tion, Troitsk: IZMIRAN, 2008.
Kane, R.P., Directional Muon Telescopes not Useful forEstimating the Magnitudes of Forbush Decreases andGeomagnetic Storms, Indian J. Radio Space Sci., 2011,vol. 40, pp. 16–84.
Kurt, V., Belov, A., Mavromichalaki, H., andGerontidou, M., Statistical Analysis of Solar ProtonEvents, Ann. Geophys., 2004, vol. 22, pp. 2255–2271.
Kuznetsov, S.N., Denisov, Yu.I., Myagkova, I.N., et al.,Comparison of the Three Events in Energy Particles for
the Period of August 2001–March 2002 Observed byCORONAS�F, Izv. Akad. Nauk. Ser. Fiz., 2003, vol. 67,no. 4, pp. 478–481.
Laurenza, M., Cliver, E.W., Hewit, J., et al., A Techniquefor Short�Term Warning of Solar Energetic ParticleEvents Based on Flare Location, Flare Size, and Evi�dence of Particle Escape, Space Weather, 2009, vol. 7,issue 4.
Mavromichalaki, H., Souvatzoglou, G., Sarlanis, C., et al.,Using Real Time Neutron Monitor Database to Estab�lish an Alert Signal, Proc. 31st ICRC, Lodz, 2009, p. 4.
Miroshnichenko, L.I., Empirical Model for the UpperLimit Spectrum of Solar Cosmic Rays at the EarthsOrbit, Rad. Measur., 1996, vol. 2, pp. 421–425.
Miroshnichenko, L.I., Mendoza, B., and Perez�Enriquez, B., Size Distributions of the >10 MeV SolarProton Events, Sol. Phys., 2001, vol. 202, pp. 151–171.
Miroshnichenko, L.I. and Perez�Peraza, J.A., Astrophysi�cal Aspects in the Studies of Solar Cosmic Rays, Int.J. Mod. Phys., 2008, vol. 23, no. 1, pp. 1–141.
Rodríguez�Gasén, R., Aran, A., Sanahuja, B., et al., WhyShould the Latitude of the Observer Be Consideredwhen Modeling Gradual Proton Events? An InsightUsing the Concept of Cobpoint, Adv. Space Res., 2011,vol. 47, issue 12, pp. 2140–2151.
Shea, M.A. and Smart, D.F., A Summary of Major SolarProton Events, Sol. Phys., 1990, vol. 127, pp. 297–320.
Veselovsky, I.S., Panasyuk, M.I., Avdyushin, G.A., et al.,Solar and Heliospheric Phenomena in Oct.–Nov.,2003: Causes and Effects, Cosmic Research, 2004,vol. 42, no. 5, pp. 435–488.
Veselovsky, I.S. and Yakovchuk, O.S., On Forecasting SolarProton Events Using a Ground based Neutron Moni�tor, Solar System Research, 2011, vol. 45, No. 4,pp. 354–364.
Yermolaev, Yu.I., Zelenyi, L.M., Zastenker, A.A., et al., AYear Later: Solar, Heliospheric and MagnetosphericDisturbances in November 2004, Geomagn. Aeron.,2005, vol. 45, no. 6, pp. 681–719.