characteristics of solar proton events associated with ... · characteristics of solar proton...
TRANSCRIPT
Characteristics of solar proton events associatedwith ground level enhancements
S. Y. Oh,1 Y. Yi,2 J. W. Bieber,1 P. Evenson,1 and Y. K. Kim3
Received 7 December 2009; revised 16 June 2010; accepted 21 June 2010; published 15 October 2010.
[1] In certain explosive events, the Sun emits large numbers of protons with energy upto tens of GeV. Particle acceleration processes on the Sun can be understood throughthe observation of such energetic particles. According to the definition of NOAA SpaceEnvironment Services Center, a solar proton event (SPE) is defined as an event with a peakintensity of >10 pfu (particle flux unit; 1 particle cm−2 sr−1 s−1) for >10 MeV protons.Major SPEs are not always associated with ground level enhancements (GLEs), whereasrelatively minor SPEs are sometimes associated with GLEs. We examined the peakintensities of 85 SPEs after 1986 using the intensity of proton differential energy channels(P3–P10) from GOES. We identified 31 SPEs associated with GLEs having well‐definedprofiles with a large increase and clear peak for each proton channel. They have largerpeak intensity and fluence and shorter delay time between onset and peak than SPEswithout GLEs. Fluences and peak intensities of SPEs have a good correlation with percentincreases of GLEs, with the best correlation coefficients obtained for the peakintensities and fluences of channels P8, P9, and P10. For these energy channels(spanning 350–700 MeV), we find that there are threshold values for GOES fluenceand peak intensity such that most SPEs above the threshold are associated with GLEs,whereas almost none below the thresholds are.
Citation: Oh, S. Y., Y. Yi, J. W. Bieber, P. Evenson, and Y. K. Kim (2010), Characteristics of solar proton events associatedwith ground level enhancements, J. Geophys. Res., 115, A10107, doi:10.1029/2009JA015171.
1. Introduction
[2] Solar proton events (SPEs) occur when protons areaccelerated to very high energies either close to the Sunduring a solar flare or by Coronal Mass Ejection (CME)‐driven shocks in the corona or in interplanetary space. Moregenerally, one can speak of solar energetic particle (SEP)events, but since our study is in fact based on observationsof the proton component, we adopt the more restrictiveterminology. An SPE is said to occur if there is an increase>10 pfu (particle flux unit; 1 particle cm−2 sr−1 s−1) in the fluxof >10 MeV protons (http://umbra.nascom.nasa.gov/SEP).This definition has been applied for many studies of SPEs.Some events are also recorded as ground level enhancements(GLEs), first identified by Forbush [1946], when sudden in-creases in cosmic ray intensity are observed by ground‐baseddetectors, at present generally neutron monitors. GLEs areclearly related to SPEs, but questions remain regarding the exactnature of the relationship. As detailed below, major SPEssometimes occur without an associated GLE, whereas con-versely some minor SPEs are accompanied by GLEs.
[3] El‐Borie [2003] examined 58 extremely large SPEs(with a flux of over 10 pfu at energy ≥60 MeV) betweenJanuary 1973 and May 2001. Nearly 40% of these eventswere associated with GLEs. The profile of flux as a functionof time showed multiple particle injection or varying particleacceleration either at the solar source or in propagation tothe Earth. He also found that large GLEs did not necessarilycome from a sequence of major proton events and werenot a condition for observing major solar proton fluxes. Inanother study, Cliver [2006] addressed that although theSPE is a favorable condition for GLE occurrence, it is not arequirement. It does not contradict El Borie’s results.[4] Kurt et al. [2004] made a catalog of 253 SPEs with
energy of >10 MeV and peak intensity of >10 pfu at theEarth’s orbit for three complete 11‐year solar cycles (1970–2002). The catalog lists SPE properties (onset time, peakflux), associated Ha flare properties (time of start and max-imum, position, importance, active region), and GLE asso-ciation. They described the association with other eventsusing a correlation analysis. From this set of 253 events, 231can be identified with Ha flares and 42 registered as GLEs.The longitudinal distribution of the associated flares showsthat most SPEs are connected with western hemisphere flares.The correlation coefficients are 0.53 with soft X‐ray (SXR)flares, 0.73 with sunspot number, 0.71 with solar flare index,and 0.86 with coronal index. These correlations are likelymanifestations of the “big flare syndrome” [Kahler, 1982].[5] Wang [2006] made a statistical study of 163 SPEs
associated with X‐ray flares, CME, and radio type II bursts
1Department of Physics and Astronomy and Bartol Research Institute,University of Delaware, Newark, Delaware, USA.
2Department of Astronomy and Space Science, Chungnam NationalUniversity, Daejeon, South Korea.
3Department of Nuclear Engineering, Hanyang University, Seoul,South Korea.
Copyright 2010 by the American Geophysical Union.0148‐0227/10/2009JA015171
JOURNAL OF GEOPHYSICAL RESEARCH, VOL. 115, A10107, doi:10.1029/2009JA015171, 2010
A10107 1 of 14
during January 1997–June 2005. He classified events by thepeak flux of >10 MeV solar protons into three groups (large:>100 pfu, moderate: 10–100 pfu, minor: 1–10 pfu). Usingthe >10 MeV proton channel, Wang [2006] concluded thatthe most intense SPEs are likely to be produced by majorflares located near the central meridian of the Sun withshock waves driven by very fast halo CME (v ≥ 1600 km/s).He suggested that CME‐driven shock acceleration is anecessary condition for large proton production.[6] Kuwabara et al. [2006] developed a system that
detects count rate increases recorded in real time by eightneutron monitors and triggers an alarm if a GLE isdetected. The GLE alert precedes the earliest indication fromGOES (100 MeV or 10 MeV protons) by ∼10–30 minutes.Kuwabara et al. [2006] listed proton events associated withGLE, classifying them in terms of intensity of >10 MeV(moderate radiation storm: S2, strong: S3, extreme: S4).They showed that the maximum intensity of protons doesnot have a particularly good correlation with whether theevent produces a GLE.[7] In contrast to the work with integral intensity, differ-
ential proton energy channels on GOES are used in somestudies of SPE. Reames and Ng [1998] used the intensitiesof proton energy channels (P3, P5, P7) on GOES 6 toexplore the streaming limit imposed by wave‐particle in-teractions. Lario et al. [2008] used the intensities of protonenergy channels (P5, P7) on GOES to explain eventsexceeding the streaming limit.[8] Tylka et al. [2006] explored whether the difference
between GLEs and exceptionally large SPEs is primarilyspectral in nature. Speculation on the physical cause of thesespectral differences appears in Tylka et al. [2005] and Tylkaand Lee [2006]. Tylka and Dietrich [2009] noted theexcellent correlation between GOES High Energy Protonand Alpha Detector fluences and neutron monitor fluences.[9] In summary, most previous studies of SPEs considered
only integral intensity, with the conclusion that the peakintensity of SPE has a poor correlation with GLE and thatmajor SPEs are not a necessary condition for GLEs. On theother hand, minor SPEs are sometimes associated with GLEs.In this paper, we explore the possibility that association witha GLE depends not on the integral intensity of particles, buton some other aspect of their energy spectrum. We presentthe results of a statistical study of SPE and GLE focusing onthe higher proton energy channels (P3 and above) on GOES.
2. Data and Method
[10] We based our study primarily on the SPE list fromNOAA Space Environment Services Center (SESC) (http://umbra.nascom.nasa.gov/SEP), which identifies 225 SPEsfrom 1976 to 2006 on the basis of 5‐minute averages of theintegral proton flux above an energy level of 10 MeV, givenin pfu, measured by GOES spacecraft at geosynchronousorbit. SESC defines the start of a proton event to be the firstof three consecutive data points with fluxes greater than orequal to 10 pfu. The end of an event is the last time the fluxwas greater than or equal to 10 pfu. We also referred to theSPE list made by Kurt et al. [2004], which broke apart themultiple events coming in quick succession from a singlelisting in the NOAA list. We added eight more events to theNOAA SESC list.
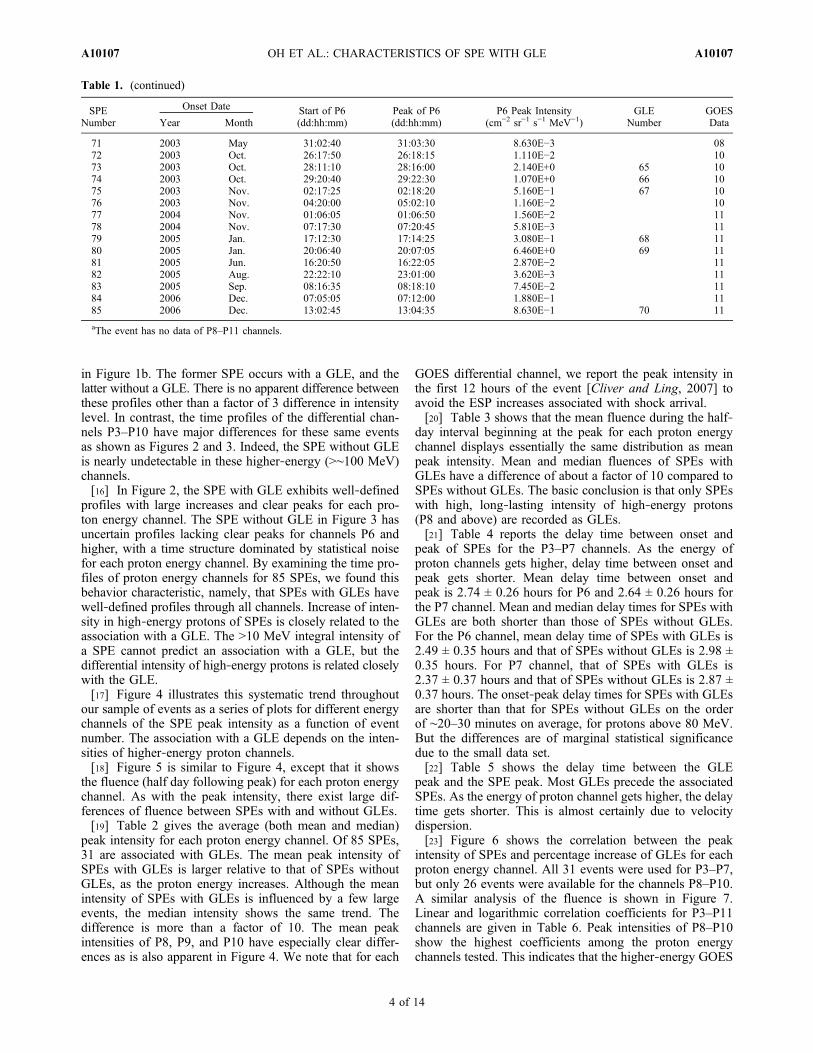
[11] From the initial 233 SPEs, our available database wasreduced to 178 SPEs occurring during 1986–2006 becauseGOES data are available only from 1986 onward and theSPE list maintained by SESC extends only to 2006. Fromthese events, we selected 85 SPEs that display a clear solarproton signal in GOES channels P6 and P7, of which 31 areassociated with GLEs. Eight of the SPEs fall within datagaps for high‐energy channels (P8–P11), of which a dispro-portionate number (five) are associated with GLEs. Conse-quently, as discussed below, we constructed a simple proxyusing IMP 8 data (Charged Particle Measurement Experiment;http://data.ftecs.com/archive/imp_cpme/) for use in part ofour analysis. Because the accuracy of the P11 integral fluxhas been questioned [Smart and Shea, 1999], we generallyomit the P11 differential flux from the figures and from ournarrative. For completeness, we do include the P11 channelin some of the tables, however.[12] Table 1 lists the 85 SPEs. The first column is simply
a sequence number we have assigned to specify the event,with a superscript a to indicate the events for which no dataexist for P8–P11. We then show the onset date (year andmonth), start time of P6, peak time of P6, peak intensity ofP6, the generally accepted GLE number for events associ-ated with GLE, and finally the GOES spacecraft (6, 7, 8, 10or 11) used for that particular event.[13] For each SPE, we determined the peak intensity, the
fluence for the half day following the peak, and the delaytime between onset and peak. If there is an associated GLEin the list from the Oulu neutron monitor station (http://cosmicrays.oulu.fi/GLE.html), we also recorded its percent-age increase and the delay time between the GLE and SPE.We also studied the correlation between the peak GLEintensity and the peak of each proton channel. We note thatthe use of a single station to characterize the GLE peakintroduces possible distortions from anisotropy of the solarparticle distribution. In spite of this, we document belowsignificant correlations between the Oulu peak and GOESenergy channels; possibly these correlations would be evenstronger if anisotropy were taken into account.[14] If SPEs have fluctuating profiles or statistical noise, it
is difficult to determine a clear peak. Choosing the largestfluctuation as the peak is essentially meaningless. This canbe particularly true of the higher‐energy channels. If there isno clear peak in channels P8–P10, we make a 1‐houraverage around the peak of the P7 profile. In the following,we shorten “SPE associated with GLE” to “SPE with GLE”and “SPE not associated with GLE” to “SPE without GLE”.The term fluence (counts cm−2 sr−1 MeV−1) as used in thispaper is the time‐integrated intensity during the half dayinterval beginning at the peak computed from 5‐minute aver-age intensity (counts cm−2 sec−1 sr−1 MeV−1). We prefer thedefinition of fluence to the fluence integrated over the wholeevent, because event onset is often difficult to define, espe-cially in minor events, and because the half‐day limitationavoids energetic storm particle (ESP) increases associatedwith the shock’s arrival at 1 AU.
3. Results
[15] Figure 1 shows examples of the time profile of SPEfor integral intensities of >10 MeV. The SPE of April 15,2001, is shown in Figure 1a and that of September 13, 2004,
OH ET AL.: CHARACTERISTICS OF SPE WITH GLE A10107A10107
2 of 14
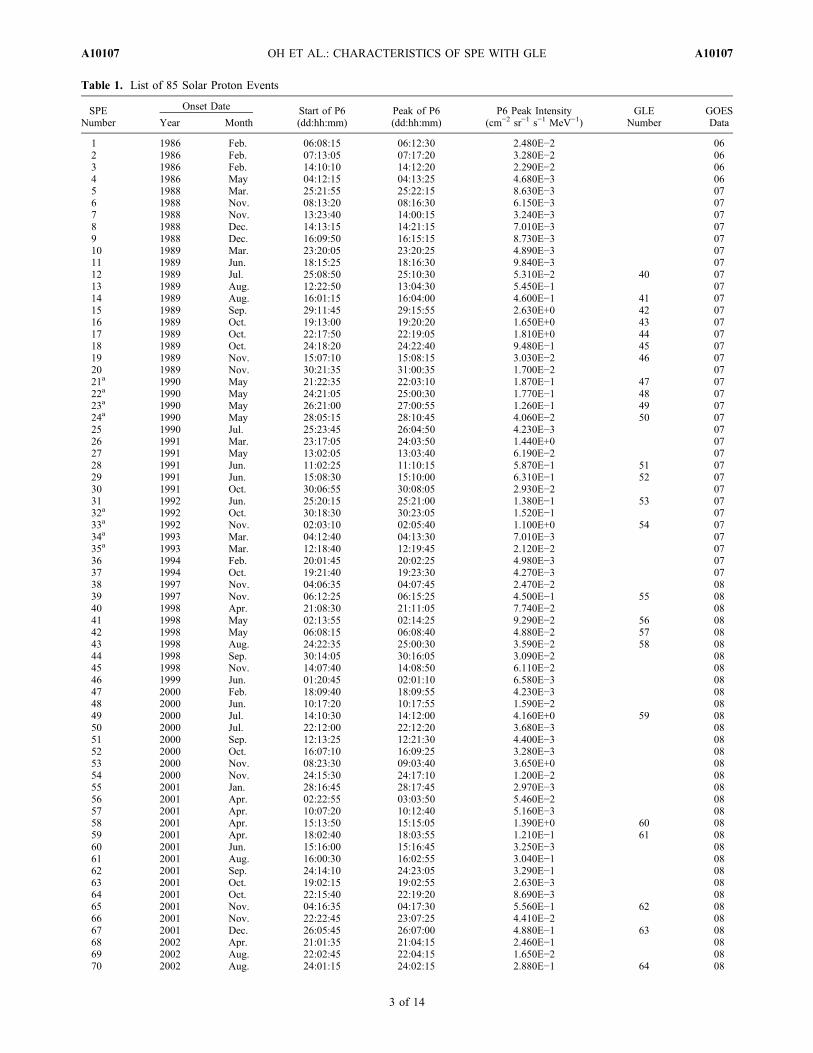
Table 1. List of 85 Solar Proton Events
SPENumber
Onset Date Start of P6(dd:hh:mm)
Peak of P6(dd:hh:mm)
P6 Peak Intensity(cm−2 sr−1 s−1 MeV−1)
GLENumber
GOESDataYear Month
1 1986 Feb. 06:08:15 06:12:30 2.480E−2 062 1986 Feb. 07:13:05 07:17:20 3.280E−2 063 1986 Feb. 14:10:10 14:12:20 2.290E−2 064 1986 May 04:12:15 04:13:25 4.680E−3 065 1988 Mar. 25:21:55 25:22:15 8.630E−3 076 1988 Nov. 08:13:20 08:16:30 6.150E−3 077 1988 Nov. 13:23:40 14:00:15 3.240E−3 078 1988 Dec. 14:13:15 14:21:15 7.010E−3 079 1988 Dec. 16:09:50 16:15:15 8.730E−3 0710 1989 Mar. 23:20:05 23:20:25 4.890E−3 0711 1989 Jun. 18:15:25 18:16:30 9.840E−3 0712 1989 Jul. 25:08:50 25:10:30 5.310E−2 40 0713 1989 Aug. 12:22:50 13:04:30 5.450E−1 0714 1989 Aug. 16:01:15 16:04:00 4.600E−1 41 0715 1989 Sep. 29:11:45 29:15:55 2.630E+0 42 0716 1989 Oct. 19:13:00 19:20:20 1.650E+0 43 0717 1989 Oct. 22:17:50 22:19:05 1.810E+0 44 0718 1989 Oct. 24:18:20 24:22:40 9.480E−1 45 0719 1989 Nov. 15:07:10 15:08:15 3.030E−2 46 0720 1989 Nov. 30:21:35 31:00:35 1.700E−2 0721a 1990 May 21:22:35 22:03:10 1.870E−1 47 0722a 1990 May 24:21:05 25:00:30 1.770E−1 48 0723a 1990 May 26:21:00 27:00:55 1.260E−1 49 0724a 1990 May 28:05:15 28:10:45 4.060E−2 50 0725 1990 Jul. 25:23:45 26:04:50 4.230E−3 0726 1991 Mar. 23:17:05 24:03:50 1.440E+0 0727 1991 May 13:02:05 13:03:40 6.190E−2 0728 1991 Jun. 11:02:25 11:10:15 5.870E−1 51 0729 1991 Jun. 15:08:30 15:10:00 6.310E−1 52 0730 1991 Oct. 30:06:55 30:08:05 2.930E−2 0731 1992 Jun. 25:20:15 25:21:00 1.380E−1 53 0732a 1992 Oct. 30:18:30 30:23:05 1.520E−1 0733a 1992 Nov. 02:03:10 02:05:40 1.100E+0 54 0734a 1993 Mar. 04:12:40 04:13:30 7.010E−3 0735a 1993 Mar. 12:18:40 12:19:45 2.120E−2 0736 1994 Feb. 20:01:45 20:02:25 4.980E−3 0737 1994 Oct. 19:21:40 19:23:30 4.270E−3 0738 1997 Nov. 04:06:35 04:07:45 2.470E−2 0839 1997 Nov. 06:12:25 06:15:25 4.500E−1 55 0840 1998 Apr. 21:08:30 21:11:05 7.740E−2 0841 1998 May 02:13:55 02:14:25 9.290E−2 56 0842 1998 May 06:08:15 06:08:40 4.880E−2 57 0843 1998 Aug. 24:22:35 25:00:30 3.590E−2 58 0844 1998 Sep. 30:14:05 30:16:05 3.090E−2 0845 1998 Nov. 14:07:40 14:08:50 6.110E−2 0846 1999 Jun. 01:20:45 02:01:10 6.580E−3 0847 2000 Feb. 18:09:40 18:09:55 4.230E−3 0848 2000 Jun. 10:17:20 10:17:55 1.590E−2 0849 2000 Jul. 14:10:30 14:12:00 4.160E+0 59 0850 2000 Jul. 22:12:00 22:12:20 3.680E−3 0851 2000 Sep. 12:13:25 12:21:30 4.400E−3 0852 2000 Oct. 16:07:10 16:09:25 3.280E−3 0853 2000 Nov. 08:23:30 09:03:40 3.650E+0 0854 2000 Nov. 24:15:30 24:17:10 1.200E−2 0855 2001 Jan. 28:16:45 28:17:45 2.970E−3 0856 2001 Apr. 02:22:55 03:03:50 5.460E−2 0857 2001 Apr. 10:07:20 10:12:40 5.160E−3 0858 2001 Apr. 15:13:50 15:15:05 1.390E+0 60 0859 2001 Apr. 18:02:40 18:03:55 1.210E−1 61 0860 2001 Jun. 15:16:00 15:16:45 3.250E−3 0861 2001 Aug. 16:00:30 16:02:55 3.040E−1 0862 2001 Sep. 24:14:10 24:23:05 3.290E−1 0863 2001 Oct. 19:02:15 19:02:55 2.630E−3 0864 2001 Oct. 22:15:40 22:19:20 8.690E−3 0865 2001 Nov. 04:16:35 04:17:30 5.560E−1 62 0866 2001 Nov. 22:22:45 23:07:25 4.410E−2 0867 2001 Dec. 26:05:45 26:07:00 4.880E−1 63 0868 2002 Apr. 21:01:35 21:04:15 2.460E−1 0869 2002 Aug. 22:02:45 22:04:15 1.650E−2 0870 2002 Aug. 24:01:15 24:02:15 2.880E−1 64 08
OH ET AL.: CHARACTERISTICS OF SPE WITH GLE A10107A10107
3 of 14
in Figure 1b. The former SPE occurs with a GLE, and thelatter without a GLE. There is no apparent difference betweenthese profiles other than a factor of 3 difference in intensitylevel. In contrast, the time profiles of the differential chan-nels P3–P10 have major differences for these same eventsas shown as Figures 2 and 3. Indeed, the SPE without GLEis nearly undetectable in these higher‐energy (>∼100 MeV)channels.[16] In Figure 2, the SPE with GLE exhibits well‐defined
profiles with large increases and clear peaks for each pro-ton energy channel. The SPE without GLE in Figure 3 hasuncertain profiles lacking clear peaks for channels P6 andhigher, with a time structure dominated by statistical noisefor each proton energy channel. By examining the time pro-files of proton energy channels for 85 SPEs, we found thisbehavior characteristic, namely, that SPEs with GLEs havewell‐defined profiles through all channels. Increase of inten-sity in high‐energy protons of SPEs is closely related to theassociation with a GLE. The >10 MeV integral intensity ofa SPE cannot predict an association with a GLE, but thedifferential intensity of high‐energy protons is related closelywith the GLE.[17] Figure 4 illustrates this systematic trend throughout
our sample of events as a series of plots for different energychannels of the SPE peak intensity as a function of eventnumber. The association with a GLE depends on the inten-sities of higher‐energy proton channels.[18] Figure 5 is similar to Figure 4, except that it shows
the fluence (half day following peak) for each proton energychannel. As with the peak intensity, there exist large dif-ferences of fluence between SPEs with and without GLEs.[19] Table 2 gives the average (both mean and median)
peak intensity for each proton energy channel. Of 85 SPEs,31 are associated with GLEs. The mean peak intensity ofSPEs with GLEs is larger relative to that of SPEs withoutGLEs, as the proton energy increases. Although the meanintensity of SPEs with GLEs is influenced by a few largeevents, the median intensity shows the same trend. Thedifference is more than a factor of 10. The mean peakintensities of P8, P9, and P10 have especially clear differ-ences as is also apparent in Figure 4. We note that for each
GOES differential channel, we report the peak intensity inthe first 12 hours of the event [Cliver and Ling, 2007] toavoid the ESP increases associated with shock arrival.[20] Table 3 shows that the mean fluence during the half‐
day interval beginning at the peak for each proton energychannel displays essentially the same distribution as meanpeak intensity. Mean and median fluences of SPEs withGLEs have a difference of about a factor of 10 compared toSPEs without GLEs. The basic conclusion is that only SPEswith high, long‐lasting intensity of high‐energy protons(P8 and above) are recorded as GLEs.[21] Table 4 reports the delay time between onset and
peak of SPEs for the P3–P7 channels. As the energy ofproton channels gets higher, delay time between onset andpeak gets shorter. Mean delay time between onset andpeak is 2.74 ± 0.26 hours for P6 and 2.64 ± 0.26 hours forthe P7 channel. Mean and median delay times for SPEs withGLEs are both shorter than those of SPEs without GLEs.For the P6 channel, mean delay time of SPEs with GLEs is2.49 ± 0.35 hours and that of SPEs without GLEs is 2.98 ±0.35 hours. For P7 channel, that of SPEs with GLEs is2.37 ± 0.37 hours and that of SPEs without GLEs is 2.87 ±0.37 hours. The onset‐peak delay times for SPEs with GLEsare shorter than that for SPEs without GLEs on the orderof ∼20–30 minutes on average, for protons above 80 MeV.But the differences are of marginal statistical significancedue to the small data set.[22] Table 5 shows the delay time between the GLE
peak and the SPE peak. Most GLEs precede the associatedSPEs. As the energy of proton channel gets higher, the delaytime gets shorter. This is almost certainly due to velocitydispersion.[23] Figure 6 shows the correlation between the peak
intensity of SPEs and percentage increase of GLEs for eachproton energy channel. All 31 events were used for P3–P7,but only 26 events were available for the channels P8–P10.A similar analysis of the fluence is shown in Figure 7.Linear and logarithmic correlation coefficients for P3–P11channels are given in Table 6. Peak intensities of P8–P10show the highest coefficients among the proton energychannels tested. This indicates that the higher‐energy GOES
Table 1. (continued)
SPENumber
Onset Date Start of P6(dd:hh:mm)
Peak of P6(dd:hh:mm)
P6 Peak Intensity(cm−2 sr−1 s−1 MeV−1)
GLENumber
GOESDataYear Month
71 2003 May 31:02:40 31:03:30 8.630E−3 0872 2003 Oct. 26:17:50 26:18:15 1.110E−2 1073 2003 Oct. 28:11:10 28:16:00 2.140E+0 65 1074 2003 Oct. 29:20:40 29:22:30 1.070E+0 66 1075 2003 Nov. 02:17:25 02:18:20 5.160E−1 67 1076 2003 Nov. 04:20:00 05:02:10 1.160E−2 1077 2004 Nov. 01:06:05 01:06:50 1.560E−2 1178 2004 Nov. 07:17:30 07:20:45 5.810E−3 1179 2005 Jan. 17:12:30 17:14:25 3.080E−1 68 1180 2005 Jan. 20:06:40 20:07:05 6.460E+0 69 1181 2005 Jun. 16:20:50 16:22:05 2.870E−2 1182 2005 Aug. 22:22:10 23:01:00 3.620E−3 1183 2005 Sep. 08:16:35 08:18:10 7.450E−2 1184 2006 Dec. 07:05:05 07:12:00 1.880E−1 1185 2006 Dec. 13:02:45 13:04:35 8.630E−1 70 11
aThe event has no data of P8–P11 channels.
OH ET AL.: CHARACTERISTICS OF SPE WITH GLE A10107A10107
4 of 14
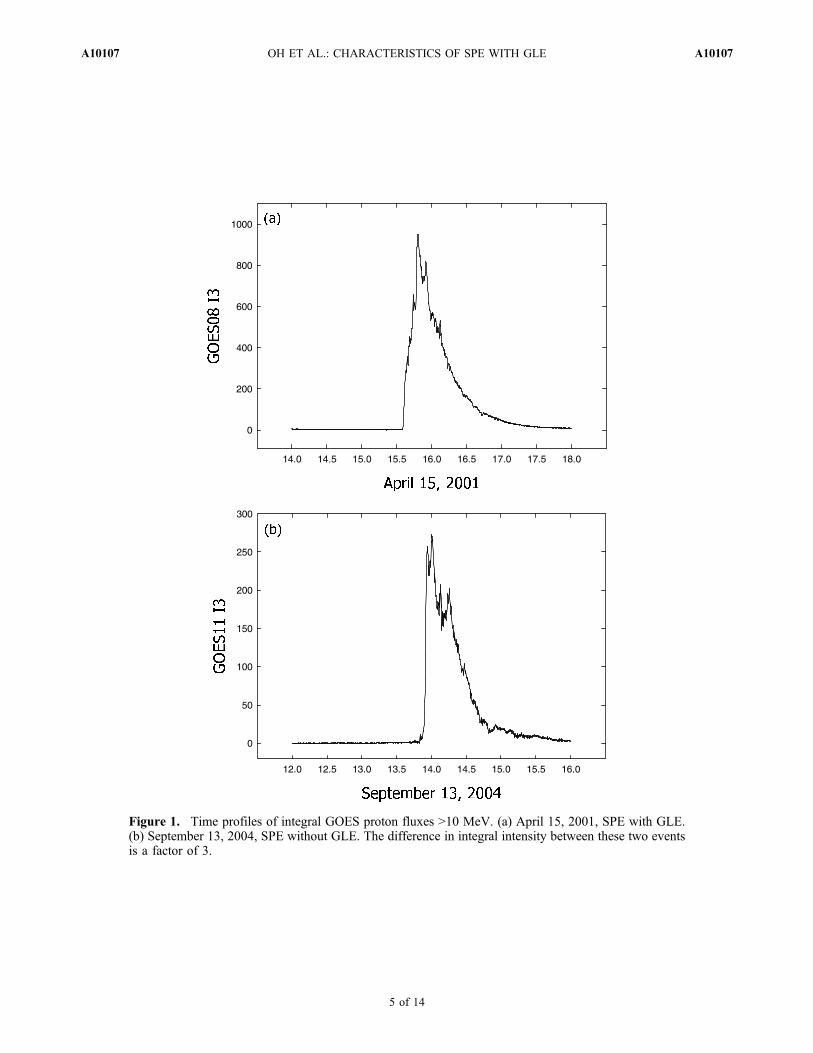
Figure 1. Time profiles of integral GOES proton fluxes >10 MeV. (a) April 15, 2001, SPE with GLE.(b) September 13, 2004, SPE without GLE. The difference in integral intensity between these two eventsis a factor of 3.
OH ET AL.: CHARACTERISTICS OF SPE WITH GLE A10107A10107
5 of 14
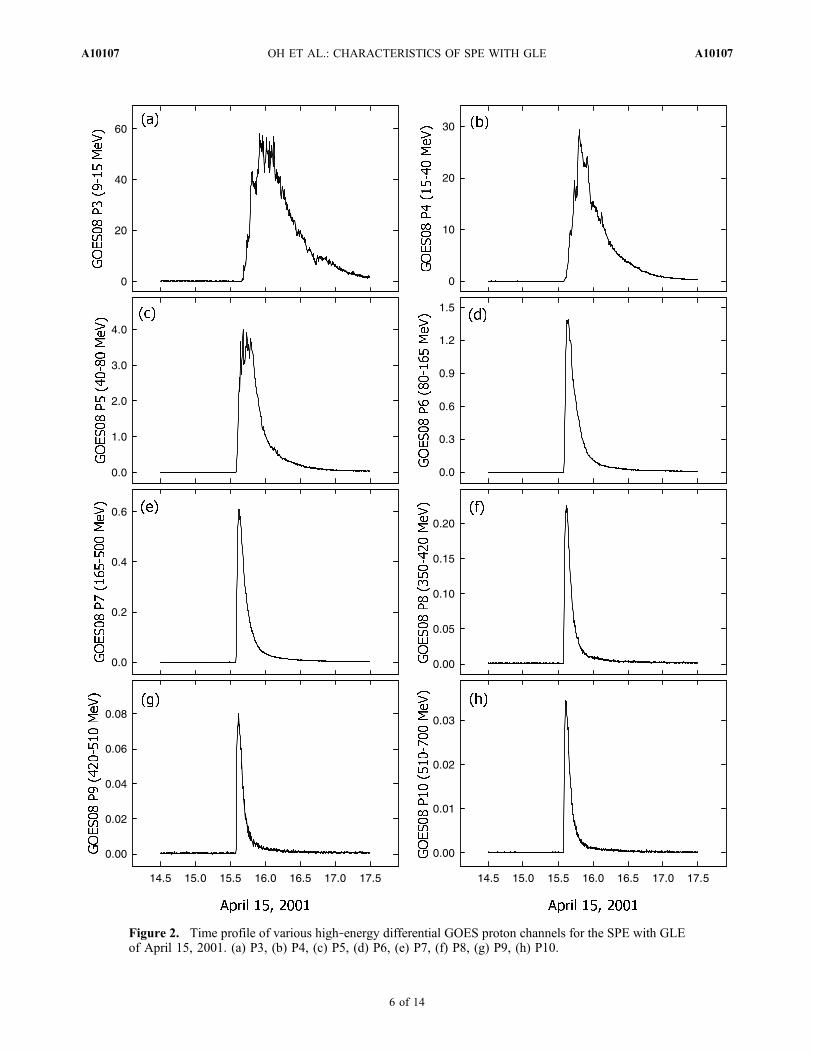
Figure 2. Time profile of various high‐energy differential GOES proton channels for the SPE with GLEof April 15, 2001. (a) P3, (b) P4, (c) P5, (d) P6, (e) P7, (f) P8, (g) P9, (h) P10.
OH ET AL.: CHARACTERISTICS OF SPE WITH GLE A10107A10107
6 of 14
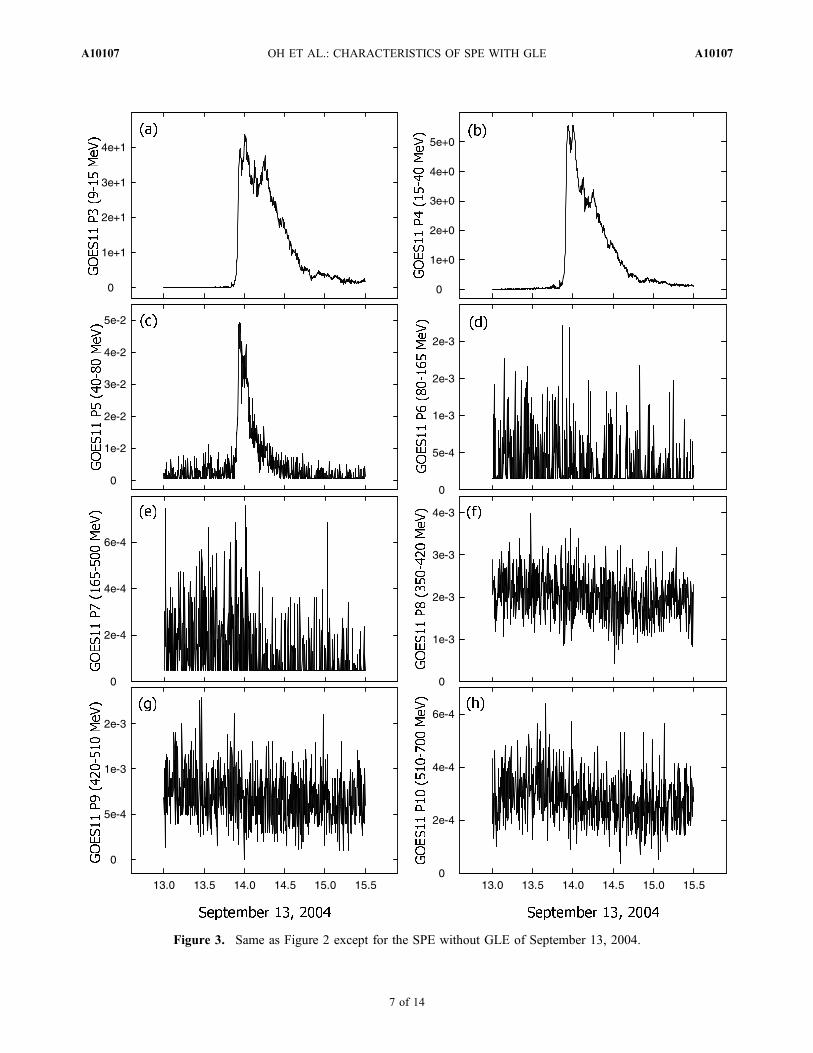
Figure 3. Same as Figure 2 except for the SPE without GLE of September 13, 2004.
OH ET AL.: CHARACTERISTICS OF SPE WITH GLE A10107A10107
7 of 14
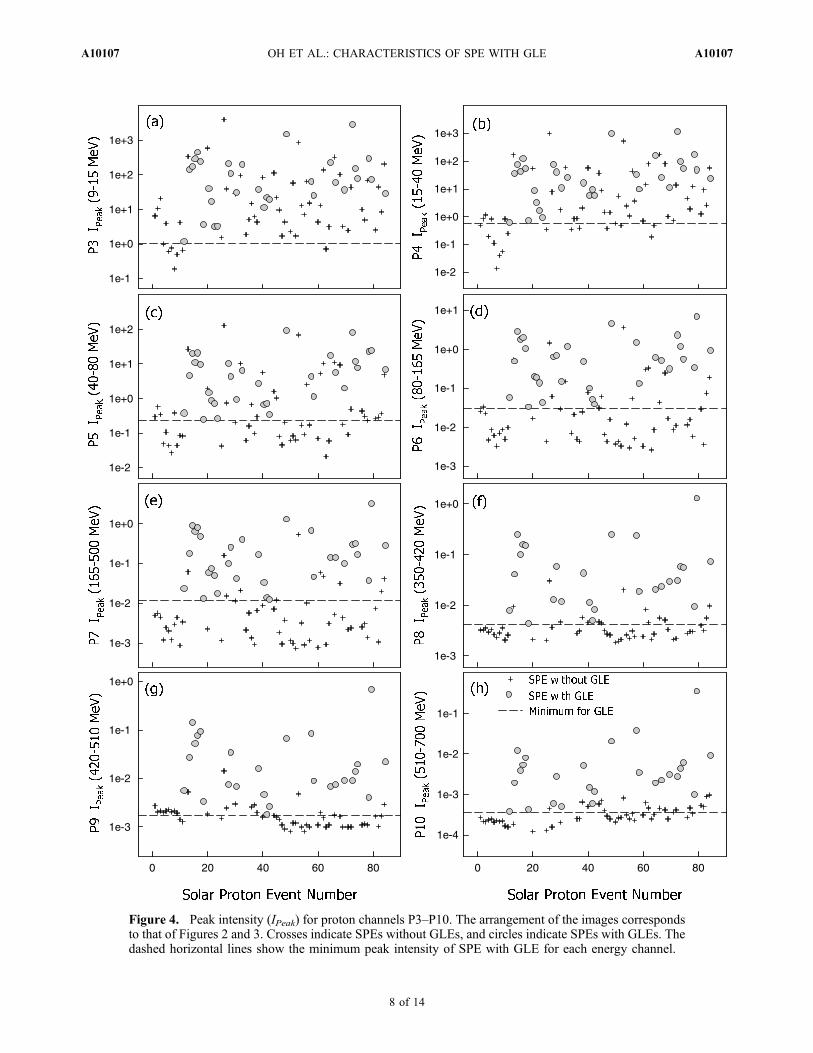
Figure 4. Peak intensity (IPeak) for proton channels P3–P10. The arrangement of the images correspondsto that of Figures 2 and 3. Crosses indicate SPEs without GLEs, and circles indicate SPEs with GLEs. Thedashed horizontal lines show the minimum peak intensity of SPE with GLE for each energy channel.
OH ET AL.: CHARACTERISTICS OF SPE WITH GLE A10107A10107
8 of 14
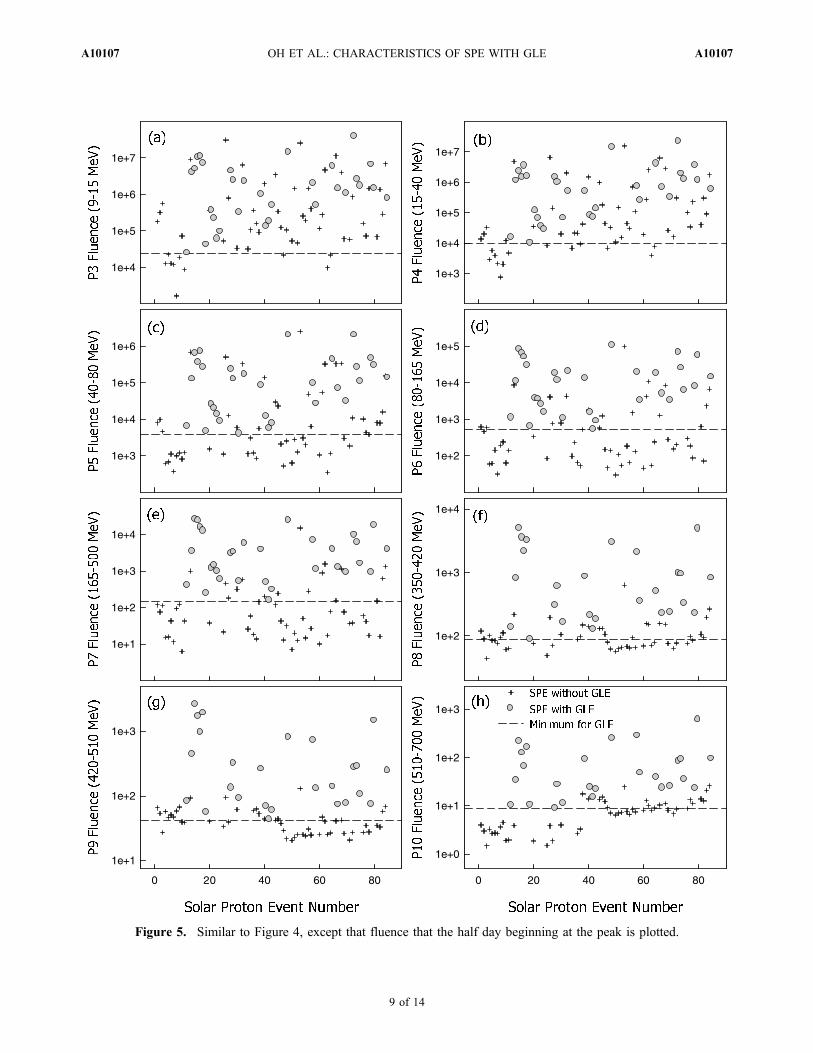
Figure 5. Similar to Figure 4, except that fluence that the half day beginning at the peak is plotted.
OH ET AL.: CHARACTERISTICS OF SPE WITH GLE A10107A10107
9 of 14
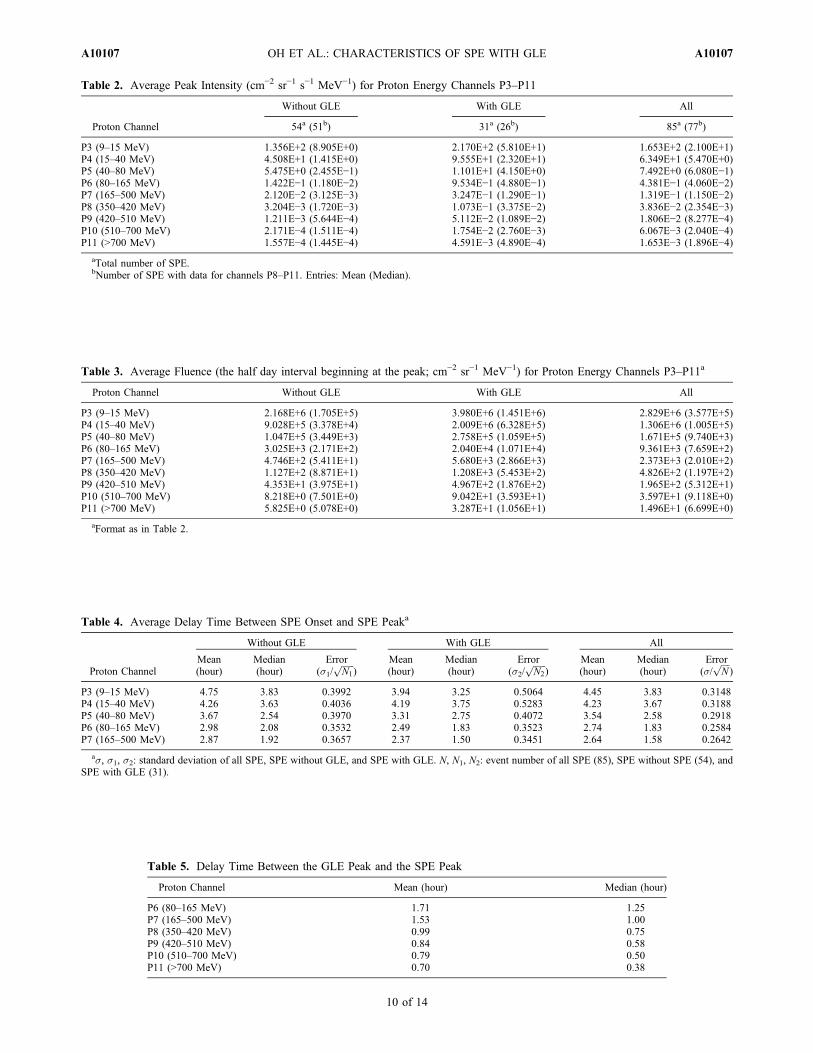
Table 2. Average Peak Intensity (cm−2 sr−1 s−1 MeV−1) for Proton Energy Channels P3–P11
Proton Channel
Without GLE With GLE All
54a (51b) 31a (26b) 85a (77b)
P3 (9–15 MeV) 1.356E+2 (8.905E+0) 2.170E+2 (5.810E+1) 1.653E+2 (2.100E+1)P4 (15–40 MeV) 4.508E+1 (1.415E+0) 9.555E+1 (2.320E+1) 6.349E+1 (5.470E+0)P5 (40–80 MeV) 5.475E+0 (2.455E−1) 1.101E+1 (4.150E+0) 7.492E+0 (6.080E−1)P6 (80–165 MeV) 1.422E−1 (1.180E−2) 9.534E−1 (4.880E−1) 4.381E−1 (4.060E−2)P7 (165–500 MeV) 2.120E−2 (3.125E−3) 3.247E−1 (1.290E−1) 1.319E−1 (1.150E−2)P8 (350–420 MeV) 3.204E−3 (1.720E−3) 1.073E−1 (3.375E−2) 3.836E−2 (2.354E−3)P9 (420–510 MeV) 1.211E−3 (5.644E−4) 5.112E−2 (1.089E−2) 1.806E−2 (8.277E−4)P10 (510–700 MeV) 2.171E−4 (1.511E−4) 1.754E−2 (2.760E−3) 6.067E−3 (2.040E−4)P11 (>700 MeV) 1.557E−4 (1.445E−4) 4.591E−3 (4.890E−4) 1.653E−3 (1.896E−4)
aTotal number of SPE.bNumber of SPE with data for channels P8–P11. Entries: Mean (Median).
Table 3. Average Fluence (the half day interval beginning at the peak; cm−2 sr−1 MeV−1) for Proton Energy Channels P3–P11a
Proton Channel Without GLE With GLE All
P3 (9–15 MeV) 2.168E+6 (1.705E+5) 3.980E+6 (1.451E+6) 2.829E+6 (3.577E+5)P4 (15–40 MeV) 9.028E+5 (3.378E+4) 2.009E+6 (6.328E+5) 1.306E+6 (1.005E+5)P5 (40–80 MeV) 1.047E+5 (3.449E+3) 2.758E+5 (1.059E+5) 1.671E+5 (9.740E+3)P6 (80–165 MeV) 3.025E+3 (2.171E+2) 2.040E+4 (1.071E+4) 9.361E+3 (7.659E+2)P7 (165–500 MeV) 4.746E+2 (5.411E+1) 5.680E+3 (2.866E+3) 2.373E+3 (2.010E+2)P8 (350–420 MeV) 1.127E+2 (8.871E+1) 1.208E+3 (5.453E+2) 4.826E+2 (1.197E+2)P9 (420–510 MeV) 4.353E+1 (3.975E+1) 4.967E+2 (1.876E+2) 1.965E+2 (5.312E+1)P10 (510–700 MeV) 8.218E+0 (7.501E+0) 9.042E+1 (3.593E+1) 3.597E+1 (9.118E+0)P11 (>700 MeV) 5.825E+0 (5.078E+0) 3.287E+1 (1.056E+1) 1.496E+1 (6.699E+0)
aFormat as in Table 2.
Table 4. Average Delay Time Between SPE Onset and SPE Peaka
Proton Channel
Without GLE With GLE All
Mean(hour)
Median(hour)
Error(s1/
ffiffiffiffiffiffi
N1p
)Mean(hour)
Median(hour)
Error(s2/
ffiffiffiffiffiffi
N2p
)Mean(hour)
Median(hour)
Error(s/
ffiffiffiffi
Np
)
P3 (9–15 MeV) 4.75 3.83 0.3992 3.94 3.25 0.5064 4.45 3.83 0.3148P4 (15–40 MeV) 4.26 3.63 0.4036 4.19 3.75 0.5283 4.23 3.67 0.3188P5 (40–80 MeV) 3.67 2.54 0.3970 3.31 2.75 0.4072 3.54 2.58 0.2918P6 (80–165 MeV) 2.98 2.08 0.3532 2.49 1.83 0.3523 2.74 1.83 0.2584P7 (165–500 MeV) 2.87 1.92 0.3657 2.37 1.50 0.3451 2.64 1.58 0.2642
as, s1, s2: standard deviation of all SPE, SPE without GLE, and SPE with GLE. N, N1, N2: event number of all SPE (85), SPE without SPE (54), andSPE with GLE (31).
Table 5. Delay Time Between the GLE Peak and the SPE Peak
Proton Channel Mean (hour) Median (hour)
P6 (80–165 MeV) 1.71 1.25P7 (165–500 MeV) 1.53 1.00P8 (350–420 MeV) 0.99 0.75P9 (420–510 MeV) 0.84 0.58P10 (510–700 MeV) 0.79 0.50P11 (>700 MeV) 0.70 0.38
OH ET AL.: CHARACTERISTICS OF SPE WITH GLE A10107A10107
10 of 14
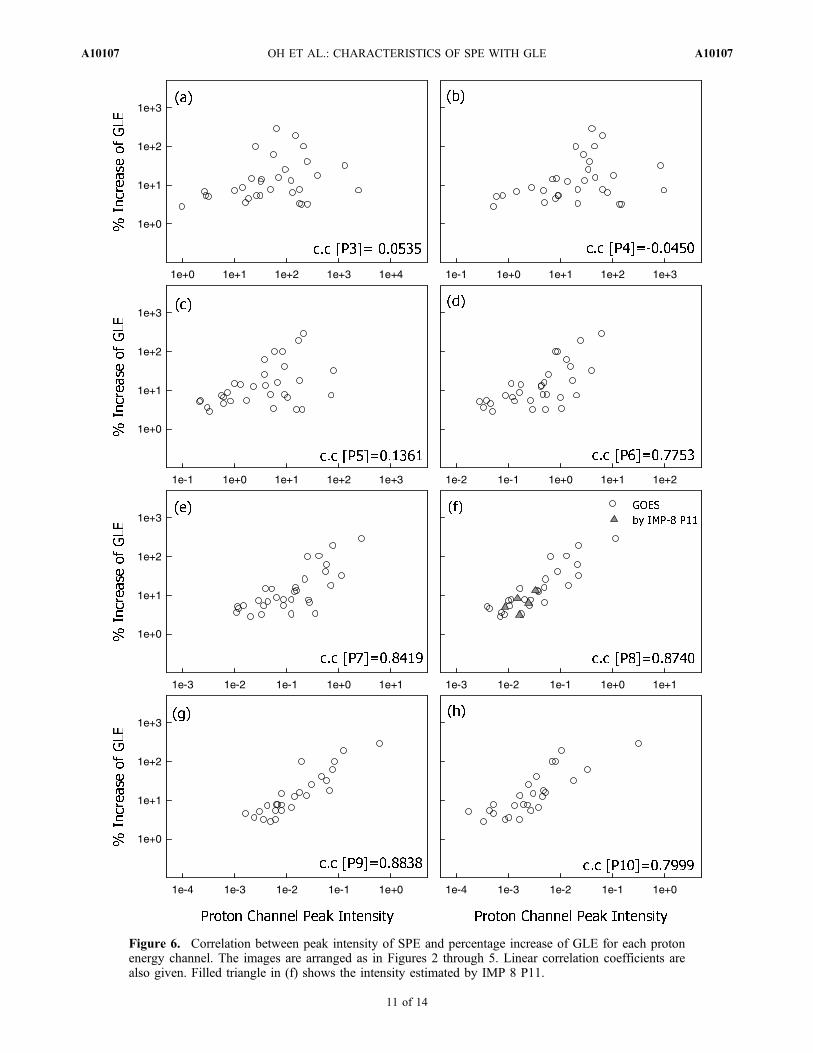
Figure 6. Correlation between peak intensity of SPE and percentage increase of GLE for each protonenergy channel. The images are arranged as in Figures 2 through 5. Linear correlation coefficients arealso given. Filled triangle in (f) shows the intensity estimated by IMP 8 P11.
OH ET AL.: CHARACTERISTICS OF SPE WITH GLE A10107A10107
11 of 14
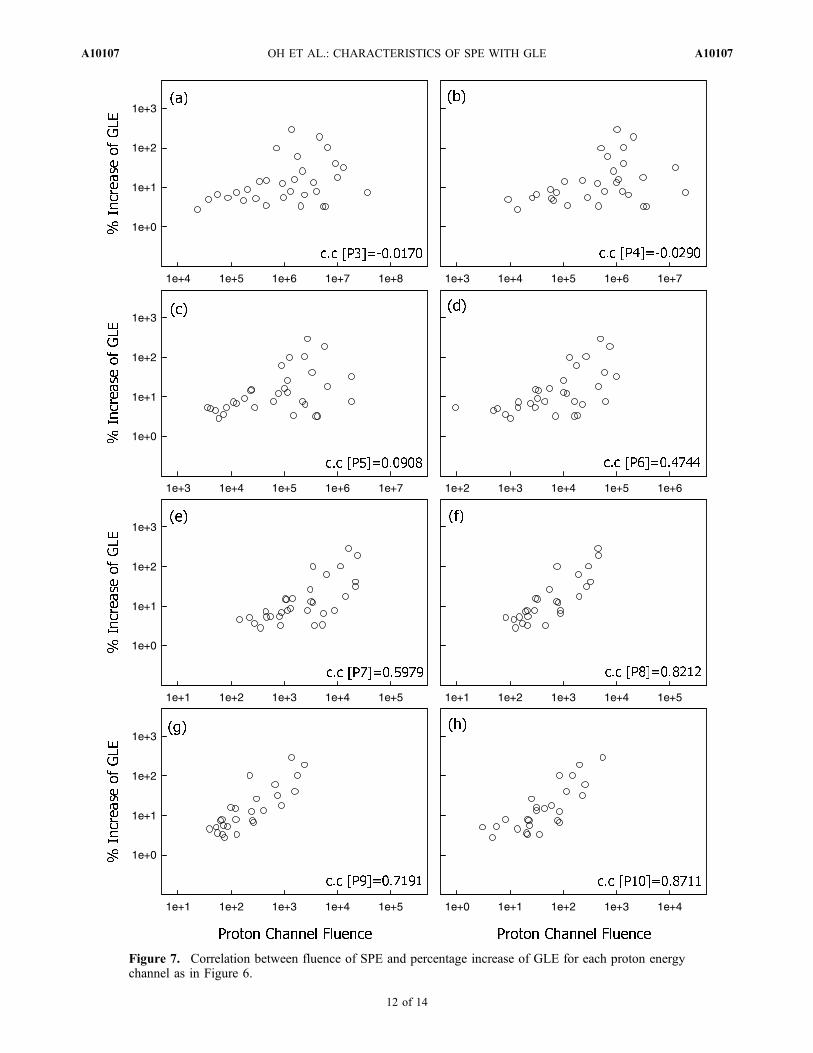
Figure 7. Correlation between fluence of SPE and percentage increase of GLE for each proton energychannel as in Figure 6.
OH ET AL.: CHARACTERISTICS OF SPE WITH GLE A10107A10107
12 of 14
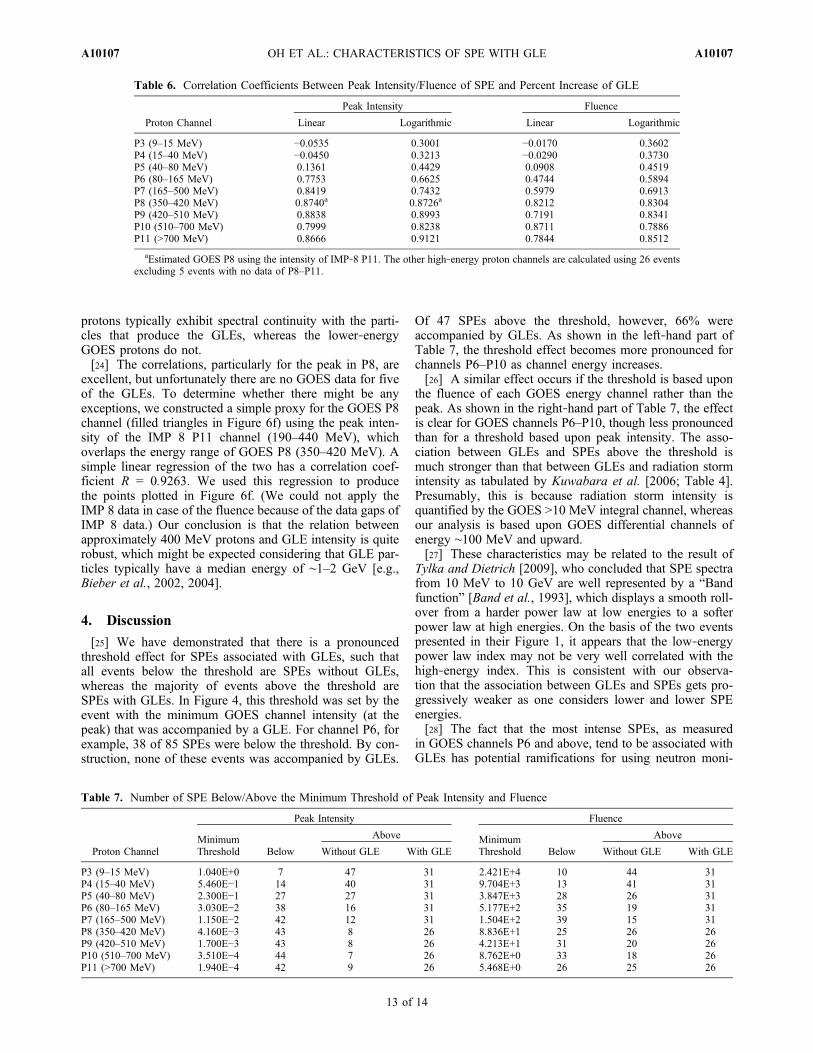
protons typically exhibit spectral continuity with the parti-cles that produce the GLEs, whereas the lower‐energyGOES protons do not.[24] The correlations, particularly for the peak in P8, are
excellent, but unfortunately there are no GOES data for fiveof the GLEs. To determine whether there might be anyexceptions, we constructed a simple proxy for the GOES P8channel (filled triangles in Figure 6f) using the peak inten-sity of the IMP 8 P11 channel (190–440 MeV), whichoverlaps the energy range of GOES P8 (350–420 MeV). Asimple linear regression of the two has a correlation coef-ficient R = 0.9263. We used this regression to producethe points plotted in Figure 6f. (We could not apply theIMP 8 data in case of the fluence because of the data gaps ofIMP 8 data.) Our conclusion is that the relation betweenapproximately 400 MeV protons and GLE intensity is quiterobust, which might be expected considering that GLE par-ticles typically have a median energy of ∼1–2 GeV [e.g.,Bieber et al., 2002, 2004].
4. Discussion
[25] We have demonstrated that there is a pronouncedthreshold effect for SPEs associated with GLEs, such thatall events below the threshold are SPEs without GLEs,whereas the majority of events above the threshold areSPEs with GLEs. In Figure 4, this threshold was set by theevent with the minimum GOES channel intensity (at thepeak) that was accompanied by a GLE. For channel P6, forexample, 38 of 85 SPEs were below the threshold. By con-struction, none of these events was accompanied by GLEs.
Of 47 SPEs above the threshold, however, 66% wereaccompanied by GLEs. As shown in the left‐hand part ofTable 7, the threshold effect becomes more pronounced forchannels P6–P10 as channel energy increases.[26] A similar effect occurs if the threshold is based upon
the fluence of each GOES energy channel rather than thepeak. As shown in the right‐hand part of Table 7, the effectis clear for GOES channels P6–P10, though less pronouncedthan for a threshold based upon peak intensity. The asso-ciation between GLEs and SPEs above the threshold ismuch stronger than that between GLEs and radiation stormintensity as tabulated by Kuwabara et al. [2006; Table 4].Presumably, this is because radiation storm intensity isquantified by the GOES >10 MeV integral channel, whereasour analysis is based upon GOES differential channels ofenergy ∼100 MeV and upward.[27] These characteristics may be related to the result of
Tylka and Dietrich [2009], who concluded that SPE spectrafrom 10 MeV to 10 GeV are well represented by a “Bandfunction” [Band et al., 1993], which displays a smooth roll-over from a harder power law at low energies to a softerpower law at high energies. On the basis of the two eventspresented in their Figure 1, it appears that the low‐energypower law index may not be very well correlated with thehigh‐energy index. This is consistent with our observa-tion that the association between GLEs and SPEs gets pro-gressively weaker as one considers lower and lower SPEenergies.[28] The fact that the most intense SPEs, as measured
in GOES channels P6 and above, tend to be associated withGLEs has potential ramifications for using neutron moni-
Table 6. Correlation Coefficients Between Peak Intensity/Fluence of SPE and Percent Increase of GLE
Proton Channel
Peak Intensity Fluence
Linear Logarithmic Linear Logarithmic
P3 (9–15 MeV) −0.0535 0.3001 −0.0170 0.3602P4 (15–40 MeV) −0.0450 0.3213 −0.0290 0.3730P5 (40–80 MeV) 0.1361 0.4429 0.0908 0.4519P6 (80–165 MeV) 0.7753 0.6625 0.4744 0.5894P7 (165–500 MeV) 0.8419 0.7432 0.5979 0.6913P8 (350–420 MeV) 0.8740a 0.8726a 0.8212 0.8304P9 (420–510 MeV) 0.8838 0.8993 0.7191 0.8341P10 (510–700 MeV) 0.7999 0.8238 0.8711 0.7886P11 (>700 MeV) 0.8666 0.9121 0.7844 0.8512
aEstimated GOES P8 using the intensity of IMP‐8 P11. The other high‐energy proton channels are calculated using 26 eventsexcluding 5 events with no data of P8–P11.
Table 7. Number of SPE Below/Above the Minimum Threshold of Peak Intensity and Fluence
Proton Channel
Peak Intensity Fluence
MinimumThreshold Below
Above MinimumThreshold Below
Above
Without GLE With GLE Without GLE With GLE
P3 (9–15 MeV) 1.040E+0 7 47 31 2.421E+4 10 44 31P4 (15–40 MeV) 5.460E−1 14 40 31 9.704E+3 13 41 31P5 (40–80 MeV) 2.300E−1 27 27 31 3.847E+3 28 26 31P6 (80–165 MeV) 3.030E−2 38 16 31 5.177E+2 35 19 31P7 (165–500 MeV) 1.150E−2 42 12 31 1.504E+2 39 15 31P8 (350–420 MeV) 4.160E−3 43 8 26 8.836E+1 25 26 26P9 (420–510 MeV) 1.700E−3 43 8 26 4.213E+1 31 20 26P10 (510–700 MeV) 3.510E−4 44 7 26 8.762E+0 33 18 26P11 (>700 MeV) 1.940E−4 42 9 26 5.468E+0 26 25 26
OH ET AL.: CHARACTERISTICS OF SPE WITH GLE A10107A10107
13 of 14
tors as a space weather tool. Owing to the high speed ofrelativistic solar cosmic rays, an alert system based uponneutron monitor data can provide an early alert of anextreme radiation storm that is 10–30 minutes earlier thanthe earliest proton alert issued by the Space Weather Pre-diction Center [Kuwabara et al., 2006]. Further, the fact thatpeak GLE intensity is well correlated with peak GOESchannel intensity (Figure 6 and Table 6) suggests that neu-tron monitor observations may have predictive value forSPE differential intensity to energies at least as low as∼100 MeV. This possibility will be examined further in aforthcoming publication.[29] Although we have referred to the events under dis-
cussion as solar proton events (SPE), this should not betaken to mean that the accelerated particles are exclusivelyprotons. In fact, there is a strong tendency for SPEs withGLEs to be iron‐rich at high energy [Tylka et al., 1999;Lopate, 2001]. Taking account of the differing character-istics of proton‐ and iron‐specific yield functions, Tylka et al.[1999] concluded that the Fe contribution to the neutronmonitor signal was at most 10% during the September 29,1989, SPE. Lopate [2001] concluded that energetic iron nucleicontributed no more than 9% of the count rate recorded byClimax neutron monitor during the same event.
[30] Acknowledgments. This work was supported by the BAERINuclear R&D program of the Ministry of Education, Science and Technol-ogy (MEST)/ Korea Science and Engineering Foundation (KOSEF) and bythe National Research Foundation of Korea Grant funded by the KoreanGovernment (NRF‐2009‐352‐C00051). This work was also supported byNASA LWS grant NNX08AQ18G and by NASA/EPSCoR CooperativeAgreement NNX09AB05A. The lists of GLEs and SPEs are archived atOulu neutron monitor station operated by Sodankyla Geophysical Observa-tory and at NOAA Space Environment Services Center. We thank all thesedata managers: Ilya Usoskin, Joe Kunches, and Joseph B. Gurman.[31] Philippa Browning thanks Galina Bazilevskaya and another
reviewer for their assistance in evaluating this paper.
ReferencesBand, D., J. Matteson, L. Ford, B. Schaefer, D. Palmer, B. Teegarden,T. Cline, M. Briggs, W. Paciesas, G. Pendleton, G. Fishman, C. Kouveliotou,C. Meegan, R. Wilson, and P. Lestrade (1993), BATSE observationsof gamma‐ray burst spectra. I. Spectral diversity, Astrophys. J., 413,281–292.
Bieber, J. W., W. Droge, P. A. Evenson, R. Pyle, D. Ruffolo, U. Pinsook,P. Tooprakai, M. Rujiwarodom, T. Khumlumlert, and S. Krucker (2002),Energetic particle observations during the 2000 July 14 solar event,Astrophys. J., 567, 622–634.
Bieber, J. W., P. Evenson, W. Droge, R. Pyle, D. Ruffolo, M. Rujiwarodom,P. Tooprakai, and T. Khumlumlert (2004), Spaceship Earth observationsof the Easter 2001 solar particle event, Astrophys. J., 601, L103–L106.
Cliver, E. W. (2006), The unusual relativistic solar proton events of 1979August 21 and 1981 May 10, Astrophys. J., 639, 1206–1217.
Cliver, E. W., and A. G. Ling (2007), Electrons and protons in solar ener-getic particle Events, Astrophys. J., 658, 1349–1356.
El‐Borie, M. A. (2003), Major solar‐energetic particle fluxes: I. Com-parison with the associated ground level enhancement of cosmic rays,Astroparticles Phys., 19, 549–558.
Forbush, S. E. (1946), The first identification of solar proton events in1942, Phys. Rev., 70, 771.
Kahler, S. W. (1982), The role of the big flare syndrome in correlations ofsolar energetic proton fluxes and associated microwave burst parameters,J. Geophys. Res., 87, 3439–3448, doi:10.1029/JA087iA05p03439.
Kurt, V., A. Belov, H. Mavromichalaki, and M. Gerontidou (2004), Statis-tical analysis of solar proton events, Ann. Geophys., 22, 2255–2271.
Kuwabara, T., J. W. Bieber, J. Clem, P. Evenson, and R. Pyle (2006),Development of a ground level enhancement alarm system basedupon neutron monitors, Space Weather, 4, S10001, doi:10.1029/2006SW000223.
Lario, D., A. Aran, and R. B. Decker (2008), Major solar energetic particleevents of solar cycles 22 and 23: Intensities above the streaming limit,Space Weather, 6, S12001, doi:10.1029/2008SW000403.
Lopate, C. (2001), Climac neutron monitor response to incident iron ions:An application to the 29 Sept 1989 ground level event, Proc. of 27th Int.Cosmic Ray Conf., 8, 3398–3400.
Reames, D. V., and C. K. Ng (1998), Streaming‐limited intensities of solarenergetic particles, Astrophys. J., 504, 1002–1005.
Smart, D. F., and M. A. Shea (1999), Comment on the use of GOES solarproton data and spectra in solar dose calculations, Rad. Meas., 30(3),327–335.
Tylka, A. J., and W. F. Dietrich (2009), A new and comprehensive analysisof proton spectra in ground‐level enhanced (GLE) solar particle events,31th Int. Cosmic Ray Conf., SH 1.5, 273.
Tylka, A. J., and M. A. Lee (2006), A model for spectral and compositionalvariability at high energies in large, gradual solar particle events, Astro-phys. J., 646, 1319–1334.
Tylka, A. J., W. F. Dietrich, C. Lopate, and D. V. Reames (1999), High‐energy solar Fe ions in the 29 September 1989 ground level event, Proc.of 26th Int. Cosmic Ray Conf., 6, 67–70.
Tylka, A. J., C. M. S. Cohen, W. F. Dietrich, M. A. Lee, C. G. Maclennan,R. A. Mewaldt, C. K. Ng, and D. V. Reames (2005), Shock geometry,seed populations, and the origin of variable elemental composition athigh energies in large gradual solar particle events, Astrophys. J., 625,474–495.
Tylka, A. J., C. M. S. Cohen, W. F. Dietrich, M. A. Lee, C. G. Maclennan,R. A. Mewaldt, C. K. Ng, and D. V. Reames (2006), A comparativestudy of ion characteristics in the large gradual solar energetic particleevents of 2002 April 21 and 2002 August 24, Astrophys. J. Suppl.Ser., 164, 536–551.
Wang, R. (2006), Statistical characteristics of solar energetic proton eventsfrom January 1997 to June 2005, Astroparticles Phys., 26, 202–208.
J. W. Bieber, P. Evenson, and S. Y. Oh, Department of Physics andAstronomy, University of Delaware, Newark, DE 19716, USA. ([email protected])Y. K. Kim, Department of Nuclear Engineering, Hanyang University,
Seoul 133‐791, South Korea.Y. Yi, Department of Astronomy and Space Science, Chungnam National
University, Daejeon 305‐764, South Korea.
OH ET AL.: CHARACTERISTICS OF SPE WITH GLE A10107A10107
14 of 14