draft€final … · appendix b. field data collection sheets ... cercla comprehensive...
TRANSCRIPT
USEPA CONTRACT NO. 68W60042USEPA WORK ASSIGNMENT NO. 157RDRD0132
USEPA Project Officer: Diana KingUSEPA Remedial Project Manager: Derrick Golden
DRAFT FINALSOURCE AREA REEVALUATION REPORT
GROVELAND WELLS NOs. 1 AND 2 SUPERFUND SITESOURCE REEVALUATION
GROVELAND, MASSACHUSETTS
VOLUME I
September 2006
Prepared By:
Metcalf & Eddy, Inc.701 Edgewater Drive
Wakefield, Massachusetts
WA#157DFSCRPT0906500
USEPA CONTRACT NO. 68W60042USEPA WORK ASSIGNMENT NO. 157RDRD0132
USEPA Project Officer: Diana KingUSEPA Remedial Project Manager: Derrick Golden
DRAFT FINALSOURCE AREA REEVALUATION REPORT
GROVELAND WELLS NOs. 1 AND 2 SUPERFUND SITESOURCE REEVALUATION
GROVELAND, MASSACHUSETTS
VOLUME I
September 2006
Prepared By:
Metcalf & Eddy, Inc.701 Edgewater Drive
Wakefield, Massachusetts

WA#157-DFSCRPT-0906-500i
VOLUME I
LIST OF ACRONYMS AND ABBREVIATIONS ........................................................................................ v
1.0 INTRODUCTION .............................................................................................................................. 1
2.0 SITE DESCRIPTION AND BACKGROUND INFORMATION............................................................. 22.1 Site Location and Description.................................................................................................... 22.2 Site History and Use ................................................................................................................. 3
3.0 TECHNICAL APPROACH TO THE WORK ASSIGNMENT ................................................................ 83.1 Problem Definition and Project Overview................................................................................... 83.2 Sampling Program .................................................................................................................... 9
3.2.1 Soil Vapor Point Survey (Existing Soil Vapor Extraction Points), 2004 ............................ 93.2.2 Soil and/or Groundwater Sampling (Conventional Geoprobe, Standard Drill Rig), 2004 103.2.3 Bedrock Well Installation, 2004..................................................................................... 113.2.4 Groundwater Sampling (Passive Diffusion Bags),2004 ................................................. 113.2.5 Limited UST Investigation, 2004 ................................................................................... 123.2.6 Ground Penetrating Radar Survey, 2006 ...................................................................... 123.2.7 Demolition of the Porch Structure, 2006 ....................................................................... 123.2.8 Sub-slab Soil Gas Sampling, 2006 ............................................................................... 123.2.9 Soil and/or Groundwater Sampling (Standard and Indoor Drill Rigs), 2006.................... 133.2.10 Residential Soil Sampling, 2006 .................................................................................. 143.2.11 Tank Removal Activities, 2006..................................................................................... 143.2.12 Slug Tests, 2006 ......................................................................................................... 153.2.13 In-situ Chemical Oxidation Test, 2006 ......................................................................... 153.2.14 Ex-situ Chemical Oxidation Test, 2006 ........................................................................ 163.2.15 White Pine Tree Assessment, 2006............................................................................. 163.2.16 In-situ Soil Mixing and Chemical Oxidation, 2006......................................................... 16
3.3 Analytical Program.................................................................................................................. 163.3.1 Project Data Quality Objectives (DQOs) ....................................................................... 173.3.2 Data Validation and Data Usability................................................................................ 173.3.3 Measurement Performance Criteria .............................................................................. 173.3.4 Documentation, Records, and Data Management......................................................... 17
4.0 CONCEPTUAL MODEL OF SOURCE AREA CONTAMINATION..................................................... 184.1 Original Conceptual Model (1985) ............................................................................................ 184.2 Evaluation of Results of Current Investigations........................................................................ 18 4.2.1 Shallow Overburden Soil Contamination..................................................................... 19 4.2.2 Shallow Overburden Groundwater Contamination ...................................................... 21 4.2.3 Shallow Overburden Sub-slab Air Contamination. ...................................................... 21 4.2.4 Clay Soil Contamination ............................................................................................. 21 4.2.5 Clay Groundwater Contamination ............................................................................... 22 4.2.6 Deep Permeable Overburden Soil Contamination....................................................... 22 4.2.7 Deep Low Permeability Overburden Soil Contamination ............................................. 23 4.2.8 Deep Overburden Groundwater Contamination .......................................................... 23 4.2.9 Bedrock Groundwater Contamination ......................................................................... 26 4.2.9 Groundwater Movement in the Source Area ................................................................. 274.3 Current Conceptual Model ...................................................................................................... 28
WA#157-DFSCRPT-0906-500ii
5.0 Remedial Pilot Testing ..................................................................................................................... 315.1 Permanganate Soil Oxidant Demand ...................................................................................... 315.2 In-situ Chemical Oxidation for Groundwater ............................................................................. 31 5.2.1 Placement and Selection of Injection Wells.................................................................... 31 5.2.2 Sodium Permanganate Injection.................................................................................... 32 5.2.3 Radius of Influence Monitoring. ..................................................................................... 33 5.2.4 Performance Monitoring. ............................................................................................... 345.3 Ex-situ Chemical Oxidation of Shallow Soil............................................................................... 35 5.3.1 Permanganate Dosage.................................................................................................. 35 5.3.2 Ex-situ Soil Screening ................................................................................................... 36 5.3.3 Ex-situ Soil Pilot Test .................................................................................................... 37 5.3.4 Ex-situ Pilot Test Results............................................................................................... 37 5.3.5 Backfill .......................................................................................................................... 385.4 Pilot Test Conclusions and Recommendations......................................................................... 38 5.4.1 In-situ Chemical Oxidation for Groundwater................................................................... 38 5.4.2. Ex-situ Chemical Oxidation for Unsaturated Soil ........................................................... 39
6.0 IDENTIFICATION AND EVALUATION OF REMEDIAL ALTERNATIVES ......................................... 40 6.1 Prior Source Area Remediation ................................................................................................ 40
6.2 Site Cleanup Levels ................................................................................................................. 406.3 Initial Screening ....................................................................................................................... 41 6.3.1 No Action....................................................................................................................... 42 6.3.2 Excavation..................................................................................................................... 42 6.3.3 Soil Vapor Extraction .................................................................................................... 43 6.3.4 In-Situ Gaseous Oxidation ............................................................................................. 44 6.3.5 In-Situ Thermal Remediation ......................................................................................... 44 6.3.6 In-Situ Chemical Oxidation, Groundwater....................................................................... 44 6.3.7 In-Situ Enhanced Reductive Dechlorination ................................................................... 456.4 Potential Alternatives ............................................................................................................... 45
6.4.1 Alternative 1A: Excavation/Oxidation of unsaturated soils andIn-situ Chemical Oxidation................................................................................ 47
6.4.2 Alternative 1B: Disposal of unsaturated soils and In-situ Chemical Oxidation ................ 53 6.4.3 Alternative 2: Excavation/Oxidation of unsaturated soils and
Enhanced Biodegradation ............................................................................... 55 6.4.4 Alternative 3: In-Situ Gaseous Oxidation of Vadose Zone Soils/In-Situ Chemical
Oxidation of Groundwater and Saturated Soils ................................................. 606.4.5 Alternative 4: In-Situ Thermal Treatment ....................................................................... 62
6.5 Comparative Analysis .............................................................................................................. 65
7.0 REFERENCES................................................................................................................................ 67
WA#157-DFSCRPT-0906-500iii
LIST OF FIGURES
Figure 2-1 Site LocationFigure 2-2 Site MapFigure 2-3 Valley PropertyFigure 3-1 Site Map Showing Locations of Borings and WellsFigure 4-1 Locations of Borings, Wells, and Geologic Cross-SectionsFigure 4-2 Cross-Section A-B TCE Concentrations in SoilFigure 4-3 Cross-Section A-C TCE Concentrations in SoilFigure 4-4 Cross-Section D-C TCE Concentrations in SoilFigure 4-5 Cross-Section A-B TCE Concentrations in GroundwaterFigure 4-6 Cross-Section A-C TCE Concentrations in GroundwaterFigure 4-7 Cross-Section D-C TCE Concentrations in GroundwaterFigure 4-8 Maximum TCE Concentration in Soil (Surface to Top of Clay)Figure 4-9 Maximum TCE Concentration in Soil (Top of Clay to Groundwater Table)Figure 4.10 Distribution of TCE in GroundwaterFigure 4.11 Groundwater Contour Map Lower Deep Overburden July 18-21, 2006Figure 4-12 Relationship Between Well Depth and Piezometric HeadFigure 5-1 Summary of Pilot Test Activities GroundwaterFigure 5-2 Summary of Pilot Test Activities Unsaturated SoilFigure 6-1 Area of Remediation for Unsaturated SoilFigure 6-2 Area of Remediation for Groundwater
LIST OF TABLES
Table 3-1 Field Sampling and Data Validation SummaryTable 3-2 Measurement Performance Criteria
Table 4-1 Photoionization Detector Survey Conducted July 23, 2004Table 4-2 USEPA Mobile Laboratory Field Analytical Results July and August 2004Table 4-3 USEPA Fixed Laboratory Analytical Results Soil Total Organic CarbonTable 4-4 On-Site Sentex Gas Chromatograph Groundwater Analytical Results, and TOC
in Groundwater Results October 2004Table 4-5 Sub-Slab Gas Survey Results May 2006Table 4-6 USEPA Mobile Laboratory Field Analytical Results May and June 2006Table 4-7 Confirmation Soil Sample and Residential Soil Sample Analytical Results - 2006Table 4-8 PCBs Analytical Results - 2006;Table 4-9 Soil Total Organic Carbon With Depth - 2006;Table 4-10 Summary of Analytical Results from UST RemovalTable 4-11 Pre-Injection Groundwater Results, 2006Table 4-12 Post-Injection Groundwater Results, 2006;Table 4-13 Groundwater Elevation Data;Table 4-14 Summary of Groundwater Slug Test Results.
Table 5-1 Groundwater Pilot Test Summary of Changes to GroundwaterTable 5-2 Ex-situ Soil Pilot Test Summary of Analytical DataTable 5-3 Ex-situ Soil Pilot Test Soil Source and Permanganate Dosage
Table 6-1 Contaminant Specific Proposed Cleanup GoalsTable 6-2 Alternative 1A Cost Estimate: Chemical Oxidation of unsaturated soils /
In-situ Chemical OxidationTable 6-3 Alternative 1B Cost Estimate: Excavation and Disposal /
In-situ Chemical Oxidation
WA#157-DFSCRPT-0906-500iv
Table 6-4 Alternative 2 Cost Estimate: Chemical Oxidation of unsaturated soils /Enhanced Biodegradation
Table 6-5 Alternative 3 Cost Estimate: In-situ Gaseous Chemical Oxidation /In-situ Chemical Oxidation
Table 6-6 Alternative 4 Cost Estimate: In-situ Thermal TreatmentTable 6-7 Summary of Costs for Remediation AlternativesTable 6-8 Abbreviated Comparative Analysis of Remedial Alternatives
VOLUME II
APPENDICES A THROUGH D
Appendix A. Field Sampling Notes and Photographs
Appendix B. Field Data Collection Sheets
Appendix C USEPA Mobile Laboratory Field Screening Analytical Results
Appendix D USEPA Fixed Laboratory Analytical Results
VOLUME III
APPENDICES E THROUGH K
Appendix E DAS and RAS Laboratory Analytical Results
Appendix F ARARs Tables
Appendix G Indoor Air Evaluation
Appendix H Proposed Soil Cleanup Level Calculations
Appendix I Soil Flushing Calculations No Further Action
Appendix J White Pine Assessment
Appendix K Pilot Testing Support Information
VOLUME IV
APPENDICES E THROUGH K
Appendix L Tank Closure Report (Charter Environmental, Inc)
Appendix M Ground Penetrating Radar Survey (Hager Geoscience, Inc.)
Appendix N Slug Test Curves
WA#157-DFSCRPT-0906-500v
LIST OF ACRONYMS AND ABBREVIATIONS
ACRONYM DEFINITION
1,2-DCE 1,2-Dichloroethene
1,1,1-TCA 1,1,1-Trichloroethane
ARAR Applicable or Relevant and Appropriate Requirement
bgs below ground surface
CERCLA Comprehensive Environmental Response, Compensation, and Liability Act,
cis-1,2-DCE cis-1,2-Dichloroethene
COC Contaminant of Concern
CY Cubic Yard
DAS Delivery of Analytical Services
DEQE Department of Environmental Quality Engineering
DNAPL Dense Non-Aqueous Phase Liquid
DQO Data quality objective
EPH Extractable Petroleum Hydrocarbons
ERH Electrical Resistance Heating
ERT Environmental Research Technology
ESCO Ex-situ chemical oxidation
EW Extraction Well
FEMA Federal Emergency Management Agency
FS Feasibility Study
g/kg grams per kilogram
gpm gallons per minute
GPR Ground Penetrating Radar
GRC Groveland Resources Corporation
GWTF Groundwater Treatment Facility
HGI Hager GeoScience, Inc.
ISCO In-situ Chemical Oxidation
ISTD In-situ Thermal Desorption
ITRC Interstate Technology and Regulatory Council
KMnO4 Potassium Permanganate
LDPE Low-density polyethylene
LNAPL Light Non-Aqueous Phase Liquid
M&E Metcalf & Eddy, Inc.
WA#157-DFSCRPT-0906-500vi
MassDEP Massachusetts Department of Environmental Protection
MCL Maximum Contaminant Level
MEK Methyl Ethyl Ketone
MOM Management of Migration
MPC Measurement Performance Criteria
mg/kg milligrams per kilogram
mg/L milligrams per liter
mL milliliters
NaMnO4 Sodium Permanganate
NAPL Non-Aqueous Phase Liquid
NCP National Contingency Plan, 40 CFR Part 300
O&M Operation and Maintenance
OEME Office of Environmental Measurement and Evaluation
ORP Oxidation-reduction potential
OU1 Operable Unit 1
OU2 Operable Unit 2
PCB Polychlorinated Biphenyl
PCE Tetrachloroethene or Perchloroethene
PDB Passive Diffusion Bags
PID Photoionization Detector
ppb parts per billion
ppbv parts per billion volume
PPE Personal Protective Equipment
ppm parts per million
PRP Potentially Responsible Party
psi pounds per squared inch
PSOD Permanganate Soil Oxidant Demand
PVC Polyvinyl Chloride
RAC Response Action Contract
RCRA Resource Conservation and Recovery Act
RFW Roy F. Weston, Inc.
RP Responsible Party
RPD Relative Percent Difference
RPM Remedial Project Manager
RI Remedial Investigation
WA#157-DFSCRPT-0906-500vii
RI/FS Remedial Investigation/Feasibility Study
ROD Record of Decision
SITE Superfund Innovative Technology Evaluation
SOW Scope of Work
SVE Soil Vapor Extraction
TCE Trichloroethene
TOC Total Organic Carbon
TSD Treatment, Storage and Disposal
USACE United States Army Corps of Engineers
USDOD United States Department of Defense
USEPA United States Environmental Protection Agency
UST Underground Storage Tank
UV Ultraviolet
VOC Volatile Organic Compound
VPH Volatile Petroleum Hydrocarbons
µg/L micrograms per liter
µg/kg micrograms per kilogram
WA#157-DFSCRPT-0906-5001
1.0 INTRODUCTION
Metcalf & Eddy, Inc. (M&E) has prepared this Draft Final Source Area Evaluation Report (Draft Final
Report) for the Source Area Re-Evaluation conducted at the Groveland Wells Nos. 1 and 2 Superfund
Site ( the Site ) located in Groveland, Essex County, Massachusetts. The Draft Final Report was
prepared under the United States Environmental Protection Agency (USEPA) Response Action Contract
(RAC) Work Assignment 157-RDRD-0132 in accordance with USEPA s Statement of Work [USEPA,
March 2004 and March 2006] and e-mailed scope clarifications dated April 29, 2004 and April 5, 2006.
The purpose of the Source Area Re-Evaluation was to evaluate the current distributions of soil and
groundwater contamination in the Source Area and to determine what actions may be considered to
further remediate that contamination. EPA s assumption of the source area remediation follows the
bankruptcy of, the responsible party (RP), Valley Manufactured Products ( Valley ), and the subsequent
discontinuation of the remedy that Valley had constructed and operated,, While the 1988 Record of
Decision for Source Control (Operable Unit 2 or OU2) required the RP to construct a series of source-
control measures [USEPA, 1998A], the RP bankruptcy left the source contamination cleanup incomplete,
leaving a significant amount of contamination that will ultimately impact the Management of Migration
remedy (Operable Unit 1 or OU1).
Field work in support of this effort was conducted in two phases, in 2004 and 2006. In 2004, soil and
groundwater data were collected and two new bedrock groundwater monitoring wells were installed.
Following receipt of this data, data gaps were identified, and follow-up sampling was conducted in 2006.
In addition, two pilot tests, in-situ chemical oxidation (ISCO) pilot testing for treatment of contaminated
groundwater and ex-situ chemical oxidation pilot testing of unsaturated soils, were conducted.
This Draft Final Report provides an evaluation of data collected during the Source Area Re-Evaluation
and provides potential remedial alternatives to address the Source Area contamination.
WA#157-DFSCRPT-0906-5002
2.0 SITE DESCRIPTION AND BACKGROUND INFORMATION
This section includes a description of Site history and uses, along with a brief summary of events that led
to regulatory action.
2.1 Site Location and Description
The Groveland Wells Nos. 1 and 2 Superfund Site is located in Groveland, Essex County, Massachusetts
within the Johnson Creek drainage basin. Johnson Creek is a tributary to the Merrimack River. The Site
contains nearly 850 acres, mostly located in the southwestern part of the Town of Groveland ( the Town )
[USEPA, 2004].
The Site is bounded to the west by Washington Street and the former Haverhill Municipal Landfill, to the
south by Salem Street, to the east by School Street, and to the north by the Merrimack River (Figure 2-1).
The Haverhill Municipal Landfill was originally part of the Groveland Wells Site, but it has since been
separately listed on the National Priorities List and is no longer part of the Site.
Land uses within the Site boundaries include numerous private residences, some industries and small
businesses, and religious and community institutions. The Archdiocese of Boston (Saint Patrick s
Church) abuts the Valley property to the south and east. The Groveland Department of Public Works is in
the central area of the Site, along with a sand and gravel operation. The former Valley Manufactured
Products Company is located to the south on the western border of the Site.
There are several small creeks and brooks flowing through the Site. Johnson Creek originates south of
the Site and flows in a northerly direction to Mill Pond, located approximately 450 feet east of the Valley
property. Argilla Brook, located to the east of Mill Pond, flows northwest through the Site and discharges
to Johnson Creek. Brindle Brook is a small tributary to Johnson Creek that flows northwestward through
the southeast corner of the Site area, eventually joining with Johnson Creek near Center Street. There
are limited wetland areas at the Site, located mostly next to Mill Pond, Argilla Brook, Johnson Creek,
Brindle Brook, and isolated areas east of Johnson Creek. A portion of the Site lies within the 100-year
floodplain delineated by the Federal Emergency Management Agency (FEMA).
One of the town s current municipal water supply wells, Station No. 1, and a former municipal supply well
(Station No. 2) are located within the Site boundaries. The Site encompasses the approximate limits of
the stratified drift aquifer that serves as the source of water for the current and former municipal supply

WA#157-DFSCRPT-0906-5003
wells. Groundwater generally flows to the north through the Site toward the Merrimack River. The Site
Map is shown in Figure 2-2.
2.2 Site History and Use
Valley Manufactured Products Company, a manufacturer of metal and plastic parts from 1963 until 2001,
was located in the southwestern corner of the Site. The original building, in which the Valley
Manufactured Products Company was housed, was constructed on the property around 1900 and, prior
to 1963, housed agricultural and textile operations [ERT, 1985]. In 1963, Groveland Resources
Corporation (GRC) leased the property and began on-site manufacturing of screw machine products.
Connected to the original building, reportedly on the southern end, was a 400 square-foot wooden shed
that was used to store virgin trichloroethene (TCE), Solvosol (an unspecified solvent), and cutting oils.
Waste cutting oils and solvents were also stored in the wooden shed. The exact location of the shed has
not been verified. GRC reportedly purchased the property in 1966. Valley Manufacturing acquired GRC s
on-site operations in August 1979; however, GRC retained property ownership [RFW, 1988].
On-site processes included machining, degreasing, and finishing of metal parts. The machining process
used cutting oils and lubricants. After machining, metal parts were cleaned (degreased) in a hydrocarbon
solvent vapor degreaser and then spun dry. TCE was used in the vapor degreasing operation from 1963
to 1979. Methylene chloride was used from 1979 to 1983. Solvosol and other solvents were also used.
In 1984, Valley discontinued the use of solvents and replaced them with detergent degreasers [RFW,
1988].
If parts required additional cleaning, they were then immersed in either an alkaline cleaning solution
(containing caustic soda) or an acid solution ( Brite Dip process, containing nitric acid). Once cleaned,
the parts were rinsed and excess rinse water was discharged to a Brite Dip subsurface disposal system
[RFW, 1988]. The Brite Dip subsurface disposal system was one of several such systems that were used
on the property. Approximate locations for these subsurface disposal systems are provided on Figure 2-
3. The systems are further described below:
1. The Brite Dip disposal system included a distribution box and leaching field located near
the southeastern corner of the building. This system accepted rinse waters from
degreasing operations and wastes from the Brite Dip process. A floor drain in the former
acid-dip room and another floor drain in a material storage area were also connected to
this system. The Brite Dip process was reportedly used until 1984 [RFW, 1988].
WA#157-DFSCRPT-0906-500 4
2. A drainage system for the loading dock (which slopes downward into the interior of the
building from street level off Washington Street) consisted of a floor drain within the
loading dock, and an oil/water separator and leaching field along the eastern portion of
the building. This system may have received storm water runoff, oil from lathes, and
TCE-contaminated oil. The following contaminants were detected in a sample collected
from the loading dock floor drain: 1,1,1-trichloroethane (1,1,1-TCA), 1,1-dichloroethane,
methylene chloride (570 parts per billion or ppb), and trans-1,2-dichloroethene (190 ppb).
Concentrations of vinyl chloride, 1,1-dichloroethene, 1,1-dichloroethane,
tetrachloroethene (PCE), methylene chloride (330 ppb), trans,-1,2-dichloroethene (4,800
ppb) and TCE (44,000 ppb) were detected in samples collected from the oil/water
separator manhole. The floor drain in the truck loading dock was later sealed and
replaced with a drainage trough, located outside the building just west of the entrance to
the loading dock area. When not plugged with debris (as it currently is), the drainage
trough system presumably intercepted storm water runoff before it entered the loading
dock and conveyed via a pipeline beneath the building to the oil/water separator and
leach field.
3. A domestic sanitary wastewater disposal system, consisting of a septic tank and leaching
field, is located under the parking lot area on the northeastern portion of the property.
Although the leaching field is likely in the vicinity of the septic tank, the exact location of
the leaching field is not known.
4. Historically, a combination storm water and cooling water collection system discharged to
a 12-inch reinforced concrete drain pipe extending from the Town of Groveland drainage
system in Washington Street, easterly across the northernmost portion of the Valley
Manufacturing parking lot. The drain line discharged to a drainage swale located on the
abutting Boston Archdiocese property, which extended easterly from the drain line to Mill
Pond. Storm water accumulating on the buildings roof were collected and discharged via
a 4-inch drain line to a drain manhole located beneath the assembly room. Cooling water
from an air compressor located in the basement of the facility and condensate water from
the plants air conditioning system were also discharged to the assembly room drain
manhole. Storm water and cooling waters discharged from the assembly room manhole
via a 12-inch drain pipe extending from the drain manhole to the 12-inch drain line
crossing the Site. Storm water collected by catch basins located along Washington
Street and by the existing roof drainage system eventually discharged to Mill Pond via the
drainage swale [RFW, 1988].
In 1972 and 1973, GRC reportedly installed six underground storage tanks (USTs) for storage of cutting
oils, solvents, and mineral spirits at the southern portion of the existing building. A concrete slab was
constructed over the USTs. The USTs ranged from 700 gallons to 3,000 gallons. Some of the USTs
WA#157-DFSCRPT-0906-500 5
contained cutting oil; the 700-gallon UST reportedly contained TCE. Cutting oils were pumped from the
USTs into distribution piping running throughout the machining areas of the facility. Recovered oils were
re-circulated through the system. Waste oils were reportedly disposed off-site. During October 1983,
pressure testing of the USTs was conducted. The USTs exhibited some initial pressure loss that was
attributed to leakage occurring at the couplings on the tank vent lines.
From 1972 to 1979, 55-gallon drums of waste cutting oils were stored on the concrete slab. In
September 1979, Valley constructed a shed roof over the concrete slab area [Lally, 1985]. This area is
known as the material storage area, but has also been referred to as the "porch area" or shed area.
According to the September 1987 Consent Order entered into by Valley Manufacturing and GRC, the
major contaminant released was TCE. In 1973, 500 gallons of TCE were reportedly released in the soil
underneath the concrete slab from a UST. No less than 3,000 gallons of waste oil and solvent has been
estimated to have been discharged to the environment from several surface and subsurface sources,
including the loading dock drainage system, the Brite-Dip disposal system, and the UST, and by routine
operations practices [RFW, 1988;, USEPA, 1988A]. These releases migrated to groundwater beneath
the Valley property and eventually contaminated the aquifer that supplied the town of Groveland s
drinking water. In June and October 1979, two Town drinking water supply wells, Groveland Well Station
Nos. 1 and 2 (Figure 2-1), were determined to be impacted with TCE. The wells were taken off-line and
the Town imposed water rationing. The Town subsequently developed another drinking water supply
well, Station No. 3 [USEPA, 2004].
Based on the sampling that led to the Consent Order, the solvent vapor degreasing and Brite-Dip
systems were eliminated. The rinse water tanks, cleaner holding tanks, and wastewater treatment
system were disassembled and removed. Incoming water supply lines to the system were cut and the
existing floor drain was plugged. The subsurface disposal system, consisting of the distribution box and
leaching field (the Brite Dip disposal system), was left in place [Lally, 1985].
In 1982, USEPA determined that the contamination in the two Town drinking water supply wells
constituted a threat to public health and to the environment. USEPA placed the Site on the National
Priorities List in December, 1982. In 1983, USEPA and the Massachusetts Department of Environmental
Protection (MassDEP, formerly known as the Department of Environmental Quality Engineering or DEQE)
conducted inspections and sampling of the subsurface disposal systems on the Valley property and found
elevated concentrations of TCE and some metals. DEQE and Valley entered into a consent agreement in
1983 that was intended to bring plant discharges into compliance with state and federal regulations, and
changes to the subsurface disposal systems were implemented by Valley as a result. DEQE and Valley
entered into a second consent agreement in March 1984 for the performance of a remedial
investigation/feasibility study (RI/FS) and remedial action. USEPA also issued an administrative order to
Valley in March 1984 to conduct a remedial investigation. Valley had an RI/FS prepared, but USEPA
determined that it was inadequate and did not provide sufficient information to serve as the basis for
WA#157-DFSCRPT-0906-500 6
selection of a Source Control or Management of Migration remedy. A supplemental RI was performed by
Valley s consultant in 1988, after substantial development and negotiation of a detailed work plan with
USEPA. USEPA contractors oversaw the supplemental RI and also prepared an endangerment
assessment [Alliance, 1987] and an endangerment assessment amendment [CDM, 1988]. A
supplemental feasibility study (FS) was also prepared by an USEPA contractor [RFW, 1988].
In July 1985, USEPA approved an initial remedial measure to rehabilitate Groveland Well Station No. 1
by using granular activated carbon treatment to remove VOCs from the groundwater. In 1987, USEPA
completed installation of the treatment system. Station No. 1 is used as a supplemental supply to Station
No. 3, while Station No. 2 was permanently shut down by the town.
In December 1986, the Valley Site was nominated for a demonstration of the Terra-Vac, Inc. Soil Vapor
Extraction (SVE) system under the USEPA Superfund Innovative Technology Evaluation (SITE) program.
The demonstration was conducted over 56 days in 1988 and removed an estimated 1300 pounds of
VOCs from the unsaturated soil at the Valley Site.
On September 30, 1988, USEPA issued a Record of Decision (ROD) for the Source Control Operable
Unit ( Source Control ROD ) at the Site. The Source Control Operable Unit is also known as Operable
Unit 2 (OU2) but is more commonly identified as the Source Control Operable Unit in Site documents.
The Source Control ROD required cleanup of the organic chemical contamination source located on the
former Valley Manufacturing property.
The major components of the selected remedy included:
1. Installation, operation, and maintenance of a SVE system to clean all areas of subsurfacesoil contamination;
2. Installation, operation, and maintenance of a groundwater recovery/re-circulation system;
3. Installation, operation, and maintenance of a groundwater treatment system to treatcontaminated groundwater from the recovery/re-circulation system;
4. Implementation of Institutional Controls.
The SVE system was operated by a contractor retained by Valley from approximately December 1992
through April 2002. Historical data for the SVE system indicate that only minimal TCE was being
removed; however, it is unclear whether the system was working effectively. Portions of the system (soil
vapor points, SVE wells) are currently present at the Site.
USEPA worked on an aquifer-wide Management of Migration (MOM) RI/FS in 1984 and 1985 and
completed supplemental MOM RI/FS work in 1990 and 1991. The MOM RI, completed in 1985, explored
the nature and extent of groundwater contamination, the potential sources of the contamination, and the
pathways by which the municipal wells were contaminated. The Supplemental MOM RI, completed in
1991, described the nature and extent of soil and groundwater contamination at Valley Manufacturing.
WA#157-DFSCRPT-0906-500 7
The results of these activities revealed that an extensive groundwater plume, containing principally TCE
and 1,2-dichloroethene (1,2-DCE), was migrating toward the Merrimack River with the highest
contaminant concentration found near the former Valley Manufacturing property and the adjacent
property owned by the Boston Archdiocese [USEPA, 2004].
A USEPA-funded groundwater treatment facility (GWTF) was constructed adjacent to the Valley facility
and began operation in April 2000. Semi-annual groundwater sampling has been conducted since April
1998 and results indicate that the TCE concentrations in areas North of Main Street, South of Main
Street, within the Groveland Highway Department (immediately North of Mill Pond), and South of Mill
Pond have been decreasing (Figure 2-2). However, TCE concentrations within the Source Area
monitoring wells remain high with some fluctuation, demonstrating no clear trend. The historical
maximum TCE concentration was detected in monitoring well TW-17 at 380,000 ppb in Fall 2003.
Recently, TCE was detected in this well at 100,000 ppb in Spring 2005, and 12,000 ppb in Spring 2006.
TW-17 is located adjacent to the former Valley Manufacturing facility.
WA#157-DFSCRPT-0906-500 8
3.0 TECHNICAL APPROACH TO THE WORK ASSIGNMENT
The following subsections describe the approach to the work assignment, including problem definition
and project overview, a description of the sampling program, and a description of the analytical program.
Discussion of analytical results is provided in Sections 4.0 and 5.0; identification of potential remedial
alternatives is presented in Section 6.0.
3.1 Problem Definition and Project Overview
The project objective for the Source Area Re-Evaluation was to determine the current distribution of
volatile organic compound (VOC) contamination in Source Area groundwater and soil and to determine
what actions may be considered to further remediate the contamination. The Source Area evaluation was
conducted in two phases. In 2004, accessibility restrictions and the remaining USTs prevented full
delineation of the horizontal and vertical nature and extent of contamination beneath the porch area and
the main Valley building. In 2006, the demolition of the porch structure allowed a more extensive
investigation of the horizontal and vertical extent of contamination. Brief lists of field activities conducted
in 2004 and 2006 are provided below. Fieldwork conducted at the Site is further detailed in Subsection
3.2, Sampling Program. Subsection 3.3 discusses analytical requirements for each type of sampling
conducted.
Field activities conducted in 2004 included:
· Inventory and screening of remaining SVE wells and vapor points (using a PID) to passivelydetermine relative VOC levels in the remaining system components;
· Performance of subsurface investigations to determine concentrations of chlorinated VOCs in soilin the Source Area;
· Installation of two new bedrock wells to further characterize Source Area groundwatercontamination, and repair of bedrock monitoring well TW-12;
· Sampling of groundwater for VOCs (using passive diffusion bag samplers or PDBs) in selectedSource Area monitoring wells and collection of total organic carbon (TOC) groundwater samplesto characterize concentrations in the Source Area.
Field activities conducted in 2006 included:
· Ground Penetrating Radar (GPR) survey to locate the USTs and delineate underground utilities;
· Sub-slab soil gas sampling within the former Valley Manufacturing Building;
· Demolition of the porch structure and installation of fencing;
· Collection of soil and groundwater VOC samples for field screening by the USEPA Office ofEnvironmental Measurement and Evaluation (OEME) mobile laboratory with confirmationsamples sent to the OEME fixed laboratory or a Routine Analytical Services (RAS) laboratory;
· Installation of 11 new overburden monitoring wells to further characterize Source Areagroundwater contamination;
WA#157-DFSCRPT-0906-500 9
· Collection of soil TOC samples for analysis by the OEME fixed laboratory;
· Collection of residential soil VOC samples to assess potential impacts to an abutting property;
· Completion of slug testing in eight groundwater monitoring wells installed during June 2006;
· Completion of an ISCO pilot test, including a pre-injection groundwater VOC round and a post-injection groundwater VOC round to assess effectiveness of the injection;
· Removal of six (6) USTs, the former Brite Dip acid leachfield, and excavation of soils forconducting an ex-situ chemical oxidation test;
· Completion of an ex-situ chemical oxidation test on excavated soils;
· Collection of light non-aqueous phase liquid (LNAPL) samples for product identification;
· Completion of an assessment of on-site and neighboring pine trees;
· Completion of in-situ mixing and chemical oxidation on soils on abutting residential property.
Using data collected during these field efforts, M&E prepared an updated conceptual model (see Section
4.0) and identified and evaluated potential remedial alternatives (see Section 6.0).
3.2 Sampling Program
The 2004 and 2006 sampling programs addressed the field efforts requested in the USEPA SOWs
[USEPA, March 2004; USEPA, March 2006] and the e-mail scope clarifications dated April 29, 2004 and
April 5, 2006. Source Area Re-Evaluation investigative activities were conducted in accordance with
USEPA approved Sampling and Analysis plans [M&E, 2004 and 2006]. Table 3-1 provides a summary of
samples collected, and highlights any data quality issues for each sampling event performed as part of
the Source Area Evaluation. Field notes are provided in Appendix A. Boring logs and chains of custody
are provided in Appendix B. VOC analytical results for OEME mobile laboratory are provided in Appendix
C. VOC analytical results for OEME fixed laboratory are provided in Appendix D. Analytical results for
RAS and DAS laboratory samples are provided in Appendix E.
Borings were drilled at 26 locations as part of the original RI performed by Lally, including a number of
locations in the Source Area [Lally, 1985]. The Lally borings were numbered 1 through 26, and the hole
number was preceded with a prefix of TW- if a monitoring well was constructed or a prefix B- where no
well or a dry well was installed. The Lally numbering convention was continued for the 2004 and 2006
M&E investigations. Since TW-26 was the highest numbered location used in the original Lally RI, the
borings and associated monitoring wells that were drilled as part of M&E Source Area investigation were
designated with location numbers starting with 27.
3.2.1 Soil Vapor Point Survey (Existing Soil Vapor Extraction Points), 2004. In 2004, M&E
surveyed existing SVE wells and vapor points using a hand-held PID to determine if measurable
VOCs (> 1 parts per million or ppm as isobutylene) could be detected in these existing SVE wells
WA#157-DFSCRPT-0906-500 10
and vapor points (Figure 3-1). SVE wells and vapor points were sealed on June 2, 2004, and the
sealed SVE wells and vapor points were allowed to equilibrate for three weeks. The PID screening
was conducted on June 23, 2004. Table 4-1 provides a summary of the SVE wells and vapor points
that were screened and the recorded PID value for each.
Elevated PID readings were recorded at locations EW-6C (84.3 ppm), EW-6D (58.3 ppm), and TW-9
(2.3 ppm). SVE wells EW-6C and EW-6D were part of an SVE triplet located in the eastern end of
the porch area (see Figure 3-1). Monitoring well TW-9 is also located within the porch area.
Due to the nature of the PID survey, it was not possible to collect field duplicate samples. No formal
validation of the PID survey data was performed. All of the data collected during the PID survey are
useable for project objectives as outlined in the 2004 M&E SAP.
3.2.2 Soil and Groundwater Sampling (Conventional Geoprobe, Standard Drill Rig), 2004. The
goal of the 2004 program was to define the extent of VOC contamination above and below a clay
layer at the Site. The clay layer is typically three to five, but up to eight, feet thick and is found
between approximately 8 to 20 feet below ground surface (bgs) in the Source Area. High levels of
contamination have historically been present in a perched zone of water above the clay as well as in
the saturated zone below the clay.
Since a conventional rig was unable to access the porch area due to ceiling height restrictions,
subsurface exploration in that area and inside the building was conducted using a Geoprobe
provided by USEPA. Fourteen shallow Geoprobe holes, designated SB-1 through SB-14, were
drilled with that equipment. Due to the dense nature of the soil, the Geoprobe was unable to
penetrate below 16.5 ft bgs,. ,
A standard drill rig was used to access three outdoor locations. Three borings were completed
without installation of monitoring wells (B-27, B-28, and B-29). Borings B-27, B-28, and B-29 were
initially labeled TW-27 through 29, but were subsequently renamed to adhere to site-wide
nomenclature.
M&E collected a variety of samples for VOC analysis by the OEME mobile laboratory in 2004,
including: water samples collected from the oil/water separator manhole; surface and subsurface soil
samples collected from the Geoprobe holes and the standard borings; and groundwater samples
collected from existing monitoring wells and, where possible, from the Geoprobe holes and borings.
Soil samples were analyzed for TCE, 1,1,1-TCA, and PCE. Aqueous samples were analyzed for
TCE, 1,1,1-TCA, PCE, and cis-1,2,-DCE.
It was noted during the investigation that the water table was dropping quickly in the Source Area. In
order to acquire data before the water table fell too low to conduct the proposed passive diffusion

WA#157-DFSCRPT-0906-500 11
bag sampling at a later date, M&E personnel collected groundwater samples from existing
monitoring wells, SVE wells, and other monitoring points with bailers. In some cases, samples were
collected both before and after purging three well volumes with the bailers (pre-purge and post-
purge), The 2004 OEME mobile laboratory results are presented in Table 4-2. No formal validation
of the OEME mobile laboratory results was performed. The data are considered useable for project
objectives as outlined in the 2004 M&E SAP.
Samples sent to the OEME fixed laboratory in Chelmsford, MA included an oily product sample
collected from monitoring well MW-5D (identified as having chromatograms closely matching 30W
motor oil) and soil TOC samples to support selection of potential remedial alternatives. TOC results
for soil samples were all non-detect at varying detection limits (Table 4-3); however, the reporting
limit was elevated and TOC is likely present at concentrations below the reporting limit. OEME fixed
laboratory data were not subjected to formal data validation. The data are considered useable for
project objectives as outlined in the 2004 M&E SAP.
3.2.3 Bedrock Well Installation, 2004. Two bedrock monitoring wells, TW-30 and TW-31, were
installed to the east of the Valley building and to the south of the existing Groveland Wells OU1
GWTF. The bedrock wells were installed using a conventional drilling rig. As proposed in the SAP,
existing bedrock monitoring well TW-12 was also repaired.
3.2.4 Groundwater Sampling (Passive Diffusion Bags), 2004. Six Source Area wells (MW-5D,
TW-15, TW-17, TW-23, TW-30, and TW-31) were selected for groundwater TOC sampling and PDB
deployment for VOC sampling, based on historical VOC concentrations detected in the wells. Each
well was sampled for TOC prior to PDB deployment. TOC samples were sent to Southwest
Research Institute for analysis by M&E Delivery of Analytical Services (DAS) Specification D-033.1.
The TOC results were not subjected to formal data validation. The data are considered useable for
project objectives as outlined in the 2004 M&E SAP.
A total of 20 PDBs were deployed in the six wells. The PDBs consist of heat-sealed, low-density
polyethylene (LDPE) lay-flat tubing, filled with approximately 220 milliliters (mL) of analyte-free
water. PDBs were deployed in series across the well screen. For a 10-foot well-screen, four PDBs
were installed in series and the samples were named using the well location and the depth in
relation to the screen (denoted A through D, with A being at the top of the screen and D being at the
bottom of the screen). For example, the PDB located at the bottom of the screen in well TW-17
would be named TW-17D. PDBs were deployed on October 7, 2004 and were retrieved and
sampled for VOCs on October 25, 2004, after an approximate three-week equilibration period. The
VOC samples were then released to Weston Solutions personnel for on-site analysis using the
Sentex gas chromatograph unit at the Groveland GWTF. Analysis was performed for trans 1,2-
dichloroethene, cis-1,2-DCE, 1,1,1-TCA, TCE, and PCE using the on-site Sentex unit. The PDB
WA#157-DFSCRPT-0906-500 12
VOC results were not subjected to formal data validation. The data are considered useable for
project objectives as outlined in the 2004 M&E SAP.
3.2.5 Limited UST Investigation, 2004. During the 2004 field effort, M&E personnel located what
appeared to be fill-ports for the former USTs in the porch area. The fill-ports were covered with
patches of concrete. At the request of the USEPA Remedial Project Manager (RPM), M&E
personnel broke through the concrete patches to inspect the fill-ports. Four of the five fill-ports
observed were filled with sand. M&E personnel removed the cap on the fifth fill-port and observed
that the fill pipe was not filled. Based on historical information, a total of six USTs were located in
the porch area. M&E personnel were unable to locate a sixth UST fill-port during the 2004
investigation. Additional investigation of the USTs was conducted in 2006, as described in Section
3.2.11.
3.2.6 Ground Penetrating Radar Survey, 2006. A GPR survey was performed by Hager
Geoscience, Inc (HGI) on April 19, 2006. The purpose of the GPR survey was to locate the six
USTs and identify other subsurface structures and obstructions to facilitate subsequent work. The
survey included the former Valley Manufacturing Building, the former porch area, and areas outside
of the main Valley building to the east and south.
Results of the GPR survey indicated six potential USTs beneath the western portion of former porch,
an additional anomaly at the southeast corner of the former porch, the Brite-Dip Acid Leachfield and
associated piping, the leachfield located along the eastern wall of the main building (Storm Drain),
potential utility pipes, and unidentified flat horizons (possibly soil boundaries). Further details,
including a map of possible subsurface obstructions, are provided in the Ground Penetrating Survey
report included in Appendix J [HGI, 2006].
3.2.7 Demolition of the Porch Structure, 2006. M&E personnel oversaw the demolition and
removal of the porch structure May 8 through May 16, 2006. At the time of the demolition, the
concrete floor structure was left in place to facilitate subsequent work. The demolition effort included
installation of additional fencing and a gate. The main manufacturing building was left in place and
secured to prohibit entry to the building.
3.2.8 Sub-slab Soil Gas Sampling, 2006. On May 23, 2006, M&E conducted a sub-slab soil gas
survey within the former Valley Manufacturing Facility to assess potential vapor intrusion. M&E
installed eight (8) vapor points throughout the building using a hammer drill to break through the
concrete. Samples were collected into 100% certified clean 6-liter SUMMA canisters fitted with a 1-
hour flow controller, through a stainless steel sample rod and dedicated Teflon tubing. The stainless
steel sample rod was decontaminated between sample locations. Clay was used to seal the sample
rod at the surface of the concrete. A total of 10 samples (eight samples, one field duplicate, and one
equipment/trip blank) were collected and analyzed for VOCs using DAS Specification D-152.
WA#157-DFSCRPT-0906-500 13
Samples AR-01, AR-02, AR-07, and AR-08 were located in the main manufacturing area. Sample
AR-03 was located in the former gear room. Sample AR-04 was located in the former machine
shop. Sample AR-05 was located in a lower level basement. Sample AR-06 was located within the
hallway, near the former offices and inspection room. These locations were selected to provide
spatial coverage within the building and are shown on Figure 3-1. The sample locations were also
selected to avoid potential utilities and potential asbestos floor tiles.
Analytical results for the sub-slab soil gas survey are provided in Appendix E. The soil gas
analytical results were subjected to Tier II validation in order to assess potential risk associated with
indoor air vapor intrusion. Using this data, an indoor air risk assessment was performed which
indicated that potential on-property risks and hazards are within or below EPA risk management
guidelines (cancer risk between 10-4 and 10-6 and noncarcinogenic hazard of one), based on
assumed residential property use, and that the future on-property indoor air pathway is unlikely to
present a risk of harm to humans. As on-property VOC levels in soil and groundwater are greater
than those in off-property locations, the off-property indoor air pathway is also unlikely to present a
risk of harm to off-property receptors. Additional details and calculations associated with the indoor
air evaluation are provided within Appendix G.
3.2.9 Soil and Groundwater Sampling (Standard and Indoor Drill Rigs), 2006. Additional soil
and groundwater VOC sampling was conducted in 2006. The purpose of the additional sampling
was to fill data gaps identified following the 2004 field effort, particularly in the porch area (facilitated
by removal of the porch structure), inside the Valley building, and at depths beneath 16 feet (limit of
the Geoprobe). The additional sampling also provided real-time analytical results to direct
monitoring well and injection well installation for the ISCO pilot study.
Sixteen borings, including nine in which monitoring wells were installed, were drilled outside of the
Valley building: TW-32I, TW-32D, TW-33, B-34, TW-35D, B-36, TW-37, B-38, B-39, TW-40, B-41,
TW-42, TW-43, TW-44D, B-52, and B-53. Seven borings, including two in which monitoring wells
were installed, were drilled inside the Valley building: B-45, B-46, TW-47, TW-48, B-49, B-50 and B-
51. Since contamination was detected at a depth of 4.4 feet in boring B-34, bordering residential
property, an additional location (B-34-F9) in the Source Area was sampled with a hand auger to a
depth of 4.5 feet to evaluate contamination along the north side of the wood fence along the
residential property at 106 Center Street, nine feet south of the location of boring B-34. Soil boring
locations are presented on Figure 3-1.
A standard drill rig was used for work outside the former Valley manufacturing building, and a low-
clearance drill rig was used for work within the former Valley manufacturing building. Both drill rigs
advanced 2-foot split-spoons and samples were collected from each spoon based on PID readings
and the discretion of M&E field team personnel. As in 2004, groundwater samples were collected
WA#157-DFSCRPT-0906-500 14
from select existing monitoring wells using bailers. Soil and aqueous samples were analyzed by the
OEME mobile laboratory for TCE, 1,1,1-TCA, PCE, and cis-1,2-DCE (Table 4-6). The 2006 OEME
mobile laboratory results were not subjected to formal validation. The data are considered useable
for project objectives as outlined in the 2006 M&E SAP.
Confirmation soil VOC samples were sent to the OEME fixed laboratory or a RAS laboratory at a
rate of approximately 10%. Confirmation soil VOC sample data were validated to Tier I.
In addition to VOC sampling, M&E collected 19 soil samples for TOC analysis by the OEME fixed
laboratory to support revision of soil cleanup levels and remedial alternative selection. TOC data
were subjected to Tier II validation and analytical results are useable for project objectives as
qualified. Tier II validation was conducted on these samples, since the TOC values are used in
calculating proposed soil cleanup levels. A soil sample for PCB analysis was collected in the vicinity
of SVE well EW-5D to confirm a historical PCB detection. The VOC and TOC data are considered
useable for project objectives as outlined in the 2004 M&E SAP.
3.2.10 Residential Soil Sampling, 2006. At the request of the USEPA RPM, M&E personnel
advanced a total of nine hand-augered soil borings on the 106 Center Street property, during two
separate events, to assess potential soil impacts to the property. The property at 106 Center Street
abuts the southern boundary of the Valley property. These samples were collected in response to
elevated TCE concentrations measured at a depth of 4.4 feet in boring B-34, approximately 10 feet
from the fence separating the two properties, and subsequently at a location on the 106 Center
Street property (HA-2). The borings were advanced to approximately 4 feet (or refusal) and samples
were collected at multiple intervals for each boring. Each sample location begins with the
designation HA , indicating a hand-augered sample. The nine locations are shown on Figure 3-1.
Samples were analyzed by the OEME mobile laboratory or a RAS laboratory (Datachem
Laboratories, Inc. of Salt Lake City, Utah). All samples sent to a RAS laboratory were subjected to
Tier I validation. The data are considered useable for project objectives as outlined in the 2006 M&E
SAP.
3.2.11 Tank Removal Activities, 2006. In an effort to remove potential contamination sources, the
six USTs and components of the Brite-Dip Leachfield were excavated, decontaminated, and
removed from the Site. Charter Environmental, Inc. (Charter), under subcontract to M&E, performed
all removal and excavation activities described in this subsection. M&E personnel provided
oversight and direction.
During removal activities, all six USTs were observed to be filled with damp, dense sand (similar to a
flowable fill type material). The contents of the USTs were removed and initially segregated for
screening with a PID. No elevated PID readings were noted of the contents of any tank. The
external walls of all six tanks appeared intact prior to removal from the ground.
WA#157-DFSCRPT-0906-500 15
Each UST feed line was observed to be covered with a pipe sleeve composed of transite. The
sleeves were removed and segregated on polyethylene sheeting within the former Valley building for
off-site disposal. Approximately 15 ounces of dark liquid was collected from the feed line likely
associated with UST No. 5. Approximately eight ounces of an oily liquid were bailed and collected
from the feed line to UST No. 2.
A single tank grave, approximately nine to ten feet deep, was excavated for the UST removal.
Approximately 10 cubic yards of excavated soil were segregated into roll off containers for use in the
ex-situ chemical oxidation test. Soil samples were collected by Charter at the direction of M&E from
the sidewalls and base of the UST grave prior to re-filling the excavation with excavated soil, tank
contents (flowable fill) and crushed portions of the concrete slab. Laboratory analysis of VOCs,
metals, extractable petroleum hydrocarbons (EPH), and volatile petroleum hydrocarbons (VPH) was
performed by a laboratory subcontracted by Charter. The top four feet of the backfill were
compacted in one-foot thick lifts.
The distribution box and pipes associated with the former Brite Dip leachfield were also excavated
and removed. The pipes were 4-inch diameter PVC with one-half inch holes for drainage. The soil
surrounding these pipes appeared to be fill material. No elevated PID readings were recorded
during the removal. All the pipes removed were decontaminated using a soap and water solution
prior to off-site removal. The fill excavated during the pipe removal was placed back in the
excavation and compacted.
Based on the GPR survey, an anomaly was located in the southwest corner of the former porch
area. The concrete slab in that location was cut, and a test pit was excavated to confirm the nature
of the anomaly. No UST or other utility structure was found at this location. A layer of dark brown,
loamy soil was observed at approximately six to eight feet below the slab, just below a layer of fill
material that included bricks (possible source of the GPR anomaly). The loamy soil had an odor and
PID readings were noted as high as 80 ppm when scanning over the soil. The soil removed to
create the test pit was backfilled and compacted.
3.2.12 Slug Tests, 2006. M&E completed slug testing on eight groundwater monitoring wells that
were installed during June 2006: TW-32D, TW-32I, TW-35D, TW-37, TW-42, TW-43, TW-44D, and
TW-48. The tests were analyzed using the Bouwer Rice method. The results of the slug test are
summarized in Table 4-14 and further discussed in Section 4.2.
3.2.13 In-situ Chemical Oxidation Test, 2006. Sodium permanganate was injected into two
injection wells on July 24, 2006. Injection of the sodium permanganate was performed by Redox
Tech, LLC (Redox), under subcontract to M&E. M&E provided technical direction and oversight. To
determine the effectiveness of the injection, groundwater samples were collected from selected
WA#157-DFSCRPT-0906-500 16
monitoring wells both before the injection, and approximately three weeks and eight weeks after the
injection (August 17 and September 20, 2006). Laboratory analysis of VOCs was performed by RAS
laboratories: pre-treatment samples by A4 Scientific of The Woodlands, TX and both post-treatment
by Mitkem Corporation of Warwick, RI). The ISCO pilot test is further discussed in Section 5.0. The
injection locations and the monitoring wells sampled to evaluate the pilot test are shown on Figure 5-
1.
During the post-injection groundwater sampling event on August 17, 2006, a LNAPL product was
observed on the water table in monitoring well TW-37. Product samples were collected and sent to
OEME fixed laboratory for identification.
3.2.14 Ex-situ Chemical Oxidation Test, 2006. M&E performed an ex-situ chemical oxidation
(ESCO) test on 55 cubic yards of soil excavated from the Source Area during the UST and leachfield
removal efforts. The excavated soil was segregated into eight piles in four roll-off boxes and dosed
with four different concentrations of potassium permanganate. Charter, under subcontract to M&E,
transported selected soil to roll-off boxes and applied chemical oxidant. M&E provided technical
oversight and direction. Pre-treatment soil samples were collected for VOCs analysis, soil oxidant
demand, and geotechnical parameters, and post-treatment soil samples were collected for VOC
analysis. Laboratory analysis was performed by laboratories subcontracted by Charter. The ESCO
pilot test is further discussed in Section 5.0.
3.2.15 White Pine Tree Assessment, 2006. At the request of the USEPA RPM, M&E conducted a
brief assessment of several white pine trees located along the fence between the Source Area and
the property located at 106 Center Street to determine possible causes of pine needle browning on
the trees. Based on the assessment, the pine trees are likely impacted by insect damage,
specifically the white pine weevil. The complete assessment is provided as Appendix J.
3.2.16 In-situ Soil Mixing and Chemical Oxidation. At the request of the USEPA RPM, additional
treatment was performed by chemical oxidation using potassium permanganate on approximately
100 cubic yards of shallow soil located on a portion of the abutting residential property that is north
of the wood fence that separates the properties. Soils were dosed and mixed in place by Charter,
under subcontract to M&E. M&E oversaw the treatment activities. The test involved collection of
pre-treatment and post-treatment soil samples for VOC analysis. Results of the residential in-situ
pilot test will be reported on separately in a technical memo after the sampling data has been
evaluated.
3.3 Analytical Program
The DQO for the various field activities performed was to provide data of sufficient quality and quantity to
better define the location and extent of the Source Area contamination. Data were collected, analyzed,
WA#157-DFSCRPT-0906-500 17
and evaluated in accordance with the 2004 and 2006 M&E SAPs. The following section describes the
types of data collected and associated data quality objectives. Table 3-1 summarizes sample delivery
group information, laboratory information, and data validation criteria for the project.
3.3.1 Project Data Quality Objectives (DQOs). As stated, the data quality objective (DQO) for the
various field activities was to provide data of sufficient quality and quantity to better define the
location and extent of the Source Area TCE and 1,2-DCE contamination. The field effort also
attempted to identify the location and extent of any non-aqueous phase liquid (NAPL) that may be
present.
To meet the project DQOs, M&E largely used field analytical data (soil and groundwater VOC
analysis by the OEME mobile laboratory with 10% fixed laboratory confirmation sampling). Where
more stringent data quality was required M&E utilized the RAC DAS program (groundwater TOC
analysis in 2004, soil gas analysis in 2006), the USEPA RAS program (pre-injection and post-
injection groundwater VOC analysis in 2006, some Source Area soil and residential soil VOC
analysis in 2006), or the OEME fixed laboratory in Chelmsford, MA (confirmation of OEME VOC
results in 2006, soil TOC in 2006). In addition, product samples were sent to the OEME fixed
laboratory for identification in 2004 and 2006. Table 3-1 provides a summary of information for
samples collected during the 2004 and 2006 field events.
3.3.2 Data Validation and Data Usability. Data validation using Region I Functional Guidelines was
not performed on field analytical data (PID survey or OEME mobile laboratory data). However,
these data were subject to review by M&E during the field effort and during M&E report generation.
Where more stringent data quality was required, such as data required for risk assessment or field
analytical confirmation, data were validated to Tier I or Tier II Region I Functional Guidelines as
outlined in the 2004 or 2006 M&E SAPs. Validation levels for the various data are summarized in
Table 3-1.
3.3.3 Measurement Performance Criteria. Performance criteria were defined for the various types
of analyses conducted to support project DQOs. Table 3-2 presents Measurement Performance
Criteria (MPC) for precision (field, laboratory), accuracy/bias (field, laboratory), representativeness,
comparability, sensitivity, and completeness for each general class of analyses conducted.
3.3.4 Documentation, Records, and Data Management. All sampling data were recorded on
appropriate data collection sheets or in the field logbook for the Site. Transfer of sample custody
between the field team and the laboratory (OEME mobile laboratory, OEME Fixed Laboratory,
Sentex unit operator, DAS laboratory, RAS laboratory) was documented using standard COC forms.
WA#157-DFSCRPT-0906-500 18
4.0 CONCEPTUAL MODEL OF SOURCE AREA CONTAMINATION
A conceptual model of contaminant distribution and migration in the Source Area is needed to properly
evaluate remedial alternatives. To develop a conceptual model, the initial RI and follow-up studies from
the mid- to late 1980s were first reviewed. Although 25 years have passed since the original RI was
done, the geologic information and the original contaminant distribution data are still useful for
understanding current subsurface conditions.
Figure 4-1 shows the locations of borings and Geoprobe holes that have been drilled in the Source Area
during the previous and current investigations. Other wells that are shown on Figure 4-1 include several
now-inactive SVE wells (EW-1 through EW-7), installed in previous Source Area remedial actions; three
monitoring wells (MW-3, MW-5D, and MW-5S ), installed after the original TW series (TW-1 through
TW-26); and three groundwater extraction wells (EW-S1 through EW-S3), installed in 1999 as part of the
current groundwater remedial action. The locations of geologic cross-sections that are referred to in the
discussions of subsurface conditions are also shown on Figure 4-1.
4.1 Original Conceptual Model (1985)
Drilling and soil sampling during the original RI at the Valley Site [Lally, 1985] identified a clay layer
beneath much of the Source Area, with the top of the clay lying at a depth of 8 to 16 feet. Between the
ground surface and the clay, the soils were found to consist of an upper layer of fill (mostly sand); an
intermediate layer of loamy sand (buried topsoil), at a depth of about 4 to 8 feet; and a lower layer of sand
(silty just above the clay in some areas).
The clay was reported to be 2 to 10 feet thick in the original remedial investigations. Between the bottom
of the clay and the bedrock surface, dense layers of sand, sand and gravel, silty sand, and glacial till were
encountered.
The conceptual model of subsurface contaminant movement at the time of the original RI, when only the
first 17 wells and borings had been drilled, was that TCE and other solvents had migrated to the east on
top of the clay, as well as down through the clay, and into the underlying dense soils. That model was
probably based largely on the observation that, at that time, the highest levels of groundwater
contamination were detected in TW-9 (located in the former porch area and screened under the clay) and
TW-8A (located east of the former porch area, beyond the eastern edge of the clay layer, and screened in
the lower overburden).
4.2 Evaluation of Results of Current Investigations
Extensive environmental data was collected to complete the Source Area evaluation, as described in
Section 3.0. The results are summarized in Tables 4-1 through 4-14:
WA#157-DFSCRPT-0906-500 19
· Table 4-1 Photoionization Detector Survey, 2004;
· Table 4-2 USEPA Mobile Laboratory Field Analytical Results, 2004;
· Table 4-3 Soil Sample TOC Analytical Results, 2004;
· Table 4-4 On-Site Sentex Gas Chromatograph Groundwater Analytical Results, 2004;
· Table 4-5 Sub-Slab Gas Survey Results, 2006;
· Table 4-6 USEPA Mobile Laboratory Field Analytical Results, 2006;
· Table 4-7 Confirmation Soil Sample and Residential Soil Sampling Results, 2006;
· Table 4-8 PCBs in Soil Results, 2006;
· Table 4-9 Soil Sample TOC Analytical Results, 2006;
· Table 4-10 UST Grave Sampling Results, 2006;
· Table 4-11 Pre-Injection Groundwater Monitoring Results, 2006
· Table 4-12 Post-Injection Groundwater Monitoring Results, 2006;
· Table 4-13 Groundwater Elevation Data; and
· Table 4-14 Groundwater Slug Test Results.
For the purposes of discussion within this report, the numerous individual strata encountered beneath the
Source Area have been grouped into five layers: shallow overburden (fill, former soil horizon, and sand);
clay; deep permeable overburden (dense fine to coarse sand and gravel); deep low permeability
overburden (fine silty sand and till); and bedrock (see geologic cross-sections in Figures 4-2 through 4-4).
Soil and groundwater contamination in each of these layers are discussed in the following subsections.
4.2.1 Shallow Overburden - Soil Contamination. The term shallow overburden refers to the soils
between the ground surface and the top of the clay layer or, where the clay is absent, an elevation of 63
feet (the average elevation at which the top of the clay layer was found).
Shallow overburden soil samples with TCE concentrations >1,000 ppb were found in the former porch
area or within 10 feet south of the remaining slab (SB-1, -2, -8, -10, and -11; B-34, -38, -45, -46, and -52;
TW-35D and -44D). TCE concentrations >10,000 ppb were measured at TW-44D, B-34, SB-2, SB-8, and
SB-10. As shown on Figure 4-2 and 4-3, at most boring locations where TCE was detected in the soil
samples, the highest concentration was found several feet above the clay layer, often in the brown loamy
sand that is believed to be a buried topsoil horizon (generally 4 to 8 feet deep). The highest TCE
concentrations in the shallow overburden were found at SB-10 at a depth of 7.7 feet (52,000 ppb) and at
TW-44D at a depth 3.6 feet (35,800 ppb). This sample from SB-10 was collected in a zone of disturbed
soils that included what appeared to be topsoil mixed with sand. SB-10 was drilled within about 5 feet of
a former SVE well (EW-6S) that was screened from a depth of 9 to 19 feet, indicating that high
concentrations of TCE have persisted despite years of SVE operation.
Elevated TCE concentrations were noted in shallow soil samples collected beneath the main Valley
building, especially near the southeastern corner (B-45, B-46, and TW-48). Concentrations decrease
WA#157-DFSCRPT-0906-500 20
moving north and west from this corner. In addition, while installing a gate along the eastern fence, a soil
sample was collected after a portion of PVC pipe was unearthed. The TCE concentration was 900 ppb in
soil removed (Pile 1) to construct the gate footing. The subsurface distribution of TCE in shallow
overburden soil, from the surface to the top of the clay layer, is shown on Figure 4-8.
In response to the elevated TCE concentration (>10,000 ppb) measured at boring B-34 at a depth of 4.4
feet, approximately 10 feet from the wood fence separating the Valley property from the residence at 106
Center Street, hand auger samples were collected along the fence on both sides. On the north side of
the fence, TCE was detected at 11 ppb (B-34-F9); however, immediately south of the fence, TCE was
detected at a concentration of 2230 ppb at 2.0 feet (HA-2). In other hand auger samples located on the
residential property at 106 Center Street, TCE was not detected or detected at low concentrations (<70
ppb).
TCE concentrations were generally low (<10 to 60 ppb) in the shallow overburden in borings advanced
outside the suspected areas of TCE releases to the east, southeast, and south of the former porch area;
and inside the building moving northward from the former porch area: SB-04, SB-05, SB-07, B-39, B-50,
B-51, B-53, TW-40, TW-32D, and TW-47. TCE concentrations were also low at all hand auger samples
except HA-2.
In 1994 and 2000, during the drilling of the pilot borings for the three extraction wells in the Source Area,
organic vapors and possible NAPL (EW-S2 only) were detected in soil samples from immediately above
the clay layer, at a depth of about 8 feet. Later, during construction of the well vaults and piping in this
area, contaminated soils were encountered and had to be removed from the excavations. TCE was not
detected in this area in SB-13 during this investigation.
On average, TOC content in soils in the shallow overburden is approximately one percent, which is a
fairly low organic fraction for shallow soils. Higher TOC readings (15,000 to 19,000 milligrams per
kilogram or mg/kg) were measured in samples collected in the dark brown sandy soil that is a likely a
buried soil horizon. TOC concentrations decreased significantly below the buried soil horizon to the top of
the clay layer.
During the June 2006 investigations, several other observations were noted while drilling beneath the
former porch area. A strong, sweet odor was detected while drilling at TW-35D and TW-44D at depths of
14 to 18 feet. In addition, a foamy substance was noted in the driller s mud tub while advancing through
this interval at both locations. A sample of the foamy water from the mud tub (MW-35D-MT) had a TCE
concentration of 41 ppb, which was likely diluted by drilling water. An oily sheen was noted on the soil
sample within the split spoon collected for the 14 to 16 foot interval at TW-44D, and analysis by the
OEME Mobile Lab GC noted several unidentified peaks in the sample collected at 15.9 feet. Several
cyclo-alkanes were detected as tentatively identified compounds in soil samples from TW-35D and TW-
44D that were analyzed at the fixed lab. In addition, a piece of crushed, black PVC pipe was extracted
WA#157-DFSCRPT-0906-500 21
from the cuttings from a depth of approximately 16 feet in TW-44D. While drilling at TW-42 and TW-43,
the drillers upgraded to Level C personal protective equipment (PPE) due to PID readings of 0.5 to 1.5
ppm in the breathing zone and greater than 75 ppm over the mud tub water.
During the installation of one of the original SVE wells (EW-5D), a soil sample from a depth of 3 to 5 feet
was analyzed for PCBs and found to contain Arochlor 1248 at a concentration of 17,400 micrograms per
kilogram (mg/kg) [Lally, 1989]. A soil sample was collected in June 2006 in the vicinity of EW-5D to try to
confirm the historical PCB detection, but PCBs were not detected.
4.2.2 Shallow Overburden Groundwater Contamination. It was known from previous investigations
that perched groundwater is present above the clay layer, at least seasonally. Where groundwater was
noted in the soil samples from several of the shallow Geoprobe holes, attempts were made to collect
aqueous samples with bailers before the holes collapsed. Water samples were collected from SB-02,
SB-03, and SB-06. The TCE concentrations in these grab samples were 111 Fg/L, 82 Fg/L, and 26 Fg/L,
respectively.
Water is consistently noted in one of the former SVE wells, EW-6S, which is screened in the shallow
overburden and possibly into the top of the clay layer. Groundwater samples collected from EW-6S in
2004 and 2006 had TCE concentrations of 82 and 95 Fg/L, respectively. While these TCE concentrations
in the perched water are high relative to the drinking water standard, they are not indicative of the
presence of NAPL above the clay in the former porch area. The TCE concentrations in the soil samples
from the depths where these water samples were collected ranged from 5 to 217 ppb in SB-02; 27 to 142
ppb in SB-03; and 21 to 66 ppb in SB-06. An additional sample of perched groundwater that was
collected from well MW-5S inside the main Valley building had a very low TCE concentration (0.7 Fg/L).
4.2.3 Shallow Overburden Sub-slab Air Contamination. Elevated concentrations of TCE were
observed in all eight sub-slab air samples collected below the floor of the main Valley building shown on
Figure 3-1 (Table 4-5). The highest concentrations were noted in the northern portion of the Screw
Machine Area (AR-02, 1,100 ppbv (parts per billion volume) and AR-07, 470 ppbv) and in the former Cam
and Gear Room (AR-03, 850 ppbv). Subsequently, a soil boring, B-49, was advanced between these two
air sample locations. The TCE concentration was 298 mg/kg at soil boring B-49 at a depth of 6.7 feet
below grade. The lowest sub-slab air TCE concentration was noted in AR-05, collected from the
basement storage room.
4.2.4 Clay Soil Contamination. A layer of gray clay was encountered at each boring advanced to
bedrock, with the exception of TW-40. The thickness of clay layer is generally three to five feet thick but
was noted to be greater than eight feet at B-50. The clay layer was generally thinner to the south of the
former porch area.
WA#157-DFSCRPT-0906-500 22
TCE was detected within the clay layer at nearly every boring in the Source Area. In several locations
where TCE was found in the clay, the chemical was not detected above or below the clay (B-34, B-46, B-
49, B-50, and TW-48). TCE concentrations greater than 1,000 ppb were measured in the clay in borings
on the eastern portion of the concrete slab of the former porch area (11,900 ppb at TW-35D; 8,130 ppb at
TW-44D; and 1,500 ppb at B-45) and to the east of the main building north of the Storm Drain Leachfield
(2,770 ppb at TW-32D). TCE concentrations in the clay increased with depth at borings where more than
one sample was collected within this layer. Concentrations of TCE in the clay decrease moving north
through the building and southward in the former porch area. TCE was not detected in the clay layer at
the northern end of the building (TW-47), along the western edge of the property (B-51 and B-36), or to
the south of the former porch and the immediately adjacent area (TW-33, B-38, B-39). In most of the
probes advanced in 2004, at least one soil sample was collected for analysis from the upper clay, where
TCE concentrations were generally in the range of <5 to 32 ppb. Higher concentrations of TCE were
found only at SB-10 (270 ppb) and TW-29 (340 ppb). The subsurface distribution of TCE in the clay layer
and in unsaturated overburden below the clay layer is shown on Figure 4-9.
Profiles based on geologic data collected in 2006 (Figure 4-4) suggest that the top of the clay slopes
down to the north from the Source Area at the southeast corner of the building towards B-50. Across the
concrete slab under the former porch area, the top of the clay tends to slope downward from Washington
Street to the east towards TW-44D, then upward towards TW-17. Since the surface of the clay in the
former porch area seems to be at a slightly lower elevation in the area of TW-44D, SB-10, EW-6S, EW-
6C, and EW-6D (see Figures 4-1 and 4-2), it is possible that TCE may have pooled temporarily above the
clay in this area if large spill(s) occurred.
4.2.5 Clay Groundwater Contamination . One former SVE well (EW-6C) in which water was present
was reportedly screened in the lower part of the clay layer. Water samples collected from this well in
2004 and 2006 had TCE concentrations of 15,100 and 7,100 Fg/L, respectively. These relatively high
concentrations suggest the presence of DNAPL in the vicinity of this well.
4.2.6 Deep Permeable Overburden Soil Contamination. In general, the highest concentrations of
TCE in the deep permeable overburden were detected just below the clay layer, particularly beneath the
former porch area and to the east of the building. Concentrations exceeded 10,000 ppb at B-45 and TW-
44D in sand encountered beneath the clay. The subsurface distribution of TCE in the clay layer and in
unsaturated overburden below the clay layer is shown on Figure 4-9. In general, where TCE was
detected in the deep permeable sand and gravel, concentrations decreased with depth. Farther below
the clay and into the groundwater, concentrations of TCE were generally fairly low, ranging from not
detected to approximately 115 ppb (Figures 4-2 through 4-4). Exceptions to the general trend were found
at TW-35D and B-38, where concentrations of TCE in the hundreds of ppb were observed farther down in
this layer. TCE was not detected in the deep sand and gravel layer to the south and west of the former
porch area or inside the building, with the exceptions of B-45 and B-46 which are inside the building along
the wall separating the main building from the former porch area.

WA#157-DFSCRPT-0906-500 23
A strong, petroleum odor was noted at TW-37 in a split spoon sample collected just below the clay from
23 to 25 feet. A sheen and a high PID reading (160 ppm) were also noted from a two-inch blackish silver
lens of fine sand within this interval.
4.2.7 Deep Low Permeability Overburden Soil Contamination. A layer of fine to very fine sand and
silt and/or till was observed at most locations between the deep permeable overburden and bedrock.
With the exception of the southeast corner of the building and former porch area, TCE was not detected
at significantly high concentrations in this low permeability layer. In borings TW-44D (15,800 ppb), TW-
35D (694 ppb), and B-45 (2,660 ppb) high concentrations of TCE were detected in this layer just above
bedrock, and these TCE concentrations were significantly greater than those detected in the more
permeable sand and gravel above (Figures 4-2 and 4-4).
4.2.8 Deep Overburden Groundwater Contamination. Within the deep overburden below the clay,
contaminant levels in groundwater have been shown to exhibit significant variability in vertical and
horizontal direction. The discussion of contaminant distribution in groundwater in this layer is presented
by area and depth. Figure 4-10 presents the distribution of TCE in groundwater, in both the upper and
lower parts of the deep overburden.
Former Porch Area. Numerous monitoring wells and former SVE wells on the eastern side of the former
porch area are screened at varying depths within the dense sand and gravel, fine silty sand, and till strata
that comprise the deep overburden. No wells are located beneath the western portion of the former porch
area due to the former USTs (removed August 2006).
Several wells are screened in the dense sand and gravel just below the clay. These wells and the
corresponding TCE concentrations from summer 2006 sampling are EW-5D (170 Fg/L), TW-23 (1,000
Fg/L), TW-37 (52 Fg/L), TW-18 (4,200 Fg/L); and EW-6D (1,000 Fg/L), as shown on Figure 4-5. Three of
these wells were also sampled in 2004; the TCE concentrations were 1,400 Fg/L (TW-23), 4,420 Fg/L
(TW-18), and 1,680 Fg/L (EW-6D). It should be noted that TCE concentrations were nearly three times
higher in pre-purge than in post-purge samples collected at two of the wells (TW-23 and EW-6D) sampled
in 2004. When TW-23 was sampled with passive diffusion bag samplers, the TCE concentrations
throughout the water column were in the range of 4,000 to 6,000 Fg/L.
The screen depth at well TW-9, 25 to 35 feet, covers almost the entire interval between the bottom of the
clay layer into top of the dense silt (Figure 4-5). TW-9 is adjacent to well TW-18, which is screened from
24 to 27 feet. The concentration of TCE in groundwater at TW-9 was 870 Fg/L in 2004 and 2,300 Fg/L in
2006, lower than the concentration in the shallower TW-18 (4,200 Fg/L). These results suggest that at
this location, TCE concentrations decrease with depth in the dense sand and gravel layer. This
observation may explain the decrease in TCE concentrations when wells in the dense sand and gravel
are purged. Under static conditions, the wells may fill with shallower, more contaminated water that is
WA#157-DFSCRPT-0906-500 24
moving down under the hydraulic gradient. When the wells are purged, this water is replaced by less
contaminated water flowing in from deeper soils. Slug tests were conducted in TW-37 to estimate the
hydraulic conductivity of the dense sand and gravel. The tests were analyzed using the Bouwer Rice
method. The resulting hydraulic conductivity value of about 3 ft/day is much lower than would be
expected for the sand and gravel layer in which this well is screened. A value of about 125 ft/day resulted
from using a very brief early portion of the curve from the test, but that analysis is not considered valid
because it represents only about a 10 percent recovery of the water level to its static position. The
presence of the clay layer immediately above the screened interval may have interfered with the test and
caused a data set that cannot be analyzed.
A layer of LNAPL was noted and bailed from TW-37 after post-injection sampling in August 2006.
Analysis of this LNAPL indicated that it was a mineral oil. A sheen and high PID readings were noted in a
soil sample collected at TW-37 from 23 to 25 feet, within the screen interval, at the time of installation.
The highest concentrations of TCE in groundwater beneath the former porch area are found in the deep
layer of dense silty sand and glacial till in the eastern portion. The concentrations of TCE in wells TW-42
and TW-43, both of which are screened just above the bedrock in the layer of silt and fine sand, were
39,000 Fg/L and 34,000 Fg/L, respectively (Figure 4-5). These high concentrations suggest the presence
of DNAPL nearby. The screen intervals of the two wells adjacent to TW-42 and TW-43, TW-44D and TW-
35D, include the lower part of the dense sand and gravel layer as well as the dense silt and fine sand
layer just above the bedrock surface. The TCE concentrations at TW-44D, three feet west of TW-43, and
at TW-35D, three feet southwest of TW-42, were 130 Fg/L and 46 Fg/L. The disparity of TCE
concentrations in these adjacent wells indicates that the groundwater is considerably less contaminated
in the sand and gravel than in the underlying dense layer of silt, fine sand, and glacial till. It also suggests
that if DNAPL is present, it may have sunk to the top of bedrock into the low permeability layer.
Slug tests were conducted in wells TW-42 and TW-43 to estimate the hydraulic conductivity of the deep
layer of dense silty sand just above bedrock, in which contaminant levels were high. The results of the
tests in these two wells were hydraulic conductivities of about 3 to 5 ft/day. Slug tests were also
conducted in TW-44D and TW-35D. These wells are screened in both the deep layer of dense silty sand
just above bedrock and the overlying dense sand and gravel. The resulting values in these two wells
were about 13 to 33 ft/day. These higher hydraulic conductivities reflect the presence of the sand and
gravel in the screened interval, a more permeable material than the silty sand below it.
Well TW-16, in the western portion of the former porch area just east of the USTs, is screened in both the
dense silty sand and till. TCE concentrations in TW-16 were less than 10 Fg/L in 2004 and 2006,
suggesting that this well is upgradient of most contamination in the deep overburden (Figure 4-5). A
groundwater sample from the deep overburden (till) was also collected at boring B-27, drilled near the
southwest corner of the former porch area in 2004. That sample had a TCE concentration of 4.1 Fg/L,
confirming that the plume in the deep overburden does not extend to the southwest.
WA#157-DFSCRPT-0906-500 25
East of the Former Porch Area. The highest levels of TCE contamination in groundwater have been
observed in well TW-17 located ten feet to the east of the former porch area, where a plume emerges
from beneath the former porch area and building and flows east-northeast toward the extraction wells
(Figure 4-5). TW-17 is screened deep in the overburden in layers of till and dense silt and sand. The
passive diffusion bag sampling of TW-17 indicated that, within the saturated screened interval of 8 feet,
the groundwater in the lower 4 feet had TCE concentrations in the range of 100,000 to 160,000 Fg/L.
Above that, the TCE concentration was in the range of 4,000 to 6,000 Fg/L (Figure 4-5).
Well TW-3 is located about 30 feet southwest of EW-S2, the southernmost extraction well in the Source
Area (Figure 4-1) and is sampled regularly as part of the plume remediation. Low concentrations of
contaminants in this well (20 Fg/L) suggested that the southernmost edge of the plume is just south of
TW-3. However, a groundwater sample collected in 2006 had a TCE concentration of 966 Fg/L. Based
on these concentrations, the southern most edge of the plume may or may not be captured by the Source
Area extraction wells.
Of the three Source Area extraction wells, the highest concentrations are generally measured in EW-S2,
which is the southernmost extraction well. The TCE concentration has been as high as 33,000 Fg/L in
the recent past but was 10,000 Fg/L in April 2006 and 1,900 Fg/L in July 2006. The TCE concentration in
EW-S1, northwest of EW-S2, has been in the range of 2,000 to 7,000 Fg/L recently and was 3,400 Fg/L in
July 2006.
The northern edge of the plume in this area is not well defined (Figure 4-10). Groundwater samples
collected in 2004 from the deep overburden in a boring (B-29) about 50 feet north of TW-17 had TCE
concentrations of 1,010 Fg/L at a depth of 25 feet, just below the clay, and 350 Fg/L at a depth of 38 feet,
just above bedrock. In June 2006 a pair of wells (TW-32I and TW-32D) was installed just south of boring
B-29, near the storm drain leachfield. The concentration of TCE in TW-32I, which is screened from within
the bottom of the clay layer into the deep sand and gravel and silt lens found below the clay, was 3,200
Fg/L. A lower concentration of TCE was noted in TW-32D, which is screened in deep sand and gravel
and likely some dense silt above the bedrock surface (330 Fg/L). The TCE concentration in TW-26A,
which is between and slightly upgradient of EW-S1 and EW-S3, was 301 Fg/L in June 2006, which is
similar to that sampled at TW-32D. Of the three Source Area extraction wells, the concentration of TCE is
lowest in EW-S3 (<100 Fg/L). These results indicate that the plume extends north of wells TW-32D and
TW-26A.
South of the Former Porch Area. Groundwater samples were collected from seven wells located to the
south of the former porch area. Wells TW-1 and TW-19, which are south of the western half of the former
porch area, are screened at the bottom of the dense sand and gravel layer. The TCE concentrations in
these wells were 21 Fg/L or less in samples collected in 2004 and 2006. Three wells in the upper portion
WA#157-DFSCRPT-0906-500 26
of the dense and gravel (EW-2D, EW-4D, and MW-3) had concentrations of TCE between 58 and 68 Fg/L
in samples collected in 2004 and 2006.
The screens in wells TW-33 and TW-40 are 15 feet long and extend from the top of bedrock, up through
the lower permeability silt and/or till, and into the dense sand and gravel. TCE was not detected in TW-40
at the southwest corner of the property, and the concentration of TCE in TW-33 was 2.3 Fg/L. In addition,
groundwater samples collected from the till layer at boring B-28 at depths 37 and 42 feet had low TCE
concentrations of 0.7 and 2.1 Fg/L, respectively.
The bedrock surface was observed to slope downward to the south along Cross-Section D-C (Figure 4-
7). A concern existed that DNAPL might have migrated along that surface southward. The groundwater
results from the wells along the southern side of the Source Area, and the absence of TCE below the
groundwater table in soil samples collected from TW-33, TW-40, B-39, and B-28, confirms that neither
DNAPL nor the contaminant plume has migrated southward.
Main Valley Building. Groundwater samples were collected from five wells located within the main
Valley Manufacturing Building. Well TW-47, the northernmost well in the building in the former machine
room, is screened in layers of dense silt and till just above the bedrock surface. Wells TW-15, TW-48,
and MW-5D are all located, in the former screw machine area. TW-48 is also screened in layers of dense
sand and silt above the bedrock surface. Wells TW-15 and MW-5D are screened in dense sand and
gravel, with screen depths slightly shallower than TW-47 and TW-48. The concentrations of TCE in these
wells were all less than 20 Fg/L. Concentrations increased slightly moving south through the building
towards the former porch area. A number of petroleum hydrocarbons and other unidentified compounds
were detected in groundwater collected from well TW-48. The relatively low concentration of TCE in
TW-48, which is west of the storm drain leachfield on the east side of the building, suggests that the
contamination at the TW-32 wells does not originate beneath the building.
Slug tests were conducted in TW-48 to estimate the hydraulic conductivity of the lower overburden at that
location. The resulting value of 0.3 ft/day suggests that the till and the overlying dense sand in that area
have a lower hydraulic conductivity than the dense silty sands at TW-42 and TW-43.
West of the Former Porch Area. Three wells are located to the west of the former porch area: TW-20,
TW-21, and TW-22. The bottoms of these wells are all 19 to 24.5 feet below grade, and all three have
historically been dry.
4.2.9 Bedrock Groundwater Contamination. Three wells to the east of the Valley Manufacturing
property are screened in the bedrock: TW-26, TW-30, and TW-31. TCE concentrations in these wells
were in the range of <1 to 33 Fg/L during the recent sampling events. To prevent the potential for DNAPL
migration from the overburden into the bedrock, no bedrock monitoring wells have been installed in the
former porch area, where the deep overburden is highly contaminated.
WA#157-DFSCRPT-0906-500 27
4.2.10 Groundwater Movement in the Source Area. Water levels were measured in the summer and
fall of 2004 and in the summer of 2006 during this investigation. Water level data are shown in Table 4-
13. The water level data suggest that steep downward vertical gradients exist in the Source Area.
The uppermost occurrence of groundwater in the former porch area is above the clay. In two former SVE
wells (EW-5S and EW-6S) that are screened in the shallow overburden and possibly into the top of the
clay layer, groundwater elevations between 63.7 and 64.5 feet were measured in 2004 and 2006. The
groundwater that was collected above the clay in 2004 in the three Geoprobe holes (SB-02, SB-03, and
SB-05) that had recoverable groundwater occurred at a similar elevation.
One of the former SVE wells, EW-6C, was reportedly screened in the clay layer. The groundwater
elevations in this well, 58.5 to 59.7 feet, were lower than the groundwater elevations in wells (EW-6S and
EW-5S) screened above the clay. The lower water level observed within the clay seems reasonable,
since a downward hydraulic gradient through the clay is expected.
The screened intervals for former SVE wells EW-2D and EW-4D are not known, but the measured depths
indicate that these wells penetrate just a short distance below the clay. The bottoms of the wells are at
elevations between approximately 53.5 and 55 feet, and the groundwater elevations were between 54.0
and 55.7 feet. These water levels suggest that groundwater exists at a relatively high elevation in the
dense deposits beneath the clay.
Groundwater elevations in another series of wells that are just slightly deeper than EW-2D and EW-4D
were strikingly similar to one another. In TW-18, TW-23, MW-3, and EW-6D, groundwater elevations in
November 2004 were between 53.32 and 53.35 feet. In June 2004, when water levels were about one
foot higher, the water elevations in these wells differed by only 0.06 feet. In July 2006, after additional
wells had been screened at this depth, the groundwater elevations in TW-18, TW-23, TW-37, MW-3, EW-
5D, EW-6D, and EW-7D, were between 55.1 and 55.23 feet. The similarity of the water levels in these
wells suggests that no lateral flow is occurring in the upper part of the deep overburden, and that
downward flow is predominant.
TW-9 is adjacent to TW-18. The top of the screened interval of TW-9 is within one foot of that in TW-18,
but its screen extends 8 feet farther down into the deep overburden where hydraulic heads are lower.
The similarity of the water levels in TW-9 and TW-18 suggests that the soils in the upper part of the TW-9
screened interval are more permeable than those in the lower part.
The elevation of the bottom of well TW-19 is about 47 feet. The water elevations in this well in 2004 and
2006 were in the range of 48.07 to 50.99 feet, lower than the shallower wells but higher than the deeper
wells.
WA#157-DFSCRPT-0906-500 28
Most of the remaining overburden monitoring wells have bottom elevations of 32 to 42 feet. The
groundwater elevations in those wells, which were in the range of 40 to 48 feet, are lower than those in
the shallower wells and represent a zone in which horizontal flow is predominant. These groundwater
elevations have been plotted and contoured on Figure 4-12 and show that the direction of groundwater
flow at the base of the overburden deposits is to the east-northeast. The relationship between well depth
and piezometric head (lower heads at lower elevations in the subsurface) is shown on Figure 4-13.
Water levels in wells in the building were generally higher than those to the south in the former porch
area. The highest water levels measured during the investigations, 67.1 to 67.3 feet, occurred in well
MW-5S. The water levels in the adjacent well MW-5D, 62.2 to 63.8 feet, were also relatively high.
Both TW-47 and TW-48 have screens 10 feet long that are set just above bedrock. TW-47 is screened in
till and dense fine silty sand, while TW-48 is screened in those two layers plus the bottom of the dense
sand and gravel layer. The water levels in TW-48, which were between 49.55 and 51.54 feet, are
considerably higher than those in TW-35D and TW-44D despite being screened at a similar depth and in
similar materials. The higher bedrock elevation beneath the building may be related to the relatively high
water levels in TW-48 and TW-47.
Well TW-15, in the building, has ten feet of screen, the bottom of which is at an elevation of about 46 feet.
The log from this boring indicates that bedrock was encountered at an elevation of about 43 feet. In late
June 2004, the groundwater elevation in this well was 50.8 feet. One month later, in late July 2004, the
well was dry, indicating that the water level had fallen by about 5 feet. In 2006, the water level in this well
fell 9 feet in 40 days. A review of the data from previous studies indicated that an even more precipitous
water level decline occurred in June 1997, when the water level in this well fell almost 8 feet in one week.
The reason for these unusually rapid water level declines is unknown, although it is suspected to be
related to perched water and well construction.
4.3 Current Conceptual Model
The conceptual model of the Source Area at the Valley Manufacturing property has been updated based
on observations of the Source Area re-evaluation, analytical results, and historical information. The TCE
contamination observed and its spatial occurrence in soil and groundwater provide evidence of several
sources. Historical information of Valley Manufacturing lists releases of TCE from USTs, leaks from
drums stored in the former porch area, releases to leachfield(s), and surface releases of chemicals for
weed control.
In the shallow overburden beneath and near the former porch area, the highest TCE concentrations in
soil samples are often found in a layer of dark brown, loamy sand believed to be a buried soil horizon at a
depth of 4 to 8 feet. Extensive surface discharges likely occurred in the eastern portion in the former
porch area, where TCE concentrations in soil were >30, 000 ppb (TW-44D and SB-10) and elevated TCE
WA#157-DFSCRPT-0906-500 29
concentrations were also observed vertically downward through the unsaturated sand to the clay layer. It
is stated in the ROD for OU2 that TCE was used a defoliant to the south and east of the Site. TCE may
have adsorbed to high organic content in this loamy layer after discrete releases, resulting in
contamination to the south and east of the former porch area where TCE concentrations are only
elevated in the top four to six feet (SB-1, SB-6, B-33, B-34, and HA-2).
The shallow overburden has a thin zone of perched groundwater just above the clay. The perched water
is generally found in the eastern part of the former porch area and to the east. TCE concentrations in this
perched water ranged from 0.7 to 111 Fg/L and were highest in the eastern portion of the former porch
area, where soil concentrations were highest as well.
The clay layer beneath the Site is generally three to five feet thick and tends to thin moving north to south.
TCE concentrations were detected within the clay layer at nearly every boring in the Source Area. In
several locations where TCE was found in the clay, the chemical was not detected above or below the
clay. This observation is likely a result of the SVE system, which extracted soil vapor from unsaturated
overburden above and below the clay but had little success in extraction from the clay layer itself. The
highest soil concentrations in the clay layer were noted at TW-35D (11,900 ppb), TW-44D (8,130 ppb),
and B-45 (1,500 ppb) which are located in the eastern portion of the former porch area below and slightly
downgradient of the highest concentrations in shallow soil. Groundwater samples from a former SVE well
(EW-6C) reportedly screened within the clay layer had TCE concentrations of 7,100 and 15,100 Fg/L.
This relatively high concentration suggests the possible presence of DNAPL in the vicinity of this well;
however, the generally low TCE concentrations in the clay and overburden above the clay suggest that
DNAPL is not widespread on the clay surface.
Beneath the former porch area and to the east of the building, high concentrations of TCE in soil (>1,000
ppb) were found just below the clay layer in unsaturated, dense sand and gravel (B-38, B-45, TW-35D,
TW-44D, TW-32D). These samples were collected below highly contaminated shallow soil and clay
samples, and are likely in the vicinity where TCE traveled through the clay or are near pockets of DNAPL.
Groundwater samples collected in wells screened in the dense sand and gravel just below the clay in the
central and eastern former porch area were also elevated (1,000 to 6,000 Fg/L). TCE concentrations in
soil and groundwater tend to decrease with depth in the saturated overburden, particularly below the
water table in the saturated dense sand and gravel.
Above bedrock, the saturated overburden is composed of a layer of silty fine sand and/or glacial till. The
highest TCE concentrations in groundwater, between 34,000 and 160,000 Fg/L, were observed in this
layer in the eastern portion of the former porch area (TW-42 and TW-43) and immediately east of the
former porch area (TW-17). Significantly lower TCE concentrations were noted in groundwater samples
collected from wells adjacent to TW-42 and TW-43 that are screened in both the dense sand and gravel
and the silt and fine sand layers.

WA#157-DFSCRPT-0906-500 30
Pure-phase TCE is denser than water and, if enough were spilled, it would have sunk by gravity to the top
of the bedrock surface or lower. Groundwater flow in the silty sand layer just above bedrock is restricted
by the low hydraulic conductivity (3 to 5 ft/day) and is subject to less dilution and transport compared to
the overlying layers. The higher TCE concentrations in the silty sand layer just above the bedrock are
believed to be the result of these factors.
TCE concentrations in three bedrock wells located downgradient (east) of the former porch area have
been fairly low, less than 33 Fg/L. TW-31 is located east of the three extraction wells, and these
concentrations are significantly less than measured in the extraction well influent. No bedrock wells exist
below the Source Area. However, with such high concentrations of TCE measured in the deep
overburden groundwater, the low concentrations of TCE in the bedrock monitoring wells suggest that any
highly contaminated groundwater that may exist in the bedrock fractures below the former porch area is
being captured by the extraction wells, which are screened in both the deep overburden and the upper
bedrock.
WA#157-DFSCRPT-0906-500 31
5.0 REMEDIAL PILOT TESTING
Pilot testing was performed during 2006 to evaluate the feasibility of remediating contaminated soil and
groundwater using chemical oxidation. ISCO using sodium permanganate was tested for contaminated
groundwater. Unsaturated soil from the Source Area was excavated, placed in four roll-off containers,
and dosed with potassium permanganate powder. The test procedures and results are described in the
subsections below.
5.1 Permanganate Soil Oxidant Demand. Permanganate was selected as the oxidant for the in-situ
and ex-situ pilot tests, as it is more persistent and more selective for organic compounds containing
double bonds (i.e., chlorinated ethenes) than other oxidants used for remediation. In addition to oxidizing
volatile organic compounds in soil and groundwater, permanganate will also oxidize natural organic
matter and reduced inorganic material in the subsurface. Permanganate Soil Oxidant Demand (PSOD) is
a preliminary screening tool that provides estimates of the amount of permanganate that may be required
and information to assist in determining the economic viability of chemical oxidation for a given site. The
PSOD is the mass of permanganate consumed per kilogram of dry soil (g/kg) in 48 hours.
Three soil samples, collected during the soil investigation in June 2006, were analyzed for PSOD by
Carus Chemical Company (Carus), the manufacturer of the permanganate used for both the ISCO and
ex-situ chemical oxidation pilot tests. Two samples were collected from within the saturated zone (TW-
44D-32-34 feet and B-50-35-38 feet), and the third sample was collected above the water table just below
the buried soil horizon (B-36 8-10 feet). The samples were dosed with three permanganate
concentrations: low (2.8 g/kg), medium (13.8 g/kg), and high (27.5 g/kg). In general, PSOD values less
than 35 g/kg are favorable for ISCO [Carus, 2006]. The average PSOD of the two samples from the
saturated zone for the low, medium, and high doses were determined to be 0.25 g/kg, 0.55 g/kg, and 0.70
g/kg, respectively. The PSOD for the shallow sample from B-36 8-10 feet (0.9 g/kg, 3.0 g/kg, 4.1 g/kg)
were at least five times greater than the samples collected from the saturated zone for all three doses.
Reaction rate and oxidant consumption can increase with permanganate dose [Carus, 2006]. The PSOD
report from Carus is included in Appendix K.
5.2 In-situ Chemical Oxidation for Groundwater. The ISCO injection was performed by Redox Tech,
LLC (Redox), under subcontract to M&E. Sodium permanganate was injected into two wells within the
Source Area. Sodium permanganate has a higher solubility in water (40%) than potassium
permanganate (4%) and was selected as the chemical oxidant to minimize the volume of water required
for injection.
5.2.1 Placement and Selection of Injection Wells. The objectives of the ISCO pilot test were to
reduce concentrations of TCE by an order of magnitude and to evaluate the radius of influence of
the permanganate. Due to the low permeability of the Source Area soils, a five-foot radius was
targeted. The ultimate remedial goal for TCE will be the Maximum Contaminant Level (MCL)
concentration of 5 mg/L. Injection locations were chosen to target historically high TCE

WA#157-DFSCRPT-0906-500 32
concentrations such that both new and existing monitoring wells could also be monitored for the
presence of permanganate. Two wells, TW-37 and TW-43, were constructed as injection wells
during the June 2006 soil investigation of the Source Area.
Well TW-43 has a screen interval of four feet, from 39.5 to 43.5 feet below ground surface. This well
is screened entirely within the layer of silt and fine sand where high TCE concentrations were noted
in soil in borings TW-35D and TW-44D and that is likely less permeable than the coarser sands
immediately above. A series of monitoring wells were installed around TW-43. Well TW-42 is
located five feet east (hydraulically downgradient) from TW-43 and is also screened in the layer of
silt and fine sand (39.5 to 42.5 feet below grade). Monitoring wells TW-44D and TW-35D are
located three feet upgradient and eight feet downgradient, respectively, of TW-43 and are both
screened from 34 to 44 feet below grade (in both the silt/fine sand and in the coarser sands and
gravel above).
Well TW-37 has a five foot screen from 23 to 28 feet below grade. That screen interval is within a
layer of permeable sand and gravel. The location and screen interval of well TW-37 is
approximately six feet west (hydraulically upgradient) from two existing monitoring wells with similar
screen intervals where elevated groundwater concentrations have been measured historically : TW-
18 (screened 24 to 27 feet below grade) and TW-9 (screened 25 to 35 feet below grade).
The injection locations and the monitoring wells sampled to evaluate the pilot test are shown on
Figure 5-1.
5.2.2 Sodium Permanganate Injection. Approximately 140 gallons of 10%, by weight, sodium
permanganate solution were injected into each of the two injection wells on July 24, 2006. Redox
performed the injection with M&E providing oversight for injection activities. Redox selected the
dosage, 1.8 g/kg, from the average PSOD of the high dose, which is more than twice the highest
PSOD value from samples collected below the groundwater table.
At well TW-37, the solution was injected under pressure using a double diaphragm pump at
approximately 30 to 35 pounds per square inch (psi), and injection was completed in approximately
30 minutes. At well TW-43, a coupling was not properly sealed at the time of construction which
prevented injecting under pressure. The injection solution was gravity fed into the well at a rate of
approximately one gallon per minute. After the injection, this coupling was sealed using glue and
should be able to accept a pressurized injection in the future.
During the initial attempt to pump permanganate under pressure into TW-43, the coupling
connection separated, causing a small volume of permanganate solution to leak across the slab and
enter wells EW-6D and EW-6C. Water was sprayed over the leak to dilute the concentration, and
then a solution of sodium thiosulfate was spread over the leak to neutralize the permanganate. The

WA#157-DFSCRPT-0906-500 33
resulting liquid was allowed to run off into two shallow trenches that were dug along the southern
edge of the concrete slab near the location of boring B-38. At the conclusion of the injection, Redox
washed out their pumps with water, and the wash water was also pumped into these trenches.
5.2.3 Radius of Influence Monitoring. Following injections, the radius of influence was monitored
by bailing groundwater samples and visually checking for purple color indicative of the presence of
permanganate. Sodium permanganate has a distinct purple color that is easily detected at
concentrations greater than 0.5 milligrams per liter (mg/L) [Weston Solutions, 2005]. Deep purple
water was observed in wells TW-9 and TW-18, located approximately six feet downgradient of the
injection point, immediately following the injection into TW-37. Purple solution was noted in well TW-
44D, three feet upgradient, after approximately 40 gallons of solution were added to TW-43 and in
well TW-42, five feet downgradient, shortly after the injection was complete at TW-43.
Wells were monitored on three occasions following injection and prior to post-injection sampling to
further assess radius of influence and to evaluate the progress of the reaction. Unreacted
permanganate is deep purple in color, while partially reacted permanganate has a dark brown color.
Site wells were visually monitored for purple color by bailing on July 28, four days after injection.
Purple was noted in TW-9, TW-18, TW-42, and TW-43, as well as EW-6C and EW-6D.
Groundwater bailed from TW-44D was brown with a trace of purple. Purple groundwater was not
observed in TW-1 (13 feet south of TW-37), EW-5D (15 feet northwest of TW-37), TW-35D (8 feet
downgradient of TW-43) or TW-17 (25 feet downgradient of TW-43).
Subsequent visual inspection of groundwater was performed on August 3. Dark purple groundwater
was still noted in TW-42, TW-43, and EW-6D. Only trace purple color was noted in TW-18 and TW-
37, and no purple color was noted in TW-9. Well EW-6C was not bailed. On August 10, dark purple
groundwater was noted in TW-42 and EW-6C, and the groundwater bailed from TW-43 was much
lighter than the previous week. Groundwater in EW-6D was brown with a trace of purple. Trace
purple groundwater was noted in well TW-42 on September 20.
The permanganate injected into TW-43, into a layer of fine sand and silt, was observed to have
traveled five feet from the injection point. Permanganate was observed to persist around the
injection well and a well five feet hydraulically downgradient (TW-42), for greater than eight weeks.
Permanganate was never observed in groundwater bailed from well TW-35D, 8 feet downgradient of
the injection well, and was only observed in well TW-44D, three feet upgradient of the injection well,
on the day of injection. However, these two wells are screened in the lower permeability layer of fine
sand and silt as well as the more permeable layer of coarse sand and gravel above. As monitoring
was performed by bailing, the lack of visual observation may be a result of higher groundwater flow
rates in the more permeable, coarser sand layer and/or limited upward migration of injected
permanganate. The radius of influence within the layer of fine sand and silt is likely greater than five
feet, especially since deep purple permanganate was still observed five feet from the injection point
WA#157-DFSCRPT-0906-500 34
after more than eight weeks. Additionally, oxidant consumption by very high concentrations of VOCs
between TW-42 and TW-35D may have contributed to why permanganate was not observed in well
TW-35D.
The permanganate injected into well TW-37, into a layer of coarse sand and gravel, was observed to
have traveled at least six feet from the injection point. Within this radius of influence, permanganate
was observed to persist for at least 10 days. The presence of an oily product, noted in TW-37 during
post-injection groundwater sampling, may have reduced both the persistence of permanganate in
the subsurface as well as the radius of influence. The permanganate did not travel to wells 10 to 15
feet from TW-37 (TW-1, EW-5D). Figure 5-1 presents a spatial plan of the permanganate injection
and radius of influence monitoring.
5.2.4 Performance Monitoring. Groundwater samples were collected on June 26 and 27, 2006 as
a pretreatment baseline within the Source Area from wells TW-9, TW-18, TW-35D, TW-37, TW-42,
TW-43, TW-44D, and EW-6D. Groundwater samples were collected for analysis of VOCs on August
17, 2006, 24 days after permanganate injection, to evaluate the performance of the chemical oxidant
injection from wells TW-9, TW-35D, TW-37, TW-42, TW-43, and TW-44D. Samples collected on
August 17, 2006 from wells TW-42 and TW-43 were purple in color and had permanganate
remaining, so a small amount of sodium bisulfite was added to each of these samples until the
purple color disappeared to neutralize the remaining oxidant. No samples were collected from wells
TW-18 or EW-6D, which were damaged during the removal of the USTs. Additional post-treatment
sampling was performed on September 20, 2006 from wells TW-9, TW-35D, TW-37, TW-42, TW-43,
and TW-44D to further evaluate chemical oxidation. A small amount of sodium bisulfite was again
added to the groundwater sample collected from well TW-42, where purple color was still noted.
Analytical results are not available for inclusion in this report, but will be included in the Final Source
Area Re-Evaluation Report.
An objective of the ISCO pilot test was to reduce the concentrations of TCE in groundwater by an
order of magnitude within a five foot radius of the injection well. Significant reduction of TCE was
noted in samples collected after permanganate injection in the monitoring wells located five feet
downgradient of the injection; the TCE concentration in well TW-9 was reduced from 2,300 to 39
mg/L, and in well TW-42 the TCE concentration was reduced from 39,000 to 55 mg/L. In well TW-37,
a small increase in TCE concentration was noted, from 52 to 130 mg/L. TCE may have been
dissolved in the LNAPL detected in this well, which may have led to this increase.
At well TW-43, the injection well, the TCE concentration was reduced from 34,000 to 19,000 mg/L. It
was assumed that this sample would have had a significantly lower concentration of TCE, as the
groundwater was still purple in color. It is likely that DNAPL is located in the immediate vicinity of
well TW-43, such that a sample containing permanganate when collected could still have such a
high TCE concentration. The TCE concentrations in wells TW-35D and TW-44D, screened in both
WA#157-DFSCRPT-0906-500 35
the deep low permeability overburden and the deep permeable overburden, both increased. In TW-
44D (upgradient location) the concentration increased from 130 to 9,800 mg/L. In the downgradient
well, TW-35D, the post-injection TCE concentration was 32,000 mg/L, up from 46 mg/L in the pre-
injection sample. These results from the deeper permanganate injection may have been caused by
dissolution of DNAPL mass and/or by the injection advecting high TCE concentration groundwater
radially outward and/or upward into the deep permeable overburden. In general, trends of other
chlorinated ethenes reflected increases or decreases in TCE concentration, with the exception of
TW-43 where cis-1,2-DCE increased slightly from 65 to 120 mg/L. Aqueous concentrations of
chlrorinated ethenes before and after the pilot test are summarized in Table 5-1.
In addition to contaminant concentrations, the impact on several geochemical parameters from the
permanganate injection was monitored. In the vicinity of the deeper injection at TW-43, dissolved
oxygen levels generally were reduced, whereas slight increases in dissolved oxygen were noted
near TW-37. Increase in oxidation-reduction potential (ORP) was noted at the time of the first post-
injection sampling event (August 17) at all wells monitored except for the two deep wells screened in
both the lower permeability silt and fine sand and the more permeable sand and gravel, TW-35D and
TW-44D. During the second post-treatment sampling event (September 20, 2006), increases in
ORP were noted in wells TW-9, TW-37, and TW-44D. ORP decreased slightly in wells TW-42 and
TW-43 between the first and second post-injection samples; however, ORP was still greater than the
value recorded prior to injection. At well TW-35D the ORP value continued to decrease. Increase in
ORP suggests a more favorable environment for oxidizing reactions, including degradation of
chlorinated VOCs. The reason for the lower ORP readings at well TW-35D is unknown at this time.
A decrease in pH was noted at several of the wells in the vicinity of the permanganate injections on
August 17, 2006, and this is likely the result of carbon dioxide generated as a by-product of oxidation
of organic carbon chemicals including TCE. The greatest decrease in pH was 2.5 pH units from
5.84 to 3.32 at well TW-42. More acidic groundwater can increase metal mobility, and the pH should
continue to be monitored to evaluate this possibility. In wells where groundwater pH was noted to
decrease after the permanganate injection, pH was noted to increase between August and
September approaching pre-injection pH values.
5.3 Ex-situ Chemical Oxidation of Shallow Soil. A pilot test for ex-situ treatment was performed on
approximately 43 cubic yards of unsaturated soil. Potassium permanganate, which has a lower solubility
than sodium permanganate, was chosen as the oxidant to increase potential contact with contaminant. In
addition, potassium permanganate is less costly and easier to handle than the more concentrated sodium
permanganate. Excavation and chemical application was performed by Charter, under subcontract to
M&E.
5.3.1 Permanganate Dosage. A range of permanganate doses was selected to determine the
optimum dose for site soils. Dosages were chosen based on analysis of PSOD from three samples
collected during the June 2006 soil investigation, an in-situ soil remediation project performed at Fort
WA#157-DFSCRPT-0906-500 36
Riley in Kansas (see Appendix K), input from Carus, and discussions between M&E and Charter.
Four nominal dry-basis PSOD values were selected to be performed in duplicate: 2 g/kg (gram
permanganate per kilogram dry soil), 3 g/kg, 5 g/kg, and 6 g/kg. A confidence factor of two was
applied to each dose to account for variability in contaminant concentrations and soil composition.
The actual potassium permanganate dosages were 4 g/kg, 6 g/kg, 10 g/kg, and 12 g/kg, and for a
soil volume of approximately five cubic yards, approximately 60, 90, 150, and 180 pounds of
potassium permanganate powder were added, respectively.
5.3.2 Ex-situ Soil Screening. Soil for the ex-situ pilot test was segregated based on PID screening,
analytical results from boring logs, visual observation (i.e., loam), and direction from M&E personnel,
and placed on polyethylene sheeting on the slab area. Excavation was performed by Charter using
an excavator with a 1.5 cubic yard bucket. The segregated soil was transported from the former
porch area to one of four roll-off containers staged in the parking lot of the GWTF using a Bobcat
with a bucket volume of approximately one-half cubic yard. Two piles of approximately five cubic
yards, 11 Bobcat bucket loads, were added to each roll-off. In total, approximately 40 cubic yards
were excavated from the Source Area for the ex-situ pilot test: 11 cubic yards from the eastern
portion of UST tank grave, 21 cubic yards from two areas south of the former porch area based on
soil boring results, and 8 cubic yards from a localized area along the south side of the fence on the
residential property at 106 Center Street. The soil excavated from the residential property was
centered around location HA-2, where the TCE concentration was >2,000 ppb at 2 feet. This
excavation was backfilled with virgin loam. An additional three cubic yards of drill cuttings from the
soil exploration event of June 2006 comprised the remainder of the soil volume for ex-situ treatment.
Figure 5-2 presents the approximate bounds of soil excavated for ex-situ treatment.
A suite of pre-treatment baseline samples were collected by Charter from each pile for laboratory
analysis after transfer to the roll-off containers. Three discrete grab samples were collected for
VOCs, and two composite samples were collected for PSOD, TOC, and geotechnical properties,
including density, grain size, and porosity. Analyses were performed by laboratories subcontracted
by Charter: Carus for PSOD and Phoenix Environmental Laboratories for VOCs, TOC, and
geotechnical properties. Samples from the soil piles in the roll-offs were collected in Level C PPE to
protect against inhalation of VOCs. The PSDO values measured in the shallow soil collected from
south of the slab were much higher than in the samples analyzed during the soil investigation in
June 2006. PSOD values in the pre-treatment piles ranged from 22.4 to 64.4 g/kg. Of the soil used
for the ex-situ tests, the highest TCE concentrations were detected in soil excavated south of the
slab near the boring SB-2, as high as 13,000 mg/kg. TCE concentrations were <5 mg/kg in soil
segregated from the east wall of the UST tank grave. Very high PID readings (50 to 160 ppm) noted
in this soil during pre-screening were likely due to elevated concentrations of VPH and EPH (See
Sample UST-5 SW-EAST/TOP on Table 4-10). The TCE concentration in all pre-treatment samples
is presented in Table 5-2. cis-1,2-DCE was detected in the soil samples collected from Piles 5, 6, 7,
WA#157-DFSCRPT-0906-500 37
8, and 9. The highest concentration was 420 mg/kg (Pile 6); however, every other detection of cis-
1,2-DCE was < 24 mg/kg.
5.3.3 Ex-situ Soil Pilot Test. M&E oversaw the application of potassium permanganate on the nine
piles by Charter on August 16, 2006. Potassium permanganate powder was delivered to the Site in
55-pound pails, and the powder was applied directly to the soil. In a similar ex-situ pilot test, higher
TCE removal was observed when adding permanganate powder to the soil compared to applying an
equivalent amount of permanganate as an aqueous solution [Regenesis, 2006]. The soil-
permanganate mixture was mixed with the excavator arm while water was added with a garden hose
at a flow rate of approximately 20 gallons per minute. For Piles 1 and 2, a representative from
Charter entered the roll-off to pour the permanganate manually over the piles. For the other seven
piles, the permanganate was poured into the bucket of the excavator and spread evenly over the pile
and mixed with the bucket. All personnel who entered the roll-off boxes or who sprayed water onto
the soil piles operated in Level C PPE. A summary of the permanganate doses and source of soil
for each pile is provided in Table 5-3. The piles were covered with polyethylene sheeting, the roll-off
covers were secured, and the permanganate was allowed to react with the soil for five days.
Oxidation with permanganate is an exothermic reaction, and steam was noted emanating from Pile 6
after dosage and mixing. This pile was not mixed as thoroughly as others to prevent further
spreading of what Charter believed to be combustion of tree roots.
5.3.4 Ex-situ Pilot Test Results. Post-treatment samples were collected on August 22, 2006. The
results are summarized in Table 5-2. Five discrete, grab samples were collected from each pile: one
from the center and one from each corner. TCE concentrations detected in the post-treatment
samples ranged from <5 to 210 mg/kg. The highest TCE concentrations were in Piles 5 and 6, in the
source soil from south of the slab near SB-2. The average TCE concentration in Piles 5 and 6 was
reduced by almost two orders of magnitude as a result of the permanganate dosage. TCE
concentrations in the post-treatment samples from soil in Pile 3 (3 g/kg) and Piles 7 and 8 (2 g/kg)
were slightly higher compared to the pre-treatment samples; however, these small increases may be
a result of soil heterogeneity within each pile and variability of VOC grab samples. USEPA guidance
suggests that duplicate soil samples are equivalent when the relative percent difference (RPD) is
less than 50 percent [USEPA, 1996]. The RPD of the average TCE concentrations before and after
treatment was between 40 and 60 percent for these piles. In these piles, with the lowest dosages of
permanganate, it is possible that the permanganate was oxidized by natural organic matter and
oxidation of TCE was negligible. The highest permanganate dose was applied to the soil in Piles 1
and 2 (6 g/kg). The soil in these piles retained a dark purple color following mixing. Both the PSOD
and TCE concentrations were very low in the soil in Piles 1 and 2. The maximum cis-1,2-DCE
detection in the post-treatment samples was 20 mg/kg. Methyl ethyl ketone (MEK) was detected in
almost every post-treatment sample. However, this compound was not detected in any pre-
treatment sample and may be the product of the oxidation of organic matter. One possible
WA#157-DFSCRPT-0906-500 38
explanation is that the use of sodium bisulfate as the low-level preservation method for soil samples
with high organic matter or humic material content has been known to result in the formation of
acetone and MEK at potentially significant concentrations in samples (>100 mg/kg) [Clausen, et. al.,
2000; CTDEP, 2005].
5.3.5 Backfill. The nine soil piles treated by the ex-situ pilot test were extracted from the roll-off
containers on September 7, 2006. The soil from Piles 3 through 9 were dumped onto the concrete
slab and placed with a bobcat south of the slab between the locations of SB-1 and EW-3, and the
open excavations near SB-2 and B-34 were filled. Small portions of purple soil were noted, and the
soil was wetted with a hose as the soil was backfilled to promote reaction of any remaining
permanganate. While backfilling, portions of the soil appeared drier and less purple, particularly in
Piles 1 and 2. It may be possible that the oxidation reaction was contact and/or moisture limited. A
large volume of purple water was present around Pile 9 (drilling cuttings); this water was drained into
the backfill area between well TW-1 and TW-19. The soil in Piles 1 and 2, which were taken from
the UST tank grave, had the largest permanganate dose and retained a deep purple color. A test pit
was excavated on September 12, 2006 at the eastern area of the former UST area, and this soil was
backfilled to a depth of approximately eight to ten feet. Generally soil was backfilled in the same
area from which it was excavated.
5.4 Pilot Test Conclusions and Recommendations. The in-situ groundwater and ex-situ soil pilot tests
demonstrated the ability of permanganates to reduce the mass of TCE. For both tests, the post-treatment
sampling results presented unexpected results that additional monitoring may help to elucidate. The
performance of the two pilot tests will provide valuable information for the remediation of the Groveland
Superfund Site.
5.4.1 In-situ Chemical Oxidation for Groundwater. The concentration of TCE was reduced by
nearly two orders of magnitude from two wells, but increases were noted in three others. The high
concentrations of TCE measured after the injection of permanganate, and in water that visually
contained permanganate, suggest that DNAPL is likely present in the vicinity of injection well TW-43.
As permanganate was still visually observed in groundwater during the post-injection sampling, it will
continue to oxidize TCE, and additional post-treatment groundwater samples should be collected to
evaluate if additional degradation or contamination rebound have occurred. A decrease in pH was
noted in some wells three weeks after permanganate injection, but the groundwater pH had
increased to near baseline conditions in most wells two months after the injection. Future sampling
events should include metals analysis and evaluate any additional pH changes. Future
permanganate injections should also be considered, due to the potential presence of DNAPL and
the possibility of contaminant rebound. Multiple injections are often required to achieve MCLs as a
cleanup goal [McGuire, et. al, 2006; ITRC, 2005].
WA#157-DFSCRPT-0906-500 39
5.4.2. Ex-situ Chemical Oxidation for Unsaturated Soil. The soil pilot test demonstrated that
significant reductions of TCE concentration in soil can be achieved using permanganate as an
oxidant. While backfilling the treated soil, portions of the soil appeared drier and less purple. It is
likely that the oxidation reaction within the roll-off containers was contact and/or moisture limited. In
addition, the PSOD in the piles was higher than expected and may have inhibited chemical oxidation
of TCE in favor of natural organic matter. For future remediation of unsaturated soils, a dose of at
least 30 lb permanganate per cubic yard soil (10 g MnO4-/kg) is recommended, particularly in areas
when soil TCE concentrations are known to be >10,000 mg/kg, and applying ample water will
improve treatment effectiveness. Obtaining PSOD of the soils to be treated in advance would aid in
determining the appropriate permanganate dosage. Soil borings to collect samples for PSOD
analysis prior to ordering permanganate would help ensure that the dose is sufficient. For future in-
situ or ex-situ dosage, adding ample water, until all soil is visibly wet, will improve contact between
permanganate and TCE in soil. Due to heterogeneity in soil and variability in analytical results,
more grab samples for VOCs should be collected using a systematic grid approach to better
evaluate treatment performance. Utilizing the OEME Mobile Laboratory would provide quantitative
contaminant characterization for each target area, aid in determining target area dosages, as well as
determine where additional treatment may be necessary while a subcontractor may already be
mobilized.
To fully evaluate chemical oxidation of contaminated soil, additional shallow soil samples should be
collected from areas of the Site where permanganate treated soil was backfilled from both the ESCO
pilot test and from where soil was treated in-situ.
WA#157-DFSCRPT-0906-500 40
6.0 IDENTIFICATION AND EVALUATION OF REMEDIAL ALTERNATIVES
This section includes a review of potential remedial technologies and alternatives to address the
contamination remaining in the Source Area soils and groundwater in order to reduce risk to human
health and reduce the time of operation of the GWTF. A total of seven remedial technologies were
considered, including four for vadose (unsaturated) zone soils, two for groundwater and saturated soil,
and one remedial technology that would address both the unsaturated and saturated zones. A total of five
remedial alternatives, combining various technologies to address both the vadose and saturated zones,
were evaluated. Implementation and performance monitoring of the pilot tests conducted during 2006
were considered as part of the alternative evaluation. Although this evaluation is not designated as a
feasibility study, the format of the evaluation of the potential alternatives has been addressed as a limited
feasibility study.
6.1 Prior Source Area Remediation
Previously, the PRPs operated a SVE system to address vadose zone contamination in Source Area soils
above and below the clay layer. The SVE system began operation as a pilot operation under the SITE
program in 1988 [USEPA, 1989]. The system was later modified to include additional vapor extraction
wells and to include the capability of dual-phase extraction and hot-air injection to enhance contaminant
removal. In 1997, an assessment of the system found that the mass of contaminants being removed was
less than 0.1 pounds per month. USEPA made several recommendations for improving system operation,
but, the recommendations were never incorporated into the system. The PRP system was shut down in
2002, after Valley Manufacturing ceased operations. Results from soil sampling conducted under this
Source Area re-evaluation indicate that the SVE system was only partially effective, particularly near the
former porch area. Evidence of success of the SVE system was observed inside the main Valley building
(B-46, B-49, B-50, and TW-48), where TCE was found only in the clay and not above or below the clay.
However, residual TCE contamination in the clay layer demonstrates the difficulty in removing VOCs in
low permeability media by SVE.
6.2 Site Cleanup Levels
Site cleanup levels for soil and groundwater were established during preparation of the Feasibility Study
[RFW, 1988] and the ROD [USEPA, 1988A]. The Safe Drinking Water Act MCLs were selected as target
cleanup levels for contaminants of concern in groundwater. For those contaminants for which MCLs were
not available at the time of ROD preparation, risk-based cleanup levels were established. Groundwater
remediation goals have been updated to be consistent with amendments to MCLs since the ROD was
prepared in 1988 [USEPA, 2003].
Proposed target cleanup levels were developed for Source Area unsaturated soils in response to updates
made to USEPA soil screening guidance. M&E calculated revised soil cleanup levels for nine
WA#157-DFSCRPT-0906-500 41
contaminants based on contaminant migration to groundwater, such that contamination leaching from
Site soils to groundwater would not exceed target groundwater levels (MCLs) at a downgradient
monitoring well. Applying site-specific hydrogeologic data collected during the Source Area Re-
Evaluation to current USEPA guidance for developing soil screening levels [USEPA, 2002], the resulting
proposed soil cleanup concentrations for these chemicals are less stringent than cleanup concentrations
in the ROD [USEPA, 1988]. All calculations associated with revised soil cleanup goals are provided
within Appendix H. The revised remediation goals are based on chemical-specific parameters as well as
site-specific data collected, including total organic carbon in soil, hydraulic conductivity, hydraulic
gradient, and aquifer thickness. The proposed soil cleanup values calculated during this study were
further evaluated to determine that these concentrations are protective of direct contact exposures (i.e.,
incidental ingestion, dermal contact, and inhalation of dust released from soil), and risks associated with
the subsurface vapor intrusion pathway (i.e., the inhalation of impacted air). Based on this evaluation, the
proposed cleanup level for TCE, which is the primary contaminant of concern, was identified as 77 mg/kg.
This proposed cleanup concentration is slightly higher than the USEPA Region IX PRG of 60 mg/kg, but is
lower than the MassDEP Method 1 Soil Cleanup Standard for Category S-1 soils in a GW-1 (drinking
water) aquifer of 300 mg/kg [MassDEP, April 2006].
Groundwater and soil cleanup concentrations calculated during this study are presented in Table 6-1.
The more stringent values identified in the ROD are also presented for comparison. Maximum
concentrations detected in unsaturated soil during the 2004 and 2006 sampling program are shown on
Figures 4-8 and 4-9. The area that would require remediation to achieve the 77 mg/kg proposed cleanup
level for unsaturated soils is depicted on Figure 6-1 with approximate contamination depths. The area
requiring remediation for groundwater and saturated soil is shown in Figure 6-2. Approximately 4,400
cubic yards of unsaturated soil would be targeted for remediation. The area requiring remediation of
groundwater and saturated soil is approximately 6,600 square feet and contains 230,000 to 300,000
gallons of groundwater.
6.3 Initial Screening
The remedial technologies are presented and screened in this subsection. Several factors were used to
determine feasibility and, in turn, to screen out those technologies that clearly should not be considered
for use at the Site. The factors used in this screening process were based on the current USEPA
guidance for conducting an FS under CERCLA [USEPA, 1988B] and included, but were not limited to, the
following:
Effectiveness in handling the estimated areas or volumes of media and in meeting theremediation goals
Potential impacts to human health and the environment during construction and implementation
Proven effectiveness and reliability with respect to the contaminants and conditions at the Site
Implementability in terms of both the technical and administrative feasibility
WA#157-DFSCRPT-0906-500 42
Relative costs as far as technologies or process options that accomplish the same result
Technologies considered for the Groveland Source Area remediation include those that will address
unsaturated soils and those technologies that could be used to treat saturated soils and groundwater.
For unsaturated or vadose zone soils, excavation with either off-site disposal or on-site chemical
oxidation of soils, in-situ gaseous chemical oxidation, and soil vapor extraction have been considered.
For saturated soils and groundwater, ISCO and bioremediation (in-situ enhanced reductive
dechlorination) have been considered. Thermal treatment has been considered for treating both the
unsaturated and saturated zones.
A brief description of the technologies is presented below, along with rationale for eliminating or retaining
the technology for further consideration. Generally, only technologies that would likely achieve the
desired results were considered, therefore most technologies were retained for consideration as part of a
remedial alternative.
6.3.1 No Further Action. The No Further Action alternative has been considered to establish a baseline.
No further remedial activities would be implemented in the Source Area. The groundwater extraction and
treatment system would continue to operate with continued monitoring. The No Further Action alternative
would not reduce leaching to groundwater or health risks associated with exposure to TCE contamination
in shallow soil, and this alternative is expected to fail to meet the proposed soil cleanup goal for TCE of
77 g/kg. Under the No Further Action alternative, residual contamination in the Source Area would
continue to dissolve into the groundwater flowing through that area, eventually reaching the extraction
wells for removal and treatment. In order to estimate the time that the GWTF would have to continue to
operate under this alternative, several methods were used to estimate the period of time for residual
contamination to be flushed from the aquifer. All calculations resulted in durations in excess of 100
additional years (See Appendix I). The calculated cleanup times are considered highly uncertain; for
example, the likely presence of DNAPL would increase anticipated cleanup time , but cleanup time would
decrease if the estimate of remaining contaminant mass were lowered. In addition, reduction of residual
contamination in unsaturated soil would be slow and could only occur by leaching associated with
infiltration. Due to the long cleanup times predicted, the No Further Action was not retained for detailed
evaluation; however, costs associated with continued GWTF operation and groundwater monitoring have
been developed and are presented for comparison with the remedial alternatives in Table 6-7.
6.3.2 Excavation. Two excavation alternatives were considered for remediation of unsaturated soil with
TCE concentrations exceeding the proposed cleanup goal of 77 mg/kg. In one alternative, all soil
exceeding the proposed cleanup goal would be excavated and disposed of off-site. The second
alternative would treat the contaminated soil with a chemical oxidant on-site, and the treated soil would be
backfilled.

WA#157-DFSCRPT-0906-500 43
Unsaturated soils exceeding the proposed cleanup goal of 77 mg/kg are located beneath much of the
former porch area and under the southern portion of the main Valley building. It is estimated that
approximately 4,400 cubic yards of soil exceeding 77 g/kg TCE would require excavation and disposal
or chemical oxidation treatment, and demolition of the main Valley building would be required to safely
access all contaminated soil. For the off-site disposal option, it has been assumed that soil would be
disposed of as a RCRA listed hazardous waste (F001) and that clean fill would be used to backfill the
excavation. Alternatively, reduction of TCE contamination by chemical oxidation would allow the soils to
remain on-site. Permanganate would likely be selected as the oxidant, similar to the pilot tests described
in Section 5.3, where up to 99 percent removal of TCE was observed. These excavation alternatives
would remove TCE from unsaturated soils in the Source Area, thereby eliminating risks associated with
direct exposure, inhalation, and mobility to groundwater. Excavation of soils exceeding the 77 g/kg
proposed cleanup goal has been retained for further consideration.
6.3.3 Soil Vapor Extraction. Soil vapor extraction is an in-situ vadose zone soil remediation technology
in which a vacuum is applied to the soil via extraction wells to induce the controlled flow of air and remove
volatile and some semivolatile contaminants from the soil. The gas leaving the soil would be treated to
remove the contaminants prior to discharge to the atmosphere.
Based on results of the soil sampling program, it appears that the existing SVE system, which was
operated by the PRPs for over 10 years, was only partially effective in remediation of Source Area soils.
High levels of contaminants remain in soils at locations within 10 feet of the SVE wells. For example, at
boring SB-10, located about 5 feet from SVE well EW-6S, TCE was detected at 52,000 g/kg at a depth
of 7.7 feet and at 2,460 g/kg at 8.2 feet (EW-6S in screened from 9 to 19 feet). At boring SB-08, located
approximately 7 feet from SVE well EW-5, TCE was detected at a concentration of 10,800 g/kg at a
depth of 7.8 feet (EW-5S is screened from 8 to 18 feet). Lower concentrations, ranging from a low of 5 to
793 g/kg TCE, were detected in soil boring depths corresponding to the screened intervals of these
wells. Both wells are located beneath the cement slab of the former porch area. It is noted that the
highest levels of contamination remaining are in the loamy soil layer found at depths ranging from 6 to 8
feet below ground surface. Due to the heterogeneity of the soils, it is likely that remediation proceeded in
the more porous sandy soil and fill, and that remediation of the loamy soil layer was limited to diffusion
through the soil media.
The existing system has been off-line and not maintained for nearly five years and was disassembled
prior to the demolition of the porch structure. In addition, several SVE extraction wells were destroyed
during the removal of USTs and soil pilot testing. If this technology were to be implemented, it is likely
that a new, enhanced SVE system would be installed, rather than attempting to use portions of the
previous SVE system. However, if remediation by SVE had previously become diffusion-limited in the
areas of highest remaining contamination, then an enhanced SVE system would be expected to achieve
only a slight improvement in the contaminant removal rate. SVE was not retained for detailed evaluation.
WA#157-DFSCRPT-0906-500 44
6.3.4 In-Situ Gaseous Oxidation of Vadose Zone Soils. In-situ gaseous oxidation (a form of chemical
oxidation) involves the injection of a gaseous oxidant into soil or groundwater to break down
contaminants into non-hazardous by-products such as water, salt, and carbon dioxide. In the case of
TCE, oxidation proceeds to 1,2-DCE, vinyl chloride, and ultimately to non-hazardous by-products. The
most commonly used chemical oxidant in gas form is ozone. For vadose zone soils, ozone injection can
be accomplished with relative ease and is, therefore, being considered for vadose zone remediation.
Variations of this technology are available. The Perozone system employs microbubbles of ozone
coated with hydrogen peroxide, which results in greater production of the hydroxyl radical than ozone
alone. To promote degradation of contaminants in the vadose zone, ozone would be introduced via
injection points targeting depths where high levels of contamination remain. In-situ gaseous oxidation
has been retained for detailed evaluation.
6.3.5 In-Situ Thermal Treatment. In-situ thermal treatment technologies, such as electrical resistance
heating (ERH) and in-situ thermal desorption (ISTD), use heat applied directly to the subsurface to strip
volatile and semivolatile contaminants from both vadose and saturated zones. The vapors are collected
through wells for treatment. One advantage of these technologies over SVE is that they are applicable to
poorly permeable or dense soils, clay layers, and heterogeneous soils.
ERH uses three-phase electricity to increase subsurface temperatures beyond the boiling point of water
and most VOCs, creating steam and causing VOCs to transition to the vapor phase and rise toward
recovery wells placed above the heated region. Since electricity will take the pathway of lower
resistance, such as silt or clay, when moving between electrodes, these pathways are heated faster. As
a result, areas of low permeability where chlorinated compounds tend to become trapped are heated
slightly faster than areas of higher permeability. Consequently, contaminants are stripped from
subsurface soils, irrespective of soil permeability [Thermal Remediation Services, Inc., 2005]. Electricity
is delivered to the subsurface using electrodes which are installed using standard drilling practices.
ISTD is based on thermal conduction through the soil, providing uniform heat transfer. Heat is applied
using thermal wells, along with heated extraction wells, which can be placed at any depth or in any
media, creating a zone of very high temperature (over 1000 oF) [TerraTherm, Inc.]. Extraction wells and
vapor-phase carbon are used to remove the contaminants.
Successful ERH and ISTD remediation projects have been demonstrated at similar sites in both
unsaturated and saturated soils. Other forms of in-situ thermal treatment include steam and hot air
injection; however these technologies would be less effective due to the heterogeneity and low
permeability of the soils. In-situ thermal remediation has been retained for further consideration.
6.3.6 In-Situ Chemical Oxidation, Groundwater. In-situ chemical oxidation involves the injection of an
oxidant into the saturated zone to break down contaminants into non-hazardous by-products such as
water, salt, and carbon dioxide. In the case of TCE, oxidation proceeds to 1,2-DCE, vinyl chloride, and
WA#157-DFSCRPT-0906-500 45
ultimately to non-hazardous by-products. The chemical oxidants most commonly employed to date
include peroxide (Fenton s Reagent), ozone, and sodium or potassium permanganate. These oxidants
have been able to cause the rapid and complete chemical destruction of many toxic organic chemicals.
Other organics undergo partial degradation, leaving by-products that are amenable to subsequent
bioremediation. In general the oxidants have been reported to achieve greater than 90 percent treatment
efficiencies for TCE, with very fast reaction rates. Field applications have clearly affirmed that matching
the oxidant and in situ delivery system to the contaminants of concern (COCs) and the site conditions is
the key to successful implementation and achieving performance goals [USDOD, 2002]. For the
Groveland Site, possible oxidants include hydrogen peroxide, which is available on-site at the GWTF, and
potassium or sodium permanganate. Permanganate is more stable than peroxide, which would allow
more time for contact with contaminants in the dense soils found in the Source Area.
6.3.7 In-Situ Enhanced Reductive Dechlorination. Nutrient enhanced reductive dechlorination is
intended to progressively destroy TCE and the breakdown products by accelerating the biodegradation
rates of site contaminants through anaerobic reductive dechlorination processes. Naturally occurring
microorganisms create hydrogen, which replaces chlorine on chlorinated ethenes, eventually producing
ethene. Without enhancements, the process is slow and unstable. The addition of an electron donor
and/or dechlorinating microbes results in acceleration of the naturally occurring process. Several
amendments are available. There are several technology vendors that sell proprietary formulations of
electron donors, including HRC® (or Hydrogen Release Compound, Regenesis) and EOS® (Emulsified
Oil Substrate), and dehalogenating microbes, including KB-1 (SiREM) and CL-OUT (CL Solutions). Also
available are technologies that use non-proprietary materials, such as molasses, lactate, and soluble oils.
Cost of the proprietary amendments is greater than for the non-proprietary; however the vendors state
that proprietary amendments result in a more extended release, thereby requiring fewer applications
[Dajak, 2006; Regenesis; 2006]. A disadvantage of this technology includes the generation of a reducing
environment in the aquifer, which could result in mobilization of naturally occurring metals, such as
arsenic. Enhanced Reductive Dechlorination has been retained for further consideration.
6.4 Potential Alternatives
Five remedial action alternatives were developed and screened in this subsection. Alternatives were
developed by combining technologies, as appropriate, to address both vadose and saturated zone soils.
These include
· Alternative 1A Excavation/On-site Chemical Oxidation of unsaturated soilsIn-situ Chemical Oxidation for saturated soils and groundwater
· Alternative 1B Excavation/Off-site Disposal of unsaturated soilsIn-situ Chemical Oxidation for saturated soils and groundwater
· Alternative 2 Excavation/On-site Chemical Oxidation of unsaturated soilsEnhanced Reductive Dechlorination for saturated soils and groundwater
· Alternative 3 In-situ Gaseous Chemical Oxidation of unsaturated soilsIn-situ Chemical Oxidation for saturated soils and groundwater
WA#157-DFSCRPT-0906-500 46
· Alternative 4 In-situ Thermal Treatment for soil and groundwater
The following statutory NCP criteria were used to evaluate the alternatives.
· Overall Protection of Human Health and the Environment
This criteria addresses how the alternative provides overall human health and environmental
protection.
· Compliance with ARARs
This criterion addresses the degree to which chemical-specific, action-specific, and location-
specific ARARs will be met by the application of the alternative. It further addresses
compliance with other appropriate criteria, advisories, and guidance that may be available.
Preliminary ARARs are presented in Appendix F.
· Long-Term Effectiveness and Permanence
This criterion addresses the magnitude of the residual risks and the adequacy and reliability
of any controls.
· Reduction of Toxicity, Mobility, and Volume Through Treatment
This criterion addresses whether a treatment process is used and if the materials of concern
are treated. It also addresses the volume of hazardous materials destroyed or treated, and
the degree of expected reduction in toxicity, mobility, and volume. Furthermore, it addresses
the degree to which treatment is irreversible and the type and quantity of residuals remaining
after treatment is complete.
· Short-Term Effectiveness
This criterion addresses the protection of the community and on-site workers during remedial
actions. It also addresses environmental impacts that may occur during the implementation
and the time required to achieve the remedial action objectives.
· Implementability
This criterion addresses three main areas including technical feasibility, administrative
feasibility, and the availability of materials and services. It addresses the ability to construct
and operate the technology and the reliability. It also addresses the ease of undertaking
WA#157-DFSCRPT-0906-500 47
additional action if it were necessary. This criterion further addresses the ability to monitor
the effectiveness, obtain approvals, and coordinate with outside agencies. Finally, this
criterion addresses the availability of off-site treatment, storage, and disposal (TSD) services,
necessary equipment and specialists, and the basic availability of the technologies proposed.
· Cost
This criterion addresses the costs projected for the alternative including capital and operation
and maintenance, and the estimated present worth costs. Order of magnitude cost estimates
were developed for each alternative. Budgetary quotes for equipment were obtained from
technology vendors. When multiple quotes were obtained for the same product, the quotes
were either averaged or one quote was selected for presentation. Contingency, project
management, design, and construction management costs were estimated as percentages of
total capital and operation and maintenance (O&M) costs, using the percentages suggested
in A Guide to Developing and Documenting Estimates During the Feasibility Study
[USACE/USEPA, 2000]. Based on estimates of the additional time for operation of the
GWTF, approximate GWTF operation costs are included for the cost evaluation of each
alternative.
· State Acceptance
This criterion addresses the expected likelihood of acceptance from the State regulatory
agency.
· Community Acceptance
This criterion addresses the expected likelihood of acceptance from the local community.
6.4.1 Alternative 1A: Excavation/Oxidation of unsaturated soils and In-situ Chemical Oxidation
This alternative includes excavation and treatment of impacted soils above the water table and in-situ
treatment below the water table in an attempt to achieve proposed cleanup levels. Treatment by
chemical oxidation of Source Area soils will eliminate potential for contaminants to continue to leach into
groundwater. Contamination in the saturated zone will be destroyed in-situ by chemical oxidation. By
removing the source of constituents impacting the Site and decreasing the mass of contaminants in
Source Area groundwater, it is anticipated that a decrease in the number of years of GWTF operation will
be realized and overall remediation will be achieved in a more timely manner.
The goal for chemical oxidation of contamination in soil and groundwater is to achieve significant mass
removal, with the intent of eventually achieving MCLs in groundwater and meeting the proposed soil
WA#157-DFSCRPT-0906-500 48
cleanup goal. As the basis for this analysis, chemical oxidation with permanganate was considered for
unsaturated soils in addition to saturated soils and groundwater. For the Groveland Wells Site Source
Area, permanganate offers the following advantages:
· Permanganate is more persistent in the subsurface than peroxide, persulfate, or ozone; therefore,it has a wider range of options for field application/subsurface delivery.
· Permanganate has a strong affinity for oxidizing organic compounds containing double carbonbonds, aldehyde groups, or hydroxyl groups. Peroxide and ozone are less selective oxidizers. Asa result, the effective radius of treatment would likely be greater for permanganate than it wouldbe for the other oxidants, because it is less likely to be consumed as quickly by natural organicmatter in the subsurface.
· Permanganate is a more stable oxidizing agent, so dangers of rapid decomposition are not asgreat as with peroxide and ozone; however, fire or explosion hazards still exist if concentratedpermanganate contacts reducing agents or combustible/flammable materials.
· Diffusive transport through low permeability zones is possible with permanganate due to itshigher stability, compared to other oxidants.
· The optimum pH range for chemical oxidation with permanganate is 7 to 8, but it is still effectiveover a wide pH range; therefore, pH adjustment is not typically required.
Permanganate can be applied to the subsurface in the form of potassium permanganate (KMnO4) or
sodium permanganate (NaMnO4). Potassium permanganate is less expensive, but has a maximum
solubility in water of 4%, which is substantially less than the 40% solubility of sodium permanganate.
Sodium permanganate can be injected into the subsurface at concentrations up to 40%. However,
because of health and safety concerns, it is typically diluted to 10 or 20% solution prior to in-situ injection
into the subsurface. A 20% solution of sodium permanganate would require only 20% of the water
necessary to deliver the same amount of oxidant as a 4% solution of potassium permanganate. In low
permeability formations, injection of excess water can substantially lengthen the injection period, and
potentially cause migration of groundwater contaminants to areas outside of the treatment zone.
Therefore, in order to prevent injection of excess volumes of water into the subsurface, sodium
permanganate is recommended as the ISCO reagent at the Groveland Wells Site Source Area.
Conversely, as the oxidation of TCE occurs in an aqueous-phase reaction, potassium permanganate
would be preferred for on-site treatment of unsaturated soil by chemical oxidation. A larger volume of
less concentrated, permanganate solution would likely increase contact with contaminated soil.
Excavation of all unsaturated soils with TCE concentrations above the proposed cleanup goal of 77 g/kg
was evaluated for this alternative, with all soil treated on-site. The approximate areas with estimated
excavation depths are presented on Figure 6-1. It is estimated that approximately 4,400 cubic yards of
soil exceeding 77 g/kg TCE would require excavation and chemical oxidation treatment. The average
excavation depth is approximately 14 feet. In some areas, excavation would be required to be as deep
as 24 feet and would include the clay layer. It has been assumed that sheeting or trench boxes would be
required to access the southern portions of deeper soil noted on Figure 6-1, and sheeting has been
WA#157-DFSCRPT-0906-500 49
assumed for developing the cost estimate. For the excavation alternatives, demolition of the main Valley
building would be required in order to safely access all contaminated soil.
Chemical oxidation of unsaturated soils would reduce the mass of TCE contamination and allow the soils
to remain on-site. Potassium permanganate would likely be the oxidant, similar to the pilot tests
described in Section 5.3. Determining the correct dose of permanganate is vital for successful treatment,
and additional soil samples would need to be collected for PSOD analysis. Mixing permanganate with
soil in-situ or applying permanganate ex-situ and backfilling would be evaluated during the remedial
design. In-situ soil mixing may be more feasible for areas where contaminated soil is shallow; however,
deeper soils may require excavation and ex-situ application of oxidant.
As the basis for this analysis, chemical oxidation using sodium permanganate was considered for
saturated soils and groundwater. The primary factors that control the effectiveness of contaminant
oxidation in the subsurface are geologic conditions, transport of the oxidant through the subsurface, and
the natural oxidant demand of the formation. At the Groveland Wells Site Source Area, it is anticipated
that a full-scale ISCO application of the permanganate solution would be accomplished using a series of
injection wells similar to standard groundwater monitoring wells.
A permanganate injection system, complete with the necessary tanks, pumps, piping, fittings, and
controls would be constructed to safely and effectively inject a solution of NaMnO4 into approximately 50
subsurface injection points. In most locations, separate wells screened at two different depths may be
necessary in order to maximize the distribution of the oxidant throughout the contaminated zones. The
injection grid would extend slightly upgradient of the plume source and continue along the approximate
width and length of the plume, including inside the former porch area and inside the former manufacturing
building. Each row of wells would be offset by 10 feet, based on observations of the ISCO pilot test
performed in July 2006, to produce a staggered effect that would help to provide even distribution of the
oxidant in the subsurface. Injection points would be determined by Source Area groundwater and soil
samples collected during 2006 to target areas where contamination exceeds proposed cleanup goals for
soil and groundwater.
Sodium permanganate solution (40% by weight) would be delivered to the Site in drums and diluted on-
site with potable water to a 10% solution prior to injection, similar to the pilot test. Dilution to 10%,
compared to 20% which is also a commonly applied dosage, allows for a slightly larger hydraulic radius of
influence as a larger volume is pumped into the subsurface. During the ISCO pilot test in July 2006, 10%
sodium permanganate solution was injected into shallow, saturated overburden (TW-37) at a rate of four
to five gallons per minute at a pressure of 30 to 35 psi. Permanganate was gravity fed into the deep, low
permeability silt layer above the bedrock (TW-43) at approximately one gallon per minute. With a more
secure coupling, the solution could have been pumped in under pressure at a slightly higher flow rate.
WA#157-DFSCRPT-0906-500 50
Concerns have been raised that the oxidizing nature of permanganate can mobilize certain metals such
as chromium, increasing groundwater concentrations to unacceptable levels. A decrease in groundwater
pH was noted following the permanganate pilot test, and many metals are more mobile under acidic
conditions. Such conditions make mobilization of metals theoretically possible, although this does not
appear to have been documented at sites where permanganate has been injected [Weston Solutions,
2005]. If metals are mobilized from the Source Area, it is anticipated that they would be removed via the
groundwater extraction and treatment system. Monitoring of metals concentrations in groundwater is
recommended for a full scale application. Trace metals may also be present as contaminants in the
permanganate solution, so analysis of the solution being injected should be performed to ensure that
such metals are not inadvertently added to the subsurface.
Post-injection monitoring of permanganate and VOCs would be performed to evaluate the distribution of
permanganate in the subsurface, assess contaminant destruction, and determine progress towards
attainment of remedial objectives. Visual inspections of groundwater in the monitor well network would be
conducted weekly following injection events to monitor for the presence of permanganate. Sodium
permanganate has a distinct purple color that is easily detected at concentrations greater than 0.5
milligrams per liter (mg/L) [Weston Solutions, 2005]. In addition to visual inspections, manganese and
chloride levels would be monitored with test kits to estimate the remedial progress for a full-scale ISCO
application. Once the permanganate dissipated within the monitor wells, groundwater samples would be
collected and analyzed for VOCs to determine whether additional injections are required. A second set of
groundwater samples would be collected and analyzed six to twelve months following injection to assess
contamination rebound in groundwater, which could potentially occur when DNAPL is present [McGuire,
et. al., 2006]. Additional permanganate would be injected in the vicinity of any monitor wells where TCE
concentrations exceed the groundwater cleanup goal (MCLs). This process of monitoring and injection
would be repeated until the VOC concentrations consistently meet cleanup goals. It is estimated that as
many as three injections may be required to complete treatment of the entire area of the plume [Weston
Solutions, 2005].
Once VOC concentrations throughout the treatment zone meet the cleanup goals (MCLs), groundwater
monitoring for VOCs and metals would be conducted on a quarterly basis for one year to confirm that
concentrations of VOCs do not rebound, and that no metals were mobilized as a result of the oxidant
injection. Based on experience at other sites in New England with similar subsurface conditions, it is not
anticipated that metals mobilization would be an issue at this Site. However, it is prudent to document the
metals concentrations in groundwater before and after an ISCO program, and verify compliance with
groundwater criteria. After one year of post-remedial monitoring has verified attainment of the remedial
objectives, the remedial action completion report for the Site would be prepared, and injection system
would be decommissioned [Weston Solutions, 2005].
The period of performance for this alternative is estimated to be five years, including three annual
injections of permanganate, additional post-remedial monitoring, and injection system decommissioning
WA#157-DFSCRPT-0906-500 51
[Weston Solutions, 2005]. The components of this alternative are presented in general detail as part of
the cost estimate in Table 6-2.
Overall Protection of Human Health and the Environment
Excavation of unsaturated Source Area soils with on-site treatment will eliminate potential for
contaminants to continue to leach into groundwater. Treatment of groundwater will occur by injecting an
oxidant to destroy contaminants in-place. It is projected that this action will reduce the contaminant
concentrations in groundwater over time. Overall, this alternative will provide a high degree of protection
of human health and the environment.
Compliance with ARARs
Over time, the aquifer will achieve compliance with chemical specific ARARs for the chemicals of concern
over most of the Source Area.
Long-Term Effectiveness and Permanence
Chemical oxidation of unsaturated soils can effectively reduce contaminant mass with the application of
sufficient dose of permanganate and ample water to allow aqueous phase contact with TCE. The
complex hydrogeologic conditions beneath the Site may make it uncertain whether some areas within the
saturated zone have been restored to appropriate standards. The geology and hydrogeology present
several key challenges, and successful delivery of the oxidant to the contaminant, the primary factor
controlling performance of the remedy, will be dependent upon geologic conditions, transport, and natural
oxidant demand in the subsurface. Relatively low PSOD values from analysis performed on saturated
and unsaturated soil prior to the pilot testing, provided further evidence that chemical oxidation by
permanganate would be favorable within the Groveland Wells Source Area. However, significantly higher
PSOD values were measured in shallow soil south of the slab, where natural organic matter may
consume permanganate limiting potential reaction with TCE. In addition, the potential presence of
DNAPL may limit effectiveness of ISCO and could lead to rebound contamination in groundwater.
Confirmatory sampling will be conducted to verify cleanup. After compliance with groundwater standards
is achieved, residual risk would be within an acceptable range.
Reduction of Toxicity, Mobility, and Volume Through Treatment
Contaminants in the vadose zone and in saturated soil and groundwater will be destroyed through
chemical oxidation producing innocuous substances such as carbon dioxide, water, and inorganic
chloride. Short term water quality may be degraded by injection of permanganate, including purple color,
addition of manganese, and pH changes. However, over time these conditions will be buffered by
WA#157-DFSCRPT-0906-500 52
groundwater flow and reactions occurring in the subsurface. Once removed or destroyed, the reduction
of the mass and volume of TCE in soil and groundwater is permanent.
Short-Term Effectiveness
During building demolition and excavation of soil above the water table, limited risk to construction
workers exists due to use of heavy equipment and direct exposure to contamination. Limited risk to the
community would be posed by truck traffic. Excavation and treatment of unsaturated soil by chemical
oxidation will be completed in the first year. Potassium permanganate powder poses an inhalation
hazard, and site workers should be dressed in Level C PPE, during execution of chemical oxidation of
contamination in unsaturated soil. Steam may be generated by exothermic oxidation reactions, which
may contain elevated concentrations of VOCs creating an inhalation risk to site workers and potentially
nearby residents. Air monitoring should be included to ensure a safe breathing environment for site
workers and that VOCs are not migrating off-site.
During the implementation of ISCO, expected to occur in three injections conducted over a three year
period, minimal risk would be posed to the local community and ecosystems. Contaminant destruction
would occur in-situ. Minimal risk is posed to workers constructing the alternative and maintaining the
mechanical systems once in place. Care must be taken when handling oxidants; however, the periodic
injections of the permanganate will pose minimal risk to the workers.
Implementability
The technologies employed in this alternative are well proven to have been technically feasible at similar
sites. Services such as demolition and excavation, drilling and pressure injection are readily available.
Techniques are well established to monitor the effectiveness of the alternative.
Cost
The primary capital costs associated with this alternative are demolition of the main Valley building,
excavation and treatment of contaminated unsaturated soil with permanganate, and installation of ISCO
injection wells. Labor and materials for ISCO injections were included as O&M expenses as three
injections were assumed over a period of three years. Additional O&M costs include performance
monitoring, procurement, and project management. An additional consideration includes the potential
decrease of operation of the GWTF as a result of source area remediation. It is estimated that following
completion of source remediation (five years), the GWTF will continue to operate for approximately 10
additional years after completion of source remediation activities to remove residual contamination in the
plume. Costs for this alternative are developed in Tables 6-2 and are compared with other alternatives in
Table 6-7.
WA#157-DFSCRPT-0906-500 53
State Acceptance
It is anticipated that the State regulatory agencies will accept this alternative.
Community Acceptance
There would be some short-term impacts on residences in the immediate vicinity of the Site during
demolition and excavation, including noise and dust associated with excavation of soils. Also, some truck
traffic will impact local roadways during removal of debris and mobilization of remediation equipment to
the Site. However, it is anticipated that the community will likely accept this alternative since
contaminants will be permanently destroyed.
6.4.2 Alternative 1B: Excavation/Disposal of unsaturated soils and In-situ Chemical Oxidation
This alternative is identical to Alternative 1A, with the exception that unsaturated soil exceeding the
proposed cleanup goal of 77 mg/kg would be excavated and disposed off-site. It is assumed that when
disposed off-site, excavated soil would be RCRA listed hazardous waste (F001), although not all of the
soil is expected to be hazardous in nature. Clean fill would be used to backfill the excavation. Including
post-remedial monitoring, the period of performance for this alternative is estimated to be five years. The
components of this alternative are presented in general detail as part of the cost estimate in Table 6-3.
Overall Protection of Human Health and the Environment
Excavation of unsaturated Source Area soils with disposal will eliminate potential for contaminants to
continue to leach into groundwater and risks associated with direct exposure and inhalation. Treatment
of groundwater will occur by injecting an oxidant to destroy contaminants in-place. It is projected that this
action will reduce the contaminant concentrations in groundwater over time. Overall, this alternative will
provide a high degree of protection of human health and the environment.
Compliance with ARARs
Over time, the aquifer will achieve compliance with chemical specific ARARs for the chemicals of concern
over most of the Source Area.
Long-Term Effectiveness and Permanence
Excavation provides an effective and permanent solution for soil in the unsaturated zone. The complex
hydrogeologic conditions beneath the Site may make it uncertain whether some areas within the
saturated zone have been restored to appropriate standards. The geology and hydrogeology present
several key challenges, and successful delivery of the oxidant to the contaminant, the primary factor
WA#157-DFSCRPT-0906-500 54
controlling performance of the remedy, will be dependent upon geologic conditions, transport, and natural
oxidant demand in the subsurface. Relatively low PSOD values from analysis performed on saturated
soil prior to the pilot testing, provided further evidence that chemical oxidation by permanganate would be
favorable within groundwater below the Groveland Wells Source Area. In addition, the potential presence
of DNAPL may limit effectiveness of ISCO and could lead to rebound contamination in groundwater.
Confirmatory sampling will be conducted to verify cleanup. Once compliance with groundwater standards
is achieved, residual risk would be within an acceptable range.
Reduction of Toxicity, Mobility, and Volume Through Treatment
Contaminants in the vadose zone will be removed from the Site through excavation, but will not be
destroyed with off-site disposal. Contaminants in the groundwater will be destroyed through chemical
oxidation producing innocuous substances such as carbon dioxide, water, and inorganic chloride. Short
term water quality may be degraded by injection of permanganate, including purple color, addition of
manganese, and pH changes. However, over time these conditions will be buffered by groundwater flow
and reactions occurring in the subsurface. Once removed or destroyed, the reduction of the mass and
volume TCE in groundwater and saturated soils is permanent.
Short-Term Effectiveness
During building demolition and excavation of soil above the water table, limited risk to construction
workers exists due to use of heavy equipment and direct exposure to contamination. Limited risk to the
community would be posed by truck traffic. Excavation and disposal of unsaturated soil would be
completed in the first year.
During the execution of chemical oxidation, expected to occur in three injections conducted over a three
year period, minimal risk would be posed to the local community and ecosystems. Treatment would
occur in-situ. Minimal risk is posed to workers constructing the alternative and maintaining the
mechanical systems once in place. Care must be taken when handling oxidants, however, the periodic
injections of the permanganate would pose minimal risk to the workers.
Implementability
The technologies employed in this alternative are well proven to have been technically feasible at similar
sites. Services such as demolition and excavation, drilling and pressure injection are readily available.
Techniques are well established to monitor the effectiveness of the alternative.
WA#157-DFSCRPT-0906-500 55
Cost
The primary capital costs associated with this alternative are demolition of the main Valley building,
excavation and disposal of unsaturated soils with TCE contamination exceeding 77 mg/kg as a listed
RCRA waste (F001), and installation of ISCO injection wells. Labor and materials for ISCO injections
were included as O&M expenses as three injections were assumed over a period of three years.
Additional O&M costs include performance monitoring, procurement, and project management. An
additional consideration includes the potential decrease of operation of the GWTF as a result of source
area remediation. It is estimated that following completion of source remediation (five years), the GWTF
will continue to operate for approximately 10 additional years after completion of source remediation
activities to remove residual contamination in the plume. Costs for this alternative are developed in
Tables 6-3 and are compared with other alternatives in Table 6-7.
State Acceptance
It is anticipated that the State regulatory agencies would accept this alternative.
Community Acceptance
There would be some short-term impacts on residences in the immediate vicinity of the Site during
demolition and excavation, including noise and dust associated with excavation of soils. Also, heavy
truck traffic would impact local roadways during removal of contaminated soil and delivery of clean fill.
However, it is anticipated that the community would likely accept this alternative since contaminants
would be permanently removed or destroyed.
6.4.3 Alternative 2: Excavation/Oxidation of Unsaturated Soils and Enhanced Biodegradation
This alternative includes excavation and treatment of impacted soils above the water table and in-situ
treatment below the water table in an attempt to achieve proposed cleanup levels. Treatment by
chemical oxidation of Source Area soils would eliminate potential for contaminants to continue to leach
into groundwater. Contamination in the saturated zone would be destroyed in-situ by bioremediation via
enhanced reductive dechlorination. By removing the source of constituents impacting the Site and
decreasing the mass of contaminants in Source Area groundwater, it is anticipated that a decrease in the
number of years of GWTF operation would be realized and overall Site remediation would be achieved in
a more timely manner.
Similar to Alternative 1A, excavation and treatment by chemical oxidation of unsaturated soils with TCE
concentrations above the 77 g/kg TCE proposed cleanup goal was considered. The areas and volumes
of soil would be the same as described for Alternative 1A, and would include the demolition of the main
WA#157-DFSCRPT-0906-500 56
building. The goal for enhanced reductive dechlorination is to achieve significant mass removal of
contamination in groundwater.
Treatment of groundwater would occur by amending the groundwater to create reducing groundwater
conditions conducive to the progressive dechlorination of TCE. Injection of an electron donor, such as
soluble oil, molasses, or a proprietary material such as HRC® would be conducted to stimulate biological
activities and create more reducing conditions. It is possible that during the reduction, chemical species
that are considered more toxic, such as vinyl chloride, would accumulate and would require additional
amendment before being further reduced. Laboratory analysis should be performed to determine if
sufficient concentrations of dehalogenating microbes (Dehalococcoides) and vinyl chloride reductase
enzyme are present. To increase rates of degradation, injection of a microorganism culture that can fully
dechlorinate TCE to ethene is recommended, and this culture would likely be added during the second,
and possibly the third, round of injection after observation of reducing conditions. Microbial degradation
rates are optimal within a pH range of 6 to 8. Injected soluble oil would likely have to be buffered for pH,
due to slightly acidic groundwater (see pre-treatment pH results in Table 5-1) and that soluble oil can
lower pH in groundwater [M&E experience with reductive dechlorination].
Creating reducing conditions in the groundwater and saturated soil may be slowed or inhibited by
application of a strong oxidant to unsaturated soils. Permanganate applied to unsaturated soils should be
consumed by oxidation of TCE and natural organic matter. To minimize the potential for residual
permanganate in unsaturated soil to stop inhibit generation of reducing conditions in groundwater,
treatment of unsaturated soil should be completed prior to commencement of in-situ injections. It is
recommended that a period of six months be allowed after soil treatment before injecting soluble oil or
another electron acceptor.
This alternative may result in temporary mobilization of some metals, including arsenic, due to reducing
conditions generated in the aquifer. If metals are mobilized from the Source Area, it is anticipated that
they would be removed via the groundwater extraction and treatment system. Monitoring should be
performed prior to commencement of groundwater remedial activities and during performance monitoring
to evaluate this potential effect. Some of the materials to be injected would require special handling
although the hazard is considered low. The required equipment above the ground surface is minimal and
temporary.
Equipment requirements would be similar to those identified for ISCO. An injection system consisting of
chemical tanks, pumps, piping, fittings, and controls would be constructed to inject the electron donor and
inoculant into approximately 50 subsurface injection points. The injection wells would be spaced
approximately five to ten feet apart, based on observations of the NaMnO4 pilot test performed in July
2006, and, in some locations, separate wells screened at different depths may be necessary in order to
maximize the distribution of the treatment materials. Use of soluble oil as an electron donor has been
WA#157-DFSCRPT-0906-500 57
assumed for the cost estimate. It has also been assumed that an inoculant microorganism culture would
be injected during the second and third years of operation.
Post-injection monitoring of the electron donor would be performed to evaluate the distribution of the
electron donor in the subsurface, assess contaminant destruction, and determine progress towards
attainment of the cleanup objectives. It is estimated that as many as three injections may be required to
complete treatment of the entire area of the plume. Monitoring of biological degradation parameters,
including ethene, ethane, methane, and chloride, as well as VOCs and some metals, would be conducted
annually following injection and for up to two years after completion of injection to monitor remedial
progress.
Once VOC concentrations throughout the treatment zone meet the cleanup goals, groundwater
monitoring for VOCs and metals would be conducted on a quarterly basis for up to three years to confirm
that concentrations of VOCs do not rebound, and that no metals were mobilized as a result of the electron
donor injection. After one year of post-remedial monitoring has verified attainment of the remedial
objectives, the remedial action completion report for the Site would be prepared, and the injection system
would be decommissioned.
Including post-remedial monitoring, the period of performance for this alternative is estimated to be seven
years [Weston Solutions, 2005]. The components of this alternative are presented in general detail as
part of the cost estimate in Table 6-4.
Overall Protection of Human Health and the Environment
Excavation of unsaturated Source Area soils with on-site treatment would eliminate potential for
contaminants to continue to leach into groundwater. Enhanced reductive dechlorination of the Source
Area groundwater would accelerate cleanup of the aquifer to conditions that are protective of human
health and the environment.
Compliance with ARARs
Over time, it is expected that the aquifer would achieve compliance with ARARs for the chemicals of
concern over most of the Site. Incomplete degradation may occur if conditions are not sufficiently
reducing or there are insufficient electron donors or dehalogenating microbes available. Some of the
degradation products are considered more toxic than the parent compounds being addressed, notably
vinyl chloride.
WA#157-DFSCRPT-0906-500 58
Long-Term Effectiveness and Permanence
Once compliance with groundwater standards is achieved, residual risk would be within an acceptable
range. The possibility exists that complete degradation may not occur, resulting in chemicals that have
greater toxicity (vinyl chloride). Microbes can only degrade aqueous contamination and have limited
success degrading pure product (DNAPL) which can be lethal to microbes. Enhanced biodegradation
rates may be limited by slightly acidic groundwater observed (pH 5.5 to 6.5), and a pH buffer would likely
need to be added to create conditions more amenable to microbial activity. In addition, the complex
hydrogeologic conditions beneath the Site may make it uncertain whether some areas have been
restored to appropriate standards.
Reduction of Toxicity, Mobility, and Volume Through Treatment
TCE would be progressively reduced within the treatment zones. During this process compounds that
may be considered more toxic would be produced, including vinyl chloride. With progressively more
reducing conditions and sufficient population of the necessary microbes, vinyl chloride would degrade.
Short term water quality may be degraded (pH changes, toxic reaction by-products, and/or mobilization of
metals) as a result of injection. However, over time these conditions would be buffered by the
groundwater. Once destroyed, the reduction of the TCE is permanent. The residual TCE in the majority
of the plume would be below appropriate standards.
Short-Term Effectiveness
During the execution of this alternative, expected to be seven years, minimal risk would be posed to the
local community and ecosystems. Excavation and treatment of unsaturated soil by chemical oxidation
would be completed in the first year. Potassium permanganate powder poses an inhalation hazard, and
site workers should be dressed in Level C PPE during execution of chemical oxidation of contamination in
unsaturated soil. Steam may be generated by exothermic oxidation reactions, which may contain
elevated concentrations of VOCs creating a potential inhalation risk to site workers and nearby residents.
Air monitoring should be included to ensure a safe breathing environment for site workers and that VOCs
are not migrating off-site. Treatment of groundwater and soil below the groundwater table would occur in-
situ. Accumulation of degradation products including vinyl chloride may occur. This would be addressed
through the normal course of operation by the addition of microbes capable of complete dechlorination to
ethene. Minimum risk is posed to workers constructing the alternative and maintaining the mechanical
systems once in place. Periodic injections of the electron donor would be required posing minimal risk to
the workers.
WA#157-DFSCRPT-0906-500 59
Implementability
This alternative is reasonably well proven to have been technically feasible at similar sites. Techniques
are well established to monitor the effectiveness of the alternative. There are several technology vendors
that sell proprietary formulations of electron donors and/or dehalogenating microbes. Each of these has
unique benefits, some of which may be appropriate for this Site. There are several companies with
experience with the technology that utilize non-proprietary materials such as molasses, lactate, and
soluble oils to serve as electron donors and control the chemical conditions.
Cost
The primary capital costs associated with this alternative are demolition of the main Valley building,
excavation and treatment of contaminated unsaturated soil with permanganate, a treatability study for
enhanced biodegradation, and installation of injection wells. Labor and materials for injection of
microbes, nutrients, electron donors, and soluble oils were included as O&M expenses as several
injections were assumed over a period of three years. Additional O&M costs include performance
monitoring, procurement, and project management. An additional consideration includes the potential
decrease of operation of the GWTF as a result of source area remediation. It is estimated that following
completion of source remediation (seven years), the GWTF will continue to operate for approximately 10
additional years after completion of source remediation activities to remove residual contamination in the
plume. Costs for this alternative are developed in Tables 6-4 and are compared with other alternatives in
Table 6-7.
State Acceptance
It is anticipated that the State regulatory agencies would accept this alternative.
Community Acceptance
There would be some short-term impacts on residences in the immediate vicinity of the Site during
demolition and excavation, including noise and dust associated with the excavation of soils. Also, some
truck traffic would impact local roadways during removal of debris and mobilization of remediation
equipment to the Site. However, it is anticipated that the community would likely accept this alternative
since contaminants would be permanently removed or destroyed.

WA#157-DFSCRPT-0906-500 60
6.4.4 Alternative 3: In-Situ Gaseous Oxidation of Vadose Zone Soils/In-Situ Chemical Oxidation ofGroundwater and Saturated Soils.
This alternative includes destruction of contaminants through in-situ gaseous chemical oxidation via
ozone injection in impacted soils above the water table and ISCO using sodium permanganate below the
water table in an attempt to achieve a permanent solution.
In-situ gaseous chemical oxidation in the vadose zone is accomplished through delivery of a reactant gas,
ozone, to the subsurface. No additional chemical reagents are required since ozone is produced on-site
from air or oxygen passed through a commercially available generator. Ozone is injected into the
subsurface under pressure produced by the generator. Utilities required include water and electrical
power. The process can be enhanced by coating injected ozone gas with hydrogen peroxide
(Perozone ). Injection wells would be installed at several depths throughout the Source Area vadose
zone. Depths would be selected to target areas where high levels of contamination remain. Specifically,
ozone would be injected directly into or just below the loamy soil horizon and into and just below the clay,
where highest levels of TCE were detected, as well as at other depths where concentrations exceed
proposed cleanup levels. A Perozone system was used as the basis for the cost estimate since the
combination of ozone and peroxide would be expected to provide a higher degree of treatment than
ozone alone. To remediate soil with TCE concentrations exceeding the 77 g/kg proposed cleanup goal
for TCE, approximately 25 injection wells would be required [Kerfoot Technologies, 2005]. The target
remediation volume would be approximately 4,400 cubic yards, similar to that described in Section 6.4.1
for Alternative 1A (Figure 6-1). Applying this in-situ technology for remediation of unsaturated soils using
injection points would preclude the need for demolition of the main Valley building to access all
contamination. It is assumed that most of the vadose zone remediation would occur during the first year
of operation; however, operation may need to continue into years two and three in some more
heterogeneous soil and/or lower permeable areas. Soil sampling would be periodically conducted to
monitor progress.
Groundwater remediation would occur by applying ISCO. The goal for chemical oxidation of
contamination in groundwater is to achieve significant mass removal, with the intent of eventually
achieving MCLs. As the basis for this analysis, chemical oxidation using sodium permanganate was
considered for saturated soils and groundwater. See Section 6.4.1, Alternative 1A, for details of the
permanganate injection system.
Including post-remedial monitoring, the period of performance for this alternative is estimated to be five
years. The components of this alternative are presented in general detail as part of the cost estimate in
Table 6-5.
WA#157-DFSCRPT-0906-500 61
Overall Protection of Human Health and the Environment
In-situ oxidation via ozone injection is expected to destroy contaminants in the vadose zone soil over
time, effectively eliminating the potential for continued leaching from soil into groundwater. There is the
potential that some areas may not be effectively remediated to proposed cleanup levels, however,
periodic soil sampling should identify areas requiring further treatment. Treatment of groundwater would
occur by injecting an oxidant to destroy contaminants in-place. It is projected that this action would
reduce the contaminant concentrations in groundwater over time. Overall, this alternative would provide
protection of human health and the environment.
Compliance with ARARs
Over time, the aquifer would achieve compliance with chemical specific ARARs for the chemicals of
concern over most of the Source Area.
Long-Term Effectiveness and Permanence
Chemical oxidation, via ozone injection in the vadose zone and permanganate injection in groundwater,
provides an effective and permanent solution for the Source Area soil and groundwater. Delivery of the
oxidant to the contaminant is the primary factor controlling performance of the remedy for both ozone and
permanganate. The complex geologic and hydrogeologic conditions beneath the Site may make it
uncertain whether some areas both within the vadose and saturated zone have been restored to
appropriate standards. TCE concentrations in unsaturated soil above, below, and in the clay layer
exceed the proposed cleanup goal, and this clay layer and heterogeneities within the vadose zone soils
may inhibit the ability of gaseous ozone to reach the contamination. Confirmatory sampling would be
conducted to verify cleanup. Once compliance with groundwater standards is achieved, residual risk
would be within an acceptable range.
Reduction of Toxicity, Mobility, and Volume Through Treatment
Contaminants in the vadose zone and in the groundwater would be destroyed through chemical oxidation
producing innocuous substances such as carbon dioxide, water, and inorganic chloride. Short term water
quality may be degraded by injection of permanganate. However, over time these conditions would be
buffered by the groundwater. Once removed or destroyed, the reduction in mass of TCE is permanent.
Short-Term Effectiveness
During the execution of chemical oxidation, expected to occur in three injections conducted over a three
year period, minimal risk would be posed to the local community and ecosystems. Treatment would
occur in-situ. Minimal risk is posed to workers constructing the alternative and maintaining the
WA#157-DFSCRPT-0906-500 62
mechanical systems once in place. Care must be taken when handling oxidants, however, the periodic
injections of the permanganate would pose minimal risk to the workers.
Implementability
The technologies employed in this alternative are well proven to have been technically feasible at similar
sites. The geology and hydrogeology present several key challenges that may inhibit oxidant delivery.
Services for drilling, ozone generation, and pressure injection are readily available. Techniques are well
established to monitor the effectiveness of the alternative.
Cost
The primary capital costs associated with this alternative are treatability testing for ozone injection and
installation of ISCO injection wells. Labor and materials for ozone and ISCO injections, including ozone
generation, were included as O&M expenses as three ISCO injections were assumed over a period of
three years. Additional O&M costs include performance monitoring, procurement, and project
management. An additional consideration includes the potential decrease of operation of the GWTF as a
result of source area remediation. It is estimated that following completion of source remediation (five
years), the GWTF will continue to operate for approximately 10 additional years after completion of
source remediation activities to remove residual contamination in the plume. Costs for this alternative are
developed in Table 6-5 and are compared with other alternatives in Table 6-7.
State Acceptance
It is anticipated that the State regulatory agencies will accept this alternative.
Community Acceptance
There would be some short-term impacts on residences in the immediate vicinity of the Site during drilling
of injection wells. Installation of the ozone and permanganate injection systems is not expected to cause
much disruption. It is anticipated that the community will accept this alternative.
6.4.5 Alternative 4: In-Situ Thermal Treatment
This alternative involves the installation and operation of an in-situ thermal treatment system for
destruction or removal of VOCs in both the unsaturated and saturated soils. Several technologies are
available; however, this evaluation was based on use of either ERH or ISTD since these technologies
have been shown to perform well at other sites with heterogeneous and low-permeability soils.
Remediation of the Groveland Source Area using ERH would involve the installation of electrodes,
installed from 6 feet to 45 feet below ground surface. A 2,000 kW power control unit would be used to
WA#157-DFSCRPT-0906-500 63
direct three-phase electrical power into the treatment area. Vapor recovery wells would be co-located
with the electrodes to remove vapors to an above grade treatment system. It is assumed that VOCs
would be removed from extracted vapors via carbon and that spent carbon would be regenerated off-site.
To achieve the 77 g/kg proposed cleanup level in vadose zone soil, approximately 36 electrodes and 36
recovery wells would be required [Thermal Remediation Services, Inc., 2005; Dajak, 2006]. Applying this
in-situ technology for remediation of unsaturated soils using electrodes injection points would preclude
the need for demolition of the main Valley building to access all contamination. The period of operation is
estimated to be approximately five months to reduce contamination below 77 g/kg TCE in soil; additional
time, up to eight months, could be required to achieve MCLs in groundwater [Thermal Remediation
Services, Inc., 2005]. Technology representatives for ERH have made guarantees that groundwater
concentrations will not exceed MCLs; however, such guarantees increase the cost of the technology by
10 to 30 percent [Dajak, 2006].
Remediation using ISTD would involve the installation of ISTD heater wells, steam injection wells, and
water and vapor extraction wells. To achieve the MCLs in groundwater, approximately 35 ISTD heater
wells, 16 steam injection wells, and seven extraction wells would be required [TerraTherm, Inc., 2005]. A
high-temperature resistant cap would be installed where necessary over the treatment area. A steam
generator and electrical distribution gear would be used to provide the steam and electrical power to heat
the wells. Vapors would be treated using a thermal oxidizer and a vacuum blower. Condensate produced
from the operation of either system would be piped to and treated by the Groundwater Treatment Facility.
Depending on the thermal treatment system used, between 4 and 25 gallons per minute of highly
concentrated water would be sent to the GWTF, where contaminants would be destroyed by the existing
UV oxidation system. GWTF operating costs could potentially increase in treating this additional flow,
particularly if VOC concentrations are high in this influent
Overall Protection of Human Health and the Environment.
Through in-situ heating of saturated and unsaturated soils, contaminants will be removed via recovery
wells, and vapors and condensate will be treated on-site. It is projected that this action will reduce the
contaminant concentrations in groundwater over time. Overall, this alternative will provide a high degree
of protection of human health and the environment.
Compliance with ARARs
Over time, the aquifer will achieve compliance with chemical specific ARARs for the chemicals of
concern.
WA#157-DFSCRPT-0906-500 64
Long-Term Effectiveness and Permanence
This remedy is expected to provide an effective and permanent solution for soil in both the unsaturated
and saturated zones. The complex hydrogeologic conditions beneath the Site may make it uncertain
whether some areas within the saturated zone have been restored to appropriate standards; however,
ERH could apply heat preferentially to zones of low permeability (i.e., silts and clays) where TCE was
detected at highest concentrations. Monitoring will be required to confirm that proposed cleanup levels
have been met. Once compliance with groundwater standards is achieved, residual risk would be within
an acceptable range.
Reduction of Toxicity, Mobility, and Volume Through Treatment
TCE and other contaminants will be removed from the subsurface for treatment in the above grade vapor
treatment system and the existing GWTF. Once removed, the reduction of VOCs is permanent.
Short-Term Effectiveness
Once installation is complete, minimal risk would be posed to workers monitoring the system. The ERH
systems produce less than 15 volts of electricity at ground surface, which is below the OSHA standard for
safe working voltages at ground surface of less than 50 volts. An inhalation risk may be posed to nearby
residents if gas extraction wells do not function properly; periodic air monitoring would be performed to
ensure that VOCs in air do not increase to hazardous concentrations as a result of thermal remediation.
Implementability
A number of case studies indicate that the thermal remediation technologies identified in this alternative
have performed well at similar sites [TerraTherm, 2005; Dajak, 2006]. Utilities required by the
technologies, including 3-phase, 480 volt power, water, and natural gas, are available at the Site. There
are a limited number of vendors that provide the technologies.
Cost
The primary capital costs associated with this alternative are installation and implementation of the
thermal treatment technology, including electrodes, electricity, and carbon [Dajak, 2006]. O&M costs
include system operation, performance monitoring, confirmatory sampling, and project management. An
additional consideration includes the potential decrease of operation of the GWTF as a result of source
area remediation. It is estimated that following completion of source remediation (one year), the GWTF
will continue to operate for approximately 10 additional years after completion of source remediation
activities to remove residual contamination in the plume. Costs for this alternative are developed in Table
6-6 and are compared with other alternatives in Table 6-7.

WA#157-DFSCRPT-0906-500 65
State Acceptance
It is anticipated that the State regulatory agencies will accept this alternative.
Community Acceptance
There would be some short-term impacts on residences in the immediate vicinity of the Site during drilling
for installation of electrodes. A community relations fact sheet and information session will likely be
necessary to address concerns and respond to questions about the use of heat and, possibly, electrical
voltage in the Source Area. However, it is expected that the community will accept this alternative since
contaminants will be permanently removed.
6.5 Comparative Analysis
A comparison of the alternatives is presented in Table 6-8. All of the alternatives considered will result in
permanent removal or destruction of TCE and other VOC contaminants; however, under Alternative 1B,
contamination in unsaturated soil would be removed but not destroyed. With Alternatives 1A, 1B, and 2
demolition of the main Valley building would likely be required to access all contaminated soil Alternatives
1A, 1B, and 2; Alternatives 3 and 4 would apply only in-situ remedial technologies and would likely not
require demolition. In the case of Alternative 2 (Enhanced Biodegradation), it is possible that vinyl
chloride will accumulate under certain circumstances requiring further amendment additions to create
chemical conditions that are favorable for complete destruction. There is also potential to mobilize certain
metals, including arsenic, in some cases, above regulatory standards, due to the creation of a reducing
and/or acidic environment. Injection of certain amendments used in Alternatives 1A, 1B, 2, and 3 create
minor water quality changes that would be expected to dissipate over a short period of time with mixing
with upgradient groundwater flowing into the Source Area.
Services and equipment needed for Alternatives 1A, 1B, and 3 are widely available, and the market is
relatively competitive. The solutes required for Alternative 2 are also available although there are only a
few suppliers of commercial proprietary electron donors and inoculants. Different media, such as soluble
oils, molasses or lactate, are more widely available on the open market. Material and services for
Alternative 4 are available to a lesser degree than the other alternatives.
The complexity of the soil matrix and hydrogeologic system presents challenges for Alternatives 1A, 1B,
2, and 3. The contamination distribution and hydrogeologic heterogeneities may have less effect on
treatment in Alternative 4.
WA#157-DFSCRPT-0906-500 66
The estimated costs to implement the alternatives are presented in Table 6-7. The additional length of
time estimated to operate the GWTF and continue MOM monitoring is also taken into account based on
performance experience of the remediation technologies evaluated.
WA#157-DFSCRPT-0906-500 67
7.0 REFERENCES
Alliance Technologies Corporation, 1987. Valley Manufactured Products Company - EndangermentAssessment. (Prepared for USEPA). September 1987.
Camp, Dresser and McKee, Inc. (CDM). 1988. Final - Amendment to the Valley Manufactured ProductsCompany Endangerment Assessment. Prepared for USEPA. September 23, 1988.
Carus Chemical Company (Carus).2006. Vendor literature and communications.
Clausen, J., Wessling, E., Hoyt, M., Steams, B., Ramirez, B. (Clausen, et. al.). 2000. Acetone Productionas a Result of Sodium Bisulfate Preservation Using EPA Method 5035. Presented at the 16th AnnualConference on Contaminated Soils, University of Massachusetts. Amherst, MA. October 16-19, 2000.
Connecticut Department of Environmental Protection (CTDEP). 2005. Recommended ReasonableConfidence Protocols, Quality Assurance and Quality Control Requirements, Volatile Organics by Method8260, SW-846, Version 1.0. July 2005. Dajak, LLC. 2006. Vendor literature and communications.
Environmental Research and Technology, Inc. (ERT) 1985. Remedial Investigation for the GrovelandWells Site, Groveland , Massachusetts, Volume I (Prepared for NUS Corporation). June 1985.
Hager GeoScience Inc. 2006. Geophysical Survey. Groveland Wells Superfund Site. May 2006.
Interstate Technology & Regulatory Council (ITRC). 2005. Technical and Regulatory Guidance for In SituChemical Oxidation of Contaminated Soil and Groundwater, 2nd Ed. January 2005.
Kerfoot Technologies, Inc. 2005. Vendor literature and communications.
M. Anthony Lally, Associates (Lally). 1985. Final Remedial Investigation report, Docket No. 84-1027,Valley Manufacturing Products, Co., Inc. March 1985.
M. Anthony Lally Associates (Lally). 1989. Draft Final Report, Soil Vapor Vacuum Extraction SystemTreatability Study, Valley Manufactured Products, Co., Inc. April 1989.
M. Anthony Lally Associates (Lally). 1991. Project Operations Plan for Valley Manufactured Products,Co., Inc. March 1991.
Massachusetts Department of Environmental Protection (MassDEP). Method 1 S-1 Soil CleanupStandards, 310 CMR 40.0975(6)(a), April, 2006.
McGuire, Travis M., McDade, James M., and Newell, Charles J. Newell. (McGuire, et. al.). 2006.Performance of DNAPL Source Depletion Technologies at 59 Chlorinated Solvent-Impacted Sites.Ground Water Monitoring and Remediation 26, no. 1: 73-84. Winter 2006.
Metcalf & Eddy, Inc. (M&E). 2004. Final Sampling and Analysis Plan: Groveland Wells Nos. 1 and 2Superfund Site, Source Area Re-Evaluation. June 2004.
Metcalf & Eddy, Inc. (M&E). 2006. Sampling and Analysis Plan: Groveland Wells Nos. 1 and 2 SuperfundSite, Operable Unit No. 2, Source Area Re-Evaluation. May 2006.
NUS Corporation (NUS). 1991. Supplemental Management of Migration Remedial Investigation Report,Groveland Wells Site. February 1991.
Regenesis. 2006. Vendor literature and communications.
Roy F. Weston, Inc. (RFW). 1988. Draft Feasibility Study for the Cleanup of Volatile Organic CompoundsGroveland Valley Site, Prepared for CDM Federal Programs Corporation as part of the Performance ofRemedial Response Activities at Uncontrolled Hazardous Waste Sites, Contract No. 68-01-06939. 1988.
WA#157-DFSCRPT-0906-500 68
Sentex Systems, Inc. 1994. Instruction / Operation Manual for the Aquascan. Revised September 1994.
Sentex Systems, Inc. 1998. Instruction / Operation Manual for the Scentograph Plus II Portable GasChromatograph. Revised October 1998.
Sentex Systems, Inc. 1999. On-Line Volatile Organic Compound (VOC) Analyzer, SupplementalInformation. July 1999.
Thermal Remediation Services, Inc. 2005. Vendor literature and communications.
TerraTherm, Inc. 2005. Vendor literature and communications.
U.S. Army Corps of Engineers / U.S. Environmental Protection Agency (USACE/USEPA). 2000. A Guideto Developing and Documenting Cost Estimates During the Feasibility Study. USEPA 540-R-00-002. July2000.
U.S. Department of Defense (USDOD). 2002. Federal Remediation Technologies Roundtable (FRTR)Remediation Technologies Screening Matrix and Reference Guide, Version 4, January 2002.
United States Environmental Protection Agency (USEPA). 2004. Statement of Work, Groveland WellsSuperfund Site, Source Area Re-Evaluation (Remedial Design). March 2004.
United States Environmental Protection Agency (USEPA). 2003. National Primary Drinking WaterStandards. Office of Water (4606M). EPA 816-F-03-016. June 2003.http://www.epa.gov/safewater/consumer/pdf/mcl.pdf
United States Environmental Protection Agency (USEPA). 2002. Supplemental Guidance for DevelopingSoil Screening Levels for Superfund Sites. OSWER 9355.4-24. December 2002.
United States Environmental Protection Agency (USEPA). 2000. A Guide to Developing andDocumenting Cost Estimates During the Feasibility Study. EPA540-R-00-002 OSWER 0355.0-75. July,2000.
United States Environmental Protection Agency (USEPA) Region I. 1996. New England Data ValidationFunction Guidelines For Evaluating Environmental Analyses. Office of Environmental Measurement andEvaluation. Revised December 1996.
United States Environmental Protection Agency (USEPA). 1989. Terra Vac In Situ Vacuum ExtractionSystem Applications Analysis Report. USEPA/540/A5-89/003. July 1989
United States Environmental Protection Agency (USEPA). 1988A. Record of Decision (ROD), GrovelandWells OU2. USEPA ID: MAD98732317. September 1988.
U.S. Environmental Protection Agency (USEPA). 1988B. Guidance for Conducting RemedialInvestigations and Feasibility Studies Under CERCLA. USEPA Office of Solid Waste and EmergencyResponse, Washington, D.C. Interim Final, October 1988.
Weston Solutions. Correspondence and telephone communications with Fred Symmes of WestonSolutions. February, 2005.
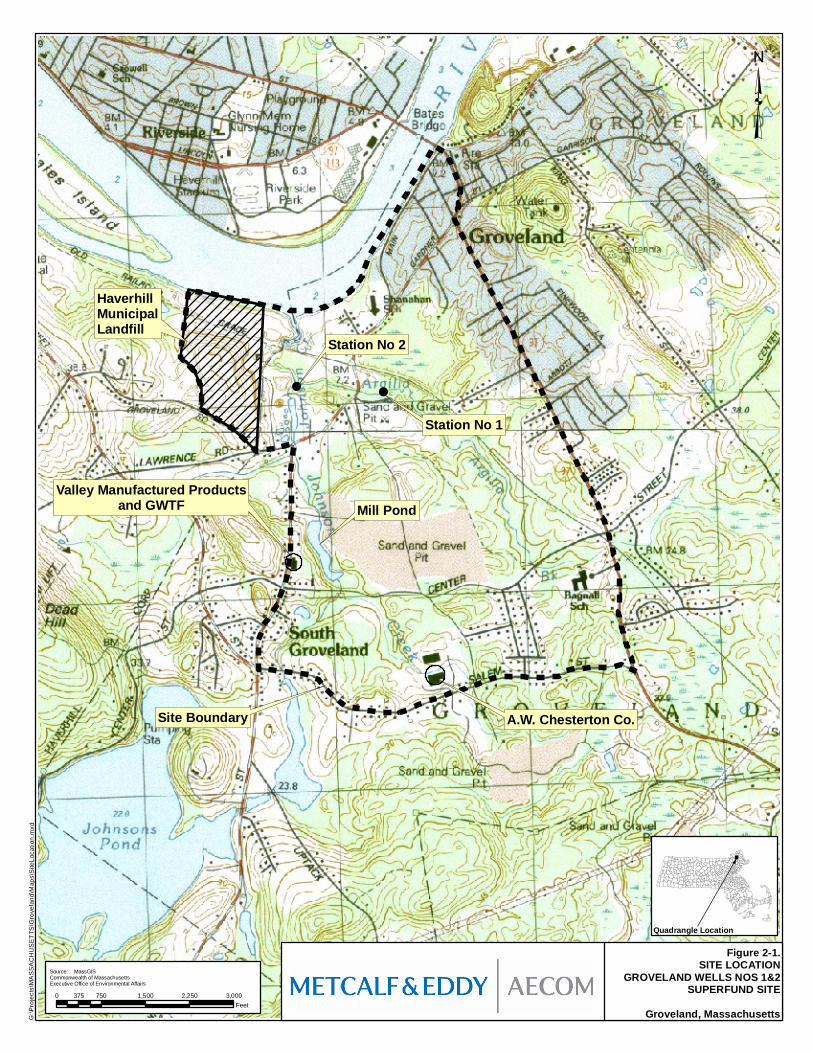
! !
G:\Pr
ojects
\MAS
SACH
USET
TS\G
rovela
nd\M
aps\S
iteLo
catio
n.mxd
³
Figure 2-1.SITE LOCATION
GROVELAND WELLS NOS 1&2SUPERFUND SITE
Groveland, Massachusetts
Station No 1
Station No 2
Mill Pond
A.W. Chesterton Co.Site Boundary
Valley Manufactured Productsand GWTF
HaverhillMunicipalLandfill
0 750 1,500 2,250 3,000375Feet
Source: MassGISCommonwealth of MassachusettsExecutive Office of Environmental Affairs
Quadrangle Location
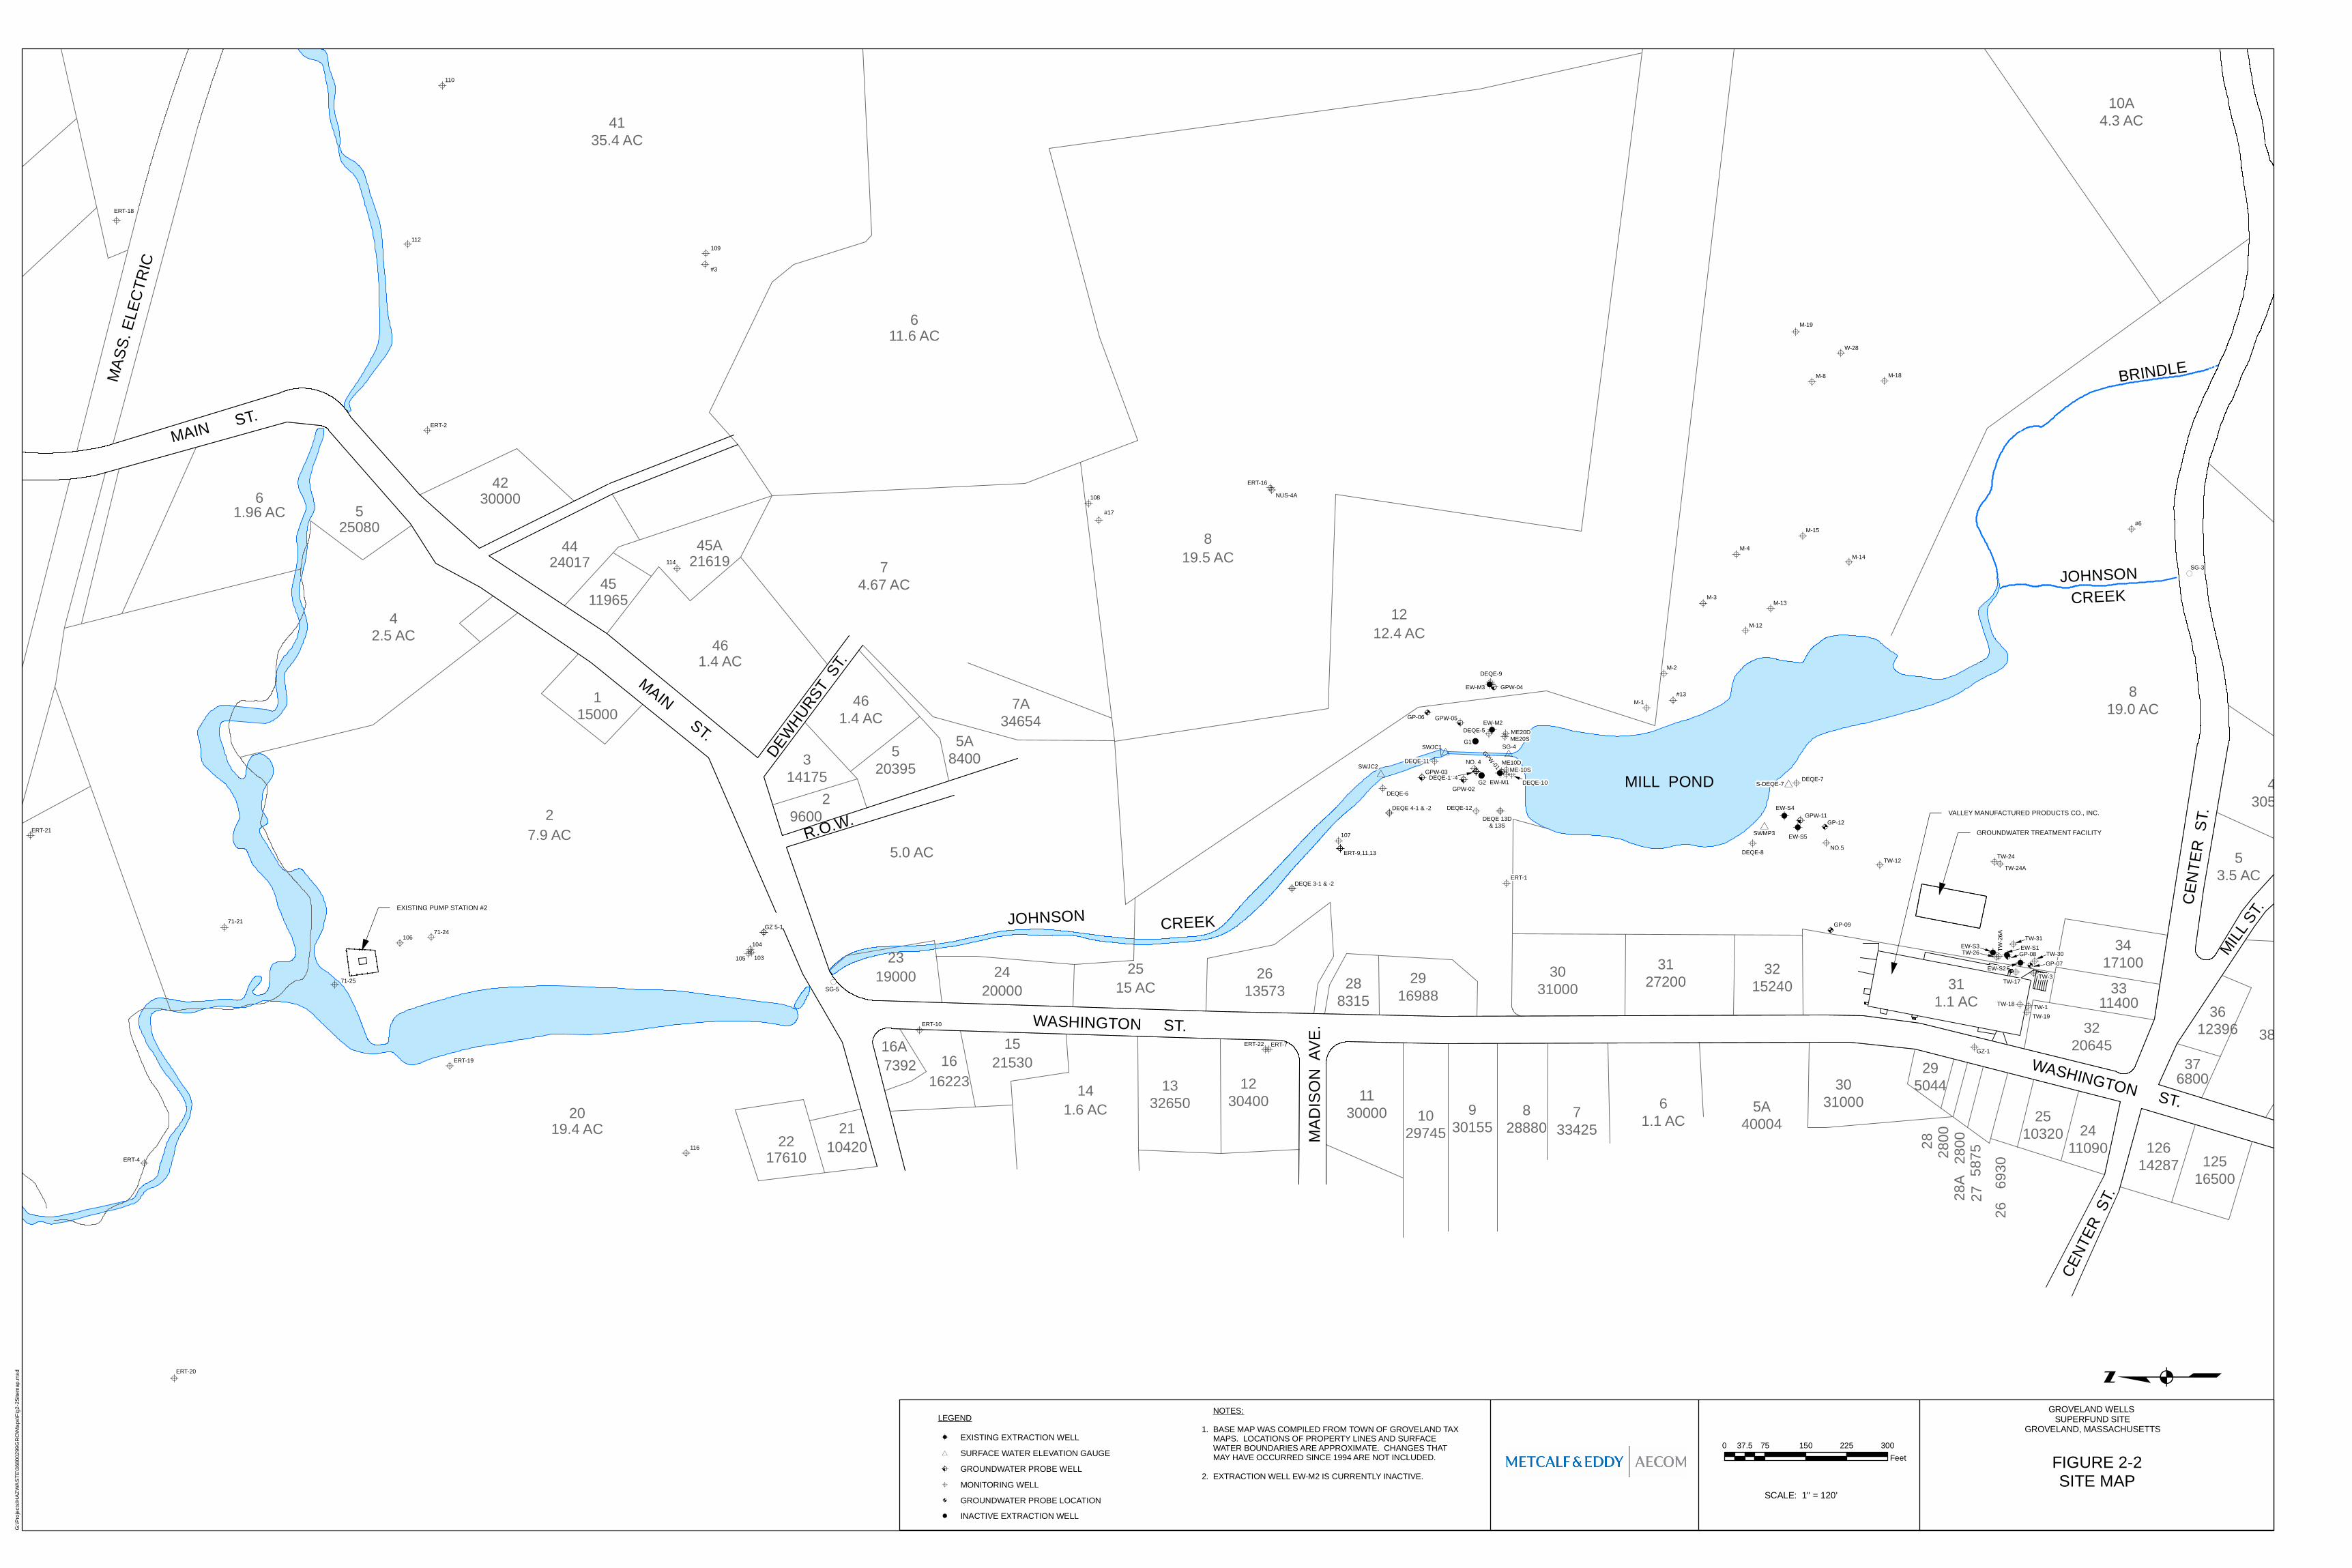
A
A
A
A
AAA A
A
A A
A
A A
A
A A
A
AA
rB
rB
*
*
A!
A
A
A
AAA
A
A
A
A
A
A
A
A
A
*
A!A!
A!
AAA!
A!
A!
A!
*
A
AA
A
A
A
AA
*
A
rB rB AAA !
rB A
rB
A
A A
!
A
AA
A
A
A
A
A
A
A
A A
A
! (
! (
A
A AA
AA
A
A
AA
A
A
A
A
A
A
A
A
A
A
A
A
A
GROUNDWATER TREATMENT FACILITY
JOHNSONCREEK
BRINDLE
CREEKJOHNSON
MAIN ST.
WASHINGTON ST.
5.0 AC
29600
314175
461.4 AC
45A21619
4511965
4424017
4230000
4135.4 AC
611.6 AC
525080
61.96 AC
42.5 AC
27.9 AC
115000 46
1.4 AC
74.67 AC
7A34654
5A84005
20395
2319000 24
2000025
15 AC26
13573
2217610
2019.4 AC 21
10420
16A7392 16
16223
1521530
141.6 AC
1332650
1230400
1212.4 AC
819.5 AC
1130000 10
297459
301558
28880
288315
2916988
3031000
733425
61.1 AC
5A40004
3127200 32
15240
3031000
295044
28 2800
28A
2800
2758
7526
6930
2510320 24
11090
311.1 AC
3220645
3311400
3417100
12614287 125
16500
VALLEY MANUFACTURED PRODUCTS CO., INC.
EXISTING PUMP STATION #2
376800
3612396 38080
10A4.3 AC
430500
53.5 AC
819.0 AC
MASS
. ELE
CTRI
C
MAIN ST.
DEWHURST
ST.
R.O.W.
CENT
ER S
T.MILL
ST.
CENT
ER S
T.
WASHINGTON ST.
MADI
SON
AVE.
MILL POND
G1
G2
M-3
#13
M-2
M-1
107
M-4
#17
M-8
108
GZ-1
M-13
M-12
SG-4
M-18
M-15
M-14
W-28
M-19
TW-1
TW-3
NO.5
TW-26
GP-09
TW-12
GP-12
ME20DME20S
GP-06
ME10DSWJC2
TW-18
EW-M3
EW-S5
EW-M1
EW-M2
EW-S4
EW-S3 EW-S1
DEQE-10
ERT-7
EW-S2
SWMP3
SWJC1
TW-17
NO. 4
TW-24
ERT-1
DEQE-5GPW-05
GPW-01
GPW-02
GPW-03
DEQE-6
ERT-22
NUS-4A
103 GP-08104
ERT-16
GPW-11
GPW-04
TW-26
A
TW-24A
DEQE-7
DEQE-8
DEQE-9
DEQE-12
DEQE-11
DEQE 3-1 & -2
S-DEQE-7
ME-10S
DEQE 4-1 & -2
ERT-9,11,13
TW-30
TW-31
109
#3
114
GZ 5-1
105
SG-5
ERT-10
116
#6
SG-3
TW-19
ERT-19
71-24106
71-25
ERT-4
ERT-20
71-21
ERT-21
ERT-2
112
110
ERT-18
DEQE 13D& 13S
DEQE-1 -4
GP-07
G:\Pr
ojects
\HAZ
WAST
E\368
0029
9GRO
\Map
s\Fig2
-2Site
map.m
xd
GROVELAND WELLS SUPERFUND SITE
GROVELAND, MASSACHUSETTS
FIGURE 2-2SITE MAP
q
SCALE: 1" = 120'
NOTES:1. BASE MAP WAS COMPILED FROM TOWN OF GROVELAND TAX MAPS. LOCATIONS OF PROPERTY LINES AND SURFACE WATER BOUNDARIES ARE APPROXIMATE. CHANGES THAT MAY HAVE OCCURRED SINCE 1994 ARE NOT INCLUDED.2. EXTRACTION WELL EW-M2 IS CURRENTLY INACTIVE.
0 75 150 225 30037.5Feet
LEGENDA! EXISTING EXTRACTION WELL
A MONITORING WELLA GROUNDWATER PROBE LOCATION! INACTIVE EXTRACTION WELL
* SURFACE WATER ELEVATION GAUGE
rB GROUNDWATER PROBE WELL
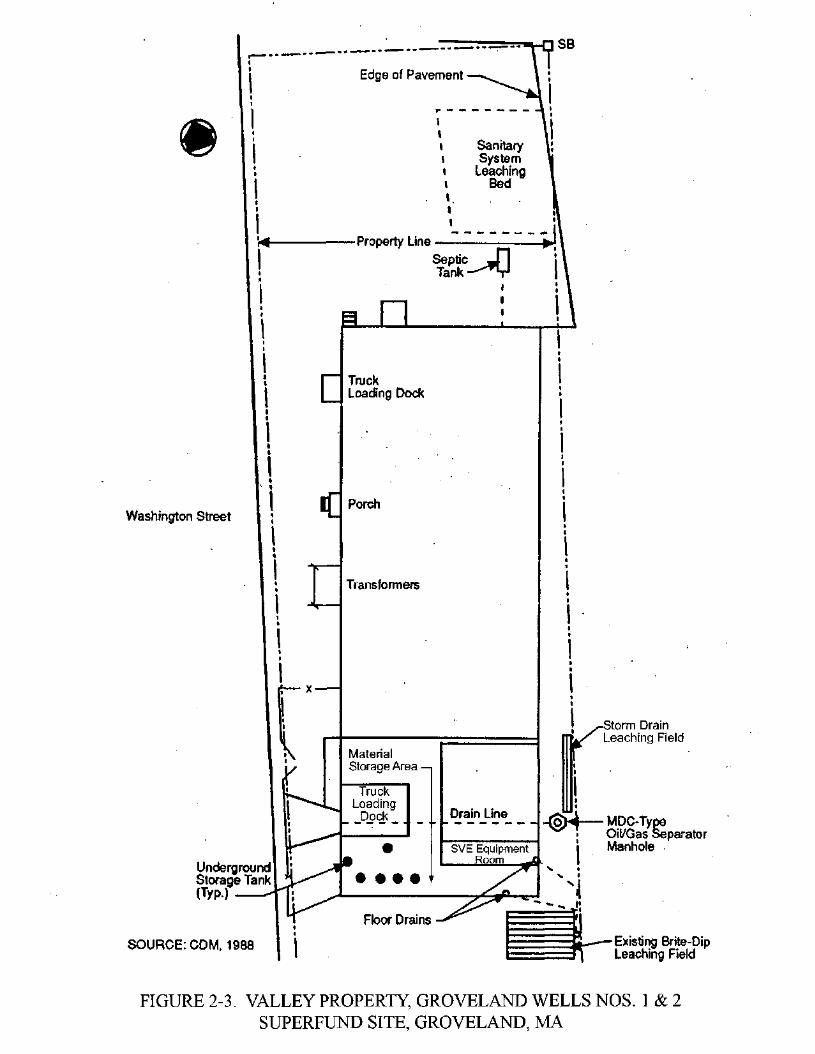
m
Washington Street
Underground Storage Tank (Typ.)
SOURCE: CDM. 1988
Storm Drain Leaching Field
- © H i MDC-Type Oil/Gas separator Manhole
Existing Brite-Dip Leaching Field
FIGURE 2-3. VALLEY PROPERTY, GROVELAND WELLS NOS. 1 & 2 SUPERFUND SITE, GROVELAND, MA
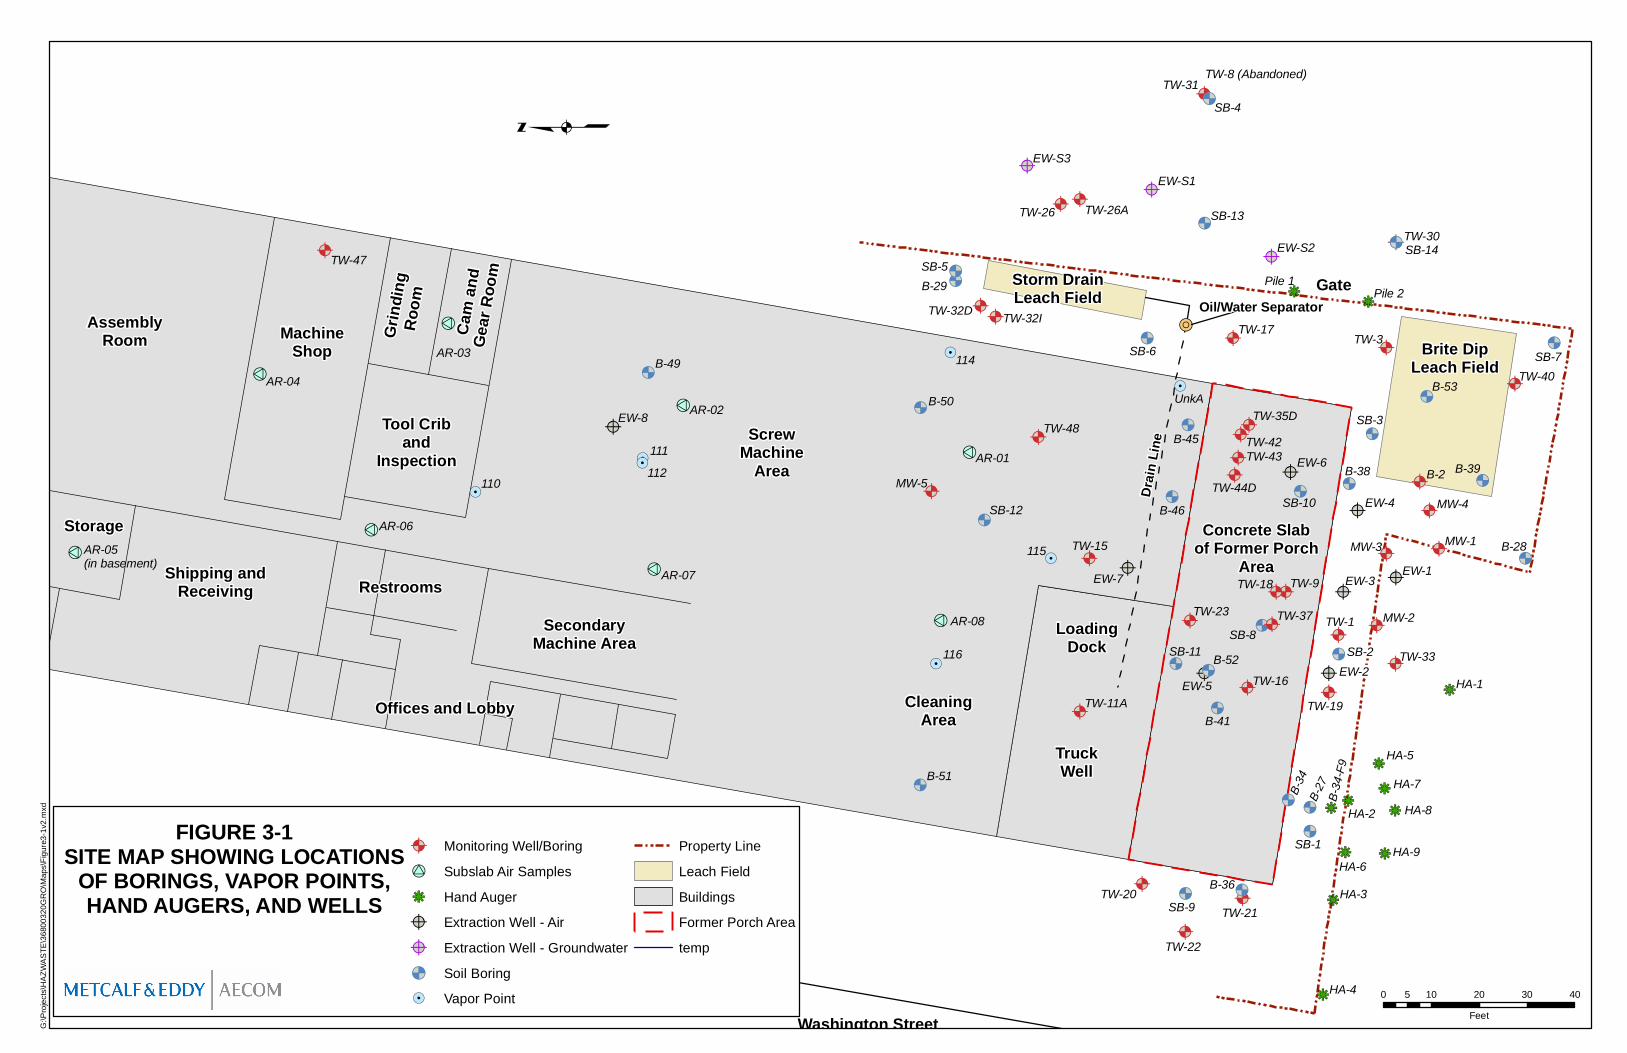
!R
@ A
@ A
@ A
@ A
@ A@ A
@ A@ A
@ A @ A
&<
&<
@ A
@ A
@ A
&<
&<
&<
&<
&<
&<
&<
&<
&<
&<
&<
&<
&<
@ ?
@ ?
@ ?
@ ?
@ ?@ ?
@ ?
@ ?
@ ?
@ ?
&<
&<
@ A
@ A
@ A
@ A
@ A@ A
@ A
@ A
@ A
@ A!.
!.
!.
!.
&<&<
&<
&<
@ A@ A
@ A@ A
@ A
@ A
@ A
&<
&<
&<
&<
&<
&<
@ A
@ A
&<
&<
kj
kjkj
kj
@ A@ A
!U
!U
!U
!U
!U
!U
!U
!U
kj
kj
kj kjkj
kjkj
kj
@ ?
!.!.
!.
HA-5HA-7
HA-8
HA-9HA-6
EW-8
110
111112
Restrooms
TruckWell
Washington Street
Concrete Slabof Former Porch
Area
LoadingDock
Tool Criband
Inspection
MachineShop
Grind
ingRo
om
Cam
and
Gear
Room
ScrewMachine
Area
Shipping andReceiving
SecondaryMachine Area
Offices and Lobby
Storage
AssemblyRoom
CleaningArea
Gate
Brite DipLeach Field
Drain
Line
Oil/Water SeparatorStorm DrainLeach Field
116
115
114
UnkA
MW-4
MW-3
MW-2
MW-1
SB-7
EW-7
EW-6
EW-5
EW-4
EW-3
EW-2
EW-1
SB-9
SB-8
SB-3
SB-2
SB-1
MW-5
TW-3
B-2
TW-1
TW-22
TW-21TW-20
TW-19
TW-23
B-28
EW-S3
EW-S2
EW-S1
SB-13
SB-12
SB-11
SB-10
B-27
TW-26
TW-17
TW-16
TW-15
TW-26A
TW-11A
SB-6
TW-47
B-49
SB-5
TW-48
B-46
B-45
TW-18
TW-35DTW-42TW-43
B-38
TW-9
TW-37
B-52
B-41
TW-33
B-34
B-36
HA-4
HA-3
HA-2
HA-1
B-39
TW-32D TW-32I
TW-40B-53
TW-30SB-14
SB-4TW-31 TW-8 (Abandoned)
B-51
B-29
TW-44D
B-50AR-04
AR-03
AR-06
AR-07
AR-02
AR-05(in basement)
AR-08
AR-01
Pile 1Pile 2
B-34
-F9
G:\Pr
ojects
\HAZ
WAST
E\368
0032
0GRO
\Map
s\Figu
re3-1v
2.mxd
FIGURE 3-1SITE MAP SHOWING LOCATIONS
OF BORINGS, VAPOR POINTS,HAND AUGERS, AND WELLS
q
@A Monitoring Well/Boring!U Subslab Air Sampleskj Hand Auger@? Extraction Well - Air@? Extraction Well - Groundwater&< Soil Boring!. Vapor Point
Property LineLeach FieldBuildingsFormer Porch Areatemp
0 10 20 30 405Feet
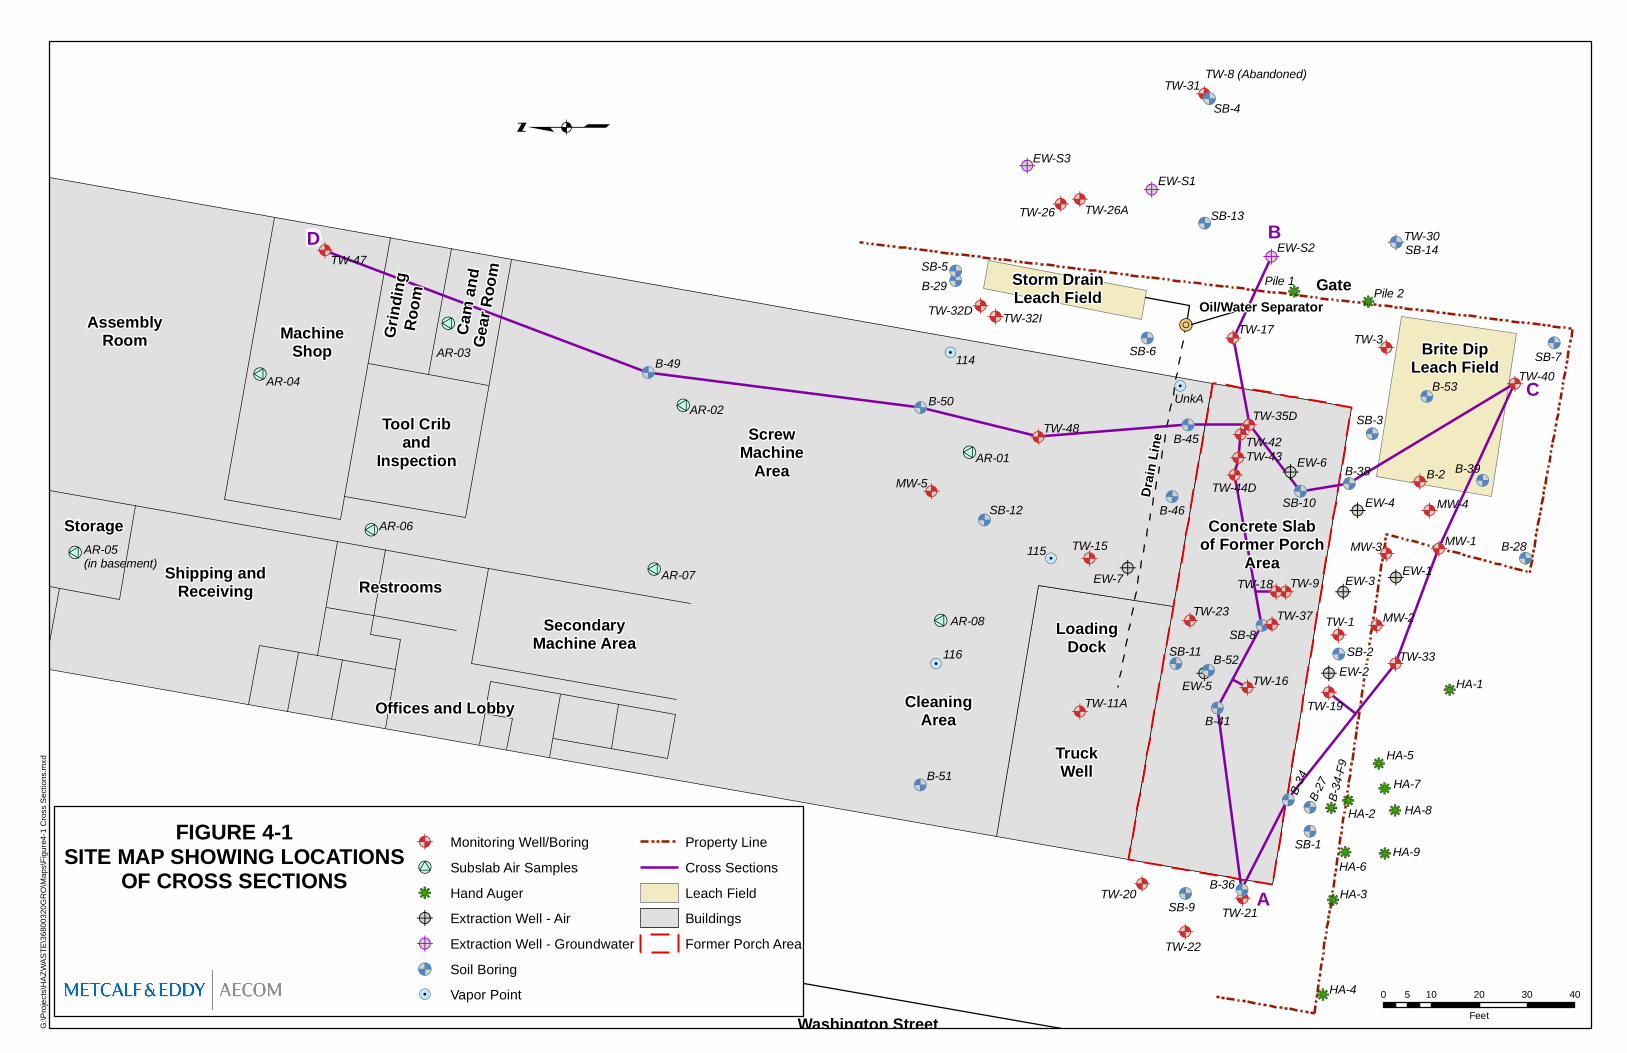
!R
@ A
@ A
@ A
@ A
@ A@ A
@ A@ A
@ A @ A
&<
&<
@ A
@ A
@ A
&<
&<
&<
&<
&<
&<
&<
&<
&<
&<
&<
&<
&<
@ ?
@ ?
@ ?
@ ?
@ ?@ ?
@ ?
@ ?
@ ?
@ ?
&<
&<
@ A
@ A
@ A
@ A
@ A@ A
@ A
@ A
@ A
@ A!.
!.
!.
!.
&<&<
&<
&<
@ A@ A
@ A@ A
@ A
@ A
@ A
&<
&<
&<
&<
&<
&<
@ A
@ A
&<
&<
kj
kjkj
kj
@ A@ A
!U
!U
!U
!U
!U
!U
!U
!U
kj
kj
kj kjkj
kjkj
kj
HA-5HA-7
HA-8
HA-9HA-6
Restrooms
TruckWell
Washington Street
Concrete Slabof Former Porch
Area
LoadingDock
Tool Criband
Inspection
MachineShop
Grind
ingRo
om
Cam
and
Gear
Room
ScrewMachine
Area
Shipping andReceiving
SecondaryMachine Area
Offices and Lobby
Storage
AssemblyRoom
CleaningArea
Gate
Brite DipLeach Field
Drain
Line
Oil/Water SeparatorStorm DrainLeach Field
116
115
114
UnkA
MW-4
MW-3
MW-2
MW-1
SB-7
EW-7
EW-6
EW-5
EW-4
EW-3
EW-2
EW-1
SB-9
SB-8
SB-3
SB-2
SB-1
MW-5
TW-3
B-2
TW-1
TW-22
TW-21TW-20
TW-19
TW-23
B-28
EW-S3
EW-S2
EW-S1
SB-13
SB-12
SB-11
SB-10
B-27
TW-26
TW-17
TW-16
TW-15
TW-26A
TW-11A
SB-6
TW-47
B-49
SB-5
TW-48
B-46
B-45
TW-18
TW-35DTW-42TW-43
B-38
TW-9
TW-37
B-52
B-41
TW-33
B-34
B-36
HA-4
HA-3
HA-2
HA-1
B-39
TW-32D TW-32I
TW-40B-53
TW-30SB-14
SB-4TW-31 TW-8 (Abandoned)
B-51
B-29
TW-44D
B-50AR-04
AR-03
AR-06
AR-07
AR-02
AR-05(in basement)
AR-08
AR-01
Pile 1Pile 2
B-34
-F9
G:\Pr
ojects
\HAZ
WAST
E\368
0032
0GRO
\Map
s\Figu
re4-1
Cros
s Sec
tions
.mxd
FIGURE 4-1SITE MAP SHOWING LOCATIONS
OF CROSS SECTIONS
q
@A Monitoring Well/Boring!U Subslab Air Sampleskj Hand Auger@? Extraction Well - Air@? Extraction Well - Groundwater&< Soil Boring!. Vapor Point
Property LineCross SectionsLeach FieldBuildingsFormer Porch Area
0 10 20 30 405Feet
D B
C
A

25
30
35
40
45
50
55
60
65
70
75
80El
evat
ion
(ft)
B36 B41 SB8
FIGURE 42. CROSSSECTION ABTCE CONCENTRATIONS IN SOIL
929722,48010,80079341819
7,380
98453715094
74283410 U
694
1,4802,2007121,5103,8707717562,1501,750
11,900
643291,0501,33078830138
1117
35469710 U
10 U
10 U
10 U
10 U
1410010 U10 U1110 U
10 U10 U10 U
10 U
10 U
10 U
10 U
10 U
6,70035,8003,3406,200
1813,850
478
50
15,800166
2165,4408,130
21,700
1127224
10 U
TW44D TW43 TW42 TW35D TW17 EWS2
20 feet Horizontal
10 feet Vertical
WEST EASTEAST EAST
LEGEND
Well Screen
Soil Boring(TCE concentrationsin ppb)
664
5
Concrete Slab/Fill
Sand
ClayDense Sand/GravelDense Sand/SiltTillBedrock
Soil/Loam

20
30
40
50
60
70
80
Elev
atio
n (ft
)TW33
B36
FIGURE 43. CROSSSECTION ACTCE CONCENTRATIONS IN SOIL
B34
TW40B39
10 U
10 U
10 U
10 U10 U
10 U
10 U10 U10 U
10010 U10 U1110 U
14 4510 U10,200
10 U10 U10 U
73
10 U10 U10 U10 U
10 U
10 U
10 U
10 U
6210 U
10U
10 U10 U10 U10 U
10 U
10 U
10 U10 U10 U10 U10 U10 U
10 U673
3510 U10 U
2710 U10 U10 U
10 U10 U10 U10 U10 U10 U
10 U
10 U
10 U
10 U10 U10 U
56
10 U
10 U
10 U
10 U
10 U
13
10 U
18
10 U
10 U
10 U
10 U
10 U 20 feet Horizontal
10 feet Vertical
WEST EAST
LEGEND
Well Screen
Soil Boring(TCE concentrationsin ppb)
6645
Concrete Slab/Fill
Sand
ClayDense Sand/GravelDense Sand/SiltTillBedrock
Soil/Loam
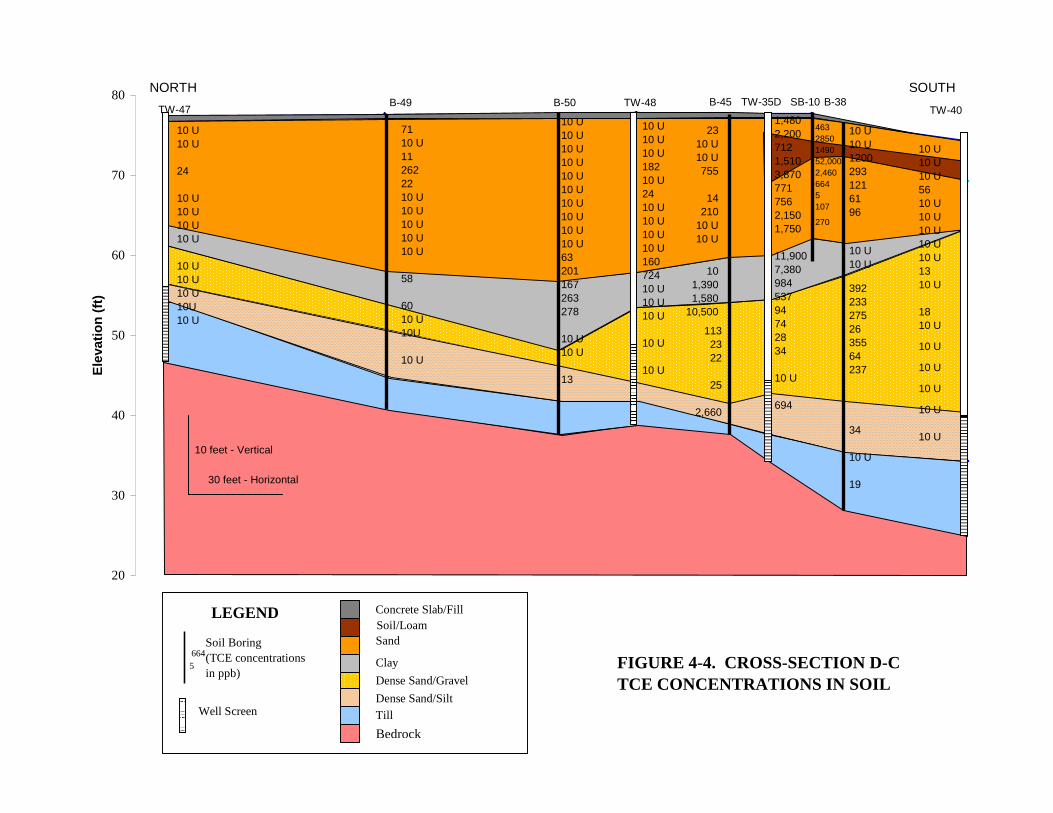
20
30
40
50
60
70
80El
evat
ion
(ft)
10 U10 U12002931216196
10 U10 U
3922332752635564237
34
10 U
19
TW47 B49
FIGURE 44. CROSSSECTION DCTCE CONCENTRATIONS IN SOIL
B50 B38TW35DB45TW481,4802,2007121,5103,8707717562,1501,750
11,9007,38098453794742834
10 U
694
10 U10 U10 U18210 U2410 U10 U10 U10 U16072410 U10 U10 U
10 U
10 U
7110 U112622210 U10 U10 U10 U10 U
58
6010 U10U
10 U
10 U10 U10 U10 U10 U10 U10 U10 U10 U10 U63201167263278
10 U10 U
13
2310 U10 U755
14210
10 U10 U
10 U10 U10 U5610 U10 U10 U10 U10 U1310 U
1810 U
10 U
10 U
10 U
10 U
10 U
TW404632850149052,0002,4606645107
270
SB10
10 U10 U
24
10 U10 U10 U10 U
10 U10 U10 U10U10 U
30 feet Horizontal
10 feet Vertical
NORTH SOUTH
LEGEND
Well Screen
Soil Boring(TCE concentrationsin ppb)
6645
Concrete Slab/Fill
Sand
ClayDense Sand/GravelDense Sand/SiltTillBedrock
Soil/Loam
101,3901,580
10,500
1132322
25
2,660
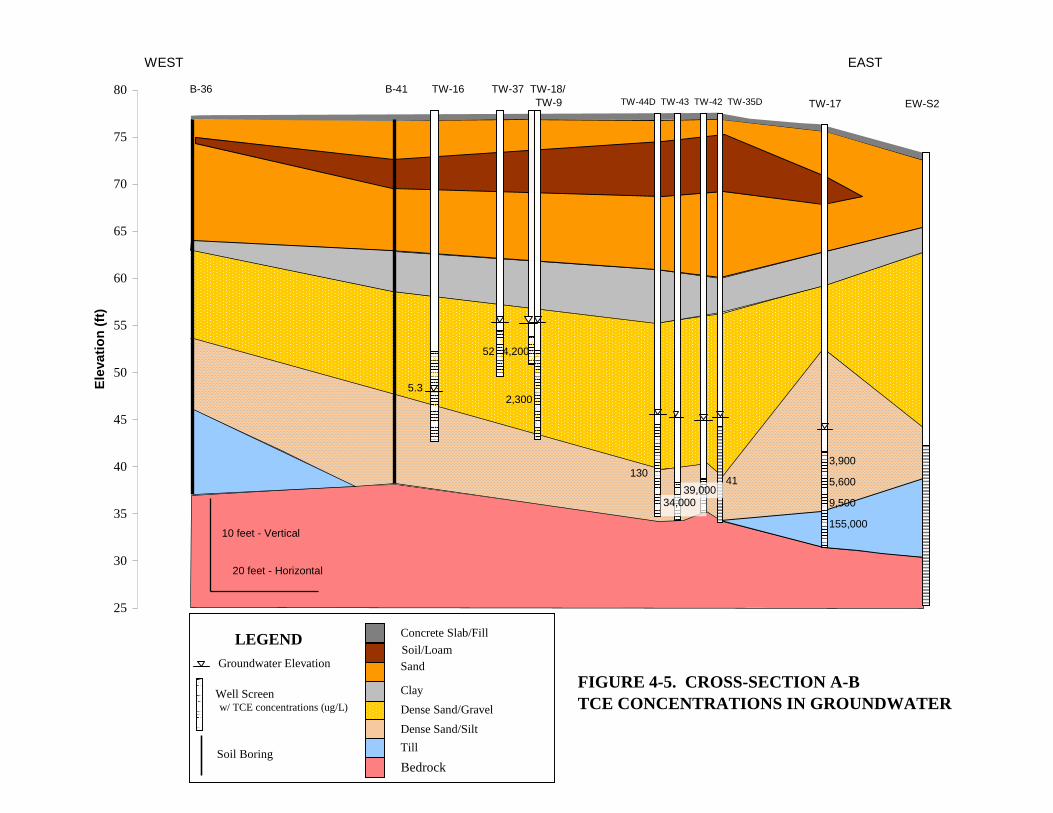
25
30
35
40
45
50
55
60
65
70
75
80El
evat
ion
(ft)
WEST EAST
B36 B41 TW16 TW37 TW18/ TW9
FIGURE 45. CROSSSECTION ABTCE CONCENTRATIONS IN GROUNDWATER
TW44D TW43 TW42 TW35D TW17 EWS2
20 feet Horizontal
10 feet Vertical
5.3
52 4,200
2,300
130
34,00039,000
41
3,900
5,600
9,500
155,000
LEGEND
Well Screen
Groundwater Elevation
Concrete Slab/Fill
Sand
ClayDense Sand/GravelDense Sand/SiltTill
Bedrock
Soil/Loam
Soil Boring
w/ TCE concentrations (ug/L)
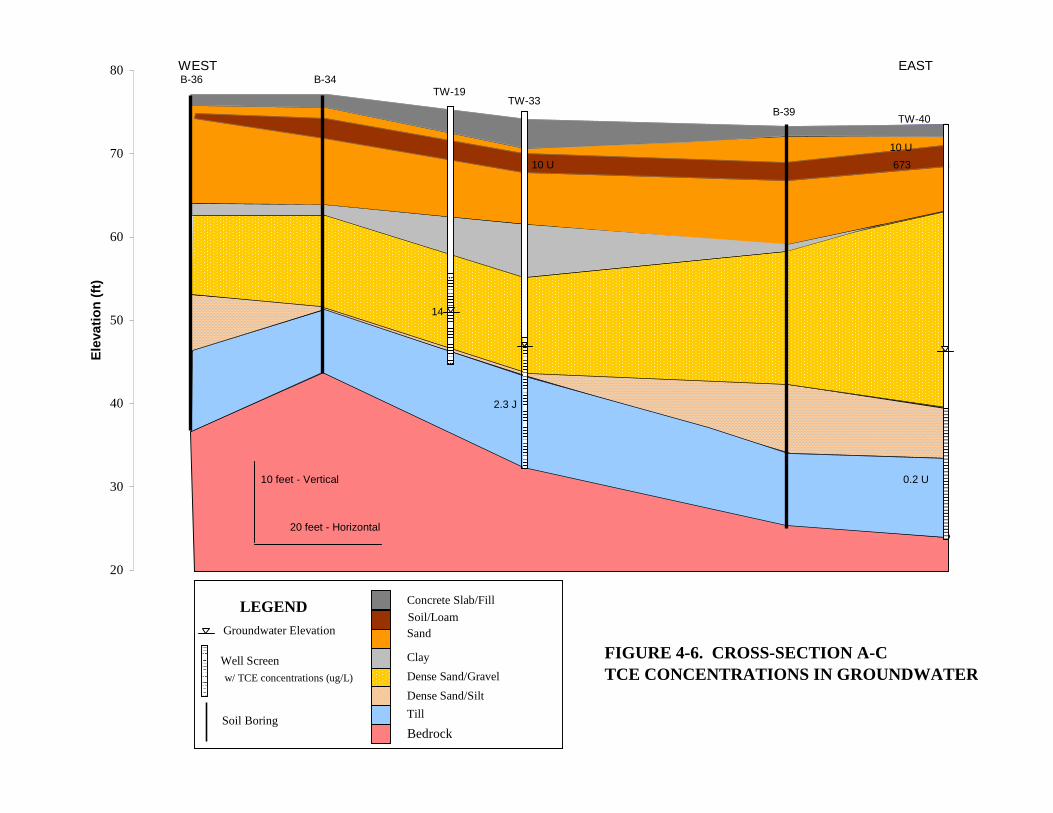
20
30
40
50
60
70
80
Elev
atio
n (ft
)TW33
B36
FIGURE 46. CROSSSECTION ACTCE CONCENTRATIONS IN GROUNDWATER
B34
TW40B39
10 U 67310 U
20 feet Horizontal
10 feet Vertical
WEST EAST
14
2.3 J
0.2 U
TW19
w/ TCE concentrations (ug/L)
LEGEND
Well Screen
Groundwater Elevation
Concrete Slab/Fill
Sand
ClayDense Sand/GravelDense Sand/SiltTill
Bedrock
Soil/Loam
Soil Boring
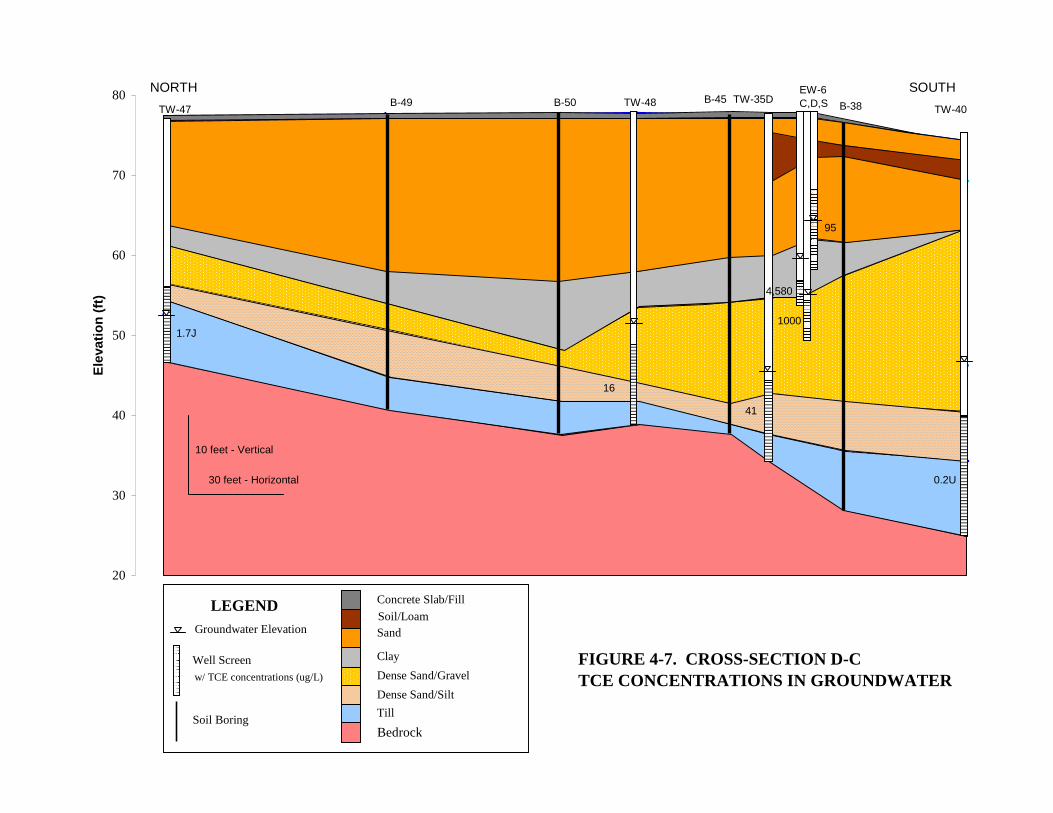
20
30
40
50
60
70
80El
evat
ion
(ft)
TW47 B49
FIGURE 47. CROSSSECTION DCTCE CONCENTRATIONS IN GROUNDWATER
B50 B38TW35DB45TW48 TW40
30 feet Horizontal
10 feet Vertical
NORTH SOUTHEW6C,D,S
LEGEND
Well Screen
Concrete Slab/Fill
Sand
ClayDense Sand/GravelDense Sand/SiltTill
Bedrock
Soil/LoamGroundwater Elevation
w/ TCE concentrations (ug/L)
Soil Boring
1.7J
16
41
4,580
1000
95
0.2U
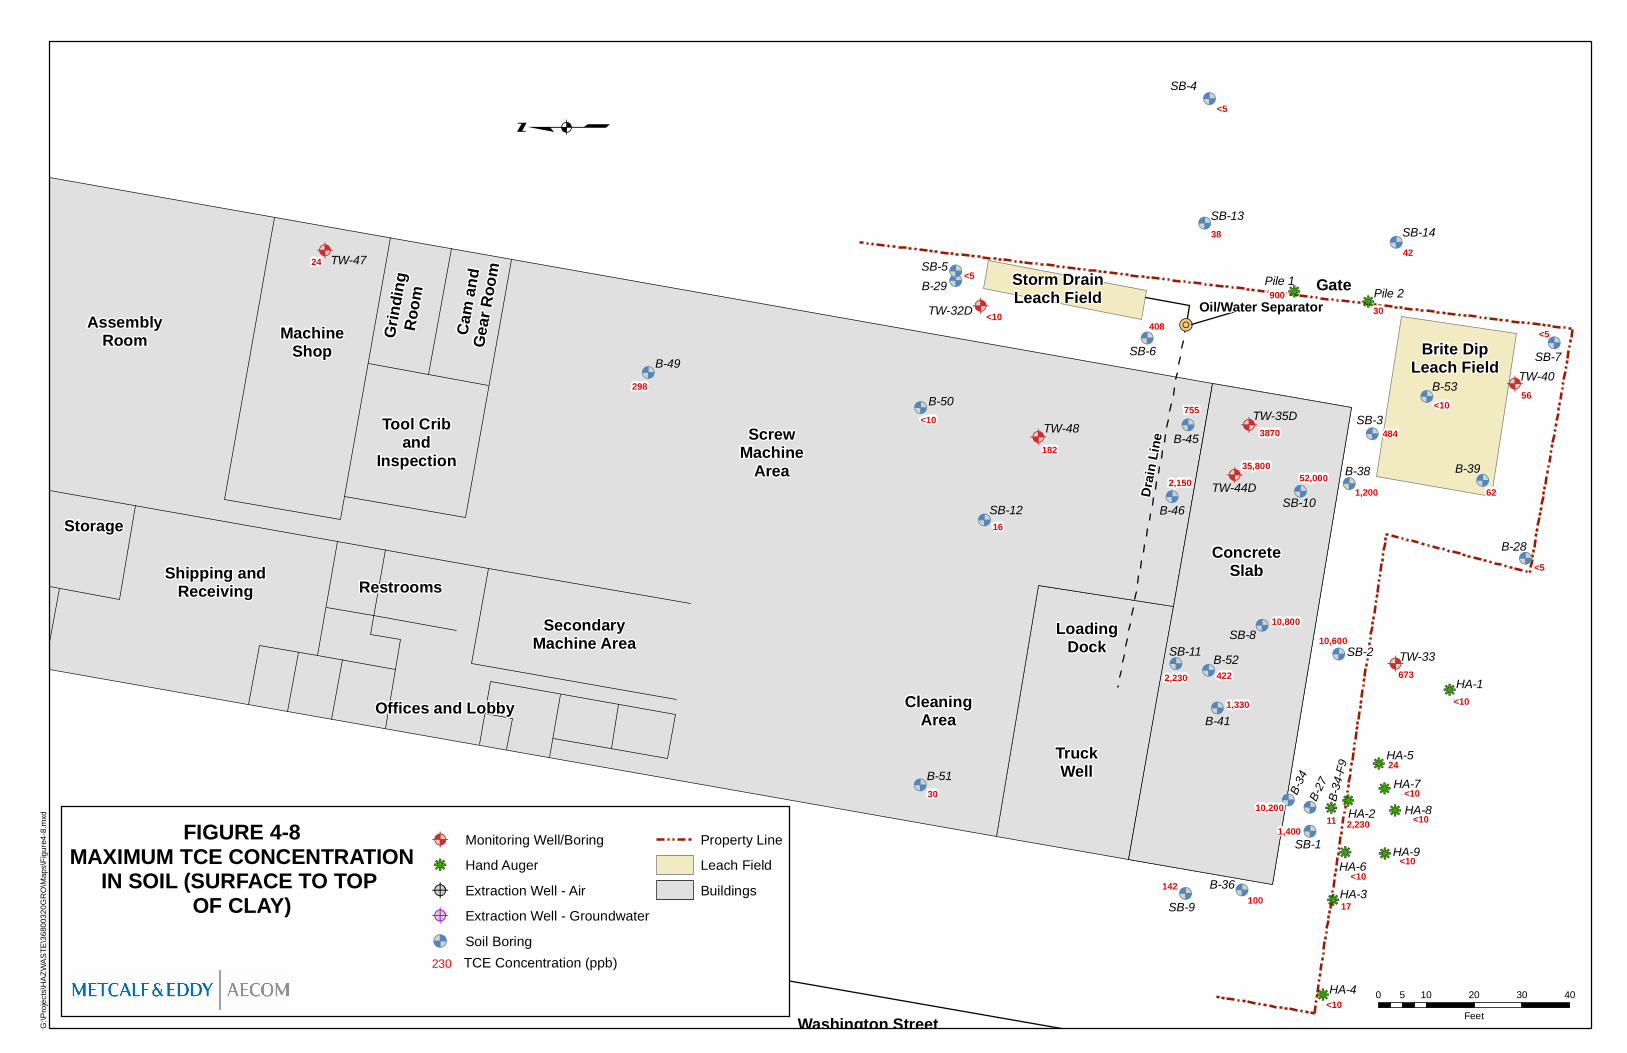
!R
&<
&<
&<
&<
&<
&<
&<
&<
&<
&<
&<
&<
&<
&<
&<
&<
&<
&<&<
&<
&<
@ A@ A
@ A
@ A
&<
&<
&<
&<
&<
&<
@ A
@ A
&<
&<
kj
kjkj
kj
@ A
kj
kj
kj kjkj
kjkj
kj
HA-5HA-7
HA-8
HA-9HA-6
SB-14
Restrooms
TruckWell
Washington Street
ConcreteSlab
LoadingDock
Tool Criband
Inspection
MachineShop
Grind
ingRo
om
Cam
and
Gear
Room
ScrewMachine
Area
Shipping andReceiving
SecondaryMachine Area
Offices and Lobby
Storage
AssemblyRoom
CleaningArea
Gate
Brite DipLeach Field
Drain
Line
Oil/Water SeparatorStorm DrainLeach Field
SB-7
SB-9
SB-8
SB-3
SB-2
SB-1
B-28
SB-13
SB-12
SB-11
SB-10
B-27
SB-6
TW-47
B-49
SB-5
TW-48
B-46
B-45TW-35D
B-38
B-52
B-41
TW-33
B-34
B-36
HA-4
HA-3
HA-2
HA-1
B-39
TW-32D
TW-40B-53
SB-4
B-51
B-29
TW-44D
B-50
Pile 1Pile 2
B-34
-F9
G:\Pr
ojects
\HAZ
WAST
E\368
0032
0GRO
\Map
s\Figu
re4-8.
mxd
FIGURE 4-8MAXIMUM TCE CONCENTRATION
IN SOIL (SURFACE TO TOP OF CLAY)
q
@A Monitoring Well/Boringkj Hand Auger@? Extraction Well - Air@? Extraction Well - Groundwater&< Soil Boring
Property LineLeach FieldBuildings
0 10 20 30 405Feet
24
298
<10
182
16
30
<5
38
90030
42
408<10
<5
755
2,150
3870
35,800
1,200
484
<10
62
56
<5
<5
673
<10
10,600
2,23010,200
111,400
17
<10
100142
1,330
4222,230
10,800
230 TCE Concentration (ppb)
52,000
24
<10
<10
<10<10
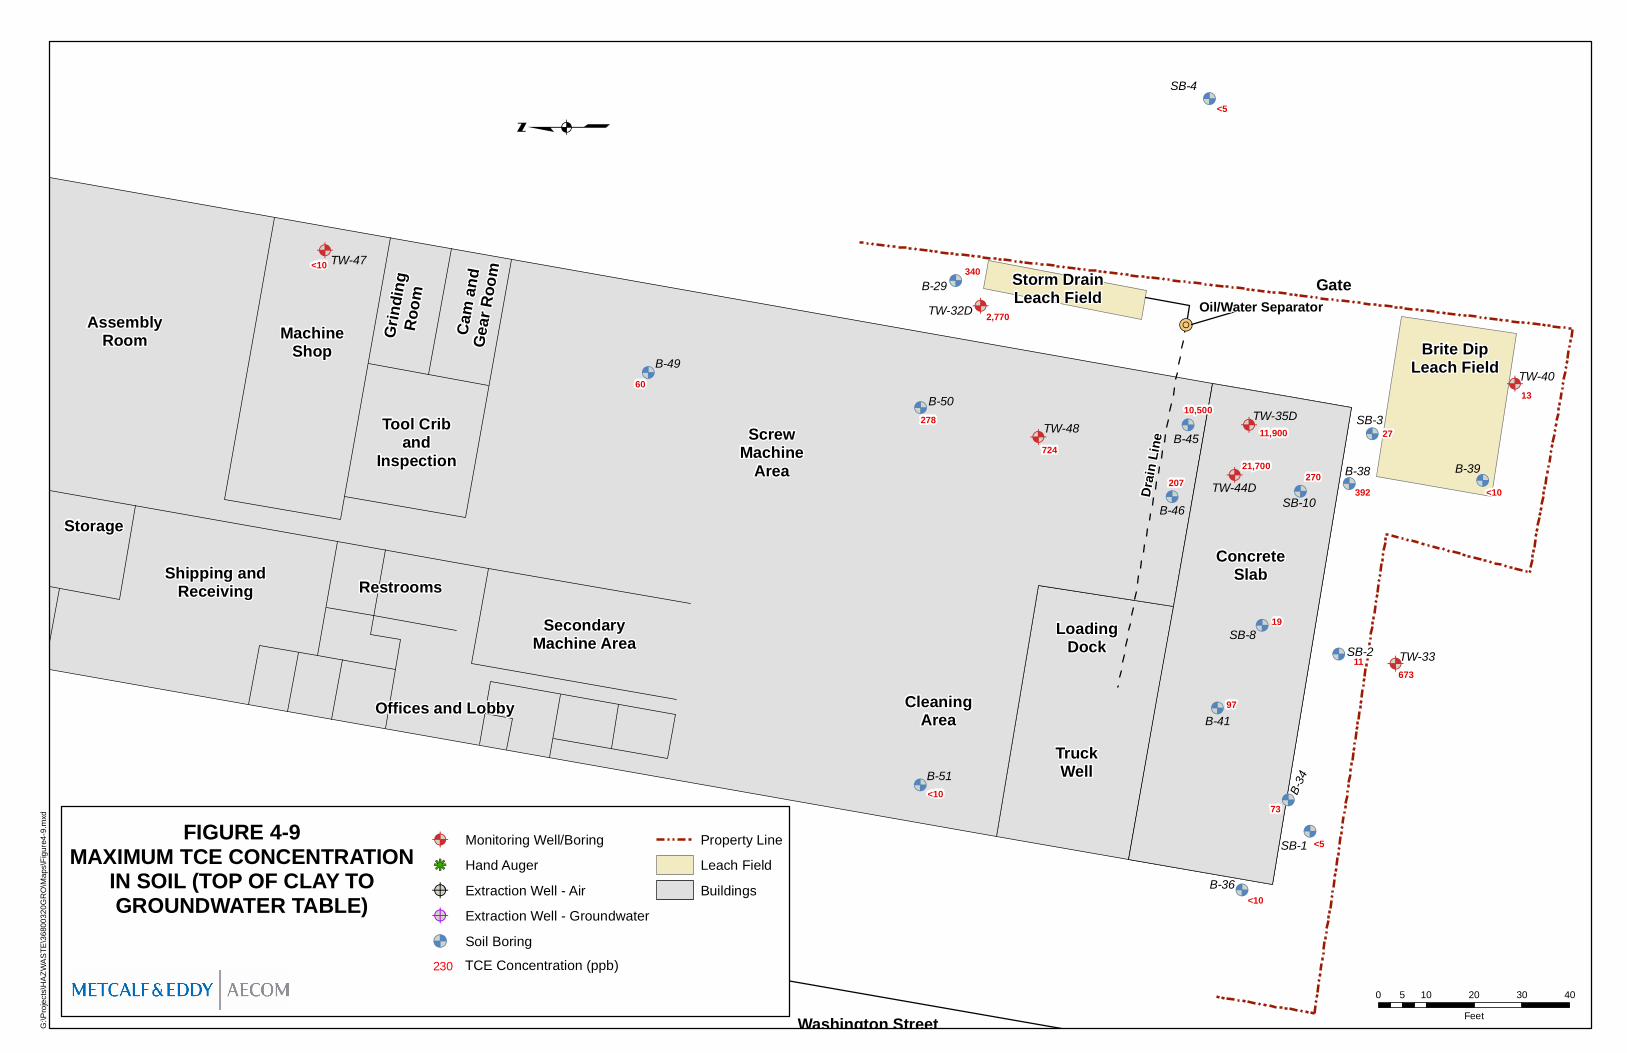
!R
&<
&<
&<
&<
&<
&<
&<
&<
&<
&<
@ A@ A
@ A
@ A
&<
&<
&<
&<
&<
&<
@ A
@ A
&<
@ A
SB-1
Restrooms
TruckWell
Washington Street
ConcreteSlab
LoadingDock
Tool Criband
Inspection
MachineShop
Grind
ingRo
om
Cam
and
Gear
Room
ScrewMachine
Area
Shipping andReceiving
SecondaryMachine Area
Offices and Lobby
Storage
AssemblyRoom
CleaningArea
Gate
Brite DipLeach Field
Drain
Line
Oil/Water SeparatorStorm DrainLeach Field
SB-8
SB-3
SB-2
SB-10
TW-47
B-49
TW-48
B-46
B-45TW-35D
B-38
B-41
TW-33
B-34
B-36
B-39
TW-32D
TW-40
SB-4
B-51
B-29
TW-44D
B-50
G:\Pr
ojects
\HAZ
WAST
E\368
0032
0GRO
\Map
s\Figu
re4-9.
mxd
FIGURE 4-9MAXIMUM TCE CONCENTRATION
IN SOIL (TOP OF CLAY TOGROUNDWATER TABLE)
q
@A Monitoring Well/Boringkj Hand Auger@? Extraction Well - Air@? Extraction Well - Groundwater&< Soil Boring
Property LineLeach FieldBuildings
0 10 20 30 405Feet
<10
60
278
724
<10
<5
2,770
340
10,500
207
11,900
21,700
392
27
<10
13
67311
73
<5
<10
97
19
270
230 TCE Concentration (ppb)

!R
@ A
@ A
@ A
@ A
@ A@ A
@ A @ A
&<
&<
@ A
@ A
@ A
@ ?
@ ?
@ ?
@ ?
@ ?
&<
@ A
@ A
@ A
@ A
@ A@ A
@ A@ A
@ A
@ A
@ A
@ A
@ A
@ A@ A
Restrooms
TruckWell
Washington Street
LoadingDock
Tool Criband
Inspection
MachineShop
Grind
ingRo
om
Cam
and
Gear
Room
ScrewMachine
Area
Shipping andReceiving
SecondaryMachine Area
Offices and Lobby
Storage
AssemblyRoom
CleaningArea
Brite DipLeach Field
Drain
Line
Oil/Water SeparatorStorm DrainLeach Field
MW-3
EW-6
EW-5D
EW-4
EW-2D
MW-5
TW-3
TW-1
TW-19
TW-23
B-28
EW-S2
B-27
TW-26
TW-17
TW-16
TW-15
TW-26A
TW-47
TW-48
TW-18
TW-35DTW-42TW-43
TW-9
TW-37
TW-33
TW-32D TW-32I
TW-40
TW-30
TW-31
B-29
TW-44D
G:\Pr
ojects
\HAZ
WAST
E\368
0032
0GRO
\Map
s\Figu
re4-10
Dist
ributi
on of
TCE i
n Grou
ndwa
ter.m
xd
FIGURE 4-10DISTRIBUTION OF TCE
IN GROUNDWATER
q
@A Monitoring Well/Boringkj Hand Auger@? Extraction Well - Air@? Extraction Well - Groundwater&< Soil Boring
Property LineLeach FieldBuildings
0 10 20 30 405Feet
33
1
25
301
1010
3,200330
350
3,900 - 160,000 966
<5
0.7
2.3
16
130
46
39,00034,000
0.71,000
44
65
4,200 2,300
52
4.2
1,000
170
5
21
58
14
4.1
Concentration (mg/L) from most recent sample (before pilot test).Values in Red are Upper Deep Overburden. Values in Green are from Lower Deep OverburdenValues in Blue are from BedrockTCE > 1,000 ug/L Isopleth in Lower Deep Overburden
TCE > 1,000 ug/L Isopleth in Upper Deep Overburden
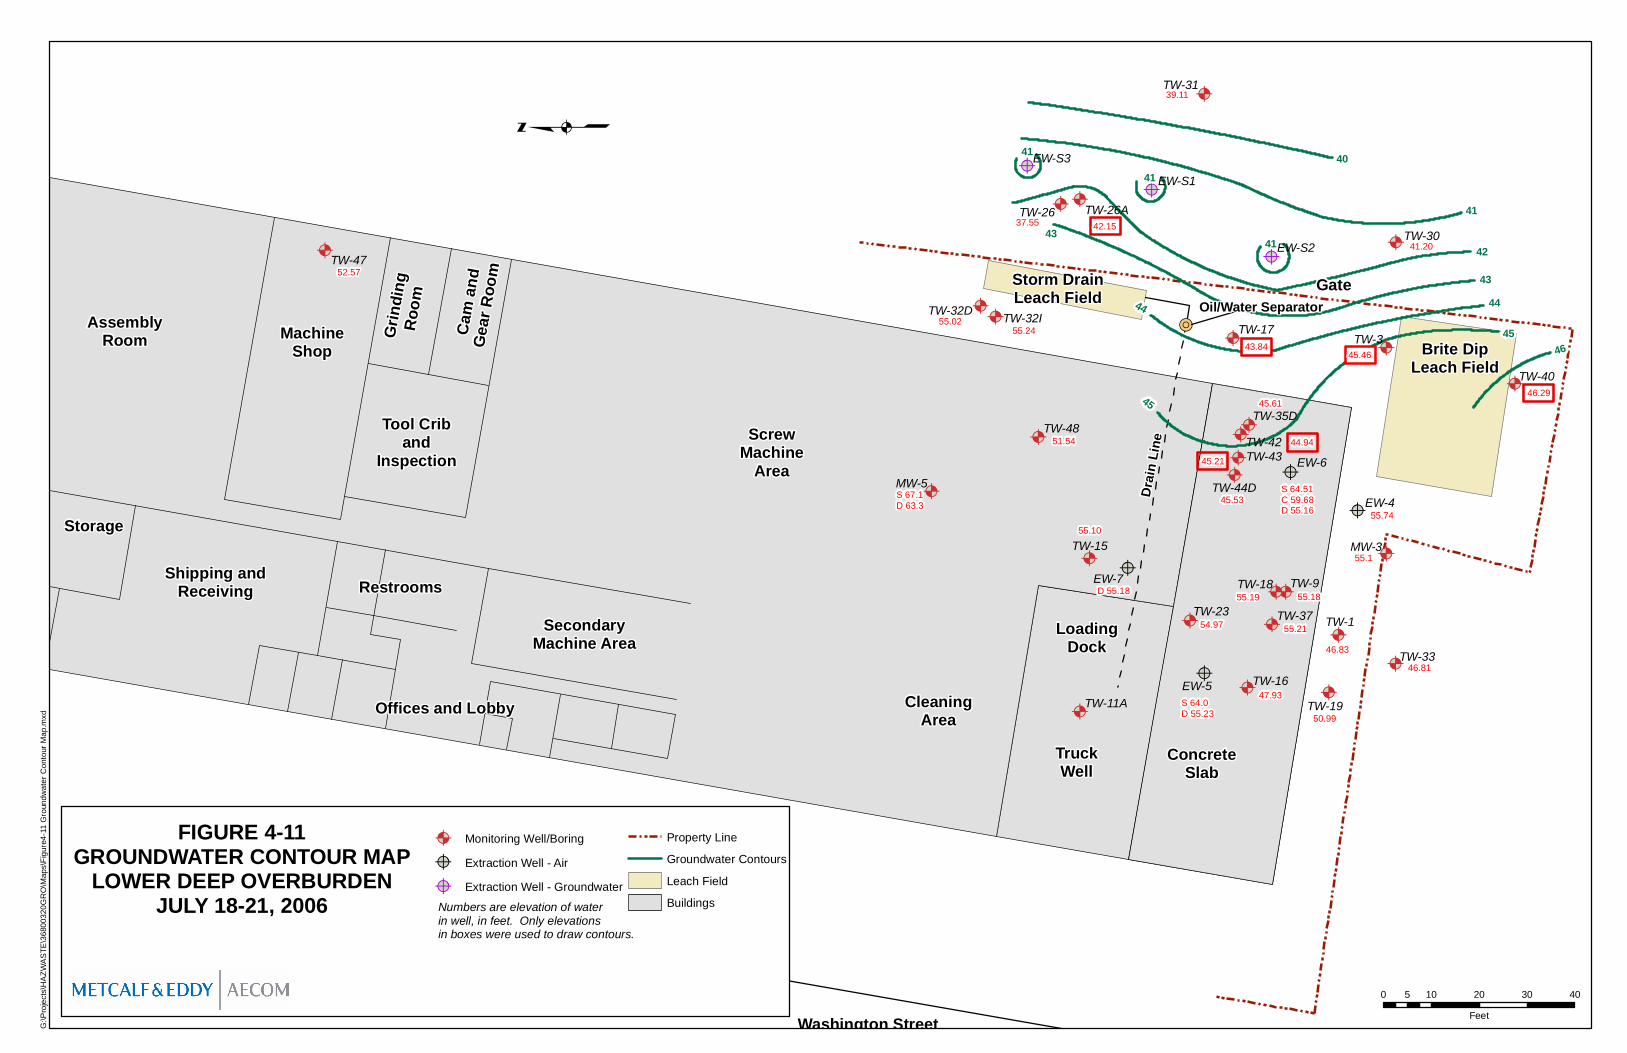
!R
@ A
@ A
@ A
@ A@ A
@ A@ A
@ A @ A
@ A
@ A
@ A
@ ?
@ ?
@ ?
@ ?
@ ?
@ ?
@ ?
@ A
@ A
@ A
@ A
@ A@ A
@ A@ A
@ A
@ A
@ A
@ A
@ A
@ A@ A
Restrooms
TruckWell
Washington Street
ConcreteSlab
LoadingDock
Tool Criband
Inspection
MachineShop
Grind
ingRo
om
Cam
and
Gear
Room
ScrewMachine
Area
Shipping andReceiving
SecondaryMachine Area
Offices and Lobby
Storage
AssemblyRoom
CleaningArea
Gate
Brite DipLeach Field
Drain
Line
Oil/Water SeparatorStorm DrainLeach Field
MW-3
EW-7
EW-6
EW-5
EW-4MW-5
TW-3
TW-1
TW-19
TW-23
EW-S3
EW-S2
EW-S1
TW-26
TW-17
TW-16
TW-15
TW-26A
TW-11A
TW-47
TW-48
TW-18
TW-35DTW-42TW-43
TW-9
TW-37
TW-33
TW-32D TW-32I
TW-40
TW-30
TW-31
TW-44D
G:\Pr
ojects
\HAZ
WAST
E\368
0032
0GRO
\Map
s\Figu
re4-11
Grou
ndwa
ter C
ontou
r Map
.mxd
FIGURE 4-11GROUNDWATER CONTOUR MAP
LOWER DEEP OVERBURDENJULY 18-21, 2006
q
@A Monitoring Well/Boring@? Extraction Well - Air@? Extraction Well - Groundwater
Property LineGroundwater ContoursLeach FieldBuildings
0 10 20 30 405Feet
Numbers are elevation of water in well, in feet. Only elevations in boxes were used to draw contours.
52.57
S 67.1D 63.3
51.54
55.10
55.0255.24
37.55 42.15
39.11
43.84
41.20
45.46
46.29
47.93
55.21
55.19 55.18
50.99
46.8146.83
55.1
55.74
54.97
S 64.0D 55.23
D 55.18
S 64.51C 59.68D 55.16
45.53
45.2144.94
45.61
41
41
41
40
41
42
43
43
44 44
45
45
46
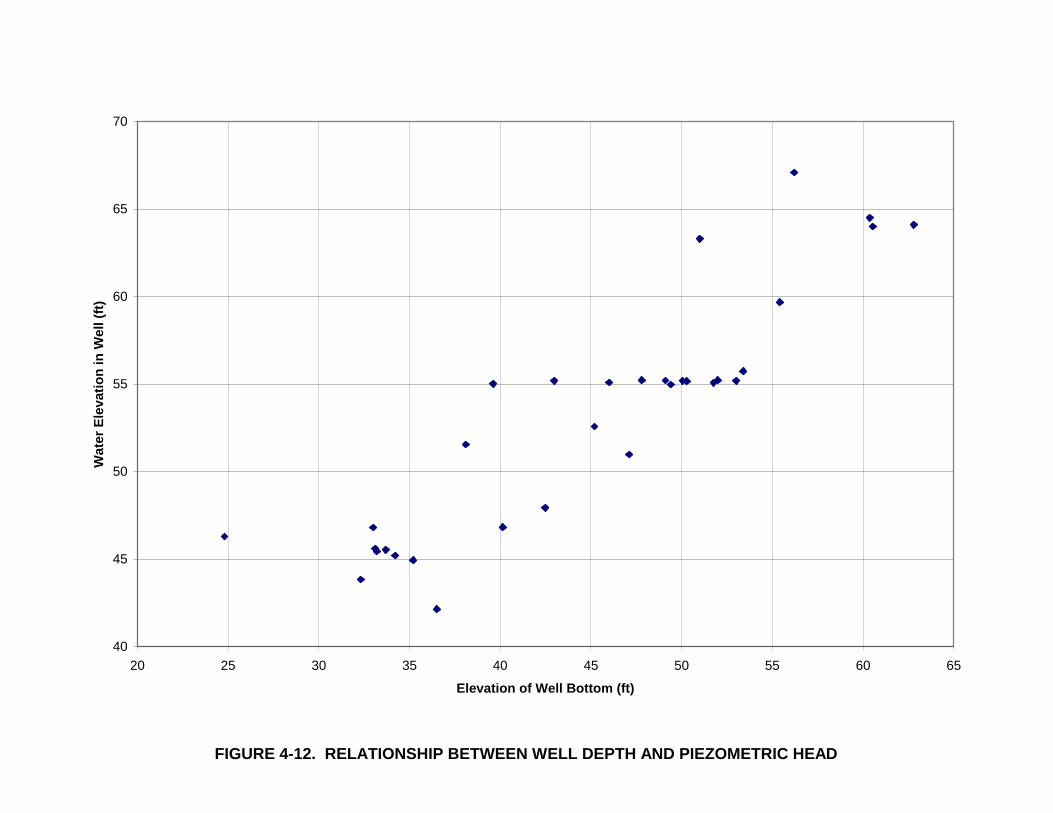
FIGURE 412. RELATIONSHIP BETWEEN WELL DEPTH AND PIEZOMETRIC HEAD
40
45
50
55
60
65
70
20 25 30 35 40 45 50 55 60 65
Elevation of Well Bottom (ft)
Wat
er E
leva
tion
in W
ell (
ft)
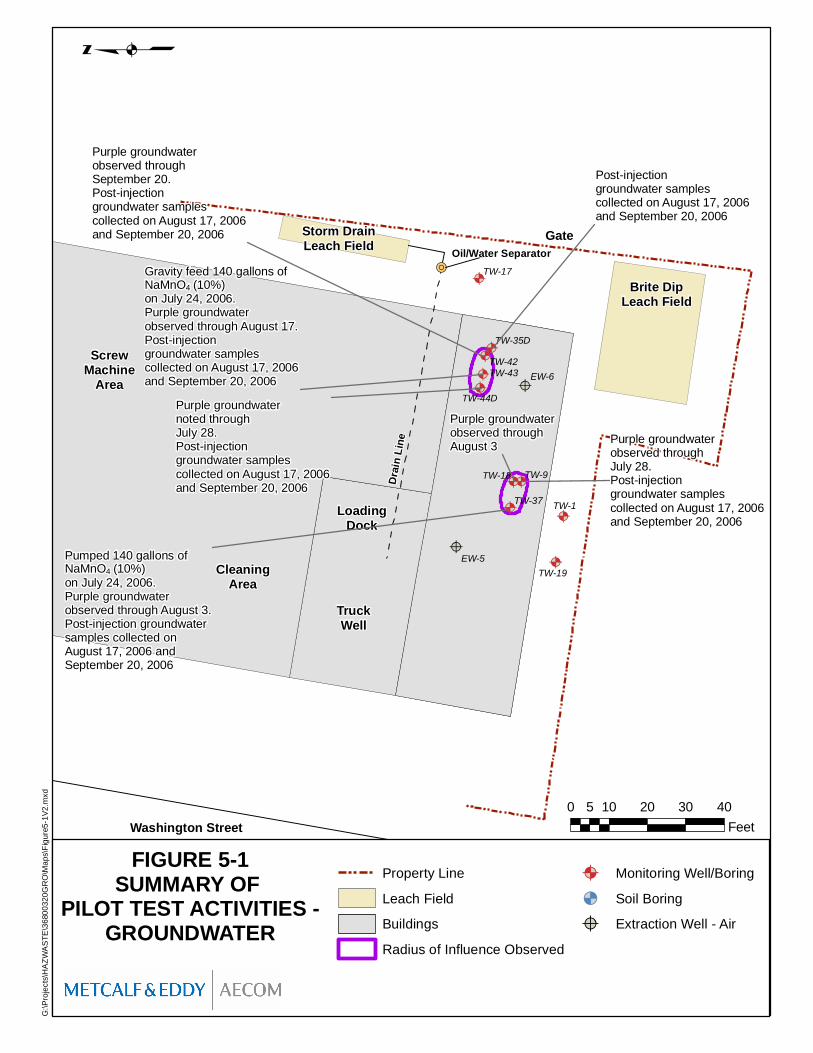
!R
@ A
@ A
@ A
@ A
@ A
@ A@ A
@ A@ A
@ A
@ ?
@ ?
EW-6
EW-5
TruckWell
Washington Street
LoadingDock
ScrewMachine
Area
CleaningArea
Gate
Brite DipLeach Field
Drain
Line
Oil/Water SeparatorStorm DrainLeach Field
TW-1
TW-19
TW-17
TW-18
TW-35DTW-42TW-43
TW-9
TW-37
TW-44D
G:\Pr
ojects
\HAZ
WAST
E\368
0032
0GRO
\Map
s\Figu
re5-1V
2.mxd
FIGURE 5-1SUMMARY OF
PILOT TEST ACTIVITIES -GROUNDWATER
q
Property LineLeach FieldBuildingsRadius of Influence Observed
@A Monitoring Well/Boring&< Soil Boring@? Extraction Well - Air
0 10 20 30 405Feet
Purple groundwaterobserved throughSeptember 20.Post-injectiongroundwater samplescollected on August 17, 2006and September 20, 2006
Gravity feed 140 gallons of NaMnO4 (10%)on July 24, 2006.Purple groundwaterobserved through August 17.Post-injectiongroundwater samplescollected on August 17, 2006and September 20, 2006
Purple groundwaternoted throughJuly 28. Post-injectiongroundwater samples collected on August 17, 2006and September 20, 2006
Purple groundwaterobserved throughAugust 3 Purple groundwater
observed through July 28.Post-injectiongroundwater samplescollected on August 17, 2006and September 20, 2006
Pumped 140 gallons of NaMnO4 (10%)on July 24, 2006.Purple groundwaterobserved through August 3.Post-injection groundwater samples collected on August 17, 2006 andSeptember 20, 2006
Post-injectiongroundwater samplescollected on August 17, 2006and September 20, 2006
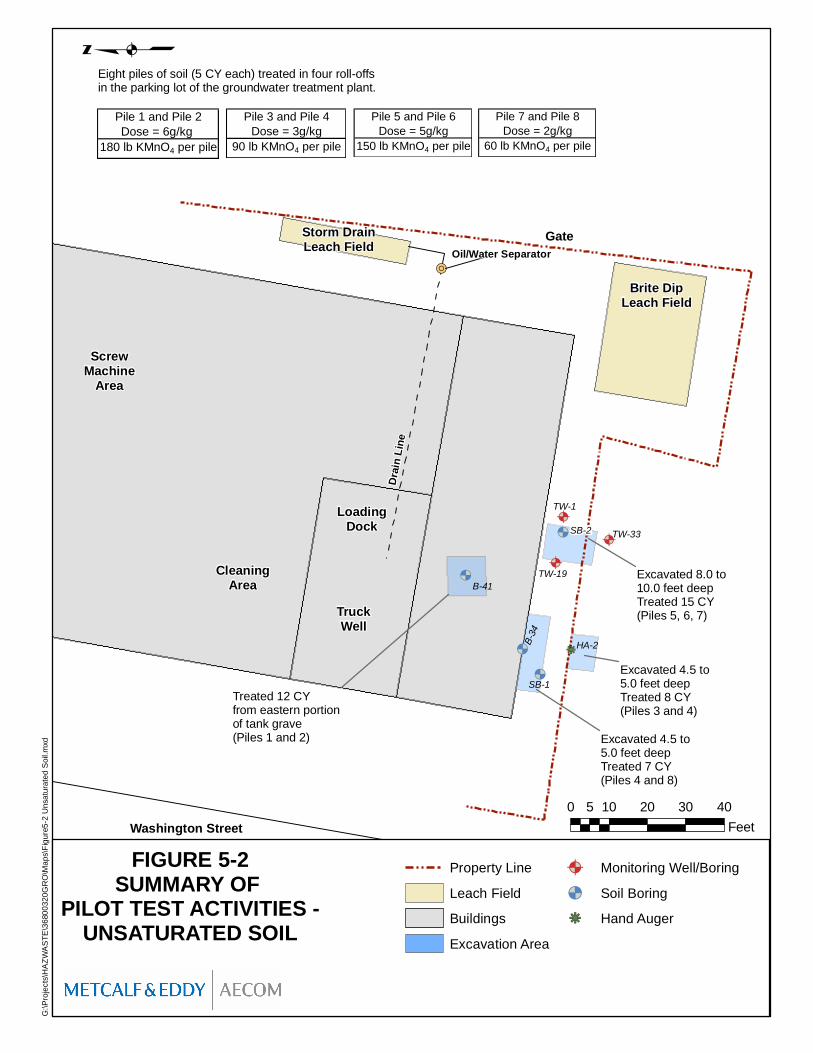
!R
@ A@ A
@ A
&<
&<
&<
&< kj
B-41
TruckWell
Washington Street
LoadingDock
ScrewMachine
Area
CleaningArea
Gate
Brite DipLeach Field
Drain
Line
Oil/Water SeparatorStorm DrainLeach Field
SB-2
SB-1
TW-1
TW-19
TW-33B-3
4
HA-2
G:\Pr
ojects
\HAZ
WAST
E\368
0032
0GRO
\Map
s\Figu
re5-2
Unsa
turate
d Soil
.mxd
FIGURE 5-2SUMMARY OF
PILOT TEST ACTIVITIES -UNSATURATED SOIL
q
Property LineLeach FieldBuildingsExcavation Area
@A Monitoring Well/Boring&< Soil Boringkj Hand Auger
0 10 20 30 405Feet
Eight piles of soil (5 CY each) treated in four roll-offs in the parking lot of the groundwater treatment plant.
Pile 1 and Pile 2Dose = 6g/kg
180 lb KMnO4 per pile
Pile 3 and Pile 4Dose = 3g/kg
90 lb KMnO4 per pile
Pile 5 and Pile 6Dose = 5g/kg
150 lb KMnO4 per pile
Pile 7 and Pile 8Dose = 2g/kg
60 lb KMnO4 per pile
Excavated 8.0 to 10.0 feet deepTreated 15 CY(Piles 5, 6, 7)
Excavated 4.5 to 5.0 feet deepTreated 7 CY(Piles 4 and 8)
Excavated 4.5 to 5.0 feet deepTreated 8 CY(Piles 3 and 4)
Treated 12 CYfrom eastern portionof tank grave(Piles 1 and 2)
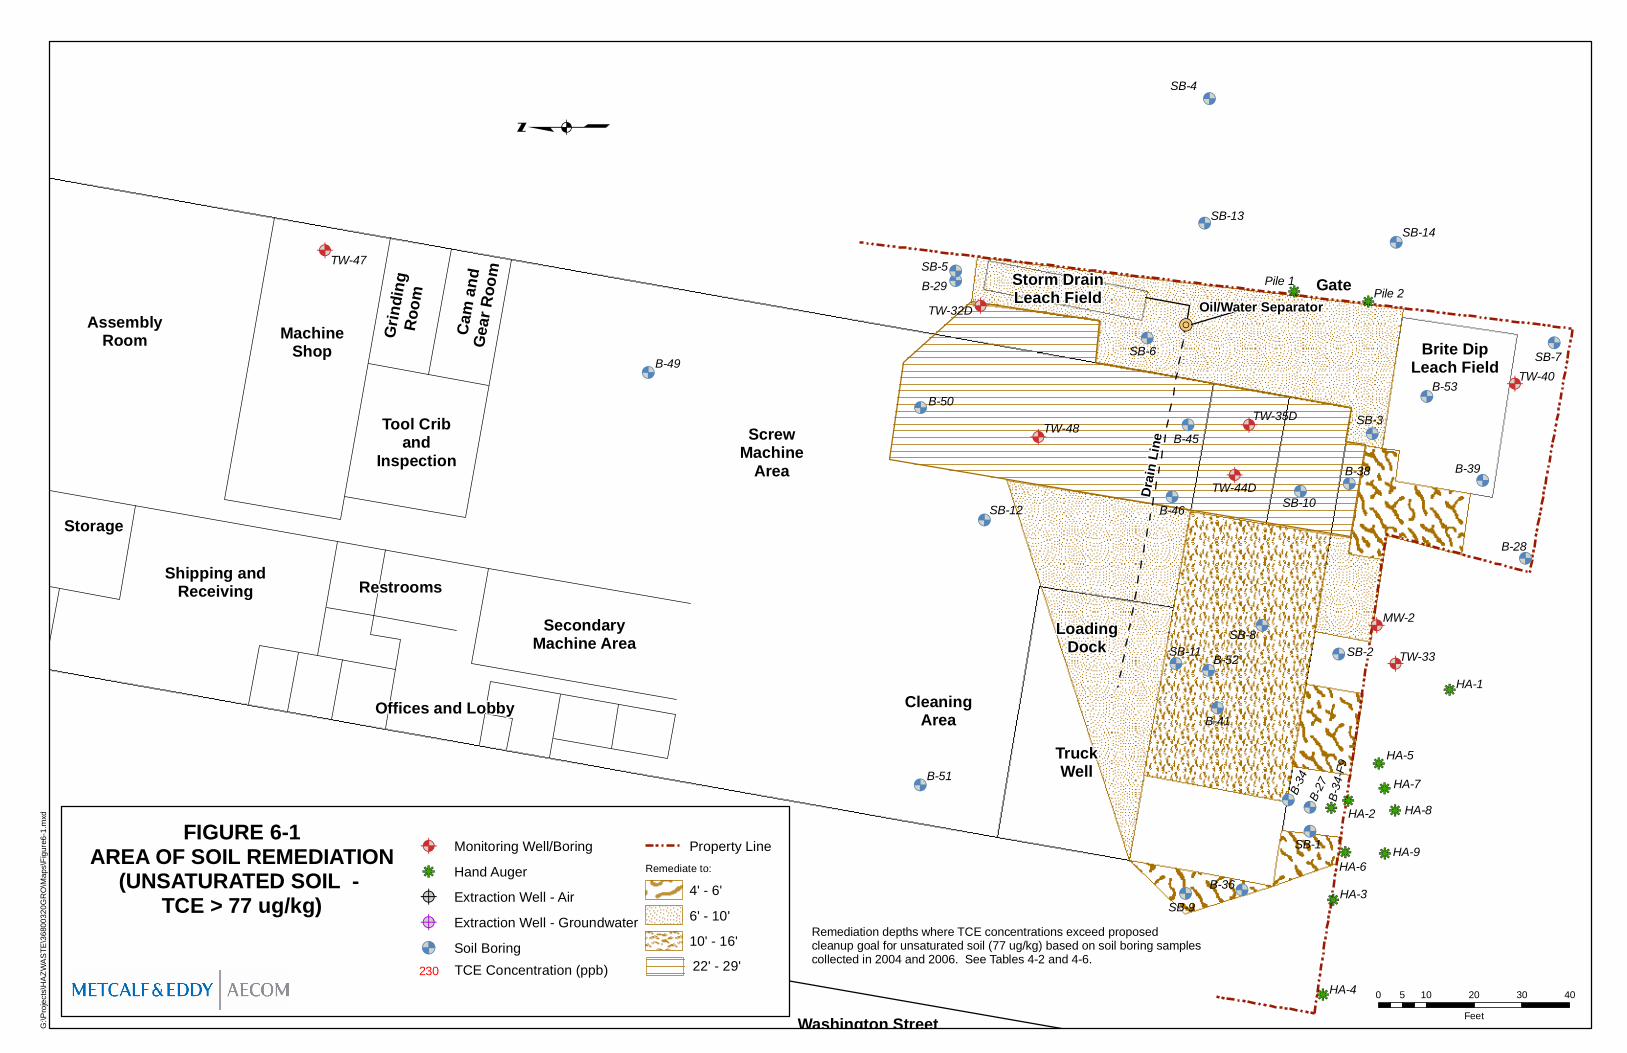
!R
&<
&<
&<
&<
&<
&<
&<
&<
&<
&<
&<
&<
&<
&<
&<
&<
&<
@ A
&<&<
&<
&<
@ A@ A
@ A
@ A
&<
&<
&<
&<
&<
&<
@ A
@ A
&<
&<
kj
kjkj
kj
@ A
kj
kj
kj kjkj
kjkj
kj
HA-5HA-7
HA-8
HA-9HA-6
SB-14
Restrooms
TruckWell
Washington Street
LoadingDock
Tool Criband
Inspection
MachineShop
Grind
ingRo
om
Cam
and
Gear
Room
ScrewMachine
Area
Shipping andReceiving
SecondaryMachine Area
Offices and Lobby
Storage
AssemblyRoom
CleaningArea
Gate
Brite DipLeach Field
Drain
Line
Oil/Water SeparatorStorm DrainLeach Field
MW-2
SB-7
SB-9
SB-8
SB-3
SB-2
SB-1
B-28
SB-13
SB-12
SB-11
SB-10
B-27
SB-6
TW-47
B-49
SB-5
TW-48
B-46
B-45TW-35D
B-38
B-52
B-41
TW-33
B-34
B-36
HA-4
HA-3
HA-2
HA-1
B-39
TW-32D
TW-40B-53
SB-4
B-51
B-29
TW-44D
B-50
Pile 1Pile 2
B-34
-F9
G:\Pr
ojects
\HAZ
WAST
E\368
0032
0GRO
\Map
s\Figu
re6-1.
mxd
FIGURE 6-1AREA OF SOIL REMEDIATION
(UNSATURATED SOIL - TCE > 77 ug/kg)
q
@A Monitoring Well/Boringkj Hand Auger@? Extraction Well - Air@? Extraction Well - Groundwater&< Soil Boring
Property LineRemediate to:
4' - 6'6' - 10'10' - 16'
0 10 20 30 405Feet
230 TCE Concentration (ppb) 22' - 29'
Remediation depths where TCE concentrations exceed proposedcleanup goal for unsaturated soil (77 ug/kg) based on soil boring samplescollected in 2004 and 2006. See Tables 4-2 and 4-6.
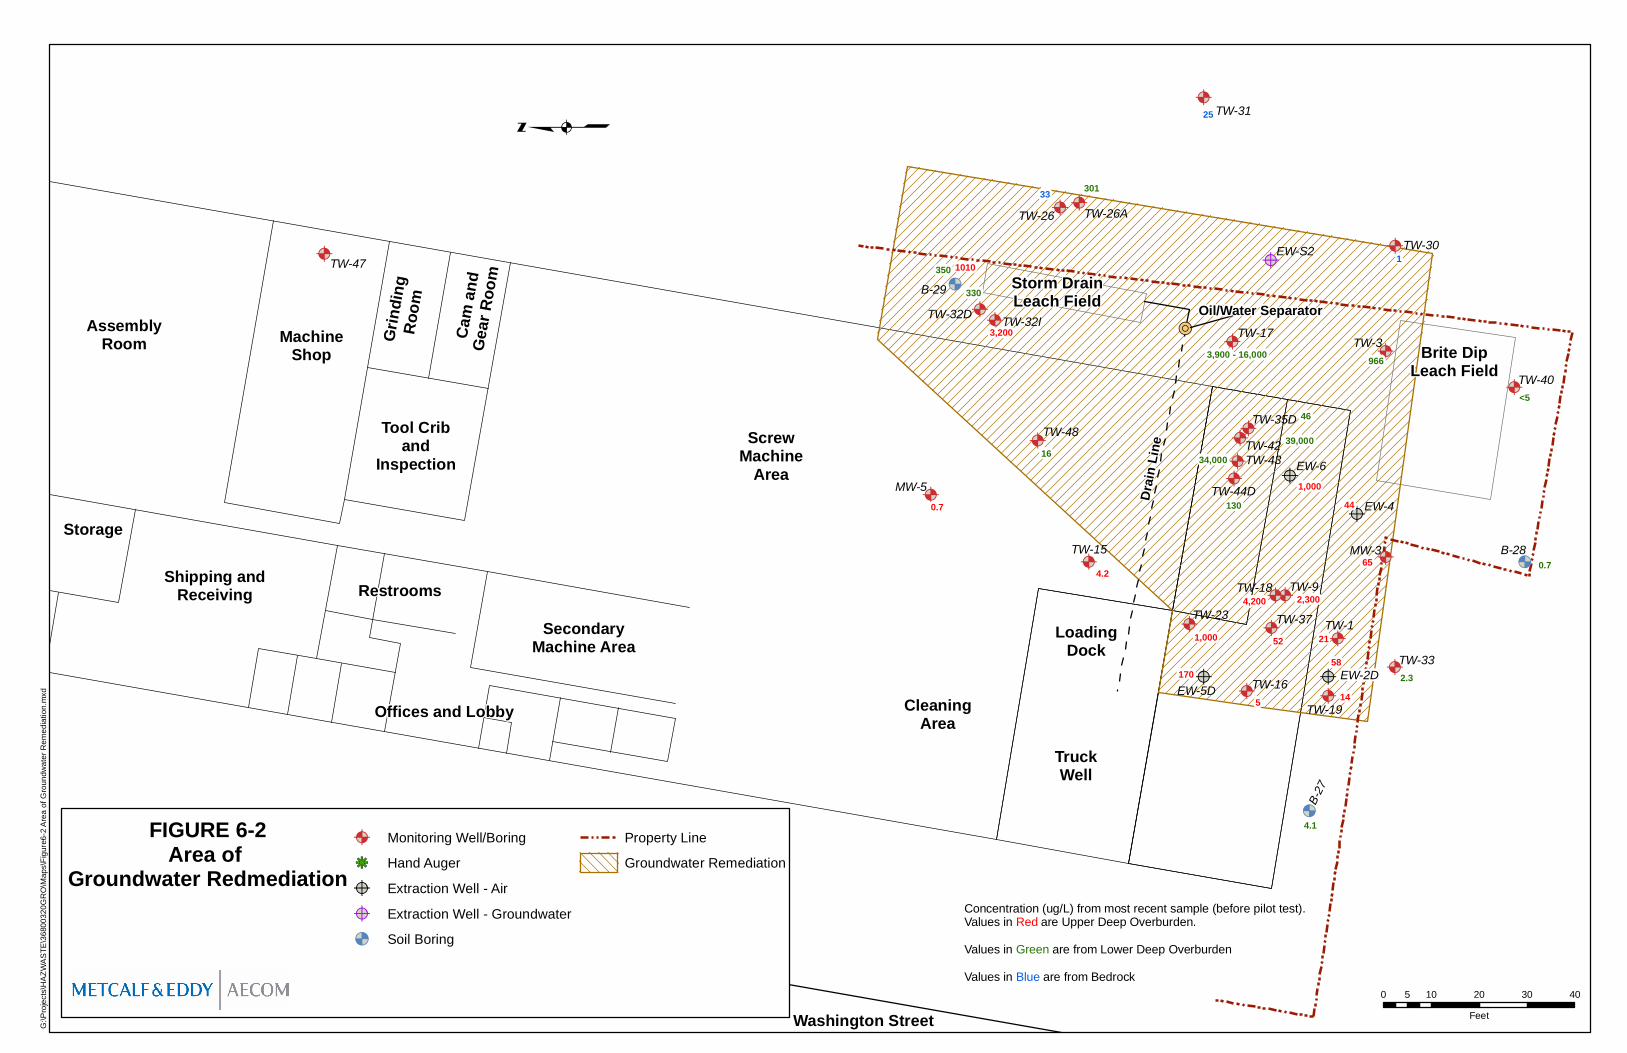
!R
@ A
@ A
@ A
@ A
@ A@ A
@ A @ A
&<
&<
@ A
@ A
@ A
@ ?
@ ?
@ ?
@ ?
@ ?
&<
@ A
@ A
@ A
@ A
@ A@ A
@ A@ A
@ A
@ A
@ A
@ A
@ A
@ A@ A
Restrooms
TruckWell
Washington Street
LoadingDock
Tool Criband
Inspection
MachineShop
Grind
ingRo
om
Cam
and
Gear
Room
ScrewMachine
Area
Shipping andReceiving
SecondaryMachine Area
Offices and Lobby
Storage
AssemblyRoom
CleaningArea
Brite DipLeach Field
Drain
Line
Oil/Water SeparatorStorm DrainLeach Field
MW-3
EW-6
EW-5D
EW-4
EW-2D
MW-5
TW-3
TW-1
TW-19
TW-23
B-28
EW-S2
B-27
TW-26
TW-17
TW-16
TW-15
TW-26A
TW-47
TW-48
TW-18
TW-35DTW-42TW-43
TW-9
TW-37
TW-33
TW-32D TW-32I
TW-40
TW-30
TW-31
B-29
TW-44D
G:\Pr
ojects
\HAZ
WAST
E\368
0032
0GRO
\Map
s\Figu
re6-2
Area
of G
round
water
Rem
ediat
ion.m
xd
FIGURE 6-2Area of
Groundwater Redmediation
q
@A Monitoring Well/Boringkj Hand Auger@? Extraction Well - Air@? Extraction Well - Groundwater&< Soil Boring
Property LineGroundwater Remediation
0 10 20 30 405Feet
33
1
25
301
1010
3,200
330
350
3,900 - 16,000 966
<5
0.7
2.3
16
130
46
39,00034,000
0.71,000
44
65
4,200 2,300
52
4.2
1,000
170
5
21
58
14
4.1
Concentration (ug/L) from most recent sample (before pilot test).Values in Red are Upper Deep Overburden. Values in Green are from Lower Deep OverburdenValues in Blue are from Bedrock
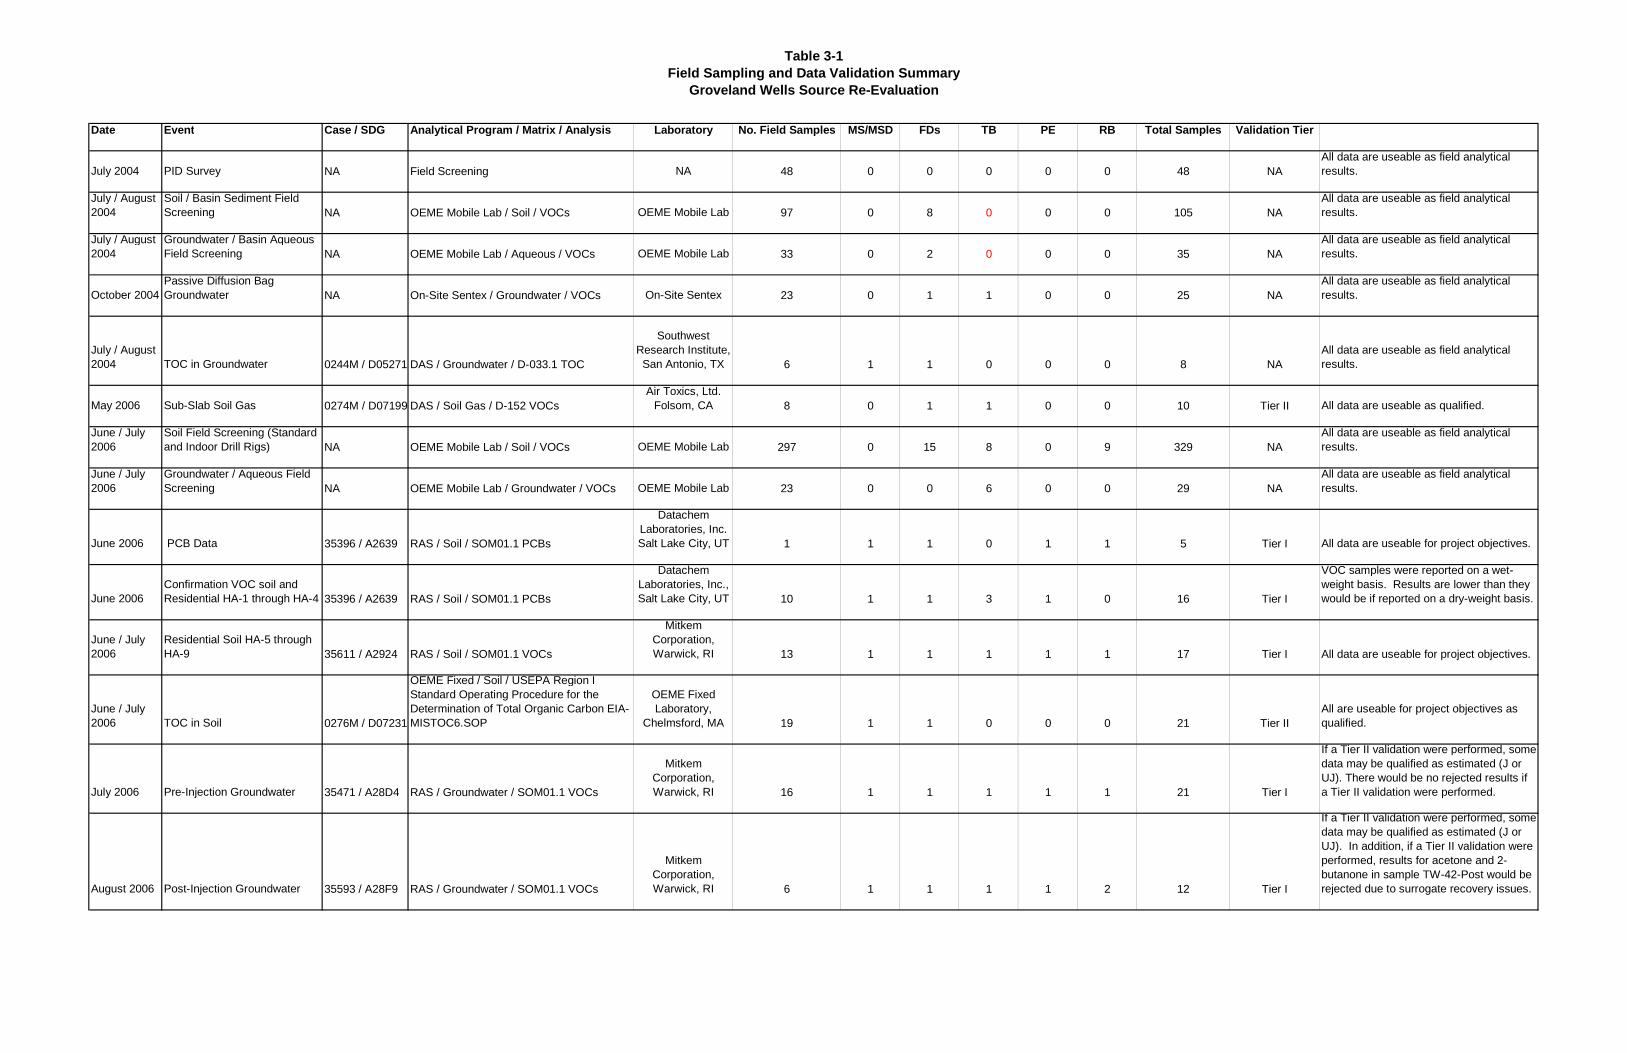
Table 31Field Sampling and Data Validation Summary
Groveland Wells Source ReEvaluation
Date Event Case / SDG Analytical Program / Matrix / Analysis Laboratory No. Field Samples MS/MSD FDs TB PE RB Total Samples Validation Tier
July 2004 PID Survey NA Field Screening NA 48 0 0 0 0 0 48 NAAll data are useable as field analyticalresults.
July / August2004
Soil / Basin Sediment FieldScreening NA OEME Mobile Lab / Soil / VOCs OEME Mobile Lab 97 0 8 0 0 0 105 NA
All data are useable as field analyticalresults.
July / August2004
Groundwater / Basin AqueousField Screening NA OEME Mobile Lab / Aqueous / VOCs OEME Mobile Lab 33 0 2 0 0 0 35 NA
All data are useable as field analyticalresults.
October 2004Passive Diffusion BagGroundwater NA OnSite Sentex / Groundwater / VOCs OnSite Sentex 23 0 1 1 0 0 25 NA
All data are useable as field analyticalresults.
July / August2004 TOC in Groundwater 0244M / D05271 DAS / Groundwater / D033.1 TOC
SouthwestResearch Institute,San Antonio, TX 6 1 1 0 0 0 8 NA
All data are useable as field analyticalresults.
May 2006 SubSlab Soil Gas 0274M / D07199 DAS / Soil Gas / D152 VOCsAir Toxics, Ltd.
Folsom, CA 8 0 1 1 0 0 10 Tier II All data are useable as qualified.
June / July2006
Soil Field Screening (Standardand Indoor Drill Rigs) NA OEME Mobile Lab / Soil / VOCs OEME Mobile Lab 297 0 15 8 0 9 329 NA
All data are useable as field analyticalresults.
June / July2006
Groundwater / Aqueous FieldScreening NA OEME Mobile Lab / Groundwater / VOCs OEME Mobile Lab 23 0 0 6 0 0 29 NA
All data are useable as field analyticalresults.
June 2006 PCB Data 35396 / A2639 RAS / Soil / SOM01.1 PCBs
DatachemLaboratories, Inc.Salt Lake City, UT 1 1 1 0 1 1 5 Tier I All data are useable for project objectives.
June 2006Confirmation VOC soil andResidential HA1 through HA4 35396 / A2639 RAS / Soil / SOM01.1 PCBs
DatachemLaboratories, Inc.,Salt Lake City, UT 10 1 1 3 1 0 16 Tier I
VOC samples were reported on a wetweight basis. Results are lower than theywould be if reported on a dryweight basis.
June / July2006
Residential Soil HA5 throughHA9 35611 / A2924 RAS / Soil / SOM01.1 VOCs
MitkemCorporation,Warwick, RI 13 1 1 1 1 1 17 Tier I All data are useable for project objectives.
June / July2006 TOC in Soil 0276M / D07231
OEME Fixed / Soil / USEPA Region IStandard Operating Procedure for theDetermination of Total Organic Carbon EIAMISTOC6.SOP
OEME FixedLaboratory,
Chelmsford, MA 19 1 1 0 0 0 21 Tier IIAll are useable for project objectives asqualified.
July 2006 PreInjection Groundwater 35471 / A28D4 RAS / Groundwater / SOM01.1 VOCs
MitkemCorporation,Warwick, RI 16 1 1 1 1 1 21 Tier I
If a Tier II validation were performed, somedata may be qualified as estimated (J orUJ). There would be no rejected results ifa Tier II validation were performed.
August 2006 PostInjection Groundwater 35593 / A28F9 RAS / Groundwater / SOM01.1 VOCs
MitkemCorporation,Warwick, RI 6 1 1 1 1 2 12 Tier I
If a Tier II validation were performed, somedata may be qualified as estimated (J orUJ). In addition, if a Tier II validation wereperformed, results for acetone and 2butanone in sample TW42Post would berejected due to surrogate recovery issues.
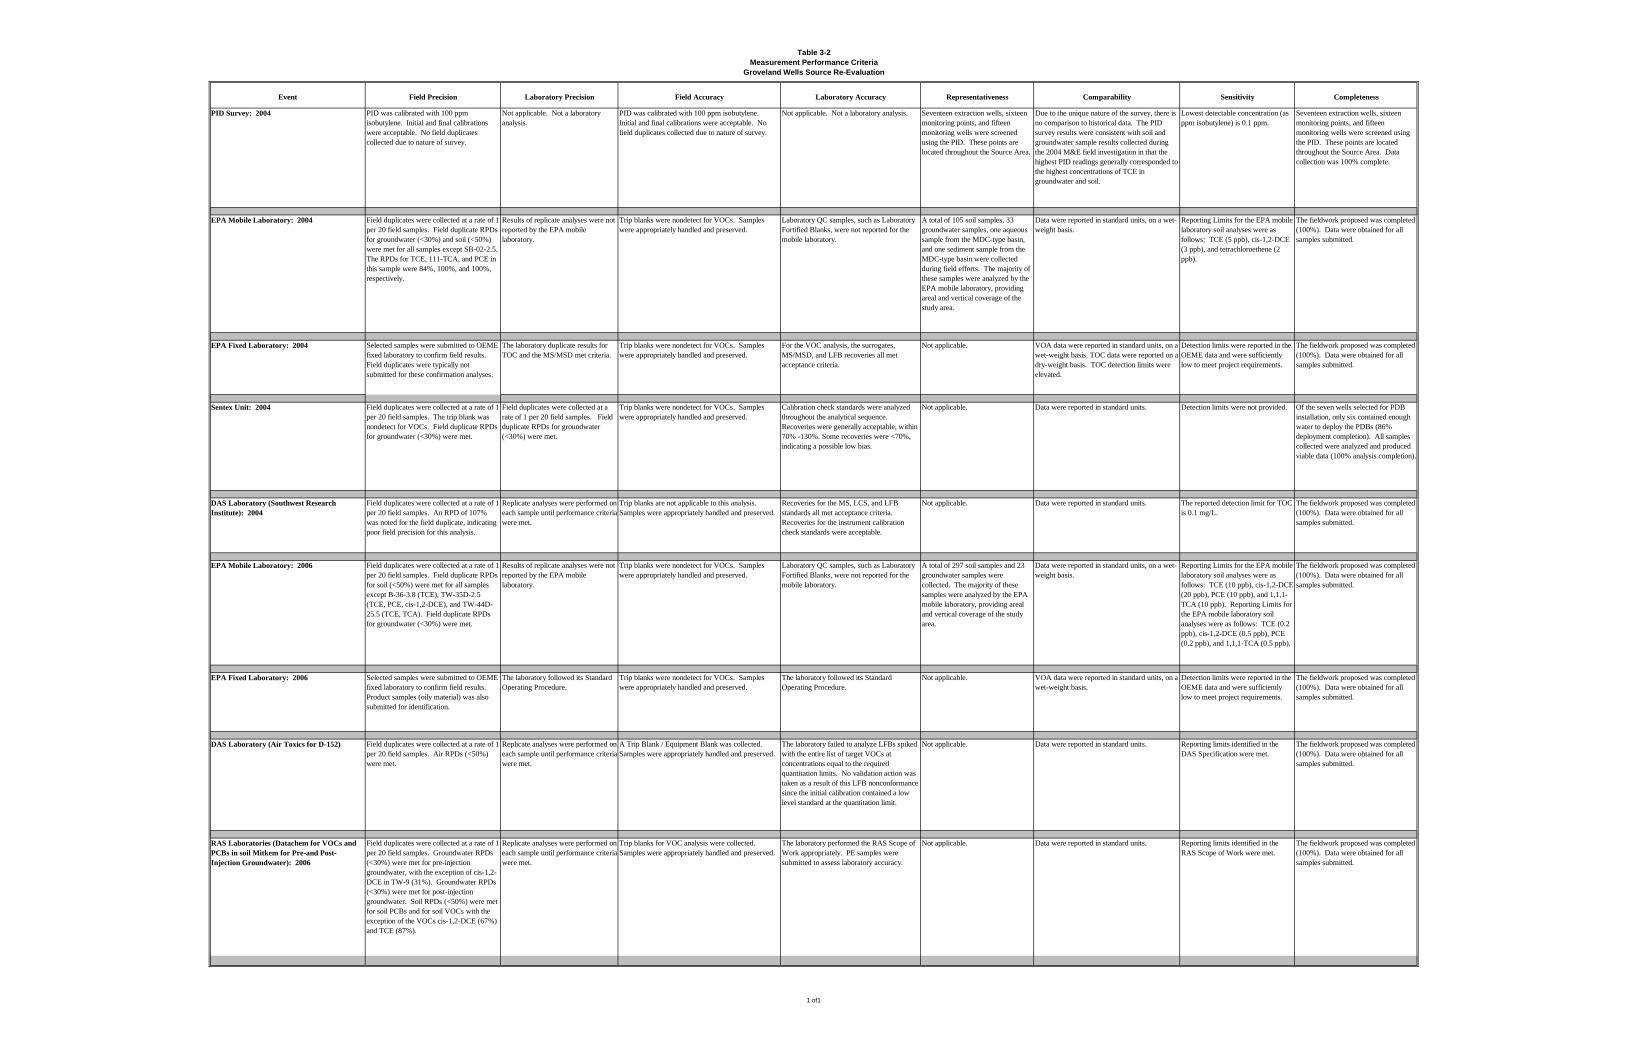
Table 32Measurement Performance Criteria
Groveland Wells Source ReEvaluation
Event Field Precision Laboratory Precision Field Accuracy Laboratory Accuracy Representativeness Comparability Sensitivity Completeness
PID Survey: 2004 PID was calibrated with 100 ppmisobutylene. Initial and final calibrationswere acceptable. No field duplicatescollected due to nature of survey.
Not applicable. Not a laboratoryanalysis.
PID was calibrated with 100 ppm isobutylene.Initial and final calibrations were acceptable. Nofield duplicates collected due to nature of survey.
Not applicable. Not a laboratory analysis. Seventeen extraction wells, sixteenmonitoring points, and fifteenmonitoring wells were screenedusing the PID. These points arelocated throughout the Source Area.
Due to the unique nature of the survey, there isno comparison to historical data. The PIDsurvey results were consistent with soil andgroundwater sample results collected duringthe 2004 M&E field investigation in that thehighest PID readings generally corresponded tothe highest concentrations of TCE ingroundwater and soil.
Lowest detectable concentration (asppm isobutylene) is 0.1 ppm.
Seventeen extraction wells, sixteenmonitoring points, and fifteenmonitoring wells were screened usingthe PID. These points are locatedthroughout the Source Area. Datacollection was 100% complete.
EPA Mobile Laboratory: 2004 Field duplicates were collected at a rate of 1per 20 field samples. Field duplicate RPDsfor groundwater (<30%) and soil (<50%)were met for all samples except SB022.5.The RPDs for TCE, 111TCA, and PCE inthis sample were 84%, 100%, and 100%,respectively.
Results of replicate analyses were notreported by the EPA mobilelaboratory.
Trip blanks were nondetect for VOCs. Sampleswere appropriately handled and preserved.
Laboratory QC samples, such as LaboratoryFortified Blanks, were not reported for themobile laboratory.
A total of 105 soil samples, 33groundwater samples, one aqueoussample from the MDCtype basin,and one sediment sample from theMDCtype basin were collectedduring field efforts. The majority ofthese samples were analyzed by theEPA mobile laboratory, providingareal and vertical coverage of thestudy area.
Data were reported in standard units, on a wetweight basis.
Reporting Limits for the EPA mobilelaboratory soil analyses were asfollows: TCE (5 ppb), cis1,2DCE(3 ppb), and tetrachloroethene (2ppb).
The fieldwork proposed was completed(100%). Data were obtained for allsamples submitted.
EPA Fixed Laboratory: 2004 Selected samples were submitted to OEMEfixed laboratory to confirm field results.Field duplicates were typically notsubmitted for these confirmation analyses.
The laboratory duplicate results forTOC and the MS/MSD met criteria.
Trip blanks were nondetect for VOCs. Sampleswere appropriately handled and preserved.
For the VOC analysis, the surrogates,MS/MSD, and LFB recoveries all metacceptance criteria.
Not applicable. VOA data were reported in standard units, on awetweight basis. TOC data were reported on adryweight basis. TOC detection limits wereelevated.
Detection limits were reported in theOEME data and were sufficientlylow to meet project requirements.
The fieldwork proposed was completed(100%). Data were obtained for allsamples submitted.
Sentex Unit: 2004 Field duplicates were collected at a rate of 1per 20 field samples. The trip blank wasnondetect for VOCs. Field duplicate RPDsfor groundwater (<30%) were met.
Field duplicates were collected at arate of 1 per 20 field samples. Fieldduplicate RPDs for groundwater(<30%) were met.
Trip blanks were nondetect for VOCs. Sampleswere appropriately handled and preserved.
Calibration check standards were analyzedthroughout the analytical sequence.Recoveries were generally acceptable, within70% 130%. Some recoveries were <70%,indicating a possible low bias.
Not applicable. Data were reported in standard units. Detection limits were not provided. Of the seven wells selected for PDBinstallation, only six contained enoughwater to deploy the PDBs (86%deployment completion). All samplescollected were analyzed and producedviable data (100% analysis completion).
DAS Laboratory (Southwest ResearchInstitute): 2004
Field duplicates were collected at a rate of 1per 20 field samples. An RPD of 107%was noted for the field duplicate, indicatingpoor field precision for this analysis.
Replicate analyses were performed oneach sample until performance criteriawere met.
Trip blanks are not applicable to this analysis.Samples were appropriately handled and preserved.
Recoveries for the MS, LCS, and LFBstandards all met acceptance criteria.Recoveries for the instrument calibrationcheck standards were acceptable.
Not applicable. Data were reported in standard units. The reported detection limit for TOCis 0.1 mg/L.
The fieldwork proposed was completed(100%). Data were obtained for allsamples submitted.
EPA Mobile Laboratory: 2006 Field duplicates were collected at a rate of 1per 20 field samples. Field duplicate RPDsfor soil (<50%) were met for all samplesexcept B363.8 (TCE), TW35D2.5(TCE, PCE, cis1,2DCE), and TW44D25.5 (TCE, TCA). Field duplicate RPDsfor groundwater (<30%) were met.
Results of replicate analyses were notreported by the EPA mobilelaboratory.
Trip blanks were nondetect for VOCs. Sampleswere appropriately handled and preserved.
Laboratory QC samples, such as LaboratoryFortified Blanks, were not reported for themobile laboratory.
A total of 297 soil samples and 23groundwater samples werecollected. The majority of thesesamples were analyzed by the EPAmobile laboratory, providing arealand vertical coverage of the studyarea.
Data were reported in standard units, on a wetweight basis.
Reporting Limits for the EPA mobilelaboratory soil analyses were asfollows: TCE (10 ppb), cis1,2DCE(20 ppb), PCE (10 ppb), and 1,1,1TCA (10 ppb). Reporting Limits forthe EPA mobile laboratory soilanalyses were as follows: TCE (0.2ppb), cis1,2DCE (0.5 ppb), PCE(0.2 ppb), and 1,1,1TCA (0.5 ppb).
The fieldwork proposed was completed(100%). Data were obtained for allsamples submitted.
EPA Fixed Laboratory: 2006 Selected samples were submitted to OEMEfixed laboratory to confirm field results.Product samples (oily material) was alsosubmitted for identification.
The laboratory followed its StandardOperating Procedure.
Trip blanks were nondetect for VOCs. Sampleswere appropriately handled and preserved.
The laboratory followed its StandardOperating Procedure.
Not applicable. VOA data were reported in standard units, on awetweight basis.
Detection limits were reported in theOEME data and were sufficientlylow to meet project requirements.
The fieldwork proposed was completed(100%). Data were obtained for allsamples submitted.
DAS Laboratory (Air Toxics for D152) Field duplicates were collected at a rate of 1per 20 field samples. Air RPDs (<50%)were met.
Replicate analyses were performed oneach sample until performance criteriawere met.
A Trip Blank / Equipment Blank was collected.Samples were appropriately handled and preserved.
The laboratory failed to analyze LFBs spikedwith the entire list of target VOCs atconcentrations equal to the requiredquantitation limits. No validation action wastaken as a result of this LFB nonconformancesince the initial calibration contained a lowlevel standard at the quantitation limit.
Not applicable. Data were reported in standard units. Reporting limits identified in theDAS Specification were met.
The fieldwork proposed was completed(100%). Data were obtained for allsamples submitted.
RAS Laboratories (Datachem for VOCs andPCBs in soil Mitkem for Preand PostInjection Groundwater): 2006
Field duplicates were collected at a rate of 1per 20 field samples. Groundwater RPDs(<30%) were met for preinjectiongroundwater, with the exception of cis1,2DCE in TW9 (31%). Groundwater RPDs(<30%) were met for postinjectiongroundwater. Soil RPDs (<50%) were metfor soil PCBs and for soil VOCs with theexception of the VOCs cis1,2DCE (67%)and TCE (87%).
Replicate analyses were performed oneach sample until performance criteriawere met.
Trip blanks for VOC analysis were collected.Samples were appropriately handled and preserved.
The laboratory performed the RAS Scope ofWork appropriately. PE samples weresubmitted to assess laboratory accuracy.
Not applicable. Data were reported in standard units. Reporting limits identified in theRAS Scope of Work were met.
The fieldwork proposed was completed(100%). Data were obtained for allsamples submitted.
1 of1
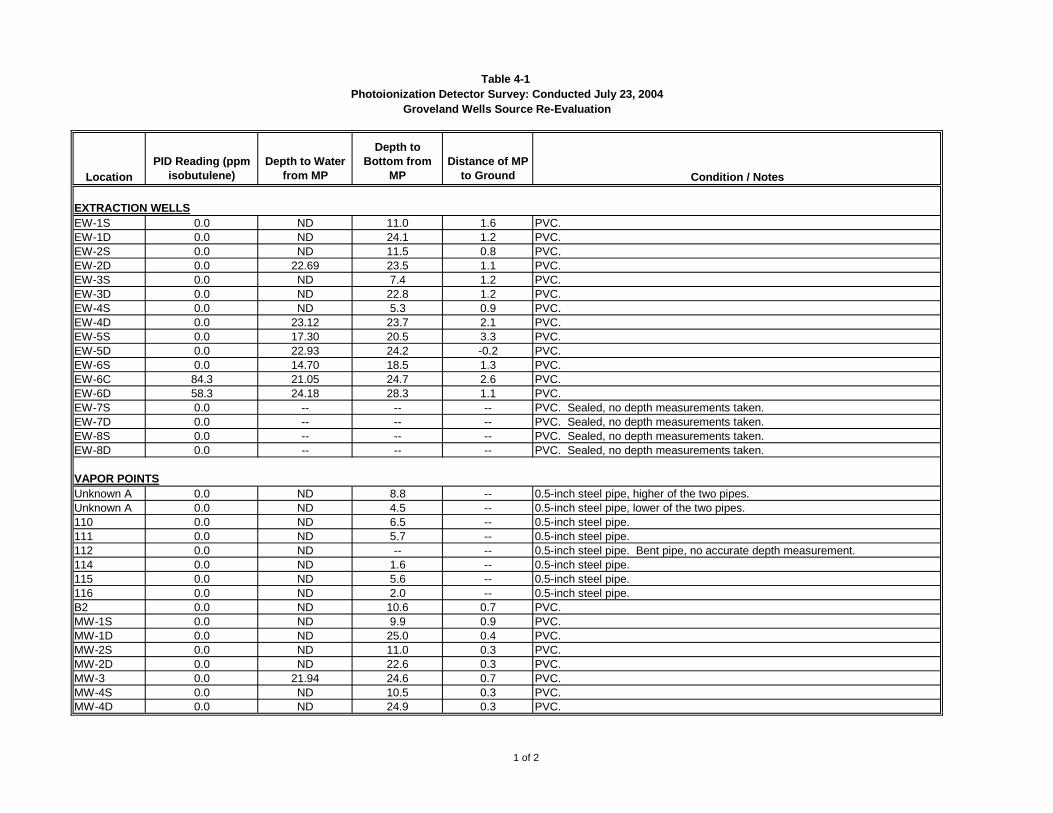
Table 41Photoionization Detector Survey: Conducted July 23, 2004
Groveland Wells Source ReEvaluation
LocationPID Reading (ppm
isobutulene)Depth to Water
from MP
Depth toBottom from
MPDistance of MP
to Ground Condition / Notes
EXTRACTION WELLSEW1S 0.0 ND 11.0 1.6 PVC.EW1D 0.0 ND 24.1 1.2 PVC.EW2S 0.0 ND 11.5 0.8 PVC.EW2D 0.0 22.69 23.5 1.1 PVC.EW3S 0.0 ND 7.4 1.2 PVC.EW3D 0.0 ND 22.8 1.2 PVC.EW4S 0.0 ND 5.3 0.9 PVC.EW4D 0.0 23.12 23.7 2.1 PVC.EW5S 0.0 17.30 20.5 3.3 PVC.EW5D 0.0 22.93 24.2 0.2 PVC.EW6S 0.0 14.70 18.5 1.3 PVC.EW6C 84.3 21.05 24.7 2.6 PVC.EW6D 58.3 24.18 28.3 1.1 PVC.EW7S 0.0 PVC. Sealed, no depth measurements taken.EW7D 0.0 PVC. Sealed, no depth measurements taken.EW8S 0.0 PVC. Sealed, no depth measurements taken.EW8D 0.0 PVC. Sealed, no depth measurements taken.
VAPOR POINTSUnknown A 0.0 ND 8.8 0.5inch steel pipe, higher of the two pipes.Unknown A 0.0 ND 4.5 0.5inch steel pipe, lower of the two pipes.110 0.0 ND 6.5 0.5inch steel pipe.111 0.0 ND 5.7 0.5inch steel pipe.112 0.0 ND 0.5inch steel pipe. Bent pipe, no accurate depth measurement.114 0.0 ND 1.6 0.5inch steel pipe.115 0.0 ND 5.6 0.5inch steel pipe.116 0.0 ND 2.0 0.5inch steel pipe.B2 0.0 ND 10.6 0.7 PVC.MW1S 0.0 ND 9.9 0.9 PVC.MW1D 0.0 ND 25.0 0.4 PVC.MW2S 0.0 ND 11.0 0.3 PVC.MW2D 0.0 ND 22.6 0.3 PVC.MW3 0.0 21.94 24.6 0.7 PVC.MW4S 0.0 ND 10.5 0.3 PVC.MW4D 0.0 ND 24.9 0.3 PVC.
1 of 2
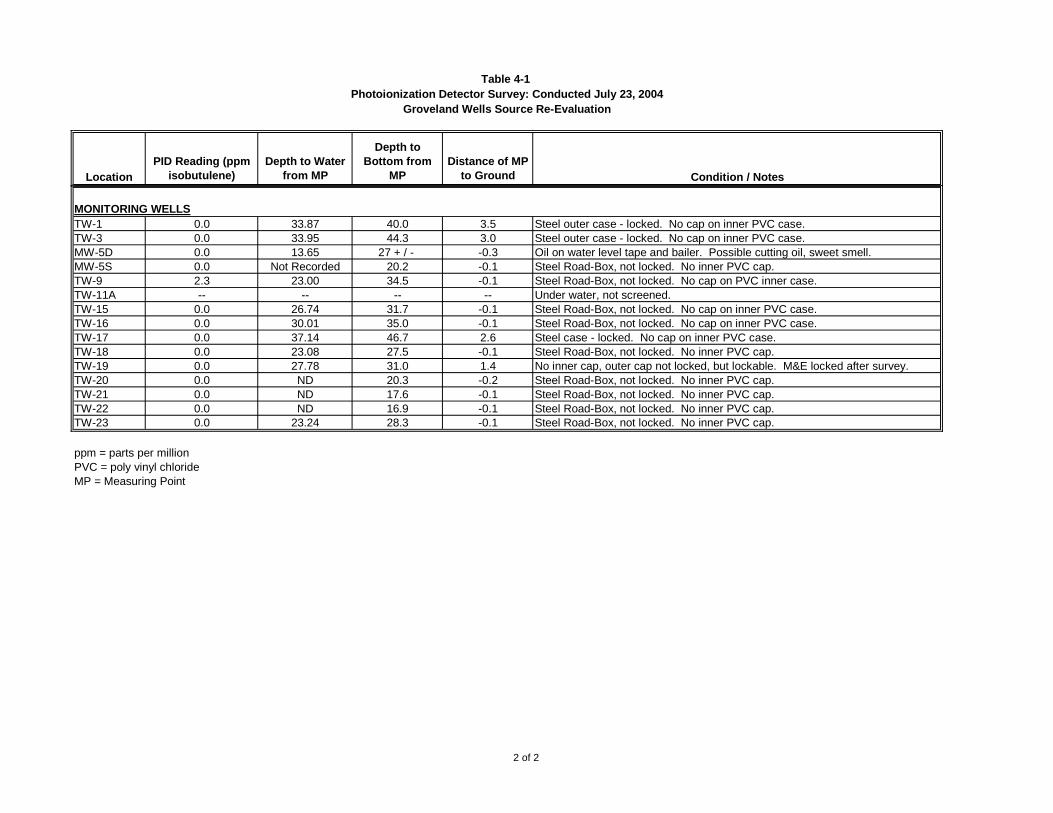
Table 41Photoionization Detector Survey: Conducted July 23, 2004
Groveland Wells Source ReEvaluation
LocationPID Reading (ppm
isobutulene)Depth to Water
from MP
Depth toBottom from
MPDistance of MP
to Ground Condition / Notes
MONITORING WELLSTW1 0.0 33.87 40.0 3.5 Steel outer case locked. No cap on inner PVC case.TW3 0.0 33.95 44.3 3.0 Steel outer case locked. No cap on inner PVC case.MW5D 0.0 13.65 27 + / 0.3 Oil on water level tape and bailer. Possible cutting oil, sweet smell.MW5S 0.0 Not Recorded 20.2 0.1 Steel RoadBox, not locked. No inner PVC cap.TW9 2.3 23.00 34.5 0.1 Steel RoadBox, not locked. No cap on PVC inner case.TW11A Under water, not screened.TW15 0.0 26.74 31.7 0.1 Steel RoadBox, not locked. No cap on inner PVC case.TW16 0.0 30.01 35.0 0.1 Steel RoadBox, not locked. No cap on inner PVC case.TW17 0.0 37.14 46.7 2.6 Steel case locked. No cap on inner PVC case.TW18 0.0 23.08 27.5 0.1 Steel RoadBox, not locked. No inner PVC cap.TW19 0.0 27.78 31.0 1.4 No inner cap, outer cap not locked, but lockable. M&E locked after survey.TW20 0.0 ND 20.3 0.2 Steel RoadBox, not locked. No inner PVC cap.TW21 0.0 ND 17.6 0.1 Steel RoadBox, not locked. No inner PVC cap.TW22 0.0 ND 16.9 0.1 Steel RoadBox, not locked. No inner PVC cap.TW23 0.0 23.24 28.3 0.1 Steel RoadBox, not locked. No inner PVC cap.
ppm = parts per millionPVC = poly vinyl chlorideMP = Measuring Point
2 of 2
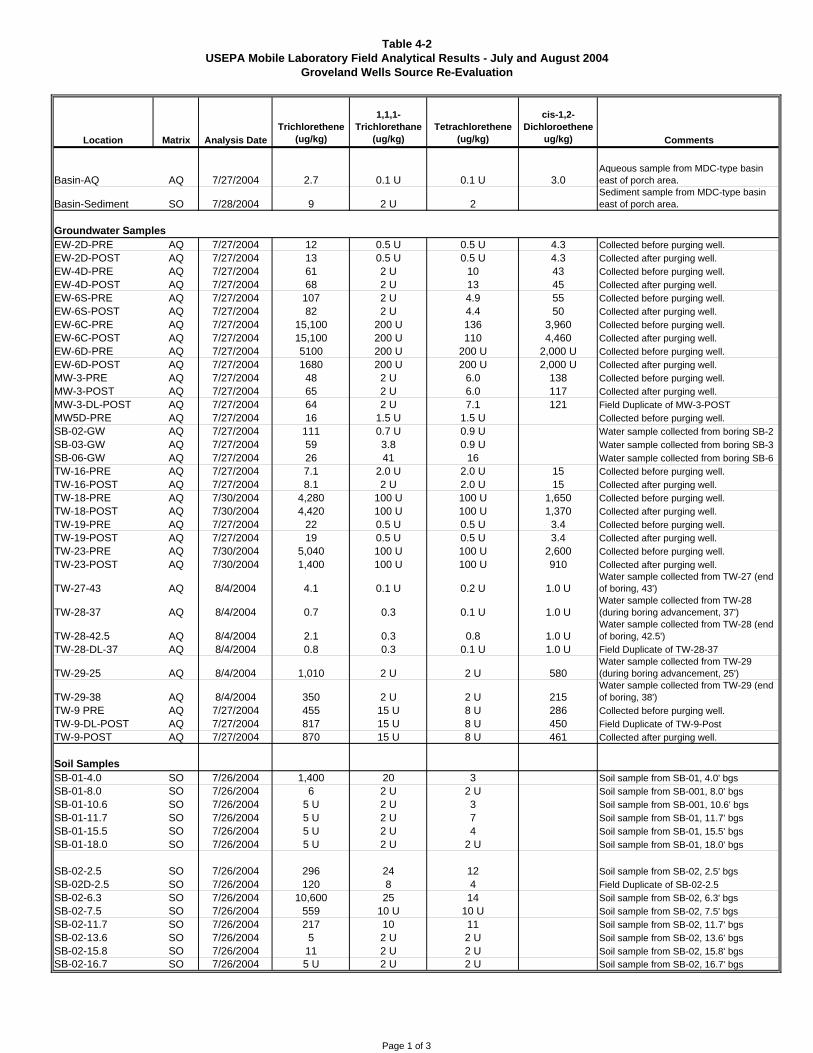
Table 42USEPA Mobile Laboratory Field Analytical Results July and August 2004
Groveland Wells Source ReEvaluation
Location Matrix Analysis DateTrichlorethene
(ug/kg)
1,1,1Trichlorethane
(ug/kg)Tetrachlorethene
(ug/kg)
cis1,2Dichloroethene
ug/kg) Comments
BasinAQ AQ 7/27/2004 2.7 0.1 U 0.1 U 3.0Aqueous sample from MDCtype basineast of porch area.
BasinSediment SO 7/28/2004 9 2 U 2Sediment sample from MDCtype basineast of porch area.
Groundwater SamplesEW2DPRE AQ 7/27/2004 12 0.5 U 0.5 U 4.3 Collected before purging well.EW2DPOST AQ 7/27/2004 13 0.5 U 0.5 U 4.3 Collected after purging well.EW4DPRE AQ 7/27/2004 61 2 U 10 43 Collected before purging well.EW4DPOST AQ 7/27/2004 68 2 U 13 45 Collected after purging well.EW6SPRE AQ 7/27/2004 107 2 U 4.9 55 Collected before purging well.EW6SPOST AQ 7/27/2004 82 2 U 4.4 50 Collected after purging well.EW6CPRE AQ 7/27/2004 15,100 200 U 136 3,960 Collected before purging well.EW6CPOST AQ 7/27/2004 15,100 200 U 110 4,460 Collected after purging well.EW6DPRE AQ 7/27/2004 5100 200 U 200 U 2,000 U Collected before purging well.EW6DPOST AQ 7/27/2004 1680 200 U 200 U 2,000 U Collected after purging well.MW3PRE AQ 7/27/2004 48 2 U 6.0 138 Collected before purging well.MW3POST AQ 7/27/2004 65 2 U 6.0 117 Collected after purging well.MW3DLPOST AQ 7/27/2004 64 2 U 7.1 121 Field Duplicate of MW3POSTMW5DPRE AQ 7/27/2004 16 1.5 U 1.5 U Collected before purging well.SB02GW AQ 7/27/2004 111 0.7 U 0.9 U Water sample collected from boring SB2SB03GW AQ 7/27/2004 59 3.8 0.9 U Water sample collected from boring SB3SB06GW AQ 7/27/2004 26 41 16 Water sample collected from boring SB6TW16PRE AQ 7/27/2004 7.1 2.0 U 2.0 U 15 Collected before purging well.TW16POST AQ 7/27/2004 8.1 2 U 2.0 U 15 Collected after purging well.TW18PRE AQ 7/30/2004 4,280 100 U 100 U 1,650 Collected before purging well.TW18POST AQ 7/30/2004 4,420 100 U 100 U 1,370 Collected after purging well.TW19PRE AQ 7/27/2004 22 0.5 U 0.5 U 3.4 Collected before purging well.TW19POST AQ 7/27/2004 19 0.5 U 0.5 U 3.4 Collected after purging well.TW23PRE AQ 7/30/2004 5,040 100 U 100 U 2,600 Collected before purging well.TW23POST AQ 7/30/2004 1,400 100 U 100 U 910 Collected after purging well.
TW2743 AQ 8/4/2004 4.1 0.1 U 0.2 U 1.0 UWater sample collected from TW27 (endof boring, 43')
TW2837 AQ 8/4/2004 0.7 0.3 0.1 U 1.0 UWater sample collected from TW28(during boring advancement, 37')
TW2842.5 AQ 8/4/2004 2.1 0.3 0.8 1.0 UWater sample collected from TW28 (endof boring, 42.5')
TW28DL37 AQ 8/4/2004 0.8 0.3 0.1 U 1.0 U Field Duplicate of TW2837
TW2925 AQ 8/4/2004 1,010 2 U 2 U 580Water sample collected from TW29(during boring advancement, 25')
TW2938 AQ 8/4/2004 350 2 U 2 U 215Water sample collected from TW29 (endof boring, 38')
TW9 PRE AQ 7/27/2004 455 15 U 8 U 286 Collected before purging well.TW9DLPOST AQ 7/27/2004 817 15 U 8 U 450 Field Duplicate of TW9PostTW9POST AQ 7/27/2004 870 15 U 8 U 461 Collected after purging well.
Soil SamplesSB014.0 SO 7/26/2004 1,400 20 3 Soil sample from SB01, 4.0' bgsSB018.0 SO 7/26/2004 6 2 U 2 U Soil sample from SB001, 8.0' bgsSB0110.6 SO 7/26/2004 5 U 2 U 3 Soil sample from SB001, 10.6' bgsSB0111.7 SO 7/26/2004 5 U 2 U 7 Soil sample from SB01, 11.7' bgsSB0115.5 SO 7/26/2004 5 U 2 U 4 Soil sample from SB01, 15.5' bgsSB0118.0 SO 7/26/2004 5 U 2 U 2 U Soil sample from SB01, 18.0' bgs
SB022.5 SO 7/26/2004 296 24 12 Soil sample from SB02, 2.5' bgsSB02D2.5 SO 7/26/2004 120 8 4 Field Duplicate of SB022.5SB026.3 SO 7/26/2004 10,600 25 14 Soil sample from SB02, 6.3' bgsSB027.5 SO 7/26/2004 559 10 U 10 U Soil sample from SB02, 7.5' bgsSB0211.7 SO 7/26/2004 217 10 11 Soil sample from SB02, 11.7' bgsSB0213.6 SO 7/26/2004 5 2 U 2 U Soil sample from SB02, 13.6' bgsSB0215.8 SO 7/26/2004 11 2 U 2 U Soil sample from SB02, 15.8' bgsSB0216.7 SO 7/26/2004 5 U 2 U 2 U Soil sample from SB02, 16.7' bgs
Page 1 of 3
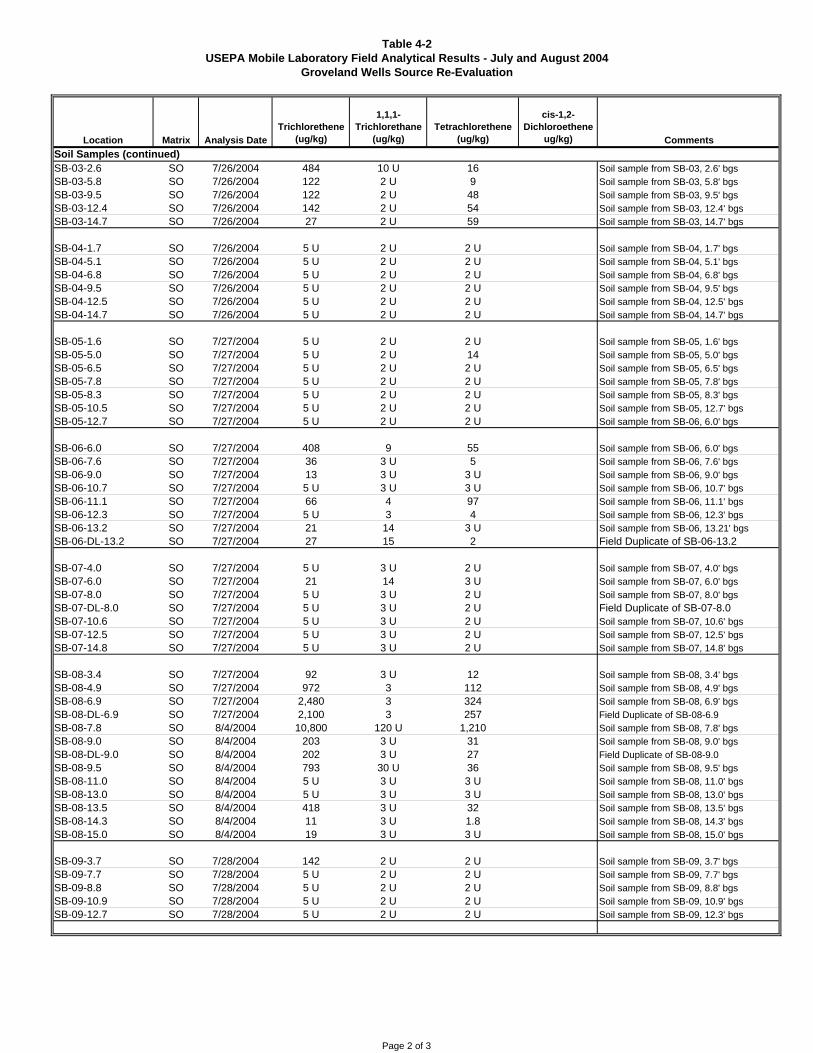
Table 42USEPA Mobile Laboratory Field Analytical Results July and August 2004
Groveland Wells Source ReEvaluation
Location Matrix Analysis DateTrichlorethene
(ug/kg)
1,1,1Trichlorethane
(ug/kg)Tetrachlorethene
(ug/kg)
cis1,2Dichloroethene
ug/kg) CommentsSoil Samples (continued)SB032.6 SO 7/26/2004 484 10 U 16 Soil sample from SB03, 2.6' bgsSB035.8 SO 7/26/2004 122 2 U 9 Soil sample from SB03, 5.8' bgsSB039.5 SO 7/26/2004 122 2 U 48 Soil sample from SB03, 9.5' bgsSB0312.4 SO 7/26/2004 142 2 U 54 Soil sample from SB03, 12.4' bgsSB0314.7 SO 7/26/2004 27 2 U 59 Soil sample from SB03, 14.7' bgs
SB041.7 SO 7/26/2004 5 U 2 U 2 U Soil sample from SB04, 1.7' bgsSB045.1 SO 7/26/2004 5 U 2 U 2 U Soil sample from SB04, 5.1' bgsSB046.8 SO 7/26/2004 5 U 2 U 2 U Soil sample from SB04, 6.8' bgsSB049.5 SO 7/26/2004 5 U 2 U 2 U Soil sample from SB04, 9.5' bgsSB0412.5 SO 7/26/2004 5 U 2 U 2 U Soil sample from SB04, 12.5' bgsSB0414.7 SO 7/26/2004 5 U 2 U 2 U Soil sample from SB04, 14.7' bgs
SB051.6 SO 7/27/2004 5 U 2 U 2 U Soil sample from SB05, 1.6' bgsSB055.0 SO 7/27/2004 5 U 2 U 14 Soil sample from SB05, 5.0' bgsSB056.5 SO 7/27/2004 5 U 2 U 2 U Soil sample from SB05, 6.5' bgsSB057.8 SO 7/27/2004 5 U 2 U 2 U Soil sample from SB05, 7.8' bgsSB058.3 SO 7/27/2004 5 U 2 U 2 U Soil sample from SB05, 8.3' bgsSB0510.5 SO 7/27/2004 5 U 2 U 2 U Soil sample from SB05, 12.7' bgsSB0512.7 SO 7/27/2004 5 U 2 U 2 U Soil sample from SB06, 6.0' bgs
SB066.0 SO 7/27/2004 408 9 55 Soil sample from SB06, 6.0' bgsSB067.6 SO 7/27/2004 36 3 U 5 Soil sample from SB06, 7.6' bgsSB069.0 SO 7/27/2004 13 3 U 3 U Soil sample from SB06, 9.0' bgsSB0610.7 SO 7/27/2004 5 U 3 U 3 U Soil sample from SB06, 10.7' bgsSB0611.1 SO 7/27/2004 66 4 97 Soil sample from SB06, 11.1' bgsSB0612.3 SO 7/27/2004 5 U 3 4 Soil sample from SB06, 12.3' bgsSB0613.2 SO 7/27/2004 21 14 3 U Soil sample from SB06, 13.21' bgsSB06DL13.2 SO 7/27/2004 27 15 2 Field Duplicate of SB0613.2
SB074.0 SO 7/27/2004 5 U 3 U 2 U Soil sample from SB07, 4.0' bgsSB076.0 SO 7/27/2004 21 14 3 U Soil sample from SB07, 6.0' bgsSB078.0 SO 7/27/2004 5 U 3 U 2 U Soil sample from SB07, 8.0' bgsSB07DL8.0 SO 7/27/2004 5 U 3 U 2 U Field Duplicate of SB078.0SB0710.6 SO 7/27/2004 5 U 3 U 2 U Soil sample from SB07, 10.6' bgsSB0712.5 SO 7/27/2004 5 U 3 U 2 U Soil sample from SB07, 12.5' bgsSB0714.8 SO 7/27/2004 5 U 3 U 2 U Soil sample from SB07, 14.8' bgs
SB083.4 SO 7/27/2004 92 3 U 12 Soil sample from SB08, 3.4' bgsSB084.9 SO 7/27/2004 972 3 112 Soil sample from SB08, 4.9' bgsSB086.9 SO 7/27/2004 2,480 3 324 Soil sample from SB08, 6.9' bgsSB08DL6.9 SO 7/27/2004 2,100 3 257 Field Duplicate of SB086.9SB087.8 SO 8/4/2004 10,800 120 U 1,210 Soil sample from SB08, 7.8' bgsSB089.0 SO 8/4/2004 203 3 U 31 Soil sample from SB08, 9.0' bgsSB08DL9.0 SO 8/4/2004 202 3 U 27 Field Duplicate of SB089.0SB089.5 SO 8/4/2004 793 30 U 36 Soil sample from SB08, 9.5' bgsSB0811.0 SO 8/4/2004 5 U 3 U 3 U Soil sample from SB08, 11.0' bgsSB0813.0 SO 8/4/2004 5 U 3 U 3 U Soil sample from SB08, 13.0' bgsSB0813.5 SO 8/4/2004 418 3 U 32 Soil sample from SB08, 13.5' bgsSB0814.3 SO 8/4/2004 11 3 U 1.8 Soil sample from SB08, 14.3' bgsSB0815.0 SO 8/4/2004 19 3 U 3 U Soil sample from SB08, 15.0' bgs
SB093.7 SO 7/28/2004 142 2 U 2 U Soil sample from SB09, 3.7' bgsSB097.7 SO 7/28/2004 5 U 2 U 2 U Soil sample from SB09, 7.7' bgsSB098.8 SO 7/28/2004 5 U 2 U 2 U Soil sample from SB09, 8.8' bgsSB0910.9 SO 7/28/2004 5 U 2 U 2 U Soil sample from SB09, 10.9' bgsSB0912.7 SO 7/28/2004 5 U 2 U 2 U Soil sample from SB09, 12.3' bgs
Page 2 of 3
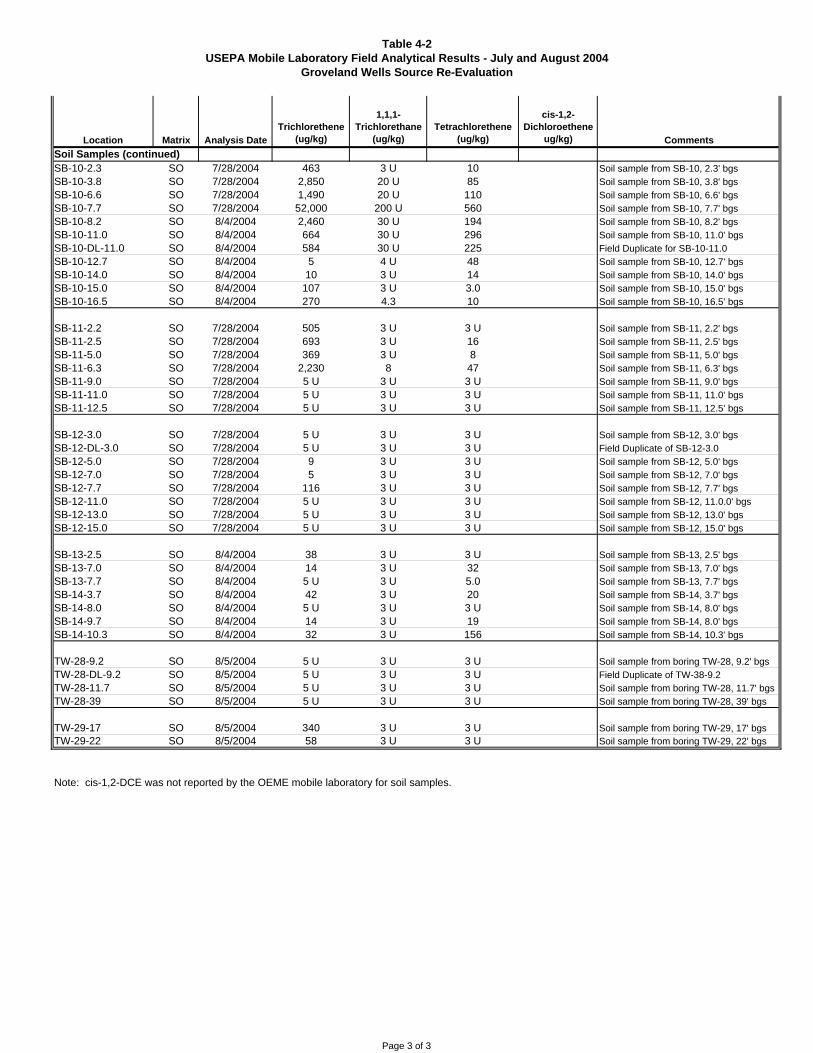
Table 42USEPA Mobile Laboratory Field Analytical Results July and August 2004
Groveland Wells Source ReEvaluation
Location Matrix Analysis DateTrichlorethene
(ug/kg)
1,1,1Trichlorethane
(ug/kg)Tetrachlorethene
(ug/kg)
cis1,2Dichloroethene
ug/kg) CommentsSoil Samples (continued)SB102.3 SO 7/28/2004 463 3 U 10 Soil sample from SB10, 2.3' bgsSB103.8 SO 7/28/2004 2,850 20 U 85 Soil sample from SB10, 3.8' bgsSB106.6 SO 7/28/2004 1,490 20 U 110 Soil sample from SB10, 6.6' bgsSB107.7 SO 7/28/2004 52,000 200 U 560 Soil sample from SB10, 7.7' bgsSB108.2 SO 8/4/2004 2,460 30 U 194 Soil sample from SB10, 8.2' bgsSB1011.0 SO 8/4/2004 664 30 U 296 Soil sample from SB10, 11.0' bgsSB10DL11.0 SO 8/4/2004 584 30 U 225 Field Duplicate for SB1011.0SB1012.7 SO 8/4/2004 5 4 U 48 Soil sample from SB10, 12.7' bgsSB1014.0 SO 8/4/2004 10 3 U 14 Soil sample from SB10, 14.0' bgsSB1015.0 SO 8/4/2004 107 3 U 3.0 Soil sample from SB10, 15.0' bgsSB1016.5 SO 8/4/2004 270 4.3 10 Soil sample from SB10, 16.5' bgs
SB112.2 SO 7/28/2004 505 3 U 3 U Soil sample from SB11, 2.2' bgsSB112.5 SO 7/28/2004 693 3 U 16 Soil sample from SB11, 2.5' bgsSB115.0 SO 7/28/2004 369 3 U 8 Soil sample from SB11, 5.0' bgsSB116.3 SO 7/28/2004 2,230 8 47 Soil sample from SB11, 6.3' bgsSB119.0 SO 7/28/2004 5 U 3 U 3 U Soil sample from SB11, 9.0' bgsSB1111.0 SO 7/28/2004 5 U 3 U 3 U Soil sample from SB11, 11.0' bgsSB1112.5 SO 7/28/2004 5 U 3 U 3 U Soil sample from SB11, 12.5' bgs
SB123.0 SO 7/28/2004 5 U 3 U 3 U Soil sample from SB12, 3.0' bgsSB12DL3.0 SO 7/28/2004 5 U 3 U 3 U Field Duplicate of SB123.0SB125.0 SO 7/28/2004 9 3 U 3 U Soil sample from SB12, 5.0' bgsSB127.0 SO 7/28/2004 5 3 U 3 U Soil sample from SB12, 7.0' bgsSB127.7 SO 7/28/2004 116 3 U 3 U Soil sample from SB12, 7.7' bgsSB1211.0 SO 7/28/2004 5 U 3 U 3 U Soil sample from SB12, 11.0.0' bgsSB1213.0 SO 7/28/2004 5 U 3 U 3 U Soil sample from SB12, 13.0' bgsSB1215.0 SO 7/28/2004 5 U 3 U 3 U Soil sample from SB12, 15.0' bgs
SB132.5 SO 8/4/2004 38 3 U 3 U Soil sample from SB13, 2.5' bgsSB137.0 SO 8/4/2004 14 3 U 32 Soil sample from SB13, 7.0' bgsSB137.7 SO 8/4/2004 5 U 3 U 5.0 Soil sample from SB13, 7.7' bgsSB143.7 SO 8/4/2004 42 3 U 20 Soil sample from SB14, 3.7' bgsSB148.0 SO 8/4/2004 5 U 3 U 3 U Soil sample from SB14, 8.0' bgsSB149.7 SO 8/4/2004 14 3 U 19 Soil sample from SB14, 8.0' bgsSB1410.3 SO 8/4/2004 32 3 U 156 Soil sample from SB14, 10.3' bgs
TW289.2 SO 8/5/2004 5 U 3 U 3 U Soil sample from boring TW28, 9.2' bgsTW28DL9.2 SO 8/5/2004 5 U 3 U 3 U Field Duplicate of TW389.2TW2811.7 SO 8/5/2004 5 U 3 U 3 U Soil sample from boring TW28, 11.7' bgsTW2839 SO 8/5/2004 5 U 3 U 3 U Soil sample from boring TW28, 39' bgs
TW2917 SO 8/5/2004 340 3 U 3 U Soil sample from boring TW29, 17' bgsTW2922 SO 8/5/2004 58 3 U 3 U Soil sample from boring TW29, 22' bgs
Note: cis1,2DCE was not reported by the OEME mobile laboratory for soil samples.
Page 3 of 3
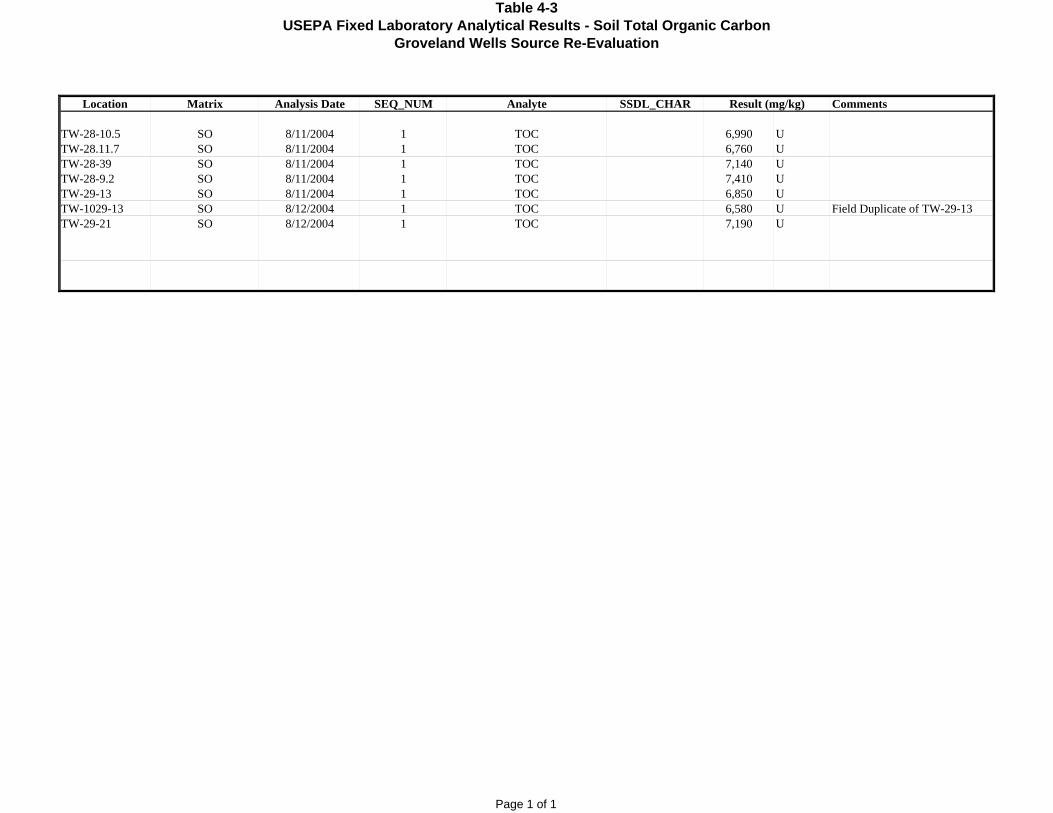
Table 43USEPA Fixed Laboratory Analytical Results Soil Total Organic Carbon
Groveland Wells Source ReEvaluation
Location Matrix Analysis Date SEQ_NUM Analyte SSDL_CHAR Comments
TW2810.5 SO 8/11/2004 1 TOC 6,990 UTW28.11.7 SO 8/11/2004 1 TOC 6,760 UTW2839 SO 8/11/2004 1 TOC 7,140 UTW289.2 SO 8/11/2004 1 TOC 7,410 UTW2913 SO 8/11/2004 1 TOC 6,850 UTW102913 SO 8/12/2004 1 TOC 6,580 U Field Duplicate of TW2913TW2921 SO 8/12/2004 1 TOC 7,190 U
Result (mg/kg)
Page 1 of 1

Table 44OnSite Sentex Gas Chromatograph Groundwater Analytical Results, and TOC in Groundwater Results October 2004
Groveland Wells Source ReEvaluation
t1,2DCE c1,2DCE 1,1,1TCA TCE PCE(µg/L) (µg/L) (µg/L) (µg/L) (µg/L)
45 MW5D 26Oct04 19:42 Sample 1.0 ND 3.3 ND 9.3 ND Sample undiluted from 1L jar.109 MW5DA 28Oct04 15:59 Sample 2.0 ND 1.7 ND 5.4 ND Sample from 4 VOA vials combined110 MW5DB 28Oct04 16:15 Sample 2.0 ND 1.8 ND 5.9 ND Sample from 4 VOA vials combined112 MW5DC 28Oct04 16:33 Sample 2.0 ND 2.0 ND 6.2 ND Sample from 4 VOA vials combined113 MW5DD 28Oct04 16:43 Sample 1.9 ND 2.3 ND 6.9 ND Sample from 4 VOA vials combined
43 TW15 26Oct04 19:01 Sample 1.0 ND 3.0 ND 20 0.11 Sample undiluted from 1L jar.114 TW15A 28Oct04 16:53 Sample 2.0 ND 1.3 ND 9.8 ND Sample from 4 VOA vials combined
73 TW17A 27Oct04 15:28 Sample 200 ND 460 ND 3,900 ND74 TW17B 27Oct04 15:38 Sample 200 10 500 ND 5,600 ND93 TW17C 28Oct04 11:15 Sample 5,000 ND 200 ND 89,000 ND94 TW17C 28Oct04 11:27 Sample Duplicate 5,000 ND ND ND 100,000 ND97 TW17D 28Oct04 12:09 Sample 5,000 ND ND ND 150,000 ND98 TW17D 28Oct04 12:24 Sample Duplicate 5,000 ND ND ND 160,000 ND15 TW23A 26Oct04 11:22 Sample 250 23 1,200 ND 5,700 1048 TW23A 26Oct04 20:22 Sample 499 ND 1,100 ND 4,600 ND49 TW23A 26Oct04 20:33 Sample Duplicate 499 ND 930 ND 4,100 ND16 TW23B 26Oct04 11:38 Sample 250 ND 990 ND 4,900 2.550 TW23B 26Oct04 20:53 Sample 499 ND 900 ND 4,200 ND17 TW23CSB 26Oct04 11:58 Sample 250 ND 980 ND 4,900 2.538 TW30 26Oct04 17:10 Sample 1.0 ND 0.20 ND 1.1 0.99 Sample undiluted from 1L jar. Very small unknown at 141s
104 TW30A 28Oct04 14:48 Sample 5.0 ND ND ND 0.30 0.05 Sample from 4 VOA vials combined105 TW30B 28Oct04 15:06 Sample 2.0 ND ND ND 0.08 0.06 Sample from 4 VOA vials combined106 TW30C 28Oct04 15:21 Sample 3.6 ND ND ND ND ND Sample from 3 VOA vials combined107 TW30D 28Oct04 15:34 Sample 2.0 ND ND ND ND ND Sample from 4 VOA vials combined
31 TW31 26Oct04 15:28 Sample 1.0 ND 0.48 ND 25 0.09 Sample undiluted from 1L jar. Very small unknown at 142s32 TW31 26Oct04 15:42 Sample Duplicate 1.0 ND 0.48 ND 25 0.08 Sample undiluted from 1L jar. Very small unknown at 142s29 TW31A 26Oct04 15:06 Sample 16 ND ND ND 10 1.333 TW31B 26Oct04 16:07 Sample 2.0 ND 0.24 ND 11 0.04 Sample from 4 VOA vials combined34 TW31C 26Oct04 16:17 Sample 2.0 ND 0.26 ND 14 ND Sample from 4 VOA vials combined35 TW31D 26Oct04 16:27 Sample 2.0 ND 0.24 ND 13 ND Sample from 4 VOA vials combined
TOC IN GROUNDWATER (DAS PROGRAM)
DAS Number Sample Location Result* UnitD05271 TW30 1.79 mg/LD05272 TW30CS 5.87 mg/L Duplicate of TW30D05273 TW31 1.37 mg/LD05274 TW17 15.4 mg/LD05277 EW6D 15.2 mg/LD05278 TW18 18.5 mg/LD05279 TW23 5.36 mg/L
* Result is the average of the duplicate analyses.
DilutionFactorSample Run Field Sample ID Date Time Type Comments
Analyte Concentration
Page 1 of 1
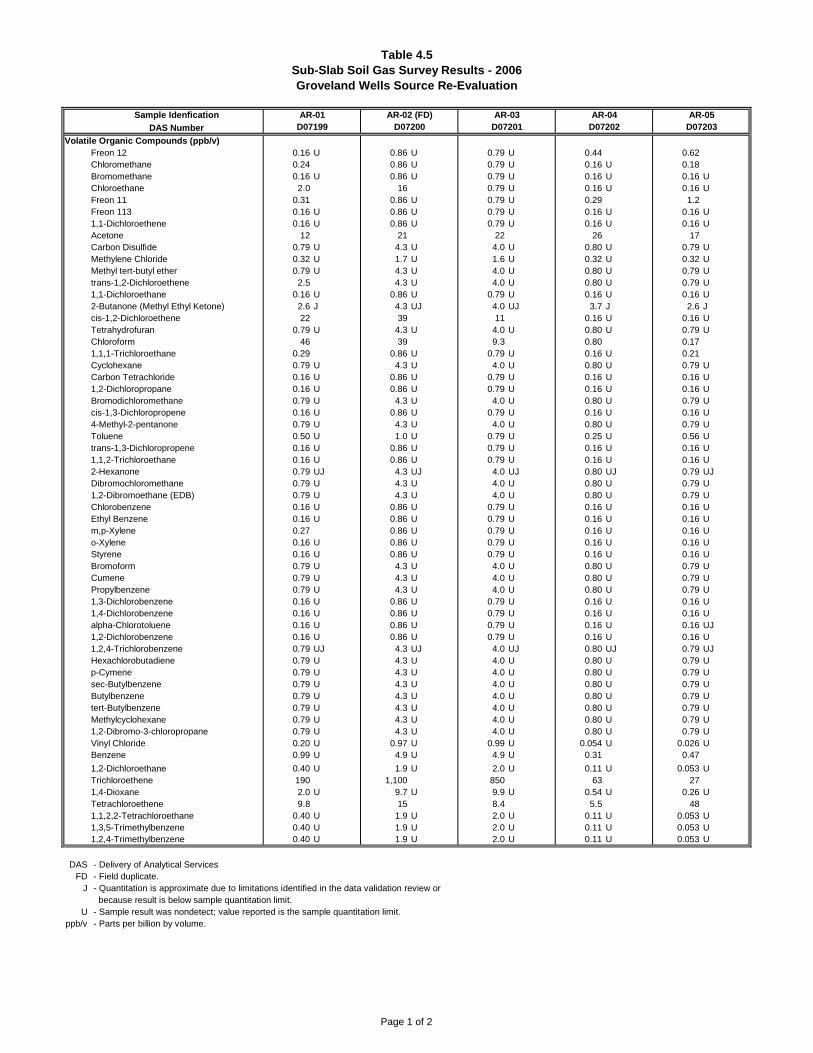
Table 4.5SubSlab Soil Gas Survey Results 2006Groveland Wells Source ReEvaluation
Sample Idenfication AR01 AR02 (FD) AR03 AR04 AR05DAS Number
Volatile Organic Compounds (ppb/v)Freon 12 0.16 U 0.86 U 0.79 U 0.44 0.62Chloromethane 0.24 0.86 U 0.79 U 0.16 U 0.18Bromomethane 0.16 U 0.86 U 0.79 U 0.16 U 0.16 UChloroethane 2.0 16 0.79 U 0.16 U 0.16 UFreon 11 0.31 0.86 U 0.79 U 0.29 1.2Freon 113 0.16 U 0.86 U 0.79 U 0.16 U 0.16 U1,1Dichloroethene 0.16 U 0.86 U 0.79 U 0.16 U 0.16 UAcetone 12 21 22 26 17Carbon Disulfide 0.79 U 4.3 U 4.0 U 0.80 U 0.79 UMethylene Chloride 0.32 U 1.7 U 1.6 U 0.32 U 0.32 UMethyl tertbutyl ether 0.79 U 4.3 U 4.0 U 0.80 U 0.79 Utrans1,2Dichloroethene 2.5 4.3 U 4.0 U 0.80 U 0.79 U1,1Dichloroethane 0.16 U 0.86 U 0.79 U 0.16 U 0.16 U2Butanone (Methyl Ethyl Ketone) 2.6 J 4.3 UJ 4.0 UJ 3.7 J 2.6 Jcis1,2Dichloroethene 22 39 11 0.16 U 0.16 UTetrahydrofuran 0.79 U 4.3 U 4.0 U 0.80 U 0.79 UChloroform 46 39 9.3 0.80 0.171,1,1Trichloroethane 0.29 0.86 U 0.79 U 0.16 U 0.21Cyclohexane 0.79 U 4.3 U 4.0 U 0.80 U 0.79 UCarbon Tetrachloride 0.16 U 0.86 U 0.79 U 0.16 U 0.16 U1,2Dichloropropane 0.16 U 0.86 U 0.79 U 0.16 U 0.16 UBromodichloromethane 0.79 U 4.3 U 4.0 U 0.80 U 0.79 Ucis1,3Dichloropropene 0.16 U 0.86 U 0.79 U 0.16 U 0.16 U4Methyl2pentanone 0.79 U 4.3 U 4.0 U 0.80 U 0.79 UToluene 0.50 U 1.0 U 0.79 U 0.25 U 0.56 Utrans1,3Dichloropropene 0.16 U 0.86 U 0.79 U 0.16 U 0.16 U1,1,2Trichloroethane 0.16 U 0.86 U 0.79 U 0.16 U 0.16 U2Hexanone 0.79 UJ 4.3 UJ 4.0 UJ 0.80 UJ 0.79 UJDibromochloromethane 0.79 U 4.3 U 4.0 U 0.80 U 0.79 U1,2Dibromoethane (EDB) 0.79 U 4.3 U 4.0 U 0.80 U 0.79 UChlorobenzene 0.16 U 0.86 U 0.79 U 0.16 U 0.16 UEthyl Benzene 0.16 U 0.86 U 0.79 U 0.16 U 0.16 Um,pXylene 0.27 0.86 U 0.79 U 0.16 U 0.16 UoXylene 0.16 U 0.86 U 0.79 U 0.16 U 0.16 UStyrene 0.16 U 0.86 U 0.79 U 0.16 U 0.16 UBromoform 0.79 U 4.3 U 4.0 U 0.80 U 0.79 UCumene 0.79 U 4.3 U 4.0 U 0.80 U 0.79 UPropylbenzene 0.79 U 4.3 U 4.0 U 0.80 U 0.79 U1,3Dichlorobenzene 0.16 U 0.86 U 0.79 U 0.16 U 0.16 U1,4Dichlorobenzene 0.16 U 0.86 U 0.79 U 0.16 U 0.16 UalphaChlorotoluene 0.16 U 0.86 U 0.79 U 0.16 U 0.16 UJ1,2Dichlorobenzene 0.16 U 0.86 U 0.79 U 0.16 U 0.16 U1,2,4Trichlorobenzene 0.79 UJ 4.3 UJ 4.0 UJ 0.80 UJ 0.79 UJHexachlorobutadiene 0.79 U 4.3 U 4.0 U 0.80 U 0.79 UpCymene 0.79 U 4.3 U 4.0 U 0.80 U 0.79 UsecButylbenzene 0.79 U 4.3 U 4.0 U 0.80 U 0.79 UButylbenzene 0.79 U 4.3 U 4.0 U 0.80 U 0.79 UtertButylbenzene 0.79 U 4.3 U 4.0 U 0.80 U 0.79 UMethylcyclohexane 0.79 U 4.3 U 4.0 U 0.80 U 0.79 U1,2Dibromo3chloropropane 0.79 U 4.3 U 4.0 U 0.80 U 0.79 UVinyl Chloride 0.20 U 0.97 U 0.99 U 0.054 U 0.026 UBenzene 0.99 U 4.9 U 4.9 U 0.31 0.471,2Dichloroethane 0.40 U 1.9 U 2.0 U 0.11 U 0.053 UTrichloroethene 190 1,100 850 63 271,4Dioxane 2.0 U 9.7 U 9.9 U 0.54 U 0.26 UTetrachloroethene 9.8 15 8.4 5.5 481,1,2,2Tetrachloroethane 0.40 U 1.9 U 2.0 U 0.11 U 0.053 U1,3,5Trimethylbenzene 0.40 U 1.9 U 2.0 U 0.11 U 0.053 U1,2,4Trimethylbenzene 0.40 U 1.9 U 2.0 U 0.11 U 0.053 U
DAS Delivery of Analytical ServicesFD Field duplicate.
J Quantitation is approximate due to limitations identified in the data validation review or because result is below sample quantitation limit.
U Sample result was nondetect; value reported is the sample quantitation limit.ppb/v Parts per billion by volume.
D07203D07199 D07200 D07201 D07202
Page 1 of 2
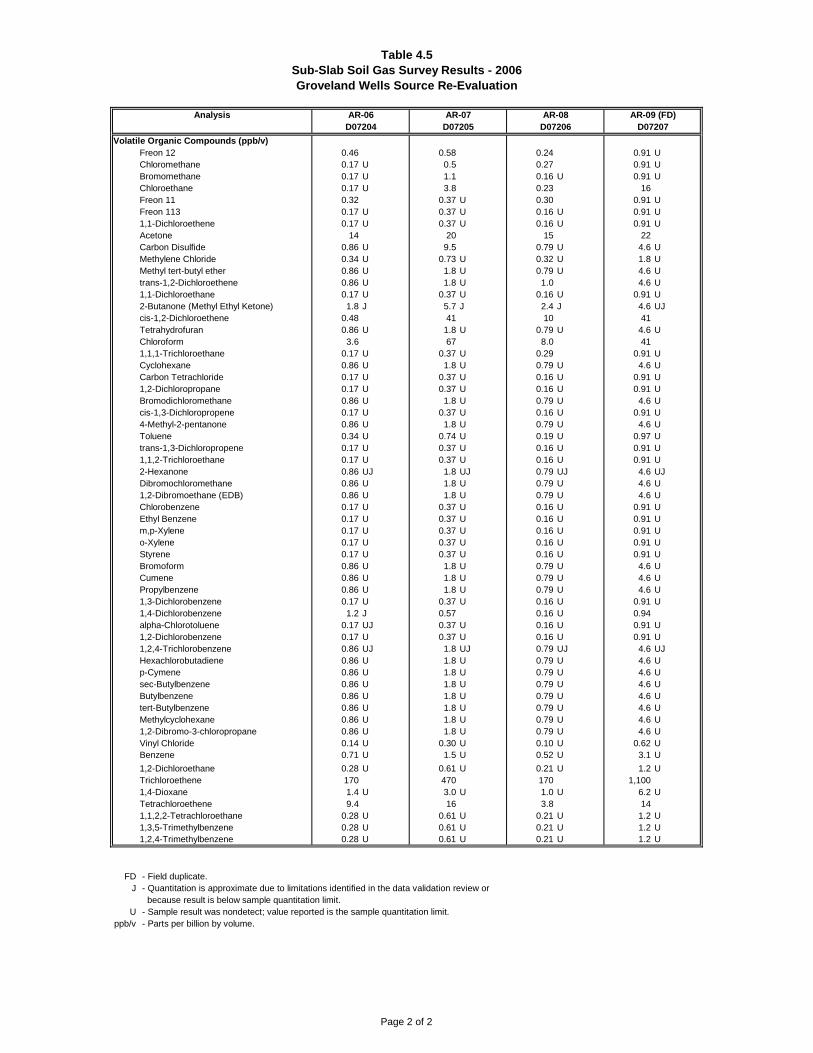
Table 4.5SubSlab Soil Gas Survey Results 2006Groveland Wells Source ReEvaluation
Analysis AR06 AR07 AR08 AR09 (FD)
Volatile Organic Compounds (ppb/v)Freon 12 0.46 0.58 0.24 0.91 UChloromethane 0.17 U 0.5 0.27 0.91 UBromomethane 0.17 U 1.1 0.16 U 0.91 UChloroethane 0.17 U 3.8 0.23 16Freon 11 0.32 0.37 U 0.30 0.91 UFreon 113 0.17 U 0.37 U 0.16 U 0.91 U1,1Dichloroethene 0.17 U 0.37 U 0.16 U 0.91 UAcetone 14 20 15 22Carbon Disulfide 0.86 U 9.5 0.79 U 4.6 UMethylene Chloride 0.34 U 0.73 U 0.32 U 1.8 UMethyl tertbutyl ether 0.86 U 1.8 U 0.79 U 4.6 Utrans1,2Dichloroethene 0.86 U 1.8 U 1.0 4.6 U1,1Dichloroethane 0.17 U 0.37 U 0.16 U 0.91 U2Butanone (Methyl Ethyl Ketone) 1.8 J 5.7 J 2.4 J 4.6 UJcis1,2Dichloroethene 0.48 41 10 41Tetrahydrofuran 0.86 U 1.8 U 0.79 U 4.6 UChloroform 3.6 67 8.0 411,1,1Trichloroethane 0.17 U 0.37 U 0.29 0.91 UCyclohexane 0.86 U 1.8 U 0.79 U 4.6 UCarbon Tetrachloride 0.17 U 0.37 U 0.16 U 0.91 U1,2Dichloropropane 0.17 U 0.37 U 0.16 U 0.91 UBromodichloromethane 0.86 U 1.8 U 0.79 U 4.6 Ucis1,3Dichloropropene 0.17 U 0.37 U 0.16 U 0.91 U4Methyl2pentanone 0.86 U 1.8 U 0.79 U 4.6 UToluene 0.34 U 0.74 U 0.19 U 0.97 Utrans1,3Dichloropropene 0.17 U 0.37 U 0.16 U 0.91 U1,1,2Trichloroethane 0.17 U 0.37 U 0.16 U 0.91 U2Hexanone 0.86 UJ 1.8 UJ 0.79 UJ 4.6 UJDibromochloromethane 0.86 U 1.8 U 0.79 U 4.6 U1,2Dibromoethane (EDB) 0.86 U 1.8 U 0.79 U 4.6 UChlorobenzene 0.17 U 0.37 U 0.16 U 0.91 UEthyl Benzene 0.17 U 0.37 U 0.16 U 0.91 Um,pXylene 0.17 U 0.37 U 0.16 U 0.91 UoXylene 0.17 U 0.37 U 0.16 U 0.91 UStyrene 0.17 U 0.37 U 0.16 U 0.91 UBromoform 0.86 U 1.8 U 0.79 U 4.6 UCumene 0.86 U 1.8 U 0.79 U 4.6 UPropylbenzene 0.86 U 1.8 U 0.79 U 4.6 U1,3Dichlorobenzene 0.17 U 0.37 U 0.16 U 0.91 U1,4Dichlorobenzene 1.2 J 0.57 0.16 U 0.94alphaChlorotoluene 0.17 UJ 0.37 U 0.16 U 0.91 U1,2Dichlorobenzene 0.17 U 0.37 U 0.16 U 0.91 U1,2,4Trichlorobenzene 0.86 UJ 1.8 UJ 0.79 UJ 4.6 UJHexachlorobutadiene 0.86 U 1.8 U 0.79 U 4.6 UpCymene 0.86 U 1.8 U 0.79 U 4.6 UsecButylbenzene 0.86 U 1.8 U 0.79 U 4.6 UButylbenzene 0.86 U 1.8 U 0.79 U 4.6 UtertButylbenzene 0.86 U 1.8 U 0.79 U 4.6 UMethylcyclohexane 0.86 U 1.8 U 0.79 U 4.6 U1,2Dibromo3chloropropane 0.86 U 1.8 U 0.79 U 4.6 UVinyl Chloride 0.14 U 0.30 U 0.10 U 0.62 UBenzene 0.71 U 1.5 U 0.52 U 3.1 U1,2Dichloroethane 0.28 U 0.61 U 0.21 U 1.2 UTrichloroethene 170 470 170 1,1001,4Dioxane 1.4 U 3.0 U 1.0 U 6.2 UTetrachloroethene 9.4 16 3.8 141,1,2,2Tetrachloroethane 0.28 U 0.61 U 0.21 U 1.2 U1,3,5Trimethylbenzene 0.28 U 0.61 U 0.21 U 1.2 U1,2,4Trimethylbenzene 0.28 U 0.61 U 0.21 U 1.2 U
FD Field duplicate.J Quantitation is approximate due to limitations identified in the data validation review or
because result is below sample quantitation limit.U Sample result was nondetect; value reported is the sample quantitation limit.
ppb/v Parts per billion by volume.
D07204 D07205 D07206 D07207
Page 2 of 2

Table 46USEPA Mobile Laboratory Field Analytical Results – May and June 2006
Groveland Source ReEvaluation
Location Matrix Analysis DateTrichlorethene(ug/kg)
1,1,1Trichlorethane(ug/kg)
Perchlorethene(ug/kg)
cis1,2Dichloroethene(ug/kg) Comments
TB01 QC 5/30/2006 10 U 10 U 10 U 15 UTB02 QC 5/31/2006 10 U 10 U 10 U 15 UTB03 SO 6/2/2006 10 U 10 U 10 U 15 UTB04 QC 6/5/2006 10 U 10 U 10 U 20 UTB06 SO 6/7/2006 10 U 10 U 10 U 20 UTB10 QC 6/12/2006 10 U 10 U 10 U 20 UTB11 QC 6/12/2006 10 U 10 U 10 U INTERFERENCETB12 QC 6/12/2006 10 U 10 U 10 U 20 U
B332.0 SO 6/12/2006 10 U 10 U 10 U 20 U All B33 samples fromB333.1 SO 6/12/2006 673 10 U 10 U 40 U boring at monitoring wellB335.5 SO 6/12/2006 35 10 U 10 U 20 U TW33B336.4 SO 6/12/2006 10 U 10 U 10 U 20 UB338.5 SO 6/12/2006 10 U 10 U 10 U 20 UB3310.5 SO 6/12/2006 27 10 U 10 U 20 UB3312.9 SO 6/12/2006 10 U 10 U 10 U 20 UB3312.9CS SO 6/12/2006 10 U 10 U 10 U 20 U Field Duplicate of B3312.9B3316.0 SO 6/12/2006 10 U 10 U 10 U 20 UB3317.8 SO 6/12/2006 10 U 10 U 10 U 20 UB3317.8CS SO 6/12/2006 10 U 10 U 10 U 20 U Field Duplicate of B3317.8B3320.0 SO 6/12/2006 10 U 10 U 10 U 20 UB3321.5 SO 6/12/2006 10 U 10 U 10 U 20 UB3324.0 SO 6/12/2006 10 U 10 U 10 U 20 UB3326.0 SO 6/12/2006 10 U 10 U 10 U 20 UB3330.0 SO 6/12/2006 10 U 10 U 10 U 20 UB3336.0 SO 6/12/2006 10 U 10 U 10 U 20 UB3341.0 SO 6/12/2006 10 U 10 U 10 U 20 U
B340.5 SO 6/1/2006 45 10 U 10 U 15 UB342.5 SO 6/1/2006 10 U 10 U 10 U 15 UB344.4 SO 6/1/2006 10,200 58 32 400 UB344.4CS SO 6/1/2006 6,800 54 29 340 U Field Duplicate of B344.4B348.0 SO 6/1/2006 10 U 10 U 10 U 15 UB3410.0 SO 6/1/2006 10 U 10 U 10 U 15 UB3411.7 SO 6/1/2006 10 U 10 U 10 U 15 UB3413.1 SO 6/1/2006 73 10 U 10 U 15 UB3416.0 SO 6/1/2006 10 U 10 U 10 U 15 UB3417.9 SO 6/2/2006 10 U 10 U 10 U 15 UB3420.0 SO 6/2/2006 10 U 10 U 10 U 15 UB3421.9 SO 6/2/2006 10 U 10 U 10 U 15 UB3425.7 SO 6/2/2006 10 U 10 U 10 U 15 UB3430.9 SO 6/2/2006 10 U 10 U 10 U 15 U
B34F90.9 SO 6/5/2006 10 U 10 U 10 U 20 UB34F92.0 SO 6/5/2006 10 U 10 U 10 U 20 UB34F94.5 SO 6/5/2006 11 10 U 10 U 20 U
B362.0 SO 6/8/2006 14 10 U 10 U 20 UB363.8 SO 6/8/2006 100 10 U 10 U 20 UB363.8CS SO 6/8/2006 32 10 U 10 U 20 U Field Duplicate of B363.8B366.0 SO 6/8/2006 10 U 10 U 10 U 20 UB368.0 SO 6/8/2006 10 U 10 U 10 U 20 UB369.0 SO 6/8/2006 11 10 U 10 U 20 UB3611.9 SO 6/8/2006 10 U 10 U 10 U 20 UB3614.0 SO 6/8/2006 10 U 10 U 10 U 20 UB3615.5 SO 6/8/2006 10 U 10 U 10 U 20 UB3617.8 SO 6/8/2006 10 U 10 U 10 U 20 UB3620.0 SO 6/8/2006 10 U 10 U 10 U 20 UB3624.0 SO 6/8/2006 10 U 10 U 10 U 20 UB3626.0 SO 6/8/2006 10 U 10 U 10 U 20 UB3631.0 SO 6/8/2006 10 U 10 U 10 U 20 UB3636.0 SO 6/8/2006 10 U 10 U 10 U 20 UB3639.5 SO 6/8/2006 10 U 10 U 10 U 20 U
Page 1 of 7
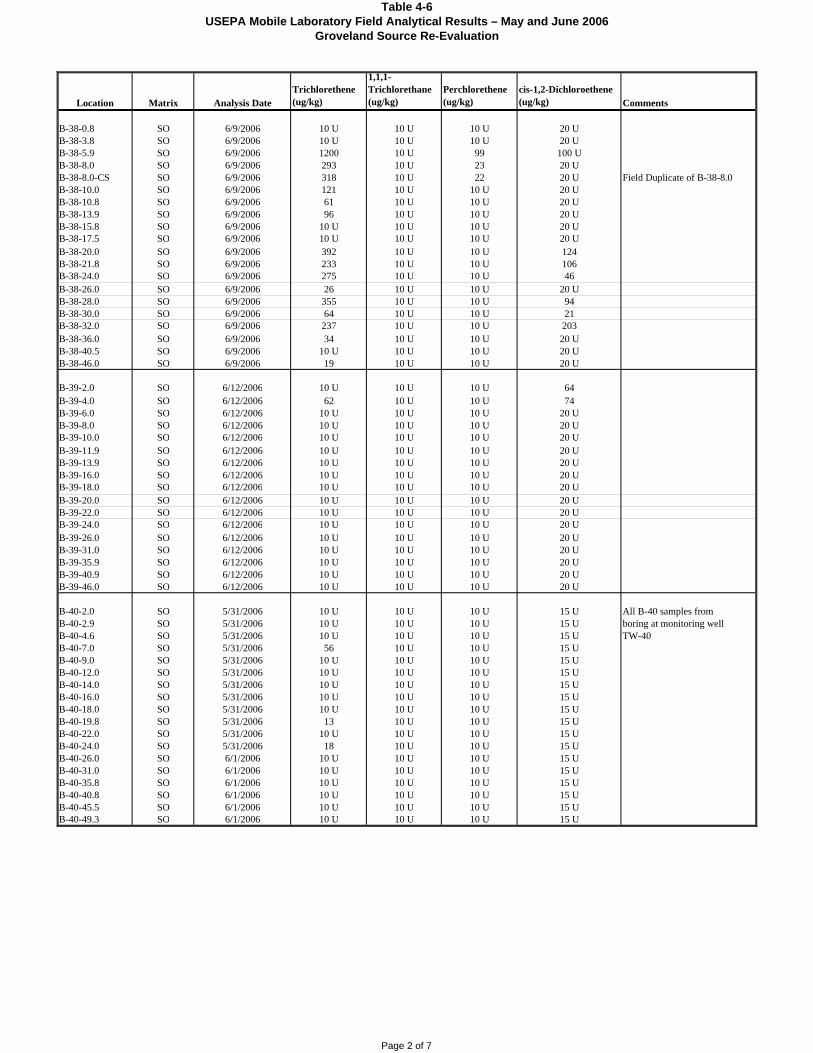
Table 46USEPA Mobile Laboratory Field Analytical Results – May and June 2006
Groveland Source ReEvaluation
Location Matrix Analysis DateTrichlorethene(ug/kg)
1,1,1Trichlorethane(ug/kg)
Perchlorethene(ug/kg)
cis1,2Dichloroethene(ug/kg) Comments
B380.8 SO 6/9/2006 10 U 10 U 10 U 20 UB383.8 SO 6/9/2006 10 U 10 U 10 U 20 UB385.9 SO 6/9/2006 1200 10 U 99 100 UB388.0 SO 6/9/2006 293 10 U 23 20 UB388.0CS SO 6/9/2006 318 10 U 22 20 U Field Duplicate of B388.0B3810.0 SO 6/9/2006 121 10 U 10 U 20 UB3810.8 SO 6/9/2006 61 10 U 10 U 20 UB3813.9 SO 6/9/2006 96 10 U 10 U 20 UB3815.8 SO 6/9/2006 10 U 10 U 10 U 20 UB3817.5 SO 6/9/2006 10 U 10 U 10 U 20 UB3820.0 SO 6/9/2006 392 10 U 10 U 124B3821.8 SO 6/9/2006 233 10 U 10 U 106B3824.0 SO 6/9/2006 275 10 U 10 U 46B3826.0 SO 6/9/2006 26 10 U 10 U 20 UB3828.0 SO 6/9/2006 355 10 U 10 U 94B3830.0 SO 6/9/2006 64 10 U 10 U 21B3832.0 SO 6/9/2006 237 10 U 10 U 203B3836.0 SO 6/9/2006 34 10 U 10 U 20 UB3840.5 SO 6/9/2006 10 U 10 U 10 U 20 UB3846.0 SO 6/9/2006 19 10 U 10 U 20 U
B392.0 SO 6/12/2006 10 U 10 U 10 U 64B394.0 SO 6/12/2006 62 10 U 10 U 74B396.0 SO 6/12/2006 10 U 10 U 10 U 20 UB398.0 SO 6/12/2006 10 U 10 U 10 U 20 UB3910.0 SO 6/12/2006 10 U 10 U 10 U 20 UB3911.9 SO 6/12/2006 10 U 10 U 10 U 20 UB3913.9 SO 6/12/2006 10 U 10 U 10 U 20 UB3916.0 SO 6/12/2006 10 U 10 U 10 U 20 UB3918.0 SO 6/12/2006 10 U 10 U 10 U 20 UB3920.0 SO 6/12/2006 10 U 10 U 10 U 20 UB3922.0 SO 6/12/2006 10 U 10 U 10 U 20 UB3924.0 SO 6/12/2006 10 U 10 U 10 U 20 UB3926.0 SO 6/12/2006 10 U 10 U 10 U 20 UB3931.0 SO 6/12/2006 10 U 10 U 10 U 20 UB3935.9 SO 6/12/2006 10 U 10 U 10 U 20 UB3940.9 SO 6/12/2006 10 U 10 U 10 U 20 UB3946.0 SO 6/12/2006 10 U 10 U 10 U 20 U
B402.0 SO 5/31/2006 10 U 10 U 10 U 15 U All B40 samples fromB402.9 SO 5/31/2006 10 U 10 U 10 U 15 U boring at monitoring wellB404.6 SO 5/31/2006 10 U 10 U 10 U 15 U TW40B407.0 SO 5/31/2006 56 10 U 10 U 15 UB409.0 SO 5/31/2006 10 U 10 U 10 U 15 UB4012.0 SO 5/31/2006 10 U 10 U 10 U 15 UB4014.0 SO 5/31/2006 10 U 10 U 10 U 15 UB4016.0 SO 5/31/2006 10 U 10 U 10 U 15 UB4018.0 SO 5/31/2006 10 U 10 U 10 U 15 UB4019.8 SO 5/31/2006 13 10 U 10 U 15 UB4022.0 SO 5/31/2006 10 U 10 U 10 U 15 UB4024.0 SO 5/31/2006 18 10 U 10 U 15 UB4026.0 SO 6/1/2006 10 U 10 U 10 U 15 UB4031.0 SO 6/1/2006 10 U 10 U 10 U 15 UB4035.8 SO 6/1/2006 10 U 10 U 10 U 15 UB4040.8 SO 6/1/2006 10 U 10 U 10 U 15 UB4045.5 SO 6/1/2006 10 U 10 U 10 U 15 UB4049.3 SO 6/1/2006 10 U 10 U 10 U 15 U
Page 2 of 7
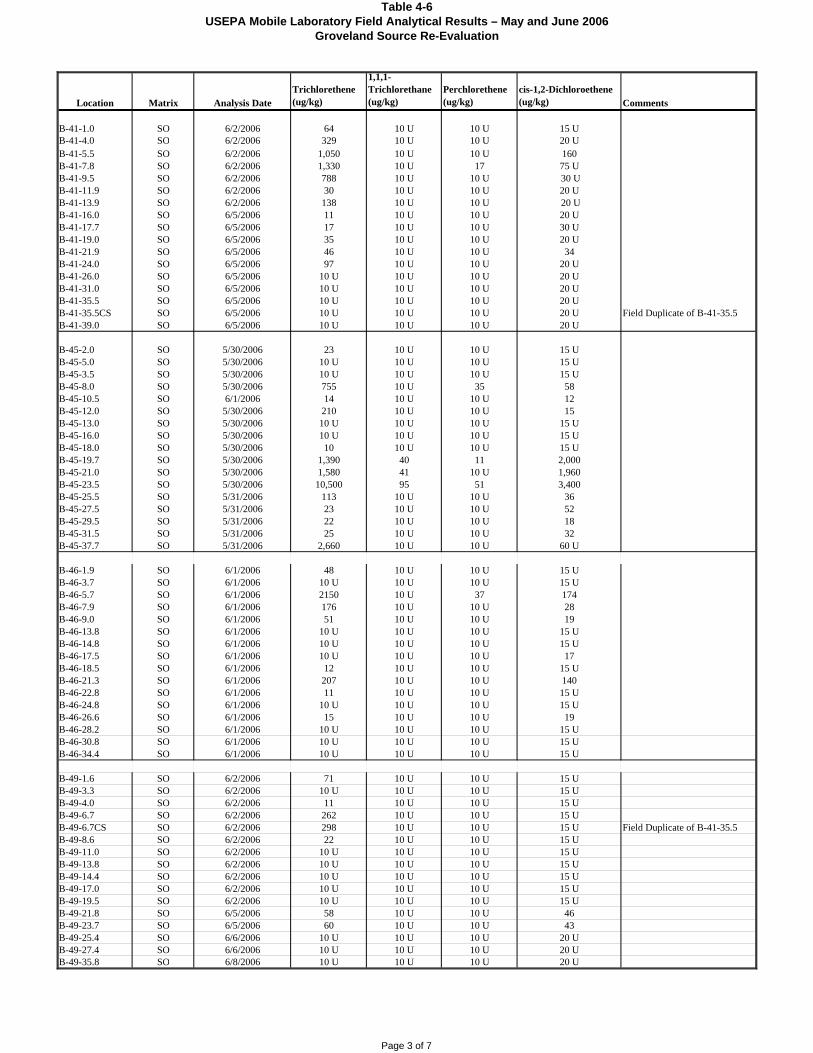
Table 46USEPA Mobile Laboratory Field Analytical Results – May and June 2006
Groveland Source ReEvaluation
Location Matrix Analysis DateTrichlorethene(ug/kg)
1,1,1Trichlorethane(ug/kg)
Perchlorethene(ug/kg)
cis1,2Dichloroethene(ug/kg) Comments
B411.0 SO 6/2/2006 64 10 U 10 U 15 UB414.0 SO 6/2/2006 329 10 U 10 U 20 UB415.5 SO 6/2/2006 1,050 10 U 10 U 160B417.8 SO 6/2/2006 1,330 10 U 17 75 UB419.5 SO 6/2/2006 788 10 U 10 U 30 UB4111.9 SO 6/2/2006 30 10 U 10 U 20 UB4113.9 SO 6/2/2006 138 10 U 10 U 20 UB4116.0 SO 6/5/2006 11 10 U 10 U 20 UB4117.7 SO 6/5/2006 17 10 U 10 U 30 UB4119.0 SO 6/5/2006 35 10 U 10 U 20 UB4121.9 SO 6/5/2006 46 10 U 10 U 34B4124.0 SO 6/5/2006 97 10 U 10 U 20 UB4126.0 SO 6/5/2006 10 U 10 U 10 U 20 UB4131.0 SO 6/5/2006 10 U 10 U 10 U 20 UB4135.5 SO 6/5/2006 10 U 10 U 10 U 20 UB4135.5CS SO 6/5/2006 10 U 10 U 10 U 20 U Field Duplicate of B4135.5B4139.0 SO 6/5/2006 10 U 10 U 10 U 20 U
B452.0 SO 5/30/2006 23 10 U 10 U 15 UB455.0 SO 5/30/2006 10 U 10 U 10 U 15 UB453.5 SO 5/30/2006 10 U 10 U 10 U 15 UB458.0 SO 5/30/2006 755 10 U 35 58B4510.5 SO 6/1/2006 14 10 U 10 U 12B4512.0 SO 5/30/2006 210 10 U 10 U 15B4513.0 SO 5/30/2006 10 U 10 U 10 U 15 UB4516.0 SO 5/30/2006 10 U 10 U 10 U 15 UB4518.0 SO 5/30/2006 10 10 U 10 U 15 UB4519.7 SO 5/30/2006 1,390 40 11 2,000B4521.0 SO 5/30/2006 1,580 41 10 U 1,960B4523.5 SO 5/30/2006 10,500 95 51 3,400B4525.5 SO 5/31/2006 113 10 U 10 U 36B4527.5 SO 5/31/2006 23 10 U 10 U 52B4529.5 SO 5/31/2006 22 10 U 10 U 18B4531.5 SO 5/31/2006 25 10 U 10 U 32B4537.7 SO 5/31/2006 2,660 10 U 10 U 60 U
B461.9 SO 6/1/2006 48 10 U 10 U 15 UB463.7 SO 6/1/2006 10 U 10 U 10 U 15 UB465.7 SO 6/1/2006 2150 10 U 37 174B467.9 SO 6/1/2006 176 10 U 10 U 28B469.0 SO 6/1/2006 51 10 U 10 U 19B4613.8 SO 6/1/2006 10 U 10 U 10 U 15 UB4614.8 SO 6/1/2006 10 U 10 U 10 U 15 UB4617.5 SO 6/1/2006 10 U 10 U 10 U 17B4618.5 SO 6/1/2006 12 10 U 10 U 15 UB4621.3 SO 6/1/2006 207 10 U 10 U 140B4622.8 SO 6/1/2006 11 10 U 10 U 15 UB4624.8 SO 6/1/2006 10 U 10 U 10 U 15 UB4626.6 SO 6/1/2006 15 10 U 10 U 19B4628.2 SO 6/1/2006 10 U 10 U 10 U 15 UB4630.8 SO 6/1/2006 10 U 10 U 10 U 15 UB4634.4 SO 6/1/2006 10 U 10 U 10 U 15 U
B491.6 SO 6/2/2006 71 10 U 10 U 15 UB493.3 SO 6/2/2006 10 U 10 U 10 U 15 UB494.0 SO 6/2/2006 11 10 U 10 U 15 UB496.7 SO 6/2/2006 262 10 U 10 U 15 UB496.7CS SO 6/2/2006 298 10 U 10 U 15 U Field Duplicate of B4135.5B498.6 SO 6/2/2006 22 10 U 10 U 15 UB4911.0 SO 6/2/2006 10 U 10 U 10 U 15 UB4913.8 SO 6/2/2006 10 U 10 U 10 U 15 UB4914.4 SO 6/2/2006 10 U 10 U 10 U 15 UB4917.0 SO 6/2/2006 10 U 10 U 10 U 15 UB4919.5 SO 6/2/2006 10 U 10 U 10 U 15 UB4921.8 SO 6/5/2006 58 10 U 10 U 46B4923.7 SO 6/5/2006 60 10 U 10 U 43B4925.4 SO 6/6/2006 10 U 10 U 10 U 20 UB4927.4 SO 6/6/2006 10 U 10 U 10 U 20 UB4935.8 SO 6/8/2006 10 U 10 U 10 U 20 U
Page 3 of 7
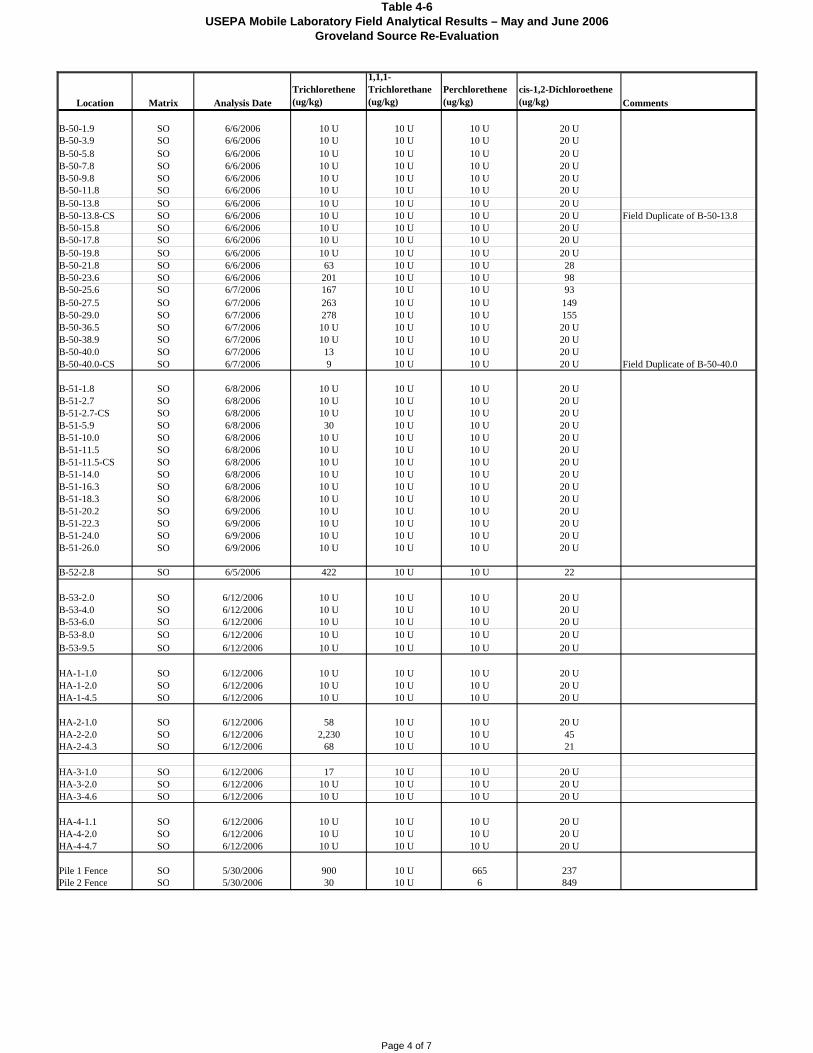
Table 46USEPA Mobile Laboratory Field Analytical Results – May and June 2006
Groveland Source ReEvaluation
Location Matrix Analysis DateTrichlorethene(ug/kg)
1,1,1Trichlorethane(ug/kg)
Perchlorethene(ug/kg)
cis1,2Dichloroethene(ug/kg) Comments
B501.9 SO 6/6/2006 10 U 10 U 10 U 20 UB503.9 SO 6/6/2006 10 U 10 U 10 U 20 UB505.8 SO 6/6/2006 10 U 10 U 10 U 20 UB507.8 SO 6/6/2006 10 U 10 U 10 U 20 UB509.8 SO 6/6/2006 10 U 10 U 10 U 20 UB5011.8 SO 6/6/2006 10 U 10 U 10 U 20 UB5013.8 SO 6/6/2006 10 U 10 U 10 U 20 UB5013.8CS SO 6/6/2006 10 U 10 U 10 U 20 U Field Duplicate of B5013.8B5015.8 SO 6/6/2006 10 U 10 U 10 U 20 UB5017.8 SO 6/6/2006 10 U 10 U 10 U 20 UB5019.8 SO 6/6/2006 10 U 10 U 10 U 20 UB5021.8 SO 6/6/2006 63 10 U 10 U 28B5023.6 SO 6/6/2006 201 10 U 10 U 98B5025.6 SO 6/7/2006 167 10 U 10 U 93B5027.5 SO 6/7/2006 263 10 U 10 U 149B5029.0 SO 6/7/2006 278 10 U 10 U 155B5036.5 SO 6/7/2006 10 U 10 U 10 U 20 UB5038.9 SO 6/7/2006 10 U 10 U 10 U 20 UB5040.0 SO 6/7/2006 13 10 U 10 U 20 UB5040.0CS SO 6/7/2006 9 10 U 10 U 20 U Field Duplicate of B5040.0
B511.8 SO 6/8/2006 10 U 10 U 10 U 20 UB512.7 SO 6/8/2006 10 U 10 U 10 U 20 UB512.7CS SO 6/8/2006 10 U 10 U 10 U 20 UB515.9 SO 6/8/2006 30 10 U 10 U 20 UB5110.0 SO 6/8/2006 10 U 10 U 10 U 20 UB5111.5 SO 6/8/2006 10 U 10 U 10 U 20 UB5111.5CS SO 6/8/2006 10 U 10 U 10 U 20 UB5114.0 SO 6/8/2006 10 U 10 U 10 U 20 UB5116.3 SO 6/8/2006 10 U 10 U 10 U 20 UB5118.3 SO 6/8/2006 10 U 10 U 10 U 20 UB5120.2 SO 6/9/2006 10 U 10 U 10 U 20 UB5122.3 SO 6/9/2006 10 U 10 U 10 U 20 UB5124.0 SO 6/9/2006 10 U 10 U 10 U 20 UB5126.0 SO 6/9/2006 10 U 10 U 10 U 20 U
B522.8 SO 6/5/2006 422 10 U 10 U 22
B532.0 SO 6/12/2006 10 U 10 U 10 U 20 UB534.0 SO 6/12/2006 10 U 10 U 10 U 20 UB536.0 SO 6/12/2006 10 U 10 U 10 U 20 UB538.0 SO 6/12/2006 10 U 10 U 10 U 20 UB539.5 SO 6/12/2006 10 U 10 U 10 U 20 U
HA11.0 SO 6/12/2006 10 U 10 U 10 U 20 UHA12.0 SO 6/12/2006 10 U 10 U 10 U 20 UHA14.5 SO 6/12/2006 10 U 10 U 10 U 20 U
HA21.0 SO 6/12/2006 58 10 U 10 U 20 UHA22.0 SO 6/12/2006 2,230 10 U 10 U 45HA24.3 SO 6/12/2006 68 10 U 10 U 21
HA31.0 SO 6/12/2006 17 10 U 10 U 20 UHA32.0 SO 6/12/2006 10 U 10 U 10 U 20 UHA34.6 SO 6/12/2006 10 U 10 U 10 U 20 U
HA41.1 SO 6/12/2006 10 U 10 U 10 U 20 UHA42.0 SO 6/12/2006 10 U 10 U 10 U 20 UHA44.7 SO 6/12/2006 10 U 10 U 10 U 20 U
Pile 1 Fence SO 5/30/2006 900 10 U 665 237Pile 2 Fence SO 5/30/2006 30 10 U 6 849
Page 4 of 7
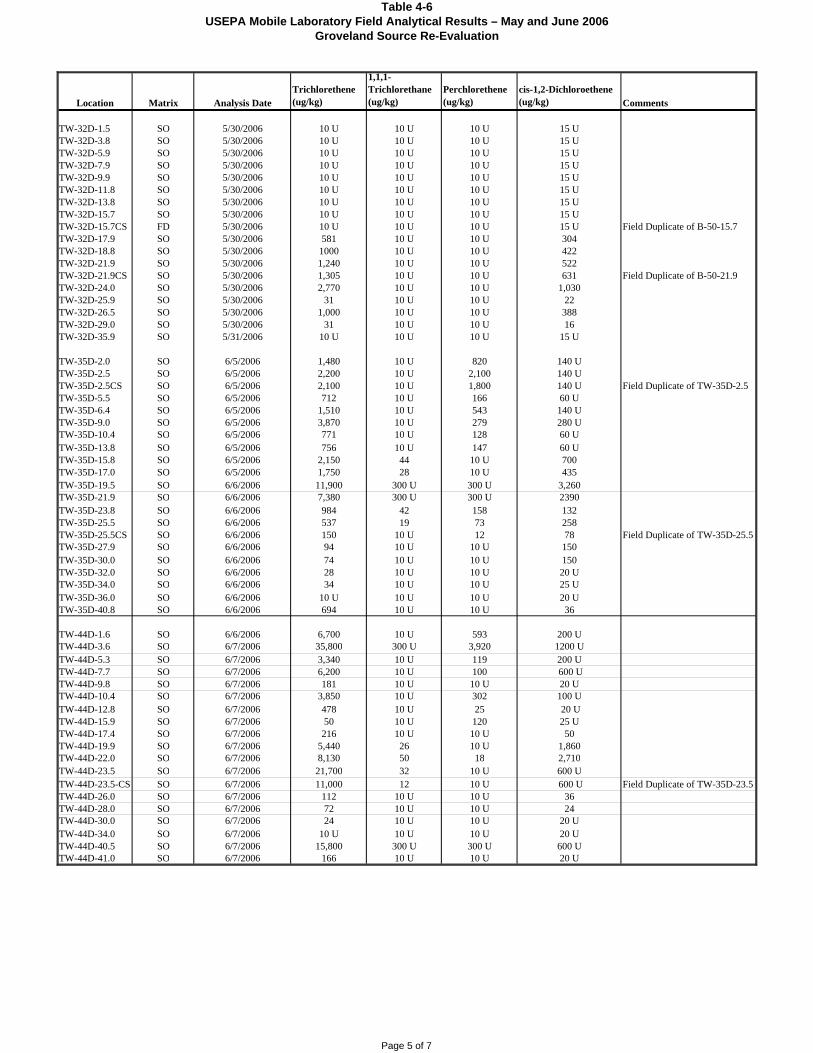
Table 46USEPA Mobile Laboratory Field Analytical Results – May and June 2006
Groveland Source ReEvaluation
Location Matrix Analysis DateTrichlorethene(ug/kg)
1,1,1Trichlorethane(ug/kg)
Perchlorethene(ug/kg)
cis1,2Dichloroethene(ug/kg) Comments
TW32D1.5 SO 5/30/2006 10 U 10 U 10 U 15 UTW32D3.8 SO 5/30/2006 10 U 10 U 10 U 15 UTW32D5.9 SO 5/30/2006 10 U 10 U 10 U 15 UTW32D7.9 SO 5/30/2006 10 U 10 U 10 U 15 UTW32D9.9 SO 5/30/2006 10 U 10 U 10 U 15 UTW32D11.8 SO 5/30/2006 10 U 10 U 10 U 15 UTW32D13.8 SO 5/30/2006 10 U 10 U 10 U 15 UTW32D15.7 SO 5/30/2006 10 U 10 U 10 U 15 UTW32D15.7CS FD 5/30/2006 10 U 10 U 10 U 15 U Field Duplicate of B5015.7TW32D17.9 SO 5/30/2006 581 10 U 10 U 304TW32D18.8 SO 5/30/2006 1000 10 U 10 U 422TW32D21.9 SO 5/30/2006 1,240 10 U 10 U 522TW32D21.9CS SO 5/30/2006 1,305 10 U 10 U 631 Field Duplicate of B5021.9TW32D24.0 SO 5/30/2006 2,770 10 U 10 U 1,030TW32D25.9 SO 5/30/2006 31 10 U 10 U 22TW32D26.5 SO 5/30/2006 1,000 10 U 10 U 388TW32D29.0 SO 5/30/2006 31 10 U 10 U 16TW32D35.9 SO 5/31/2006 10 U 10 U 10 U 15 U
TW35D2.0 SO 6/5/2006 1,480 10 U 820 140 UTW35D2.5 SO 6/5/2006 2,200 10 U 2,100 140 UTW35D2.5CS SO 6/5/2006 2,100 10 U 1,800 140 U Field Duplicate of TW35D2.5TW35D5.5 SO 6/5/2006 712 10 U 166 60 UTW35D6.4 SO 6/5/2006 1,510 10 U 543 140 UTW35D9.0 SO 6/5/2006 3,870 10 U 279 280 UTW35D10.4 SO 6/5/2006 771 10 U 128 60 UTW35D13.8 SO 6/5/2006 756 10 U 147 60 UTW35D15.8 SO 6/5/2006 2,150 44 10 U 700TW35D17.0 SO 6/5/2006 1,750 28 10 U 435TW35D19.5 SO 6/6/2006 11,900 300 U 300 U 3,260TW35D21.9 SO 6/6/2006 7,380 300 U 300 U 2390TW35D23.8 SO 6/6/2006 984 42 158 132TW35D25.5 SO 6/6/2006 537 19 73 258TW35D25.5CS SO 6/6/2006 150 10 U 12 78 Field Duplicate of TW35D25.5TW35D27.9 SO 6/6/2006 94 10 U 10 U 150TW35D30.0 SO 6/6/2006 74 10 U 10 U 150TW35D32.0 SO 6/6/2006 28 10 U 10 U 20 UTW35D34.0 SO 6/6/2006 34 10 U 10 U 25 UTW35D36.0 SO 6/6/2006 10 U 10 U 10 U 20 UTW35D40.8 SO 6/6/2006 694 10 U 10 U 36
TW44D1.6 SO 6/6/2006 6,700 10 U 593 200 UTW44D3.6 SO 6/7/2006 35,800 300 U 3,920 1200 UTW44D5.3 SO 6/7/2006 3,340 10 U 119 200 UTW44D7.7 SO 6/7/2006 6,200 10 U 100 600 UTW44D9.8 SO 6/7/2006 181 10 U 10 U 20 UTW44D10.4 SO 6/7/2006 3,850 10 U 302 100 UTW44D12.8 SO 6/7/2006 478 10 U 25 20 UTW44D15.9 SO 6/7/2006 50 10 U 120 25 UTW44D17.4 SO 6/7/2006 216 10 U 10 U 50TW44D19.9 SO 6/7/2006 5,440 26 10 U 1,860TW44D22.0 SO 6/7/2006 8,130 50 18 2,710TW44D23.5 SO 6/7/2006 21,700 32 10 U 600 UTW44D23.5CS SO 6/7/2006 11,000 12 10 U 600 U Field Duplicate of TW35D23.5TW44D26.0 SO 6/7/2006 112 10 U 10 U 36TW44D28.0 SO 6/7/2006 72 10 U 10 U 24TW44D30.0 SO 6/7/2006 24 10 U 10 U 20 UTW44D34.0 SO 6/7/2006 10 U 10 U 10 U 20 UTW44D40.5 SO 6/7/2006 15,800 300 U 300 U 600 UTW44D41.0 SO 6/7/2006 166 10 U 10 U 20 U
Page 5 of 7
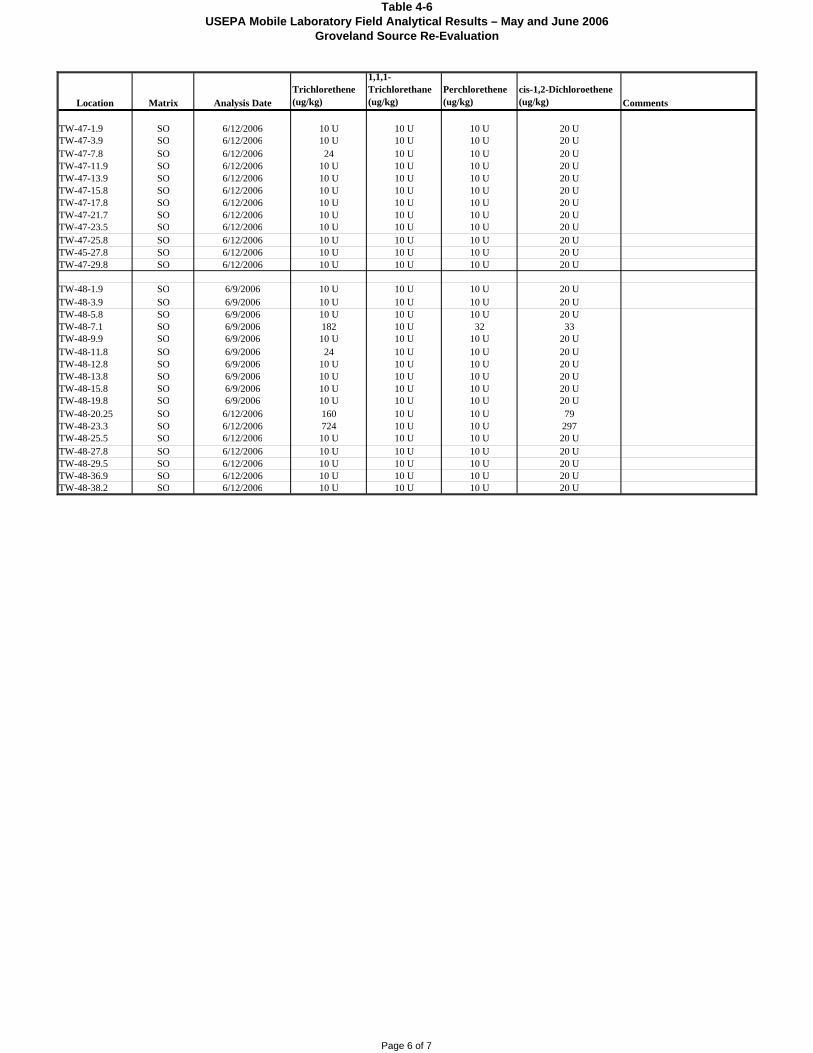
Table 46USEPA Mobile Laboratory Field Analytical Results – May and June 2006
Groveland Source ReEvaluation
Location Matrix Analysis DateTrichlorethene(ug/kg)
1,1,1Trichlorethane(ug/kg)
Perchlorethene(ug/kg)
cis1,2Dichloroethene(ug/kg) Comments
TW471.9 SO 6/12/2006 10 U 10 U 10 U 20 UTW473.9 SO 6/12/2006 10 U 10 U 10 U 20 UTW477.8 SO 6/12/2006 24 10 U 10 U 20 UTW4711.9 SO 6/12/2006 10 U 10 U 10 U 20 UTW4713.9 SO 6/12/2006 10 U 10 U 10 U 20 UTW4715.8 SO 6/12/2006 10 U 10 U 10 U 20 UTW4717.8 SO 6/12/2006 10 U 10 U 10 U 20 UTW4721.7 SO 6/12/2006 10 U 10 U 10 U 20 UTW4723.5 SO 6/12/2006 10 U 10 U 10 U 20 UTW4725.8 SO 6/12/2006 10 U 10 U 10 U 20 UTW4527.8 SO 6/12/2006 10 U 10 U 10 U 20 UTW4729.8 SO 6/12/2006 10 U 10 U 10 U 20 U
TW481.9 SO 6/9/2006 10 U 10 U 10 U 20 UTW483.9 SO 6/9/2006 10 U 10 U 10 U 20 UTW485.8 SO 6/9/2006 10 U 10 U 10 U 20 UTW487.1 SO 6/9/2006 182 10 U 32 33TW489.9 SO 6/9/2006 10 U 10 U 10 U 20 UTW4811.8 SO 6/9/2006 24 10 U 10 U 20 UTW4812.8 SO 6/9/2006 10 U 10 U 10 U 20 UTW4813.8 SO 6/9/2006 10 U 10 U 10 U 20 UTW4815.8 SO 6/9/2006 10 U 10 U 10 U 20 UTW4819.8 SO 6/9/2006 10 U 10 U 10 U 20 UTW4820.25 SO 6/12/2006 160 10 U 10 U 79TW4823.3 SO 6/12/2006 724 10 U 10 U 297TW4825.5 SO 6/12/2006 10 U 10 U 10 U 20 UTW4827.8 SO 6/12/2006 10 U 10 U 10 U 20 UTW4829.5 SO 6/12/2006 10 U 10 U 10 U 20 UTW4836.9 SO 6/12/2006 10 U 10 U 10 U 20 UTW4838.2 SO 6/12/2006 10 U 10 U 10 U 20 U
Page 6 of 7

Table 46USEPA Mobile Laboratory Field Analytical Results – May and June 2006
Groveland Source ReEvaluation
Location Matrix Analysis DateTrichlorethene(ug/L)
1,1,1Trichlorethane(ug/L)
Carbontetrachloride(ug/L)
cis1,2Dichloroethene(ug/L) Comments
TB01GW QC 5/31/2006 0.2 U 0.2 U 0.2 U 0.5 UTB02 GW QC 5/31/2006 0.2 U 0.2 U 0.2 U 0.5 UTB03GW QC 6/6/2006 0.2 U 0.2 U 0.2 U 0.5 UTB04GW QC 6/7/2006 0.2 U 0.2 U 0.2 U 0.5 UTB06GW QC 6/9/2006 0.2 U 0.2 U 0.2 U 0.5 UTB08GW QC 6/12/2006 0.2 U 0.2 U 0.2 U 0.5 U
EB01 (O) EB 6/7/2006 0.2 U 0.2 U 0.2 U 0.5 UEB01(I) EB 6/7/2006 0.2 U 0.2 U 0.2 U 0.5 UEB02 (O) EB 6/9/2006 0.2 U 0.2 U 0.2 U 0.5 UEB02 (I) EB 6/9/2006 0.2 U 0.2 U 0.2 U 0.5 U
EB03 (HA) EB 6/12/2006 0.2 U 0.2 U 0.2 U 0.5 UEB03 (O) EB 6/12/2006 0.2 U 0.2 U 0.2 U 0.5 UEB03 (I) EB 6/12/2006 0.2 U 0.2 U 0.2 U 0.5 U
EB04 (I) EB 6/12/2006 0.2 U 0.2 U 0.2 U 0.5 UEB04 (O) EB 6/12/2006 0.2 U 0.2 U 0.2 U 0.5 U
EW2D AQ 5/31/2006 58 0.4 0.2 51EW4D AQ 5/31/2006 44 0.2 U 7.0 27EW6S AQ 6/6/2006 95 6 U 6 U 81EW6D AQ 6/6/2006 1240 6 U 6 U 234EW6C (pre) AQ 6/6/2006 7100 42 70 2360 Collected before purging wellEW6C AQ 6/6/2006 4580 21 52 1310 Collected after purging well
MW5S AQ 6/6/2006 0.7 0.2 U 0.2 U 0.5 UMW5D AQ 6/7/2006 0.2 U 0.2 U 0.2 U 0.5 U
TW1 AQ 5/31/2006 21 0.2 U 0.2 U 5.3TW1CS AQ 5/31/2006 20 0.2 U 0.2 U 5.0TW3 AQ 6/3/2006 966 6 U 6 U 398TW9 AQ 5/31/2006 1210 12 10 401TW15 AQ 5/31/2006 4.2 0.2 U 0.2 2.1TW16 AQ 5/31/2006 5.3 0.2 U 0.2 U 0.5TW18 AQ 5/31/2006 1770 18 22 683TW19 AQ 5/31/2006 14 0.2 U 0.2 U 2.6TW23 AQ 5/31/2006 1000 8.4 8.3 560TW26 AQ 6/3/2006 33 0.2 U 0.2 U 11TW26A AQ 6/3/2006 301 1.3 0.6 108TW32D AQ 6/9/2006 11 0.2 U 0.2 U 6.7TW35DMT AQ 6/6/2006 41 6 U 12 16 UTW40 AQ 6/6/2006 0.2 U 0.2 U 0.2 U 0.5 UTW44D AQ 6/12/2006 73 6 U 6 U 14
Page 7 of 7
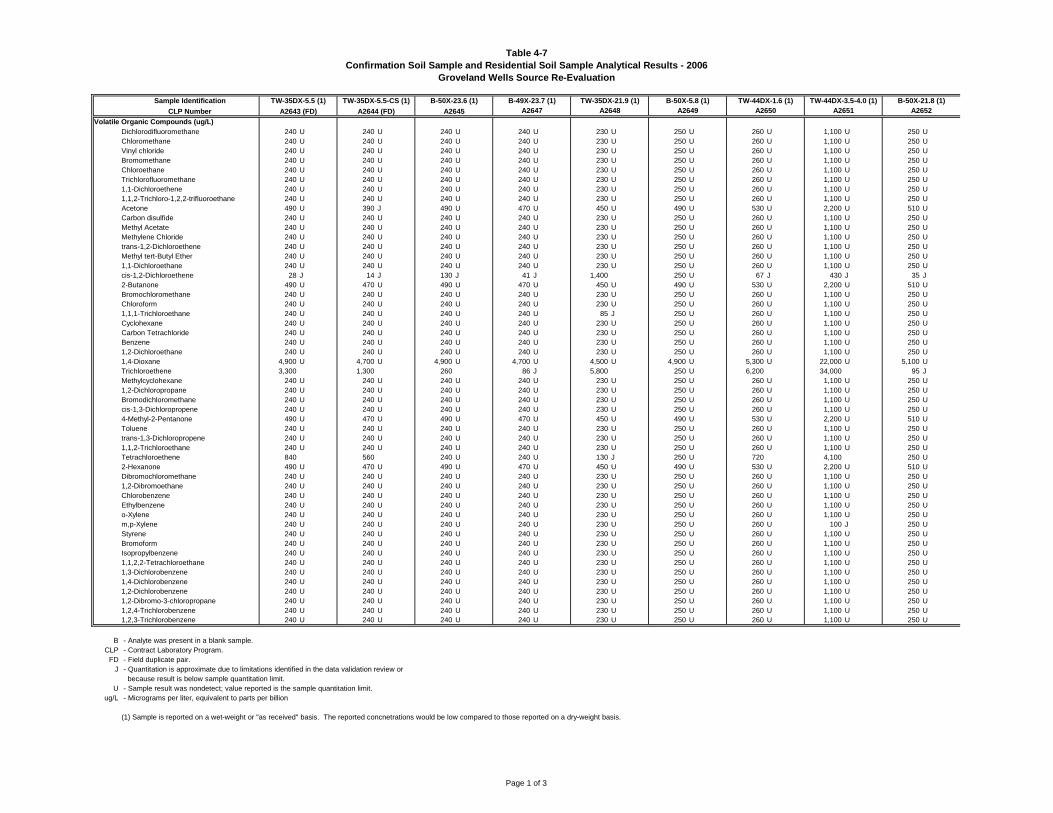
Table 47Confirmation Soil Sample and Residential Soil Sample Analytical Results 2006
Groveland Wells Source ReEvaluation
Sample Identification TW35DX5.5 (1) TW35DX5.5CS (1) B50X23.6 (1) B49X23.7 (1) TW35DX21.9 (1) B50X5.8 (1) TW44DX1.6 (1) TW44DX3.54.0 (1) B50X21.8 (1)CLP Number A2643 (FD) A2644 (FD) A2645
Volatile Organic Compounds (ug/L)Dichlorodifluoromethane 240 U 240 U 240 U 240 U 230 U 250 U 260 U 1,100 U 250 UChloromethane 240 U 240 U 240 U 240 U 230 U 250 U 260 U 1,100 U 250 UVinyl chloride 240 U 240 U 240 U 240 U 230 U 250 U 260 U 1,100 U 250 UBromomethane 240 U 240 U 240 U 240 U 230 U 250 U 260 U 1,100 U 250 UChloroethane 240 U 240 U 240 U 240 U 230 U 250 U 260 U 1,100 U 250 UTrichlorofluoromethane 240 U 240 U 240 U 240 U 230 U 250 U 260 U 1,100 U 250 U1,1Dichloroethene 240 U 240 U 240 U 240 U 230 U 250 U 260 U 1,100 U 250 U1,1,2Trichloro1,2,2trifluoroethane 240 U 240 U 240 U 240 U 230 U 250 U 260 U 1,100 U 250 UAcetone 490 U 390 J 490 U 470 U 450 U 490 U 530 U 2,200 U 510 UCarbon disulfide 240 U 240 U 240 U 240 U 230 U 250 U 260 U 1,100 U 250 UMethyl Acetate 240 U 240 U 240 U 240 U 230 U 250 U 260 U 1,100 U 250 UMethylene Chloride 240 U 240 U 240 U 240 U 230 U 250 U 260 U 1,100 U 250 Utrans1,2Dichloroethene 240 U 240 U 240 U 240 U 230 U 250 U 260 U 1,100 U 250 UMethyl tertButyl Ether 240 U 240 U 240 U 240 U 230 U 250 U 260 U 1,100 U 250 U1,1Dichloroethane 240 U 240 U 240 U 240 U 230 U 250 U 260 U 1,100 U 250 Ucis1,2Dichloroethene 28 J 14 J 130 J 41 J 1,400 250 U 67 J 430 J 35 J2Butanone 490 U 470 U 490 U 470 U 450 U 490 U 530 U 2,200 U 510 UBromochloromethane 240 U 240 U 240 U 240 U 230 U 250 U 260 U 1,100 U 250 UChloroform 240 U 240 U 240 U 240 U 230 U 250 U 260 U 1,100 U 250 U1,1,1Trichloroethane 240 U 240 U 240 U 240 U 85 J 250 U 260 U 1,100 U 250 UCyclohexane 240 U 240 U 240 U 240 U 230 U 250 U 260 U 1,100 U 250 UCarbon Tetrachloride 240 U 240 U 240 U 240 U 230 U 250 U 260 U 1,100 U 250 UBenzene 240 U 240 U 240 U 240 U 230 U 250 U 260 U 1,100 U 250 U1,2Dichloroethane 240 U 240 U 240 U 240 U 230 U 250 U 260 U 1,100 U 250 U1,4Dioxane 4,900 U 4,700 U 4,900 U 4,700 U 4,500 U 4,900 U 5,300 U 22,000 U 5,100 UTrichloroethene 3,300 1,300 260 86 J 5,800 250 U 6,200 34,000 95 JMethylcyclohexane 240 U 240 U 240 U 240 U 230 U 250 U 260 U 1,100 U 250 U1,2Dichloropropane 240 U 240 U 240 U 240 U 230 U 250 U 260 U 1,100 U 250 UBromodichloromethane 240 U 240 U 240 U 240 U 230 U 250 U 260 U 1,100 U 250 Ucis1,3Dichloropropene 240 U 240 U 240 U 240 U 230 U 250 U 260 U 1,100 U 250 U4Methyl2Pentanone 490 U 470 U 490 U 470 U 450 U 490 U 530 U 2,200 U 510 UToluene 240 U 240 U 240 U 240 U 230 U 250 U 260 U 1,100 U 250 Utrans1,3Dichloropropene 240 U 240 U 240 U 240 U 230 U 250 U 260 U 1,100 U 250 U1,1,2Trichloroethane 240 U 240 U 240 U 240 U 230 U 250 U 260 U 1,100 U 250 UTetrachloroethene 840 560 240 U 240 U 130 J 250 U 720 4,100 250 U2Hexanone 490 U 470 U 490 U 470 U 450 U 490 U 530 U 2,200 U 510 UDibromochloromethane 240 U 240 U 240 U 240 U 230 U 250 U 260 U 1,100 U 250 U1,2Dibromoethane 240 U 240 U 240 U 240 U 230 U 250 U 260 U 1,100 U 250 UChlorobenzene 240 U 240 U 240 U 240 U 230 U 250 U 260 U 1,100 U 250 UEthylbenzene 240 U 240 U 240 U 240 U 230 U 250 U 260 U 1,100 U 250 UoXylene 240 U 240 U 240 U 240 U 230 U 250 U 260 U 1,100 U 250 Um,pXylene 240 U 240 U 240 U 240 U 230 U 250 U 260 U 100 J 250 UStyrene 240 U 240 U 240 U 240 U 230 U 250 U 260 U 1,100 U 250 UBromoform 240 U 240 U 240 U 240 U 230 U 250 U 260 U 1,100 U 250 UIsopropylbenzene 240 U 240 U 240 U 240 U 230 U 250 U 260 U 1,100 U 250 U1,1,2,2Tetrachloroethane 240 U 240 U 240 U 240 U 230 U 250 U 260 U 1,100 U 250 U1,3Dichlorobenzene 240 U 240 U 240 U 240 U 230 U 250 U 260 U 1,100 U 250 U1,4Dichlorobenzene 240 U 240 U 240 U 240 U 230 U 250 U 260 U 1,100 U 250 U1,2Dichlorobenzene 240 U 240 U 240 U 240 U 230 U 250 U 260 U 1,100 U 250 U1,2Dibromo3chloropropane 240 U 240 U 240 U 240 U 230 U 250 U 260 U 1,100 U 250 U1,2,4Trichlorobenzene 240 U 240 U 240 U 240 U 230 U 250 U 260 U 1,100 U 250 U1,2,3Trichlorobenzene 240 U 240 U 240 U 240 U 230 U 250 U 260 U 1,100 U 250 U
B Analyte was present in a blank sample.CLP Contract Laboratory Program.
FD Field duplicate pair.J Quantitation is approximate due to limitations identified in the data validation review or
because result is below sample quantitation limit.U Sample result was nondetect; value reported is the sample quantitation limit.
ug/L Micrograms per liter, equivalent to parts per billion
(1) Sample is reported on a wetweight or "as received" basis. The reported concnetrations would be low compared to those reported on a dryweight basis.
A2651 A2652A2647 A2648 A2649 A2650
Page 1 of 3
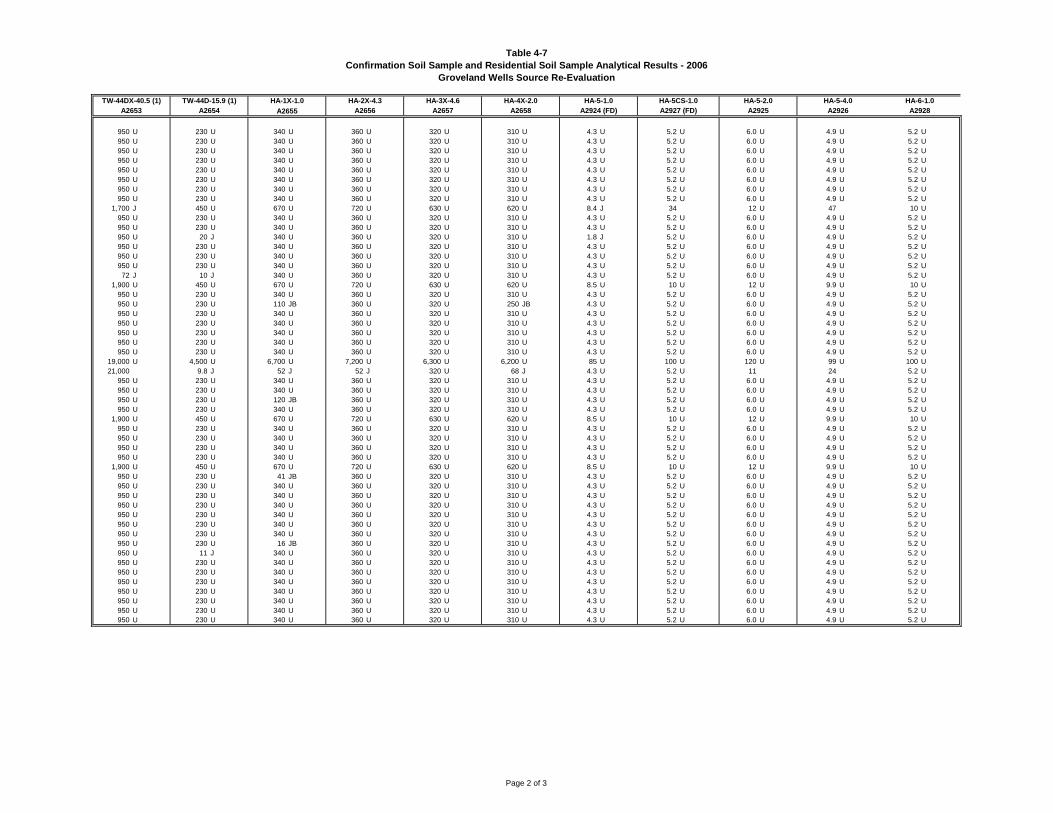
Table 47Confirmation Soil Sample and Residential Soil Sample Analytical Results 2006
Groveland Wells Source ReEvaluation
TW44DX40.5 (1) TW44D15.9 (1) HA1X1.0 HA2X4.3 HA3X4.6
950 U 230 U 340 U 360 U 320 U 310 U 4.3 U 5.2 U 6.0 U 4.9 U 5.2 U950 U 230 U 340 U 360 U 320 U 310 U 4.3 U 5.2 U 6.0 U 4.9 U 5.2 U950 U 230 U 340 U 360 U 320 U 310 U 4.3 U 5.2 U 6.0 U 4.9 U 5.2 U950 U 230 U 340 U 360 U 320 U 310 U 4.3 U 5.2 U 6.0 U 4.9 U 5.2 U950 U 230 U 340 U 360 U 320 U 310 U 4.3 U 5.2 U 6.0 U 4.9 U 5.2 U950 U 230 U 340 U 360 U 320 U 310 U 4.3 U 5.2 U 6.0 U 4.9 U 5.2 U950 U 230 U 340 U 360 U 320 U 310 U 4.3 U 5.2 U 6.0 U 4.9 U 5.2 U950 U 230 U 340 U 360 U 320 U 310 U 4.3 U 5.2 U 6.0 U 4.9 U 5.2 U
1,700 J 450 U 670 U 720 U 630 U 620 U 8.4 J 34 12 U 47 10 U950 U 230 U 340 U 360 U 320 U 310 U 4.3 U 5.2 U 6.0 U 4.9 U 5.2 U950 U 230 U 340 U 360 U 320 U 310 U 4.3 U 5.2 U 6.0 U 4.9 U 5.2 U950 U 20 J 340 U 360 U 320 U 310 U 1.8 J 5.2 U 6.0 U 4.9 U 5.2 U950 U 230 U 340 U 360 U 320 U 310 U 4.3 U 5.2 U 6.0 U 4.9 U 5.2 U950 U 230 U 340 U 360 U 320 U 310 U 4.3 U 5.2 U 6.0 U 4.9 U 5.2 U950 U 230 U 340 U 360 U 320 U 310 U 4.3 U 5.2 U 6.0 U 4.9 U 5.2 U72 J 10 J 340 U 360 U 320 U 310 U 4.3 U 5.2 U 6.0 U 4.9 U 5.2 U
1,900 U 450 U 670 U 720 U 630 U 620 U 8.5 U 10 U 12 U 9.9 U 10 U950 U 230 U 340 U 360 U 320 U 310 U 4.3 U 5.2 U 6.0 U 4.9 U 5.2 U950 U 230 U 110 JB 360 U 320 U 250 JB 4.3 U 5.2 U 6.0 U 4.9 U 5.2 U950 U 230 U 340 U 360 U 320 U 310 U 4.3 U 5.2 U 6.0 U 4.9 U 5.2 U950 U 230 U 340 U 360 U 320 U 310 U 4.3 U 5.2 U 6.0 U 4.9 U 5.2 U950 U 230 U 340 U 360 U 320 U 310 U 4.3 U 5.2 U 6.0 U 4.9 U 5.2 U950 U 230 U 340 U 360 U 320 U 310 U 4.3 U 5.2 U 6.0 U 4.9 U 5.2 U950 U 230 U 340 U 360 U 320 U 310 U 4.3 U 5.2 U 6.0 U 4.9 U 5.2 U
19,000 U 4,500 U 6,700 U 7,200 U 6,300 U 6,200 U 85 U 100 U 120 U 99 U 100 U21,000 9.8 J 52 J 52 J 320 U 68 J 4.3 U 5.2 U 11 24 5.2 U
950 U 230 U 340 U 360 U 320 U 310 U 4.3 U 5.2 U 6.0 U 4.9 U 5.2 U950 U 230 U 340 U 360 U 320 U 310 U 4.3 U 5.2 U 6.0 U 4.9 U 5.2 U950 U 230 U 120 JB 360 U 320 U 310 U 4.3 U 5.2 U 6.0 U 4.9 U 5.2 U950 U 230 U 340 U 360 U 320 U 310 U 4.3 U 5.2 U 6.0 U 4.9 U 5.2 U
1,900 U 450 U 670 U 720 U 630 U 620 U 8.5 U 10 U 12 U 9.9 U 10 U950 U 230 U 340 U 360 U 320 U 310 U 4.3 U 5.2 U 6.0 U 4.9 U 5.2 U950 U 230 U 340 U 360 U 320 U 310 U 4.3 U 5.2 U 6.0 U 4.9 U 5.2 U950 U 230 U 340 U 360 U 320 U 310 U 4.3 U 5.2 U 6.0 U 4.9 U 5.2 U950 U 230 U 340 U 360 U 320 U 310 U 4.3 U 5.2 U 6.0 U 4.9 U 5.2 U
1,900 U 450 U 670 U 720 U 630 U 620 U 8.5 U 10 U 12 U 9.9 U 10 U950 U 230 U 41 JB 360 U 320 U 310 U 4.3 U 5.2 U 6.0 U 4.9 U 5.2 U950 U 230 U 340 U 360 U 320 U 310 U 4.3 U 5.2 U 6.0 U 4.9 U 5.2 U950 U 230 U 340 U 360 U 320 U 310 U 4.3 U 5.2 U 6.0 U 4.9 U 5.2 U950 U 230 U 340 U 360 U 320 U 310 U 4.3 U 5.2 U 6.0 U 4.9 U 5.2 U950 U 230 U 340 U 360 U 320 U 310 U 4.3 U 5.2 U 6.0 U 4.9 U 5.2 U950 U 230 U 340 U 360 U 320 U 310 U 4.3 U 5.2 U 6.0 U 4.9 U 5.2 U950 U 230 U 340 U 360 U 320 U 310 U 4.3 U 5.2 U 6.0 U 4.9 U 5.2 U950 U 230 U 16 JB 360 U 320 U 310 U 4.3 U 5.2 U 6.0 U 4.9 U 5.2 U950 U 11 J 340 U 360 U 320 U 310 U 4.3 U 5.2 U 6.0 U 4.9 U 5.2 U950 U 230 U 340 U 360 U 320 U 310 U 4.3 U 5.2 U 6.0 U 4.9 U 5.2 U950 U 230 U 340 U 360 U 320 U 310 U 4.3 U 5.2 U 6.0 U 4.9 U 5.2 U950 U 230 U 340 U 360 U 320 U 310 U 4.3 U 5.2 U 6.0 U 4.9 U 5.2 U950 U 230 U 340 U 360 U 320 U 310 U 4.3 U 5.2 U 6.0 U 4.9 U 5.2 U950 U 230 U 340 U 360 U 320 U 310 U 4.3 U 5.2 U 6.0 U 4.9 U 5.2 U950 U 230 U 340 U 360 U 320 U 310 U 4.3 U 5.2 U 6.0 U 4.9 U 5.2 U950 U 230 U 340 U 360 U 320 U 310 U 4.3 U 5.2 U 6.0 U 4.9 U 5.2 U
A2653 A2654 A2655 A2656 A2657 A2658HA4X2.0 HA51.0
A2924 (FD)HA52.0A2925
HA5CS1.0 HA61.0A2927 (FD) A2928
HA54.0A2926
Page 2 of 3
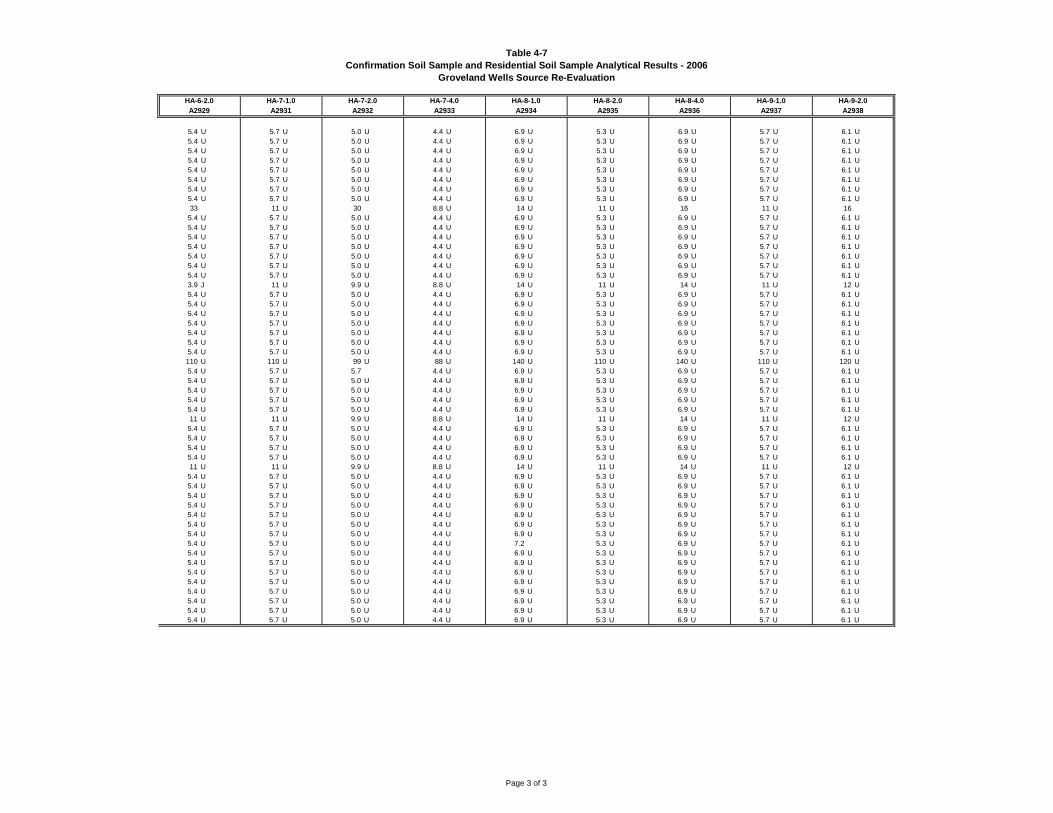
Table 47Confirmation Soil Sample and Residential Soil Sample Analytical Results 2006
Groveland Wells Source ReEvaluation
5.4 U 5.7 U 5.0 U 4.4 U 6.9 U 5.3 U 6.9 U 5.7 U 6.1 U5.4 U 5.7 U 5.0 U 4.4 U 6.9 U 5.3 U 6.9 U 5.7 U 6.1 U5.4 U 5.7 U 5.0 U 4.4 U 6.9 U 5.3 U 6.9 U 5.7 U 6.1 U5.4 U 5.7 U 5.0 U 4.4 U 6.9 U 5.3 U 6.9 U 5.7 U 6.1 U5.4 U 5.7 U 5.0 U 4.4 U 6.9 U 5.3 U 6.9 U 5.7 U 6.1 U5.4 U 5.7 U 5.0 U 4.4 U 6.9 U 5.3 U 6.9 U 5.7 U 6.1 U5.4 U 5.7 U 5.0 U 4.4 U 6.9 U 5.3 U 6.9 U 5.7 U 6.1 U5.4 U 5.7 U 5.0 U 4.4 U 6.9 U 5.3 U 6.9 U 5.7 U 6.1 U33 11 U 30 8.8 U 14 U 11 U 16 11 U 16
5.4 U 5.7 U 5.0 U 4.4 U 6.9 U 5.3 U 6.9 U 5.7 U 6.1 U5.4 U 5.7 U 5.0 U 4.4 U 6.9 U 5.3 U 6.9 U 5.7 U 6.1 U5.4 U 5.7 U 5.0 U 4.4 U 6.9 U 5.3 U 6.9 U 5.7 U 6.1 U5.4 U 5.7 U 5.0 U 4.4 U 6.9 U 5.3 U 6.9 U 5.7 U 6.1 U5.4 U 5.7 U 5.0 U 4.4 U 6.9 U 5.3 U 6.9 U 5.7 U 6.1 U5.4 U 5.7 U 5.0 U 4.4 U 6.9 U 5.3 U 6.9 U 5.7 U 6.1 U5.4 U 5.7 U 5.0 U 4.4 U 6.9 U 5.3 U 6.9 U 5.7 U 6.1 U3.9 J 11 U 9.9 U 8.8 U 14 U 11 U 14 U 11 U 12 U5.4 U 5.7 U 5.0 U 4.4 U 6.9 U 5.3 U 6.9 U 5.7 U 6.1 U5.4 U 5.7 U 5.0 U 4.4 U 6.9 U 5.3 U 6.9 U 5.7 U 6.1 U5.4 U 5.7 U 5.0 U 4.4 U 6.9 U 5.3 U 6.9 U 5.7 U 6.1 U5.4 U 5.7 U 5.0 U 4.4 U 6.9 U 5.3 U 6.9 U 5.7 U 6.1 U5.4 U 5.7 U 5.0 U 4.4 U 6.9 U 5.3 U 6.9 U 5.7 U 6.1 U5.4 U 5.7 U 5.0 U 4.4 U 6.9 U 5.3 U 6.9 U 5.7 U 6.1 U5.4 U 5.7 U 5.0 U 4.4 U 6.9 U 5.3 U 6.9 U 5.7 U 6.1 U110 U 110 U 99 U 88 U 140 U 110 U 140 U 110 U 120 U5.4 U 5.7 U 5.7 4.4 U 6.9 U 5.3 U 6.9 U 5.7 U 6.1 U5.4 U 5.7 U 5.0 U 4.4 U 6.9 U 5.3 U 6.9 U 5.7 U 6.1 U5.4 U 5.7 U 5.0 U 4.4 U 6.9 U 5.3 U 6.9 U 5.7 U 6.1 U5.4 U 5.7 U 5.0 U 4.4 U 6.9 U 5.3 U 6.9 U 5.7 U 6.1 U5.4 U 5.7 U 5.0 U 4.4 U 6.9 U 5.3 U 6.9 U 5.7 U 6.1 U11 U 11 U 9.9 U 8.8 U 14 U 11 U 14 U 11 U 12 U
5.4 U 5.7 U 5.0 U 4.4 U 6.9 U 5.3 U 6.9 U 5.7 U 6.1 U5.4 U 5.7 U 5.0 U 4.4 U 6.9 U 5.3 U 6.9 U 5.7 U 6.1 U5.4 U 5.7 U 5.0 U 4.4 U 6.9 U 5.3 U 6.9 U 5.7 U 6.1 U5.4 U 5.7 U 5.0 U 4.4 U 6.9 U 5.3 U 6.9 U 5.7 U 6.1 U11 U 11 U 9.9 U 8.8 U 14 U 11 U 14 U 11 U 12 U
5.4 U 5.7 U 5.0 U 4.4 U 6.9 U 5.3 U 6.9 U 5.7 U 6.1 U5.4 U 5.7 U 5.0 U 4.4 U 6.9 U 5.3 U 6.9 U 5.7 U 6.1 U5.4 U 5.7 U 5.0 U 4.4 U 6.9 U 5.3 U 6.9 U 5.7 U 6.1 U5.4 U 5.7 U 5.0 U 4.4 U 6.9 U 5.3 U 6.9 U 5.7 U 6.1 U5.4 U 5.7 U 5.0 U 4.4 U 6.9 U 5.3 U 6.9 U 5.7 U 6.1 U5.4 U 5.7 U 5.0 U 4.4 U 6.9 U 5.3 U 6.9 U 5.7 U 6.1 U5.4 U 5.7 U 5.0 U 4.4 U 6.9 U 5.3 U 6.9 U 5.7 U 6.1 U5.4 U 5.7 U 5.0 U 4.4 U 7.2 5.3 U 6.9 U 5.7 U 6.1 U5.4 U 5.7 U 5.0 U 4.4 U 6.9 U 5.3 U 6.9 U 5.7 U 6.1 U5.4 U 5.7 U 5.0 U 4.4 U 6.9 U 5.3 U 6.9 U 5.7 U 6.1 U5.4 U 5.7 U 5.0 U 4.4 U 6.9 U 5.3 U 6.9 U 5.7 U 6.1 U5.4 U 5.7 U 5.0 U 4.4 U 6.9 U 5.3 U 6.9 U 5.7 U 6.1 U5.4 U 5.7 U 5.0 U 4.4 U 6.9 U 5.3 U 6.9 U 5.7 U 6.1 U5.4 U 5.7 U 5.0 U 4.4 U 6.9 U 5.3 U 6.9 U 5.7 U 6.1 U5.4 U 5.7 U 5.0 U 4.4 U 6.9 U 5.3 U 6.9 U 5.7 U 6.1 U5.4 U 5.7 U 5.0 U 4.4 U 6.9 U 5.3 U 6.9 U 5.7 U 6.1 U
HA71.0A2931
HA62.0A2929 A2935 A2936
HA72.0A2932
HA92.0A2938
HA74.0 HA81.0A2933 A2934
HA91.0A2937
HA82.0 HA84.0
Page 3 of 3
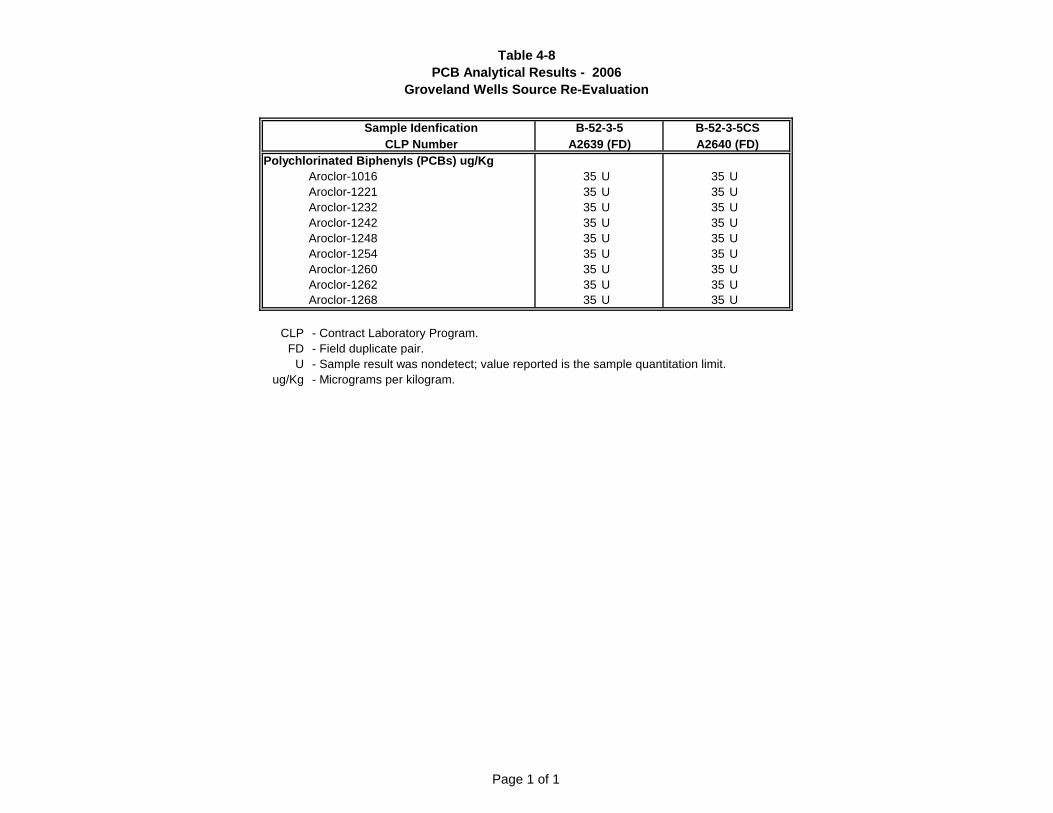
Table 48PCB Analytical Results 2006
Groveland Wells Source ReEvaluation
Sample Idenfication B5235 B5235CSCLP Number A2639 (FD) A2640 (FD)
Polychlorinated Biphenyls (PCBs) ug/KgAroclor1016 35 U 35 UAroclor1221 35 U 35 UAroclor1232 35 U 35 UAroclor1242 35 U 35 UAroclor1248 35 U 35 UAroclor1254 35 U 35 UAroclor1260 35 U 35 UAroclor1262 35 U 35 UAroclor1268 35 U 35 U
CLP Contract Laboratory Program.FD Field duplicate pair.
U Sample result was nondetect; value reported is the sample quantitation limit.ug/Kg Micrograms per kilogram.
Page 1 of 1
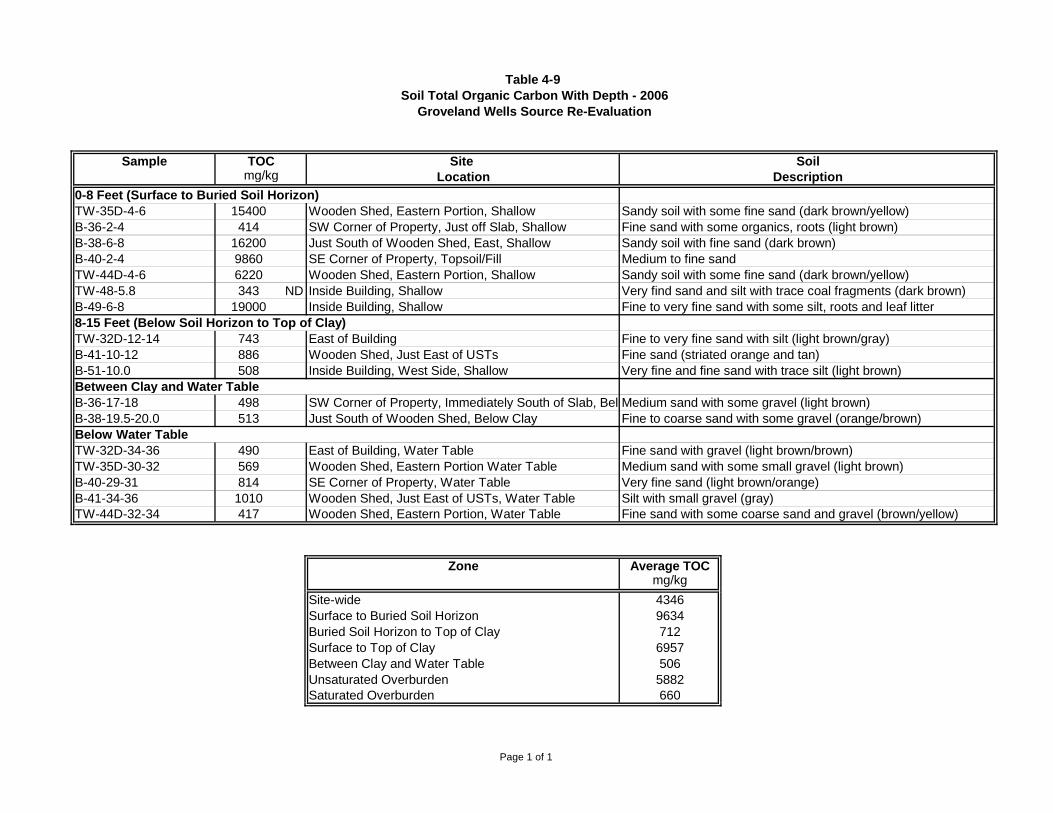
Table 49Soil Total Organic Carbon With Depth 2006
Groveland Wells Source ReEvaluation
Sample TOC Site Soilmg/kg Location Description
08 Feet (Surface to Buried Soil Horizon)TW35D46 15400 Wooden Shed, Eastern Portion, Shallow Sandy soil with some fine sand (dark brown/yellow)B3624 414 SW Corner of Property, Just off Slab, Shallow Fine sand with some organics, roots (light brown)B3868 16200 Just South of Wooden Shed, East, Shallow Sandy soil with fine sand (dark brown)B4024 9860 SE Corner of Property, Topsoil/Fill Medium to fine sandTW44D46 6220 Wooden Shed, Eastern Portion, Shallow Sandy soil with some fine sand (dark brown/yellow)TW485.8 343 ND Inside Building, Shallow Very find sand and silt with trace coal fragments (dark brown)B4968 19000 Inside Building, Shallow Fine to very fine sand with some silt, roots and leaf litter815 Feet (Below Soil Horizon to Top of Clay)TW32D1214 743 East of Building Fine to very fine sand with silt (light brown/gray)B411012 886 Wooden Shed, Just East of USTs Fine sand (striated orange and tan)B5110.0 508 Inside Building, West Side, Shallow Very fine and fine sand with trace silt (light brown)Between Clay and Water TableB361718 498 SW Corner of Property, Immediately South of Slab, Below ClayMedium sand with some gravel (light brown)B3819.520.0 513 Just South of Wooden Shed, Below Clay Fine to coarse sand with some gravel (orange/brown)Below Water TableTW32D3436 490 East of Building, Water Table Fine sand with gravel (light brown/brown)TW35D3032 569 Wooden Shed, Eastern Portion Water Table Medium sand with some small gravel (light brown)B402931 814 SE Corner of Property, Water Table Very fine sand (light brown/orange)B413436 1010 Wooden Shed, Just East of USTs, Water Table Silt with small gravel (gray)TW44D3234 417 Wooden Shed, Eastern Portion, Water Table Fine sand with some coarse sand and gravel (brown/yellow)
Zone Average TOCmg/kg
Sitewide 4346Surface to Buried Soil Horizon 9634Buried Soil Horizon to Top of Clay 712Surface to Top of Clay 6957Between Clay and Water Table 506Unsaturated Overburden 5882Saturated Overburden 660
Page 1 of 1
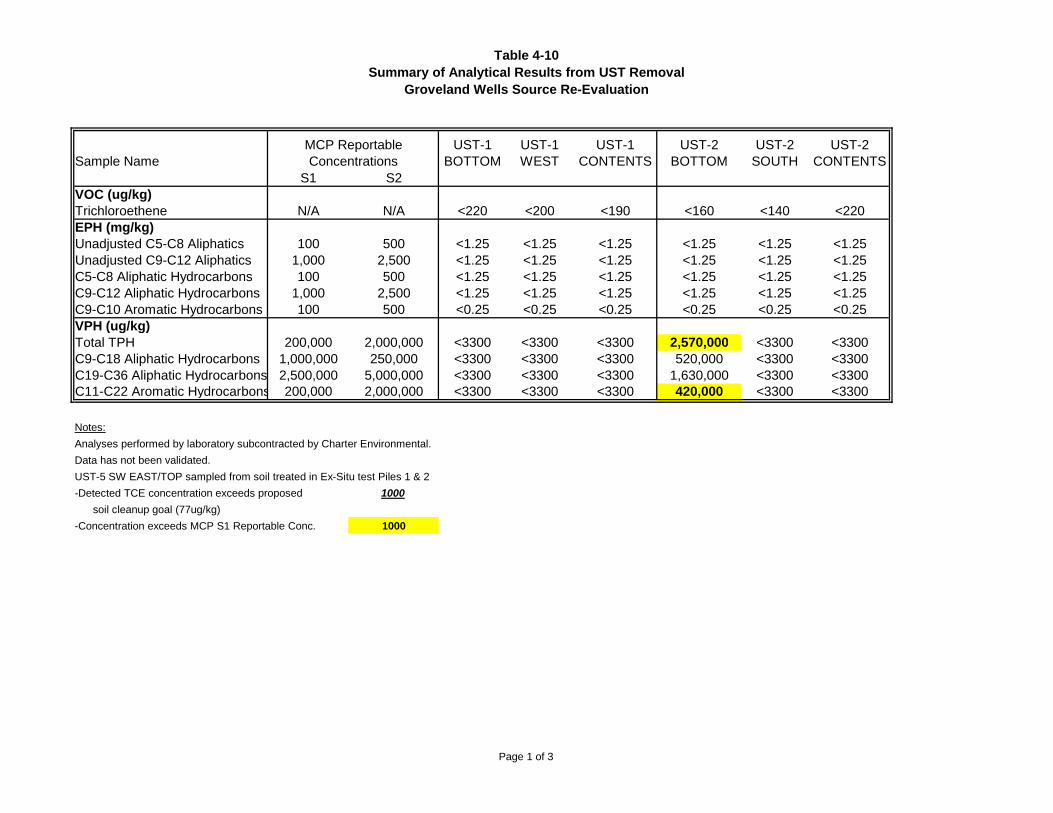
Table 410Summary of Analytical Results from UST Removal
Groveland Wells Source ReEvaluation
Sample NameMCP ReportableConcentrations
UST1BOTTOM
UST1WEST
UST1CONTENTS
UST2BOTTOM
UST2SOUTH
UST2CONTENTS
S1 S2VOC (ug/kg)Trichloroethene N/A N/A <220 <200 <190 <160 <140 <220EPH (mg/kg)Unadjusted C5C8 Aliphatics 100 500 <1.25 <1.25 <1.25 <1.25 <1.25 <1.25Unadjusted C9C12 Aliphatics 1,000 2,500 <1.25 <1.25 <1.25 <1.25 <1.25 <1.25C5C8 Aliphatic Hydrocarbons 100 500 <1.25 <1.25 <1.25 <1.25 <1.25 <1.25C9C12 Aliphatic Hydrocarbons 1,000 2,500 <1.25 <1.25 <1.25 <1.25 <1.25 <1.25C9C10 Aromatic Hydrocarbons 100 500 <0.25 <0.25 <0.25 <0.25 <0.25 <0.25VPH (ug/kg)Total TPH 200,000 2,000,000 <3300 <3300 <3300 2,570,000 <3300 <3300C9C18 Aliphatic Hydrocarbons 1,000,000 250,000 <3300 <3300 <3300 520,000 <3300 <3300C19C36 Aliphatic Hydrocarbons 2,500,000 5,000,000 <3300 <3300 <3300 1,630,000 <3300 <3300C11C22 Aromatic Hydrocarbons 200,000 2,000,000 <3300 <3300 <3300 420,000 <3300 <3300
Notes:Analyses performed by laboratory subcontracted by Charter Environmental.Data has not been validated.UST5 SW EAST/TOP sampled from soil treated in ExSitu test Piles 1 & 2Detected TCE concentration exceeds proposed 1000 soil cleanup goal (77ug/kg)Concentration exceeds MCP S1 Reportable Conc. 1000
Page 1 of 3
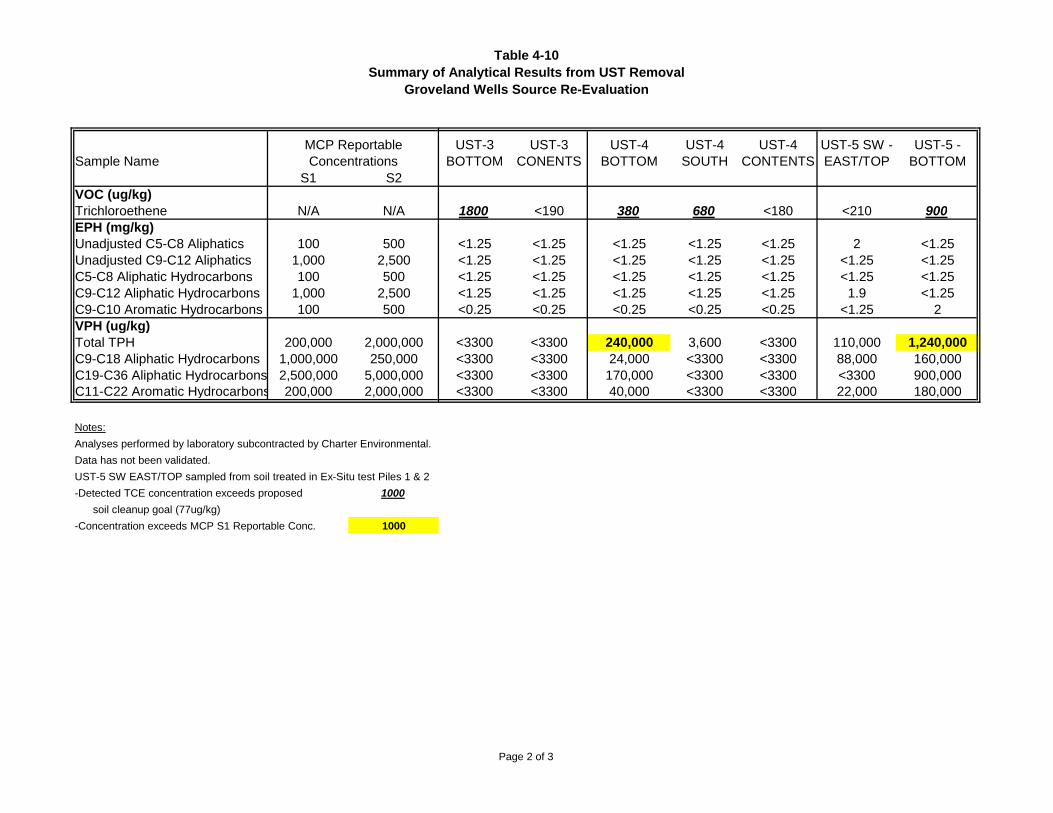
Table 410Summary of Analytical Results from UST Removal
Groveland Wells Source ReEvaluation
Sample NameMCP ReportableConcentrations
S1 S2VOC (ug/kg)Trichloroethene N/A N/AEPH (mg/kg)Unadjusted C5C8 Aliphatics 100 500Unadjusted C9C12 Aliphatics 1,000 2,500C5C8 Aliphatic Hydrocarbons 100 500C9C12 Aliphatic Hydrocarbons 1,000 2,500C9C10 Aromatic Hydrocarbons 100 500VPH (ug/kg)Total TPH 200,000 2,000,000C9C18 Aliphatic Hydrocarbons 1,000,000 250,000C19C36 Aliphatic Hydrocarbons 2,500,000 5,000,000C11C22 Aromatic Hydrocarbons 200,000 2,000,000
Notes:Analyses performed by laboratory subcontracted by Charter Environmental.Data has not been validated.UST5 SW EAST/TOP sampled from soil treated in ExSitu test Piles 1 & 2Detected TCE concentration exceeds proposed 1000 soil cleanup goal (77ug/kg)Concentration exceeds MCP S1 Reportable Conc. 1000
UST3BOTTOM
UST3CONENTS
UST4BOTTOM
UST4SOUTH
UST4CONTENTS
UST5 SW EAST/TOP
UST5 BOTTOM
1800 <190 380 680 <180 <210 900
<1.25 <1.25 <1.25 <1.25 <1.25 2 <1.25<1.25 <1.25 <1.25 <1.25 <1.25 <1.25 <1.25<1.25 <1.25 <1.25 <1.25 <1.25 <1.25 <1.25<1.25 <1.25 <1.25 <1.25 <1.25 1.9 <1.25<0.25 <0.25 <0.25 <0.25 <0.25 <1.25 2
<3300 <3300 240,000 3,600 <3300 110,000 1,240,000<3300 <3300 24,000 <3300 <3300 88,000 160,000<3300 <3300 170,000 <3300 <3300 <3300 900,000<3300 <3300 40,000 <3300 <3300 22,000 180,000
Page 2 of 3
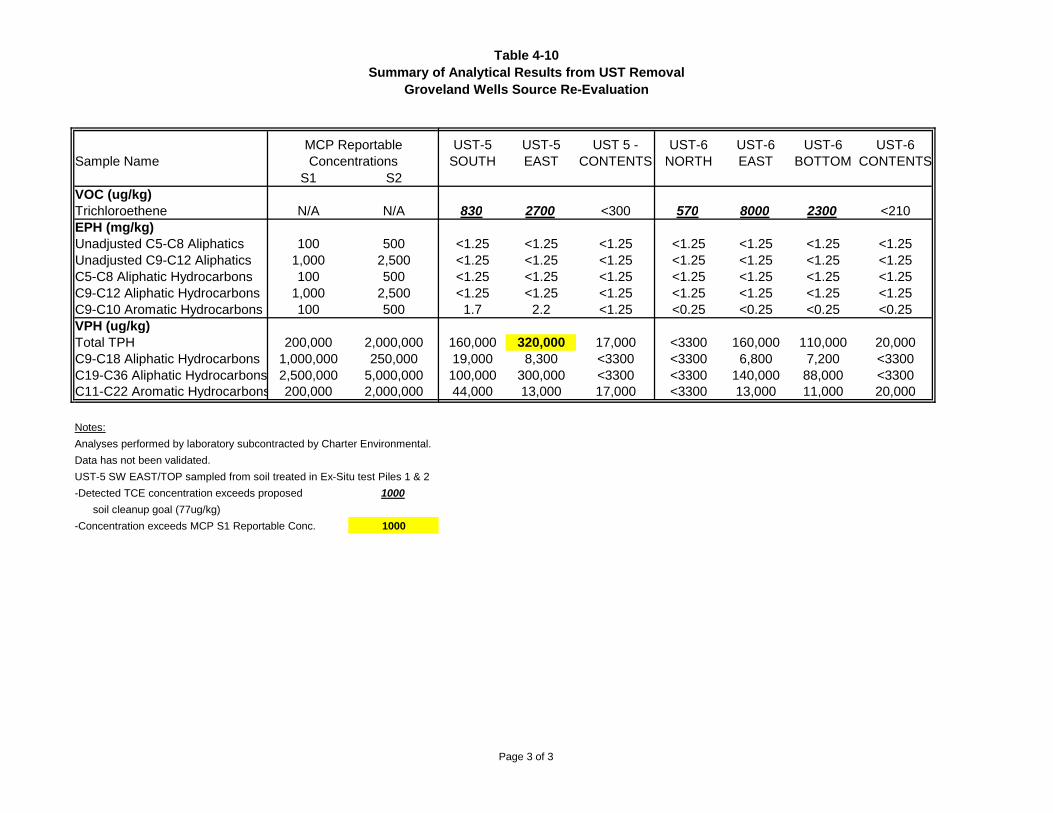
Table 410Summary of Analytical Results from UST Removal
Groveland Wells Source ReEvaluation
Sample NameMCP ReportableConcentrations
S1 S2VOC (ug/kg)Trichloroethene N/A N/AEPH (mg/kg)Unadjusted C5C8 Aliphatics 100 500Unadjusted C9C12 Aliphatics 1,000 2,500C5C8 Aliphatic Hydrocarbons 100 500C9C12 Aliphatic Hydrocarbons 1,000 2,500C9C10 Aromatic Hydrocarbons 100 500VPH (ug/kg)Total TPH 200,000 2,000,000C9C18 Aliphatic Hydrocarbons 1,000,000 250,000C19C36 Aliphatic Hydrocarbons 2,500,000 5,000,000C11C22 Aromatic Hydrocarbons 200,000 2,000,000
Notes:Analyses performed by laboratory subcontracted by Charter Environmental.Data has not been validated.UST5 SW EAST/TOP sampled from soil treated in ExSitu test Piles 1 & 2Detected TCE concentration exceeds proposed 1000 soil cleanup goal (77ug/kg)Concentration exceeds MCP S1 Reportable Conc. 1000
UST5SOUTH
UST5EAST
UST 5 CONTENTS
UST6NORTH
UST6EAST
UST6BOTTOM
UST6CONTENTS
830 2700 <300 570 8000 2300 <210
<1.25 <1.25 <1.25 <1.25 <1.25 <1.25 <1.25<1.25 <1.25 <1.25 <1.25 <1.25 <1.25 <1.25<1.25 <1.25 <1.25 <1.25 <1.25 <1.25 <1.25<1.25 <1.25 <1.25 <1.25 <1.25 <1.25 <1.25
1.7 2.2 <1.25 <0.25 <0.25 <0.25 <0.25
160,000 320,000 17,000 <3300 160,000 110,000 20,00019,000 8,300 <3300 <3300 6,800 7,200 <3300100,000 300,000 <3300 <3300 140,000 88,000 <330044,000 13,000 17,000 <3300 13,000 11,000 20,000
Page 3 of 3
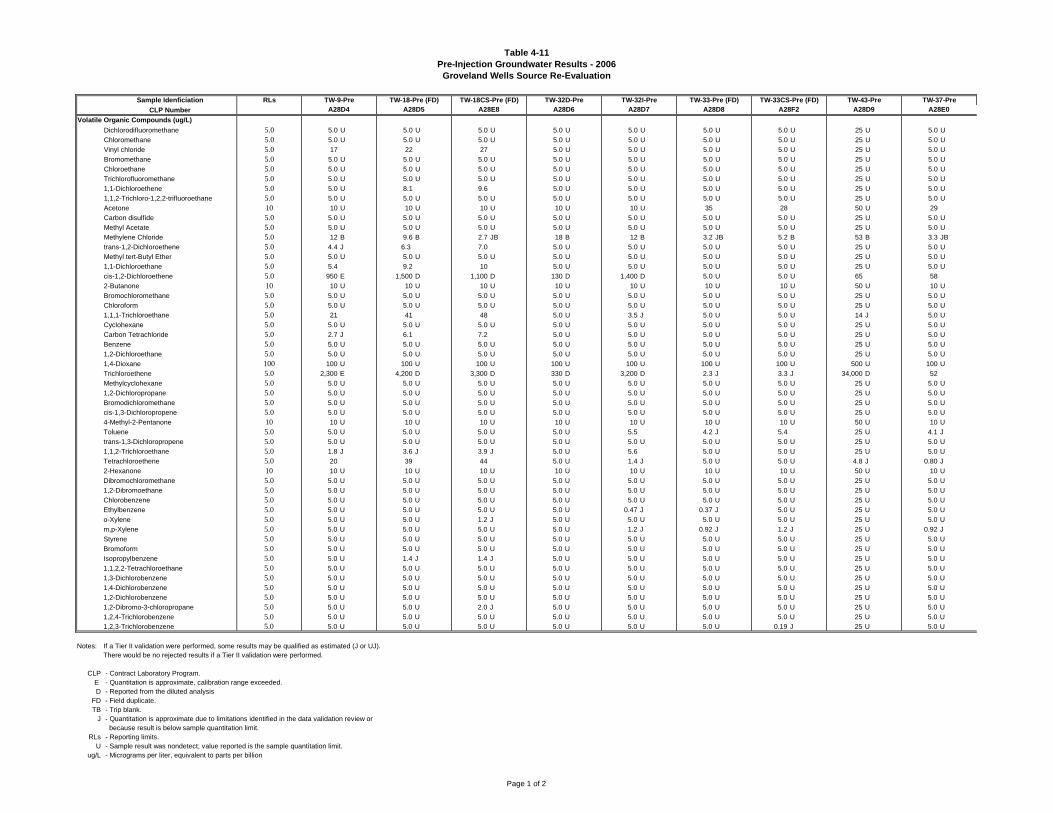
Table 411PreInjection Groundwater Results 2006
Groveland Wells Source ReEvaluation
Sample Idenficiation RLs TW9Pre TW18Pre (FD) TW18CSPre (FD) TW32DPre TW32IPre TW33Pre (FD) TW33CSPre (FD) TW43Pre TW37PreCLP Number
Volatile Organic Compounds (ug/L)Dichlorodifluoromethane 5.0 5.0 U 5.0 U 5.0 U 5.0 U 5.0 U 5.0 U 5.0 U 25 U 5.0 UChloromethane 5.0 5.0 U 5.0 U 5.0 U 5.0 U 5.0 U 5.0 U 5.0 U 25 U 5.0 UVinyl chloride 5.0 17 22 27 5.0 U 5.0 U 5.0 U 5.0 U 25 U 5.0 UBromomethane 5.0 5.0 U 5.0 U 5.0 U 5.0 U 5.0 U 5.0 U 5.0 U 25 U 5.0 UChloroethane 5.0 5.0 U 5.0 U 5.0 U 5.0 U 5.0 U 5.0 U 5.0 U 25 U 5.0 UTrichlorofluoromethane 5.0 5.0 U 5.0 U 5.0 U 5.0 U 5.0 U 5.0 U 5.0 U 25 U 5.0 U1,1Dichloroethene 5.0 5.0 U 8.1 9.6 5.0 U 5.0 U 5.0 U 5.0 U 25 U 5.0 U1,1,2Trichloro1,2,2trifluoroethane 5.0 5.0 U 5.0 U 5.0 U 5.0 U 5.0 U 5.0 U 5.0 U 25 U 5.0 UAcetone 10 10 U 10 U 10 U 10 U 10 U 35 28 50 U 29Carbon disulfide 5.0 5.0 U 5.0 U 5.0 U 5.0 U 5.0 U 5.0 U 5.0 U 25 U 5.0 UMethyl Acetate 5.0 5.0 U 5.0 U 5.0 U 5.0 U 5.0 U 5.0 U 5.0 U 25 U 5.0 UMethylene Chloride 5.0 12 B 9.6 B 2.7 JB 18 B 12 B 3.2 JB 5.2 B 53 B 3.3 JBtrans1,2Dichloroethene 5.0 4.4 J 6.3 7.0 5.0 U 5.0 U 5.0 U 5.0 U 25 U 5.0 UMethyl tertButyl Ether 5.0 5.0 U 5.0 U 5.0 U 5.0 U 5.0 U 5.0 U 5.0 U 25 U 5.0 U1,1Dichloroethane 5.0 5.4 9.2 10 5.0 U 5.0 U 5.0 U 5.0 U 25 U 5.0 Ucis1,2Dichloroethene 5.0 950 E 1,500 D 1,100 D 130 D 1,400 D 5.0 U 5.0 U 65 582Butanone 10 10 U 10 U 10 U 10 U 10 U 10 U 10 U 50 U 10 UBromochloromethane 5.0 5.0 U 5.0 U 5.0 U 5.0 U 5.0 U 5.0 U 5.0 U 25 U 5.0 UChloroform 5.0 5.0 U 5.0 U 5.0 U 5.0 U 5.0 U 5.0 U 5.0 U 25 U 5.0 U1,1,1Trichloroethane 5.0 21 41 48 5.0 U 3.5 J 5.0 U 5.0 U 14 J 5.0 UCyclohexane 5.0 5.0 U 5.0 U 5.0 U 5.0 U 5.0 U 5.0 U 5.0 U 25 U 5.0 UCarbon Tetrachloride 5.0 2.7 J 6.1 7.2 5.0 U 5.0 U 5.0 U 5.0 U 25 U 5.0 UBenzene 5.0 5.0 U 5.0 U 5.0 U 5.0 U 5.0 U 5.0 U 5.0 U 25 U 5.0 U1,2Dichloroethane 5.0 5.0 U 5.0 U 5.0 U 5.0 U 5.0 U 5.0 U 5.0 U 25 U 5.0 U1,4Dioxane 100 100 U 100 U 100 U 100 U 100 U 100 U 100 U 500 U 100 UTrichloroethene 5.0 2,300 E 4,200 D 3,300 D 330 D 3,200 D 2.3 J 3.3 J 34,000 D 52Methylcyclohexane 5.0 5.0 U 5.0 U 5.0 U 5.0 U 5.0 U 5.0 U 5.0 U 25 U 5.0 U1,2Dichloropropane 5.0 5.0 U 5.0 U 5.0 U 5.0 U 5.0 U 5.0 U 5.0 U 25 U 5.0 UBromodichloromethane 5.0 5.0 U 5.0 U 5.0 U 5.0 U 5.0 U 5.0 U 5.0 U 25 U 5.0 Ucis1,3Dichloropropene 5.0 5.0 U 5.0 U 5.0 U 5.0 U 5.0 U 5.0 U 5.0 U 25 U 5.0 U4Methyl2Pentanone 10 10 U 10 U 10 U 10 U 10 U 10 U 10 U 50 U 10 UToluene 5.0 5.0 U 5.0 U 5.0 U 5.0 U 5.5 4.2 J 5.4 25 U 4.1 Jtrans1,3Dichloropropene 5.0 5.0 U 5.0 U 5.0 U 5.0 U 5.0 U 5.0 U 5.0 U 25 U 5.0 U1,1,2Trichloroethane 5.0 1.8 J 3.6 J 3.9 J 5.0 U 5.6 5.0 U 5.0 U 25 U 5.0 UTetrachloroethene 5.0 20 39 44 5.0 U 1.4 J 5.0 U 5.0 U 4.8 J 0.80 J2Hexanone 10 10 U 10 U 10 U 10 U 10 U 10 U 10 U 50 U 10 UDibromochloromethane 5.0 5.0 U 5.0 U 5.0 U 5.0 U 5.0 U 5.0 U 5.0 U 25 U 5.0 U1,2Dibromoethane 5.0 5.0 U 5.0 U 5.0 U 5.0 U 5.0 U 5.0 U 5.0 U 25 U 5.0 UChlorobenzene 5.0 5.0 U 5.0 U 5.0 U 5.0 U 5.0 U 5.0 U 5.0 U 25 U 5.0 UEthylbenzene 5.0 5.0 U 5.0 U 5.0 U 5.0 U 0.47 J 0.37 J 5.0 U 25 U 5.0 UoXylene 5.0 5.0 U 5.0 U 1.2 J 5.0 U 5.0 U 5.0 U 5.0 U 25 U 5.0 Um,pXylene 5.0 5.0 U 5.0 U 5.0 U 5.0 U 1.2 J 0.92 J 1.2 J 25 U 0.92 JStyrene 5.0 5.0 U 5.0 U 5.0 U 5.0 U 5.0 U 5.0 U 5.0 U 25 U 5.0 UBromoform 5.0 5.0 U 5.0 U 5.0 U 5.0 U 5.0 U 5.0 U 5.0 U 25 U 5.0 UIsopropylbenzene 5.0 5.0 U 1.4 J 1.4 J 5.0 U 5.0 U 5.0 U 5.0 U 25 U 5.0 U1,1,2,2Tetrachloroethane 5.0 5.0 U 5.0 U 5.0 U 5.0 U 5.0 U 5.0 U 5.0 U 25 U 5.0 U1,3Dichlorobenzene 5.0 5.0 U 5.0 U 5.0 U 5.0 U 5.0 U 5.0 U 5.0 U 25 U 5.0 U1,4Dichlorobenzene 5.0 5.0 U 5.0 U 5.0 U 5.0 U 5.0 U 5.0 U 5.0 U 25 U 5.0 U1,2Dichlorobenzene 5.0 5.0 U 5.0 U 5.0 U 5.0 U 5.0 U 5.0 U 5.0 U 25 U 5.0 U1,2Dibromo3chloropropane 5.0 5.0 U 5.0 U 2.0 J 5.0 U 5.0 U 5.0 U 5.0 U 25 U 5.0 U1,2,4Trichlorobenzene 5.0 5.0 U 5.0 U 5.0 U 5.0 U 5.0 U 5.0 U 5.0 U 25 U 5.0 U1,2,3Trichlorobenzene 5.0 5.0 U 5.0 U 5.0 U 5.0 U 5.0 U 5.0 U 0.19 J 25 U 5.0 U
Notes: If a Tier II validation were performed, some results may be qualified as estimated (J or UJ).There would be no rejected results if a Tier II validation were performed.
CLP Contract Laboratory Program.E Quantitation is approximate, calibration range exceeded.D Reported from the diluted analysis
FD Field duplicate.TB Trip blank.
J Quantitation is approximate due to limitations identified in the data validation review or because result is below sample quantitation limit.
RLs Reporting limits.U Sample result was nondetect; value reported is the sample quantitation limit.
ug/L Micrograms per liter, equivalent to parts per billion
A28E0A28D7 A28D8 A28F2 A28D9A28D4 A28D5 A28E8 A28D6
Page 1 of 2
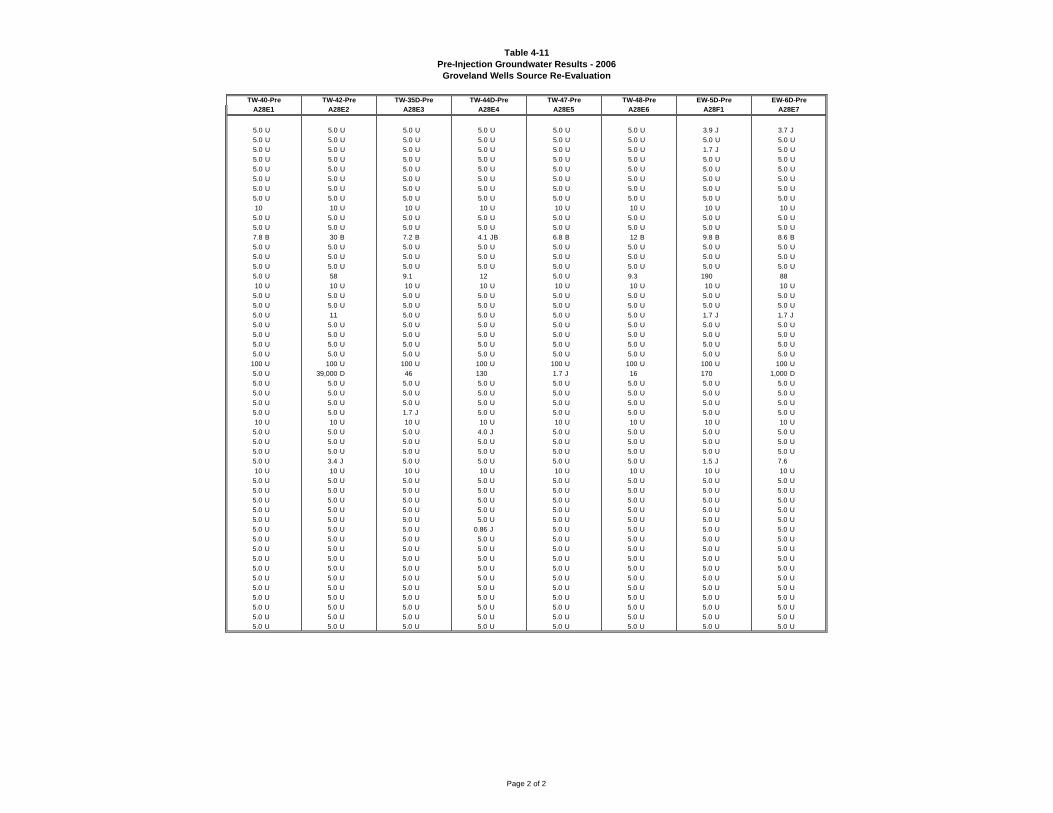
Table 411PreInjection Groundwater Results 2006
Groveland Wells Source ReEvaluation
TW40Pre TW42Pre TW35DPre TW44DPre TW47Pre TW48Pre EW5DPre EW6DPre
5.0 U 5.0 U 5.0 U 5.0 U 5.0 U 5.0 U 3.9 J 3.7 J5.0 U 5.0 U 5.0 U 5.0 U 5.0 U 5.0 U 5.0 U 5.0 U5.0 U 5.0 U 5.0 U 5.0 U 5.0 U 5.0 U 1.7 J 5.0 U5.0 U 5.0 U 5.0 U 5.0 U 5.0 U 5.0 U 5.0 U 5.0 U5.0 U 5.0 U 5.0 U 5.0 U 5.0 U 5.0 U 5.0 U 5.0 U5.0 U 5.0 U 5.0 U 5.0 U 5.0 U 5.0 U 5.0 U 5.0 U5.0 U 5.0 U 5.0 U 5.0 U 5.0 U 5.0 U 5.0 U 5.0 U5.0 U 5.0 U 5.0 U 5.0 U 5.0 U 5.0 U 5.0 U 5.0 U10 10 U 10 U 10 U 10 U 10 U 10 U 10 U
5.0 U 5.0 U 5.0 U 5.0 U 5.0 U 5.0 U 5.0 U 5.0 U5.0 U 5.0 U 5.0 U 5.0 U 5.0 U 5.0 U 5.0 U 5.0 U7.8 B 30 B 7.2 B 4.1 JB 6.8 B 12 B 9.8 B 8.6 B5.0 U 5.0 U 5.0 U 5.0 U 5.0 U 5.0 U 5.0 U 5.0 U5.0 U 5.0 U 5.0 U 5.0 U 5.0 U 5.0 U 5.0 U 5.0 U5.0 U 5.0 U 5.0 U 5.0 U 5.0 U 5.0 U 5.0 U 5.0 U5.0 U 58 9.1 12 5.0 U 9.3 190 8810 U 10 U 10 U 10 U 10 U 10 U 10 U 10 U
5.0 U 5.0 U 5.0 U 5.0 U 5.0 U 5.0 U 5.0 U 5.0 U5.0 U 5.0 U 5.0 U 5.0 U 5.0 U 5.0 U 5.0 U 5.0 U5.0 U 11 5.0 U 5.0 U 5.0 U 5.0 U 1.7 J 1.7 J5.0 U 5.0 U 5.0 U 5.0 U 5.0 U 5.0 U 5.0 U 5.0 U5.0 U 5.0 U 5.0 U 5.0 U 5.0 U 5.0 U 5.0 U 5.0 U5.0 U 5.0 U 5.0 U 5.0 U 5.0 U 5.0 U 5.0 U 5.0 U5.0 U 5.0 U 5.0 U 5.0 U 5.0 U 5.0 U 5.0 U 5.0 U
100 U 100 U 100 U 100 U 100 U 100 U 100 U 100 U5.0 U 39,000 D 46 130 1.7 J 16 170 1,000 D5.0 U 5.0 U 5.0 U 5.0 U 5.0 U 5.0 U 5.0 U 5.0 U5.0 U 5.0 U 5.0 U 5.0 U 5.0 U 5.0 U 5.0 U 5.0 U5.0 U 5.0 U 5.0 U 5.0 U 5.0 U 5.0 U 5.0 U 5.0 U5.0 U 5.0 U 1.7 J 5.0 U 5.0 U 5.0 U 5.0 U 5.0 U10 U 10 U 10 U 10 U 10 U 10 U 10 U 10 U
5.0 U 5.0 U 5.0 U 4.0 J 5.0 U 5.0 U 5.0 U 5.0 U5.0 U 5.0 U 5.0 U 5.0 U 5.0 U 5.0 U 5.0 U 5.0 U5.0 U 5.0 U 5.0 U 5.0 U 5.0 U 5.0 U 5.0 U 5.0 U5.0 U 3.4 J 5.0 U 5.0 U 5.0 U 5.0 U 1.5 J 7.610 U 10 U 10 U 10 U 10 U 10 U 10 U 10 U
5.0 U 5.0 U 5.0 U 5.0 U 5.0 U 5.0 U 5.0 U 5.0 U5.0 U 5.0 U 5.0 U 5.0 U 5.0 U 5.0 U 5.0 U 5.0 U5.0 U 5.0 U 5.0 U 5.0 U 5.0 U 5.0 U 5.0 U 5.0 U5.0 U 5.0 U 5.0 U 5.0 U 5.0 U 5.0 U 5.0 U 5.0 U5.0 U 5.0 U 5.0 U 5.0 U 5.0 U 5.0 U 5.0 U 5.0 U5.0 U 5.0 U 5.0 U 0.86 J 5.0 U 5.0 U 5.0 U 5.0 U5.0 U 5.0 U 5.0 U 5.0 U 5.0 U 5.0 U 5.0 U 5.0 U5.0 U 5.0 U 5.0 U 5.0 U 5.0 U 5.0 U 5.0 U 5.0 U5.0 U 5.0 U 5.0 U 5.0 U 5.0 U 5.0 U 5.0 U 5.0 U5.0 U 5.0 U 5.0 U 5.0 U 5.0 U 5.0 U 5.0 U 5.0 U5.0 U 5.0 U 5.0 U 5.0 U 5.0 U 5.0 U 5.0 U 5.0 U5.0 U 5.0 U 5.0 U 5.0 U 5.0 U 5.0 U 5.0 U 5.0 U5.0 U 5.0 U 5.0 U 5.0 U 5.0 U 5.0 U 5.0 U 5.0 U5.0 U 5.0 U 5.0 U 5.0 U 5.0 U 5.0 U 5.0 U 5.0 U5.0 U 5.0 U 5.0 U 5.0 U 5.0 U 5.0 U 5.0 U 5.0 U5.0 U 5.0 U 5.0 U 5.0 U 5.0 U 5.0 U 5.0 U 5.0 U
A28E7A28E4 A28E5 A28E6 A28F1A28E1 A28E2 A28E3
Page 2 of 2

Table 412 PostInjection Groundwater Results 2006
Groveland Wells Source ReEvaluation
Sample Identification RLs TW9Post TW9CSPost TW37Post TW35DPost TW42Post TW43Post TW44DPostCLP Number
Volatile Organic Compounds (ug/L)Dichlorodifluoromethane 5.0 5.0 U 5.0 U 5.0 U 5.0 U 5.0 U 5.0 U 5.0 UChloromethane 5.0 5.0 U 5.0 U 5.0 U 5.0 U 5.0 U 5.0 U 730 EVinyl chloride 5.0 5.0 U 8.8 11 5.0 U 5.0 U 5.0 U 5.0 UBromomethane 5.0 5.0 U 5.0 U 5.0 U 5.0 U 5.0 U 5.0 U 5.0 UChloroethane 5.0 5.0 U 5.0 U 5.0 U 5.0 U 5.0 U 5.0 U 5.0 UTrichlorofluoromethane 5.0 5.0 U 5.0 U 5.0 U 5.0 U 5.0 U 5.0 U 5.0 U1,1Dichloroethene 5.0 5.0 U 5.0 U 5.0 U 5.0 U 5.0 U 5.0 U 5.0 U1,1,2Trichloro1,2,2trifluoroethane 5.0 5.0 U 5.0 U 5.0 U 5.0 U 5.0 U 5.0 U 5.0 UAcetone 10 78 85 10 10 U 10 U 10 U 10 UCarbon disulfide 5.0 5.0 U 5.0 U 5.0 U 5.0 U 5.0 U 5.0 U 5.0 UMethyl Acetate 5.0 5.0 U 4.4 J 5.0 U 5.0 U 5.0 U 5.0 U 5.0 UMethylene Chloride 5.0 5.0 U 5.0 U 5.0 U 5.0 U 5.0 U 5.0 U 5.0 Utrans1,2Dichloroethene 5.0 5.0 U 5.0 U 5.0 U 5.0 U 5.0 U 4.3 J 5.0 UMethyl tertButyl Ether 5.0 5.0 U 5.0 U 5.0 U 5.0 U 5.0 U 5.0 U 5.0 U1,1Dichloroethane 5.0 5.0 U 5.0 U 5.0 U 2.2 J 5.0 U 5.0 U 5.0 Ucis1,2Dichloroethene 5.0 120 120 120 320 E 5.6 120 1802Butanone 10 10 U 23 10 U 10 U 10 U 10 U 10 UBromochloromethane 5.0 5.0 U 5.0 U 5.0 U 5.0 U 5.0 U 5.0 U 5.0 UChloroform 5.0 5.0 U 5.0 U 5.0 U 5.0 U 2.5 J 5.0 U 5.0 U1,1,1Trichloroethane 5.0 4.8 J 4.1 J 5.0 U 20 26 16 9.8Cyclohexane 5.0 4.8 U 5.0 U 5.0 U 5.0 U 5.0 U 5.0 U 5.0 UCarbon Tetrachloride 5.0 4.8 U 5.0 U 5.0 U 6.1 11 4.3 J 5.0 UBenzene 5.0 4.8 U 5.0 U 5.0 U 5.0 U 5.0 U 5.0 U 5.0 U1,2Dichloroethane 5.0 4.8 U 5.0 U 5.0 U 5.0 U 5.0 U 5.0 U 5.0 U1,4Dioxane 100 100 U 100 U 100 U 100 U 100 U 100 U 100 UTrichloroethene 5.0 39 37 B 130 32,000 DB 55 B 19,000 DB 9,800 DBMethylcyclohexane 5.0 5.0 U 5.0 U 5.0 U 5.0 U 5.0 U 5.0 U 5.0 U1,2Dichloropropane 5.0 5.0 U 5.0 U 5.0 U 5.0 U 5.0 U 5.0 U 5.0 UBromodichloromethane 5.0 5.0 U 5.0 U 5.0 U 5.0 U 5.0 U 5.0 U 5.0 Ucis1,3Dichloropropene 5.0 5.0 U 5.0 U 5.0 U 5.0 U 5.0 U 5.0 U 5.0 U4Methyl2Pentanone 10 10 U 10 U 10 U 10 U 10 U 10 U 10 UToluene 5.0 5.0 U 5.0 U 5.0 U 5.0 U 5.0 U 5.0 U 5.0 Utrans1,3Dichloropropene 5.0 5.0 U 5.0 U 5.0 U 5.0 U 5.0 U 5.0 U 5.0 U1,1,2Trichloroethane 5.0 5.0 U 5.0 U 5.0 U 5.0 U 5.0 U 5.0 U 5.0 UTetrachloroethene 5.0 4.7 J 4.2 J 14 15 5.6 5.0 J 3.9 J2Hexanone 10 10 U 10 U 10 U 10 U 10 U 10 U 10 UDibromochloromethane 5.0 5.0 U 5.0 U 5.0 U 5.0 U 5.0 U 5.0 U 5.0 U1,2Dibromoethane 5.0 5.0 U 5.0 U 5.0 U 5.0 U 5.0 U 5.0 U 5.0 UChlorobenzene 5.0 5.0 U 5.0 U 5.0 U 5.0 U 5.0 U 5.0 U 5.0 UEthylbenzene 5.0 5.0 U 5.0 U 5.0 U 5.0 U 5.0 U 5.0 U 5.0 Um,pXylene 5.0 5.0 U 5.0 U 5.0 U 5.0 U 5.0 U 5.0 U 5.0 UoXylene 5.0 5.0 U 5.0 U 5.0 U 5.0 U 5.0 U 5.0 U 5.0 UStyrene 5.0 5.0 U 5.0 U 5.0 U 5.0 U 5.0 U 5.0 U 5.0 UBromoform 5.0 5.0 U 5.0 U 5.0 U 5.0 U 5.0 U 5.0 U 5.0 UIsopropylbenzene 5.0 5.0 U 5.0 U 5.0 U 5.0 U 5.0 U 5.0 U 5.0 U1,1,2,2Tetrachloroethane 5.0 5.0 U 5.0 U 5.0 U 5.0 U 5.0 U 5.0 U 5.0 U1,3Dichlorobenzene 5.0 5.0 U 5.0 U 5.0 U 5.0 U 5.0 U 5.0 U 5.0 U1,4Dichlorobenzene 5.0 5.0 U 5.0 U 5.0 U 5.0 U 5.0 U 5.0 U 5.0 U1,2Dichlorobenzene 5.0 5.0 U 5.0 U 5.0 U 5.0 U 5.0 U 5.0 U 5.0 U1,2Dibromo3chloropropane 5.0 5.0 U 5.0 U 5.0 U 5.0 U 5.0 U 5.0 U 5.0 U1,2,4Trichlorobenzene 5.0 5.0 U 5.0 U 5.0 U 5.0 U 5.0 U 5.0 U 5.0 U1,2,3Trichlorobenzene 5.0 5.0 U 5.0 U 5.0 U 5.0 U 5.0 U 5.0 U 5.0 U
Notes: If a Tier II validation were performed, some results may be qualified as estimated (J or UJ).In addition, if a Tier II validation were performed, results for acetone and 2butanone in sampleTW42Post would be rejected due to surrogate recovery issues.
B Analyte was present in a blank.CLP Contract Laboratory Program.
D Reported from diluted analysis.E Quantitation is approximate, calibration range exceeded.
FD Field duplicate.J Quantitation is approximate due to limitations identified in the data validation review or
because result is below sample quantitation limit.RLs Reporting limits.
U Sample result was nondetect; value reported is the sample quantitation limit.ug/L Micrograms per liter, equivalent to parts per billion
A28G3 A28G2 A28G5A28F9 A28G7 A28G0 A28G1
Page 1 of 1
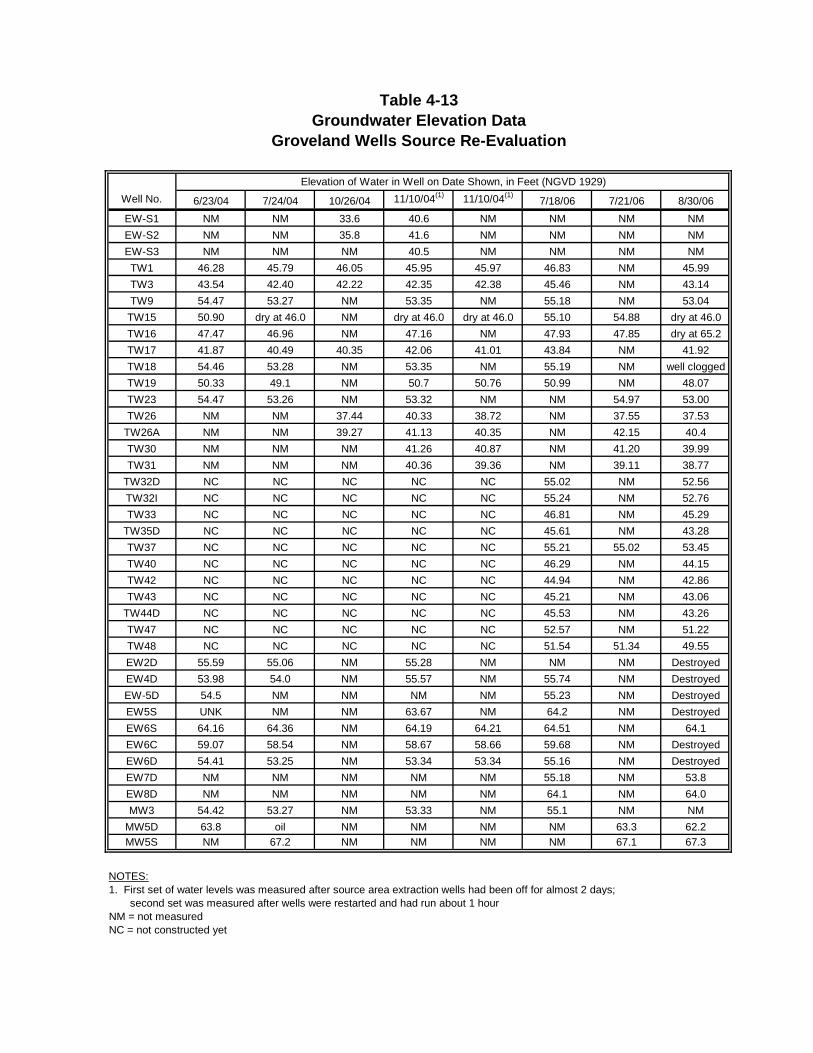
Groveland Wells Source ReEvaluation
Well No. 6/23/04 7/24/04 10/26/04 11/10/04(1) 11/10/04(1)7/18/06 7/21/06 8/30/06
EWS1 NM NM 33.6 40.6 NM NM NM NMEWS2 NM NM 35.8 41.6 NM NM NM NMEWS3 NM NM NM 40.5 NM NM NM NMTW1 46.28 45.79 46.05 45.95 45.97 46.83 NM 45.99TW3 43.54 42.40 42.22 42.35 42.38 45.46 NM 43.14TW9 54.47 53.27 NM 53.35 NM 55.18 NM 53.04
TW15 50.90 dry at 46.0 NM dry at 46.0 dry at 46.0 55.10 54.88 dry at 46.0TW16 47.47 46.96 NM 47.16 NM 47.93 47.85 dry at 65.2TW17 41.87 40.49 40.35 42.06 41.01 43.84 NM 41.92TW18 54.46 53.28 NM 53.35 NM 55.19 NM well cloggedTW19 50.33 49.1 NM 50.7 50.76 50.99 NM 48.07TW23 54.47 53.26 NM 53.32 NM NM 54.97 53.00TW26 NM NM 37.44 40.33 38.72 NM 37.55 37.53
TW26A NM NM 39.27 41.13 40.35 NM 42.15 40.4TW30 NM NM NM 41.26 40.87 NM 41.20 39.99TW31 NM NM NM 40.36 39.36 NM 39.11 38.77
TW32D NC NC NC NC NC 55.02 NM 52.56TW32I NC NC NC NC NC 55.24 NM 52.76TW33 NC NC NC NC NC 46.81 NM 45.29
TW35D NC NC NC NC NC 45.61 NM 43.28TW37 NC NC NC NC NC 55.21 55.02 53.45TW40 NC NC NC NC NC 46.29 NM 44.15TW42 NC NC NC NC NC 44.94 NM 42.86TW43 NC NC NC NC NC 45.21 NM 43.06
TW44D NC NC NC NC NC 45.53 NM 43.26TW47 NC NC NC NC NC 52.57 NM 51.22TW48 NC NC NC NC NC 51.54 51.34 49.55EW2D 55.59 55.06 NM 55.28 NM NM NM DestroyedEW4D 53.98 54.0 NM 55.57 NM 55.74 NM DestroyedEW5D 54.5 NM NM NM NM 55.23 NM DestroyedEW5S UNK NM NM 63.67 NM 64.2 NM DestroyedEW6S 64.16 64.36 NM 64.19 64.21 64.51 NM 64.1EW6C 59.07 58.54 NM 58.67 58.66 59.68 NM DestroyedEW6D 54.41 53.25 NM 53.34 53.34 55.16 NM DestroyedEW7D NM NM NM NM NM 55.18 NM 53.8EW8D NM NM NM NM NM 64.1 NM 64.0MW3 54.42 53.27 NM 53.33 NM 55.1 NM NM
MW5D 63.8 oil NM NM NM NM 63.3 62.2MW5S NM 67.2 NM NM NM NM 67.1 67.3
NOTES:1. First set of water levels was measured after source area extraction wells had been off for almost 2 days; second set was measured after wells were restarted and had run about 1 hourNM = not measuredNC = not constructed yet
Elevation of Water in Well on Date Shown, in Feet (NGVD 1929)
Table 413Groundwater Elevation Data
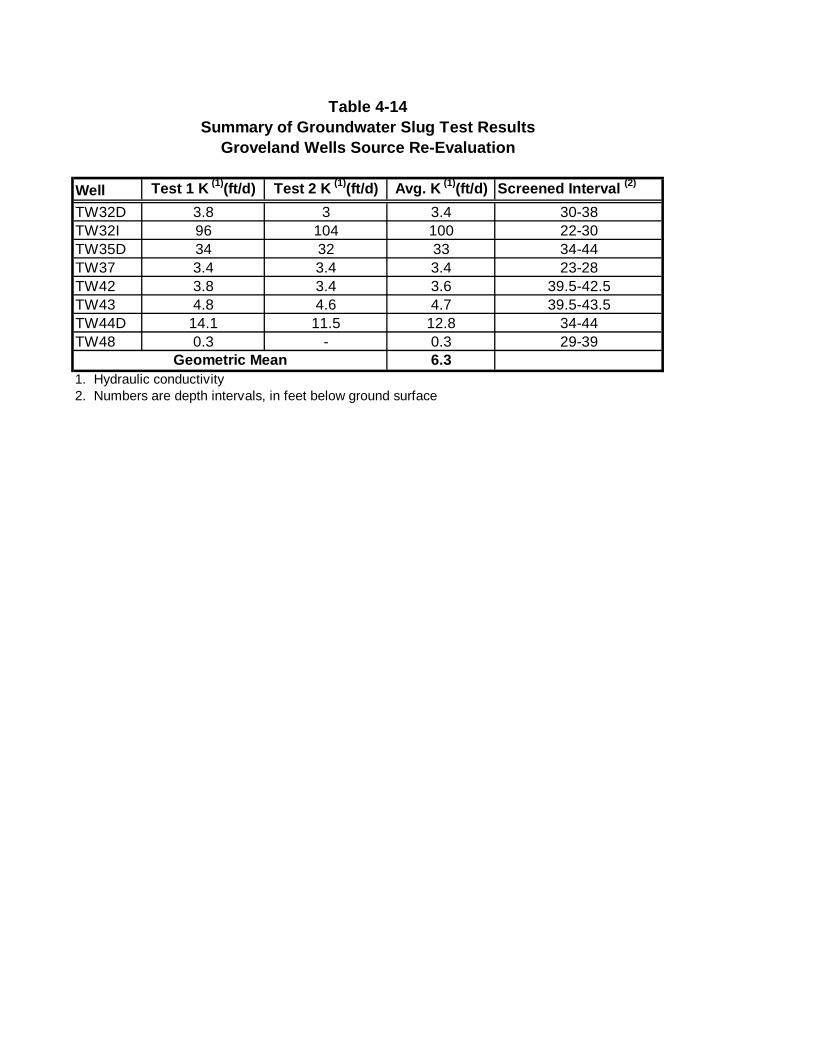
Table 414Summary of Groundwater Slug Test Results
Groveland Wells Source ReEvaluation
Well Test 1 K (1)(ft/d) Test 2 K (1)(ft/d) Avg. K (1)(ft/d) Screened Interval (2)
TW32D 3.8 3 3.4 3038TW32I 96 104 100 2230TW35D 34 32 33 3444TW37 3.4 3.4 3.4 2328TW42 3.8 3.4 3.6 39.542.5TW43 4.8 4.6 4.7 39.543.5TW44D 14.1 11.5 12.8 3444TW48 0.3 0.3 2939
6.31. Hydraulic conductivity2. Numbers are depth intervals, in feet below ground surface
Geometric Mean
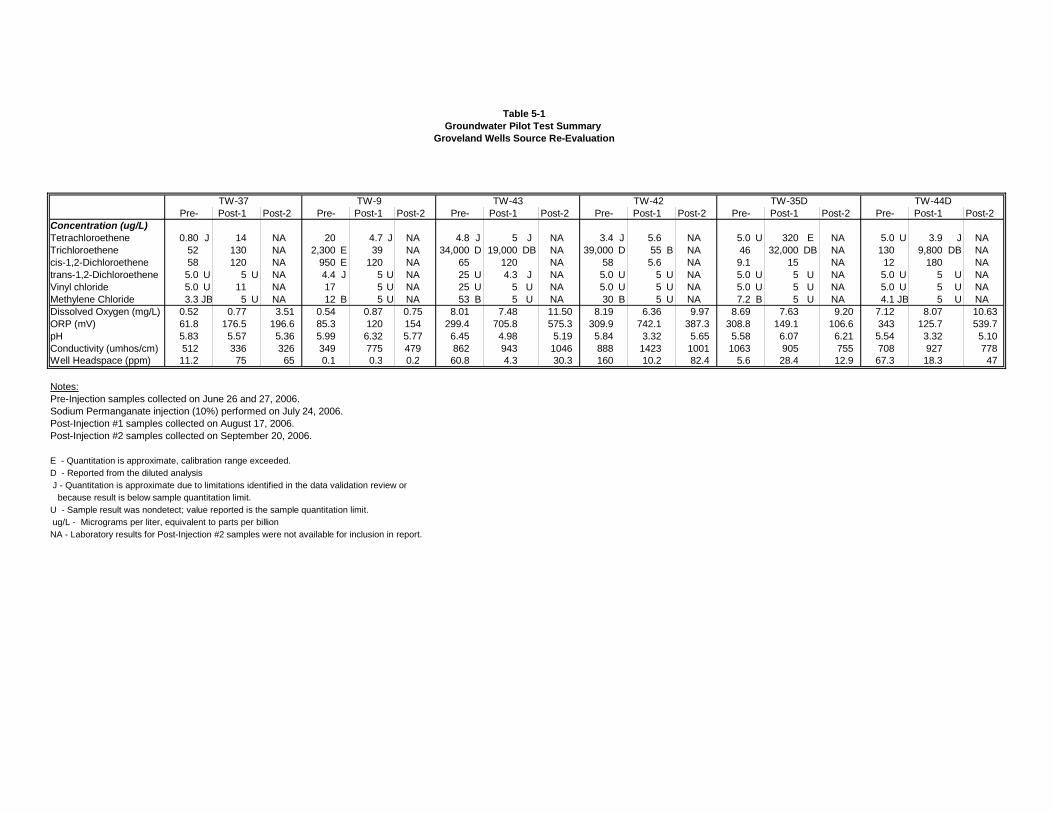
Table 51Groundwater Pilot Test Summary
Groveland Wells Source ReEvaluation
TW37 TW9 TW43 TW42 TW35D TW44DPre Post1 Post2 Pre Post1 Post2 Pre Post1 Post2 Pre Post1 Post2 Pre Post1 Post2 Pre Post1 Post2
Concentration (ug/L)Tetrachloroethene 0.80 J 14 NA 20 4.7 J NA 4.8 J 5 J NA 3.4 J 5.6 NA 5.0 U 320 E NA 5.0 U 3.9 J NATrichloroethene 52 130 NA 2,300 E 39 NA 34,000 D 19,000 DB NA 39,000 D 55 B NA 46 32,000 DB NA 130 9,800 DB NAcis1,2Dichloroethene 58 120 NA 950 E 120 NA 65 120 NA 58 5.6 NA 9.1 15 NA 12 180 NAtrans1,2Dichloroethene 5.0 U 5 U NA 4.4 J 5 U NA 25 U 4.3 J NA 5.0 U 5 U NA 5.0 U 5 U NA 5.0 U 5 U NAVinyl chloride 5.0 U 11 NA 17 5 U NA 25 U 5 U NA 5.0 U 5 U NA 5.0 U 5 U NA 5.0 U 5 U NAMethylene Chloride 3.3 JB 5 U NA 12 B 5 U NA 53 B 5 U NA 30 B 5 U NA 7.2 B 5 U NA 4.1 JB 5 U NADissolved Oxygen (mg/L) 0.52 0.77 3.51 0.54 0.87 0.75 8.01 7.48 11.50 8.19 6.36 9.97 8.69 7.63 9.20 7.12 8.07 10.63ORP (mV) 61.8 176.5 196.6 85.3 120 154 299.4 705.8 575.3 309.9 742.1 387.3 308.8 149.1 106.6 343 125.7 539.7pH 5.83 5.57 5.36 5.99 6.32 5.77 6.45 4.98 5.19 5.84 3.32 5.65 5.58 6.07 6.21 5.54 3.32 5.10Conductivity (umhos/cm) 512 336 326 349 775 479 862 943 1046 888 1423 1001 1063 905 755 708 927 778Well Headspace (ppm) 11.2 75 65 0.1 0.3 0.2 60.8 4.3 30.3 160 10.2 82.4 5.6 28.4 12.9 67.3 18.3 47
Notes:PreInjection samples collected on June 26 and 27, 2006.Sodium Permanganate injection (10%) performed on July 24, 2006.PostInjection #1 samples collected on August 17, 2006.PostInjection #2 samples collected on September 20, 2006.
E Quantitation is approximate, calibration range exceeded.D Reported from the diluted analysis J Quantitation is approximate due to limitations identified in the data validation review or because result is below sample quantitation limit.U Sample result was nondetect; value reported is the sample quantitation limit. ug/L Micrograms per liter, equivalent to parts per billionNA Laboratory results for PostInjection #2 samples were not available for inclusion in report.
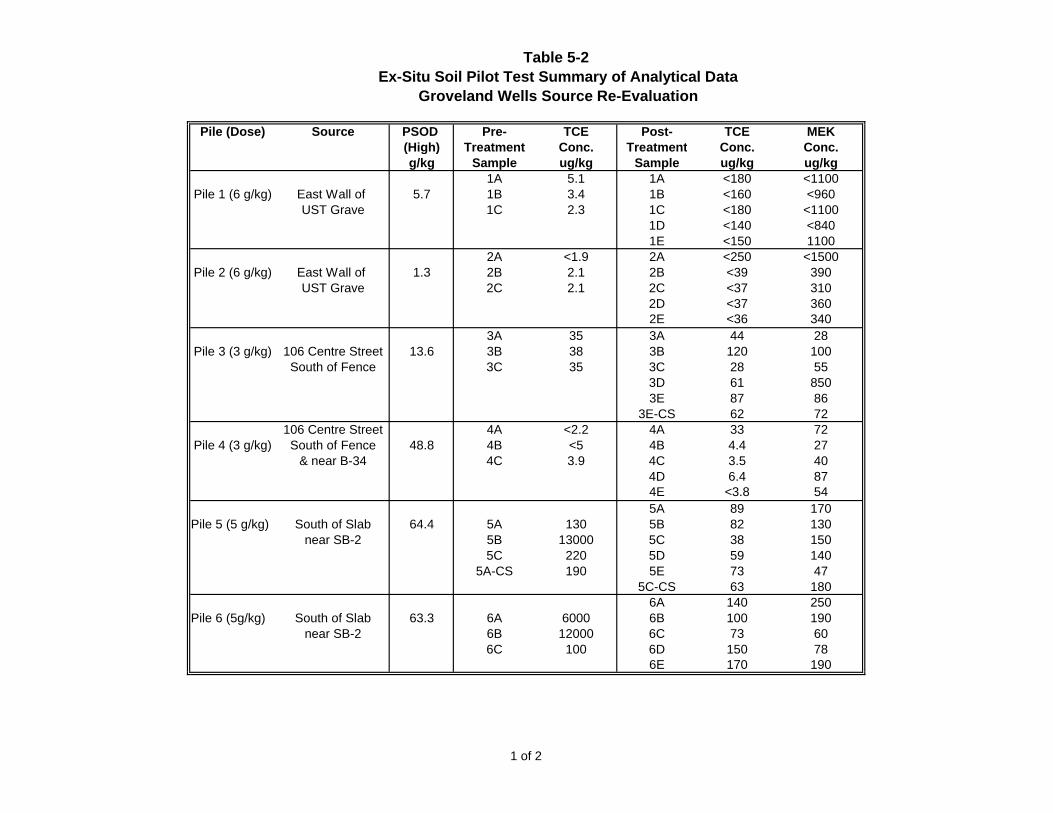
Table 52ExSitu Soil Pilot Test Summary of Analytical Data
Groveland Wells Source ReEvaluation
Pile (Dose) Source PSOD Pre TCE Post TCE MEK(High) Treatment Conc. Treatment Conc. Conc.g/kg Sample ug/kg Sample ug/kg ug/kg
1A 5.1 1A <180 <1100Pile 1 (6 g/kg) East Wall of 5.7 1B 3.4 1B <160 <960
UST Grave 1C 2.3 1C <180 <11001D <140 <8401E <150 1100
2A <1.9 2A <250 <1500Pile 2 (6 g/kg) East Wall of 1.3 2B 2.1 2B <39 390
UST Grave 2C 2.1 2C <37 3102D <37 3602E <36 340
3A 35 3A 44 28Pile 3 (3 g/kg) 106 Centre Street 13.6 3B 38 3B 120 100
South of Fence 3C 35 3C 28 553D 61 8503E 87 86
3ECS 62 72106 Centre Street 4A <2.2 4A 33 72
Pile 4 (3 g/kg) South of Fence 48.8 4B <5 4B 4.4 27& near B34 4C 3.9 4C 3.5 40
4D 6.4 874E <3.8 545A 89 170
Pile 5 (5 g/kg) South of Slab 64.4 5A 130 5B 82 130near SB2 5B 13000 5C 38 150
5C 220 5D 59 1405ACS 190 5E 73 47
5CCS 63 1806A 140 250
Pile 6 (5g/kg) South of Slab 63.3 6A 6000 6B 100 190near SB2 6B 12000 6C 73 60
6C 100 6D 150 786E 170 190
1 of 2
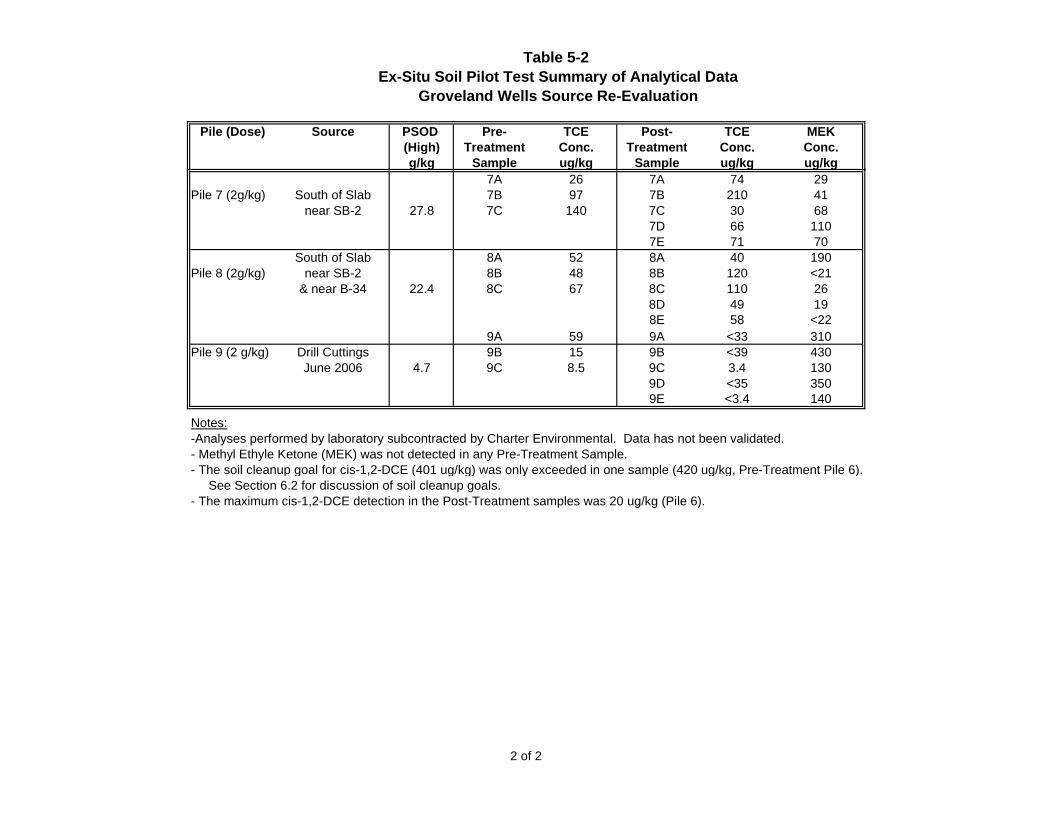
Table 52ExSitu Soil Pilot Test Summary of Analytical Data
Groveland Wells Source ReEvaluation
Pile (Dose) Source PSOD Pre TCE Post TCE MEK(High) Treatment Conc. Treatment Conc. Conc.g/kg Sample ug/kg Sample ug/kg ug/kg
7A 26 7A 74 29Pile 7 (2g/kg) South of Slab 7B 97 7B 210 41
near SB2 27.8 7C 140 7C 30 687D 66 1107E 71 70
South of Slab 8A 52 8A 40 190Pile 8 (2g/kg) near SB2 8B 48 8B 120 <21
& near B34 22.4 8C 67 8C 110 268D 49 198E 58 <22
9A 59 9A <33 310Pile 9 (2 g/kg) Drill Cuttings 9B 15 9B <39 430
June 2006 4.7 9C 8.5 9C 3.4 1309D <35 3509E <3.4 140
Notes:Analyses performed by laboratory subcontracted by Charter Environmental. Data has not been validated. Methyl Ethyle Ketone (MEK) was not detected in any PreTreatment Sample. The soil cleanup goal for cis1,2DCE (401 ug/kg) was only exceeded in one sample (420 ug/kg, PreTreatment Pile 6). See Section 6.2 for discussion of soil cleanup goals. The maximum cis1,2DCE detection in the PostTreatment samples was 20 ug/kg (Pile 6).
2 of 2
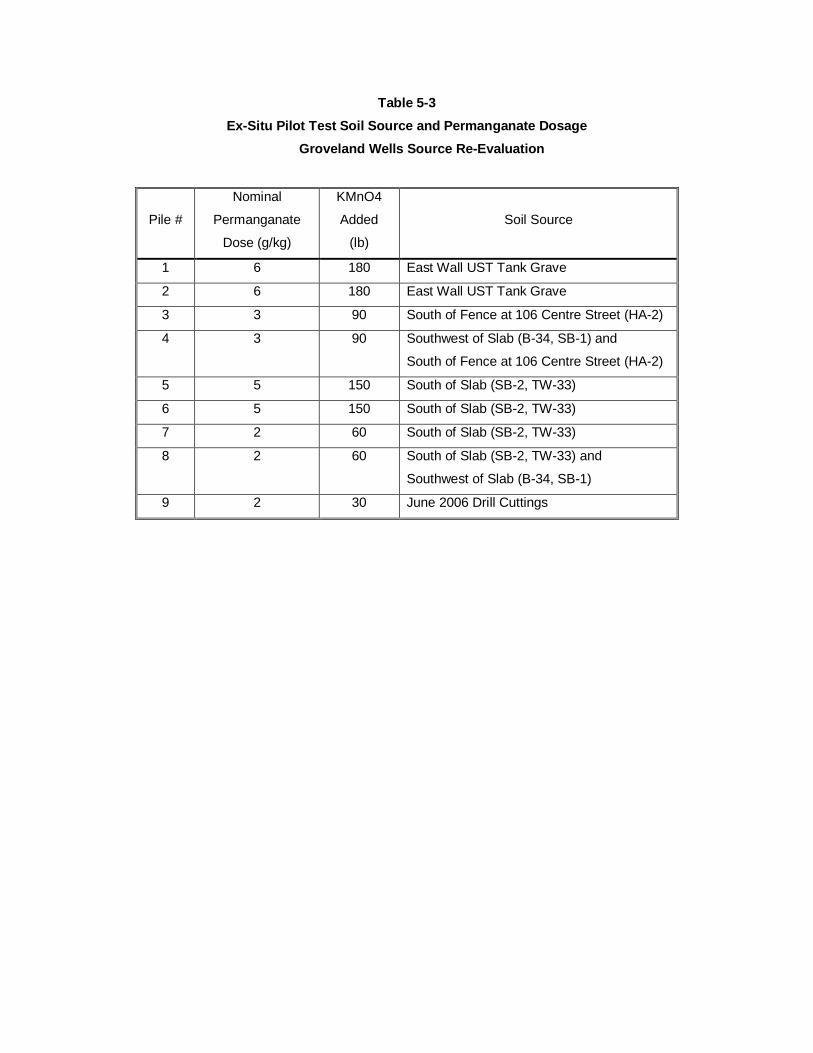
Table 53ExSitu Pilot Test Soil Source and Permanganate Dosage
Groveland Wells Source ReEvaluation
Pile #
Nominal
Permanganate
Dose (g/kg)
KMnO4
Added
(lb)
Soil Source
1 6 180 East Wall UST Tank Grave
2 6 180 East Wall UST Tank Grave
3 3 90 South of Fence at 106 Centre Street (HA2)
4 3 90 Southwest of Slab (B34, SB1) and
South of Fence at 106 Centre Street (HA2)
5 5 150 South of Slab (SB2, TW33)
6 5 150 South of Slab (SB2, TW33)
7 2 60 South of Slab (SB2, TW33)
8 2 60 South of Slab (SB2, TW33) and
Southwest of Slab (B34, SB1)
9 2 30 June 2006 Drill Cuttings
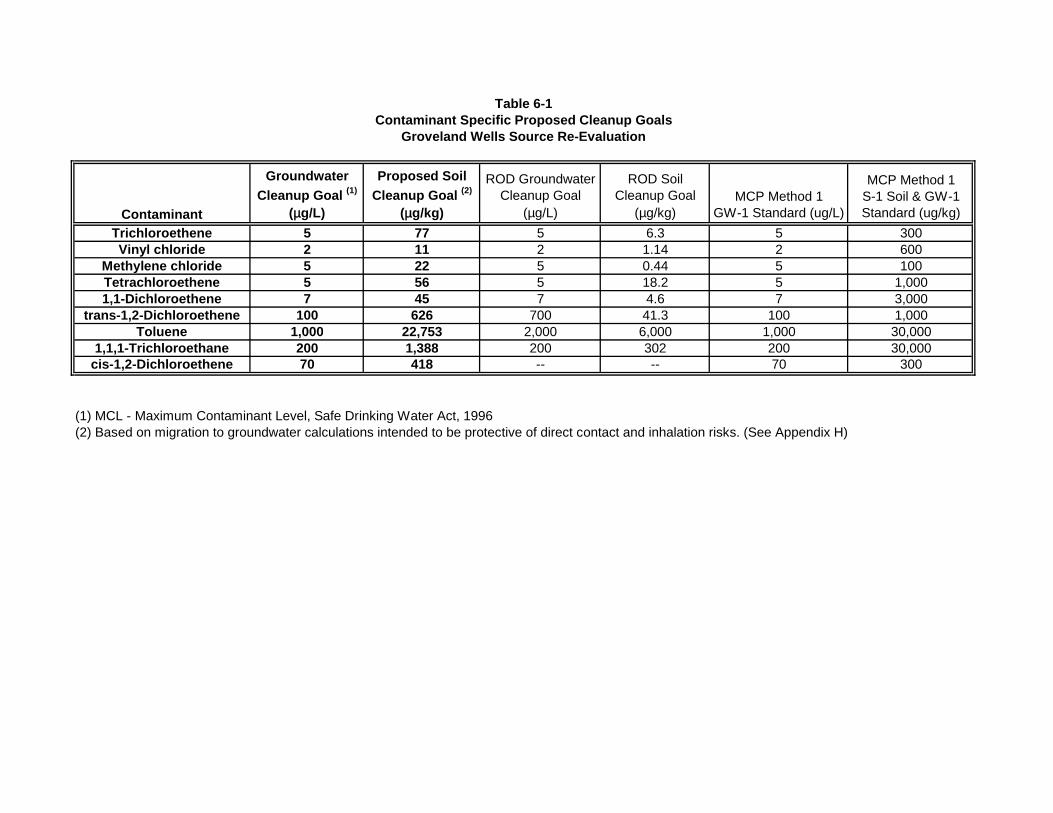
Table 61Contaminant Specific Proposed Cleanup Goals
Groveland Wells Source ReEvaluation
Contaminant
GroundwaterCleanup Goal (1)
(µg/L)
Proposed SoilCleanup Goal (2)
(µg/kg)
ROD GroundwaterCleanup Goal
(µg/L)
ROD SoilCleanup Goal
(µg/kg)MCP Method 1
GW1 Standard (ug/L)
MCP Method 1S1 Soil & GW1Standard (ug/kg)
Trichloroethene 5 77 5 6.3 5 300Vinyl chloride 2 11 2 1.14 2 600
Methylene chloride 5 22 5 0.44 5 100Tetrachloroethene 5 56 5 18.2 5 1,0001,1Dichloroethene 7 45 7 4.6 7 3,000
trans1,2Dichloroethene 100 626 700 41.3 100 1,000Toluene 1,000 22,753 2,000 6,000 1,000 30,000
1,1,1Trichloroethane 200 1,388 200 302 200 30,000cis1,2Dichloroethene 70 418 70 300
(1) MCL Maximum Contaminant Level, Safe Drinking Water Act, 1996(2) Based on migration to groundwater calculations intended to be protective of direct contact and inhalation risks. (See Appendix H)
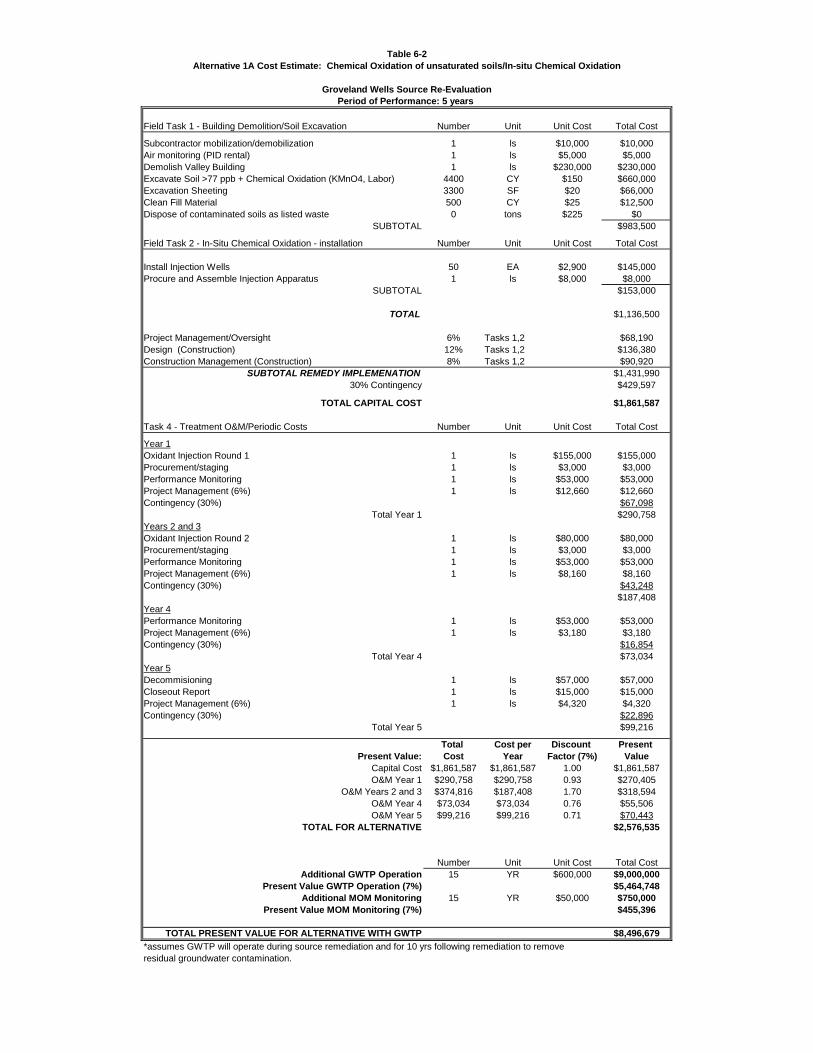
Table 62Alternative 1A Cost Estimate: Chemical Oxidation of unsaturated soils/Insitu Chemical Oxidation
Groveland Wells Source ReEvaluationPeriod of Performance: 5 years
Field Task 1 Building Demolition/Soil Excavation Number Unit Unit Cost Total Cost
Subcontractor mobilization/demobilization 1 ls $10,000 $10,000Air monitoring (PID rental) 1 ls $5,000 $5,000Demolish Valley Building 1 ls $230,000 $230,000Excavate Soil >77 ppb + Chemical Oxidation (KMnO4, Labor) 4400 CY $150 $660,000Excavation Sheeting 3300 SF $20 $66,000Clean Fill Material 500 CY $25 $12,500Dispose of contaminated soils as listed waste 0 tons $225 $0
SUBTOTAL $983,500
Field Task 2 InSitu Chemical Oxidation installation Number Unit Unit Cost Total Cost
Install Injection Wells 50 EA $2,900 $145,000Procure and Assemble Injection Apparatus 1 ls $8,000 $8,000
SUBTOTAL $153,000
TOTAL $1,136,500
Project Management/Oversight 6% Tasks 1,2 $68,190Design (Construction) 12% Tasks 1,2 $136,380Construction Management (Construction) 8% Tasks 1,2 $90,920
SUBTOTAL REMEDY IMPLEMENATION $1,431,99030% Contingency $429,597
TOTAL CAPITAL COST $1,861,587
Task 4 Treatment O&M/Periodic Costs Number Unit Unit Cost Total Cost
Year 1Oxidant Injection Round 1 1 ls $155,000 $155,000Procurement/staging 1 ls $3,000 $3,000Performance Monitoring 1 ls $53,000 $53,000Project Management (6%) 1 ls $12,660 $12,660Contingency (30%) $67,098
Total Year 1 $290,758Years 2 and 3Oxidant Injection Round 2 1 ls $80,000 $80,000Procurement/staging 1 ls $3,000 $3,000Performance Monitoring 1 ls $53,000 $53,000Project Management (6%) 1 ls $8,160 $8,160Contingency (30%) $43,248
$187,408Year 4Performance Monitoring 1 ls $53,000 $53,000Project Management (6%) 1 ls $3,180 $3,180Contingency (30%) $16,854
Total Year 4 $73,034Year 5Decommisioning 1 ls $57,000 $57,000Closeout Report 1 ls $15,000 $15,000Project Management (6%) 1 ls $4,320 $4,320Contingency (30%) $22,896
Total Year 5 $99,216
Total Cost per Discount PresentPresent Value: Cost Year Factor (7%) Value
Capital Cost $1,861,587 $1,861,587 1.00 $1,861,587O&M Year 1 $290,758 $290,758 0.93 $270,405
O&M Years 2 and 3 $374,816 $187,408 1.70 $318,594O&M Year 4 $73,034 $73,034 0.76 $55,506O&M Year 5 $99,216 $99,216 0.71 $70,443
TOTAL FOR ALTERNATIVE $2,576,535
Number Unit Unit Cost Total CostAdditional GWTP Operation 15 YR $600,000 $9,000,000
Present Value GWTP Operation (7%) $5,464,748Additional MOM Monitoring 15 YR $50,000 $750,000
Present Value MOM Monitoring (7%) $455,396
TOTAL PRESENT VALUE FOR ALTERNATIVE WITH GWTP $8,496,679*assumes GWTP will operate during source remediation and for 10 yrs following remediation to removeresidual groundwater contamination.
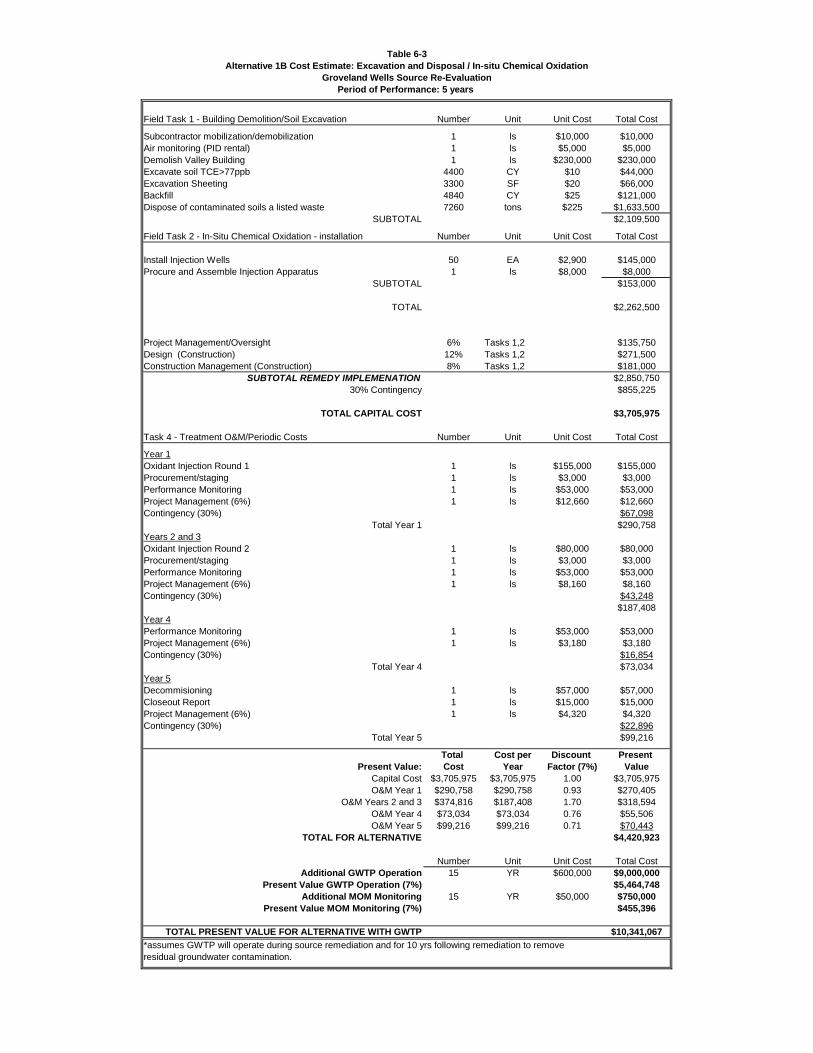
Table 63Alternative 1B Cost Estimate: Excavation and Disposal / Insitu Chemical Oxidation
Groveland Wells Source ReEvaluationPeriod of Performance: 5 years
Field Task 1 Building Demolition/Soil Excavation Number Unit Unit Cost Total Cost
Subcontractor mobilization/demobilization 1 ls $10,000 $10,000Air monitoring (PID rental) 1 ls $5,000 $5,000Demolish Valley Building 1 ls $230,000 $230,000Excavate soil TCE>77ppb 4400 CY $10 $44,000Excavation Sheeting 3300 SF $20 $66,000Backfill 4840 CY $25 $121,000Dispose of contaminated soils a listed waste 7260 tons $225 $1,633,500
SUBTOTAL $2,109,500
Field Task 2 InSitu Chemical Oxidation installation Number Unit Unit Cost Total Cost
Install Injection Wells 50 EA $2,900 $145,000Procure and Assemble Injection Apparatus 1 ls $8,000 $8,000
SUBTOTAL $153,000
TOTAL $2,262,500
Project Management/Oversight 6% Tasks 1,2 $135,750Design (Construction) 12% Tasks 1,2 $271,500Construction Management (Construction) 8% Tasks 1,2 $181,000
SUBTOTAL REMEDY IMPLEMENATION $2,850,75030% Contingency $855,225
TOTAL CAPITAL COST $3,705,975
Task 4 Treatment O&M/Periodic Costs Number Unit Unit Cost Total Cost
Year 1Oxidant Injection Round 1 1 ls $155,000 $155,000Procurement/staging 1 ls $3,000 $3,000Performance Monitoring 1 ls $53,000 $53,000Project Management (6%) 1 ls $12,660 $12,660Contingency (30%) $67,098
Total Year 1 $290,758Years 2 and 3Oxidant Injection Round 2 1 ls $80,000 $80,000Procurement/staging 1 ls $3,000 $3,000Performance Monitoring 1 ls $53,000 $53,000Project Management (6%) 1 ls $8,160 $8,160Contingency (30%) $43,248
$187,408Year 4Performance Monitoring 1 ls $53,000 $53,000Project Management (6%) 1 ls $3,180 $3,180Contingency (30%) $16,854
Total Year 4 $73,034Year 5Decommisioning 1 ls $57,000 $57,000Closeout Report 1 ls $15,000 $15,000Project Management (6%) 1 ls $4,320 $4,320Contingency (30%) $22,896
Total Year 5 $99,216
Total Cost per Discount PresentPresent Value: Cost Year Factor (7%) Value
Capital Cost $3,705,975 $3,705,975 1.00 $3,705,975O&M Year 1 $290,758 $290,758 0.93 $270,405
O&M Years 2 and 3 $374,816 $187,408 1.70 $318,594O&M Year 4 $73,034 $73,034 0.76 $55,506O&M Year 5 $99,216 $99,216 0.71 $70,443
TOTAL FOR ALTERNATIVE $4,420,923
Number Unit Unit Cost Total CostAdditional GWTP Operation 15 YR $600,000 $9,000,000
Present Value GWTP Operation (7%) $5,464,748Additional MOM Monitoring 15 YR $50,000 $750,000
Present Value MOM Monitoring (7%) $455,396
TOTAL PRESENT VALUE FOR ALTERNATIVE WITH GWTP $10,341,067*assumes GWTP will operate during source remediation and for 10 yrs following remediation to removeresidual groundwater contamination.
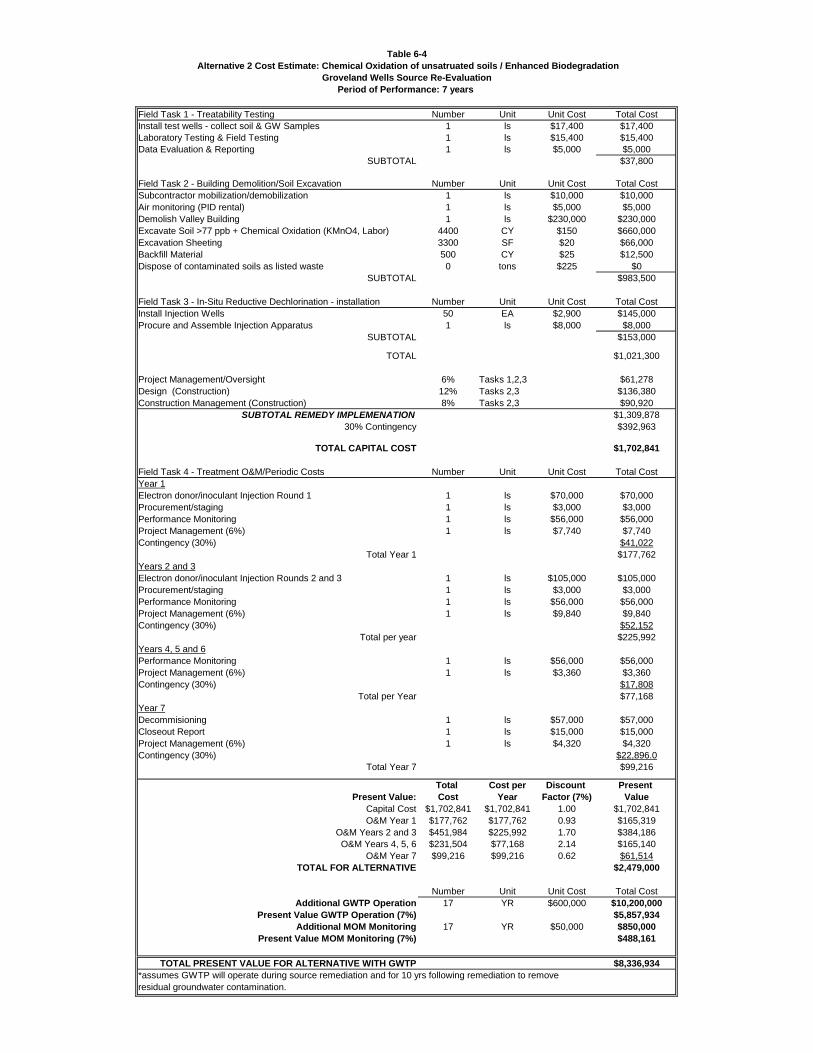
Table 64 Alternative 2 Cost Estimate: Chemical Oxidation of unsatruated soils / Enhanced Biodegradation
Groveland Wells Source ReEvaluationPeriod of Performance: 7 years
Field Task 1 Treatability Testing Number Unit Unit Cost Total CostInstall test wells collect soil & GW Samples 1 ls $17,400 $17,400Laboratory Testing & Field Testing 1 ls $15,400 $15,400Data Evaluation & Reporting 1 ls $5,000 $5,000
SUBTOTAL $37,800
Field Task 2 Building Demolition/Soil Excavation Number Unit Unit Cost Total CostSubcontractor mobilization/demobilization 1 ls $10,000 $10,000Air monitoring (PID rental) 1 ls $5,000 $5,000Demolish Valley Building 1 ls $230,000 $230,000Excavate Soil >77 ppb + Chemical Oxidation (KMnO4, Labor) 4400 CY $150 $660,000Excavation Sheeting 3300 SF $20 $66,000Backfill Material 500 CY $25 $12,500Dispose of contaminated soils as listed waste 0 tons $225 $0
SUBTOTAL $983,500
Field Task 3 InSitu Reductive Dechlorination installation Number Unit Unit Cost Total CostInstall Injection Wells 50 EA $2,900 $145,000Procure and Assemble Injection Apparatus 1 ls $8,000 $8,000
SUBTOTAL $153,000
TOTAL $1,021,300
Project Management/Oversight 6% Tasks 1,2,3 $61,278Design (Construction) 12% Tasks 2,3 $136,380Construction Management (Construction) 8% Tasks 2,3 $90,920
SUBTOTAL REMEDY IMPLEMENATION $1,309,87830% Contingency $392,963
TOTAL CAPITAL COST $1,702,841
Field Task 4 Treatment O&M/Periodic Costs Number Unit Unit Cost Total CostYear 1Electron donor/inoculant Injection Round 1 1 ls $70,000 $70,000Procurement/staging 1 ls $3,000 $3,000Performance Monitoring 1 ls $56,000 $56,000Project Management (6%) 1 ls $7,740 $7,740Contingency (30%) $41,022
Total Year 1 $177,762Years 2 and 3Electron donor/inoculant Injection Rounds 2 and 3 1 ls $105,000 $105,000Procurement/staging 1 ls $3,000 $3,000Performance Monitoring 1 ls $56,000 $56,000Project Management (6%) 1 ls $9,840 $9,840Contingency (30%) $52,152
Total per year $225,992Years 4, 5 and 6Performance Monitoring 1 ls $56,000 $56,000Project Management (6%) 1 ls $3,360 $3,360Contingency (30%) $17,808
Total per Year $77,168Year 7Decommisioning 1 ls $57,000 $57,000Closeout Report 1 ls $15,000 $15,000Project Management (6%) 1 ls $4,320 $4,320Contingency (30%) $22,896.0
Total Year 7 $99,216
Total Cost per Discount PresentPresent Value: Cost Year Factor (7%) Value
Capital Cost $1,702,841 $1,702,841 1.00 $1,702,841O&M Year 1 $177,762 $177,762 0.93 $165,319
O&M Years 2 and 3 $451,984 $225,992 1.70 $384,186O&M Years 4, 5, 6 $231,504 $77,168 2.14 $165,140
O&M Year 7 $99,216 $99,216 0.62 $61,514TOTAL FOR ALTERNATIVE $2,479,000
Number Unit Unit Cost Total CostAdditional GWTP Operation 17 YR $600,000 $10,200,000
Present Value GWTP Operation (7%) $5,857,934Additional MOM Monitoring 17 YR $50,000 $850,000
Present Value MOM Monitoring (7%) $488,161
TOTAL PRESENT VALUE FOR ALTERNATIVE WITH GWTP $8,336,934*assumes GWTP will operate during source remediation and for 10 yrs following remediation to removeresidual groundwater contamination.

Table 65Alternative 3 Cost Estimate: Insitu Gaseous Chemical Oxidation/
Insitu Chemical OxidationGroveland Wells Source ReEvaluation
Period of Performance:5 years
Field Task 1 Treatability Testing (Ozone) Number Unit Unit Cost Total CostInstall test wells collect soil & GW Samples 1 ls $17,000 $17,000Laboratory Testing & Field Testing 1 ls $19,000 $19,000Data Evaluation & Reporting 1 ls $10,000 $10,000Field Oversight/Review 1 ls $4,000 $4,000
SUBTOTAL $50,000
Field Task 2 Demolition Number Unit Unit Cost Total CostSubcontractor mobilization/demobilization 0 ls $10,000 $0Air monitoring 0 ls $5,000 $0Demolish Building 0 ls $230,000 $0
SUBTOTAL $0
Field Task 3 Vadose Zone Ozone Injection System Number Unit Unit Cost Total CostInstall Injection Points (25 points) 25 ea $2,000 $50,000Procure and Assemble Ozone Generator/Injection Apparatus 1 ls $122,000 $122,000
SUBTOTAL $172,000
Field Task 4 InSitu Chemical Oxidation GroundwaterInstall Injection Wells 50 EA $2,900 $145,000Procure and Assemble Injection Apparatus 1 ls $8,000 $8,000
SUBTOTAL $153,000
TOTAL $375,000
Project Management/Oversight 6% Tasks 1,2,3,4 $22,500Design (Construction) 12% Tasks 2,3,4 $39,000Construction Management (Construction) 8% Tasks 2,3,4 $26,000
SUBTOTAL REMEDY IMPLEMENATION $462,50030% Contingency $138,750
TOTAL CAPITAL COST $601,250
Field Task 5 Treatment O&M/Periodic Costs Number Unit Unit Cost Total CostYear 1Oxidant Injection Round 1 1 ls $155,000 $155,000Procurement/staging 1 ls $3,000 $3,000Ozone generation & assoc maintenance 1 ls $12,000 $12,000Performance Monitoring 1 ls $68,000 $68,000Project Management (6%) 1 ls $14,280 $14,280Contingency (30%) $75,684.0
Total Year 1 $327,964Years 2 and 3Oxidant Injection Round 2 1 ls $80,000 $80,000Procurement/staging 1 ls $3,000 $3,000Ozone generation & assoc maintenance 1 ls $6,000 $6,000Performance Monitoring 1 ls $60,000 $60,000Project Management (6%) 1 ls $8,940 $8,940Contingency (30%) $47,382
Total per Year $205,322Year 4Performance Monitoring 1 ls $53,000 $53,000Project Management (6%) 1 ls $3,180 $3,180Contingency (30%) $16,854.0
Total Year 4 $73,034Year 5Decommisioning 1 ls $57,000 $57,000Closeout Report 1 ls $15,000 $15,000Project Management (6%) 1 ls $4,320 $4,320Contingency (30%) $22,896.0
Total Year 5 $94,896
Total Cost per Discount PresentPresent Value: Cost Year Factor (7%) Value
Capital Cost $601,250 $601,250 1.00 $601,250O&M Year 1 $327,964 $327,964 0.93 $305,007
O&M Years 2 and 3 $410,644 $205,322 1.70 $349,047O&M Year 4 $73,034 $73,034 0.76 $55,506O&M Year 5 $94,896 $94,896 0.71 $67,376
TOTAL FOR ALTERNATIVE $1,378,186
Number Unit Unit Cost Total CostAdditional GWTP Operation 15 YR $600,000 $9,000,000
Present Value GWTP Operation (7%) $5,464,748Additional MOM Monitoring 15 YR $50,000 $750,000
Present Value MOM Monitoring (7%) $455,396
TOTAL PRESENT VALUE FOR ALTERNATIVE WITH GWTP $6,842,934*assumes GWTP will operate during source remediation and for 10 yrs following remediation to removeresidual groundwater contamination.
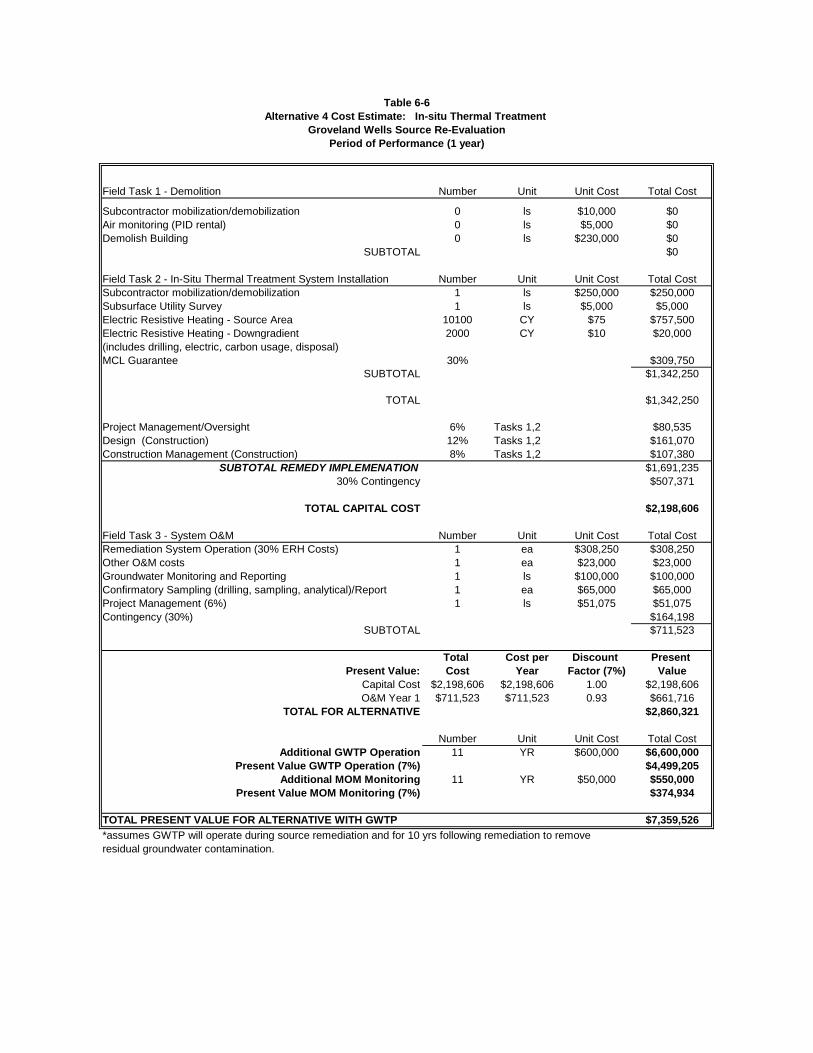
Table 66Alternative 4 Cost Estimate: Insitu Thermal Treatment
Groveland Wells Source ReEvaluationPeriod of Performance (1 year)
Field Task 1 Demolition Number Unit Unit Cost Total Cost
Subcontractor mobilization/demobilization 0 ls $10,000 $0Air monitoring (PID rental) 0 ls $5,000 $0Demolish Building 0 ls $230,000 $0
SUBTOTAL $0
Field Task 2 InSitu Thermal Treatment System Installation Number Unit Unit Cost Total CostSubcontractor mobilization/demobilization 1 ls $250,000 $250,000Subsurface Utility Survey 1 ls $5,000 $5,000Electric Resistive Heating Source Area 10100 CY $75 $757,500Electric Resistive Heating Downgradient 2000 CY $10 $20,000(includes drilling, electric, carbon usage, disposal)MCL Guarantee 30% $309,750
SUBTOTAL $1,342,250
TOTAL $1,342,250
Project Management/Oversight 6% Tasks 1,2 $80,535Design (Construction) 12% Tasks 1,2 $161,070Construction Management (Construction) 8% Tasks 1,2 $107,380
SUBTOTAL REMEDY IMPLEMENATION $1,691,23530% Contingency $507,371
TOTAL CAPITAL COST $2,198,606
Field Task 3 System O&M Number Unit Unit Cost Total CostRemediation System Operation (30% ERH Costs) 1 ea $308,250 $308,250Other O&M costs 1 ea $23,000 $23,000Groundwater Monitoring and Reporting 1 ls $100,000 $100,000Confirmatory Sampling (drilling, sampling, analytical)/Report 1 ea $65,000 $65,000Project Management (6%) 1 ls $51,075 $51,075Contingency (30%) $164,198
SUBTOTAL $711,523
Total Cost per Discount PresentPresent Value: Cost Year Factor (7%) Value
Capital Cost $2,198,606 $2,198,606 1.00 $2,198,606O&M Year 1 $711,523 $711,523 0.93 $661,716
TOTAL FOR ALTERNATIVE $2,860,321
Number Unit Unit Cost Total CostAdditional GWTP Operation 11 YR $600,000 $6,600,000
Present Value GWTP Operation (7%) $4,499,205Additional MOM Monitoring 11 YR $50,000 $550,000
Present Value MOM Monitoring (7%) $374,934
TOTAL PRESENT VALUE FOR ALTERNATIVE WITH GWTP $7,359,526*assumes GWTP will operate during source remediation and for 10 yrs following remediation to removeresidual groundwater contamination.
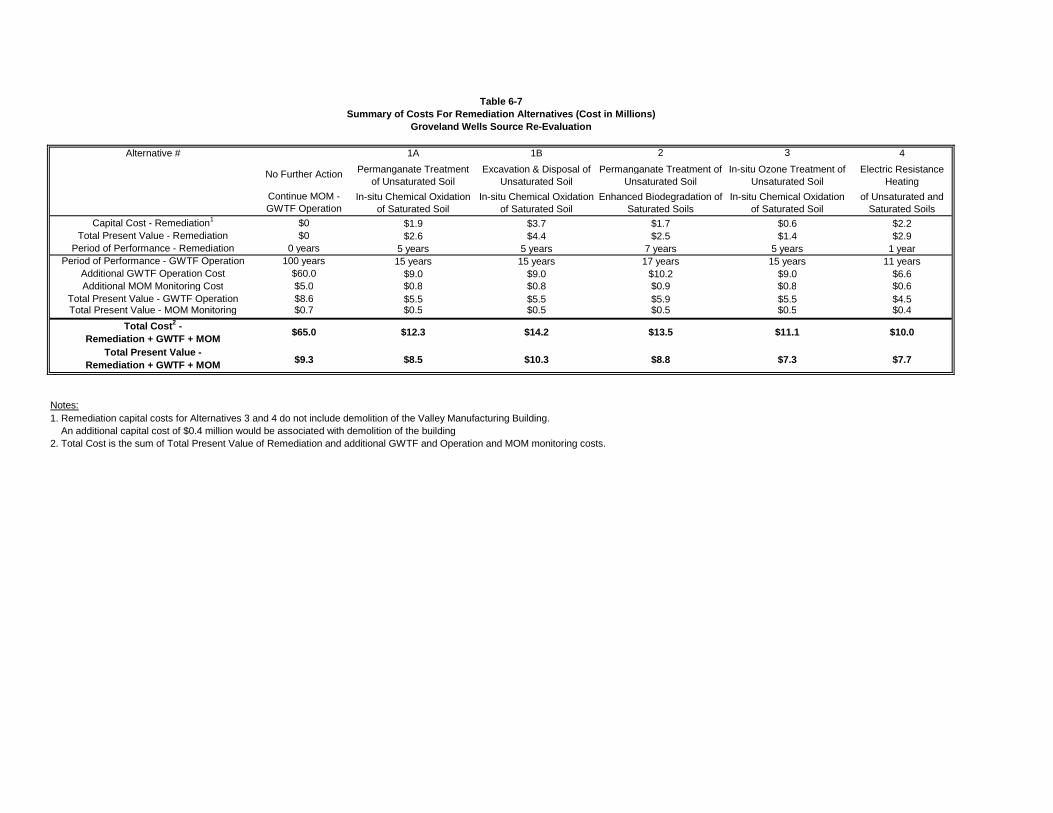
Table 67Summary of Costs For Remediation Alternatives (Cost in Millions)
Groveland Wells Source ReEvaluation
Alternative # 1A 1B 2 3 4
No Further Action Permanganate Treatmentof Unsaturated Soil
Excavation & Disposal ofUnsaturated Soil
Permanganate Treatment ofUnsaturated Soil
Insitu Ozone Treatment ofUnsaturated Soil
Electric ResistanceHeating
Continue MOM GWTF Operation
Insitu Chemical Oxidationof Saturated Soil
Insitu Chemical Oxidationof Saturated Soil
Enhanced Biodegradation ofSaturated Soils
Insitu Chemical Oxidationof Saturated Soil
of Unsaturated andSaturated Soils
Capital Cost Remediation1 $0 $1.9 $3.7 $1.7 $0.6 $2.2Total Present Value Remediation $0 $2.6 $4.4 $2.5 $1.4 $2.9
Period of Performance Remediation 0 years 5 years 5 years 7 years 5 years 1 yearPeriod of Performance GWTF Operation 100 years 15 years 15 years 17 years 15 years 11 years
Additional GWTF Operation Cost $60.0 $9.0 $9.0 $10.2 $9.0 $6.6Additional MOM Monitoring Cost $5.0 $0.8 $0.8 $0.9 $0.8 $0.6
Total Present Value GWTF Operation $8.6 $5.5 $5.5 $5.9 $5.5 $4.5Total Present Value MOM Monitoring $0.7 $0.5 $0.5 $0.5 $0.5 $0.4
Total Cost2 Remediation + GWTF + MOM $65.0 $12.3 $14.2 $13.5 $11.1 $10.0
Total Present Value Remediation + GWTF + MOM $9.3 $8.5 $10.3 $8.8 $7.3 $7.7
Notes:1. Remediation capital costs for Alternatives 3 and 4 do not include demolition of the Valley Manufacturing Building. An additional capital cost of $0.4 million would be associated with demolition of the building2. Total Cost is the sum of Total Present Value of Remediation and additional GWTF and Operation and MOM monitoring costs.
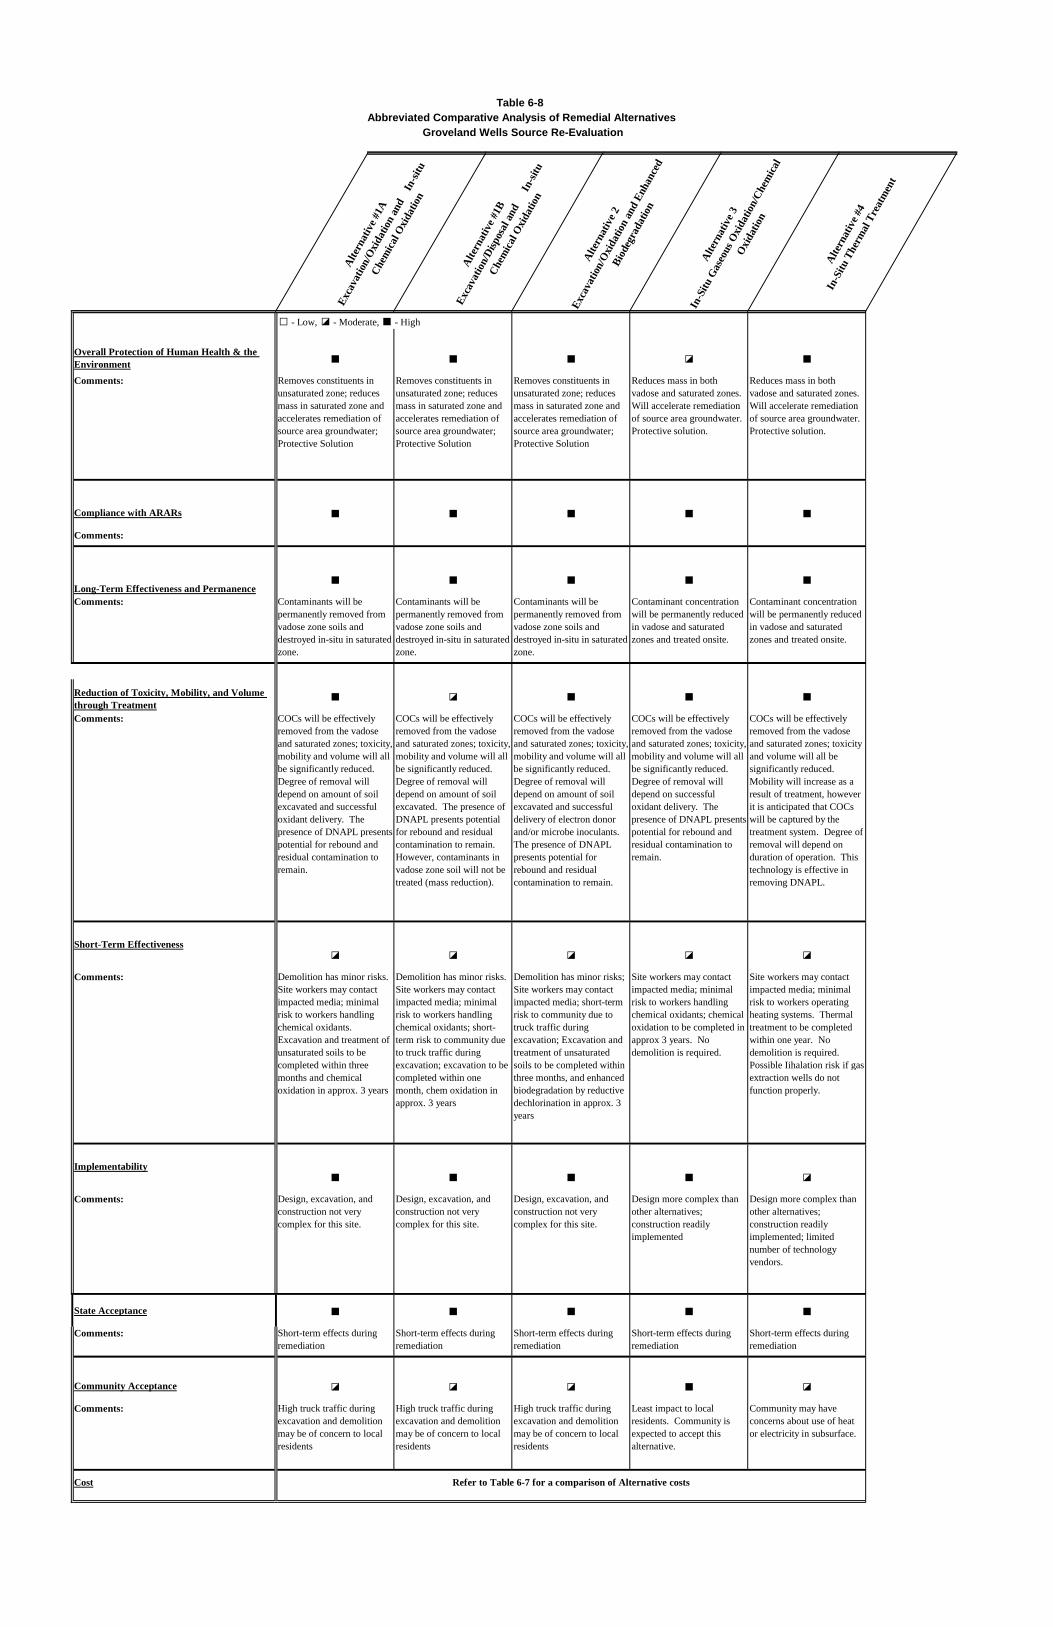
Table 68Abbreviated Comparative Analysis of Remedial Alternatives
Groveland Wells Source ReEvaluation
Alte
rnat
ive #
1A
Exca
vatio
n/O
xida
tion
and
In
situ
Chem
ical O
xida
tion
Alte
rnat
ive #
1B
Exca
vatio
n/Di
spos
al an
d
Insi
tu
Chem
ical O
xida
tion
Alte
rnat
ive 2
Exca
vatio
n/O
xida
tion
and
Enha
nced
Biod
egra
datio
n
Alte
rnat
ive 3
InS
itu G
aseo
us O
xida
tion/
Chem
ical
Oxi
datio
n
Alte
rnat
ive #
4
InS
itu T
herm
al T
reat
men
t
Low, Moderate, High
Overall Protection of Human Health & theEnvironmentComments: Removes constituents in
unsaturated zone; reducesmass in saturated zone andaccelerates remediation ofsource area groundwater;Protective Solution
Removes constituents inunsaturated zone; reducesmass in saturated zone andaccelerates remediation ofsource area groundwater;Protective Solution
Removes constituents inunsaturated zone; reducesmass in saturated zone andaccelerates remediation ofsource area groundwater;Protective Solution
Reduces mass in bothvadose and saturated zones.Will accelerate remediationof source area groundwater.Protective solution.
Reduces mass in bothvadose and saturated zones.Will accelerate remediationof source area groundwater.Protective solution.
Compliance with ARARs
Comments:
LongTerm Effectiveness and PermanenceComments: Contaminants will be
permanently removed fromvadose zone soils anddestroyed insitu in saturatedzone.
Contaminants will bepermanently removed fromvadose zone soils anddestroyed insitu in saturatedzone.
Contaminants will bepermanently removed fromvadose zone soils anddestroyed insitu in saturatedzone.
Contaminant concentrationwill be permanently reducedin vadose and saturatedzones and treated onsite.
Contaminant concentrationwill be permanently reducedin vadose and saturatedzones and treated onsite.
Reduction of Toxicity, Mobility, and Volumethrough TreatmentComments: COCs will be effectively
removed from the vadoseand saturated zones; toxicity,mobility and volume will allbe significantly reduced.Degree of removal willdepend on amount of soilexcavated and successfuloxidant delivery. Thepresence of DNAPL presentspotential for rebound andresidual contamination toremain.
COCs will be effectivelyremoved from the vadoseand saturated zones; toxicity,mobility and volume will allbe significantly reduced.Degree of removal willdepend on amount of soilexcavated. The presence ofDNAPL presents potentialfor rebound and residualcontamination to remain.However, contaminants invadose zone soil will not betreated (mass reduction).
COCs will be effectivelyremoved from the vadoseand saturated zones; toxicity,mobility and volume will allbe significantly reduced.Degree of removal willdepend on amount of soilexcavated and successfuldelivery of electron donorand/or microbe inoculants.The presence of DNAPLpresents potential forrebound and residualcontamination to remain.
COCs will be effectivelyremoved from the vadoseand saturated zones; toxicity,mobility and volume will allbe significantly reduced.Degree of removal willdepend on successfuloxidant delivery. Thepresence of DNAPL presentspotential for rebound andresidual contamination toremain.
COCs will be effectivelyremoved from the vadoseand saturated zones; toxicityand volume will all besignificantly reduced.Mobility will increase as aresult of treatment, howeverit is anticipated that COCswill be captured by thetreatment system. Degree ofremoval will depend onduration of operation. Thistechnology is effective inremoving DNAPL.
ShortTerm Effectiveness
Comments: Demolition has minor risks.Site workers may contactimpacted media; minimalrisk to workers handlingchemical oxidants.Excavation and treatment ofunsaturated soils to becompleted within threemonths and chemicaloxidation in approx. 3 years
Demolition has minor risks.Site workers may contactimpacted media; minimalrisk to workers handlingchemical oxidants; shortterm risk to community dueto truck traffic duringexcavation; excavation to becompleted within onemonth, chem oxidation inapprox. 3 years
Demolition has minor risks;Site workers may contactimpacted media; shorttermrisk to community due totruck traffic duringexcavation; Excavation andtreatment of unsaturatedsoils to be completed withinthree months, and enhancedbiodegradation by reductivedechlorination in approx. 3years
Site workers may contactimpacted media; minimalrisk to workers handlingchemical oxidants; chemicaloxidation to be completed inapprox 3 years. Nodemolition is required.
Site workers may contactimpacted media; minimalrisk to workers operatingheating systems. Thermaltreatment to be completedwithin one year. Nodemolition is required.Possible Iihalation risk if gasextraction wells do notfunction properly.
Implementability
Comments: Design, excavation, andconstruction not verycomplex for this site.
Design, excavation, andconstruction not verycomplex for this site.
Design, excavation, andconstruction not verycomplex for this site.
Design more complex thanother alternatives;construction readilyimplemented
Design more complex thanother alternatives;construction readilyimplemented; limitednumber of technologyvendors.
State Acceptance
Comments: Shortterm effects duringremediation
Shortterm effects duringremediation
Shortterm effects duringremediation
Shortterm effects duringremediation
Shortterm effects duringremediation
Community Acceptance
Comments: High truck traffic duringexcavation and demolitionmay be of concern to localresidents
High truck traffic duringexcavation and demolitionmay be of concern to localresidents
High truck traffic duringexcavation and demolitionmay be of concern to localresidents
Least impact to localresidents. Community isexpected to accept thisalternative.
Community may haveconcerns about use of heator electricity in subsurface.
Cost Refer to Table 67 for a comparison of Alternative costs