dr. manpreet k. dhami (orcid id : 0000-0002-8956-0674)...
TRANSCRIPT
Acc
epte
d A
rtic
le
This article has been accepted for publication and undergone full peer review but has not been through the copyediting, typesetting, pagination and proofreading process, which may lead to differences between this version and the Version of Record. Please cite this article as doi: 10.1111/mec.14535
This article is protected by copyright. All rights reserved.
DR. MANPREET K. DHAMI (Orcid ID : 0000-0002-8956-0674)
Article type : Special Issue
Genomic diversity of a nectar yeast clusters into metabolically, but not geographically, distinct
lineages
Authors: Manpreet K Dhami1,2*, Thomas Hartwig3,4, Andrew D Letten1,5, Michael Banf4, and
Tadashi Fukami1*
Postal address
1Department of Biology, Stanford University, Stanford, USA
2Landcare Research, Lincoln, New Zealand
3Max Planck Institute for Plant Breeding Research, Köln, Germany
4Department of Plant Biology, Carnegie Institution for Science, Stanford, USA
5Department of Biology, University of Canterbury, Christchurch, New Zealand
keywords: spatial structure, niche modification, mass effects, population genomics
Corresponding authors:
Manpreet K Dhami
Landcare Research, PO Box 69040, Lincoln 7608, New Zealand
Acc
epte
d A
rtic
le
This article is protected by copyright. All rights reserved.
Tadashi Fukami
Department of Biology, Stanford University, 371 Serra Mall, Stanford, CA, 94305, USA
Running title: Metabolic clusters define genetic diversity
ABSTRACT
Both dispersal limitation and environmental sorting can affect genetic variation in populations, but
their contribution remains unclear, particularly in microbes. We sought to determine the contribution
of geographic distance (as a proxy for dispersal limitation) and phenotypic traits (as a proxy for
environmental sorting), including morphology, metabolic ability, and interspecific competitiveness, to
the genotypic diversity in a nectar yeast species, Metschnikowia reukaufii. To measure genotypic
diversity, we sequenced the genomes of 102 strains of M. reukaufii isolated from the floral nectar of
hummingbird-pollinated shrub, Mimulus aurantiacus, along a 200-km coastline in California.
Intraspecific genetic variation showed no detectable relationship with geographic distance, but could
be grouped into three distinct lineages that correlated with metabolic ability and interspecific
competitiveness. Despite ample evidence for strong competitive interactions within and among nectar
yeasts, a full spectrum of the genotypic and phenotypic diversity observed across the 200-km
coastline was represented even at a scale as small as 200 m. Furthermore, more competitive strains
were not necessarily more abundant. These results suggest that dispersal limitation and environmental
sorting might not fully explain intraspecific diversity in this microbe and highlight the need to also
consider other ecological factors such as trade-offs, source-sink dynamics, and niche modification.
Acc
epte
d A
rtic
le
This article is protected by copyright. All rights reserved.
INTRODUCTION
Environmental heterogeneity and dispersal limitation are often invoked to explain the distributions of
organisms across space, but their relative importance has been a contentious issue, particularly in
microbial species. Historically, microbes were thought to occur wherever environmental conditions
are suitable because their small size and high propagule pressure enable microbes to disperse virtually
anywhere (Bass Becking 1934; Finlay 2002). More recently, a growing body of evidence contradicts
the idea that microbes can disperse unhindered (Martiny et al. 2006; Whitaker et al. 2003), and
dispersal limitation is now considered a potential major determinant of microbial distribution (Kivlin
et al. 2014). Nevertheless, the importance of dispersal limitation relative to environmental
heterogeneity remains unclear (Cadotte & Tucker 2017; Talbot et al. 2014; Zhang et al. 2017),
particularly for intraspecific genetic variation (Andrew et al. 2010; Lowe et al. 2012).
The traditional concept emphasizing the role of environmental heterogeneity is deceptively simple:
the genotype with the set of phenotypic traits most suitable to a specific local environmental condition
is expected to be most abundant under that condition, causing local sites that vary in environmental
conditions to harbor different genotypes having different phenotypic traits. The mechanism for this
correspondence between environment and phenotype, which we will refer to as environmental sorting,
can be ecological or evolutionary, resulting from differential population growth or local adaptation,
respectively, or both can operate at the same time. Although intuitive, this concept is difficult to
demonstrate empirically because resource competition and other biotic interactions can modify the
environment-phenotype correspondence (Kraft et al. 2015). Moreover, dispersal and environment can
have interactive, not just additive, effects on populations. In nectar-inhabiting yeasts, for example,
local coexistence of populations has been attributed to resource use, in combination with plant host-
mediated phenotypic differences among strains (Pozo et al. 2016). However, resource competition can
be strong among these yeasts, and the outcome of competition can depend on the order in which
Acc
epte
d A
rtic
le
This article is protected by copyright. All rights reserved.
different strains disperse to flowers (Peay et al. 2012), potentially obscuring the matching of
phenotype and environment.
Despite this complexity, several characteristics of nectar-colonizing microbes make them a good
study system with which to assess the influence of environmental sorting and dispersal limitation on
intraspecific variation. Initially sterile, floral nectar is colonized by a variety of bacterial and fungal
(mainly yeast) species (Alvarez-Perez et al. 2012; Brysch-Herzberg 2004). Many of these species are
found almost exclusively in nectar or on the animals that visit flowers to forage for nectar such as
bees and hummingbirds (Belisle et al. 2014; Brysch-Herzberg 2004). Nectar microbes rely on these
animals for dispersal among flowers (Belisle et al. 2014; de Vega et al. 2009; Wehner et al. 2017). As
such, flowers represent discrete and ephemeral habitats (Toju et al. In Press) where environmental
sorting and dispersal limitation and can be studied relatively easily (Belisle et al. 2012). Different
yeast genotypes tend to be found in different host plant species, providing strong evidence for
environmental sorting (Herrera et al. 2011, 2014). Analysis of genetic diversity in a single host
species complements these previous studies because it should allow dispersal limitation to be detected
more easily, if it exists (Belisle et al. 2012).
Here we focus on the naturally occurring genotypic diversity of the nectar yeast Metschnikowia
reukaufii in a single host plant, Mimulus aurantiacus, to achieve two goals: (1) to determine whether
genetic diversity is spatially structured, which might suggest dispersal limitation, and (2) to search for
phenotypic and metabolic clustering of the genotypes, which might suggest environmental sorting. To
this end, we quantified genotypic diversity by whole-genome sequencing of field-collected strains and
characterized cellular, metabolic, and competitive phenotypes in these strains.
Acc
epte
d A
rtic
le
This article is protected by copyright. All rights reserved.
MATERIALS AND METHODS
Nectar microbial diversity and strain collection
We collected nectar from 12 Mimulus aurantiacus plants per site and 8 flowers per plant from 12 sites
across an approximately 200-km coastline around San Francisco, California (Fig 1c, Table S1, n =
1,152 flowers). We chose M. aurantiacus as the study species because this common native shrub
pollinated primarily by hummingbirds (Calypte anna) produces a copious amount of nectar (up to 10
µL per flower) and because the knowledge gained through our previous field research with M.
aurantiacus facilitated the design of this study (Belisle et al. 2012; Toju et al. In Press; Tsuji et al.
2016; Vannette & Fukami 2017).
To sample nectar from flowers, the corolla tube was separated from the calyx, and nectar was
extracted from each flower using a 10-µL microcapillary tube. The volume of each sample was
quantified, and nectar sample diluted in 30 µL of sterile water, which was kept on ice while in the
field. Bacteria often co-occur in the nectar environment with the yeasts, and can alter nectar
properties. We therefore estimated bacterial abundance in parallel with yeasts in each nectar sample.
All samples were processed the same day in the lab, by spread-plating 1 in 10 dilution onto YM media
supplemented with 100 mg L-1 chloramphenicol (antibacterial) for yeast colonies and 1 in 100 dilution
onto R2A agar supplemented with 20% sucrose and 100 mg L-1 cycloheximide (antifungal) for
bacterial colonies, as specified in Vannette & Fukami (2017). All colonies were enumerated and yeast
strains were phenotypically described, and their pure cultures obtained via streaking. Further
identification of isolated strains was performed using PCR amplification of the D1/D2 domain of the
LSU rRNA gene from single yeast colonies using the NL1-NL4 primer pair (O'Donnell & Gray
1994), since this region provides species level distinction for Metschnikowia yeasts (Kurtzman &
Robnett 1998). A collection of phenotyped and identified yeasts was prepared and stored at -80 °C in
15% glycerol + YM stocks.
Acc
epte
d A
rtic
le
This article is protected by copyright. All rights reserved.
Metschnikowia reukaufii was the most commonly isolated yeast species in M. aurantiacus nectar
(93/223 strains), followed by Candida rancensis (59/223 strains) and Hanseniaspora valbyensis
(21/233) (Table S2). M. reukaufii dominated over half the sites (7/12), while no other species
dominated more than a single site (Table S2). Site OH did not yield any Metschnikowia strains and
was therefore omitted from further analysis. Bacterial densities varied from 0 to 105 colony forming
units/µL, allowing for the classification of low abundance and high abundance flowers. Nectar volume
ranged from 0.1 to 6 µL, allowing classification of low and high nectar flowers.
We subsequently regenerated M. reukaufii (n =81) and Metschnikowia sp. (n=7) strains (outgroup)
from -80 °C stocks, for whole-genome sequencing (Table S3). We included an additional 21 strains of
M. reukaufii from a previous collection made in 2014 at Jasper Ridge Biological Preserve (JR). A
total of 102 M. reukaufii and seven strains of closely related species (M. gruessii, M. koreensis, M.
viticola and Candida rancensis) were whole-genome sequenced, and the pooled data were used for
further analysis.
Genotyping by whole-genome sequencing
Genomic library preparation and sequencing. Overnight cultures (at 25°C) from single colonies
grown in yeast media (YM) were obtained and 106 cells were harvested by centrifugation, followed by
two washes with sterile distilled water. Genomic DNA was extracted using the DNeasy Blood and
Tissue 96 sample kit (Qiagen). Bacterial contamination of gDNA was tested via PCR amplification of
the 16S rRNA gene using universal primers (Weisburg et al. 1991), but no amplicons were returned.
gDNA was quantified using Qubit HS kit (ThermoFisher Scientific) and diluted to 2.5ng/µL and
genomic library was prepared as described previously (Baym et al. 2015). Each genomic library was
dual-labelled using the Nextera index kit (Illumina, San Diego, CA) and pooled for sequencing. The
library was run on an Illumina HiSeq 3000 sequencer with 150x2 paired end mode. gDNA from
additional 21 strains of M. reukaufii from JR (37°40'54.35"N, 122°24'37.08"W) was extracted and
Acc
epte
d A
rtic
le
This article is protected by copyright. All rights reserved.
prepared for sequencing similarly and run on Illumina HiSeq 2500 sequencer with 100x2 paired end
mode.
Genome assembly, variant calling and analysis. We identified single nucleotide polymorphisms
(SNPs), and inserts and deletions (InDels) by using a reference-based alignment and variant calling
approach. We followed the Genome Analysis Toolkit (GATK) (McKenna et al. 2010)
recommendations of DNAseq best practices for calling variants. Clean reads (q20 trimmed) were
mapped to the previously published M. reukaufii diploid reference genome A10 (Dhami et al. 2016)
using the Burrows Wheeler Aligner (BWA, v0.7.5) using BWA-mem (Li 2013). The workflow
included the following steps: (1) alignment to MR1 diploid reference genome, version A10 (length =
19 Mbps, N50 = 1,244,334 bp, 122 scaffolds), (2) realignment around InDels, and (3) variant
discovery. Polymorphisms were initially identified with relaxed settings individually using the g.vcf
haplotype caller function in joint genotyping mode, after being marked for duplicates. SNP and InDel
discovery and genotyping was performed across all 109 strains simultaneously. Hard filtering of
initial SNPs was performed using the GATK variant filtration tool (v3.4) and VCFtools (v1.5) as per
best practices (Danecek et al. 2011), using the following parameters: base quality = 20, quality by
depth = 2.0, mapping quality = 30, Fisher strand bias = 60, mapping quality rank sum =-12.5, and
ReadPosRankSum = -8.0. Post InDel removal, the SNP set consisting 1.27 million SNPs across 109
strains was further filtered to exclude: non-bi-allelic SNPs, a minor allele frequency below 0.05 and
polymorphisms with more than 50% missing data. To resolve SNPs in linkage, a window size of 50
SNPs advanced by 5 SNPS at a time and an r2 threshold of 0.5 was used. The final set of high
confidence SNPs consisted of 88, 192 polymorphisms (for mapping quality statistics see Fig S1).
Sequence data has been archived under GenBank (PRJNA431678) and final SNPset and scripts have
been archived in Dryad repository (doi: 10.5061/dryad.hg375).
Population structure and diversity analysis. The model-based Bayesian algorithm fastSTRUCTURE
(v1.0) was used to identify and quantify the number of genetically distinct populations and degree of
admixture in the 109 sequenced genomes (Raj et al. 2014). fastSTRUCTURE was run on the filtered
set of 88, 192 SNPs, with varying the number of ancestral populations (K) between 1 and 10 using the
Acc
epte
d A
rtic
le
This article is protected by copyright. All rights reserved.
simple prior implemented in fastSTRUCTURE. The number of iterations varied from 10 at K=1 up to
80 at K=10. Optimal K=4 was identified by scoring the highest marginal likelihood (K4=-0.596).
Analysis of ancestry matrices and plotting were performed in R (v3.3.4) (R Development Core Team
2008).
Phylogenetic clustering analysis. Sets of genes that have descended from a single ancestral gene are
likely to be identical, forming the basis of relatedness measure: identical-by-descent (IBD) (Weir and
Cockerham, 1984, Weir and Hill, 2002). Therefore, at any given locus for a pair of individuals with
known genotype, identity-by-state (IBS) can have three possible outcomes: one shared allele, two
shared alleles, or no shared alleles. When pedigree of individuals and therefore a priori information on
ancestry is not known, IBS distance can be used to generate probabilities of shared alleles and
therefore an IBD estimate of relatedness (Zheng & Weir 2016). Using this framework, we built a
pairwise IBD relatedness matrix for all 109 strains using both PLINK Method of Moments (MoM)
(Purcell et al. 2007) and the maximum likelihood approach as implemented in SNPRelate package
(Zheng et al. 2012). The kinship between strains was estimated via IBS allele-sharing proportions,
and a hidden Markov model approach was used to detect extended chromosomal sharing to estimate
underlying hidden IBD state given the observed IBS sharing and genome-wide level of relatedness
between each pair. Cluster analysis was performed on the genome-wide IBS pairwise distances and
groups were determined by a permutation score (z threshold = 15, outlier threshold = 5). Genetic
covariance matrix was calculated from the genotypes to perform principle components analysis
(PCA), and PCA1 and PCA2 represented the respective eigenvectors, as implemented in SNPRelate
package (Zheng et al. 2012). Only linkage filtered informative sites as contained in the pruned SNP
set of 88, 192 sites were used for each analysis. Population-wide nucleotide diversity metrics such as
Fst, Tajima’s D and π were calculated in R package adegenet (Jombart 2008).
Acc
epte
d A
rtic
le
This article is protected by copyright. All rights reserved.
Phenotypic characterization of M. reukaufii strains
We measured four traits to describe the phenotype of M. reukaufii strains, as we detail below. We
refer to them as colony morphology, maximum growth rate, µmax (when nutrients are not limited, i.e.,
in liquid YM media), nectar growth rate, µnectar (when nutrients are limiting but resembling natural
environment), and µN-limited, (when nectar is increasingly N-limited, likely due to competition).
Colony morphology. Strains were incubated at 25 °C for 4 days on YM agar and colony phenotype
noted. M. reukaufii strains developed either circular, matt opaque colonies, hereafter called smooth, or
increasingly undulate and shiny colonies, hereafter called bumpy (Fig S2). Production of large thick-
walled oblong cells, called chlamydospores was consistently correlated with bumpy-ness of colonies
(Kurtzman et al. 2011). Chlamydospores are common among Metschnikowia species and are
postulated to store lipids, but this function remains to be tested (Kurtzman et al. 2011). We
enumerated vegetative and chlamydospore cells for each strain using a hemocytometer, and the
chlamydospore-to-vegetative cell ratio (C/V) was used as a measure of morphological variance across
strains.
Physiology and nitrogen stress tolerance. M. reukaufii thrives in a nutrient-limited nectar
environment, where resource competition from other nectar microbes such as yeasts and bacteria
appears to further exacerbate resource limitation (Peay et al. 2012; Tucker & Fukami 2014). We
compared the growth of M. reukaufii strains in an optimum environment (µmax), in a simulated nectar
environment (µnectar, in synthetic nectar, i.e., a mixture of 4mM amino acids and vitamins (Difco) in
20% sucrose, as specified in Vannette & Fukami 2014), and in an N-limited nectar environment (µN-
limited, in synthetic nectar but with 4mM proline as the only N source). Each treatment was inoculated
with approximately 103 yeast cells and incubated at 25°C with shaking for 5 s followed by OD600
measurements every 5 min using a Tecan M1000 Pro (ThermoFisher Scientific, Swedesboro, NJ,
USA).
Acc
epte
d A
rtic
le
This article is protected by copyright. All rights reserved.
Metabolic characterization. Sixteen strains of M. reukaufii (Table S3) were selected from a single site
(JR) to measure metabolic capabilities using the Biolog™ YT system. Briefly, cells from a 2-day-old
colony were harvested, washed twice in sterile PB buffer to remove traces of growth media, and re-
suspended in sterile distilled water. Approximately 104 cells were applied to each of the 96 wells of a
YT microplate, with 2 plate replicates per strain. Four blank YT plates were included as controls. The
plates were incubated at 25°C for 80 hours and spectrophotometer readings were taken every 30 min.
The spectrophotometer data were transformed and analysed by R package opm (v1.1.0) (Vaas et al.
2013).
Testing hypotheses on phenotypic trait evolution. To search for a signal of environmental sorting via
adaptation to the local environmental conditions of floral nectar, we used the modelling approach
developed by Butler & King (2004). For three traits (µmax, µnectar, and C/V), we fitted six evolutionary
models to the SNP-based phylogeny and quantified their fit to the data using maximum likelihood
based criteria. Briefly, we tested (a) neutral drift (Brownian motion), (b) global optimum (Ornstein-
Uhlenbeck process), (c) habitat-selection by nectar volume, (d) habitat-selection by nectar bacterial
abundance, (e) clade-specific model 1, and (f) clade-specific model 2 (Fig S3). The first model
assumes that the character of interest, in this case µmax, µnectar or C/V, is not under selection and
therefore characterised by neutral drift. The second model assumes that the selective regime is a
combination of environmental and organismal traits that can vary across the phylogeny, leading to a
trait value close to a fitness optimum (Butler & King 2004). Remaining models are adaptive, based on
habitat affinities, with nectar volume and bacterial abundance used as a proxy for local environmental
conditions (models c and d), or via clade-specific sharing of characters (models e and f). Evidence of
selection along these habitat levels, as tested via models c and d, would identify characters that have
presumably responded to variation in resource availability. The remaining two models assume that
phenotypic characters are a result of all strains along a clade sharing a common set of selective
pressures (see, e.g., Knope & Scales 2013). We tested two levels of clade differentiation across
models e and f. Maximum likelihood of model fits to the data were compared using the Akaike
Acc
epte
d A
rtic
le
This article is protected by copyright. All rights reserved.
Information Criterion corrected for small sample size (AICc) (Burnham & Anderson 2004), and all
analyses were conducted in R.
Competitive ability of M. reukaufii genotypes
We expected more competitive strains to be more abundant. To investigate if an estimate of
competitive ability as a phenotypic trait can explain strain abundance, we conducted microcosm
competition experiments as described previously (Dhami et al. 2016; Peay et al. 2012). Briefly, 200
cells of each strain of Metschnikowia reukaufii were introduced two days before or after the
introduction of the strongly competitive and second most abundant species in this study, Candida
rancensis (CR1) (Peay et al. 2012). This set up mimics the natural nectar environment where serial
introductions of nectar microbes are carried out by pollinators. At the end of five days, nectar
microcosms were plated on YM media and relative population densities of each strain enumerated.
Each treatment was repeated four times. Eight different strains of M. reukaufii were tested, and their
respective invasion scores (ratio of population density as a resident or invader compared to baseline
growth in monocultures) calculated (Peay et al. 2012). We regressed the population density ratios as a
function of genetic distance, treating resident/invader status as a fixed effect.
RESULTS
Genotypic diversity and population structure of M. reukaufii
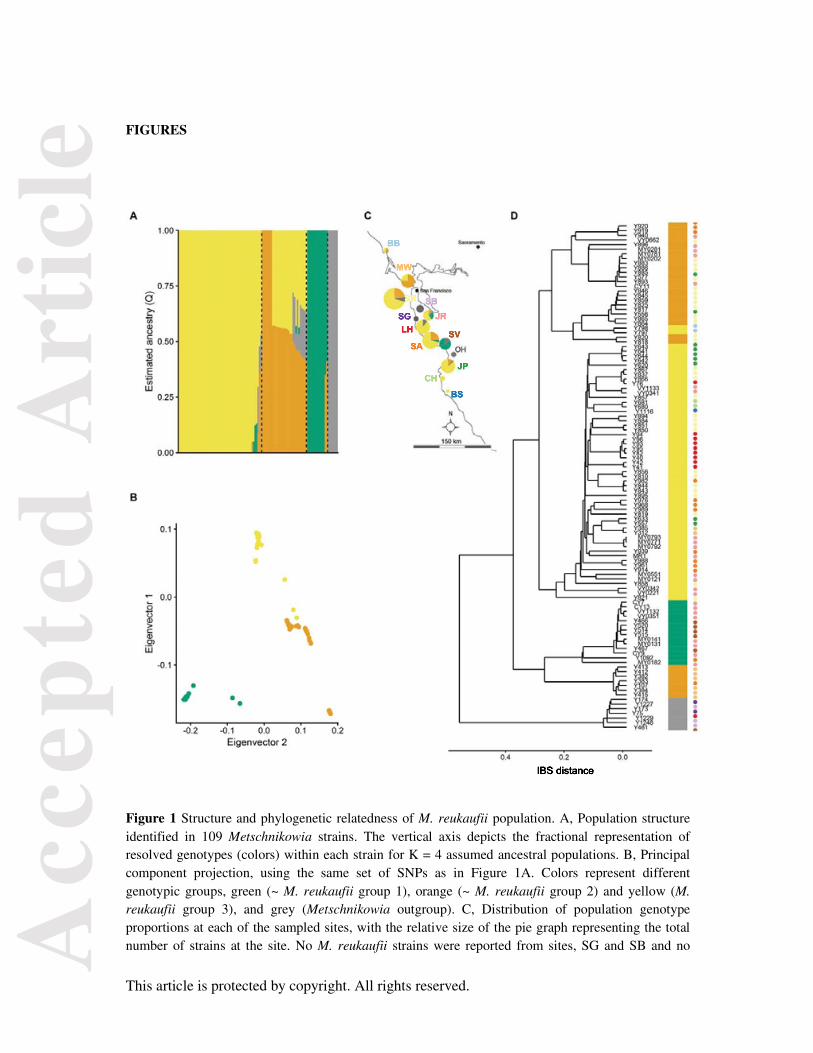
Three main lineages were revealed across the M. reukaufii strains genotyped (Fig 1d), hereby referred
to as group 1 (green), group 2 (orange) and group 3 (yellow). Of these, groups 1 and 2 further split
into two clades each, resulting into total 5 clades (Fig 1d). The outgroup contained 7 strains, as was
expected (Fig 1d).
Acc
epte
d A
rtic
le
This article is protected by copyright. All rights reserved.
We recreated the population structure in a filtered set of 88,192 SNPs across all strains, using the
Bayesian model-based clustering approach implemented in fastSTRUCTURE (Raj et al. 2014). This
analysis yielded a pattern of population structure that is consistent with the main lineages defined in
the phylogeny, here represented as estimated number of ancestral populations, k=4 (including
outgroup, Fig 1a). The overall population structure matched between the two analyses, with one
exception, where at k=4, phylogenetic M. reukaufii group 1 did not completely overlap with the
strains included in the major population structure grouping (green). At k=6, this was resolved when
the phylogenetic subgroups split (see Fig S4). The overall population structure is further supported by
a principal components analysis of the SNP data (Fig 1b). We observed shared ancestry among the in-
group strains of groups 2 and 3, likely arising from incomplete lineage sorting since this species is
typically clonal in nature (Herrera et al. 2014). There were also instances of shared ancestry between
outgroup and a few ingroup strains, but this was also resolved at k=6 (Fig S4). Additionally, non-
conformant strains such as Y798/Y797, which phylogenetically cluster with group 2 (Fig 1d), but
share group 1 and group 2 genotype almost equally (Fig 1a), represent cases where ancestry plots
while informative for overall population patterns, are unable to resolve highly admixed individuals.
The population subgroups were not aligned by geographic origin. Group 3 genotype was widespread
across the region sampled, and multiple genotypes were represented at many of the sites (Fig 1c).
Comparison of pairwise genetic distance and geographic distance matrices revealed no significant
relationship between the two (Mantel statistic r = -0.063, p-value = 0.84, Fig S5). The filtered set of
88,192 SNPs was used to calculate nucleotide diversity metrics such as π, Tajima’s D, heterozygosity,
and FST (Table 1, Fig S6). Across the strain collection, the nucleotide diversity, π, was 0.001, which is
high for closely related strains, but similar to the values reported for natural populations of wine
yeasts (Liti et al. 2009). Consistent intergroup FST values further support the three lineages identified
in the M. reukaufii population (Table 1).
Acc
epte
d A
rtic
le
This article is protected by copyright. All rights reserved.
Phenotypic features of M. reukaufii genotypes
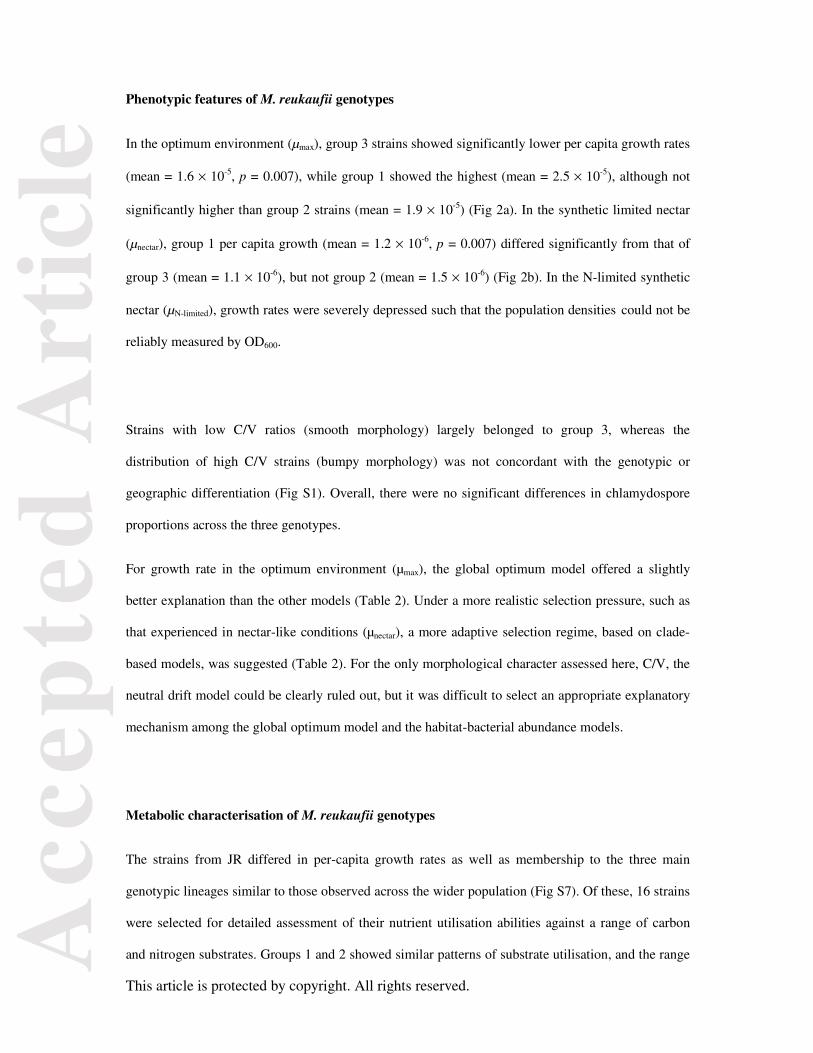
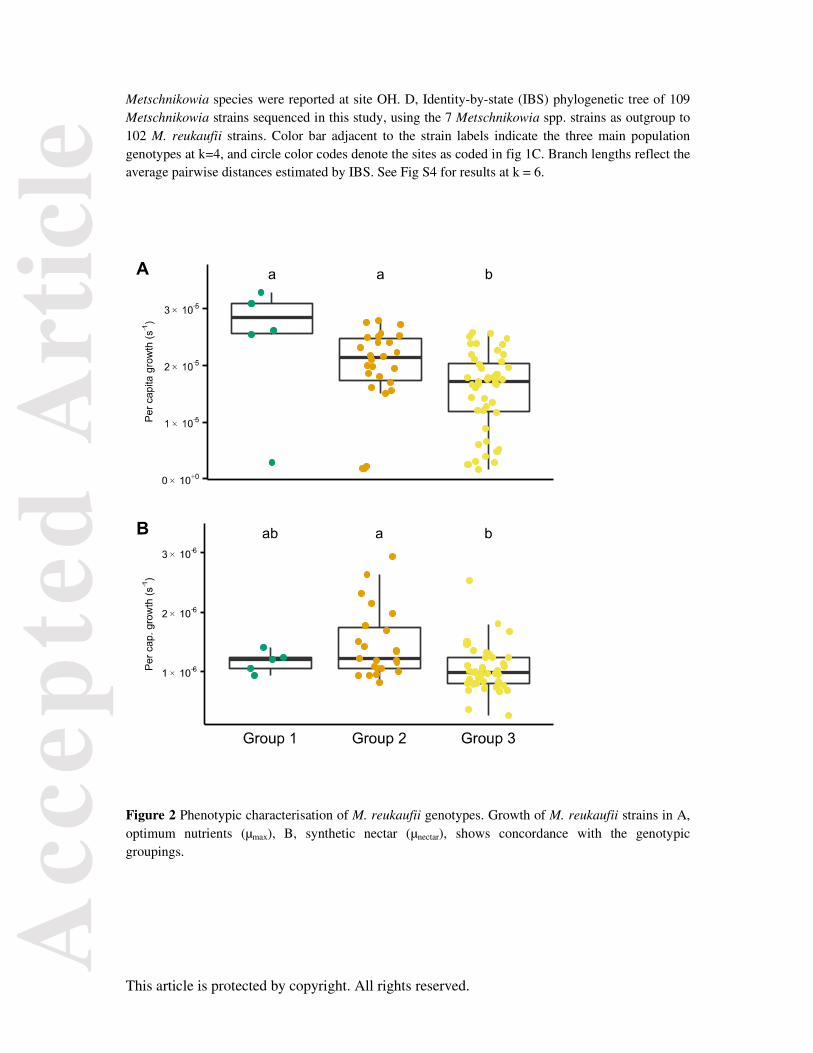
In the optimum environment (µmax), group 3 strains showed significantly lower per capita growth rates
(mean = 1.6 × 10⁻⁵, p = 0.007), while group 1 showed the highest (mean = 2.5 × 10⁻⁵), although not
significantly higher than group 2 strains (mean = 1.9 × 10⁻⁵) (Fig 2a). In the synthetic limited nectar
(µnectar), group 1 per capita growth (mean = 1.2 × 10⁻⁶, p = 0.007) differed significantly from that of
group 3 (mean = 1.1 × 10⁻⁶), but not group 2 (mean = 1.5 × 10⁻⁶) (Fig 2b). In the N-limited synthetic
nectar (µN-limited), growth rates were severely depressed such that the population densities could not be
reliably measured by OD600.
Strains with low C/V ratios (smooth morphology) largely belonged to group 3, whereas the
distribution of high C/V strains (bumpy morphology) was not concordant with the genotypic or
geographic differentiation (Fig S1). Overall, there were no significant differences in chlamydospore
proportions across the three genotypes.
For growth rate in the optimum environment (µmax), the global optimum model offered a slightly
better explanation than the other models (Table 2). Under a more realistic selection pressure, such as
that experienced in nectar-like conditions (µnectar), a more adaptive selection regime, based on clade-
based models, was suggested (Table 2). For the only morphological character assessed here, C/V, the
neutral drift model could be clearly ruled out, but it was difficult to select an appropriate explanatory
mechanism among the global optimum model and the habitat-bacterial abundance models.
Metabolic characterisation of M. reukaufii genotypes
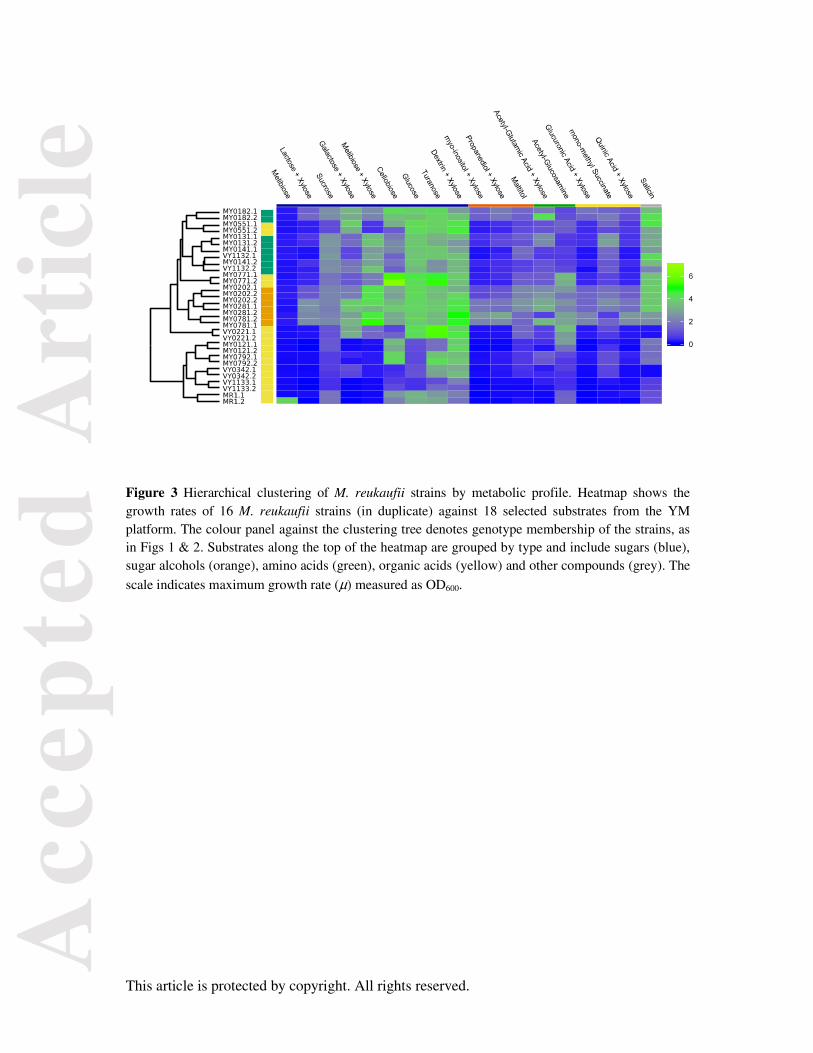
The strains from JR differed in per-capita growth rates as well as membership to the three main
genotypic lineages similar to those observed across the wider population (Fig S7). Of these, 16 strains
were selected for detailed assessment of their nutrient utilisation abilities against a range of carbon
and nitrogen substrates. Groups 1 and 2 showed similar patterns of substrate utilisation, and the range
Acc
epte
d A
rtic
le
This article is protected by copyright. All rights reserved.
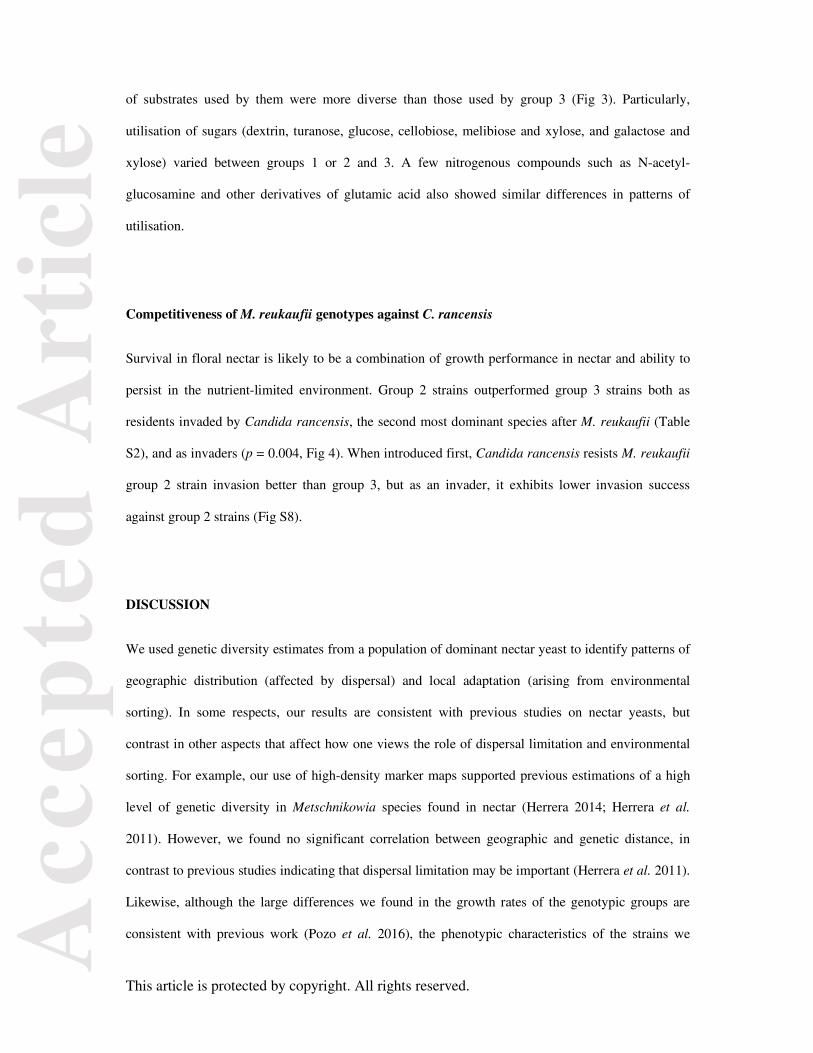
of substrates used by them were more diverse than those used by group 3 (Fig 3). Particularly,
utilisation of sugars (dextrin, turanose, glucose, cellobiose, melibiose and xylose, and galactose and
xylose) varied between groups 1 or 2 and 3. A few nitrogenous compounds such as N-acetyl-
glucosamine and other derivatives of glutamic acid also showed similar differences in patterns of
utilisation.
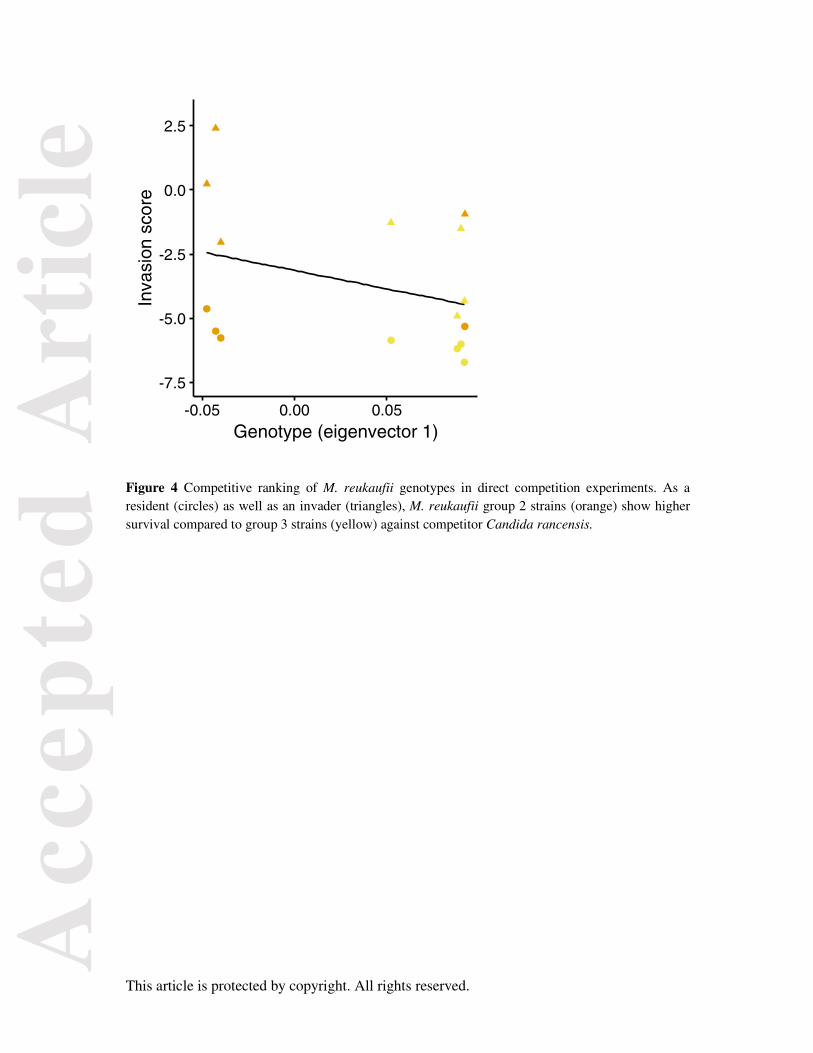
Competitiveness of M. reukaufii genotypes against C. rancensis
Survival in floral nectar is likely to be a combination of growth performance in nectar and ability to
persist in the nutrient-limited environment. Group 2 strains outperformed group 3 strains both as
residents invaded by Candida rancensis, the second most dominant species after M. reukaufii (Table
S2), and as invaders (p = 0.004, Fig 4). When introduced first, Candida rancensis resists M. reukaufii
group 2 strain invasion better than group 3, but as an invader, it exhibits lower invasion success
against group 2 strains (Fig S8).
DISCUSSION
We used genetic diversity estimates from a population of dominant nectar yeast to identify patterns of
geographic distribution (affected by dispersal) and local adaptation (arising from environmental
sorting). In some respects, our results are consistent with previous studies on nectar yeasts, but
contrast in other aspects that affect how one views the role of dispersal limitation and environmental
sorting. For example, our use of high-density marker maps supported previous estimations of a high
level of genetic diversity in Metschnikowia species found in nectar (Herrera 2014; Herrera et al.
2011). However, we found no significant correlation between geographic and genetic distance, in
contrast to previous studies indicating that dispersal limitation may be important (Herrera et al. 2011).
Likewise, although the large differences we found in the growth rates of the genotypic groups are
consistent with previous work (Pozo et al. 2016), the phenotypic characteristics of the strains we
Acc
epte
d A
rtic
le
This article is protected by copyright. All rights reserved.
measured did not explain the observed patterns of strain abundance and distribution well, suggesting
that environmental sorting may not adequately explain the patterns for the populations we studied
here. Instead, our adaptive evolution modelling suggested that the three genotypic lineages might have
evolved under different selective pressures in terms of the ecologically relevant trait, µnectar, possibly
towards fitness optima that might be diverging across the lineages.
The competitive ranking inferred from our experiment is particularly surprising. Both as a resident
population resisting invasion and as an invader itself, group 2 strains outperformed group 3 strains
(Fig 4). Since group 2 strains generally grow faster in various nutrient conditions, and utilised a wider
range of substrates, we would expect them to be better competitors. However, the lowest competitive
genotype, group 3, were the most common and widespread of the three groups, representing about
half the sampled strains (n=59/102, Fig 1c). Of course, it is possible that our experiment that used
artificial nectar did not capture actual competitiveness in real nectar in wild flowers, so our results
should be interpreted with caution. Another possibility is that additional factors not assessed here,
such as tolerance to desiccation, osmotic stress, and extreme temperature fluctuations, influenced the
abundance of different genotypes. For example, desiccation tolerance, during dispersal and off-season
period (when flowers are not present), may influence the colonisation ability of different genotypes.
One reason why less competitive strains were abundant might be because they were better at
tolerating desiccation. Life-history traits of nectar yeasts during the non-flowering period are little
known (Brysch-Herzberg 2004), but could explain the prevalence of non-competitive strains.
In addition, source-sink dynamics (sensu Leibold et al. 2004) may explain the observed genotype
distribution. Nectar metacommunities are a continuum of nectar patches across different species of
coexisting host plants that pollinators visit (Toju et al. In Press). Host-mediated heterogeneity in
nectar composition may favour one genotype over another (Herrera 2014; Herrera et al. 2014).
Therefore, coexisting host plants with different nectar chemistry may offer refuges to genotypes that
Acc
epte
d A
rtic
le
This article is protected by copyright. All rights reserved.
are not favoured in M. aurantiacus nectar. Such alternative hosts may provide source habitats, from
which certain genotypes may have higher net migration to M. aurantiacus, thereby off-setting the
impact of competitive exclusion. Analysis of the distribution and abundance of M. reukaufii
genotypes among a wider range of host plants that coexist with M. aurantiacus may elucidate the role
of source-sink dynamics in counteracting the effects of competitive interactions.
Finally, we should also note that nectar-colonizing microbes, both yeast and bacteria, can rapidly and
markedly change the chemical composition in varied ways (Vannette & Fukami 2014, 2016; Vannette
et al. 2013). Nectar modification by microbes can influence pollinator visitation (Vannette et al. 2013),
and our preliminary observations suggest that yeasts are more reliant on pollinators than bacteria,
leading to unequal influence of nectar modification on their dispersal history. These interactions may
result in divergence of flowers in their nectar conditions via differential niche modifications by
different microbes even within a single host plant (Tucker & Fukami 2014). The differential response
of M. reukaufii genotypes to the substrates assessed here suggests that small variations in nectar
composition may determine niche utilisation by these genotypes. Monitoring biochemistry of mixed
species nectar communities may shed light on the effect of niche modification on the distribution of M.
reukaufii genotypes.
CONCLUSION
We have provided an example where dispersal limitation and environmental sorting might not fully
explain the distribution of microbial genotypes. There was no detectable correlation between
geographic and genetic distance despite the seemingly limited pollinator-assisted dispersal. Metabolic
differences might explain local patterns, but it did not extend to the distribution across the landscape,
especially with further information on competitive hierarchy of the different genotypes. Our results
suggest that other factors such as source-sink dynamics, and niche modifications, and alternative
ecological trade-offs might need to be invoked.
Acc
epte
d A
rtic
le
This article is protected by copyright. All rights reserved.
ACKNOWLEDGEMENTS
We thank Itzel Arias Del Razo, David Cross, Po-Ju Ke, Carolyn Rice, Nic Romano, and Kaoru Tsuji
for assistance with field and laboratory work, Matt Knope for advice on analysis, and two anonymous
reviewers for comments. This work was supported by the National Science Foundation (DEB
1149600, DEB 1555786, DEB 1737758) and the Center for Computational, Evolutionary, and Human
Genomics, the Terman Fellowship, the Department of Biology, and the VPUE summer research
program at Stanford University.
REFERENCES
Alvarez-Perez S, Herrera CM, de Vega C (2012) Zooming-in on floral nectar: a first exploration of nectar-associated bacteria in wild plant communities. FEMS Microbiology Ecology 80, 591-602.
Andrew RL, Wallis IR, Harwood CE, Foley WJ (2010) Genetic and environmental contributions to variation and population divergence in a broad-spectrum foliar defence of Eucalyptus tricarpa. Annals of Botany 105, 707-717.
Bass Becking L (1934) Geobiologie of inleiding tot de milieukunde. The Hague, the Netherlands: WP Van Stockum & Zoon. Belin C, Neaud-Masson, 2012-2013.
Baym M, Kryazhimskiy S, Lieberman TD, et al. (2015) Inexpensive multiplexed library preparation for megabase-sized genomes. PLoSOne 10, e0131262.
Belisle M, Mendenhall CD, Brenes FO, Fukami T (2014) Temporal variation in fungal communities associated with tropical hummingbirds and nectarivorous bats. Fungal Ecology 12, 44-51.
Belisle M, Peay KG, Fukami T (2012) Flowers as islands: spatial distribution of nectar-inhabiting microfungi among plants of Mimulus aurantiacus, a hummingbird-pollinated shrub. Microbial Ecology 63, 711-718.
Brysch-Herzberg M (2004) Ecology of yeasts in plant-bumblebee mutualism in Central Europe. FEMS Microbiology Ecology 50, 87-100.
Burnham KP, Anderson DR (2004) Multimodel inference - understanding AIC and BIC in model selection. Sociological Methods & Research 33, 261-304.
Butler MA, King AA (2004) Phylogenetic comparative analysis: A modeling approach for adaptive evolution. American Naturalist 164, 683-695.
Cadotte MW, Tucker CM (2017) Should environmental filtering be abandoned? Trends in Ecology & Evolution 32, 429-437.
Acc
epte
d A
rtic
le
This article is protected by copyright. All rights reserved.
Danecek P, Auton A, Abecasis G, et al. (2011) The variant call format and VCFtools. Bioinformatics 27, 2156-2158.
de Vega C, Herrera CM, Johnson SD (2009) Yeasts in floral nectar of some South African plants: quantification and associations with pollinator type and sugar concentration. South African Journal of Botany 75, 798-806.
Dhami MK, Hartwig T, Fukami T (2016) Genetic basis of priority effects: insights from nectar yeast. Proceedings of the Royal Society B-Biological Sciences 283, 20161455.
Finlay BJ (2002) Global dispersal of free-living microbial eukaryote species. Science 296, 1061-1063.
Herrera CM (2014) Population growth of the floricolous yeast Metschnikowia reukaufii: effects of nectar host, yeast genotype, and host × genotype interaction. FEMS Microbiology Ecology 88, 250-257.
Herrera CM, Pozo MI, Bazaga P (2011) Clonality, genetic diversity and support for the diversifying selection hypothesis in natural populations of a flower-living yeast. Molecular Ecology 20, 4395-4407.
Herrera CM, Pozo MI, Bazaga P (2014) Nonrandom genotype distribution among floral hosts contributes to local and regional genetic diversity in the nectar-living yeast Metschnikowia reukaufii. FEMS Microbiology Ecology 87, 568-575.
Jombart T (2008) adegenet: a R package for the multivariate analysis of genetic markers. Bioinformatics 24, 1403-1405.
Kivlin SN, Winston GC, Goulden ML, Treseder KK (2014) Environmental filtering affects soil fungal community composition more than dispersal limitation at regional scales. Fungal Ecology 12, 14-25.
Knope ML, Scales JA (2013) Adaptive morphological shifts to novel habitats in marine sculpin fishes. Journal of Evolutionary Biology 26, 472-482.
Kraft NJB, Adler PB, Godoy O, et al. (2015) Community assembly, coexistence and the environmental filtering metaphor. Functional Ecology 29, 592-599.
Kurtzman C, Fell JW, Boekhout T (2011) The yeasts: a taxonomic study Elsevier: Amsterdam, The Netherlands.
Kurtzman CP, Robnett CJ (1998) Identification and phylogeny of ascomycetous yeasts from analysis of nuclear large subunit (26S) ribosomal DNA partial sequences. Antonie Van Leeuwenhoek International Journal of General and Molecular Microbiology 73, 331-371.
Leibold MA, Holyoak M, Mouquet N, et al. (2004) The metacommunity concept: a framework for multi-scale community ecology. Ecology Letters 7, 601-613.
Li H (2013) Aligning sequence reads, clone sequences and assembly contigs with BWA-MEM. arXiv preprint, 1303.3997.
Acc
epte
d A
rtic
le
This article is protected by copyright. All rights reserved.
Liti G, Carter DM, Moses AM, et al. (2009) Population genomics of domestic and wild yeasts. Nature 458, 337-341.
Lowe CD, Martin LE, Montagnes DJS, Watts PC (2012) A legacy of contrasting spatial genetic structure on either side of the Atlantic-Mediterranean transition zone in a marine protist. Proceedings of the National Academy of Sciences of the United States of America 109, 20998-21003.
Martiny JBH, Bohannan BJ, Brown JH, et al. (2006) Microbial biogeography: putting microorganisms on the map. Nature Reviews Microbiology 4, 102-112.
McKenna A, Hanna M, Banks E, et al. (2010) The Genome Analysis Toolkit: A MapReduce framework for analyzing next-generation DNA sequencing data. Genome Research 20, 1297-1303.
O'Donnell K, Gray L (1994) Phylogenetic relationships of the soybean sudden death syndrome pathogen Fusarium solani f. sp. phaseoli inferred from rDNA sequence data and PCR primers for its identification. Molecular Plant-Microbe Interactions 8, 709-716.
Peay KG, Belisle M, Fukami T (2012) Phylogenetic relatedness predicts priority effects in nectar yeast communities. Proceedings of the Royal Society B-Biological Sciences 279, 749-758.
Pozo MI, Herrera CM, Lachance MA, et al. (2016) Species coexistence in simple microbial communities: unravelling the phenotypic landscape of co-occurring Metschnikowia species in floral nectar. Environmental Microbiology 18, 1850-1862.
Purcell S, Neale B, Todd-Brown K, et al. (2007) PLINK: A tool set for whole-genome association and population-based linkage analyses. American Journal of Human Genetics 81, 559-575.
R Development Core Team (2008) R: a language and environment for statistical computing. R Foundation for Statistical Computing, Vienna, Austria.
Raj A, Stephens M, Pritchard JK (2014) fastSTRUCTURE: Variational inference of population structure in large SNP data sets. Genetics 197, 573-589.
Talbot JM, Bruns TD, Taylor JW, et al. (2014) Endemism and functional convergence across the North American soil mycobiome. Proceedings of the National Academy of Sciences of the United States of America 111, 6341-6346.
Toju H, Vannette RL, Gauthier M-PL, Dhami MK, Fukami T (In Press) Priority effects can persist across floral generations in nectar microbial metacommunities. Oikos.
Tsuji K, Dhami MK, Cross DJR, et al. (2016) Florivory and pollinator visitation: a cautionary tale. Aob Plants 8, plw036.
Tucker CM, Fukami T (2014) Environmental variability counteracts priority effects to facilitate species coexistence: evidence from nectar microbes. Proceedings of the Royal Society B-Biological Sciences 281, 20132637.
Vaas LA, Sikorski J, Hofner B, et al. (2013) opm: an R package for analysing OmniLog® phenotype microarray data. Bioinformatics, 29, 1823-1824.
Acc
epte
d A
rtic
le
This article is protected by copyright. All rights reserved.
Vannette RL, Fukami T (2014) Historical contingency in species interactions: towards niche-based predictions. Ecology Letters 17, 115-124.
Vannette RL, Fukami T (2016) Nectar microbes can reduce secondary metabolites in nectar and alter effects on nectar consumption by pollinators. Ecology 97, 1410-1419.
Vannette RL, Fukami T (2017) Dispersal enhances beta diversity in nectar microbes. Ecology Letters 20, 901-910.
Vannette RL, Gauthier MPL, Fukami T (2013) Nectar bacteria, but not yeast, weaken a plant - pollinator mutualism. Proceedings of the Royal Society B-Biological Sciences 280, 20122601.
Wehner J, Mittelbach M, Rillig MC, Verbruggen E (2017) Specialist nectar-yeasts decline with urbanization in Berlin. Scientific Reports 7, 45315.
Weisburg WG, Barns SM, Pelletier DA, Lane DJ (1991) 16S ribosomal DNA amplification for phylogenetic study. Journal of Bacteriology 173, 697-703.
Whitaker RJ, Grogan DW, Taylor JW (2003) Geographic barriers isolate endemic populations of hyperthermophilic archaea. Science 301, 976-978.
Zhang KP, Adams JM, Shi Y, et al. (2017) Environment and geographic distance differ in relative importance for determining fungal community of rhizosphere and bulk soil. Environmental Microbiology 19, 3649-3659.
Zheng X, Levine D, Shen J, et al. (2012) A high-performance computing toolset for relatedness and principal component analysis of SNP data. Bioinformatics 28, 3326-3328.
Zheng XW, Weir BS (2016) Eigenanalysis of SNP data with an identity by descent interpretation. Theoretical Population Biology 107, 65-76.
DATA ACCESSIBILITY
Whole genome sequence data has been submitted to GenBank under the project accession number PRJNA431678. SNP-dataset and relevant R scripts have been submitted to Dryad repository, doi: 10.5061/dryad. hg375
Acc
epte
d A
rtic
le
This article is protected by copyright. All rights reserved.
AUTHOR CONTRIBUTIONS
MKD and TF conceived the study and collected the samples. MKD processed the samples and collected the data. MKD, TH and ADL analysed the data and MB wrote bioinformatics code. MKD wrote the initial draft of the manuscript and all authors contributed to subsequent writing.
TABLES
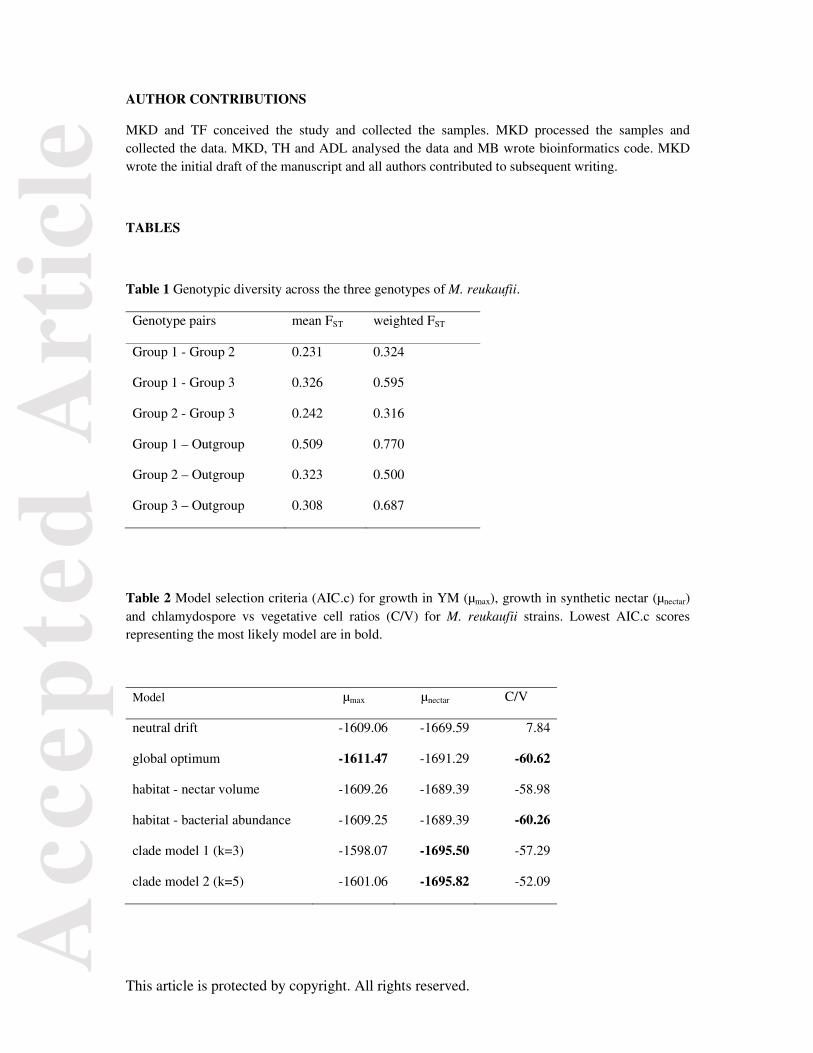
Table 1 Genotypic diversity across the three genotypes of M. reukaufii.
Genotype pairs mean FST weighted FST
Group 1 - Group 2 0.231 0.324
Group 1 - Group 3 0.326 0.595
Group 2 - Group 3 0.242 0.316
Group 1 – Outgroup 0.509 0.770
Group 2 – Outgroup 0.323 0.500
Group 3 – Outgroup 0.308 0.687
Table 2 Model selection criteria (AIC.c) for growth in YM (µmax), growth in synthetic nectar (µnectar) and chlamydospore vs vegetative cell ratios (C/V) for M. reukaufii strains. Lowest AIC.c scores representing the most likely model are in bold.
Model µmax µnectar C/V
neutral drift -1609.06 -1669.59 7.84
global optimum -1611.47 -1691.29 -60.62
habitat - nectar volume -1609.26 -1689.39 -58.98
habitat - bacterial abundance -1609.25 -1689.39 -60.26
clade model 1 (k=3) -1598.07 -1695.50 -57.29
clade model 2 (k=5) -1601.06 -1695.82 -52.09
Acc
epte
d A
rtic
le
This article is protected by copyright. All rights reserved.
FIGURES
Figure 1 Structure and phylogenetic relatedness of M. reukaufii population. A, Population structure identified in 109 Metschnikowia strains. The vertical axis depicts the fractional representation of resolved genotypes (colors) within each strain for K = 4 assumed ancestral populations. B, Principal component projection, using the same set of SNPs as in Figure 1A. Colors represent different genotypic groups, green (~ M. reukaufii group 1), orange (~ M. reukaufii group 2) and yellow (M. reukaufii group 3), and grey (Metschnikowia outgroup). C, Distribution of population genotype proportions at each of the sampled sites, with the relative size of the pie graph representing the total number of strains at the site. No M. reukaufii strains were reported from sites, SG and SB and no
Acc
epte
d A
rtic
le
This article is protected by copyright. All rights reserved.
Metschnikowia species were reported at site OH. D, Identity-by-state (IBS) phylogenetic tree of 109 Metschnikowia strains sequenced in this study, using the 7 Metschnikowia spp. strains as outgroup to 102 M. reukaufii strains. Color bar adjacent to the strain labels indicate the three main population genotypes at k=4, and circle color codes denote the sites as coded in fig 1C. Branch lengths reflect the average pairwise distances estimated by IBS. See Fig S4 for results at k = 6.
Figure 2 Phenotypic characterisation of M. reukaufii genotypes. Growth of M. reukaufii strains in A, optimum nutrients (µmax), B, synthetic nectar (µnectar), shows concordance with the genotypic groupings.
Acc
epte
d A
rtic
le
This article is protected by copyright. All rights reserved.
Figure 3 Hierarchical clustering of M. reukaufii strains by metabolic profile. Heatmap shows the growth rates of 16 M. reukaufii strains (in duplicate) against 18 selected substrates from the YM platform. The colour panel against the clustering tree denotes genotype membership of the strains, as in Figs 1 & 2. Substrates along the top of the heatmap are grouped by type and include sugars (blue), sugar alcohols (orange), amino acids (green), organic acids (yellow) and other compounds (grey). The
scale indicates maximum growth rate (μ) measured as OD600.
Acc
epte
d A
rtic
le
This article is protected by copyright. All rights reserved.
Figure 4 Competitive ranking of M. reukaufii genotypes in direct competition experiments. As a resident (circles) as well as an invader (triangles), M. reukaufii group 2 strains (orange) show higher survival compared to group 3 strains (yellow) against competitor Candida rancensis.
-7.5
-5.0
-2.5
0.0
2.5
-0.05 0.00 0.05Genotype (eigenvector 1)
Inva
sion
sco
re