Download - Water Balance Group

Russell AuwaeHannah Cooper
Helder Da CostaDenise Duenas
Abby FrazierJames FrizzellMelissa Kahili

IntroductionHawai‘i’s success is due to fresh water
available from Orographic rainfall Water is the most important natural resource
HealthEconomicsLand UseSustenance

ObjectivesWhere does the water go in the Mānoa basin?Ground Water Recharge Evapotranspiration for Hydrologic CycleHuman Impacts on Hydrologic CycleEcosystem AnalysisFlood Analysis

Water Balance ModelText Description:
Water Balance = Hydrometeorology + Soil Physics + Groundwater Hydrology
Simple Water Balance Formula:
•Input = Output + Storage
•RF + Irr + CWI = RO + ET + GWR + SM
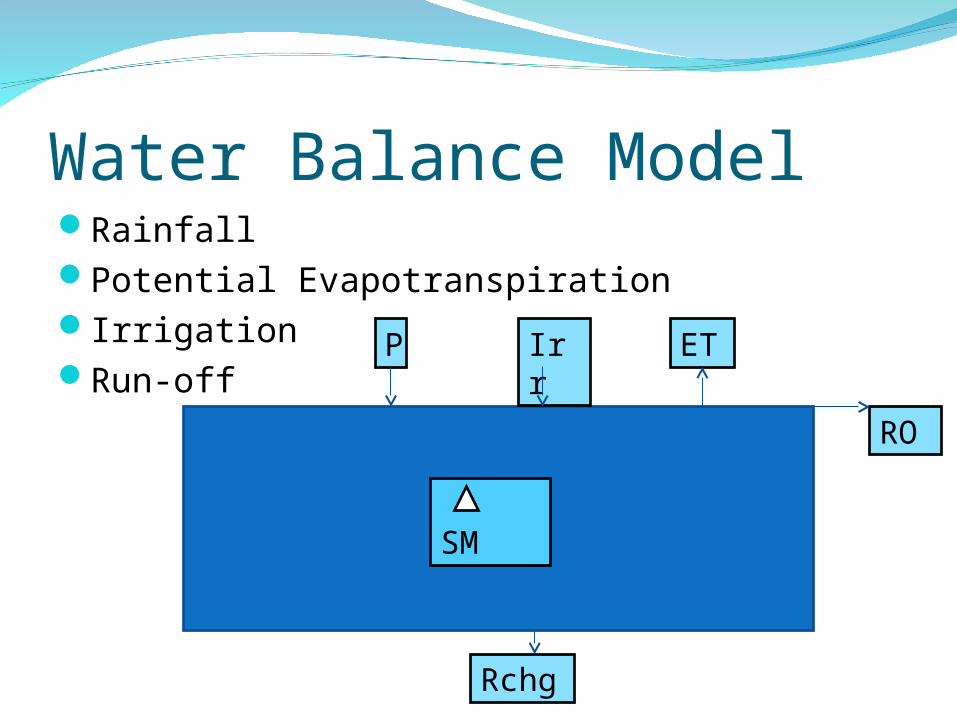
Water Balance Model RainfallPotential EvapotranspirationIrrigationRun-off
P Irr ET
Rchg
RO
SM

Input ParametersAvailable Water CapacityRoot Depth (mm)Crop FactorInitial Soil Moisture (AW/AWC)Fraction of Area Paved (Amount of Land
Cover Paved)Irrigated Area (Irrigated or Not Irrigated)

OutputsActual EvapotranspirationSoil Moisture ContentGroundwater Recharge
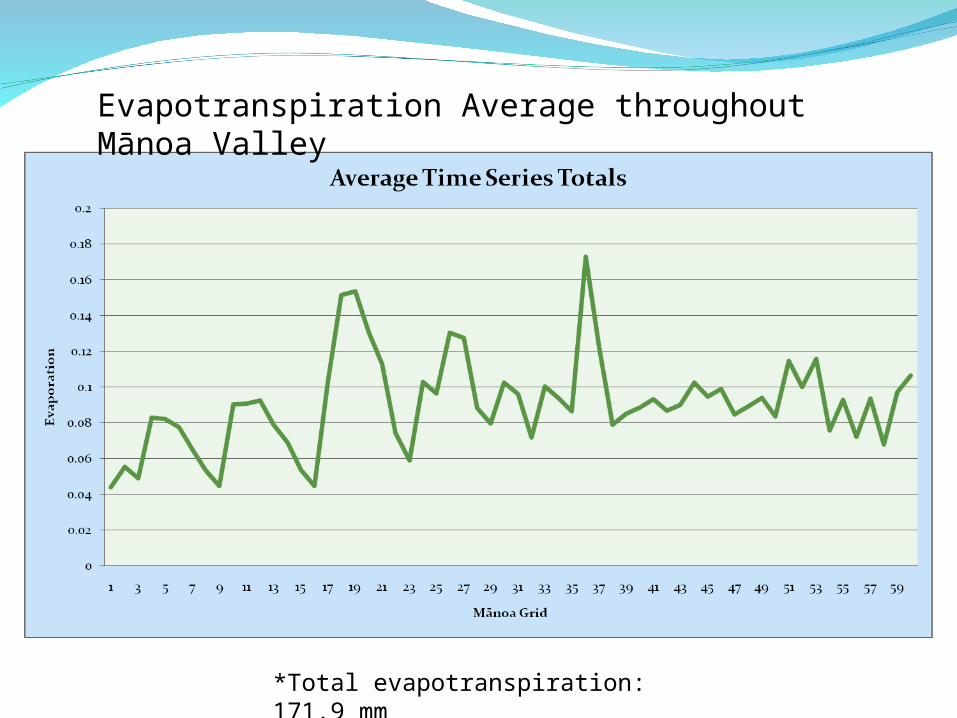
Evapotranspiration Average throughout Mānoa Valley
*Total evapotranspiration: 171.9 mm

Valley Evaporation Mean Diurnal Cycle Comparison
0
0.05
0.1
0.15
0.2
0.25
0.3
0.35
0.4
00:0
0
02:0
004
:00
06:0
008
:00
10:0
012
:00
14:0
016
:00
18:0
020
:00
22:0
0
Evap
orati
on
Upper Valley
Mid-Valley
Lower Valley
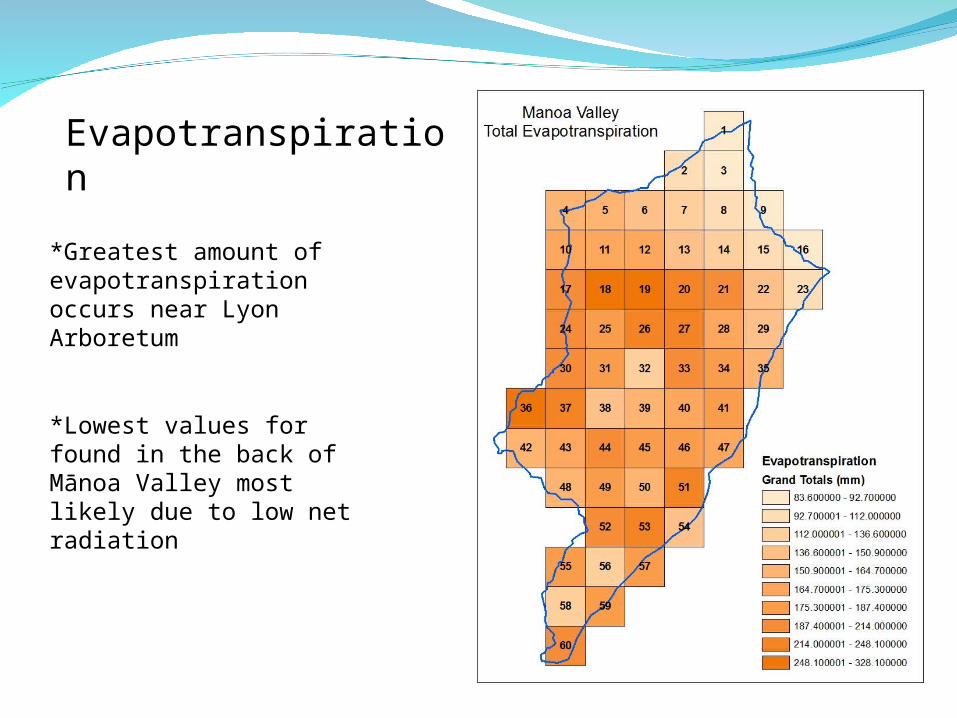
*Greatest amount of evapotranspiration occurs near Lyon Arboretum
*Lowest values for found in the back of Mānoa Valley most likely due to low net radiation
Evapotranspiration

SM output from water balance model for Grid 19 vs. the actual measurement from Arboretum station
0.5
0.55
0.6
0.65
0.7
0.75
0.8
8/29 9/2 9/6 9/10 9/14 9/18 9/22 9/26 9/30 10/4 10/8 10/12 10/16 10/20 10/24 10/28 11/1 11/5 11/9 11/13
Day
20
30
40
50
60
70
80
90
100
Raw SM
Grid 19
How good is the water balance model when measuring
Soil Moisture throughout Mānoa Valley?

Daily Average Soil Moisture and Runoff Over Manoa Valley Basin
0
5
10
15
20
25
30
35
08/28 09/01 09/05 09/09 09/13 09/17 09/21 09/25 09/29 10/03 10/07 10/11 10/15 10/19 10/23 10/27 10/31 11/04 11/08 11/12
Day
Dep
th (
mm
)
Soil Moisture
Runoff
Daily Average of Soil Moisture and Rainfall Over the Whole Manoa Valley Basin
0
5
10
15
20
25
30
35
08/29 09/02 09/06 09/10 09/14 09/18 09/22 09/26 09/30 10/04 10/08 10/12 10/16 10/20 10/24 10/28 11/01 11/05 11/09 11/13
Day
dept
h in
mm
Soil Moisture
Rainfall
*Total soil moisture: 22.8
mm


*Highest amounts of recharge occur near the Lyon Arboretum
*Lowest amounts of recharge found in Mānoa urban/residential areas
Recharge


RECHARGESpatial Variation
Grid 32: Total Rchg = 128.8mmPeak = 8.7mm in one hour
Grid 58: Total Rchg = 21.9mmPeak = 2.07mm in one hour
Grid 13: Total Rchg = 436.9mmPeak = 18.4mm in one hour
Grid 47: Total Rchg = 272.6mmPeak = 13.15mm in one hour

*About half of the total recharge was produced in the last 22 days of the study
*Total recharge produced: 258.8 mm
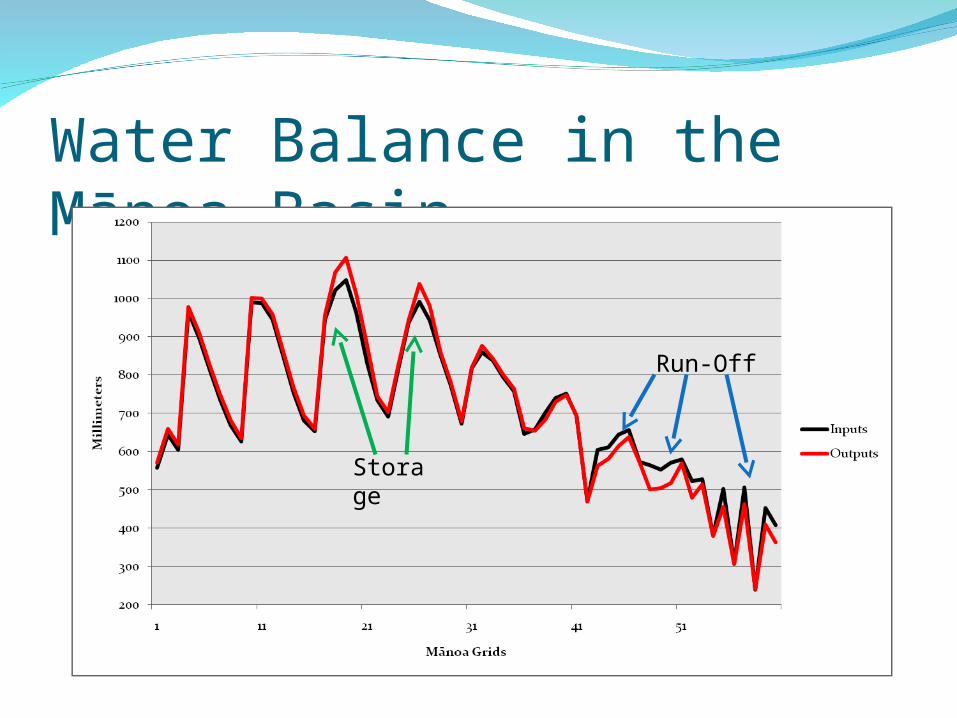
Water Balance in the Mānoa Basin
Run-Off
Storage

Water Balance ResultsWhere the water went in the Mānoa Basin:
Input: 708.9 mm / 10,997,895 m3
Output: 709.6 mm / 11,008,754.82 m3
Name Symbol Actual Amount Percentage
InputPrecipatation RF 665.3 mm 93.80%Irrigation Irr 43.7 mm 6.20%Total for Input 708.9 mm 100.00%OutputRun-Off RO 256.1 mm 36.10%Evapotranspiration ET 171.9 mm 24.20%Recharge GWR 258.8 mm 36.50%Soil Moisture Content SM 22.8 mm 3.20%Total for Output 709.6 mm 100.00%

SummaryWhere the water went in the Mānoa Basin:
Input: 708.9 mm / 10,997,895 m3
Output: 709.6 mm / 11,008,754.82 m3
RF + Irr = RO + ET + GWR + SM
93.8%
6.2%
36.1%
24.2%
36.5%
3.2%

Questions?


