
Safety Benefits Methodology for RSC and ESC Systems in Commercial Vehicle Tractor Semi-Trailers
May 14, 2008
Alrik L. SvensonNational Highway Traffic Safety AdministrationWashington, D.C.
John Woodrooffe, Dan Blower, Paul E. Green University of Michigan Transportation Research InstituteAnn Arbor, MI
SAE Government / Industry Meeting

2
PartnersPartners
• Meritor WABCO• University of Michigan Transportation
Research Institute (UMTRI)
3
Project GoalsProject Goals
• Define pre-crash scenarios and identify factors associated with loss of control and rollover
• Review applicability of stability control for each scenario
• Develop a measure of relative safety effectiveness of the approaches to stability control
4
Technologies InvestigatedTechnologies Investigated
• Tractor-based electronic stability control (ESC)
• Tractor-based roll stability control (RSC)

5
Project FlowProject Flow
Hardwarein-the-Loop
National Crash Databases
Fleet Case Studies
Prime Activity Modules
State CrashAnalysis
Scenarios
Potential Crash Reductions
BenefitCalculation
6
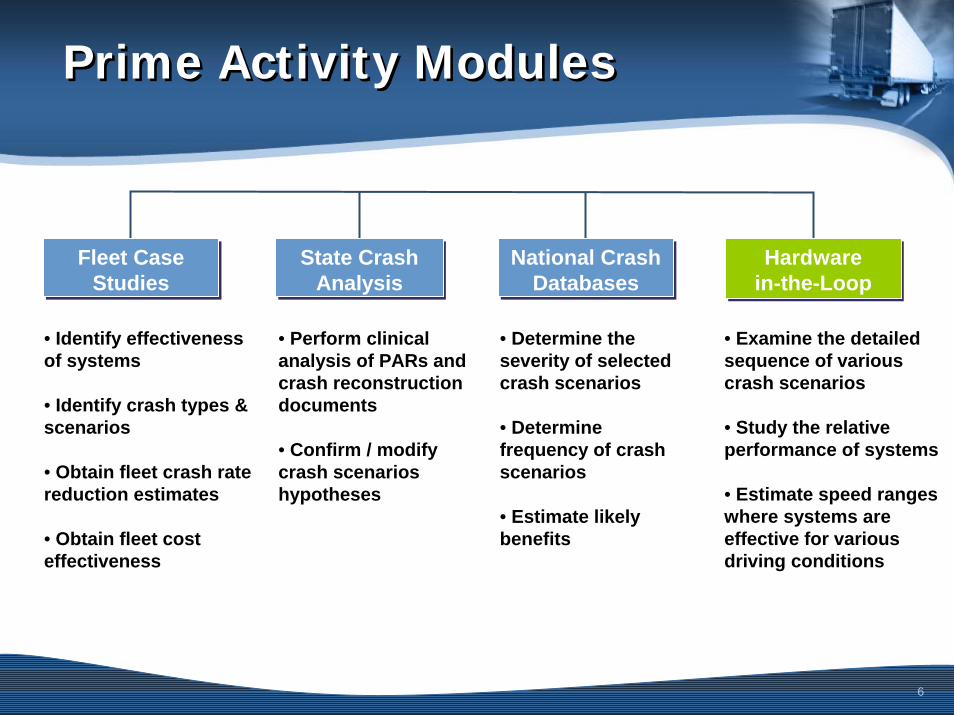
Prime Activity ModulesPrime Activity Modules
• Perform clinical analysis of PARs and crash reconstruction documents
• Confirm / modify crash scenarios hypotheses
• Determine the severity of selected crash scenarios
• Determine frequency of crash scenarios
• Estimate likely benefits
• Identify effectiveness of systems
• Identify crash types & scenarios
• Obtain fleet crash rate reduction estimates
• Obtain fleet cost effectiveness
• Examine the detailed sequence of various crash scenarios
• Study the relative performance of systems
• Estimate speed ranges where systems are effective for various driving conditions
Hardwarein-the-LoopHardware
in-the-LoopNational Crash
DatabasesNational Crash
DatabasesFleet Case
StudiesFleet Case
StudiesState Crash
AnalysisState Crash
Analysis
7
Differentiating ESC / RSCDifferentiating ESC / RSC
• ESC units contain RSC functionality –ESC also includes tractor steer axle braking
• ESC and RSC systems should perform similarly in first event rollover scenarios
• ESC and RSC should perform differently in loss of control scenarios

8
Crash Data SourcesCrash Data Sources
• General Estimates System (GES)– Nationally-representative
– Coded from Police Reports
– All crash severities
• Trucks Involved in Fatal Accidents (TIFA)– Census of truck fatal crash involvements
– Supplements NHTSA FARS data
– Configuration & Crash detail
• Large Truck Crash Causation Study (LTCCS)– K, A, or B crash severity
– Rich detail about pre-crash events and truck configuration

9
Large Truck Crash Causation Study CasesLarge Truck Crash Causation Study Cases
• LTCCS provides detailed information about crash events– Scene diagram
– Detailed narrative
– Detailed coded crash events (matches GES; can be approximated in TIFA)
– Matches TIFA on detail of physical configuration of the vehicle (weights, lengths, axle count, cargo weight and type, etc.)
• Specific limitations– Relatively few cases: 963 crashes, 1128 vehicles
– National representation not useful for this study (e.g., about twice as many rollovers as expected)

10
Use of LTCCS CasesUse of LTCCS Cases
• How LTCCS Was Used– Use TIFA/GES to determine national distribution of
yaw & roll instability crash scenarios
– Apply algorithm to classify yaw and roll cases developed in TIFA/GES to LTCCS to establish crash types
– Detail of LTCCS produced example crash types for engineering review and simulation
– Refine GES data queries to select only relevant crashes

11
LTCCS Rollover CaseLTCCS Rollover Case
Road curved Dry surfaceCargo: loaded
3-axle tractor pulling bottom dump.31,000 lbs cargo (dirt)61,800 gross weightEst. 40 mph

12
Rollover Crash FactorsRollover Crash Factors
• Rollover crashes occur when the limits of lateral acceleration are exceeded
• Function of speed, CG height, and road characteristic
• Most rollovers on curves of 50m – 500m radius
• Rollovers related to freeway road geometry: ramps, interconnecting roads, and bridges where curve radii are less than 500 m

13
LTCCS Yaw Instability CaseLTCCS Yaw Instability Case
Road curved Wet roadway surfaceCargo: loaded
3-axle tractor pulling reefer van trailerUnknown cargo weight (>20% full)Unknown gross weightUnknown speed

14
Loss of Control Crash FactorsLoss of Control Crash Factors
• LOC are yaw instability events• Less likely to be related to road curve• Includes challenging maneuver such as
hard braking, steering• LOC associated with lightly loaded vehicles
on low friction surfaces• LOC includes understeer and oversteer

15
Review of LTCCS Yaw & Roll Instability CrashesReview of LTCCS Yaw & Roll Instability Crashes
• Assess for– Accuracy of coding
– Suitability for HIL simulation
– Crash details (radius of curvature, curve entry speed)
– Relevance of roll & yaw control technologies (likely, probably, unlikely, unknown)

16
Fleet DataFleet Data
• Crash data from a large for-hire carrier were analyzed by UMTRI
• 35,055 crashes from 2001-2007– 379 Rollovers, 421 Jackknifes
• Fleet began adopting RSC in February 2004
• RSC reduced the probability of a rollover for trucks with system

17
Fleet DataYearly Rollover RateFleet DataYearly Rollover Rate
0
1
2
3
4
5
6
2001 2002 2003 2004 2005 2006 2007
Rollover Rate per 100 million miles
18
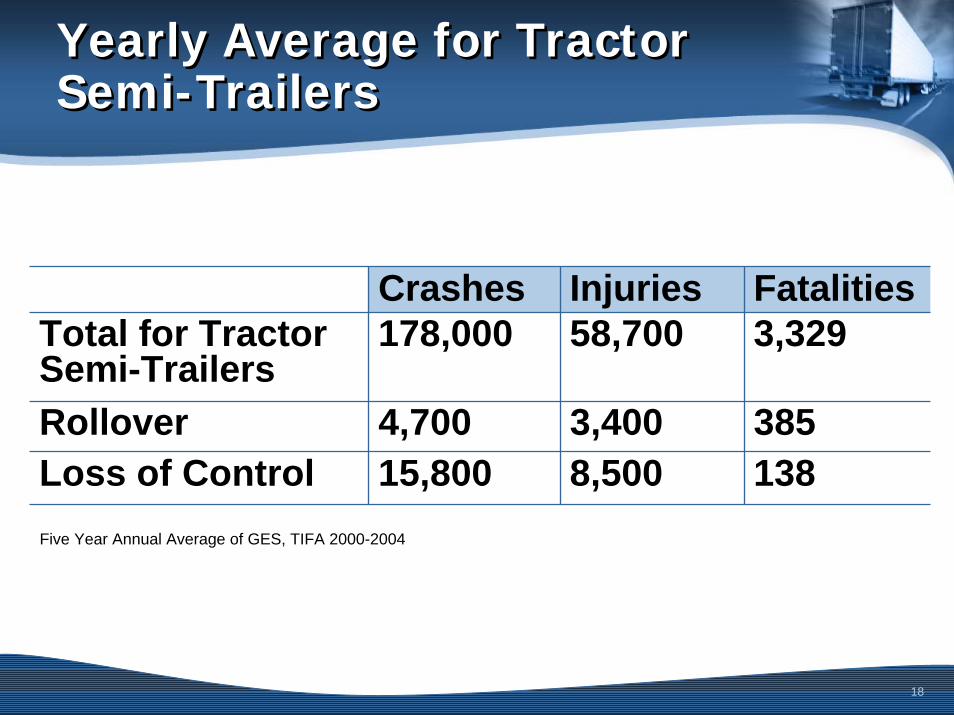
Yearly Average for Tractor Semi-TrailersYearly Average for Tractor Semi-Trailers
Crashes Injuries FatalitiesTotal for Tractor Semi-Trailers
178,000 58,700 3,329
Rollover 4,700 3,400 385Loss of Control 15,800 8,500 138
Five Year Annual Average of GES, TIFA 2000-2004Five Year Annual Average of GES, TIFA 2000-2004

19
Benefit EquationBenefit Equation
B = Benefit in Terms of Reduced Number of Crashes
Exposure)]()([B ×−= CPCP wwo
Probability of Crash Without Technology=)(CPwo
=)(CPw Probability of Crash With Technology
Exposure = All Trucks in the Population

20
Benefit Equation For a Given Crash Scenario, SBenefit Equation For a Given Crash Scenario, S
⎥⎦
⎤⎢⎣
⎡××
−××=)()|(
)()|(1)|(B
SPSCPSPSCP
CSPNwowo
wwwowo
From GES Data From HILSimulation
From Fleet Data
21
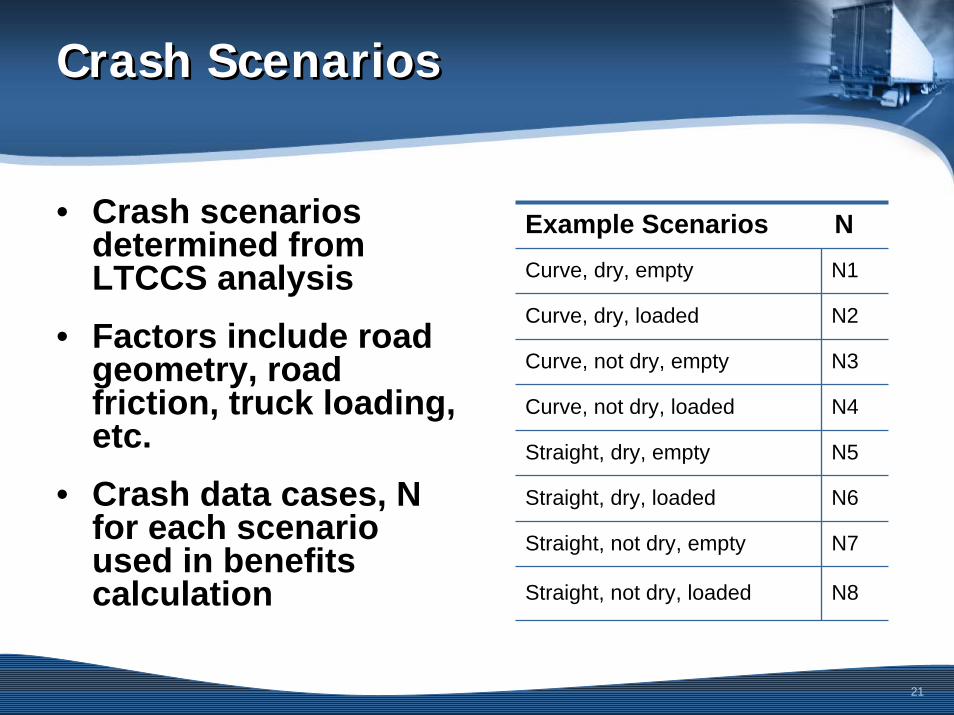
Crash ScenariosCrash Scenarios
• Crash scenarios determined from LTCCS analysis
• Factors include road geometry, road friction, truck loading, etc.
• Crash data cases, N for each scenario used in benefits calculation
Example Scenarios NCurve, dry, empty N1
Curve, dry, loaded N2
Curve, not dry, empty N3
Curve, not dry, loaded N4
Straight, dry, empty N5
Straight, dry, loaded N6
Straight, not dry, empty N7
Straight, not dry, loaded N8

22
Hardware-in-the-LoopHardware-in-the-Loop
• TruckSim offers Real-time Simulation in Combination with SIMULINK and the TruckSim Animator

23
Hardware-in-the-LoopHardware-in-the-Loop
• Pneumatic and electronic control elements, from air reservoirs, through treadle and other system valves to brake actuation chambers
• Brake chambers installed on real S-cam brakes with appropriate pressure/deflection properties
• HIL Validation - Power unit components for 3-axle power unit and 2-axle semi trailer
• Simulations provide system effectiveness in crash scenarios of interest

24
SummarySummary
• Hardware-in-the-Loop analysis is currently underway will be completed in Spring 2008
• NHTSA will present potential benefits of ESC and RSC in Final Report
• www.nhtsa.dot.gov


