U.S. Department of Transportation National Highway Traffic Safety Administration
DOT-VNTSC-NHTSA-02-03 March 2003 DOT HS 809 571
Analysis of Lane Change Crashes
Research and Special Programs Administration Volpe National Transportation Systems Center Cambridge, MA 02142-1093
This document is available to the public through the National Technical Information Service, Springfield, VA 22161
ii
NOTICE This document is disseminated under the sponsorship of theDepartment of Transportation in the interest of informationexchange. The United States Government assumes no liabilityfor its contents or use thereof.
REPORT DOCUMENTATION PAGE Form Approved OMB No. 0704-0188
Public reporting burden for this collection of information is estimated to average 1 hour per response, including the time for reviewing instructions, searching existing data sources, gathering and maintaining the data needed, and completing and reviewing the collection of information. Send comments regarding this burden estimate or any other aspect of this collection of information, including suggestions for reducing this burden, to Washington Headquarters Services, Directorate for Information Operations and Reports, 1215 Jefferson Davis Highway, Suite 1204, Arlington, VA 22202-4302, and to the Office of Management and Budget, Paperwork Reduction Project (0704-0188), Washington, DC 20503. 1. AGENCY USE ONLY (Leave blank)
2. REPORT DATE
March 2003 3. REPORT TYPE AND DATES COVERED
Final Report May 2000 – March 2003
4. TITLE AND SUBTITLE
Analysis of Lane Change Crashes 6. AUTHOR(S) Basav Sen*, John D. Smith, and Wassim G. Najm
5. FUNDING NUMBERS
HS319/S3059
7. PERFORMING ORGANIZATION NAME(S) AND ADDRESS(ES) U.S. Department of Transportation Research and Special Programs Administration John A. Volpe National Transportation Systems Center Cambridge, MA 02142
8. PERFORMING ORGANIZATION REPORT NUMBER DOT-VNTSC-NHTSA-02-03
9. SPONSORING/MONITORING AGENCY NAME(S) AND ADDRESS(ES) U.S. Department of Transportation National Highway Traffic Safety Administration 400 7th St. SW Washington, DC 20590
10. SPONSORING/MONITORING AGENCY REPORT NUMBER
DOT HS 809 571
11. SUPPLEMENTARY NOTES
*EG&G Technical Services, Inc. 55 Broadway Cambridge, MA 02142 12a. DISTRIBUTION/AVAILABILITY STATEMENT This document is available to the public through the National Technical Information Service, Springfield, Virginia 22161.
12b. DISTRIBUTION CODE
13. ABSTRACT (Maximum 200 words) This report defines the problem of lane change crashes in the United States (U.S.) based on data from the 1999 National Automotive Sampling System/General Estimates System (GES) crash database of the National Highway Traffic Safety Administration. The results from this analysis provide a basis for related future research in the U.S. Department of Transportation’s Intelligent Vehicle Initiative. Lane change crashes are defined in this report as two-vehicle crashes that occur when one vehicle encroaches into the path of another vehicle initially on a parallel path with the first vehicle and traveling in the same direction. Such encroachment results from various vehicle maneuvers including typical lane change, merge, pass, drift, turn, and leave or enter a parking position. Approximately 539,000 two-vehicle lane change crashes occurred in the U.S. in 1999. The analysis of pre-crash scenarios identified the seven most common scenarios that accounted for about 88% of all two-vehicle lane change crashes. Ten percent of “typical lane change” crashes involved large trucks changing lanes and light vehicles going straight; about 5% of these crashes involved the reverse combination. Similarly, trucks were turning and light vehicles were going straight in 10% of the “turning at junction” crashes; the reverse combination was reported in only 1% of these crashes. The highest involvement of trucks was observed in the “merging” scenario, accounting for 42% of these crashes. Finally, the physical setting of the seven scenarios was described in terms of the number of travel lanes per direction of travel, crash relation to junction, posted speed limit, roadway alignment, and roadway profile. The report also examines possible contributing factors using available GES variables.
15. NUMBER OF PAGES 49
14. SUBJECT TERMS lane changes, crashes, crash-imminent scenarios, test scenarios, Intelligent Vehicle Initiative
16. PRICE CODE
17. SECURITY CLASSIFICATION OF REPORT Unclassified
18. SECURITY CLASSIFICATION OF THIS PAGE Unclassified
19. SECURITY CLASSIFICATION OF ABSTRACT Unclassified
20. LIMITATION OF ABSTRACT
NSN 7540-01-280-5500 Standard Form 298 (Rev. 2-89)
Prescribed by ANSI Std. 239-18 298-102
iii
METRIC/ENGLISH CONVERSION FACTORS
ENGLISH TO METRIC METRIC TO ENGLISHLENGTH (APPROXIMATE) LENGTH (APPROXIMATE)
1 inch (in) = 2.5 centimeters (cm) 1 millimeter (mm) = 0.04 inch (in) 1 foot (ft) = 30 centimeters (cm) 1 centimeter (cm) = 0.4 inch (in)
1 yard (yd) = 0.9 meter (m) 1 meter (m) = 3.3 feet (ft) 1 mile (mi) = 1.6 kilometers (km) 1 meter (m) = 1.1 yards (yd)
1 kilometer (km) = 0.6 mile (mi)
AREA (APPROXIMATE) AREA (APPROXIMATE)
1 square inch (sq in, in2) = 6.5 square centimeters (cm2) 1 square centimeter (cm2) = 0.16 square inch (sq in, in2) 1 square foot (sq ft, ft2) = 0.09 square meter (m2) 1 square meter (m2) = 1.2 square yards (sq yd, yd2)
1 square yard (sq yd, yd2) = 0.8 square meter (m2) 1 square kilometer (km2) = 0.4 square mile (sq mi, mi2) 1 square mile (sq mi, mi2) = 2.6 square kilometers (km2) 10,000 square meters (m2) = 1 hectare (ha) = 2.5 acres
1 acre = 0.4 hectare (he) = 4,000 square meters (m2)
MASS - WEIGHT (APPROXIMATE) MASS - WEIGHT (APPROXIMATE)
1 ounce (oz) = 28 grams (gm) 1 gram (gm) = 0.036 ounce (oz) 1 pound (lb) = 0.45 kilogram (kg) 1 kilogram (kg) = 2.2 pounds (lb)
1 short ton = 2,000 pounds (lb) = 0.9 tonne (t) 1 tonne (t)
= =
1,000 kilograms (kg) 1.1 short tons
VOLUME (APPROXIMATE) VOLUME (APPROXIMATE)
1 teaspoon (tsp) = 5 milliliters (ml) 1 milliliter (ml) = 0.03 fluid ounce (fl oz) 1 tablespoon (tbsp) = 15 milliliters (ml) 1 liter (l) = 2.1 pints (pt)
1 fluid ounce (fl oz) = 30 milliliters (ml) 1 liter (l) = 1.06 quarts (qt) 1 cup (c) = 0.24 liter (l) 1 liter (l) = 0.26 gallon (gal)
1 pint (pt) = 0.47 liter (l) 1 quart (qt) = 0.96 liter (l)
1 gallon (gal) = 3.8 liters (l) 1 cubic foot (cu ft, ft3) = 0.03 cubic meter (m3) 1 cubic meter (m3) = 36 cubic feet (cu ft, ft3)
1 cubic yard (cu yd, yd3) = 0.76 cubic meter (m3) 1 cubic meter (m3) = 1.3 cubic yards (cu yd, yd3)
TEMPERATURE (EXACT) TEMPERATURE (EXACT)
[(x-32)(5/9)] °F = y °C [(9/5) y + 32] °C = x °F
QUICK INCH - CENTIMETER LENGTH CONVERSION
10 2 3 4 5
InchesCentimeters 0 1 3 4 52 6 1110987 1312
QUICK FAHRENHEIT - CELSIUS TEMPERATURE CONVERSION -40° -22° -4° 14° 32° 50° 68° 86° 104° 122° 140° 158° 176° 194° 212°
°F
°C -40° -30° -20° -10° 0° 10° 20° 30° 40° 50° 60° 70° 80° 90° 100°
For more exact and or other conversion factors, see NIST Miscellaneous Publication 286, Units of Weights and Measures. Price $2.50 SD Catalog No. C13 10286 Updated 6/17/98
iv
TABLE OF CONTENTS Section Page EXECUTIVE SUMMARY..........................................................................................................viii
1 INTRODUCTION................................................................................................................... 1
1.1 Previous Work................................................................................................................. 2 1.2 Analysis Data Bases ........................................................................................................ 2
1.2.1 Lane Change/Merge Crashes: Problem Size Assessment and Statistical Description ....................................................................................................................... 2 1.2.2 Examination of Lane Change Crashes and Potential Intelligent Vehicle Highway System (IVHS) Countermeasures .................................................................................... 3 1.2.3 Synthesis Report: Examination of Target Vehicular Crashes and Potential Intelligent Transportation Systems (ITS) Countermeasures ............................................ 4 1.2.4 Crash Avoidance System Task I Final Report ....................................................... 4
2 DEFINITION AND CLASSIFICATION OF LANE CHANGE CRASHES ........................ 7
2.1 Target Crash Population.................................................................................................. 8 2.2 Pre-Crash Scenarios ........................................................................................................ 9
3 STATISTICAL DESCRIPTION OF LANE CHANGE CRASH SCENARIOS ................. 13
3.1 Vehicle Type Distribution for Pre-Crash Scenarios...................................................... 13 3.2 Physical Setting of Lane Change Crashes..................................................................... 16
3.2.1 Number of Travel Lanes per Direction ................................................................. 17 3.2.2 Relation to Junction............................................................................................... 18 3.2.3 Posted Speed Limit................................................................................................ 19 3.2.4 Roadway Alignment and Profile ........................................................................... 19
3.3 Driver and Environmental Contributing Factors........................................................... 19 3.3.1 Driver Contributing Factors .................................................................................. 21 3.3.2 Environmental Contributing Factors..................................................................... 22
3.4 Maximum Injury Severity ............................................................................................. 23
4 CONCLUSIONS................................................................................................................... 31
5 REFERENCES...................................................................................................................... 33 APPENDIX A …………………………………………………………………………………...35
v
LIST OF TABLES
Table Page 1. Frequencies and Shares of Lane Change Pre-Crash Scenarios for All Vehicles (in Descending
Order) .................................................................................................................................... 10 2. Upper and Lower Confidence Bounds on Frequencies of Lane Change Pre-Crash Scenarios 11 3. Distribution of Scenario 1 (Typical Lane Change) Crashes by Type of Vehicle Involved ..... 14 4. Distribution of Scenario 2 (Turning) Crashes by Type of Vehicle Involved........................... 14 5. Distribution of Scenario 3 (Drifting) Crashes by Type of Vehicle Involved1 ......................... 15 6. Distribution of Scenario 4 (Passing Combined with Turning) Crashes by Type of Vehicle
Involved................................................................................................................................. 15 7. Distribution of Scenario 5 (Passing) Crashes by Type of Vehicle Involved ........................... 16 8. Distribution of Scenario 6 (Leaving Parked Position) Crashes by Type of Vehicle Involved 16 9. Distribution of Scenario 7 (Merging) Crashes by Type of Vehicle Involved.......................... 16 10. Distribution of Number of Crashes by Number of Lanes/Direction for Lane Change Pre-
Crash Scenarios ..................................................................................................................... 24 11. Distribution of Number of Crashes by Relation to Junction for Lane Change Pre-Crash
Scenarios ............................................................................................................................... 24 12. Distribution of Number of Crashes by Speed Limit (mph) for Lane Change Pre-Crash
Scenarios ............................................................................................................................... 25 13. Distribution of Number of Crashes by Roadway Alignment for Lane Change Pre-Crash
Scenarios ............................................................................................................................... 26 14. Distribution of Number of Crashes by Roadway Profile for Lane Change Pre-Crash
Scenarios ............................................................................................................................... 26 15. Distribution of Driver Contributing Factors by Scenario and Pre-Crash Movement ............ 27 16. Distribution of Environmental Factors by Scenario and Pre-Crash Movement, for Cases
With No Driver Factors Present ............................................................................................ 28 17. Distribution of Maximum Injury Severity in Vehicle by Scenario and Pre-Crash Movement
............................................................................................................................................... 29
vi
LIST OF ACRONYMS
CDS Crashworthiness Data System DOT U.S. Department of Transportation FARS Fatality Analysis Reporting System GES General Estimates System ITS Intelligent Transportation Systems IVHS Intelligent Vehicle Highway System IVI Intelligent Vehicle Initiative LCM Lane Change/Merge NASS National Automotive Sampling System NHTSA National Highway Traffic Safety Administration POV Principal Other Vehicle

vii
viii
EXECUTIVE SUMMARY This report defines the problem of lane change crashes in the United States (U.S.) based on data from the 1999 National Automotive Sampling System/General Estimates System (GES) crash database of the National Highway Traffic Safety Administration. The results from this analysis provide a basis for related future research in the U.S. Department of Transportation’s Intelligent Vehicle Initiative to solve traffic safety problems through the development and deployment of vehicle-based and vehicle-infrastructure cooperative countermeasure systems using advanced technologies. Lane change crashes (or more properly, the lane change family of crashes) are defined in this report as two-vehicle crashes that occur when one vehicle encroaches into the path of another vehicle initially on a parallel path with the first vehicle and traveling in the same direction. Such encroachment results from various vehicle maneuvers including typical lane change, merge, pass, drift, turn, and leave or enter a parking position. There were 539,000 two-vehicle lane change crashes in 1999 based on GES data, or about 9% of all police-reported motor vehicle crashes. This report breaks down these crashes into major pre-crash scenarios and describes the characteristics of each scenario in terms of vehicle types involved, physical setting, crash contributing factors, and injury severity. Lane change crashes mostly consist of the following seven pre-crash scenarios, ranked in a descending order in terms of their frequency of occurrence in 1999:
1. Two vehicles on parallel paths; one intentionally changes lanes and collides with other vehicle: 207,000 (typical lane change).
2. Two vehicles on parallel paths; one turns across the path of the other at a roadway junction: 89,000 (turning at junction).
3. Two vehicles on parallel paths (both going straight/both turning left/both turning right/both negotiating curve); one drifts into another’s lane with no apparent reason: 62,000 (drifting).
4. Two vehicles on parallel paths; one turning at a roadway junction and one passing: 46,000 (turning combined with passing).
5. Two vehicles on parallel paths; one moves into the other’s lane to pass the other, or to pass a third vehicle: 27,000 (passing).
6. One vehicle leaves parked position and sideswipes/is sideswiped by another vehicle in lane into which the first vehicle is trying to merge: 25,000 (leaving parked position).
7. One vehicle merges into the lane of another from entrance to limited access highway and/or other similar entrance, and sideswipes/is sideswiped by the other vehicle: 19,000 (merging).
The seven most common pre-crash scenarios accounted for about 88% of all two-vehicle lane change crashes. A large share (10%) of “typical lane change” crashes involved large trucks (medium and heavy trucks) changing lanes and light vehicles (passenger cars, sport utility vehicles, vans, and pickups) going straight; in contrast, about 5% of these crashes involved the reverse combination. Similarly, trucks were turning and light vehicles were going straight in 10% of the “turning at junction” crashes; however, the reverse combination was reported in only 1% of these crashes. The highest involvement of trucks was observed in the “merging” scenario,
ix
accounting for 42% of these crashes. Buses (transit and inter-city buses, not school buses) were mostly associated with in “drifting” and “leaving parked position” scenarios. The physical setting of the seven scenarios was described in terms of the number of travel lanes per direction of travel, crash relation to junction, posted speed limit, roadway alignment, and roadway profile. Moreover, this report examined the factors that might have contributed to the crash in each of the seven scenarios using available GES variables. The list of factors included driver distraction, vision obstruction, speeding, traffic violation, hit and run, and environmental factors such as night and adverse weather conditions. Finally, the maximum injury severity per crash was analyzed which revealed that 14% of lane change crashes resulted in some form of injury.
1
1 INTRODUCTION This report presents the results from an analysis of lane change crashes based on data from the 1999 National Automotive Sampling System (NASS)/General Estimates System (GES) crash database of the National Highway Traffic Safety Administration (NHTSA). Lane change crashes (or more properly, the lane change family of crashes) are defined in this report as two-vehicle crashes which occur when one vehicle encroaches into the path of another vehicle initially on a parallel path with the first vehicle and traveling in the same direction. It includes cases in which one vehicle changes lanes and is involved in a collision with a vehicle going straight in the adjacent lane; cases in which one vehicle attempts to turn at an intersection and collides with another vehicle in an adjacent lane traveling in the same initial direction; and so on. A complete listing of the subtypes (or scenarios) included in the lane change family of crashes, along with their descriptions, is provided in Section 2.2. This report defines the problem of lane change crashes and provides a basis for related future research in the U.S. Department of Transportation’s (DOT) Intelligent Vehicle Initiative (IVI). Note that certain types of crashes are not included in this family. These include crashes which occur off the roadway; crashes involving encroachment by one vehicle into the lane of another vehicle traveling in the opposite direction or on an intersecting path; and so on. The exclusions are also described in more detail in Section 2. The IVI is focused on solving traffic safety problems through the development and deployment of vehicle-based and vehicle-infrastructure cooperative countermeasure systems using advanced technologies [1]. There are seven problem areas under consideration in the IVI including rear-end, off-roadway, lane change, crossing paths, driver impairment, reduced visibility, and vehicle instability crashes. Research in these crash problem areas is being performed in the context of four vehicle platforms that include light vehicles (passenger cars, sport utility vehicles, vans, and pickups), commercial vehicles (large trucks–medium and heavy trucks), transit vehicles (buses, but not school buses), and specialty vehicles (police, fire, ambulance, snow plows, and other roadway maintenance vehicles). This report provides crash statistics for all vehicles involved in lane change crashes. Section 2.3 describes the distributions of the different crash scenarios by vehicle type involved, including a category for “other” vehicles not included in the definitions of the four platforms considered in the IVI. “Other” vehicles include motorcycles and other two- or three-wheeled vehicles; farm and construction equipment other than trucks; etc. This report analyzes lane change crashes for all vehicles and focuses on a select portion (target) of these crashes to enable the development of concepts, functional requirements, performance guidelines, and test procedures and the safety assessment of potential lane change crash avoidance systems. This analysis of lane change crashes began with the selection of target crashes and followed with the breakdown of these crashes into common pre-crash scenarios that represented vehicle dynamics. These scenarios formed the foundation to statistically describe the physical setting of these target lane change crashes, the factors that might have contributed to the cause of the crash, and post-crash events such as maximum injury severity. The combination of causal factors and pre-crash scenarios allows the development of crash countermeasure concepts and essential functional requirements [2]. Information on pre-crash scenarios and their physical setting helps to develop performance guidelines and objective test procedures (including
2
test scenarios) for crash avoidance systems [3]. Such information also guides researchers to collect the appropriate data on driver performance with and without the assistance of crash avoidance systems. Such data are essential to the design of effective warning algorithms and driver-vehicle interfaces, and estimation of safety benefits for crash avoidance systems [4]. Finally, injury severity statistics support the projection of safety benefits in terms of injury severity reduction that might be accrued by the use of lane change crash countermeasure systems [5]. 1.1 Previous Work Several previous studies have used NHTSA GES data to analyze lane change crash types. Four such studies are reviewed here, confined to discussion of only those parts of the studies that are relevant to the present study including definitions, methodology, and results. 1.2 Analysis Databases This analysis utilized the 1999 GES crash database to define and statistically describe the problem of lane change crashes. The GES constitutes a part of NHTSA’s NASS crash data collection. Providing data about all types of crashes involving all types of vehicles, the GES is used to identify highway safety problem areas, supply a foundation for regulatory and consumer information initiatives, and form the basis for cost and benefit analyses of highway safety initiatives. The GES is a nationally representative sample of police-reported crashes collected from about 400 police agencies within 60 geographical sites in the United States. Each year, about 55,000 police accident reports are selected and coded directly in the GES by trained personnel who check the data for validity and consistency. 1.2.1 Lane Change/Merge Crashes: Problem Size Assessment and Statistical Description [6] This study classified lane change crashes (or, to use their terminology, lane change/merge (LCM) crashes) into two types: angle/sideswipe LCM crashes and rear-end LCM crashes. The study identified angle/sideswipe LCM crashes from GES as follows:
1. Imputed Vehicle Maneuver (replaced in current GES by Movement Prior to Critical Event) = 14 (LCM)
2. Involved Vehicles per Crash ≥ 2 3. Imputed Manner of Collision = 4 (angle) or 5 (sideswipe, same direction).
The definition of rear-end LCM crashes used in this study included only cases in which the vehicle changing lanes was rear-ended by the vehicle going straight. Cases in which the vehicle going straight was rear-ended by the vehicle changing lanes were classified as straightforward rear-end crashes, unlike in the present study in which they are included in the definition of lane change crashes. Also note the difference in the classification of crash scenarios; in the present study, rear-end lane change crashes are not considered as a distinct scenario, but rather, included in an “other and unknown” category, since the number of these crashes found was small compared to the entire population of lane change crashes.
3
Differences with the present study in the identification procedure include:
1. Passing, turning maneuvers, leaving parked position, and drifting are excluded from the family of lane change crashes.
2. The Critical Event variable is not used; this leads to the possibility that miscoded rear-end crashes, miscoded leaving parked position crashes, and some complicated crashes involving avoidance maneuvers, are undifferentiated from the general family of LCM crashes.
3. Because of limitations of GES in earlier years (specifically, 1991), LCM crashes are distinguished using the Relation to Intersection variable; the 1991 GES did not have separate lane change and merge codes for the Vehicle Maneuver variable. Pre-crash variables were added to NASS in 1992, including “movement prior to critical event” and “critical event” variables.
4. Rear-end LCM crashes are identified using the Imputed Vehicle Role (struck), rather than matching the critical event for two vehicles, and cross-checking with the movement prior to critical event for consistency, as in the present study.
5. Loss-of-control crashes are not identified and excluded. Other differences with the present study include the use of FARS to identify fatal LCM crashes in Reference 6, and the use of a hierarchy of contributing factors in the present study. The total population of angle/sideswipe LCM crashes was found to be 233,000 (as compared to greater than 226,000 in the present study), which is sufficiently close. The total population of rear-end LCM crashes, however, was 11,000, as compared to only 1,000 in the present study. Results were analyzed by finding distributions of LCM crashes, differentiated by passenger vehicles and combination trucks, cross-cut with the following variables: time of day, urban/rural, relation to roadway, relation to intersection, trafficway flow, road surface conditions, speed limit, light conditions, weather, pre-crash travel speed, point of impact, obstruction of driver vision, driver age and sex, etc. Longitudinal impact location was analyzed, and differentiated by lane change to left and lane change to right. 1.2.2 Examination of Lane Change Crashes and Potential Intelligent Vehicle Highway System
(IVHS) Countermeasures [7] This study involved manual analysis of individual cases from the NASS Crashworthiness Data System (CDS) and GES. The family of lane change crashes was classified into the general categories of changing lanes, merging, exiting, passing, and weaving. Based on the distribution of crashes between non-junction and junction areas, the authors decided to focus on lane change and merge crashes. Loss-of-control and drift were distinguished from controlled maneuver crashes. (Note the difference with the present study, which excludes loss of control from the definition of lane change crashes, but does not include drifting.) Single vehicle crashes coded as lane change were deleted from the set of cases analyzed. Note that the sample size in this study was very small, since a manual analysis was used.
4
Based on analysis of the results, LCM crashes were classified into two broad classes:
1. Proximity crashes, in which the subject vehicle (which changes lanes/merges) and the principal other vehicle (POV) are traveling at close to the same speed. This class accounts for the vast majority (about 90%) of LCM crashes, and is further divided into forward overlap, side-by-side, and rearward overlap.
2. Fast approach crashes, in which one of the vehicles is traveling significantly faster than the other.
The share of loss-of-control, drifting, and unknown crashes was significantly smaller than in the present study. This is partly attributed to differences in definition (LCM crashes as defined in this report cover only the “typical lane change” and “merge scenarios” of the present study), and differences in methodology (manual analysis of a small sample of individual unweighted cases versus a relatively more automated analysis of a large, weighted number of coded cases). In a majority of the cases, no avoidance maneuver was initiated by either vehicle. Also, in most cases, the subject vehicle driver did not see the POV before impact. 1.2.3 Synthesis Report: Examination of Target Vehicular Crashes and Potential Intelligent
Transportation Systems (ITS) Countermeasures [2] The definition and identification procedure for LCM crashes was essentially the same as in the previous two studies. The distribution of a number of target crash types, including LCM crashes, across several conditions (such as time of day, light condition, atmospheric condition, roadway surface condition, roadway alignment, roadway profile, speed limit, relation to junction, alcohol involvement, and injury severity) was examined. The distribution of the crash types by causal factor was also found for a total of 18 detailed causal factors and 5 groups of causal factors: driving task errors, driver physiological impairment, vehicle defects, low-friction road surface, and reduced visibility. Note the difference between this matrix of causal factors and the hierarchialized causal factor matrix used in the present study (Section 2). Driving task errors caused close to 100% of LCM crashes. The largest share was attributed to failure of the subject vehicle’s driver to see the POV. The next largest share was attributed to misjudgment of gap or speed. 1.2.4 Crash Avoidance System Task I Final Report [8] Only the LCM crash analysis methodology from the report is reviewed here. LCM crashes were extracted from the GES and CDS data bases, the distributions with various probable causal factors were found, and statistical analyses were performed. The manner of identification of LCM crashes from the GES is as follows:
1. Accident type = 44-47 (angle/sideswipe crashes).
5
2. Manner of collision = 1 (rear-end), 4 (angle), or 5 (sideswipe, same direction). 3. Movement prior to critical event = 7 (leaving a parked position), 16 (changing lanes),
or 17 (merging) for at least one of the vehicles involved. Note that this study does not distinguish changing lanes from merging.
4. Vehicle role = 1 (striking) or 2 (struck); scenarios are distinguished based on the role. The identification of cases from the CDS is similar, except that the vehicle role variable does not exist in the CDS. Eight scenarios are identified from the data, some of which are further divided into sub-scenarios (note that the numbering used here is different from the numbering in the report being reviewed):
1. Vehicle changing lanes or merging strikes vehicle going straight; angle collision. 2. Vehicle changing lanes or merging strikes vehicle going straight; sideswipe collision. 3. Vehicle changing lanes or merging is struck by vehicle going straight; divided into
angle collision and sideswipe collision sub-scenarios. 4. Both vehicles changing lanes or merging. 5. “Drifting” cases, with neither vehicle changing lanes or merging; further divided into
angle collision and sideswipe collision sub-scenarios. 6. Vehicle changing lanes rear-ends vehicle going straight. 7. Vehicle changing lanes is rear-ended by vehicle going straight. 8. Leaving parked position crashes, further subdivided into:
a. Vehicle leaving parked position, striking another vehicle (angle/sideswipe). b. Vehicle leaving parked position, struck (angle/sideswipe). c. Vehicle leaving parked position, struck (rear-end).
Scenarios 1, 2, 3, and 4 are identical to the combination of the “typical lane change” scenario and the merging scenario in the present study. Note that changing lanes and merging are not distinguished as in the present study, while vehicle roles (striking versus struck) and angle collisions versus sideswipe collisions are distinguished. Scenarios 5, 6, 7, and 8, respectively, are identical to the drifting and leaving parked position scenarios in the present study, as well as the lane change rear-end crashes which constitute part of the “other and unknown” category in the present study. A key difference with the present study is that the turning at intersection and passing scenarios are not considered as part of the family of LCM crashes. For the purpose of finding distributions by causal factors, the scenarios are aggregated into groups. Scenarios 1, 2, and 4 (striking vehicles only) are classified into the “lane change striking” group; 3, 7, and 4 (struck vehicles only) are classified into the “lane change struck” group; 5 (drifting); and 8 (leaving parked position). Note that Scenario 6 (lane change rear-end) was not considered. The causal factors considered included roadway profile and alignment; road surface condition; weather condition; light condition; and relation to junction. Statistical analysis was performed to determine the degree of association between the occurrence of the different crash scenarios, the causal variables, other factors (such as driver alcohol use and restraint use), and consequences (such as injury severity and vehicle damage severity).
6
Finally, a manual analysis was performed on selected cases from the CDS, to identify crash scenarios. The results show both similarities and differences with the results of the present study. The numbers of crashes by scenario are comparable to the numbers for equivalent scenarios in the present study, with the exception of rear-end crashes. The number of typical lane change crashes is about 203,000 as compared to about 208,000 in the present study. The number of drifting crashes is about 49,000, as compared to about 60,000 in the present study. (Note that drifting while negotiating a curve, or turning on parallel paths at an intersection, are not included in the TRW report, but are included in the drifting scenario in the present study.) The number of leaving parked position crashes was about 22,000, as compared to about 26,000 in the present study. The numbers of LCM rear-end crashes are significantly different between the two studies. The TRW report found about 16,000 crashes with the lane-changing vehicle rear-ending the vehicle going straight (as compared to 4,000 in the present study), and 11,000 lane change rear-end crashes with the vehicle going straight rear-ending the lane-changing vehicle (as compared to only 1,000 in the present study). The difference is thought to arise in part from the differences in methodology. In the TRW report, lane change rear-end crashes were found from the accident type, vehicle role, and manner of collision variables. In the present study, they were found mainly from the critical event and movement prior to critical event variables. Consequently, crashes identified as lane change rear-end crashes in the TRW study are probably classified as “miscoded rear-end” and excluded from the family of lane change crashes, or classified as “other and unknown,” in the present study. The distribution of crashes by causal factor showed that most LCM crashes occur on level straight roads, in clear weather, on dry roadway surfaces, in daylight, and not near an intersection. No obvious causal factors were found. The statistical analysis, similarly, did not yield any probable associations between LCM crashes and causal factors. For most scenarios, only the most obvious associations were found to be possible or probable, such as between restraint use and injury severity, between damage severity for one vehicle and for the other, or between surface conditions and weather. The distribution of crash scenarios found from the CDS was different from the distribution found from the GES. This difference is attributed to a bias in the CDS towards more severe crashes (vehicles towed from the scene due to damage).
7
2 DEFINITION AND CLASSIFICATION OF LANE CHANGE CRASHES The universe of the lane change family of crashes, as defined in this study, includes all crashes occurring on the roadway, in which one vehicle encroaches into the travel lane of another vehicle that is initially traveling in the same direction, and on a parallel path. The definition is broader than what is usually understood by the term “lane change crashes,” since, in addition to crashes that occur when one vehicle intentionally changes lanes while traveling straight on a roadway, it includes other lane-encroachment type crashes (see Section 2.1). Note that certain types of crashes are excluded from the definition. The exclusions, and the rationale behind them, are described in Section 2.1. The general principles behind the definition of lane change crashes in this report are:
1. The vehicles involved must initially be traveling on parallel paths in the same direction. If they are on intersecting paths, or traveling in opposite directions, then the collisions are not classified as lane change crashes.
2. The encroachment, whether intentional (as in a typical lane change) or unintended (as in drifting), is the first in a sequence of events leading to the crash. This means that lane encroachment that occurs as a consequence of loss of control due to catastrophic vehicle failure, or lane encroachment that occurs as an avoidance maneuver in response to another crash-imminent situation, are excluded.
In addition, crashes involving more than two vehicles are excluded for reasons of simplicity of crash scenario analysis. The analytical procedure used categorizes lane crashes into scenarios based on the combination of the GES Movement Prior to Critical Event and Critical Event variables; an implicit reconstruction of the crash based on the relatively limited information available in GES. This procedure becomes complicated for crashes involving more than two vehicles, since these crashes are complicated events, and the GES data are not enough to be able to reconstruct the likely sequence of events for these crashes. Based on 1999 GES data, the universe of two-vehicle lane change crashes consists of 539,000 crashes, involving 1,078,000 vehicles. This constitutes about 10% of the 12.1 million vehicles in the 1999 GES, and about 9% of the 6.3 million crashes. The difference between the proportion of crashes and the proportion of vehicles arises from the large share of single-vehicle crashes in GES (such as vehicles overturning or colliding with fixed objects). National estimates produced from GES data may differ from the true values because they are based on a probability sample of crashes and not a census of all crashes. The size of these differences may vary depending on which sample of crashes was selected. Generalized standard errors for estimates of totals are provided in Appendix D of Reference 9. The standard error of an estimate is a measure of the precision or reliability with which an estimate from the GES sample approximates the results of a census. The 1999 GES crash standard error is 400 for a vehicle estimate of 1,000 and 61,400 for a vehicle estimate of 1,000,000. The 95% confidence interval for the estimate of 1,078,000 vehicles involved in lane change crashes would be approximately 948,000 to 1,208,000 vehicles in 1999.
8
2.1 Target Crash Population As described earlier, the lane change family of crashes as defined in this report includes a number of different crash sub-types, which have some key common attributes. To identify the universe of crashes with these attributes, the following sequential procedure was followed [9]:
1. Crashes with the following ranges of values for the Accident Type variable were selected from the 1999 GES (Appendix B of Reference 9): 44-49, and 70-75.
2. Off-roadway crashes from this set of crashes were eliminated, since the present study is concerned with lane change crashes occurring on the roadway only.
3. Crashes involving more than two vehicles were eliminated for ease of analysis, as described earlier.
4. Crashes involving loss of control (Critical Event variable ranging from 01 to 09) were eliminated from the target population. Crashes in which one or more vehicles lose control due to loss of traction on a wet surface or tire failure, and this failure is the immediate cause of lane encroachment, are not within the scope of countermeasures for lane encroachment type crashes; the lane encroachment in these cases is a consequence of another determining event.
5. Crashes involving pedestrians and pedalcyclists, or animals or other objects in the roadway (Critical Event variable ranging from 80 to 92) were eliminated. These were the subject of an earlier IVI study, and involve specific countermeasures that are not within the scope of countermeasures for lane change crashes. More specifically, crashes in which lane encroachment occurs as an avoidance maneuver in response to an imminent crash with a pedestrian, pedalcyclist, animal, or object, does not fall in the general category of crashes in which a lane encroachment (intentional or otherwise) initiates the sequence of events leading to the crash.
6. Crashes involving vehicles initially traveling in opposite direction, or turning into opposite direction (Critical Event variable = 54, 62, 63, 67, 71, 72), or cases in which it is not clear if the vehicles were initially traveling in opposite directions or the same direction (Critical Event variable = 59, 68, 73, and 78) are eliminated, because they do not conform to the definition of lane change crashes.
7. Crashes of Accident Type = 74-75 and involving one or both vehicles turning (Critical Event variable = 15 or 16, or Movement Prior to Critical Event variable = 10 or 11) are eliminated, since it is not clear in these cases if the vehicles are initially traveling in the same direction or in opposite directions.
8. Crashes in which it appears the vehicles were initially traveling in the same lane are eliminated, since it is not clear if these were truly lane change crashes, or rear-end crashes with the Accident Type variable miscoded. Specifically, these are crashes with Critical Event variable = 50, 51, or 52 for one vehicle, and Critical Event variable = 18 or 53 for the other vehicle.
After this sequential process, the remaining population of crashes constitutes the target lane change crash population. Note that the resulting target crash population estimate is a conservative estimate. In all cases, if it is not known, or it cannot be ascertained whether or not the vehicles were initially traveling in
9
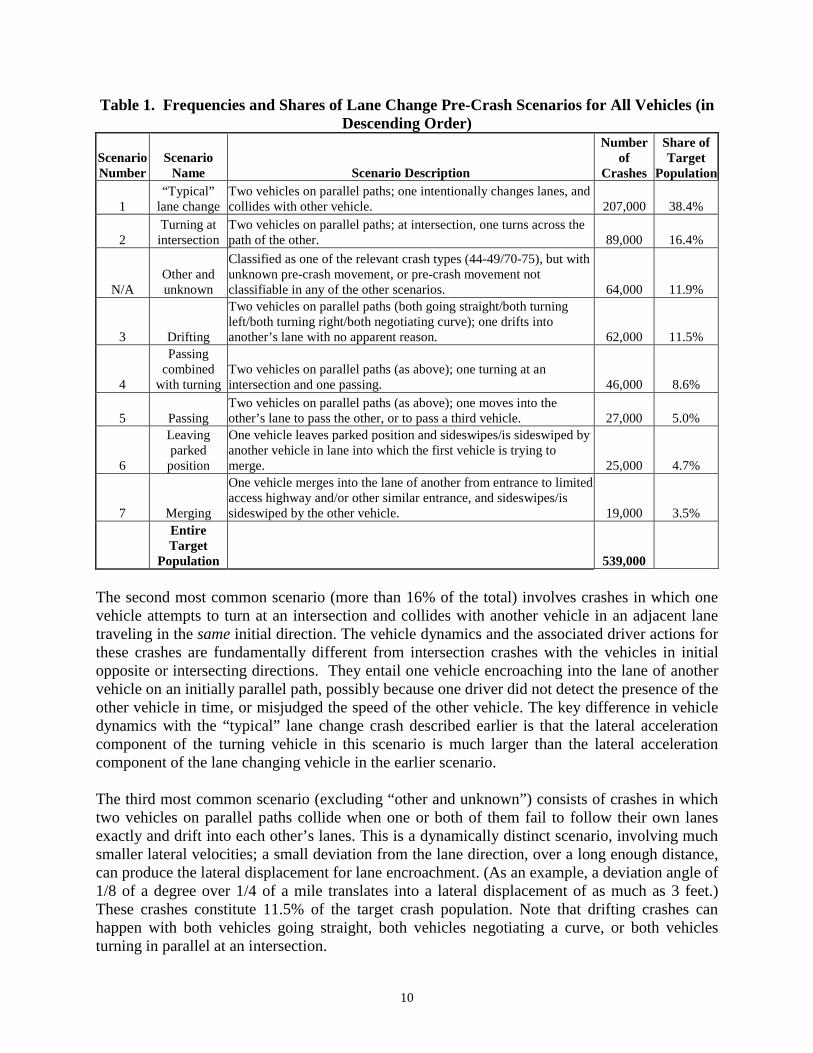
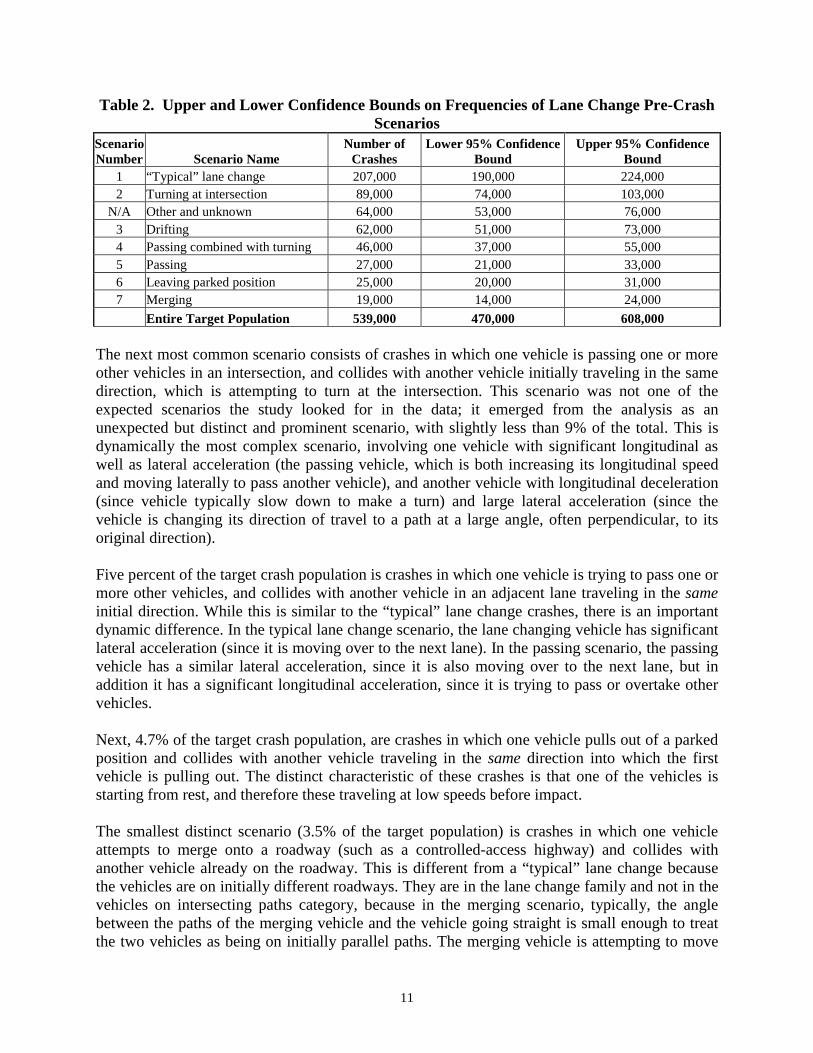
the same direction, the crash is excluded from the target population. Additionally, lane change crashes involving more than two vehicles are left out. Therefore, the target crash population identified in the present study can be thought of as a lower bound for the population of lane change crashes. 2.2 Pre-Crash Scenarios The target crash population was divided into seven pre-crash scenarios (and an additional “Other and Unknown” scenario) based on a combination of the GES Critical Event and Movement Prior to Critical Event variables. The Movement Prior to Critical Event variable describes the vehicle’s activity prior to the driver’s realization of an impending critical event, or just prior to impact, if the driver took no action to attempt any evasive maneuver. These scenarios qualitatively represent the dynamics of the vehicle immediately prior to the collision. Each of these scenarios represents a distinct subset of the lane change family of crashes, characterized by distinct vehicle trajectories and distinct patterns of driver actions. The “other and unknown” scenario includes both crashes in which the pre-crash movement of one or both vehicles could not be determined from the GES data, as well as crashes in which the pre-crash movement could be determined, but there were too few crashes with those characteristics to merit being classified as a distinct scenario. Table 1 defines the most common scenarios of lane change crashes involving all vehicles and shows statistics in descending order of their frequency of occurrence and their frequency relative to the total target crash population. The four most common scenarios (excluding “other and unknown”) constitute 75% of the target crash population. Appendix A provides the GES codes that identify each of the known scenarios in Table 1. Table 2 provides the 95% confidence bounds on GES estimates of crash counts for each of the 8 pre-crash scenarios. The classification of these seven pre-crash scenarios is needed as a basis for the development of performance guidelines and objective test procedures for appropriate countermeasure systems, and for the collection of driver performance data with and without the assistance of these systems to design better warning algorithms and driver-vehicle interfaces and to assess their impact on safety. The most common lane change type crash scenario, expectedly, involves one vehicle changing lanes intentionally, and sideswiping or being sideswiped by a vehicle in the adjacent lane. These crashes constitute more than 38% of the target crash population. The Movement Prior to Critical Event variable for one of the vehicles consistently has the value 15, denoting a lane change; the other vehicle could be going straight, decelerating, accelerating, etc.
10
Table 1. Frequencies and Shares of Lane Change Pre-Crash Scenarios for All Vehicles (in Descending Order)
Scenario Number
Scenario Name Scenario Description
Number of
Crashes
Share of Target
Population
1 “Typical”
lane change Two vehicles on parallel paths; one intentionally changes lanes, and collides with other vehicle. 207,000 38.4%
2 Turning at intersection
Two vehicles on parallel paths; at intersection, one turns across the path of the other. 89,000 16.4%
N/A Other and unknown
Classified as one of the relevant crash types (44-49/70-75), but with unknown pre-crash movement, or pre-crash movement not classifiable in any of the other scenarios. 64,000 11.9%
3 Drifting
Two vehicles on parallel paths (both going straight/both turning left/both turning right/both negotiating curve); one drifts into another’s lane with no apparent reason. 62,000 11.5%
4
Passing combined
with turning Two vehicles on parallel paths (as above); one turning at an intersection and one passing. 46,000 8.6%
5 Passing Two vehicles on parallel paths (as above); one moves into the other’s lane to pass the other, or to pass a third vehicle. 27,000 5.0%
6
Leaving parked
position
One vehicle leaves parked position and sideswipes/is sideswiped by another vehicle in lane into which the first vehicle is trying to merge. 25,000 4.7%
7 Merging
One vehicle merges into the lane of another from entrance to limited access highway and/or other similar entrance, and sideswipes/is sideswiped by the other vehicle. 19,000 3.5%
Entire Target
Population 539,000 The second most common scenario (more than 16% of the total) involves crashes in which one vehicle attempts to turn at an intersection and collides with another vehicle in an adjacent lane traveling in the same initial direction. The vehicle dynamics and the associated driver actions for these crashes are fundamentally different from intersection crashes with the vehicles in initial opposite or intersecting directions. They entail one vehicle encroaching into the lane of another vehicle on an initially parallel path, possibly because one driver did not detect the presence of the other vehicle in time, or misjudged the speed of the other vehicle. The key difference in vehicle dynamics with the “typical” lane change crash described earlier is that the lateral acceleration component of the turning vehicle in this scenario is much larger than the lateral acceleration component of the lane changing vehicle in the earlier scenario. The third most common scenario (excluding “other and unknown”) consists of crashes in which two vehicles on parallel paths collide when one or both of them fail to follow their own lanes exactly and drift into each other’s lanes. This is a dynamically distinct scenario, involving much smaller lateral velocities; a small deviation from the lane direction, over a long enough distance, can produce the lateral displacement for lane encroachment. (As an example, a deviation angle of 1/8 of a degree over 1/4 of a mile translates into a lateral displacement of as much as 3 feet.) These crashes constitute 11.5% of the target crash population. Note that drifting crashes can happen with both vehicles going straight, both vehicles negotiating a curve, or both vehicles turning in parallel at an intersection.
11
Table 2. Upper and Lower Confidence Bounds on Frequencies of Lane Change Pre-Crash Scenarios
Scenario Number Scenario Name
Number of Crashes
Lower 95% Confidence Bound
Upper 95% Confidence Bound
1 “Typical” lane change 207,000 190,000 224,000 2 Turning at intersection 89,000 74,000 103,000
N/A Other and unknown 64,000 53,000 76,000 3 Drifting 62,000 51,000 73,000 4 Passing combined with turning 46,000 37,000 55,000 5 Passing 27,000 21,000 33,000 6 Leaving parked position 25,000 20,000 31,000 7 Merging 19,000 14,000 24,000 Entire Target Population 539,000 470,000 608,000
The next most common scenario consists of crashes in which one vehicle is passing one or more other vehicles in an intersection, and collides with another vehicle initially traveling in the same direction, which is attempting to turn at the intersection. This scenario was not one of the expected scenarios the study looked for in the data; it emerged from the analysis as an unexpected but distinct and prominent scenario, with slightly less than 9% of the total. This is dynamically the most complex scenario, involving one vehicle with significant longitudinal as well as lateral acceleration (the passing vehicle, which is both increasing its longitudinal speed and moving laterally to pass another vehicle), and another vehicle with longitudinal deceleration (since vehicle typically slow down to make a turn) and large lateral acceleration (since the vehicle is changing its direction of travel to a path at a large angle, often perpendicular, to its original direction). Five percent of the target crash population is crashes in which one vehicle is trying to pass one or more other vehicles, and collides with another vehicle in an adjacent lane traveling in the same initial direction. While this is similar to the “typical” lane change crashes, there is an important dynamic difference. In the typical lane change scenario, the lane changing vehicle has significant lateral acceleration (since it is moving over to the next lane). In the passing scenario, the passing vehicle has a similar lateral acceleration, since it is also moving over to the next lane, but in addition it has a significant longitudinal acceleration, since it is trying to pass or overtake other vehicles. Next, 4.7% of the target crash population, are crashes in which one vehicle pulls out of a parked position and collides with another vehicle traveling in the same direction into which the first vehicle is pulling out. The distinct characteristic of these crashes is that one of the vehicles is starting from rest, and therefore these traveling at low speeds before impact. The smallest distinct scenario (3.5% of the target population) is crashes in which one vehicle attempts to merge onto a roadway (such as a controlled-access highway) and collides with another vehicle already on the roadway. This is different from a “typical” lane change because the vehicles are on initially different roadways. They are in the lane change family and not in the vehicles on intersecting paths category, because in the merging scenario, typically, the angle between the paths of the merging vehicle and the vehicle going straight is small enough to treat the two vehicles as being on initially parallel paths. The merging vehicle is attempting to move
12
over laterally to the next lane, much like a vehicle changing lanes, and unlike a vehicle on an intersecting path. The “other and unknown” scenario accounts for almost 12% of the target crash population. It is not included in most of the subsequent analyses, because it is not a distinct scenario with typical vehicle dynamics; rather, it is a collection of crashes in which the vehicle dynamics are unknown, or includes crashes that could not be categorized in the above seven scenarios. Specifically, it includes the following three types of lane change crashes:
1. Crashes in which the vehicle movement prior to the crash is not known from the GES data (Movement Prior to Critical Event variable = 97 or 99, or Critical Event variable = 98 or 99), for one or both vehicles.
2. Crashes in which the prior movement codes are contradictory or confusing, making it hard to determine what happened. This is not a hard situation to imagine, considering that crashes are complex events, and this study attempts to reconstruct them based on a handful of codes in a data base.
3. Crashes which are in a dynamically distinct group, but which are too few in number to merit classification in a scenario of their own. For example, the “other and unknown” category includes crashes in which one vehicle changes lanes and rear-ends another vehicle going straight in its new lane, a dynamically distinct scenario, but constituting only 0.8% of the target population.
13
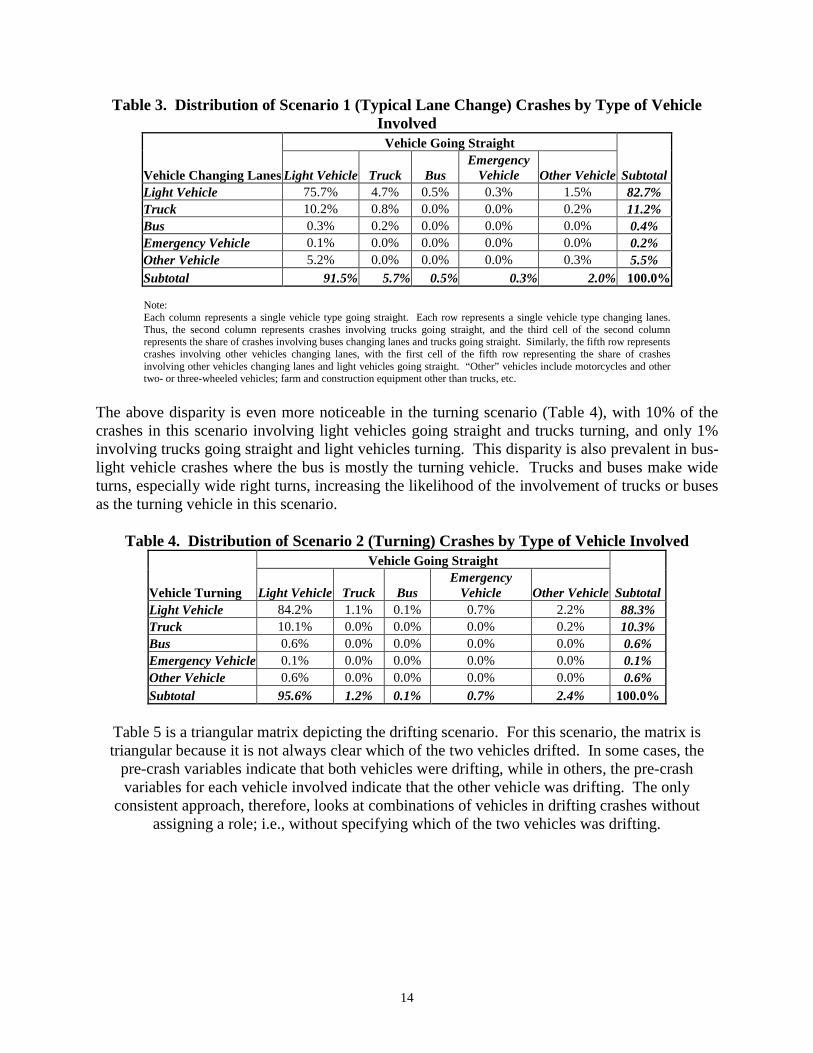
3 STATISTICAL DESCRIPTION OF LANE CHANGE CRASH SCENARIOS This section shows the statistical distribution of the pre-crash scenarios identified in Section 2, with respect to the relative involvement of different vehicle types; the distribution of these crashes by roadway physical environment; the distribution of these crashes by driver and environmental factors that may have contributed to the crash; and the distribution of these crashes by maximum injury severity. Each of these distributions is valuable in understanding the dynamics of these crashes and designing countermeasures. 3.1 Vehicle Type Distribution for Pre-Crash Scenarios Knowing the relative involvement of different vehicle types for the various scenarios is useful for many reasons. It is important to know what proportion of the crashes involves light vehicles. (Note, these include crashes in which only one of the two vehicles involved is a light vehicle.) Additionally, it is useful to know a quantitative distribution of the other vehicle types with which light vehicles are colliding in lane change crashes, as well as the relative distribution of light vehicles between the different roles in the lane change crash scenarios (i.e., lane-changing vehicle versus vehicle going straight), to better understand of the dynamics of lane change crashes involving light vehicles, and to prioritize problems that need to be addressed by the countermeasures developed. The seven distinct scenarios described in Table 1 (excluding “other and unknown”) were examined for the distribution of vehicle types involved, to detect any pattern of the higher involvement of specific types of vehicles in crashes in any of these scenarios. The five types of vehicles considered in the analysis were the four vehicle platforms included in the scope of the IVI (light vehicles, trucks, buses, and specialty vehicles), and other vehicles (i.e., vehicles not included in these four categories such as motorcycles and farm and construction vehicles other than trucks). Tables 3 through 9 show the results of the analysis. It should be noted that the “specialty vehicle” type is referred to as the “emergency vehicle” in these tables because the GES enables the identification of only the specialty vehicles that were coded under “emergency use”. The dominance of crashes involving two light vehicles is unsurprising, considering that light vehicles dominate the roadway in terms of number of vehicles, vehicle miles traveled, or any other criterion. What are of interest in these numbers are the differences between the scenarios in the relative prominence of some of the other combinations. Table 3 shows that a large share (10%) of typical lane change crashes involve trucks changing lanes and light vehicles going straight. In contrast, 4.7% of the crashes in this scenario involve the reverse combination, trucks going straight and light vehicles changing lanes. This is attributed to the fact that trucks are large vehicles, more likely to collide with a vehicle in an adjacent lane while moving over to the next lane.
14
Table 3. Distribution of Scenario 1 (Typical Lane Change) Crashes by Type of Vehicle Involved
Vehicle Going Straight
Vehicle Changing Lanes Light Vehicle Truck Bus Emergency
Vehicle Other Vehicle Subtotal Light Vehicle 75.7% 4.7% 0.5% 0.3% 1.5% 82.7% Truck 10.2% 0.8% 0.0% 0.0% 0.2% 11.2% Bus 0.3% 0.2% 0.0% 0.0% 0.0% 0.4% Emergency Vehicle 0.1% 0.0% 0.0% 0.0% 0.0% 0.2% Other Vehicle 5.2% 0.0% 0.0% 0.0% 0.3% 5.5% Subtotal 91.5% 5.7% 0.5% 0.3% 2.0% 100.0% Note: Each column represents a single vehicle type going straight. Each row represents a single vehicle type changing lanes. Thus, the second column represents crashes involving trucks going straight, and the third cell of the second column represents the share of crashes involving buses changing lanes and trucks going straight. Similarly, the fifth row represents crashes involving other vehicles changing lanes, with the first cell of the fifth row representing the share of crashes involving other vehicles changing lanes and light vehicles going straight. “Other” vehicles include motorcycles and other two- or three-wheeled vehicles; farm and construction equipment other than trucks, etc.
The above disparity is even more noticeable in the turning scenario (Table 4), with 10% of the crashes in this scenario involving light vehicles going straight and trucks turning, and only 1% involving trucks going straight and light vehicles turning. This disparity is also prevalent in bus-light vehicle crashes where the bus is mostly the turning vehicle. Trucks and buses make wide turns, especially wide right turns, increasing the likelihood of the involvement of trucks or buses as the turning vehicle in this scenario.
Table 4. Distribution of Scenario 2 (Turning) Crashes by Type of Vehicle Involved Vehicle Going Straight
Vehicle Turning Light Vehicle Truck Bus Emergency
Vehicle Other Vehicle SubtotalLight Vehicle 84.2% 1.1% 0.1% 0.7% 2.2% 88.3% Truck 10.1% 0.0% 0.0% 0.0% 0.2% 10.3% Bus 0.6% 0.0% 0.0% 0.0% 0.0% 0.6% Emergency Vehicle 0.1% 0.0% 0.0% 0.0% 0.0% 0.1% Other Vehicle 0.6% 0.0% 0.0% 0.0% 0.0% 0.6% Subtotal 95.6% 1.2% 0.1% 0.7% 2.4% 100.0%
Table 5 is a triangular matrix depicting the drifting scenario. For this scenario, the matrix is triangular because it is not always clear which of the two vehicles drifted. In some cases, the
pre-crash variables indicate that both vehicles were drifting, while in others, the pre-crash variables for each vehicle involved indicate that the other vehicle was drifting. The only
consistent approach, therefore, looks at combinations of vehicles in drifting crashes without assigning a role; i.e., without specifying which of the two vehicles was drifting.
15
Table 5. Distribution of Scenario 3 (Drifting) Crashes by Type of Vehicle Involved1
Vehicle 2
Vehicle 1 Light Vehicle Truck Bus Emergency
Vehicle Other Vehicle Subtotal2 Light Vehicle 70.1% 12.8% 4.8% 0.5% 8.1% 96.3% Truck n/a 1.5% 0.5% 0.4% 0.7% 15.9% Bus n/a n/a 0.0% 0.0% 0.5% 5.8% Emergency Vehicle n/a n/a n/a 0.0% 0.0% 0.9% Other Vehicle n/a n/a n/a n/a 0.0% 9.4% Subtotal
Notes: 1 For this scenario, the matrix is triangular, because it is not always clear which of the two vehicles drifted. In some cases, the pre-crash variables indicate that both vehicles were drifting, while in others, the pre-crash variables for each vehicle involved indicate that the other vehicle was drifting. The only consistent approach, therefore, looks at combinations of vehicles in drifting crashes without assigning a role; i.e., without specifying which of the two vehicles was drifting. 2 This is not a simple row subtotal. Rather, it represents the sum of all crashes in which one or both vehicles were of the type specified by the row. Hence, the column adds up to greater than 100%.
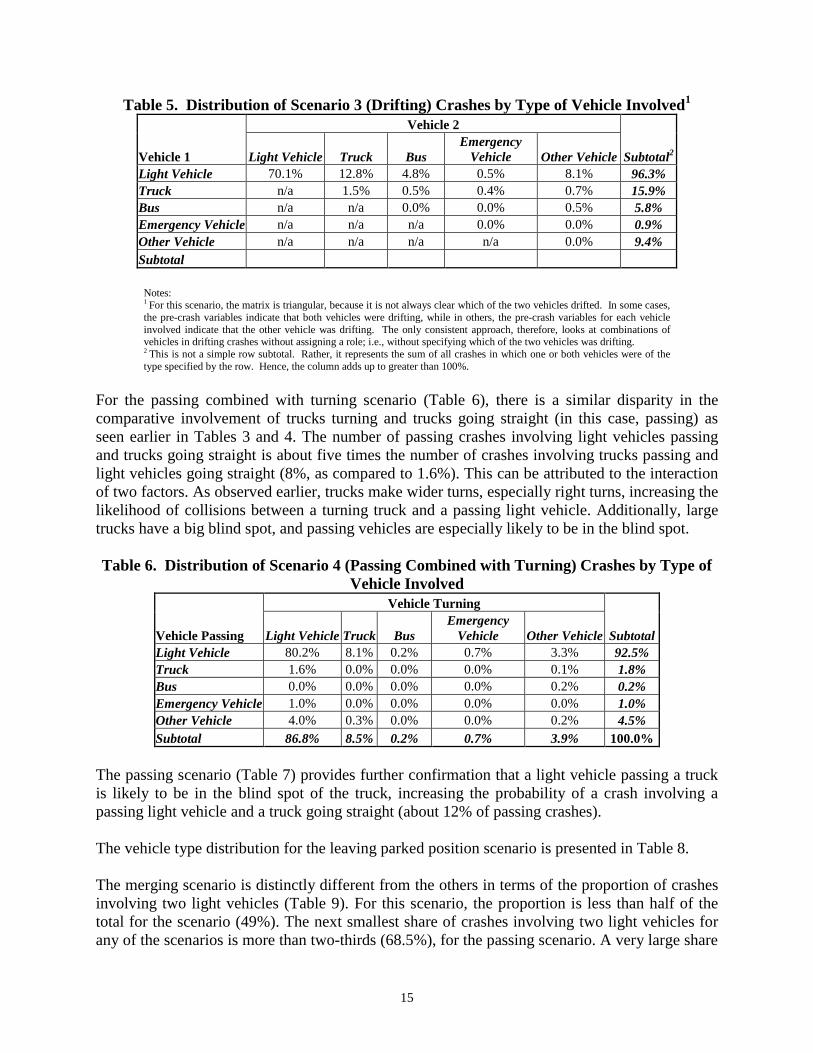
For the passing combined with turning scenario (Table 6), there is a similar disparity in the comparative involvement of trucks turning and trucks going straight (in this case, passing) as seen earlier in Tables 3 and 4. The number of passing crashes involving light vehicles passing and trucks going straight is about five times the number of crashes involving trucks passing and light vehicles going straight (8%, as compared to 1.6%). This can be attributed to the interaction of two factors. As observed earlier, trucks make wider turns, especially right turns, increasing the likelihood of collisions between a turning truck and a passing light vehicle. Additionally, large trucks have a big blind spot, and passing vehicles are especially likely to be in the blind spot. Table 6. Distribution of Scenario 4 (Passing Combined with Turning) Crashes by Type of
Vehicle Involved Vehicle Turning
Vehicle Passing Light Vehicle Truck Bus Emergency
Vehicle Other Vehicle SubtotalLight Vehicle 80.2% 8.1% 0.2% 0.7% 3.3% 92.5% Truck 1.6% 0.0% 0.0% 0.0% 0.1% 1.8% Bus 0.0% 0.0% 0.0% 0.0% 0.2% 0.2% Emergency Vehicle 1.0% 0.0% 0.0% 0.0% 0.0% 1.0% Other Vehicle 4.0% 0.3% 0.0% 0.0% 0.2% 4.5% Subtotal 86.8% 8.5% 0.2% 0.7% 3.9% 100.0%
The passing scenario (Table 7) provides further confirmation that a light vehicle passing a truck is likely to be in the blind spot of the truck, increasing the probability of a crash involving a passing light vehicle and a truck going straight (about 12% of passing crashes). The vehicle type distribution for the leaving parked position scenario is presented in Table 8. The merging scenario is distinctly different from the others in terms of the proportion of crashes involving two light vehicles (Table 9). For this scenario, the proportion is less than half of the total for the scenario (49%). The next smallest share of crashes involving two light vehicles for any of the scenarios is more than two-thirds (68.5%), for the passing scenario. A very large share
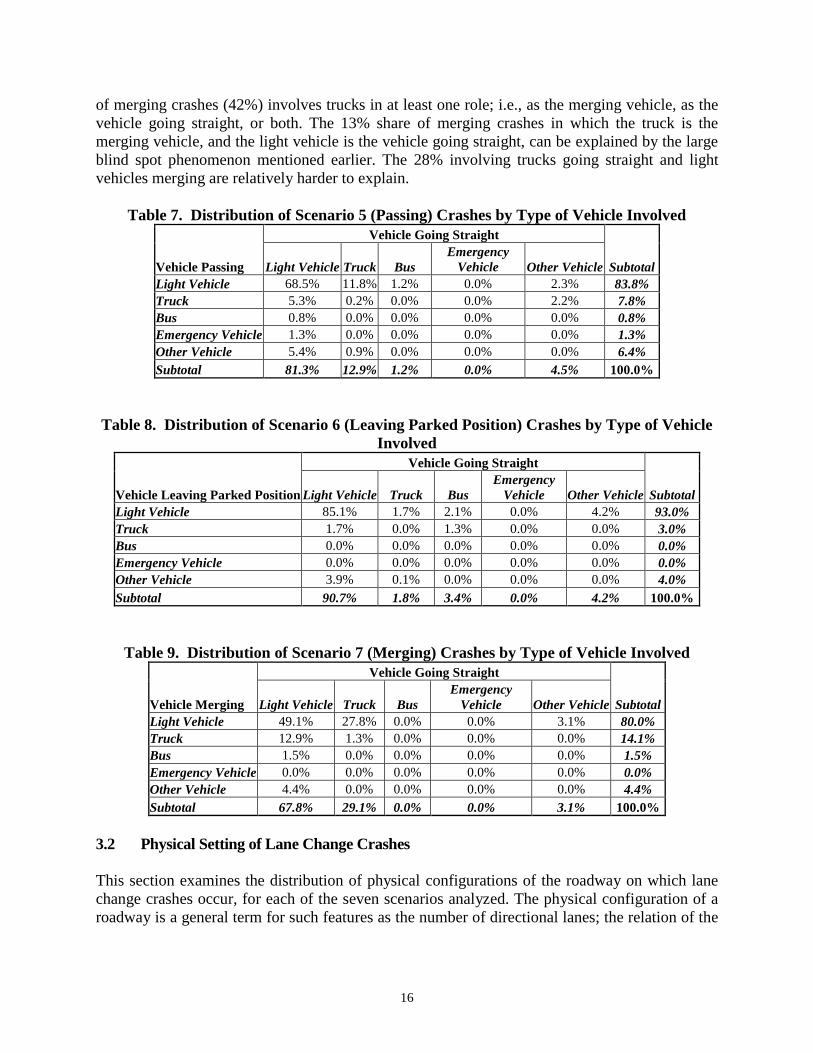
16
of merging crashes (42%) involves trucks in at least one role; i.e., as the merging vehicle, as the vehicle going straight, or both. The 13% share of merging crashes in which the truck is the merging vehicle, and the light vehicle is the vehicle going straight, can be explained by the large blind spot phenomenon mentioned earlier. The 28% involving trucks going straight and light vehicles merging are relatively harder to explain.
Table 7. Distribution of Scenario 5 (Passing) Crashes by Type of Vehicle Involved Vehicle Going Straight
Vehicle Passing Light Vehicle Truck Bus Emergency
Vehicle Other Vehicle SubtotalLight Vehicle 68.5% 11.8% 1.2% 0.0% 2.3% 83.8% Truck 5.3% 0.2% 0.0% 0.0% 2.2% 7.8% Bus 0.8% 0.0% 0.0% 0.0% 0.0% 0.8% Emergency Vehicle 1.3% 0.0% 0.0% 0.0% 0.0% 1.3% Other Vehicle 5.4% 0.9% 0.0% 0.0% 0.0% 6.4% Subtotal 81.3% 12.9% 1.2% 0.0% 4.5% 100.0%
Table 8. Distribution of Scenario 6 (Leaving Parked Position) Crashes by Type of Vehicle
Involved Vehicle Going Straight
Vehicle Leaving Parked Position Light Vehicle Truck Bus Emergency
Vehicle Other Vehicle Subtotal Light Vehicle 85.1% 1.7% 2.1% 0.0% 4.2% 93.0% Truck 1.7% 0.0% 1.3% 0.0% 0.0% 3.0% Bus 0.0% 0.0% 0.0% 0.0% 0.0% 0.0% Emergency Vehicle 0.0% 0.0% 0.0% 0.0% 0.0% 0.0% Other Vehicle 3.9% 0.1% 0.0% 0.0% 0.0% 4.0% Subtotal 90.7% 1.8% 3.4% 0.0% 4.2% 100.0%
Table 9. Distribution of Scenario 7 (Merging) Crashes by Type of Vehicle Involved Vehicle Going Straight
Vehicle Merging Light Vehicle Truck Bus Emergency
Vehicle Other Vehicle SubtotalLight Vehicle 49.1% 27.8% 0.0% 0.0% 3.1% 80.0% Truck 12.9% 1.3% 0.0% 0.0% 0.0% 14.1% Bus 1.5% 0.0% 0.0% 0.0% 0.0% 1.5% Emergency Vehicle 0.0% 0.0% 0.0% 0.0% 0.0% 0.0% Other Vehicle 4.4% 0.0% 0.0% 0.0% 0.0% 4.4% Subtotal 67.8% 29.1% 0.0% 0.0% 3.1% 100.0%
3.2 Physical Setting of Lane Change Crashes This section examines the distribution of physical configurations of the roadway on which lane change crashes occur, for each of the seven scenarios analyzed. The physical configuration of a roadway is a general term for such features as the number of directional lanes; the relation of the
17
roadway location to junctions, ramps, etc., where the crash occurs; the posted speed limit; the roadway alignment (i.e., curvature); and the roadway profile (i.e., slope of roadway). Note the following two important differences with earlier studies (Reference 10, for example) in terms of variables analyzed. Roadway type (freeway and non-freeway) was not considered as a variable for analysis, based on the results of an earlier study on off-roadway crashes (Table 6 in Reference 10). Roadway type is not a GES variable; it was derived in the earlier study based on a combination of the Trafficway Flow and Posted Speed Limit variables, and was defined as a divided roadway with a posted speed limit greater than or equal to 55 mph. For some off-roadway crash scenarios, these earlier results showed a small percentage of freeway crashes occurring at intersections. This indicates that the procedure of identifying freeways based on Trafficway Flow and Posted Speed Limit may yield unreliable results for one or more scenarios. The Land Use variable was not analyzed, since it was decided that the distinction between rural and urban environment does not have any direct influence over the frequency or dynamics of lane change crashes. Traffic volume presumably does have an impact, but there is not necessarily a correspondence between traffic volume and land use. 3.2.1 Number of Travel Lanes per Direction The distribution of crashes by number of lanes per direction was examined for each scenario (Table 10). The number of lanes per direction was chosen, rather than the total number of lanes, because the study focuses on lane change crashes in particular, defined as crashes which occur when one vehicle encroaches into the path of another vehicle initially on a parallel path with the first vehicle and traveling in the same direction. The number of lanes per direction is not a variable directly provided by GES. It is derived based on a combination of the Trafficway Flow and Number of Lanes variables. As explained in Reference 9, the Number of Lanes variable represents the number of lanes per direction for a divided roadway, and the total number of lanes for an undivided roadway. (For a one-way roadway, of course, the number of lanes per direction and the total number of lanes are one and the same thing.) Hence, for undivided roadways, the Number of Lanes variable was divided by two to yield the number of directional lanes. Note that the number of lanes per direction need not be an integer. Sometimes, a roadway has unequal number of lanes between the two directions. Because of the way in which the Number of Lanes variable is defined for an undivided roadway, the derived result based on GES data will yield a non-integer number. (Of course, a non-integer number of lanes is not significant. For a crash occurring on the two-lane side of an undivided roadway with two lanes in one direction and one lane in the other, the correct number of directional lanes for this crash is, of course, two. But the estimation procedure based on GES data will yield 1.5 lanes per direction. This demonstrates the limitation of using a data base like the GES for this type of analysis. General trends can be analyzed, but the detailed information available from crash investigations is not available from GES data analysis.) As expected, typical lane change crashes are distributed fairly evenly for number of lanes per direction greater than 1, falling off for number of lanes per direction greater than 3. The latter probably reflects the fact that few roadways have more than three lanes per direction. The small
18
percentage of typical lane change crashes occurring when the number of lanes equals 1 may partly reflect coding errors in the data, and may partly reflect that, for many minor rural (and even urban) roadways, lane markings are not necessarily clear, and a wide lane in one direction may be mistaken for two lanes by some drivers, who will attempt to “change” lanes to one side of the same lane. This last phenomenon of multilane driving behavior on the part of drivers on single directional lane roadways is probably a large factor for the passing-turning and passing crashes, with more than half of the former occurring on roadways with lanes/direction equaling 1. The leaving parked position crashes, expectedly, occur more on roadways with fewer lanes per direction, and drop off rapidly with increasing lanes per direction. Similarly, the merging crashes show exactly the reverse pattern, with the highest share occurring on roadways with greater than 3 lanes as compared to any scenario. This is an indication that roadside parking is typically a feature of narrow urban streets with few lanes, and merging is typically a feature of freeways. 3.2.2 Relation to Junction The distribution of crashes with respect to the GES Relation to Junction variable was found for each scenario (Table 11). Several simplifications and aggregations were made in the analysis. The distinction between non-interchange area and interchange area (see Reference 9) was dropped, and several of the codes were grouped together. Specifically, intersection (codes 1 and 11) and intersection-related (codes 2 and 12) were combined into the “intersection” category in Table 11. Similarly, five distinct codes from the GES (rail grade crossing, bridge, crossover-related, other, and unknown) were combined into the “other and unknown” category. A large majority of typical lane change crashes occurred on non-junction roadways, which is to be expected, since drivers would typically change lanes in between intersections. While most turning at intersection crashes (71%) expectedly occur at intersections, note that a significant share of them also occur at driveways. Evidently, turning into driveways and parking lot entrances are being coded as turning movements in the GES. The same phenomenon is seen for the passing-turning scenario. Very small shares of both the turning and passing-turning crashes are seen to occur at non-junction locations (or, in the case of the former scenario, at ramp locations), which obviously shows coding errors in the data. A similar coding error is seen with the small share of leaving parked position crashes occurring at ramp locations. The dominant share of leaving parked position crashes (about 78%) occur in non-junction areas, which is another expected result. The merging scenario yields some counterintuitive results. As expected, this is the only scenario for which a significant share of crashes occur at ramp locations. The 27% of merging crashes occurring at intersection locations, and the 4% occurring at driveways, can be explained by lack of rigor in coding results, since it is conceivable that right turns at intersections (especially right turns on a red light) may be interpreted as merging movements. Similarly, pulling out of driveways into traffic may be interpreted as merging. However, the largest share of merging
19
crashes (almost 40%) occur in non-junction locations, and these are the hardest to explain. One possibility is the lack of precision in defining the ramp location. The average distribution for all 7 scenarios combined (excluding “other and unknown”) is dominated by intersection and non-junction locations, which account for 83% of classifiable lane change crashes. 3.2.3 Posted Speed Limit The distribution of crashes by the GES Speed Limit variable (Table 12) paints a broad picture of the travel speeds associated with lane change crashes. The posted speed limit does not provide a direct reliable indication of the speed at which the vehicles involved were actually traveling. The Travel Speed variable was not analyzed in this report because it is, in most cases, unknown. The results in Table 12 show that nearly 74% of the crashes occurred on roadways with speed limits less than or equal to 45 mph (excluding the unknown). 3.2.4 Roadway Alignment and Profile The results for crash distribution by roadway alignment and profile (Tables 13 and 14) provide no denominator information; i.e., information on how much driving occurs on roadway segments with different alignments and profiles. Without such information, it is impossible to tell if a disproportionate share of lane change crashes as a whole, or crashes in one particular scenario, are occurring on roadways with a particular type of alignment or profile. Besides, drivers may adjust their behaviors in response to roadway conditions, and try to change lanes less frequently on a curved road – another factor that cannot be accounted for in this analysis. However, a few interesting observations can be made regarding both distributions. Table 13 shows that, of all the scenarios, the drifting scenario is the one with the relative largest share of crashes on curved roadway. This shows that following a traffic lane on a curved road is a more difficult driving task than, say, turning at an intersection on a curved road. The relatively large share (compared to other scenarios) of lane change, passing, passing-turning, and merging crashes occurring on grade/hill segments of roadway (Table 14) may be an indication of the difficulty of visual determination of following vehicles in an adjacent lane, especially on a downward slope. 3.3 Driver and Environmental Contributing Factors This analysis relied on 1999 GES variables to identify factors that might have contributed to the cause of target lane change crashes. Note that the GES does not contain variables that indicate the primary cause of the crash. However, GES does provide data on driver behavior and environmental conditions that might have contributed to the crash. Therefore, some 1999 GES variables were investigated that point to a number of crash contributing factors including the Police Reported Alcohol Involvement, Person’s Physical Impairment, Driver Distracted By, Driver Vision Obscured By, Speed Related, Sign Violation Charged, Other Violations Charged, and Hit and Run variables.
20
The Police Reported Alcohol Involvement variable indicates that a driver had consumed an alcoholic beverage. The Person’s Physical Impairment variable attempts to identify driver physical impairments that may have contributed to the cause of the crash such as illness, blackouts, drowsiness, fatigue, or impairment due to previous injury. The Driver Distracted By variable attempts to capture distractions that may have influenced driver performance and contributed to the cause of the crash. These distractions include passengers, vehicle instrument display, phone, other internal distractions, other crash, or external distractions. The Driver Vision Obscured By variable attempts to capture the presence of factors that may have prevented the driver from seeing other vehicles, and therefore, may have contributed to the crash, such as rain, snow, smoke, sand or dust; glare, sunlight, or headlights; curve in roadway or hill; and buildings, trees, moving vehicles, parked vehicles, etc. The Speed Related variable captures whether or not vehicle speed was a factor in the crash. The Sign Violation Charged variable in this analysis is a subset of the Violations Charged variable in the GES, specifically including codes 6 and 7; i.e., Failure to Yield Right of Way and Running a Traffic Signal or Stop Sign, respectively [9]. The Other Violations Charged variable in the analysis is another subset of the Violations Charged variable in the GES, specifically including codes 5, 97, and 98 (Driving with Suspended/Revoked License, Violation Charged – No Details, and Other Violation, respectively). Note that the remaining codes (except Unknown) in the GES Violations Charged variable (namely alcohol, drugs, speeding, reckless driving, and hit and run) are covered in other analysis variables in the present study. The Hit and Run variable is coded when a motor vehicle in transport or its driver departs from the scene of the crash. If the driver leaves the scene, with or without the vehicle, the police accident report typically contains little information about the drivers’ actions, and therefore, contributing factors are generally unknown. However, a few cases of hit-and-run crashes in the GES might contain information (typically reported by eyewitnesses) on whether or not the driver was drunk or impaired. This analysis deducted one dominant contributing factor for each crash based on a priority scheme that ranked contributing factors in descending order:
• Alcohol or drugs • Driver impairment • Driver distraction • Driver vision obscured • Speeding • Sign violation
21
• Other violation • Hit and run
First, this analysis determined the portion of target lane change crashes that involved alcohol or drugs and then adopted a process of elimination to quantify the involvement of other factors [10]. Thus, the remaining target lane change crashes were examined to identify the portion of crashes that were attributed to driver impairment. After, the involvement of each of the other factors (driver distraction, driver vision obscured, speeding, and hit and run) was sequentially determined from the remaining crashes. Finally, the remaining crashes, not linked to any of these contributing factors, were separated by various environmental factors to establish other circumstances that might have potentially contributed to target lane change crashes. Thus, this approach is an attempt to identify dominant factors that might have contributed to the cause of the crash by deductive reasoning and not to describe the environmental circumstances of the crash. This analysis considered the combination of the Light Condition and Atmospheric Conditions variables from the 1999 GES. The Light Condition variable denotes general light conditions at the time of the crash, taking into account the existence of external roadway illumination fixtures. All non-daylight conditions, including dark but lighted, dusk, and dawn, were grouped as “night.” The Atmospheric Conditions variable points to general atmospheric conditions at the time of the crash such as clear or adverse weather. All adverse weather conditions—rain, sleet, snow, fog, and smog—were categorized as “adverse.” The combination of lighting and weather conditions constitute another important crash contributing factor, both of which may make it difficult to see other vehicles, or estimate their distance and rate of approach. 3.3.1 Driver Contributing Factors The most noticeable feature of the distribution of driver contributing factors for target lane change crashes (Table 15) is the disparity between the vehicle going straight and the vehicle encroaching (for all applicable scenarios), in the share of drivers for whom one of the factors considered could be identified. For example, in the typical lane change scenario, only about 7% of the drivers going straight had identifiable driver contributing factors, while as many as 65% of the drivers changing lanes had identifiable driver contributing factors. Overall, only about 36% of drivers involved in lane change crashes had identifiable driver factors. Of the different driver contributing factors, the most significant factor for the encroaching vehicle in most scenarios is driver distraction. Driver distraction occurs in more than 20% of lane changing/passing/merging/turning drivers in 4 scenarios and has a high share of 31% for the driver leaving a parked position, in the leaving parked position scenario. Driver distraction accounts for over 10% for the drifting scenario, and for the turning driver in the combined passing-turning scenario. The only other driver contributing factor in Table 15 that has numerical significance for a sizable number of scenarios is Other Violations Charged. Other violations include driving with a suspended or revoked license, failure to yield right of way, and other violations with no available
22
details. Some violations cited, such as driving with a suspended or revoked license, are not analytically significant as they are not likely to be a crash contributing factor. A sizable number of hit-and-run cases occur for the lane changing driver in the typical lane change scenario (12%), and the passing driver in the passing scenario (18%). In all of these cases, the study can safely assume that there was some violation on the part of the driver who left the scene. Alcohol/drugs and speeding/reckless driving, were insignificant for most cases, with their largest share being only 4% and 3%, respectively, both for the passing drivers in the passing scenario. Sign violations are similarly insignificant, with their largest shares being for the driver leaving a parked position in the leaving parked position scenario, and the merging driver in the merging scenario (6% in both cases). The overall conclusions are that:
1. Driver distraction is a significant contributor to lane change crashes. 2. The GES data base does not specify the violations charged for a large number of
crash-involved drivers. 3. A large share of lane change crashes show no identifiable driver contributing factors,
particularly for the driver going straight. 3.3.2 Environmental Contributing Factors The remainder of vehicles in lane change crashes (for which driver contributing factors could not be identified) was analyzed for potential environmental contributing factors (Table 16). It was found that the large majority of these crashes (about 73%) occurred in daylight with no adverse weather conditions. This implies that for these vehicles, in addition to no identifiable driver contributing factors, there were no identifiable adverse environmental conditions that may have contributed to the crash. The implication is that for these vehicles, there is no clear crash contributor, since neither driver behavior nor environmental conditions appear to have contributed to the crash, as coded in the GES. Generally, the GES underestimates driver distraction/inattention as a contributing factor because distraction/inattention is rarely noted in police accident reports. The CDS usually reports higher rates of driver distraction/inattention than in the GES. (Note that even for the hit-and-run cases, while the exact driver factor associated with the vehicle is unknown, it is safe to assume that in most instances there is likelihood of there being some violation on part of the driver, which may explain their hurry to leave the scene before the arrival of the police.) The lowest share of day clear conditions is for the drifting scenario (61%), suggesting the possibility that poor visibility (whether at night or because of adverse weather) can contribute to drifting. Similarly, the share of night and/or adverse conditions is also high for the vehicle going straight in the passing scenario. This suggests that difficulty in timely observation of passing vehicles at night or in adverse weather conditions may be a factor contributing to passing crashes.
23
3.4 Maximum Injury Severity The maximum injury severity was determined using the GES Maximum Injury Severity in Crash variable. This variable indicates the most severe injury sustained by any person involved in the crash, excluding unknown values. For example, if there are three persons involved in a crash, and one is killed, one has a non-incapacitating injury, and one is unhurt, the Maximum Injury Severity will have the value of fatal injury. Table 17 provides the distribution of maximum injury severity sustained in lane change crashes based on the 1999 GES, broken out by scenario, and by type of vehicle movement within each scenario. Depending on the scenario and vehicle movement, between about 85% and 97% of lane change crashes had no known injury (i.e., either it was known that no one was injured, or it was not known if anyone was injured). The crashes in which it was definitely known that no one was injured varied from approximately 79% to 91%, again depending on the scenario and the vehicle movement. This shows that crashes involving injuries are relatively rare events. Fatal crashes are even rarer events, with a total of 449 fatal crashes out of a target crash population of 539,000 or less than 0.1% of lane change crashes result in fatalities. The particular combinations of crash scenarios with vehicle movements seen to result in the largest share of known injuries (excluding no injury, no person coded, and unknown), are the “passing” and the “turning” movements associated with the passing-turning scenario, and the “going straight and other” movement associated with the turning at intersection scenario.
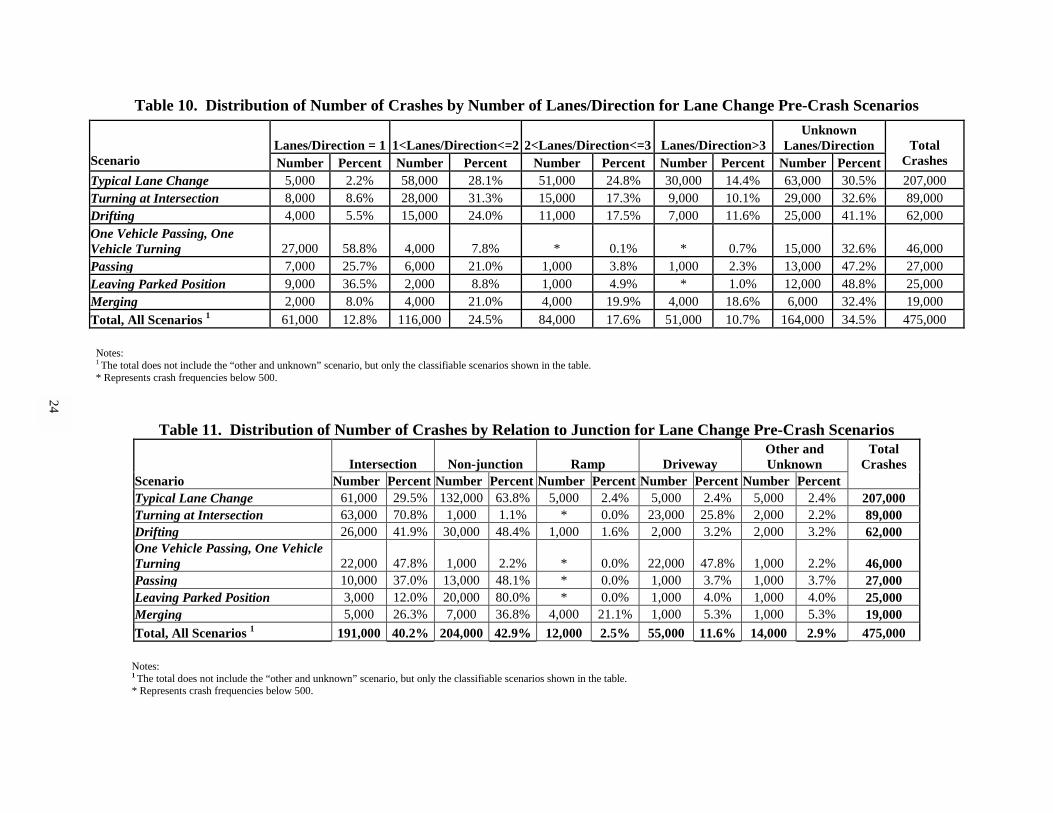
Table 10. Distribution of Number of Crashes by Number of Lanes/Direction for Lane Change Pre-Crash Scenarios
Notes: 1 The total does not include the “other and unknown” scenario, but only the classifiable scenarios shown in the table. * Represents crash frequencies below 500.
Table 11. Distribution of Number of Crashes by Relation to Junction for Lane Change Pre-Crash Scenarios
Intersection Non-junction Ramp Driveway Other and Unknown
Total Crashes
Scenario Number Percent Number Percent Number Percent Number Percent Number Percent Typical Lane Change 61,000 29.5% 132,000 63.8% 5,000 2.4% 5,000 2.4% 5,000 2.4% 207,000 Turning at Intersection 63,000 70.8% 1,000 1.1% * 0.0% 23,000 25.8% 2,000 2.2% 89,000 Drifting 26,000 41.9% 30,000 48.4% 1,000 1.6% 2,000 3.2% 2,000 3.2% 62,000 One Vehicle Passing, One Vehicle Turning 22,000 47.8% 1,000 2.2% * 0.0% 22,000 47.8% 1,000 2.2% 46,000 Passing 10,000 37.0% 13,000 48.1% * 0.0% 1,000 3.7% 1,000 3.7% 27,000 Leaving Parked Position 3,000 12.0% 20,000 80.0% * 0.0% 1,000 4.0% 1,000 4.0% 25,000 Merging 5,000 26.3% 7,000 36.8% 4,000 21.1% 1,000 5.3% 1,000 5.3% 19,000 Total, All Scenarios 1 191,000 40.2% 204,000 42.9% 12,000 2.5% 55,000 11.6% 14,000 2.9% 475,000
Notes:
1 The total does not include the “other and unknown” scenario, but only the classifiable scenarios shown in the table. * Represents crash frequencies below 500.
Lanes/Direction = 1 1<Lanes/Direction<=2 2<Lanes/Direction<=3 Lanes/Direction>3 Unknown
Lanes/Direction Scenario Number Percent Number Percent Number Percent Number Percent Number Percent
Total Crashes
Typical Lane Change 5,000 2.2% 58,000 28.1% 51,000 24.8% 30,000 14.4% 63,000 30.5% 207,000 Turning at Intersection 8,000 8.6% 28,000 31.3% 15,000 17.3% 9,000 10.1% 29,000 32.6% 89,000 Drifting 4,000 5.5% 15,000 24.0% 11,000 17.5% 7,000 11.6% 25,000 41.1% 62,000 One Vehicle Passing, One Vehicle Turning 27,000 58.8% 4,000 7.8% * 0.1% * 0.7% 15,000 32.6% 46,000 Passing 7,000 25.7% 6,000 21.0% 1,000 3.8% 1,000 2.3% 13,000 47.2% 27,000 Leaving Parked Position 9,000 36.5% 2,000 8.8% 1,000 4.9% * 1.0% 12,000 48.8% 25,000 Merging 2,000 8.0% 4,000 21.0% 4,000 19.9% 4,000 18.6% 6,000 32.4% 19,000 Total, All Scenarios 1 61,000 12.8% 116,000 24.5% 84,000 17.6% 51,000 10.7% 164,000 34.5% 475,000
24
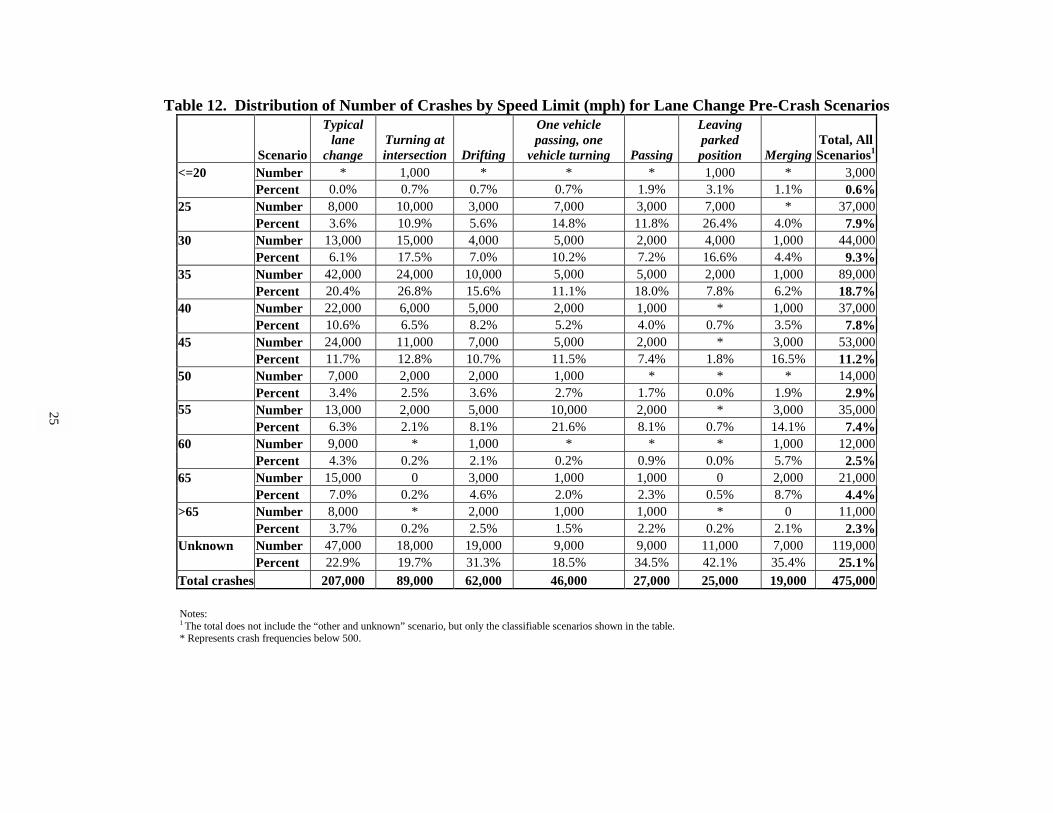
Table 12. Distribution of Number of Crashes by Speed Limit (mph) for Lane Change Pre-Crash Scenarios
Scenario
Typical lane
change Turning at intersection Drifting
One vehicle passing, one
vehicle turning Passing
Leaving parked position Merging
Total, All Scenarios1
<=20 Number * 1,000 * * * 1,000 * 3,000 Percent 0.0% 0.7% 0.7% 0.7% 1.9% 3.1% 1.1% 0.6% 25 Number 8,000 10,000 3,000 7,000 3,000 7,000 * 37,000 Percent 3.6% 10.9% 5.6% 14.8% 11.8% 26.4% 4.0% 7.9% 30 Number 13,000 15,000 4,000 5,000 2,000 4,000 1,000 44,000 Percent 6.1% 17.5% 7.0% 10.2% 7.2% 16.6% 4.4% 9.3% 35 Number 42,000 24,000 10,000 5,000 5,000 2,000 1,000 89,000 Percent 20.4% 26.8% 15.6% 11.1% 18.0% 7.8% 6.2% 18.7% 40 Number 22,000 6,000 5,000 2,000 1,000 * 1,000 37,000 Percent 10.6% 6.5% 8.2% 5.2% 4.0% 0.7% 3.5% 7.8% 45 Number 24,000 11,000 7,000 5,000 2,000 * 3,000 53,000 Percent 11.7% 12.8% 10.7% 11.5% 7.4% 1.8% 16.5% 11.2% 50 Number 7,000 2,000 2,000 1,000 * * * 14,000 Percent 3.4% 2.5% 3.6% 2.7% 1.7% 0.0% 1.9% 2.9% 55 Number 13,000 2,000 5,000 10,000 2,000 * 3,000 35,000 Percent 6.3% 2.1% 8.1% 21.6% 8.1% 0.7% 14.1% 7.4% 60 Number 9,000 * 1,000 * * * 1,000 12,000 Percent 4.3% 0.2% 2.1% 0.2% 0.9% 0.0% 5.7% 2.5% 65 Number 15,000 0 3,000 1,000 1,000 0 2,000 21,000 Percent 7.0% 0.2% 4.6% 2.0% 2.3% 0.5% 8.7% 4.4% >65 Number 8,000 * 2,000 1,000 1,000 * 0 11,000 Percent 3.7% 0.2% 2.5% 1.5% 2.2% 0.2% 2.1% 2.3% Unknown Number 47,000 18,000 19,000 9,000 9,000 11,000 7,000 119,000 Percent 22.9% 19.7% 31.3% 18.5% 34.5% 42.1% 35.4% 25.1% Total crashes 207,000 89,000 62,000 46,000 27,000 25,000 19,000 475,000
Notes:
1 The total does not include the “other and unknown” scenario, but only the classifiable scenarios shown in the table. * Represents crash frequencies below 500.
25
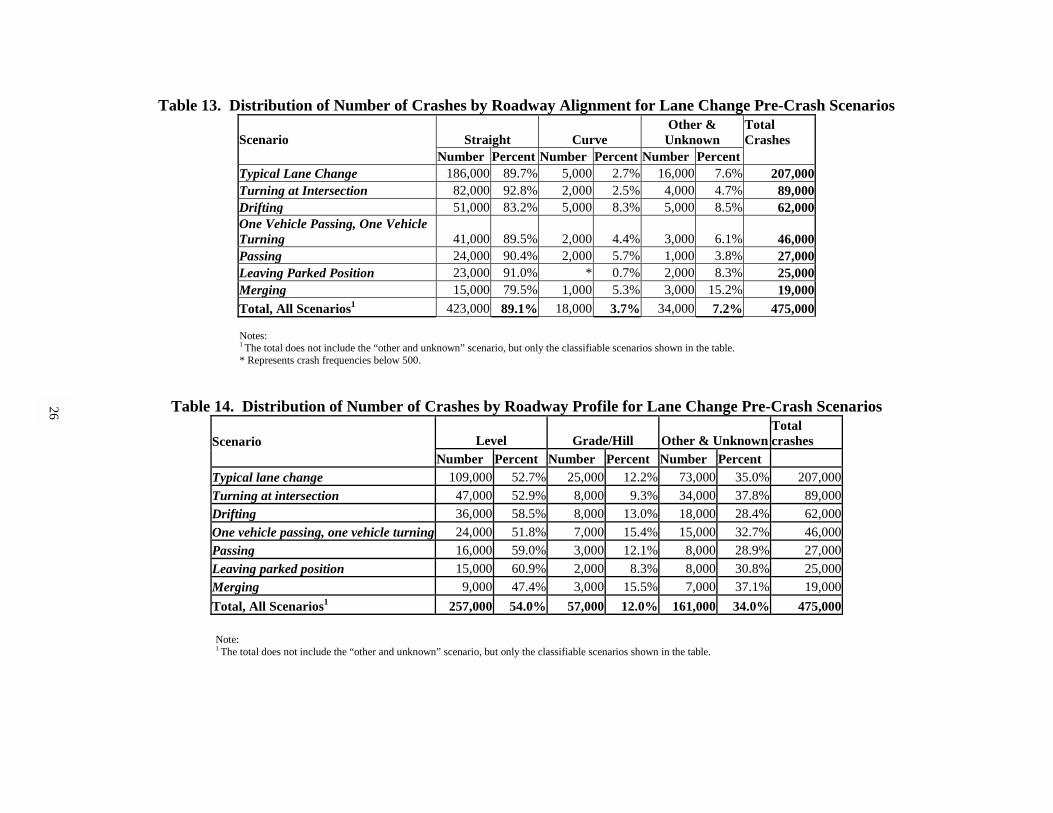
Table 13. Distribution of Number of Crashes by Roadway Alignment for Lane Change Pre-Crash Scenarios
Scenario Straight Curve Other &
Unknown Total Crashes
Number Percent Number Percent Number Percent Typical Lane Change 186,000 89.7% 5,000 2.7% 16,000 7.6% 207,000 Turning at Intersection 82,000 92.8% 2,000 2.5% 4,000 4.7% 89,000 Drifting 51,000 83.2% 5,000 8.3% 5,000 8.5% 62,000 One Vehicle Passing, One Vehicle Turning 41,000 89.5% 2,000 4.4% 3,000 6.1% 46,000 Passing 24,000 90.4% 2,000 5.7% 1,000 3.8% 27,000 Leaving Parked Position 23,000 91.0% * 0.7% 2,000 8.3% 25,000 Merging 15,000 79.5% 1,000 5.3% 3,000 15.2% 19,000 Total, All Scenarios1 423,000 89.1% 18,000 3.7% 34,000 7.2% 475,000 Notes: 1 The total does not include the “other and unknown” scenario, but only the classifiable scenarios shown in the table. * Represents crash frequencies below 500.
Table 14. Distribution of Number of Crashes by Roadway Profile for Lane Change Pre-Crash Scenarios
Level Grade/Hill Other & UnknownTotal crashes Scenario
Number Percent Number Percent Number Percent Typical lane change 109,000 52.7% 25,000 12.2% 73,000 35.0% 207,000 Turning at intersection 47,000 52.9% 8,000 9.3% 34,000 37.8% 89,000 Drifting 36,000 58.5% 8,000 13.0% 18,000 28.4% 62,000 One vehicle passing, one vehicle turning 24,000 51.8% 7,000 15.4% 15,000 32.7% 46,000 Passing 16,000 59.0% 3,000 12.1% 8,000 28.9% 27,000 Leaving parked position 15,000 60.9% 2,000 8.3% 8,000 30.8% 25,000 Merging 9,000 47.4% 3,000 15.5% 7,000 37.1% 19,000 Total, All Scenarios1 257,000 54.0% 57,000 12.0% 161,000 34.0% 475,000
Note:
1 The total does not include the “other and unknown” scenario, but only the classifiable scenarios shown in the table.
26
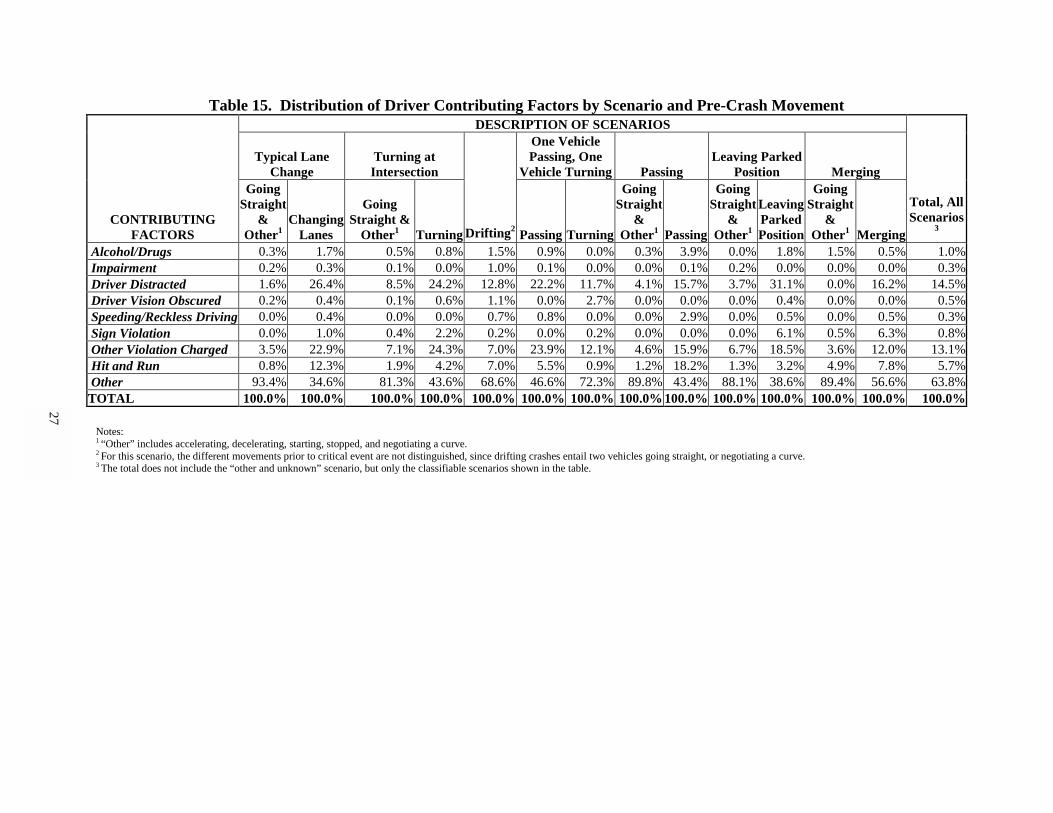
Table 15. Distribution of Driver Contributing Factors by Scenario and Pre-Crash Movement DESCRIPTION OF SCENARIOS
Typical Lane
Change Turning at Intersection
One Vehicle Passing, One
Vehicle Turning Passing Leaving Parked
Position Merging
CONTRIBUTING FACTORS
Going Straight
& Other1
Changing Lanes
Going Straight &
Other1 Turning Drifting2 Passing Turning
Going Straight
& Other1 Passing
Going Straight
& Other1
Leaving Parked Position
Going Straight
& Other1 Merging
Total, All Scenarios
3 Alcohol/Drugs 0.3% 1.7% 0.5% 0.8% 1.5% 0.9% 0.0% 0.3% 3.9% 0.0% 1.8% 1.5% 0.5% 1.0% Impairment 0.2% 0.3% 0.1% 0.0% 1.0% 0.1% 0.0% 0.0% 0.1% 0.2% 0.0% 0.0% 0.0% 0.3% Driver Distracted 1.6% 26.4% 8.5% 24.2% 12.8% 22.2% 11.7% 4.1% 15.7% 3.7% 31.1% 0.0% 16.2% 14.5% Driver Vision Obscured 0.2% 0.4% 0.1% 0.6% 1.1% 0.0% 2.7% 0.0% 0.0% 0.0% 0.4% 0.0% 0.0% 0.5% Speeding/Reckless Driving 0.0% 0.4% 0.0% 0.0% 0.7% 0.8% 0.0% 0.0% 2.9% 0.0% 0.5% 0.0% 0.5% 0.3% Sign Violation 0.0% 1.0% 0.4% 2.2% 0.2% 0.0% 0.2% 0.0% 0.0% 0.0% 6.1% 0.5% 6.3% 0.8% Other Violation Charged 3.5% 22.9% 7.1% 24.3% 7.0% 23.9% 12.1% 4.6% 15.9% 6.7% 18.5% 3.6% 12.0% 13.1% Hit and Run 0.8% 12.3% 1.9% 4.2% 7.0% 5.5% 0.9% 1.2% 18.2% 1.3% 3.2% 4.9% 7.8% 5.7% Other 93.4% 34.6% 81.3% 43.6% 68.6% 46.6% 72.3% 89.8% 43.4% 88.1% 38.6% 89.4% 56.6% 63.8% TOTAL 100.0% 100.0% 100.0% 100.0% 100.0% 100.0% 100.0% 100.0% 100.0% 100.0% 100.0% 100.0% 100.0% 100.0%
Notes:
1 “Other” includes accelerating, decelerating, starting, stopped, and negotiating a curve. 2 For this scenario, the different movements prior to critical event are not distinguished, since drifting crashes entail two vehicles going straight, or negotiating a curve. 3 The total does not include the “other and unknown” scenario, but only the classifiable scenarios shown in the table.
27
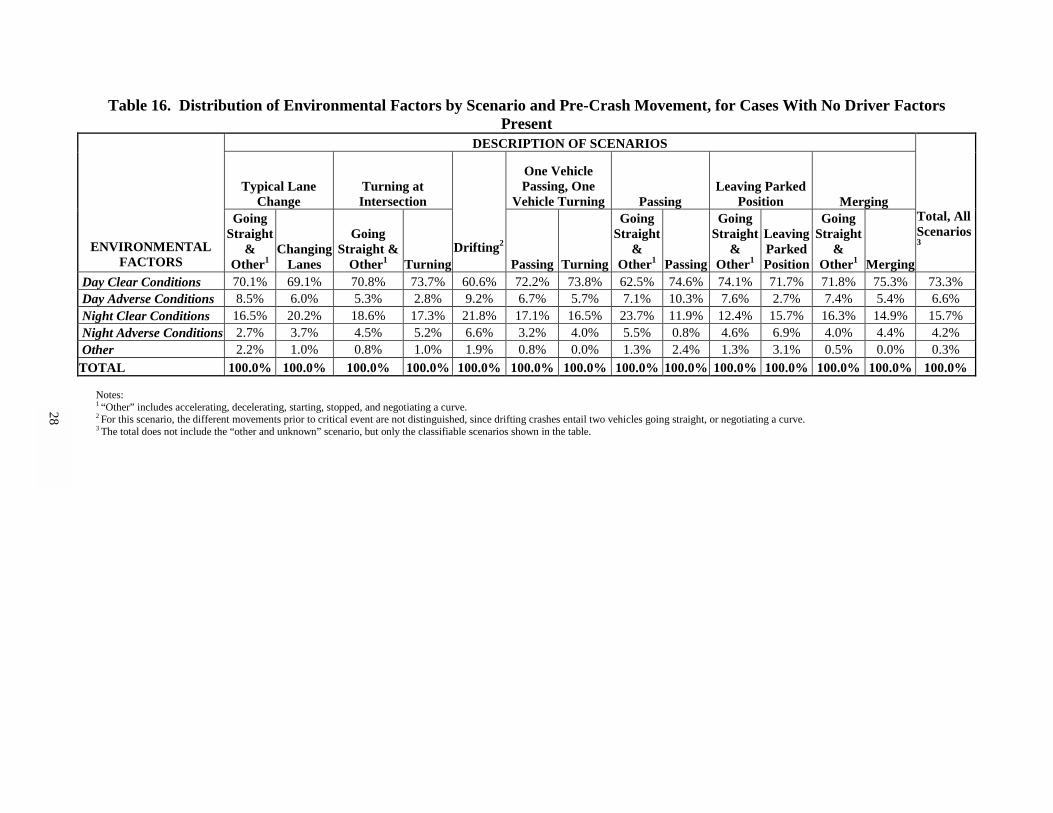
Table 16. Distribution of Environmental Factors by Scenario and Pre-Crash Movement, for Cases With No Driver Factors Present
DESCRIPTION OF SCENARIOS
Typical Lane Change
Turning at Intersection
One Vehicle Passing, One
Vehicle Turning Passing Leaving Parked
Position Merging
ENVIRONMENTAL FACTORS
Going Straight
& Other1
Changing Lanes
Going Straight &
Other1 TurningDrifting2
Passing Turning
Going Straight
& Other1 Passing
Going Straight
& Other1
Leaving Parked Position
Going Straight
& Other1 Merging
Total, All Scenarios 3
Day Clear Conditions 70.1% 69.1% 70.8% 73.7% 60.6% 72.2% 73.8% 62.5% 74.6% 74.1% 71.7% 71.8% 75.3% 73.3% Day Adverse Conditions 8.5% 6.0% 5.3% 2.8% 9.2% 6.7% 5.7% 7.1% 10.3% 7.6% 2.7% 7.4% 5.4% 6.6% Night Clear Conditions 16.5% 20.2% 18.6% 17.3% 21.8% 17.1% 16.5% 23.7% 11.9% 12.4% 15.7% 16.3% 14.9% 15.7% Night Adverse Conditions 2.7% 3.7% 4.5% 5.2% 6.6% 3.2% 4.0% 5.5% 0.8% 4.6% 6.9% 4.0% 4.4% 4.2% Other 2.2% 1.0% 0.8% 1.0% 1.9% 0.8% 0.0% 1.3% 2.4% 1.3% 3.1% 0.5% 0.0% 0.3% TOTAL 100.0% 100.0% 100.0% 100.0% 100.0% 100.0% 100.0% 100.0% 100.0% 100.0% 100.0% 100.0% 100.0% 100.0%
Notes:
1 “Other” includes accelerating, decelerating, starting, stopped, and negotiating a curve. 2 For this scenario, the different movements prior to critical event are not distinguished, since drifting crashes entail two vehicles going straight, or negotiating a curve. 3 The total does not include the “other and unknown” scenario, but only the classifiable scenarios shown in the table.
28
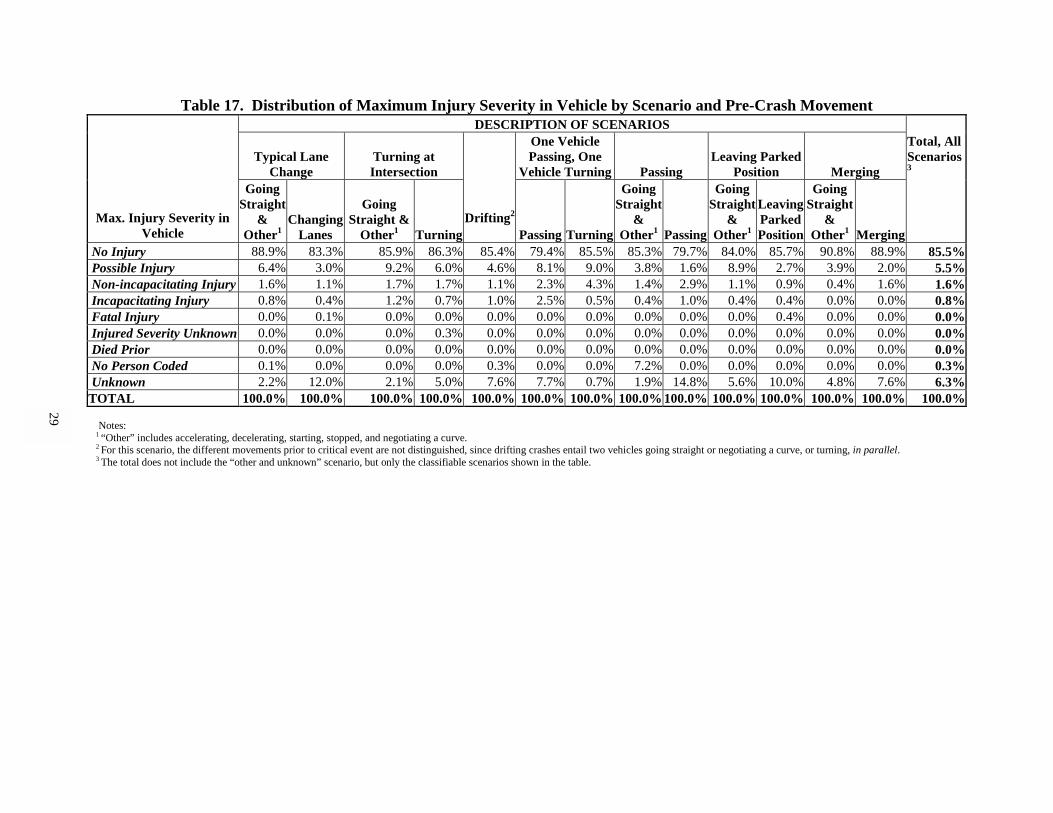
Table 17. Distribution of Maximum Injury Severity in Vehicle by Scenario and Pre-Crash Movement DESCRIPTION OF SCENARIOS
Typical Lane Change
Turning at Intersection
One Vehicle Passing, One
Vehicle Turning Passing Leaving Parked
Position Merging
Total, All Scenarios 3
Max. Injury Severity in
Vehicle
Going Straight
& Other1
Changing Lanes
Going Straight &
Other1 Turning Drifting2
Passing Turning
Going Straight
& Other1 Passing
Going Straight
& Other1
Leaving Parked Position
Going Straight
& Other1 Merging
No Injury 88.9% 83.3% 85.9% 86.3% 85.4% 79.4% 85.5% 85.3% 79.7% 84.0% 85.7% 90.8% 88.9% 85.5% Possible Injury 6.4% 3.0% 9.2% 6.0% 4.6% 8.1% 9.0% 3.8% 1.6% 8.9% 2.7% 3.9% 2.0% 5.5% Non-incapacitating Injury 1.6% 1.1% 1.7% 1.7% 1.1% 2.3% 4.3% 1.4% 2.9% 1.1% 0.9% 0.4% 1.6% 1.6% Incapacitating Injury 0.8% 0.4% 1.2% 0.7% 1.0% 2.5% 0.5% 0.4% 1.0% 0.4% 0.4% 0.0% 0.0% 0.8% Fatal Injury 0.0% 0.1% 0.0% 0.0% 0.0% 0.0% 0.0% 0.0% 0.0% 0.0% 0.4% 0.0% 0.0% 0.0% Injured Severity Unknown 0.0% 0.0% 0.0% 0.3% 0.0% 0.0% 0.0% 0.0% 0.0% 0.0% 0.0% 0.0% 0.0% 0.0% Died Prior 0.0% 0.0% 0.0% 0.0% 0.0% 0.0% 0.0% 0.0% 0.0% 0.0% 0.0% 0.0% 0.0% 0.0% No Person Coded 0.1% 0.0% 0.0% 0.0% 0.3% 0.0% 0.0% 7.2% 0.0% 0.0% 0.0% 0.0% 0.0% 0.3% Unknown 2.2% 12.0% 2.1% 5.0% 7.6% 7.7% 0.7% 1.9% 14.8% 5.6% 10.0% 4.8% 7.6% 6.3% TOTAL 100.0% 100.0% 100.0% 100.0% 100.0% 100.0% 100.0% 100.0% 100.0% 100.0% 100.0% 100.0% 100.0% 100.0%
Notes: 1 “Other” includes accelerating, decelerating, starting, stopped, and negotiating a curve. 2 For this scenario, the different movements prior to critical event are not distinguished, since drifting crashes entail two vehicles going straight or negotiating a curve, or turning, in parallel. 3 The total does not include the “other and unknown” scenario, but only the classifiable scenarios shown in the table.
29

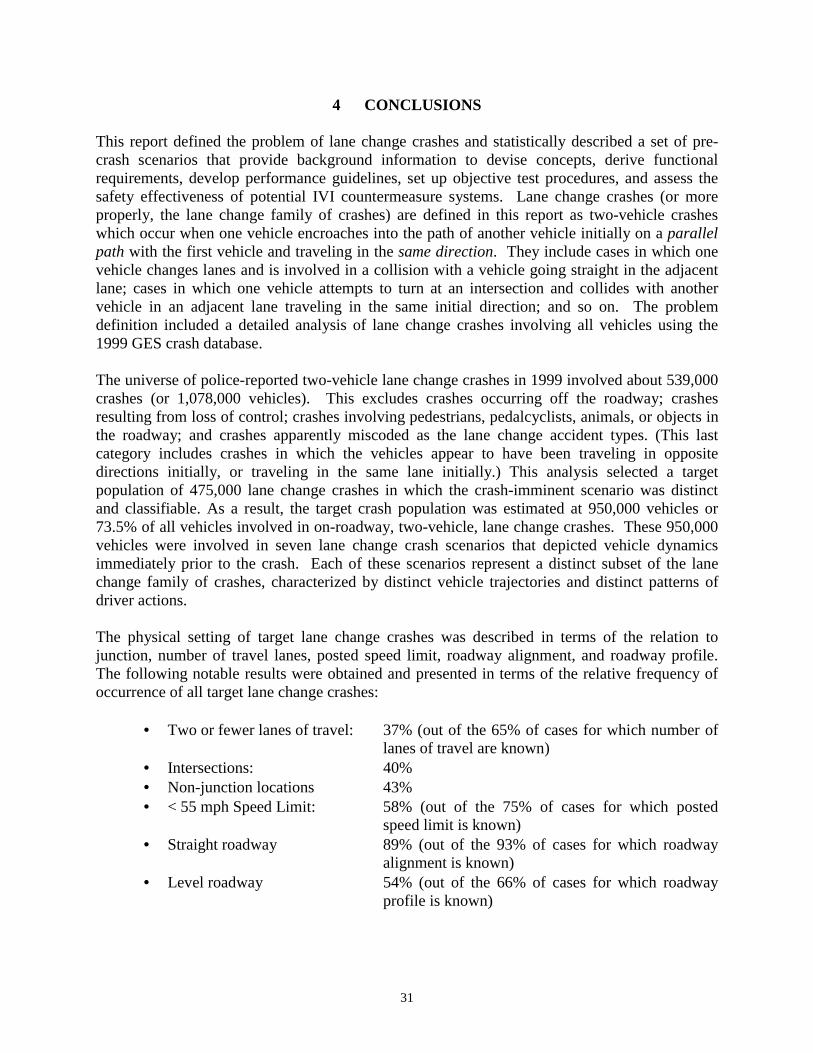
31
4 CONCLUSIONS This report defined the problem of lane change crashes and statistically described a set of pre-crash scenarios that provide background information to devise concepts, derive functional requirements, develop performance guidelines, set up objective test procedures, and assess the safety effectiveness of potential IVI countermeasure systems. Lane change crashes (or more properly, the lane change family of crashes) are defined in this report as two-vehicle crashes which occur when one vehicle encroaches into the path of another vehicle initially on a parallel path with the first vehicle and traveling in the same direction. They include cases in which one vehicle changes lanes and is involved in a collision with a vehicle going straight in the adjacent lane; cases in which one vehicle attempts to turn at an intersection and collides with another vehicle in an adjacent lane traveling in the same initial direction; and so on. The problem definition included a detailed analysis of lane change crashes involving all vehicles using the 1999 GES crash database. The universe of police-reported two-vehicle lane change crashes in 1999 involved about 539,000 crashes (or 1,078,000 vehicles). This excludes crashes occurring off the roadway; crashes resulting from loss of control; crashes involving pedestrians, pedalcyclists, animals, or objects in the roadway; and crashes apparently miscoded as the lane change accident types. (This last category includes crashes in which the vehicles appear to have been traveling in opposite directions initially, or traveling in the same lane initially.) This analysis selected a target population of 475,000 lane change crashes in which the crash-imminent scenario was distinct and classifiable. As a result, the target crash population was estimated at 950,000 vehicles or 73.5% of all vehicles involved in on-roadway, two-vehicle, lane change crashes. These 950,000 vehicles were involved in seven lane change crash scenarios that depicted vehicle dynamics immediately prior to the crash. Each of these scenarios represent a distinct subset of the lane change family of crashes, characterized by distinct vehicle trajectories and distinct patterns of driver actions. The physical setting of target lane change crashes was described in terms of the relation to junction, number of travel lanes, posted speed limit, roadway alignment, and roadway profile. The following notable results were obtained and presented in terms of the relative frequency of occurrence of all target lane change crashes:
• Two or fewer lanes of travel: 37% (out of the 65% of cases for which number of lanes of travel are known)
• Intersections: 40% • Non-junction locations 43% • < 55 mph Speed Limit: 58% (out of the 75% of cases for which posted
speed limit is known) • Straight roadway 89% (out of the 93% of cases for which roadway
alignment is known) • Level roadway 54% (out of the 66% of cases for which roadway
profile is known)
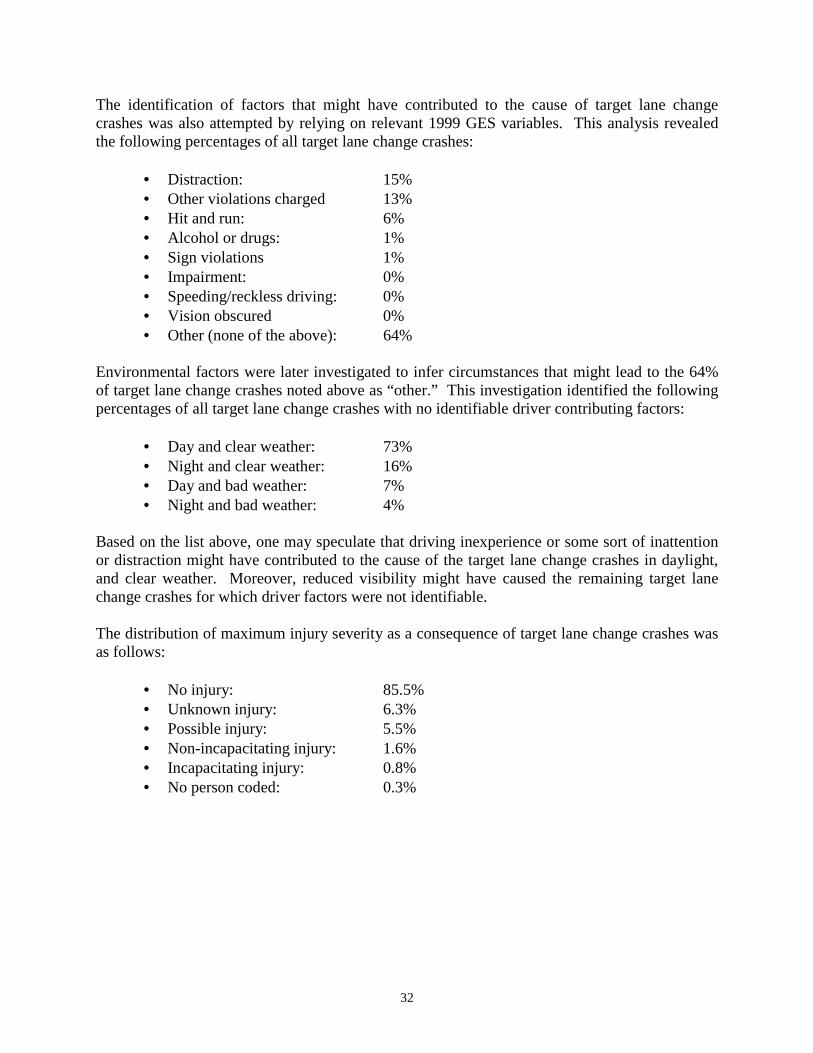
32
The identification of factors that might have contributed to the cause of target lane change crashes was also attempted by relying on relevant 1999 GES variables. This analysis revealed the following percentages of all target lane change crashes:
• Distraction: 15% • Other violations charged 13% • Hit and run: 6% • Alcohol or drugs: 1% • Sign violations 1% • Impairment: 0% • Speeding/reckless driving: 0% • Vision obscured 0% • Other (none of the above): 64%
Environmental factors were later investigated to infer circumstances that might lead to the 64% of target lane change crashes noted above as “other.” This investigation identified the following percentages of all target lane change crashes with no identifiable driver contributing factors:
• Day and clear weather: 73% • Night and clear weather: 16% • Day and bad weather: 7% • Night and bad weather: 4%
Based on the list above, one may speculate that driving inexperience or some sort of inattention or distraction might have contributed to the cause of the target lane change crashes in daylight, and clear weather. Moreover, reduced visibility might have caused the remaining target lane change crashes for which driver factors were not identifiable. The distribution of maximum injury severity as a consequence of target lane change crashes was as follows:
• No injury: 85.5% • Unknown injury: 6.3% • Possible injury: 5.5% • Non-incapacitating injury: 1.6% • Incapacitating injury: 0.8% • No person coded: 0.3%
33
5 REFERENCES 1. U.S. Department of Transportation ITS Joint Program Office. ITS National Intelligent
Transportation Systems Program Plan Five-Year Horizon. U.S. Department of Transportation, Federal Highway Administration, Washington, D.C., FHWA-OP-00-008, August 2000.
2. W.G. Najm, M. Mironer, J. Koziol, Jr., J.S. Wang, and R.R. Knipling. Synthesis Report:
Examination of Target Vehicular Crashes and Potential ITS Countermeasures. DOT HS 808 263, June 1995.
3. R. Kiefer, D. LeBlanc, M. Palmer, J. Salinger, R. Deering, and M. Shulman. Development
and Validation of Functional Definitions and Evaluation Procedures for Collision Warning/Avoidance Systems. Crash Avoidance Metrics Partnership, DOT HS 808 964, August 1999.
4. W.G. Najm and M.P. daSilva. Benefits Estimation Methodology for Intelligent Vehicle Safety
Systems Based on Encounters with Critical Driving Conflicts. ITS America’s Tenth Annual Meeting & Exposition, Boston, Massachusetts, May 2000.
5. W.G. Najm, M.P. daSilva, and C.J. Wiacek. Estimation of Crash Injury Severity Reduction
for Intelligent Vehicle Safety Systems. SAE 2000 World Congress, Paper No. 2000-01-1354, Detroit, Michigan, March 2000.
6. J.S. Wang and R.R. Knipling. Lane Change/Merge Crashes: Problem Size Assessment and
Statistical Description. DOT HS 808 075, January 1994. 7. J.D. Chovan, L. Tijerina, G. Alexander, and D. Hendricks. Examination of Lane Change
Crashes and Potential IVHS Countermeasures. DOT HS 808 071, March 1994. 8. C.D. Eberhard, K.M. Luebkemann, P.J. Moffa, S.K. Young, R.W. Allen, E.A. Harwin, J.P.
Keating, and R. Mason. Crash Avoidance System Task 1 Final Report. TRW Space and Technology Division, August 1994.
9. National Center for Statistics and Analysis. National Automotive Sampling System General
Estimates System Analytical User’s Manual 1988-1999. U.S. Department of Transportation, National Highway Traffic Safety Administration, Washington, D.C., 20590, 2000.
10. W.G. Najm, J.A. Koopmann, L. Ng Boyle, and D.L. Smith. Development of Test Scenarios
for Off-Roadway Crash Countermeasures Based on Crash Statistics. DOT HS 809 505, September 2002.

34
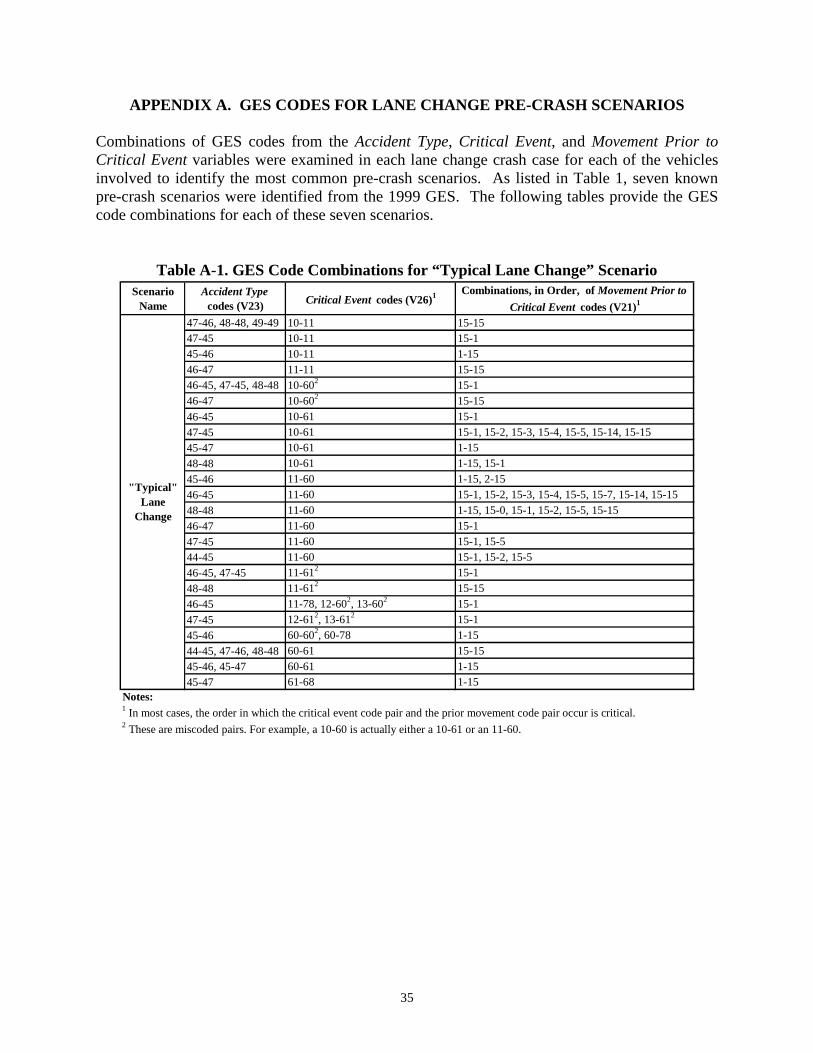
35
APPENDIX A. GES CODES FOR LANE CHANGE PRE-CRASH SCENARIOS Combinations of GES codes from the Accident Type, Critical Event, and Movement Prior to Critical Event variables were examined in each lane change crash case for each of the vehicles involved to identify the most common pre-crash scenarios. As listed in Table 1, seven known pre-crash scenarios were identified from the 1999 GES. The following tables provide the GES code combinations for each of these seven scenarios.
Table A-1. GES Code Combinations for “Typical Lane Change” Scenario
Scenario Name
Accident Type codes (V23) Critical Event codes (V26)1 Combinations, in Order, of Movement Prior to
Critical Event codes (V21)1
47-46, 48-48, 49-49 10-11 15-1547-45 10-11 15-145-46 10-11 1-1546-47 11-11 15-1546-45, 47-45, 48-48 10-602 15-146-47 10-602 15-1546-45 10-61 15-147-45 10-61 15-1, 15-2, 15-3, 15-4, 15-5, 15-14, 15-1545-47 10-61 1-1548-48 10-61 1-15, 15-145-46 11-60 1-15, 2-1546-45 11-60 15-1, 15-2, 15-3, 15-4, 15-5, 15-7, 15-14, 15-1548-48 11-60 1-15, 15-0, 15-1, 15-2, 15-5, 15-1546-47 11-60 15-147-45 11-60 15-1, 15-544-45 11-60 15-1, 15-2, 15-546-45, 47-45 11-612 15-148-48 11-612 15-1546-45 11-78, 12-602, 13-602 15-147-45 12-612, 13-612 15-145-46 60-602, 60-78 1-1544-45, 47-46, 48-48 60-61 15-1545-46, 45-47 60-61 1-1545-47 61-68 1-15
Notes:1 In most cases, the order in which the critical event code pair and the prior movement code pair occur is critical.2 These are miscoded pairs. For example, a 10-60 is actually either a 10-61 or an 11-60.
"Typical" Lane
Change
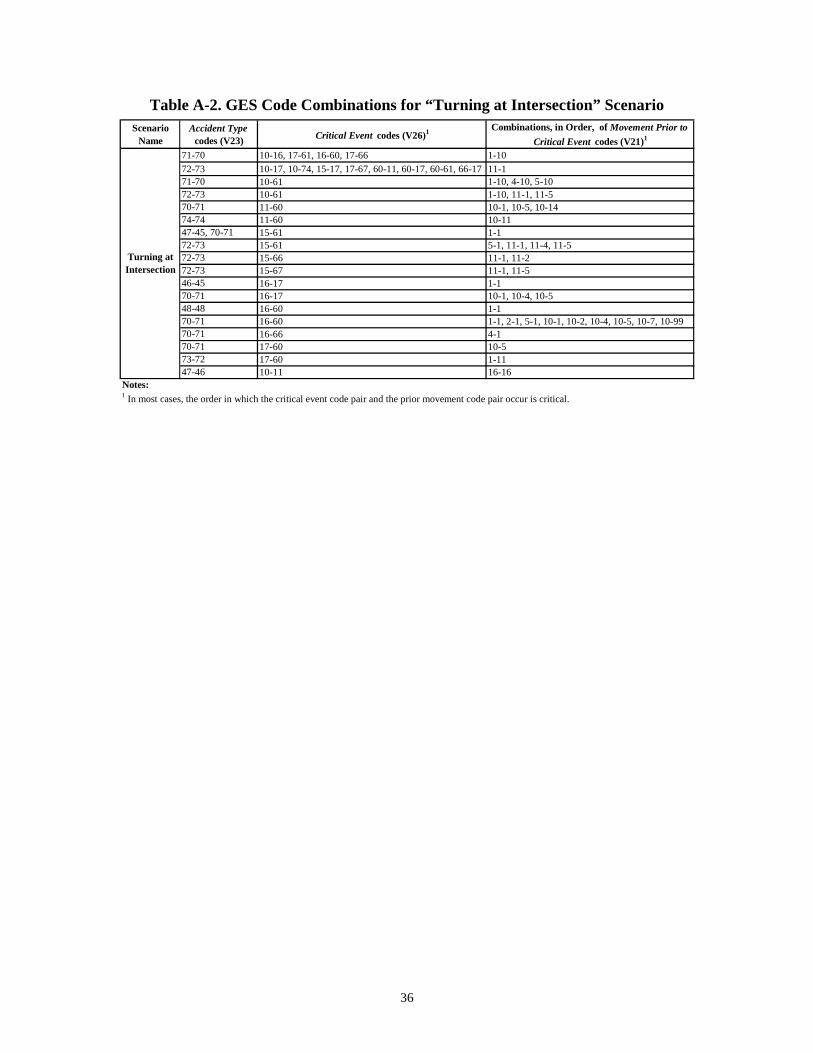
36
Table A-2. GES Code Combinations for “Turning at Intersection” Scenario
Scenario Name
Accident Type codes (V23) Critical Event codes (V26)1 Combinations, in Order, of Movement Prior to
Critical Event codes (V21)1
71-70 10-16, 17-61, 16-60, 17-66 1-1072-73 10-17, 10-74, 15-17, 17-67, 60-11, 60-17, 60-61, 66-17 11-171-70 10-61 1-10, 4-10, 5-1072-73 10-61 1-10, 11-1, 11-570-71 11-60 10-1, 10-5, 10-1474-74 11-60 10-1147-45, 70-71 15-61 1-172-73 15-61 5-1, 11-1, 11-4, 11-572-73 15-66 11-1, 11-272-73 15-67 11-1, 11-546-45 16-17 1-170-71 16-17 10-1, 10-4, 10-548-48 16-60 1-170-71 16-60 1-1, 2-1, 5-1, 10-1, 10-2, 10-4, 10-5, 10-7, 10-9970-71 16-66 4-170-71 17-60 10-573-72 17-60 1-1147-46 10-11 16-16
Notes:1 In most cases, the order in which the critical event code pair and the prior movement code pair occur is critical.
Turning at Intersection
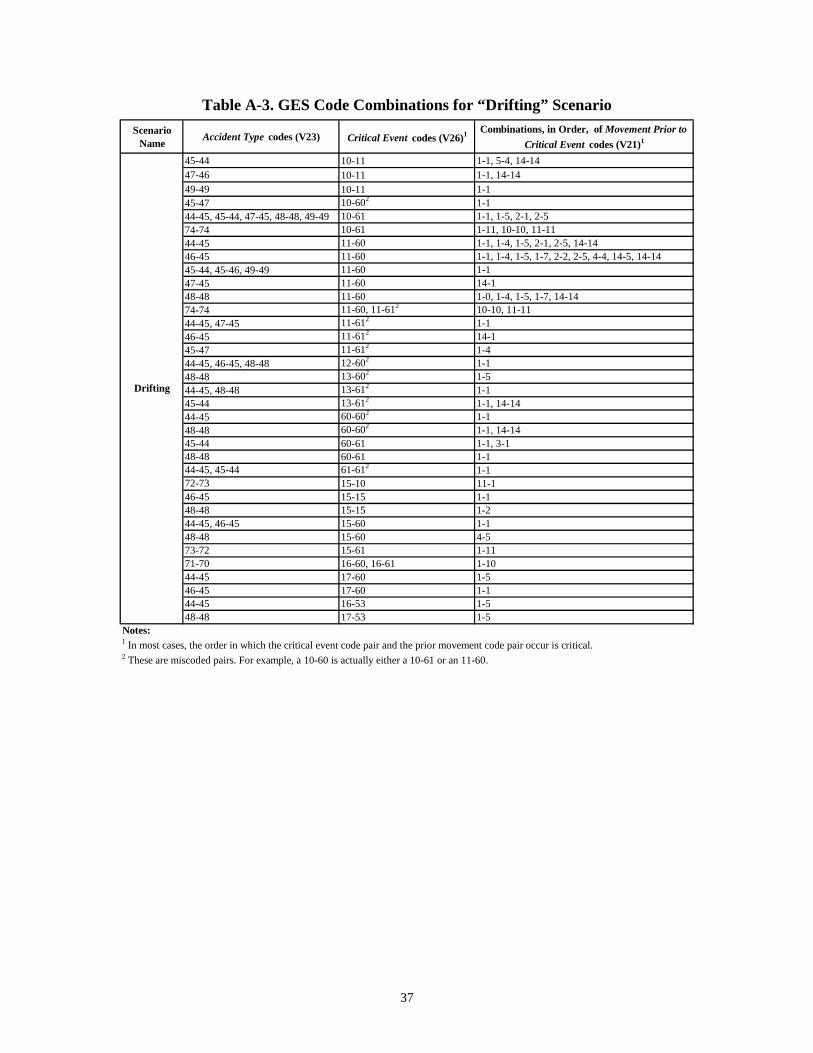
37
Table A-3. GES Code Combinations for “Drifting” Scenario
Scenario Name Accident Type codes (V23) Critical Event codes (V26)1 Combinations, in Order, of Movement Prior to
Critical Event codes (V21)1
45-44 10-11 1-1, 5-4, 14-1447-46 10-11 1-1, 14-1449-49 10-11 1-145-47 10-602 1-144-45, 45-44, 47-45, 48-48, 49-49 10-61 1-1, 1-5, 2-1, 2-574-74 10-61 1-11, 10-10, 11-1144-45 11-60 1-1, 1-4, 1-5, 2-1, 2-5, 14-1446-45 11-60 1-1, 1-4, 1-5, 1-7, 2-2, 2-5, 4-4, 14-5, 14-1445-44, 45-46, 49-49 11-60 1-147-45 11-60 14-148-48 11-60 1-0, 1-4, 1-5, 1-7, 14-1474-74 11-60, 11-612 10-10, 11-1144-45, 47-45 11-612 1-146-45 11-612 14-145-47 11-612 1-444-45, 46-45, 48-48 12-602 1-148-48 13-602 1-544-45, 48-48 13-612 1-145-44 13-612 1-1, 14-1444-45 60-602 1-148-48 60-602 1-1, 14-1445-44 60-61 1-1, 3-148-48 60-61 1-144-45, 45-44 61-612 1-172-73 15-10 11-146-45 15-15 1-148-48 15-15 1-244-45, 46-45 15-60 1-148-48 15-60 4-573-72 15-61 1-1171-70 16-60, 16-61 1-1044-45 17-60 1-546-45 17-60 1-1 44-45 16-53 1-548-48 17-53 1-5
Notes:1 In most cases, the order in which the critical event code pair and the prior movement code pair occur is critical.2 These are miscoded pairs. For example, a 10-60 is actually either a 10-61 or an 11-60.
Drifting
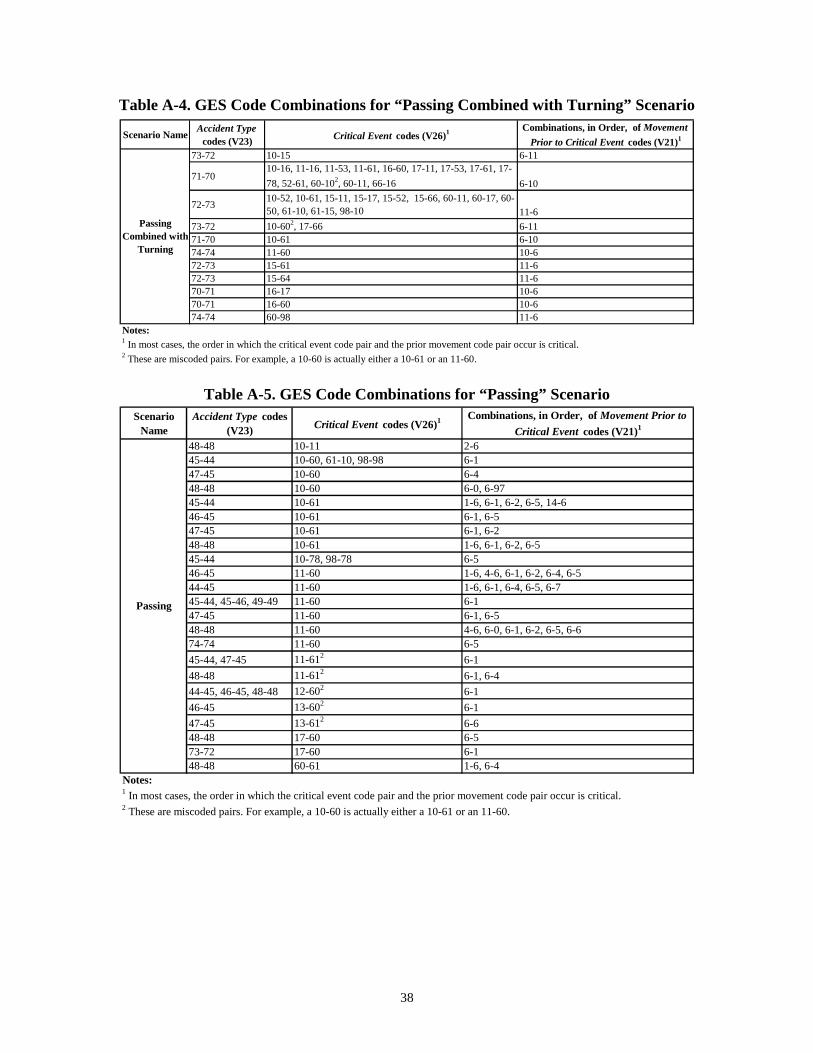
38
Table A-4. GES Code Combinations for “Passing Combined with Turning” Scenario
Table A-5. GES Code Combinations for “Passing” Scenario
Scenario Name Accident Type codes (V23) Critical Event codes (V26)1 Combinations, in Order, of Movement
Prior to Critical Event codes (V21)1
73-72 10-15 6-11
71-7010-16, 11-16, 11-53, 11-61, 16-60, 17-11, 17-53, 17-61, 17-78, 52-61, 60-102, 60-11, 66-16 6-10
72-73 10-52, 10-61, 15-11, 15-17, 15-52, 15-66, 60-11, 60-17, 60-50, 61-10, 61-15, 98-10 11-6
73-72 10-602, 17-66 6-1171-70 10-61 6-1074-74 11-60 10-672-73 15-61 11-672-73 15-64 11-670-71 16-17 10-670-71 16-60 10-674-74 60-98 11-6
Notes:1 In most cases, the order in which the critical event code pair and the prior movement code pair occur is critical.2 These are miscoded pairs. For example, a 10-60 is actually either a 10-61 or an 11-60.
Passing Combined with
Turning
Scenario Name
Accident Type codes (V23) Critical Event codes (V26)1 Combinations, in Order, of Movement Prior to
Critical Event codes (V21)1
48-48 10-11 2-645-44 10-60, 61-10, 98-98 6-147-45 10-60 6-448-48 10-60 6-0, 6-9745-44 10-61 1-6, 6-1, 6-2, 6-5, 14-646-45 10-61 6-1, 6-547-45 10-61 6-1, 6-248-48 10-61 1-6, 6-1, 6-2, 6-545-44 10-78, 98-78 6-546-45 11-60 1-6, 4-6, 6-1, 6-2, 6-4, 6-544-45 11-60 1-6, 6-1, 6-4, 6-5, 6-745-44, 45-46, 49-49 11-60 6-147-45 11-60 6-1, 6-548-48 11-60 4-6, 6-0, 6-1, 6-2, 6-5, 6-674-74 11-60 6-545-44, 47-45 11-612 6-148-48 11-612 6-1, 6-444-45, 46-45, 48-48 12-602 6-146-45 13-602 6-147-45 13-612 6-648-48 17-60 6-573-72 17-60 6-148-48 60-61 1-6, 6-4
Notes:1 In most cases, the order in which the critical event code pair and the prior movement code pair occur is critical.2 These are miscoded pairs. For example, a 10-60 is actually either a 10-61 or an 11-60.
Passing
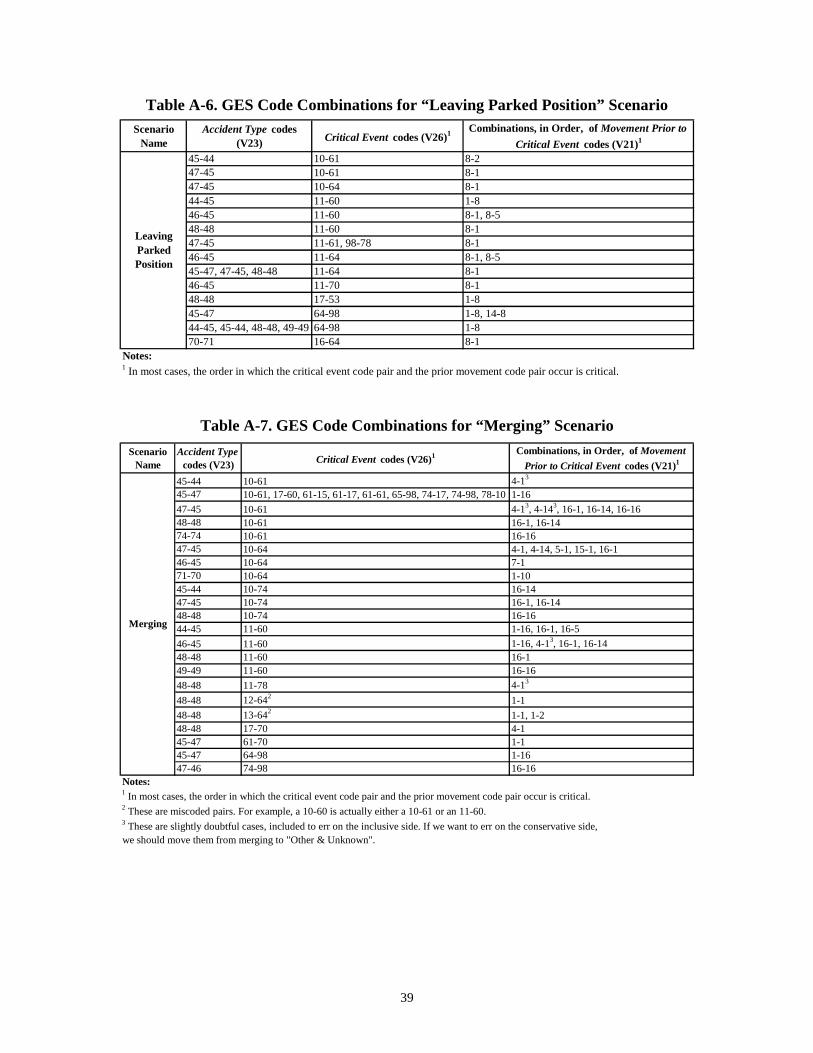
39
Table A-6. GES Code Combinations for “Leaving Parked Position” Scenario
Table A-7. GES Code Combinations for “Merging” Scenario
Scenario Name
Accident Type codes (V23) Critical Event codes (V26)1 Combinations, in Order, of Movement Prior to
Critical Event codes (V21)1
45-44 10-61 8-247-45 10-61 8-147-45 10-64 8-144-45 11-60 1-846-45 11-60 8-1, 8-548-48 11-60 8-147-45 11-61, 98-78 8-146-45 11-64 8-1, 8-545-47, 47-45, 48-48 11-64 8-146-45 11-70 8-148-48 17-53 1-845-47 64-98 1-8, 14-844-45, 45-44, 48-48, 49-49 64-98 1-870-71 16-64 8-1
Notes:1 In most cases, the order in which the critical event code pair and the prior movement code pair occur is critical.
Leaving Parked Position
Scenario Name
Accident Type codes (V23) Critical Event codes (V26)1 Combinations, in Order, of Movement
Prior to Critical Event codes (V21)1
45-44 10-61 4-13
45-47 10-61, 17-60, 61-15, 61-17, 61-61, 65-98, 74-17, 74-98, 78-10 1-1647-45 10-61 4-13, 4-143, 16-1, 16-14, 16-1648-48 10-61 16-1, 16-1474-74 10-61 16-1647-45 10-64 4-1, 4-14, 5-1, 15-1, 16-146-45 10-64 7-171-70 10-64 1-1045-44 10-74 16-1447-45 10-74 16-1, 16-1448-48 10-74 16-1644-45 11-60 1-16, 16-1, 16-546-45 11-60 1-16, 4-13, 16-1, 16-1448-48 11-60 16-149-49 11-60 16-1648-48 11-78 4-13
48-48 12-642 1-148-48 13-642 1-1, 1-248-48 17-70 4-145-47 61-70 1-145-47 64-98 1-1647-46 74-98 16-16
Notes:1 In most cases, the order in which the critical event code pair and the prior movement code pair occur is critical.2 These are miscoded pairs. For example, a 10-60 is actually either a 10-61 or an 11-60.3 These are slightly doubtful cases, included to err on the inclusive side. If we want to err on the conservative side,we should move them from merging to "Other & Unknown".
Merging

40

41
42
DOT-VNTSC-NHTSA-01-02 DOT HS 809 571 March 2003 U.S. Department of Transportation National Highway Traffic Safety Administration
Research and Special Programs
Administration Volpe National
Transportation System Center Cambridge, MA 02142-1093


