2019Beverage Alcohol
Trend Analysis
April 30, 2019

-2-
Unique Beverage Industry Expertise for Providing “Added-Value” to Selected Clients
Beverage Marketing Capabilities
Cutting Edge Insights: New Age Emergence, Multiple Beverage Competition, Specialty Beer Opportunity, Bottled Water Dominance, Hyper-Category
Competition, Micro-Marketing Age
Beverage Marketing Corporation utilizes an integrated model for providing information, analysis and advice to beverage industry clients
-3-
Beverage Marketing Capabilities
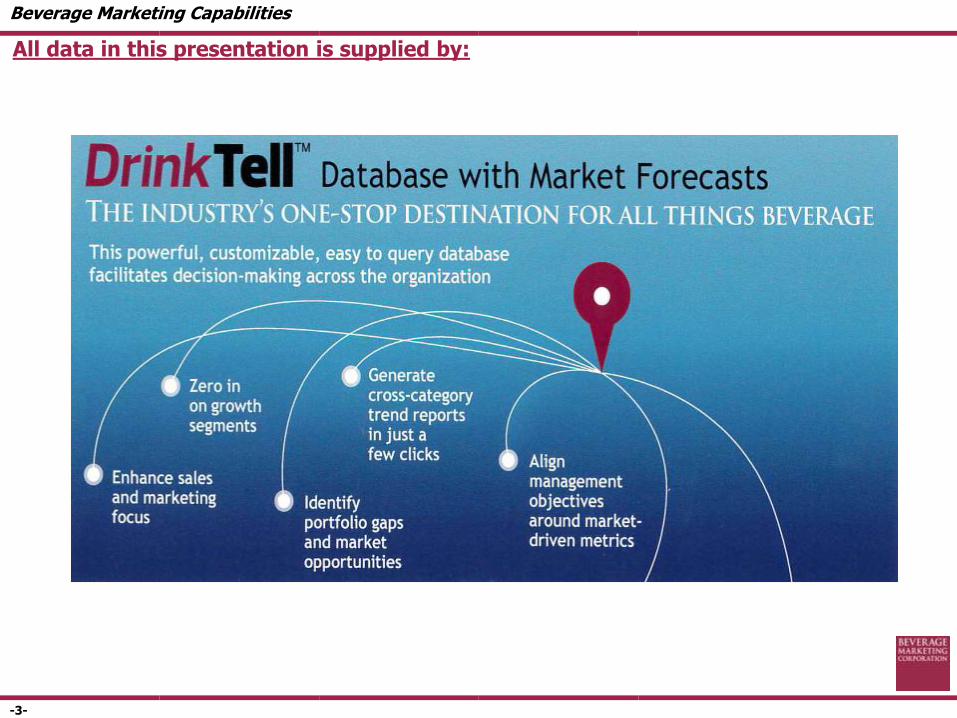
All data in this presentation is supplied by:
-4-
2019 Beverage Alcohol Trend Analysis
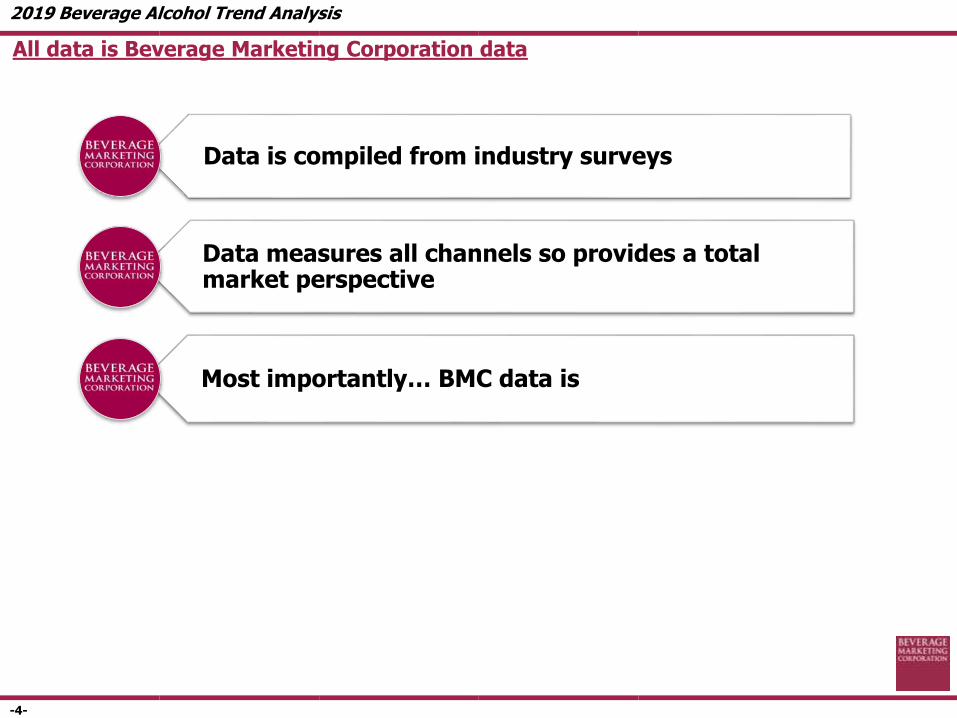
All data is Beverage Marketing Corporation data
Data is compiled from industry surveys
Data measures all channels so provides a total market perspective
Most importantly… BMC data is

-5-
Ag
en
da
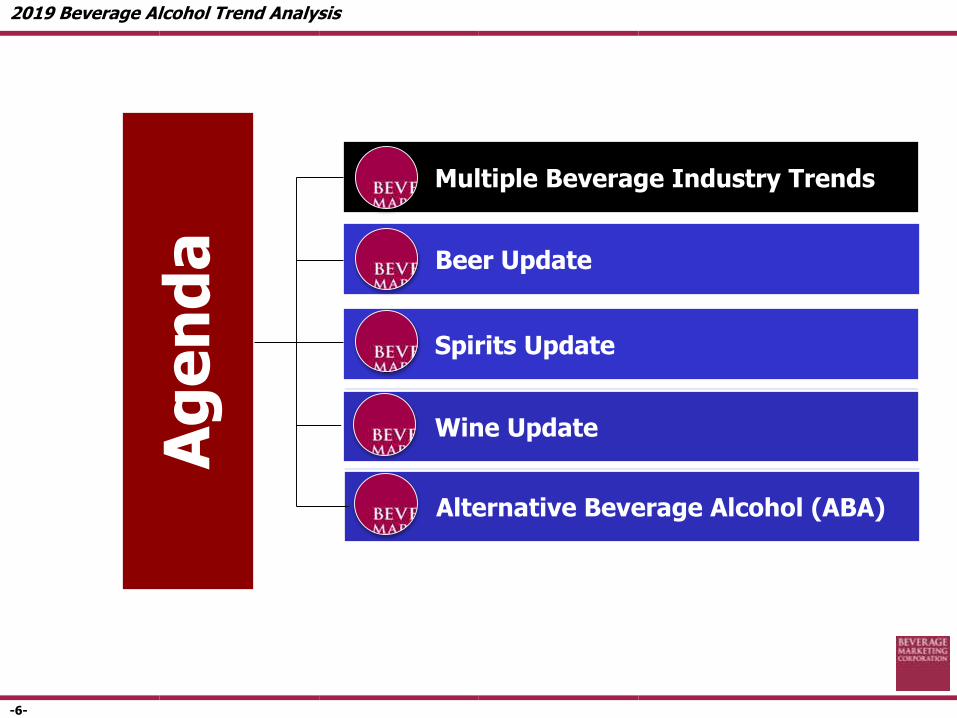
Multiple Beverage Industry Trends
Beer Update
Spirits Update
Wine Update
2019 Beverage Alcohol Trend Analysis
Alternative Beverage Alcohol (ABA)
-6-
Ag
en
da
Multiple Beverage Industry Trends
Beer Update
Spirits Update
Wine Update
2019 Beverage Alcohol Trend Analysis
Alternative Beverage Alcohol (ABA)

-7-
Beverage Headlines
State of the Industry – The Good and the Bad
2019 Multiple Industry Trends
Total U.S. beverage market grew for fifth consecutive year in 2018, and saw slightly accelerated
growth over 2017
Carbonated soft drinks (CSDs) experienced improved performance in 2018 but declined slightly for the 14th consecutive year
Bottled water widened its gap over CSDs as the largest beverage category in the U.S., driven primarily by the single-serve PET segment
Niche categories continue to outperform traditional mass-market categories with exception of bottled water --- continued market fragmentation
Wine and spirits led alcohol growth in 2018, and beer volume continued to decline around 1%
-8-
P: PreliminarySource: Beverage Marketing Corporation
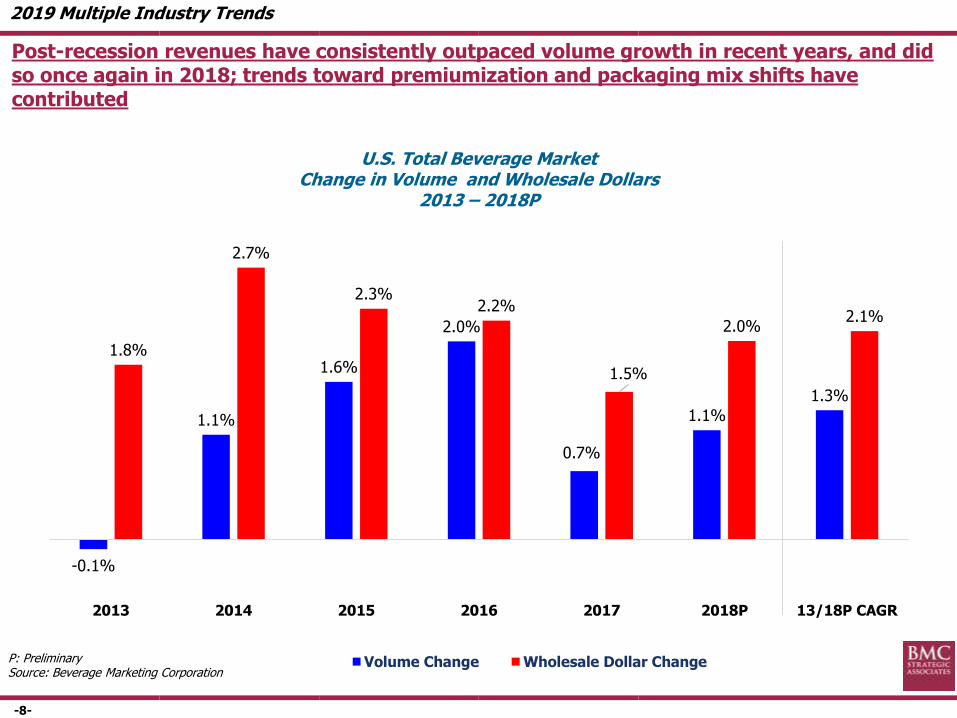
U.S. Total Beverage MarketChange in Volume and Wholesale Dollars
2013 – 2018P
Post-recession revenues have consistently outpaced volume growth in recent years, and did so once again in 2018; trends toward premiumization and packaging mix shifts have contributed
-0.1%
1.1%
1.6%
2.0%
0.7%
1.1%
1.3%
1.8%
2.7%
2.3%2.2%
1.5%
2.0%2.1%
2013 2014 2015 2016 2017 2018P 13/18P CAGR
Volume Change Wholesale Dollar Change
2019 Multiple Industry Trends
-9-
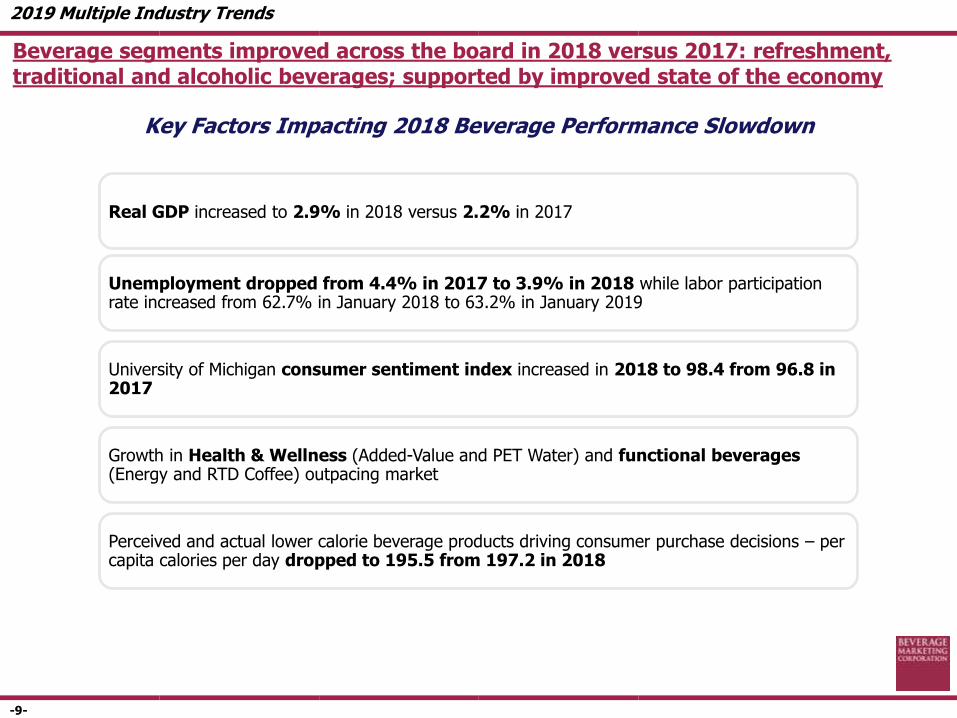
Key Factors Impacting 2018 Beverage Performance Slowdown
Beverage segments improved across the board in 2018 versus 2017: refreshment, traditional and alcoholic beverages; supported by improved state of the economy
Real GDP increased to 2.9% in 2018 versus 2.2% in 2017
Unemployment dropped from 4.4% in 2017 to 3.9% in 2018 while labor participation rate increased from 62.7% in January 2018 to 63.2% in January 2019
University of Michigan consumer sentiment index increased in 2018 to 98.4 from 96.8 in 2017
Growth in Health & Wellness (Added-Value and PET Water) and functional beverages (Energy and RTD Coffee) outpacing market
Perceived and actual lower calorie beverage products driving consumer purchase decisions – per capita calories per day dropped to 195.5 from 197.2 in 2018
2019 Multiple Industry Trends
-10-
Health and Wellness / Functionality
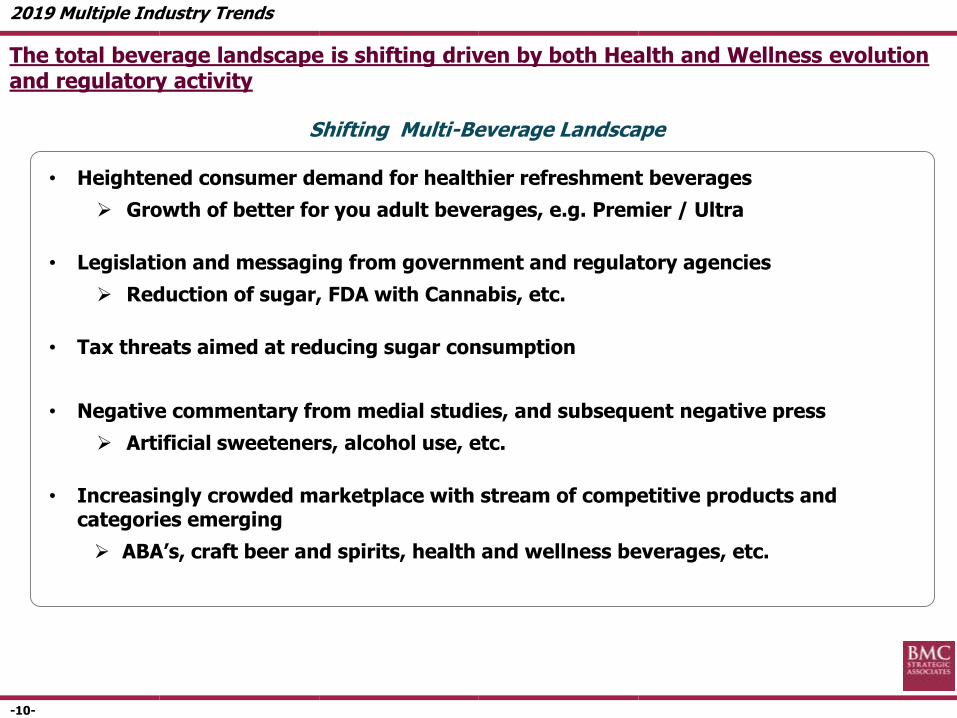
The total beverage landscape is shifting driven by both Health and Wellness evolution and regulatory activity
Shifting Multi-Beverage Landscape
• Heightened consumer demand for healthier refreshment beverages
Growth of better for you adult beverages, e.g. Premier / Ultra
• Legislation and messaging from government and regulatory agencies
Reduction of sugar, FDA with Cannabis, etc.
• Tax threats aimed at reducing sugar consumption
• Negative commentary from medial studies, and subsequent negative press
Artificial sweeteners, alcohol use, etc.
• Increasingly crowded marketplace with stream of competitive products and categories emerging
ABA’s, craft beer and spirits, health and wellness beverages, etc.
2019 Multiple Industry Trends
-11-
Ag
en
da
Multiple Beverage Industry Trends
Beer Update
Spirits Update
Wine Update
2019 Beverage Alcohol Trend Analysis
Alternative Beverage Alcohol (ABA)
-12-
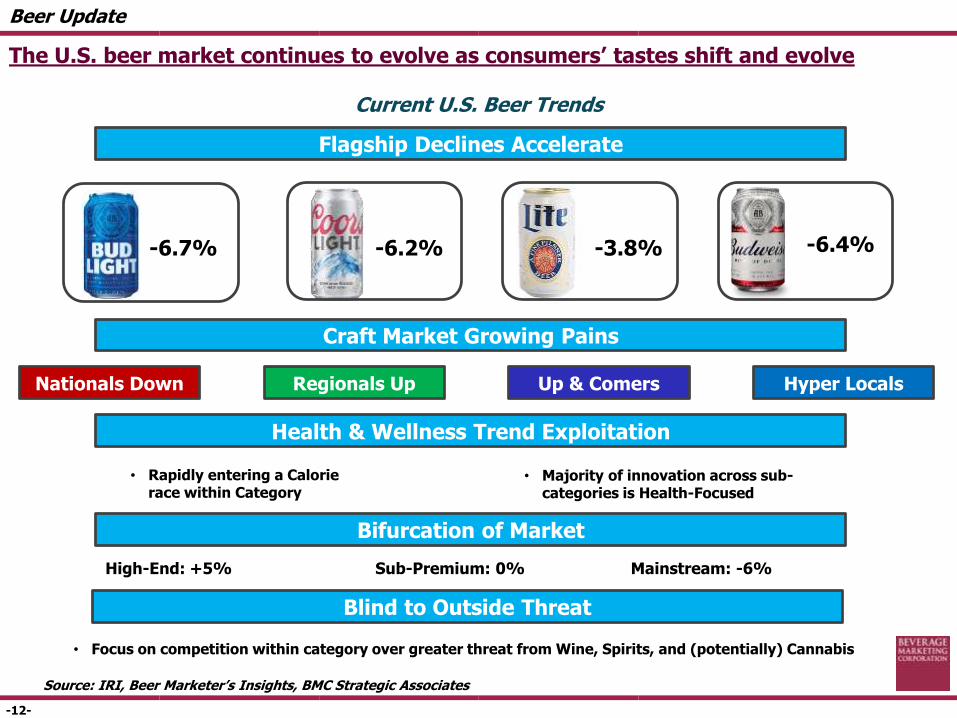
Current U.S. Beer Trends
The U.S. beer market continues to evolve as consumers’ tastes shift and evolve
Beer Update
Flagship Declines Accelerate
-6.7% -6.2% -3.8% -6.4%
Craft Market Growing Pains
Nationals Down Regionals Up Up & Comers
Health & Wellness Trend Exploitation
• Rapidly entering a Calorie race within Category
• Majority of innovation across sub-categories is Health-Focused
Bifurcation of Market
High-End: +5% Sub-Premium: 0% Mainstream: -6%
Source: IRI, Beer Marketer’s Insights, BMC Strategic Associates
Hyper Locals
Blind to Outside Threat
• Focus on competition within category over greater threat from Wine, Spirits, and (potentially) Cannabis
-13-
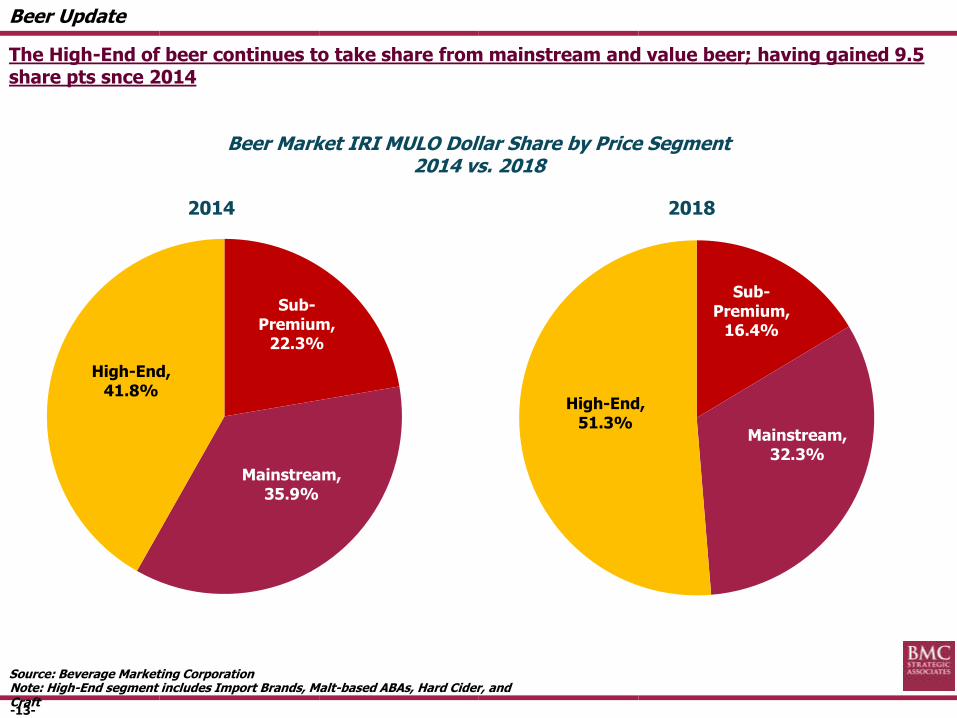
Sub-Premium,
16.4%
Mainstream, 32.3%
High-End, 51.3%
Beer Market IRI MULO Dollar Share by Price Segment2014 vs. 2018
Note: High-End segment includes Import Brands, Malt-based ABAs, Hard Cider, and Craft
The High-End of beer continues to take share from mainstream and value beer; having gained 9.5 share pts snce 2014
Source: Beverage Marketing Corporation
Sub-Premium,
22.3%
Mainstream, 35.9%
High-End, 41.8%
20182014
Beer Update
-14-
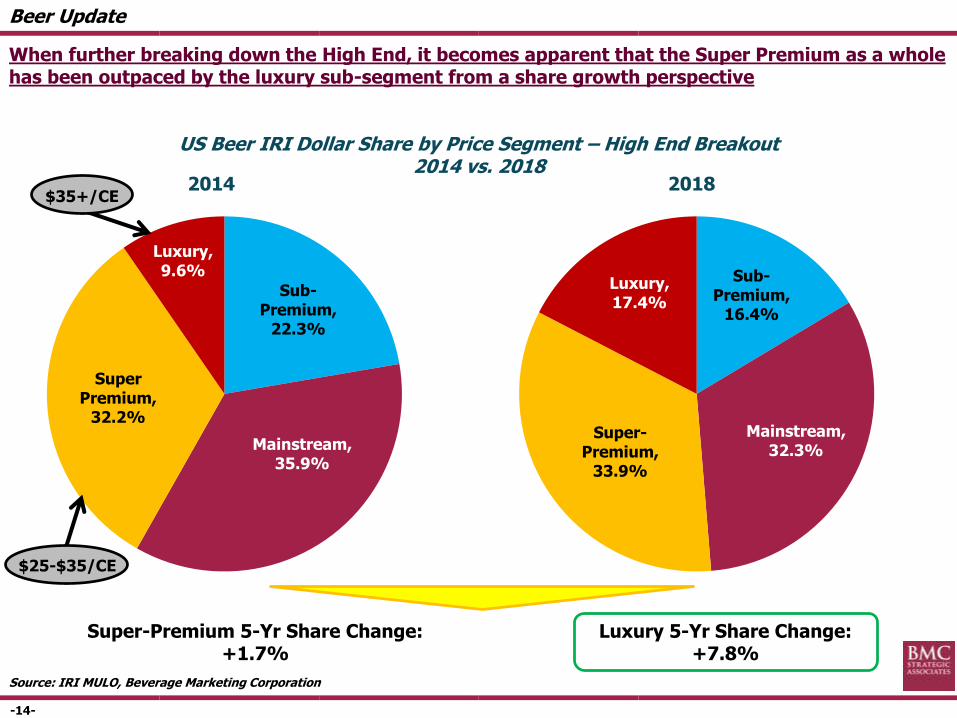
Sub-Premium,
16.4%
Mainstream, 32.3%
Super-Premium,
33.9%
Luxury, 17.4%
US Beer IRI Dollar Share by Price Segment – High End Breakout2014 vs. 2018
2018
When further breaking down the High End, it becomes apparent that the Super Premium as a whole has been outpaced by the luxury sub-segment from a share growth perspective
Source: IRI MULO, Beverage Marketing Corporation
2014
Sub-Premium,
22.3%
Mainstream, 35.9%
Super Premium,
32.2%
Luxury, 9.6%
Super-Premium 5-Yr Share Change: +1.7%
Luxury 5-Yr Share Change: +7.8%
$25-$35/CE
$35+/CE
Beer Update

-15-
Mainstream Beer Losses
The total Beer (malt beverage and cider) shipments declined 0.9% in 2018; but when you eliminate FMB’s and Local Craft Beer, it is closer to 3.0%
Beer Update
*Standard Beer – Beer styles broadly available to consumersSource: BMCSA Analysis, IRI MULO, Beer Business Insights
2017 2018 Growth
Total Beer 2,861.0 2,835.3 -0.9%
Less FMBs 141.7 163.7 +15.5%
Historical Beer 2,719.3 2,671.6 -1.8%
Less Local Craft 173.3 201.1 +16.1%
Standard Beer 2,546.0 2,470.5 -3.0%
-16-
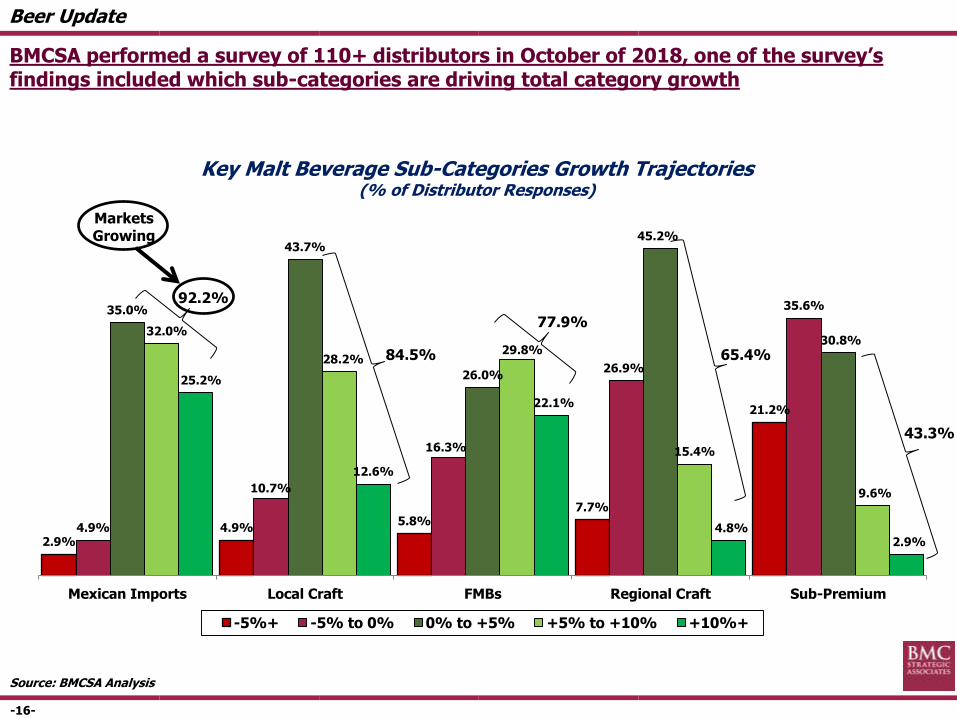
Key Malt Beverage Sub-Categories Growth Trajectories(% of Distributor Responses)
2.9%4.9%
5.8%7.7%
21.2%
4.9%
10.7%
16.3%
26.9%
35.6%35.0%
43.7%
26.0%
45.2%
30.8%32.0%
28.2%29.8%
15.4%
9.6%
25.2%
12.6%
22.1%
4.8%2.9%
Mexican Imports Local Craft FMBs Regional Craft Sub-Premium
-5%+ -5% to 0% 0% to +5% +5% to +10% +10%+
BMCSA performed a survey of 110+ distributors in October of 2018, one of the survey’s findings included which sub-categories are driving total category growth
92.2%
65.4%84.5%
77.9%
43.3%
Source: BMCSA Analysis
Markets Growing
Beer Update
-17-
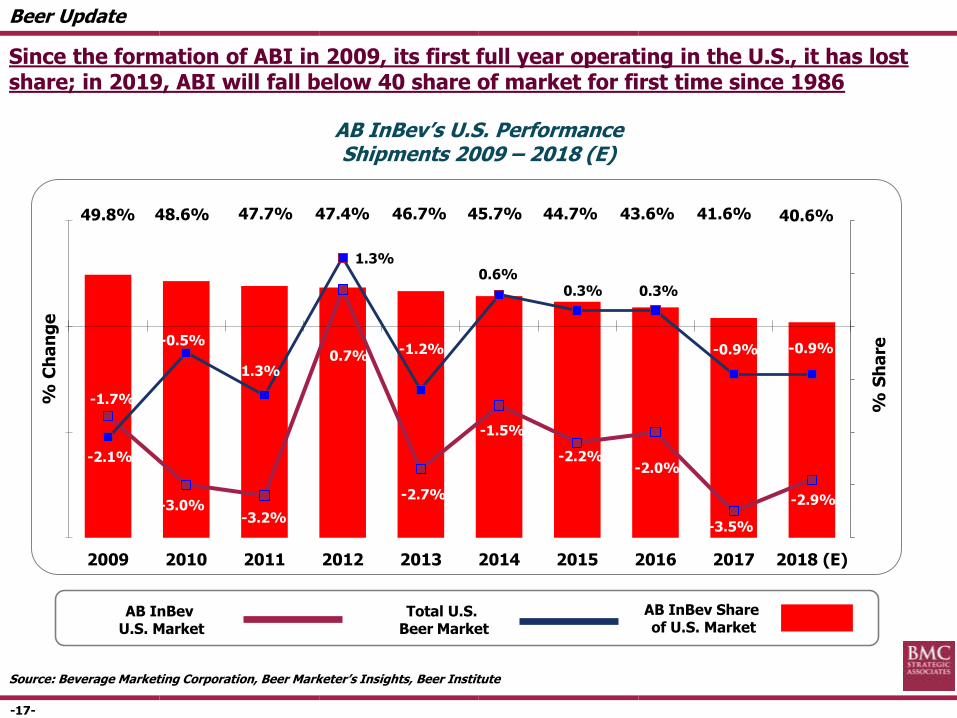
Since the formation of ABI in 2009, its first full year operating in the U.S., it has lost share; in 2019, ABI will fall below 40 share of market for first time since 1986
AB InBev’s U.S. Performance Shipments 2009 – 2018 (E)
Total U.S. Beer Market
AB InBev U.S. Market
49.8% 48.6% 47.7% 47.4% 46.7% 45.7% 44.7% 43.6% 41.6% 40.6%
-1.7%
-3.0%-3.2%
0.7%
-2.7%
-1.5%
-2.2%-2.0%
-3.5%
-2.9%
-2.1%
-0.5%
-1.3%
1.3%
-1.2%
0.6%0.3% 0.3%
-0.9% -0.9%
0.0%
10.0%
20.0%
30.0%
40.0%
50.0%
60.0%
-4.0%
-2.0%
0.0%
2.0%
2009 2010 2011 2012 2013 2014 2015 2016 2017 2018 (E)
% C
ha
ng
e
% S
ha
re
AB InBev Share of U.S. Market
Source: Beverage Marketing Corporation, Beer Marketer’s Insights, Beer Institute
Beer Update

-18-
Since 2012, the top 4 brewers in the US have lost a combined 7.1 share points in aggregate; this would be worse without Constellation’s 4.5 point share gain
• Combined ABI, MC & HUSA have lost 15.8 share points over the same period; the overall share loss in 2018 for the top 4 was at its lowest level since 2013
Top 4 Brewer’s U.S. Share Change Shipments 2012 – 2018
% S
ha
re
Source: Beverage Marketing Corporation, Beer Marketer’s Insights, Beer Institute
47.4% 46.7% 45.7% 44.7% 43.6% 41.5% 40.6%
28.2% 28.2% 27.3% 26.5% 25.5%24.4% 23.5%
6.0% 6.5% 7.1% 7.8% 8.6%9.4% 10.5%
3.9% 3.9% 3.9% 4.0% 3.9%3.8% 3.7%
2012 2013 2014 2015 2016 2017 2018 E
85.5% 85.2% 84.0% 83.0% 81.6% 79.1% 78.4%
Down 6.8%
Down 4.7%
Up 4.5%
Down 0.2%
Down 7.1%
Share vs. ‘12
STZ Share of U.S. Market
HUSA Share of U.S. Market
MC Share of U.S. Market
ABI Share of U.S. Market
Beer Update

-19-
Ag
en
da
Multiple Beverage Industry Trends
Beer Update
Spirits Update
Wine Update
2019 Beverage Alcohol Trend Analysis
Alternative Beverage Alcohol (ABA)

-20-
Source: Beverage Marketing Corporation
U.S. Distilled Spirits Market2010 – 2018 (MM 9-L Cases)
192
199
206209
212
216
221
225
229
170
180
190
200
210
220
230
240
+3.5%
+2.0%
+3.1%
+1.5%
+1.5%
+1.9%
+2.4%
+1.8%
Spirits Update
2010 2011 2012 2013 2014 2015 2016 2017 2018
Since 2010, the spirits category has been the best performing of beer, wine and spirits; growing at an annual CAGR of 2.2% since 2010
-21-
Source: Beverage Marketing Corporation
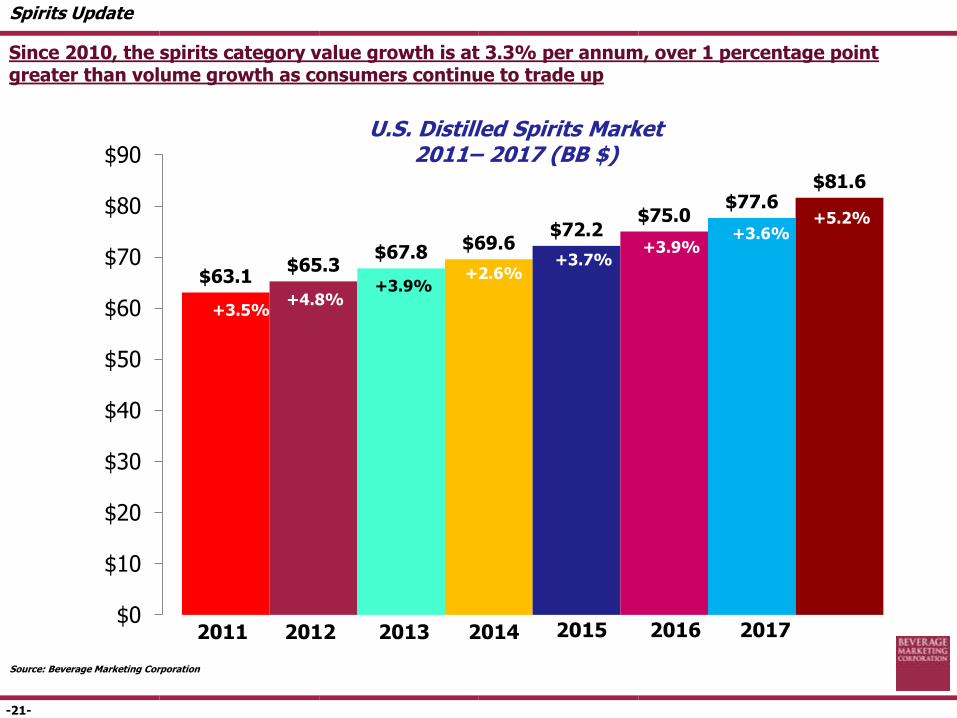
U.S. Distilled Spirits Market2011– 2017 (BB $)
$63.1$65.3
$67.8$69.6
$72.2$75.0
$77.6$81.6
$0
$10
$20
$30
$40
$50
$60
$70
$80
$90
+3.5%
+5.2%
Spirits Update
2011 2012 2013 2014 2015 2016 2017
+4.8%
+3.7%+2.6%
+3.6%
+3.9%
+3.9%
Since 2010, the spirits category value growth is at 3.3% per annum, over 1 percentage point greater than volume growth as consumers continue to trade up
-22-
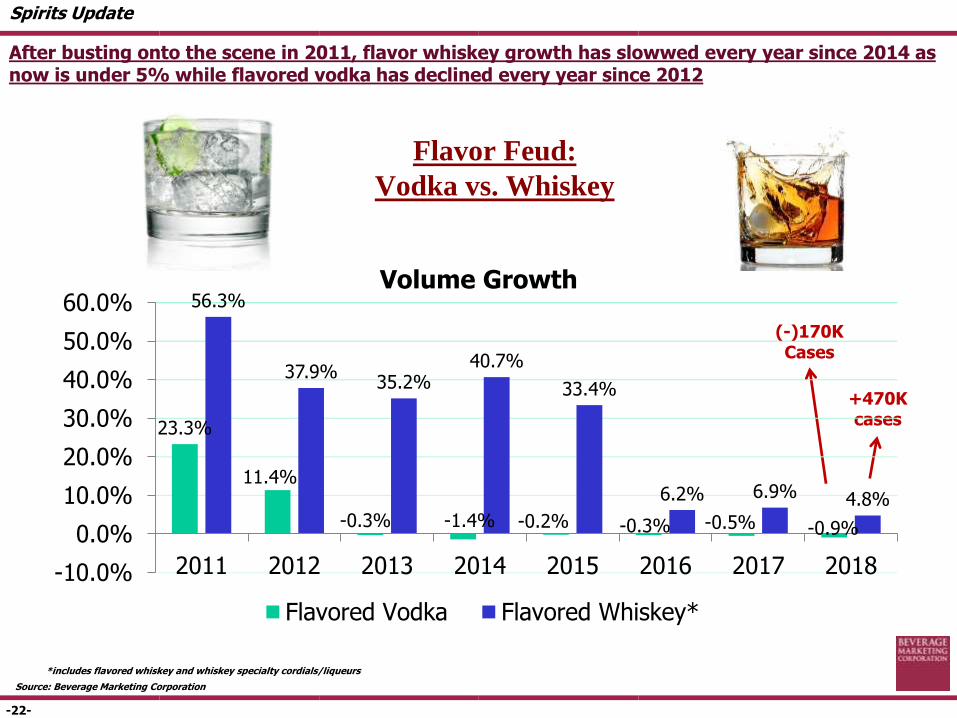
Flavor Feud:
Vodka vs. Whiskey
*includes flavored whiskey and whiskey specialty cordials/liqueurs
Volume Growth
Source: Beverage Marketing Corporation
+470Kcases
(-)170K Cases
Spirits Update
23.3%
11.4%
-0.3% -1.4% -0.2% -0.3% -0.5% -0.9%
56.3%
37.9%35.2%
40.7%
33.4%
6.2% 6.9% 4.8%
-10.0%
0.0%
10.0%
20.0%
30.0%
40.0%
50.0%
60.0%
2011 2012 2013 2014 2015 2016 2017 2018
Flavored Vodka Flavored Whiskey*
After busting onto the scene in 2011, flavor whiskey growth has slowwed every year since 2014 as now is under 5% while flavored vodka has declined every year since 2012

-23-
*includes flavored whiskey and whiskey specialty cordials/liqueurs
Source: Beverage Marketing Corporation
Spirits Update
Flavor Feud:
Vodka vs. Whiskey
7178
63
3226
20 1712
312
21 2515 12
7 30
20
40
60
80
100
2011 2012 2013 2014 2015 2016 2017 2018
Flavored Vodka Flavored Whiskey*
Product introductions
As growth of flavored whiskey and vodka has slowed, so has the number of new product introductions
-24-
Source: Beverage Marketing Corporation
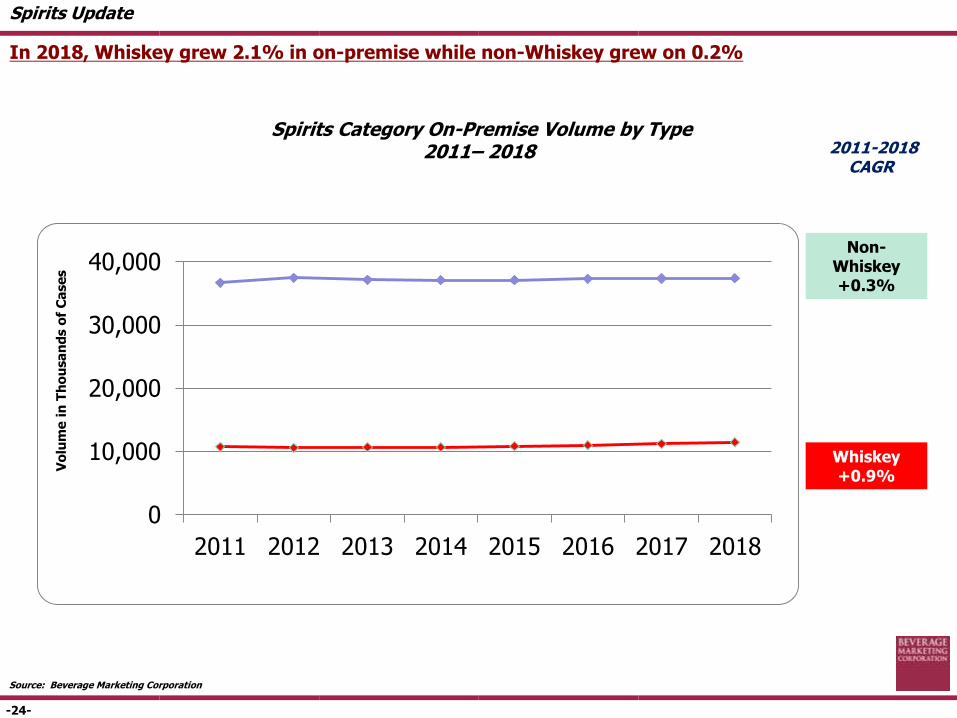
Spirits Category On-Premise Volume by Type2011– 2018 2011-2018
CAGR
In 2018, Whiskey grew 2.1% in on-premise while non-Whiskey grew on 0.2%
Spirits Update
Vo
lum
e i
n T
ho
usa
nd
s o
f C
ase
s
Non-Whiskey+0.3%
Whiskey+0.9%
0
10,000
20,000
30,000
40,000
2011 2012 2013 2014 2015 2016 2017 2018
-25-
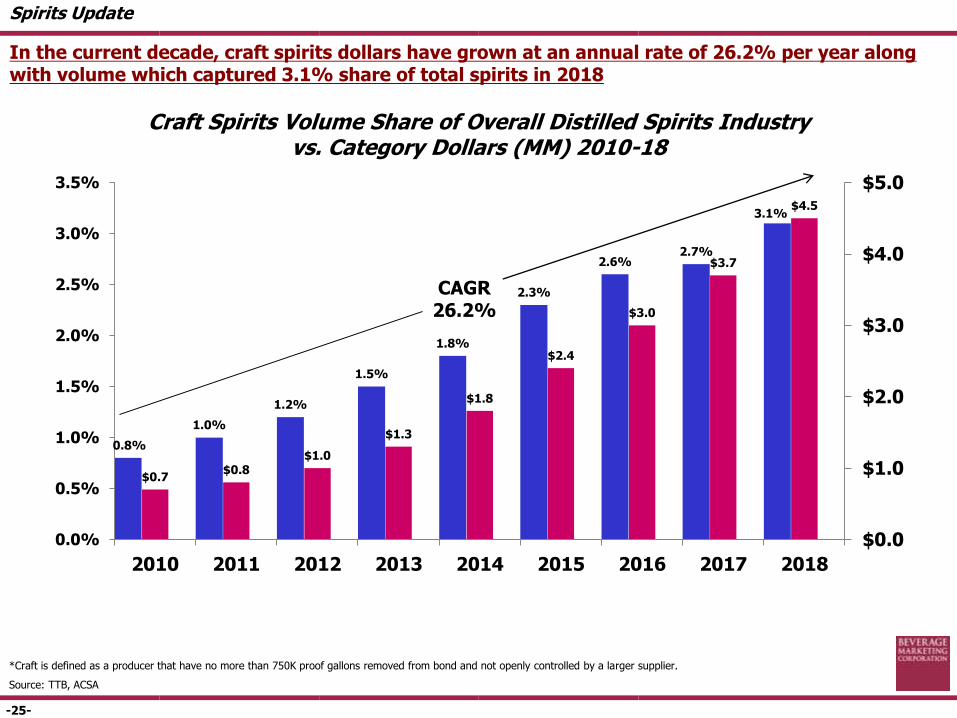
Craft Spirits Volume Share of Overall Distilled Spirits Industryvs. Category Dollars (MM) 2010-18
*Craft is defined as a producer that have no more than 750K proof gallons removed from bond and not openly controlled by a larger supplier.
Source: TTB, ACSA
0.8%
1.0%
1.2%
1.5%
1.8%
2.3%
2.6%2.7%
3.1%
$0.7$0.8
$1.0
$1.3
$1.8
$2.4
$3.0
$3.7
$4.5
$0.0
$1.0
$2.0
$3.0
$4.0
$5.0
0.0%
0.5%
1.0%
1.5%
2.0%
2.5%
3.0%
3.5%
2010 2011 2012 2013 2014 2015 2016 2017 2018
Spirits Update
CAGR26.2%
In the current decade, craft spirits dollars have grown at an annual rate of 26.2% per year along with volume which captured 3.1% share of total spirits in 2018
-26-
Source: Beverage Marketing Corp., Technomic Inc.
Spirits Update
Bars and full-service restaurants are top locations for adult beverage occasions
• Slowed consumer traffic on premise and stagnancy in occasions involving adult beverages translated to a slight 0.3% increase in total alcohol volume in restaurants and bars in 2018
Shifting on premise account performance
• Market strength is small independent full service restaurants while casual chain restaurants experience challenges. E-commerce sites, e.g. Uber Eats and Grub hub, are aiding at home consumption helping certain restaurants with food sales while hurting on premise alcohol sales
Aged spirits strength continues
• Aged Whiskey and Tequila continue to retain relevance with today’s consumers, especially in restaurants and bars
Vodka On Premise Struggles
• Although vodka remains the best selling spirit category in the on premise, more flavorful spirits such as whiskey continue to grow share in the channel. When vodka was strong, imported and flavor vodka lead the category. Today they are dragging down overall vodka performance.
Adult Beverage Consumer AttitudesOn Premise
In 2018, on premise volume increased 0.3% driven by strength of small independent full service restaurants. Whiskey continues to drive consumption at expense of Vodka

-27-
The industry is using innovation to keep up with changing consumer preferences
• Flavor continues to be a focus area for distillers along with aging which is used to promote uniqueness of offerings
• Using the flexibility of spirits, specialized cocktails are being made using specific types of new spirit styles created by craft distillers
Some examples of these products include new flavor launches such as:
• Sour cherry gin
• Peppermint flavored whiskey
• Hybrid products such as vodka with a blend of rose’ wine
There has also been an influx of different aging methods utilizing wine and beer barrels to produce unique flavor profiles, which include:
• Run finished in Vermouth casks
• Single malt whiskey aged in Ex=Bourbon barrels and finished in Oloroso Sherry casks
• Irish whiskey finished in stout barrels
• Straight whiskey finished in maple syrup barrels
Distiller’s Innovation focused on Aging and Flavors
Spirits Update
Innovation is being used in an attempt by distillers to keep ahead of consumers seeking greater and newer alternatives
-28-
Ag
en
da
Multiple Beverage Industry Trends
Beer
Spirits
Wine
2019 Beverage Alcohol Trend Analysis
Alternative Beverage Alcohol (ABA)
-29-
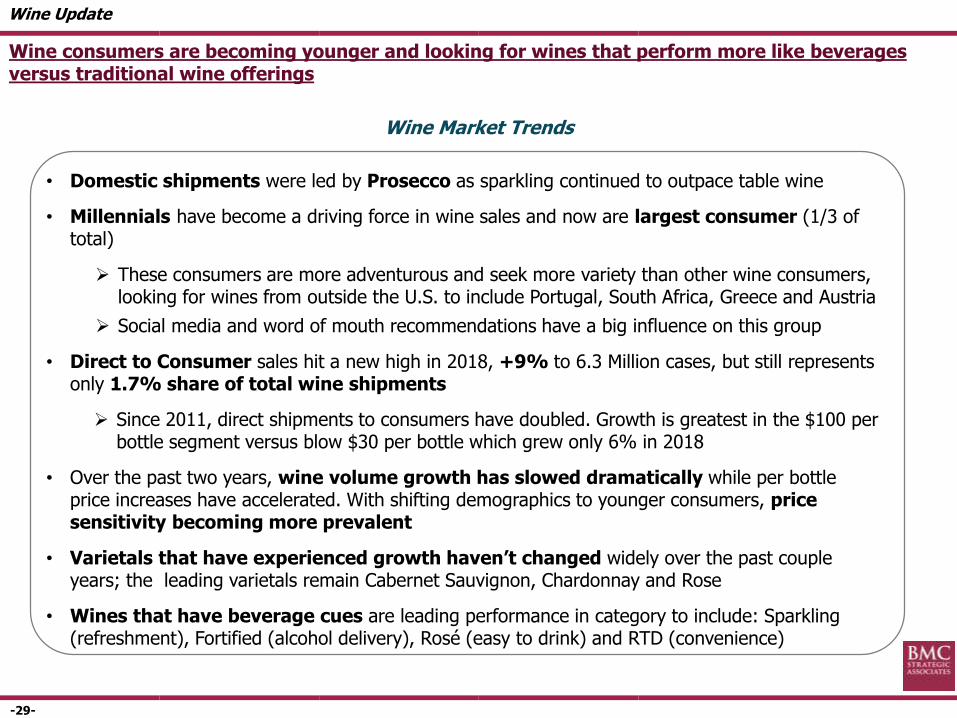
Wine Market Trends
• Domestic shipments were led by Prosecco as sparkling continued to outpace table wine
• Millennials have become a driving force in wine sales and now are largest consumer (1/3 of total)
These consumers are more adventurous and seek more variety than other wine consumers, looking for wines from outside the U.S. to include Portugal, South Africa, Greece and Austria
Social media and word of mouth recommendations have a big influence on this group
• Direct to Consumer sales hit a new high in 2018, +9% to 6.3 Million cases, but still represents only 1.7% share of total wine shipments
Since 2011, direct shipments to consumers have doubled. Growth is greatest in the $100 per bottle segment versus blow $30 per bottle which grew only 6% in 2018
• Over the past two years, wine volume growth has slowed dramatically while per bottle price increases have accelerated. With shifting demographics to younger consumers, price sensitivity becoming more prevalent
• Varietals that have experienced growth haven’t changed widely over the past couple years; the leading varietals remain Cabernet Sauvignon, Chardonnay and Rose
• Wines that have beverage cues are leading performance in category to include: Sparkling (refreshment), Fortified (alcohol delivery), Rosé (easy to drink) and RTD (convenience)
Wine Update
Wine consumers are becoming younger and looking for wines that perform more like beverages versus traditional wine offerings
-30-
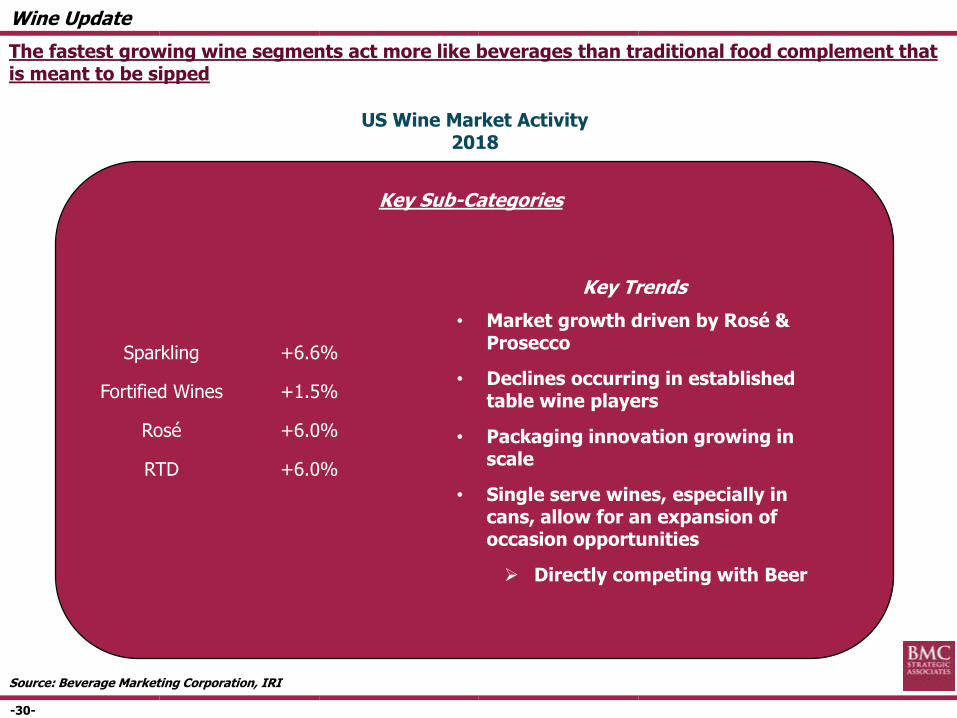
US Wine Market Activity2018
Key Sub-Categories
Sparkling +6.6%
Fortified Wines +1.5%
Rosé +6.0%
RTD +6.0%
Key Trends
• Market growth driven by Rosé & Prosecco
• Declines occurring in established table wine players
• Packaging innovation growing in scale
• Single serve wines, especially in cans, allow for an expansion of occasion opportunities
Directly competing with Beer
The fastest growing wine segments act more like beverages than traditional food complement that is meant to be sipped
Source: Beverage Marketing Corporation, IRI
Wine Update

-31-
P: PreliminarySource: Beverage Marketing Corporation
U.S. Wine Market2011 – 2018P
338.1
345.6
353.1
357.8360.9
368.3370.0 370.5
320
330
340
350
360
370
380
2011 2012 2013 2014 2015 2016 2017 2018p
+1.4%
+0.9%
+2.0%
+2.2%
+0.5% +0.2%
Mill
ions
of
Nin
e L
iter
Case
s
+2.2%
The wine market volume growth has slowed over the past two years to near flat in 2018
Wine Update
-32-
P: PreliminarySource: Beverage Marketing Corporation
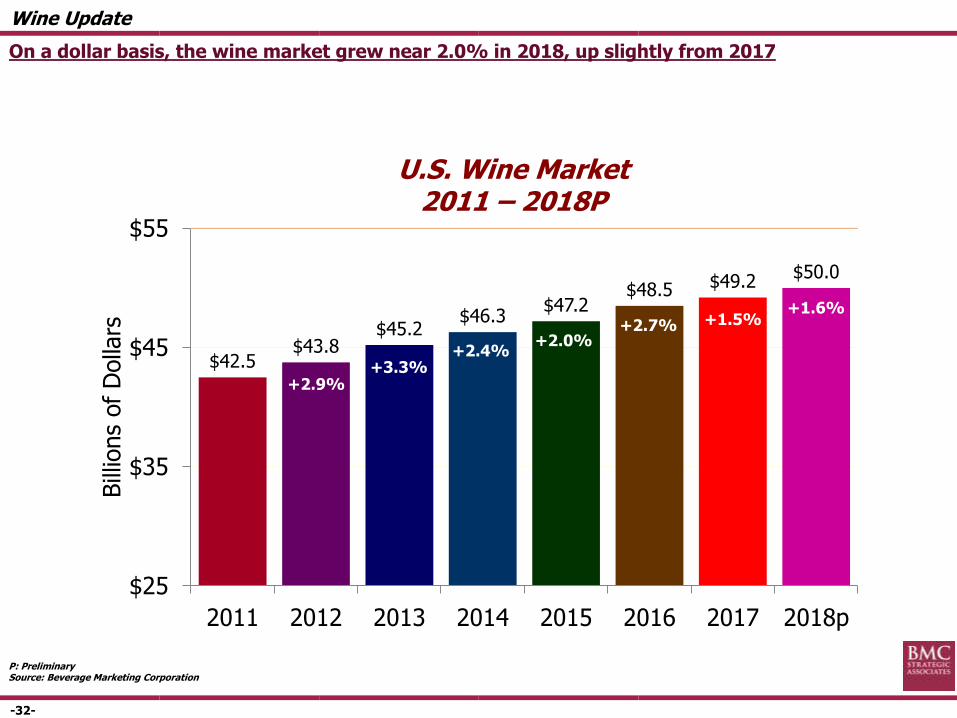
U.S. Wine Market2011 – 2018P
$42.5$43.8
$45.2$46.3
$47.2$48.5 $49.2
$50.0
$25
$35
$45
$55
2011 2012 2013 2014 2015 2016 2017 2018p
Bill
ions
of
Dolla
rs
+2.9%
+2.4%+2.0%
+2.7%
+3.3%
+1.5%+1.6%
On a dollar basis, the wine market grew near 2.0% in 2018, up slightly from 2017
Wine Update

-33-
11.3%
13.6%14.6%
19.1%18.3% 17.8%
15.3%17.7%
18.6%
27.1%
33.9%33.3%
27.2%
16.5% 15.7%
0.0%
5.0%
10.0%
15.0%
20.0%
25.0%
30.0%
35.0%
40.0%
2011 2015 2018p
Super-Premium ($15.00 and above) Premium ($12.00-$14.99) Popular Premium ($9.00-$11.99)
Fighting Varietal ($6.00-$8.99) Value ($5.99 and below)
Table Wine Volume Sales by Price Tier 2011, 2015 & 2018p
Sweet spot for Millennial consumers
The super-premium segment continues to outperform consistent with trading up in other beverage alcohol segments while the popular premium, $9.00 - $11.99 appeals to millennials
Wine Update
-34-
23.7%22.4%
11.9%13.6%
11.1%
8.9%
4.6%
7.7%
6.0%
7.4%
9.8%
5.8%5.1% 5.7%
1.4%
4.6%
26.4%
23.9%
0.0%
5.0%
10.0%
15.0%
20.0%
25.0%
30.0%
2010 2018p
Chardonnay Cabernet Sauvignon Merlot Pinot Grigio Pinot Noir
White Zinfandel Blush/Rose' Red Blend Other
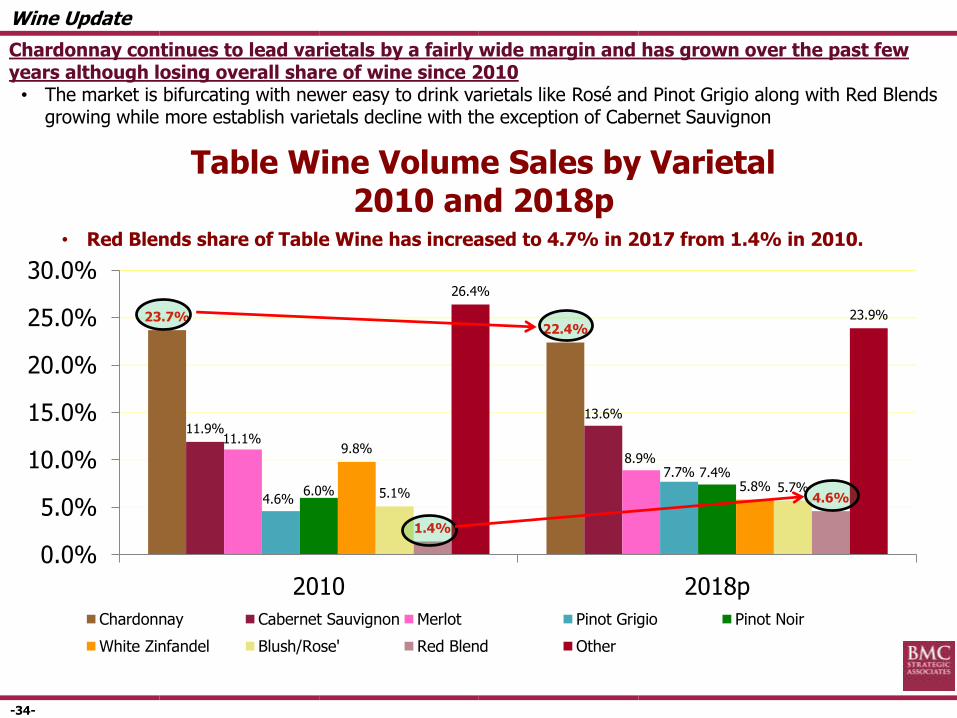
Table Wine Volume Sales by Varietal2010 and 2018p
• Red Blends share of Table Wine has increased to 4.7% in 2017 from 1.4% in 2010.
Chardonnay continues to lead varietals by a fairly wide margin and has grown over the past few years although losing overall share of wine since 2010• The market is bifurcating with newer easy to drink varietals like Rosé and Pinot Grigio along with Red Blends
growing while more establish varietals decline with the exception of Cabernet Sauvignon
Wine Update

-35-
House wine varietals are selling athigh-end craft beer prices. Single serve offerings in can have exploded in the market
Health and Wellness / Functionality
Wine in a Can
ABI purchased a minority stake in Swish, makers of Babe Rosé in March 2018; product is gaining distribution and will compete in the alcohol refreshment space. Although small, the brand poses a potential threat to beer
Wine’s penetration into the ABA space is accelerating with cans and is positioned to source volume from female consumers
• Wine single-serve beverages at 15 million cases and growing mid to high single digits
Wine Update
-36-
Ag
en
da
Multiple Beverage Industry Trends
Beer Update
Spirits Update
Wine Update
2019 Beverage Alcohol Trend Analysis
Alternative Beverage Alcohol (ABA)
-37-
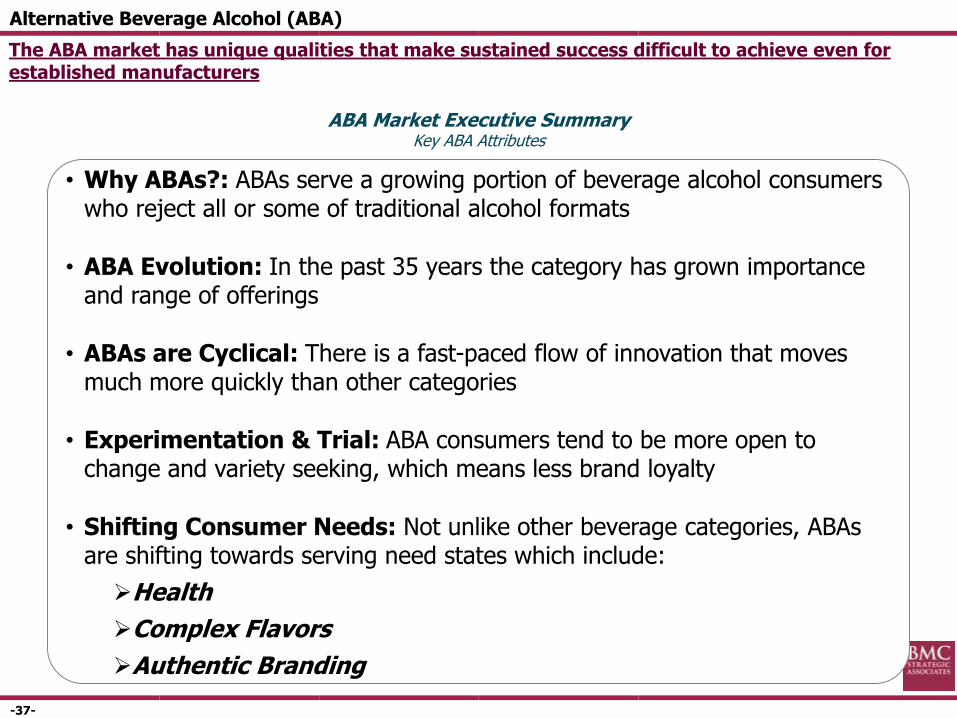
• Why ABAs?: ABAs serve a growing portion of beverage alcohol consumers who reject all or some of traditional alcohol formats
• ABA Evolution: In the past 35 years the category has grown importance and range of offerings
• ABAs are Cyclical: There is a fast-paced flow of innovation that moves much more quickly than other categories
• Experimentation & Trial: ABA consumers tend to be more open to change and variety seeking, which means less brand loyalty
• Shifting Consumer Needs: Not unlike other beverage categories, ABAs are shifting towards serving need states which include:
Health
Complex Flavors
Authentic Branding
The ABA market has unique qualities that make sustained success difficult to achieve even for established manufacturers
ABA Market Executive SummaryKey ABA Attributes
Alternative Beverage Alcohol (ABA)

-38-
275.6 million 288oz cases
9.9% EQ Share of Beer
47%
16%17%
15% 4%
ABA Volume bySub-Segment - 2018
ABA Growth 2014-2018Volume in ‘000 288 Cases
Alternative-Beverage-Alcohol (ABA) sales will reach 275 million cases by end of 2018. Since 2014 classic FMBs, Hard Ciders and Flavored Craft Beers have gained the most volume
Volu
me in 2
88oz
Case
s
+36,000
CAGR %
-1.2% +2.3% +0.3% +2.2% +4.7% +31.0% -4.8% -22.1% +3.7%
Alternative Beverage Alcohol (ABA)
-39-
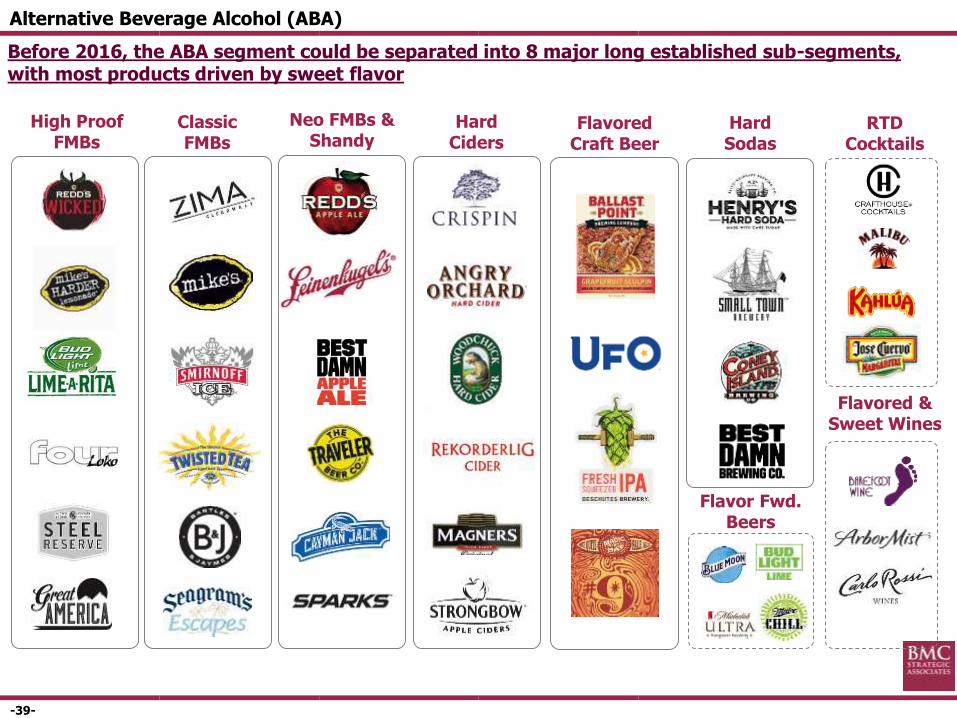
High Proof FMBs
Classic FMBs
Hard Ciders
Hard Sodas
Neo FMBs & Shandy
RTD Cocktails
Flavored & Sweet Wines
Flavor Fwd. Beers
Before 2016, the ABA segment could be separated into 8 major long established sub-segments, with most products driven by sweet flavor
Flavored Craft Beer
Alternative Beverage Alcohol (ABA)
-40-
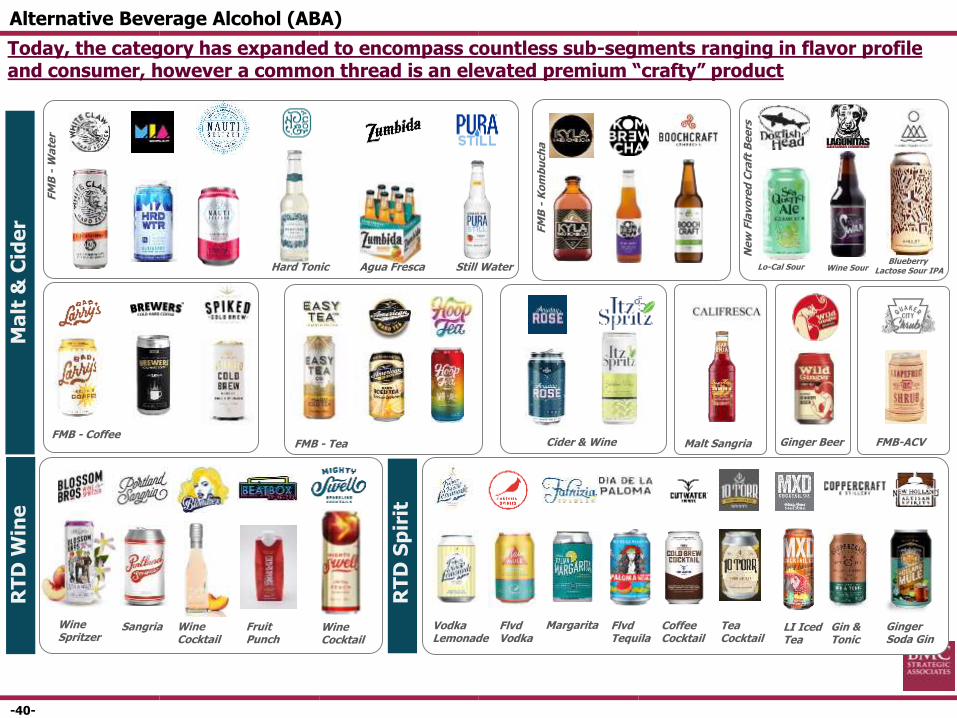
Agua Fresca Still WaterHard Tonic
Malt Sangria FMB-ACVCider & Wine Ginger Beer
Wine Spritzer
Sangria Wine Cocktail
Fruit Punch
Wine Cocktail
Margarita Coffee Cocktail
Flvd Vodka
Flvd Tequila
Tea Cocktail
Ginger Soda Gin
LI Iced Tea
Gin & Tonic
Vodka Lemonade
FMB - CoffeeFMB - Tea
FM
B -
Wa
ter
FM
B -
Ko
mb
uch
a
Ma
lt &
Cid
er
RT
D W
ine
RT
D S
pir
it
Today, the category has expanded to encompass countless sub-segments ranging in flavor profile and consumer, however a common thread is an elevated premium “crafty” product
Ne
w F
lavo
red
Cra
ft B
ee
rs
Lo-Cal Sour Wine SourBlueberry
Lactose Sour IPA
Alternative Beverage Alcohol (ABA)

-41-
Ben Weiss:Crook & Marker
MillerCoors: Cape Line
Boston Beer:Wild Leaf & Tura
Specialty Water:
CBD
Wild Leaf Hard Tea
Tura Hard Kombucha
CANarchy:Wild Basin
2019 Innovation – ABAs & Specialty Water
• A driving force in Cannabis approaching the mainstream will be CBD (the non-psychoactive element of the flower). Its growing interest is leading to infused beverages which may compete with Beverage Alcohol
Innovation in both the ABA & Specialty Water categories will only accelerate in 2019, as major players look to join established smaller brands in key sub-segments
Alternative Beverage Alcohol (ABA)
-42-
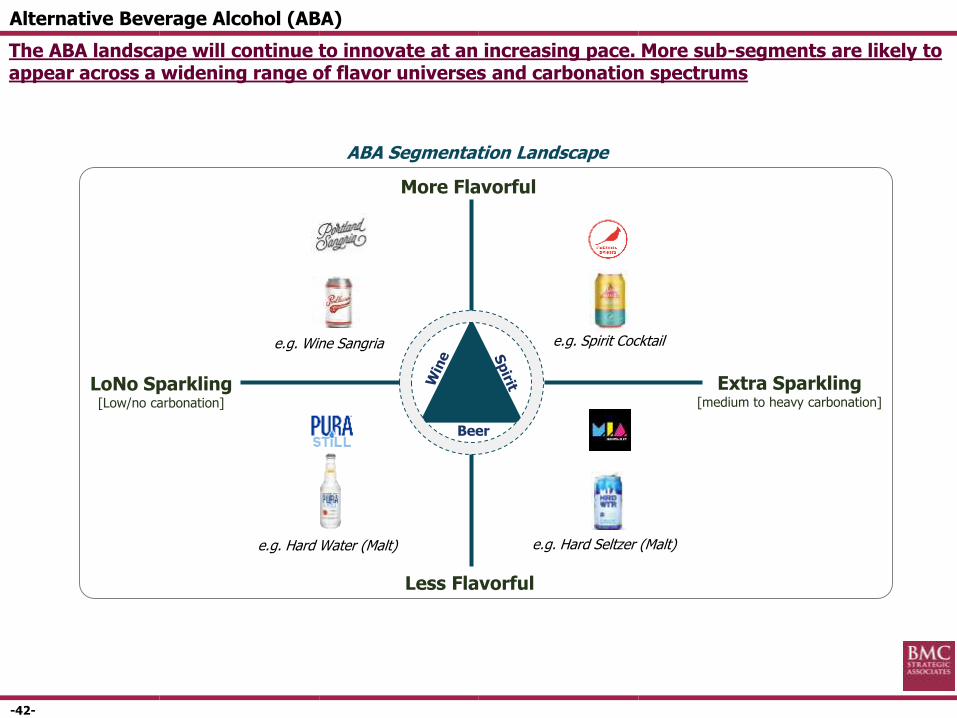
LoNo Sparkling[Low/no carbonation]
Extra Sparkling[medium to heavy carbonation]
More Flavorful
Less Flavorful
Beer
e.g. Wine Sangria e.g. Spirit Cocktail
e.g. Hard Water (Malt) e.g. Hard Seltzer (Malt)
The ABA landscape will continue to innovate at an increasing pace. More sub-segments are likely to appear across a widening range of flavor universes and carbonation spectrums
ABA Segmentation Landscape
Alternative Beverage Alcohol (ABA)
-43-
Alternative Beverage Alcohol (ABA)
What is next?
What are the solutions to future consumer needs?
Welcome Brian Jorgensen: McCormick and Company to discuss
potential solutions to questions above


