dot/faa/am-02/2 power: objective activity and … · principal components analysis , system...
TRANSCRIPT
DOT/FAA/AM-02/2
Scott H. MillsSBC Technology Resources, Inc.Austin, TX 78759
Elaine M. PfleidererCarol A. ManningCivil Aerospace Medical InstituteFederal Aviation AdministrationOklahoma City, OK 73125
February 2002
Final Report
This document is available to the publicthrough the National Technical InformationService, Springfield, VA 22161.
POWER: Objective Activityand Taskload Assessment inEn Route Air Traffic Control
Office of Aerospace MedicineWashington, DC 20591

N O T I C E
This document is disseminated under the sponsorship ofthe U.S. Department of Transportation in the interest of
information exchange. The United States Governmentassumes no liability for the contents thereof.

i
Technical Report Documentation Page
1. Report No. 2. Government Accession No. 3. Recipient's Catalog No.
DOT/FAA/AM-02/2
4. Title and Subtitle 5. Report Date
February 2002POWER: Objective Activity and Taskload Assessment in En Route AirTraffic Control
6. Performing Organization Code
7. Author(s) 8. Performing Organization Report No.
Mills, S.H.1, Pfleiderer, E.M.2, and Manning, C.A.2
9. Performing Organization Name and Address 10. Work Unit No. (TRAIS)1SBC Tech. Resources, Inc. 2FAA Civil Aerospace Medical InstituteAustin, TX 78759 P.O. Box 25082
Oklahoma City, OK 73125 11. Contract or Grant No.
12. Sponsoring Agency name and Address 13. Type of Report and Period Covered
Office of Aerospace MedicineFederal Aviation Administration800 Independence Ave., S.W.Washington, DC 20591 14. Sponsoring Agency Code
15. Supplemental Notes
This report was prepared in support of approved subtask # AM-B-01-HRR-516.16. Abstract
Two computer programs, the National Airspace System (NAS) Data Management System (NDMS) and thePerformance and Objective Workload Evaluation Research (POWER) program, have been developed toprovide a platform for quantifying en route air traffic controller activity and taskload. The NDMS programextracts data produced by en route mainframe computers and encodes the information into database files thatprovide efficient storage and access. The POWER program calculates specific measures using aircraft positionsand controller data entries. The development and use of such measures is important for establishing baselineactivity measures and for evaluating modifications to ATC systems. NAS System Analysis Recording (SAR)data were collected from the Jacksonville en route air traffic control center between 8:30-10:30 a.m. andbetween 12:00-2:00 p.m. (local time) for each of four consecutive days. POWER measures were computed in30-minute intervals for all active sectors. A Principal Components Analysis (PCA) was conducted to evaluatethe current set of POWER variables and provide guidelines for the addition of new measures or themodification of existing ones. PCA with Varimax rotation converged in seven iterations and produced fivecomponents with eigenvalues > 1. Cumulatively, the four components accounted for 68.18% of the variabilityin the data set: Component 1 (Activity) accounted for 26%, Component 2 (Flight Path Variability)accounted for nearly 13%, Component 3 (Objective Workload) accounted for 11%, Component 4 (D-sideActivity) accounted for 9%, and Component 5 (Overload) accounted for approximately 8%. Variablescomprising the five extracted components provided valuable information about the underlying dimensions ofthe NAS data set. Additions or modifications that might improve the ability of POWER to describe ATCactivity and taskload were identified.
17. Key Words 18. Distribution Statement
Document is available to the public through theNational Technical Information Service;
Air Traffic Control, Taskload Measures, Activity Measures,Principal Components Analysis , System AnalysisRecordings, Data Analysis Reduction Tool, National TrackAnalysis Program, NAS Data Management System
Springfield, VA 22161
19. Security Classif. (of this report) 20. Security Classif. (of this page) 21. No. of Pages 22. Price
Unclassified Unclassified 22Form DOT F 1700.7 (8-72) Reproduction of completed page authorized


1
POWER: OBJECTIVE ACTIVITY AND TASKLOAD ASSESSMENT
IN EN ROUTE AIR TRAFFIC CONTROL
Two computer programs, the National AirspaceSystem (NAS) Data Management System (NDMS)and the Performance and Objective Workload Evalu-ation Research (POWER) program, have been devel-oped to provide a platform for quantifying en route airtraffic controller activity and taskload. The NDMSprogram extracts data produced by en route main-frame computers and encodes the information intodatabase files that provide efficient storage and access.The POWER program calculates specific measuresusing aircraft positions and controller data entries.The development and use of such measures is impor-tant for establishing baseline activity measures and forevaluating modifications to ATC systems.
En Route Air Traffic ControlIn the continental United States, air traffic between
terminal areas is controlled by a network of 20 AirRoute Traffic Control Centers (ARTCCs). Collec-tively, these facilities handle over 40 million flightsannually. Each ARTCC has responsibility for a por-tion of airspace that is divided into discrete sectors,with a single controller or team of controllers workingtraffic in each sector. A typical sector workstation is
equipped with a radar console, a flight progress stripbay, one or more auxiliary text displays, input devices,and a communications panel (see Figure 1).
Each sector workstation is staffed by one to threecontrollers, referred to as the R-side (radar), D-side(data), and A-side (associate). The R-side controlleroperates the radar console and communicates directlywith aircraft pilots by radio. The D-side controllermanages the flight progress strip bay, performs pre-planning duties, and coordinates with other control-lers. The A-side controller provides administrativeassistance to the R-side and D-side controllers, in-cluding delivering flight strips from the printer to thesector workstation.
The radar console consists of a 20”x20” electronicscreen (called the Main Display Monitor, MDM) thatdisplays a map of the sector airspace, aircraft positionsymbols, and aircraft information tags, called datablocks. The data blocks indicate flight informationsuch as sector ownership, aircraft identity, altitude,ground speed, handoff information, and sometimesdestination, which is updated as the informationchanges. Lists of aircraft in potential conflict, departingaircraft, and other information also appear on the
Figure 1. En route Sector Workstation
2
radar screen. The MDM also features an R-side Com-puter Readout Device (R-CRD) view (or, window)that displays information such as command entriesand system messages for the R-side controller. Similarfunctionality and information is available on the D-side controller’s monitor. A monitor is located on theA-side console as well, although its functions arerelatively limited. The flight progress strip bay con-tains paper flight progress strips that display flightinformation for individual aircraft. Flight progressstrips contain more information about each flight,compared with the data blocks, such as equipmenttype and planned flight route. Controllers use a key-board and a pointing device (trackball) to enter com-mands and information, such as assigned altitudelevels, into the system.
Changes in Air Traffic ControlThe number of flights handled annually by ARTCCs
is projected to rise from over 40 million in the year2000 to more than 76 million by 2025, an increase ofmore than 90% (FAA, 1999). To accommodate thisincrease in air traffic, the FAA is updating and mod-ernizing the air traffic control system with the intro-duction of new automation systems and relatedoperational procedures. Recently, Display SystemReplacement (DSR) equipment was installed in allARTCCs. DSR replaced the older, plan view displayradar consoles with modern workstations such as theone shown in Figure 1. The DSR system was designedto be modified and enhanced through software up-grades, including decision support tools (DSTs), andseveral such modifications are planned for implemen-tation. One DST is the User Request Evaluation Tool(URET) which is currently being evaluated in severalen route facilities and is expected to be deployednationwide. URET provides controllers with enhancedconflict alert and resolution functions as well as anelectronic aircraft list. Another DST, Problem Analy-sis Resolution and Ranking (PARR), will provideautomated resolution advisories. As new systems andprocedures are added to the en route controller’s workdomain, it will be important to be able to assess theexpected benefits and effects of such changes oncontroller activity and taskload.
History of Workload, Taskload, and ComplexityMeasurement
Several studies have explored sector activity andtaskload in various ways using simulation studies(Buckley, DeBaryshe, Hitchner, & Kohn, 1983; Stein,
1985; Mogford, Murphy, and Guttman, 1994; Pawlak,Brinton, Crouch, and Lancaster, 1996). The method-ology most often used assumes that many variablesaffecting activity in an airspace also influence theperceived workload and the objective taskload of thecontroller. For example, as the number of aircraft inan airspace increases, one might expect the controllerto perceive a higher workload level and perform moreactivities to maintain safe separation and efficienttraffic flow, depending on the difficulty or complexityof the ATC situation. The variables examined in suchstudies have been described with various terms, in-cluding workload (the perceived level of effort re-quired to accomplish a task), taskload, (the amount ofactivity required to accomplish a task), and complex-ity (the number or combination of elements influenc-ing workload and taskload).
Buckley, DeBaryshe, Hitchner, and Kohn (1983)conducted a study consisting of a series of experi-ments in an ATC simulation environment and, as aresult, identified a set of four general ATC factors(Conflict, Occupancy, Communications, and Delay)and two auxiliary measures that appeared to adequatelyrepresent all other ATC measures (Number of AircraftHandled and Fuel Consumption). The authors rec-ommended the use of these measures for subsequentair traffic simulation studies. In a separate study, Stein(1985) exposed controllers to different levels of air-space activity and concluded that three variables (i.e.,Aircraft Count, Clustering, and Restricted Airspace)significantly influenced mental workload. More re-cently, Mogford, Murphy, and Guttman (1994) usedverbal reports from air traffic control specialists andmultidimensional scaling to identify a list of 16 fac-tors that contribute to airspace complexity. Finally,Pawlak, Brinton, Crouch, and Lancaster (1996) fo-cused on controllers’ strategies and decision-makingactivities and proposed a list of 15 factors that mayinfluence perceived air traffic complexity.
Simulation studies such as those cited have manyadvantages, like the ability to construct and manipu-late the air traffic scenarios used in experiments. Thisallows them to design studies to answer specific re-search questions. Another advantage of simulationstudies is that because the participants are not control-ling live air traffic, researchers have the freedom tomanipulate conditions and measure different vari-ables without disrupting the controllers’ task. Forexample, situation awareness ratings can be collectedby freezing a scenario periodically and administeringtest instruments to participants. This interruption

3
would not be possible during actual air traffic control.As a result, the internal validity of conclusions basedon simulation studies can be maximized.
While simulation studies are valuable tools forinvestigating many types of research questions, thereare also certain disadvantages that limit their useful-ness. For example, while it is desirable to use experi-enced controllers as participants because they arehighly trained in the task of ATC, it can be difficultto obtain sufficient numbers of controllers who areavailable for participation. Another disadvantage canbe the expense of maintaining and operating a highlycomplex ATC simulation facility. Additionally, theparticipants’ knowledge that they are being observedduring an experiment may alter their behavior. Fi-nally, as in all experimental research, there is theproblem that external validity may be decreased as aresult of the manipulation of experimental condi-tions. Consequently, decreased external validity maylimit the extent to which conclusions based on suchstudies are generalizable to other settings.
In contrast to simulation studies, taskload andactivity measures based on routinely-recorded live airtraffic data have certain complimentary advantages.First, participants do not have to be recruited ortested, since measures are based on the actual execu-tion of the task. Second, data recording is a routineprocedure of every ARTCC and because data arerecorded by the ATC computers, participants are notdisturbed as they perform their jobs; that is, datacollection is unobtrusive. Finally, because conditionsare not manipulated by the researcher, the externalvalidity of these studies is maximized. Therefore,conclusions based on the analysis of routinely-re-corded data may be more generalizable to other set-tings than those based on simulator studies.
The most notable disadvantage of studies based onrecorded data is that because the experimenter cannotmanipulate conditions, the research is observationalrather than experimental. This minimizes the studies’internal validity and limits the ability of researchers todraw conclusions about relationships between vari-ables. Another significant disadvantage is that the setof measures used in such research is limited to thosethat can be derived from the data routinely recordedby the ATC computers.
Other issues related to analysis of recorded ATCdata include the requirement for data storage andorganization, and proper computation of relevanttaskload measures. Recently, however, two softwareapplications, the NAS Data Management System
(NDMS) and Performance and Objective WorkloadEvaluation Research (POWER), have been developedto address these issues.
System Analysis RecordingAs part of the normal operation of ARTCCs, many
types of information are routinely recorded by ATCcomputers. The computer that performs radar anddata processing is the IBM 9672-Generation 3, re-ferred to as the HOST computer. This mainframesystem receives and organizes radar and flight infor-mation and presents it to the controller at the sectorworkstation. It also accepts commands and informa-tion from the controller through various input de-vices. As these interactions occur, the HOST recordsrelevant activity in the form of SAR data. This infor-mation is stored on magnetic tape and normallyretained by the ARTCC for at least 15 days for thepurpose of system evaluation, although the tapes maybe stored longer if they are needed to review incidentsor accidents. SAR reports include information aboutdata displayed at the sector workstations or printed onflight progress strips, controller input to the system,and other flight information.
SAR data are written in Jovial, a binary computerlanguage developed to process ATC information onthe HOST computer, which is not easily interpretableby humans. However, two data reduction programs,the Data Analysis and Reduction Tool (DART) andthe National Track Analysis Program (NTAP) can beused to produce reports of selected subsets of the SARdata. These programs are run on the HOST computerand produce several types of text-based reports.
The DART program produces the Log report,which contains a variety of system messages. Theseinclude controllers’ keyboard and trackball entriesinto the system, as well as all information that was sentby the HOST to the radar display and the auxiliarytext display, such as data blocks and list items. TheLog report also includes records of all flight progressstrip messages. In addition to the Log report, DARTalso produces the Track report, which contains de-tailed information from the HOST computer’s inter-nal radar track database. This includes data such aseach tracked flight’s heading, speed, altitude, andposition. The NTAP program produces the Beaconand Weather reports. These reports indicate the posi-tions of aircraft beacon and weather symbols on theradar display. A partial listing of the contents of Logand Track reports can be found in Table 1. Anexample of the type of data available can be seen inFigures 2 and 3.

4
Table 1. Log and Track Reports – Partial Contents
LOG Report TRACK Report
Controller Entries Projected Flight Position
Data Block Contents Flight Altitude, Heading, and Speed
Auxiliary Text Display Messages Controlling Sector
Flight Progress Strip Information Flight Assigned Altitude
----------------------------------------------------------------------------------------------1 LOG SORT=AID,TIME NAS ID=JX11E015 NAS DATE=09/06/98 CO
! TIME !AID CID/MID!DEV DID !MSG TYP! MSG CONTENT ---------------------------------------------------------------------------------------------- !112801.7!ASH5504 431!DRC DARC !O FPLAN! FLIGHT MODIFICATION ALT = 100 BCN = ---------------------------------------------------------------------------------------------- !112801.7!ASH5504 431!HSP HSP !O FPDAT! 1128 TLH AM *431 ASH5504 T/BE02/A 5567 279 TLH P ---------------------------------------------------------------------------------------------- !112801.8!ASH5504 431!NAS ZCX !I DA ! X976 DA J315 ---------------------------------------------------------------------------------------------- !112801.8!ASH5504 431!NAS ZCX !O AF ! J315 AF ASH5504/431 TLH PNS 06 TLH 09 100 10 TLH.. ----------------------------------------------------------------------------------------------!112803.9!ASH5504 431!RFD TLHA1!O ACCPT! ACCEPT AM ASH5504/431 ---------------------------------------------------------------------------------------------- !112807.5!ASH5504 431!DCR 12D !O RS UP! ASH5504 431 REMOVE * 1* ! ! ! ! ! STRIPS ---------------------------------------------------------------------------------------------- !112808.8!ASH5504 431!RFD TLHA1!O DEP ! ASH5504 5567 TLH TLH PFN PNS ! ! ! ! ! 1 ! ! ! ! ! T/BE02/A P1130 ! ! ! ! !! ! ! ! ! 431 100
Figure 2. Log File Excerpt
TRACK AIRCRAFT ID = AAL2003 COMPUTER ID = 835 TRACK ID = 065 TIME :MRI TMI ND TC M TMS CN HOI AALT RALT ABC RBC : PREDX PREDY SPD HDG PVX :ASI FRZ SID RS AHI AHDT BETA DDR DDT : TPF TNF PFX EXS DELSP CPT : TOC TSB REPA PVB : CLUTR- CONTR DRI ---------------------------------------------------------------------------------------------- 112808.0 :FLT FRE 00 DB P XTE NS FNS 00350 00350 3763 3763: 0523.7 0087.7 00405 326 -0022 :NUL NFZ RAT 16 YES 00000 00000 : 00000 NON 00040 042015.0 : 6297 00358 00000 3763: 0,0,0,0 0,0,0,0 NO ---------:-------------------------------------------------:---------------------------------- 112814.0 :FLT FRE 00 DB P XTE NS FNS 00350 00350 3763 3763: 0523.3 0088.3 00404 327 -0022 :NUL NFZ RAT 16 YES 00000 00000 : 00000 NON 00040 042021.0 : 6298 00423 00000 3763: 0,0,0,0 0,0,0,0 NO ---------:-------------------------------------------------:---------------------------------- 112820.0 :FLT FRE 00 DB P XTE NS FNS 00350 00350 3763 3763: 0523.0 0089.0 00404 327 -0022
Figure 3. Track File Excerpt

5
The reports produced by DART and NTAP can beused to review controller and system activity for avariety of purposes. An example of this process is themethod used to review the occurrence of operationalerrors and incidents with the Systematic Air TrafficOperations Research Initiative (SATORI) program(Rogers & Duke, 1993). SATORI uses informationfrom DART and NTAP reports to graphically re-create ATC incidents on a computer screen. It is usedat ARTCCs in an attempt to understand the combina-tion of events that contribute to operational errorsand deviations.
Although the data in the LOG and TRACK reportscan be used to review air traffic control incidents, theformat in which they are created does not provide apractical platform for exploring and computingtaskload and activity measures. Unfortunately, DARTand NTAP produce very large text-based reports thatconsist of tables of information designed to be re-viewed manually by humans. That is, they are notdesigned to be efficiently processed by computers.These reports contain large amounts of redundantinformation (such as formatting characters and tableheadings) and must be electronically accessed sequen-tially. This creates difficulties with regard to storagespace and processing time.
NAS Data Management System (NDMS)The NDMS program was developed to provide an
optimal platform for ATC activity and taskload re-search. The program transforms the information inDART and NTAP reports into organized databasefiles that can be accessed rapidly by computer pro-grams. It provides access that allows researchers toinvestigate the unique characteristics of SAR data andto subsequently develop appropriate methods for cal-culating measures. An example is the detection ofinterim altitude assignments, which can be accom-plished by scanning specific fields of data block records.Another example is the calculation of handoff latency.This requires searching both data block records andtrack records. The format of NDMS database filesallows computer programs to perform these types ofoperations quickly and efficiently.
A problem with DART and NTAP reports in theiroriginal format is that they require large amounts ofelectronic storage space. For example, the reports fora single 24-hour period from the Los Angeles ARTCCrecorded in January, 2000 require approximately 6.5gigabytes of computer storage space. This storageissue is rendered inconsequential by using the NDMSsystem since it reduces the storage space requirementsfor DART and NTAP output significantly. Once
IBM Mainframe Computer
SARRecordings
DatabaseFiles
DART
NTAP
LOG ReportTRACK Report
CONFLICT ReportBEACON Report
WEATHER Report
Microsoft Windows Computer
NDMS POWER
POWERMeasures
Second StageProcessing
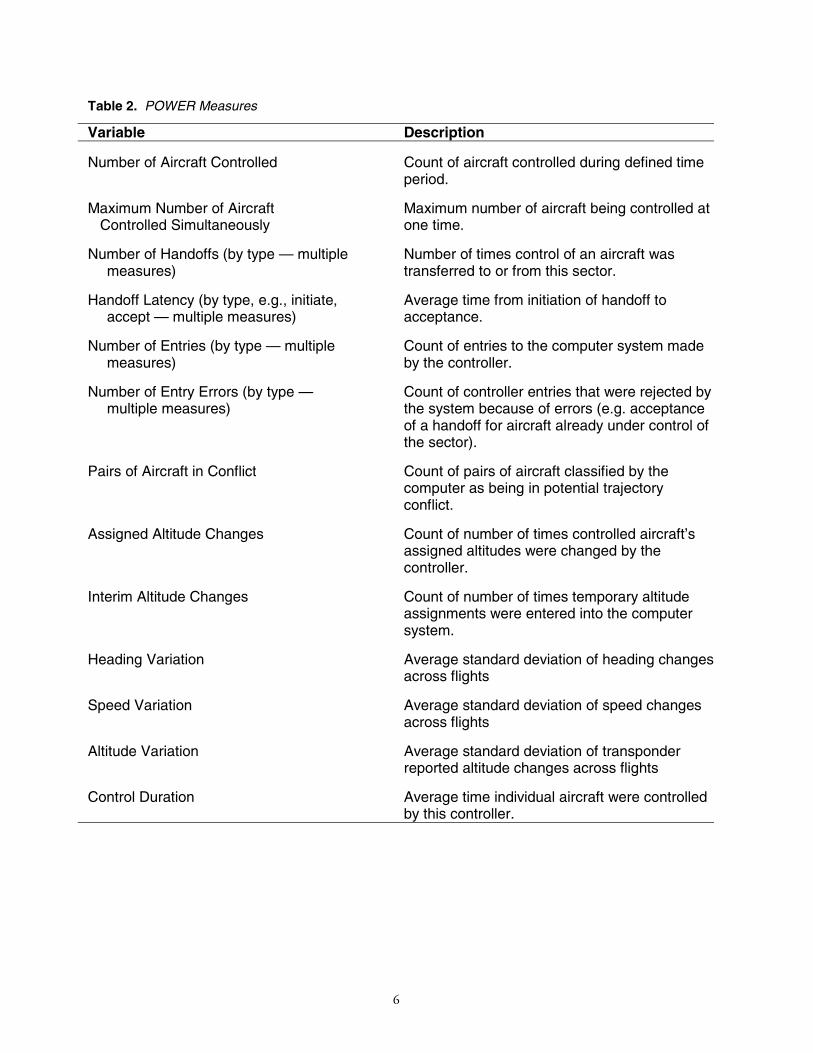
Figure 4. Data Flow Activity
6
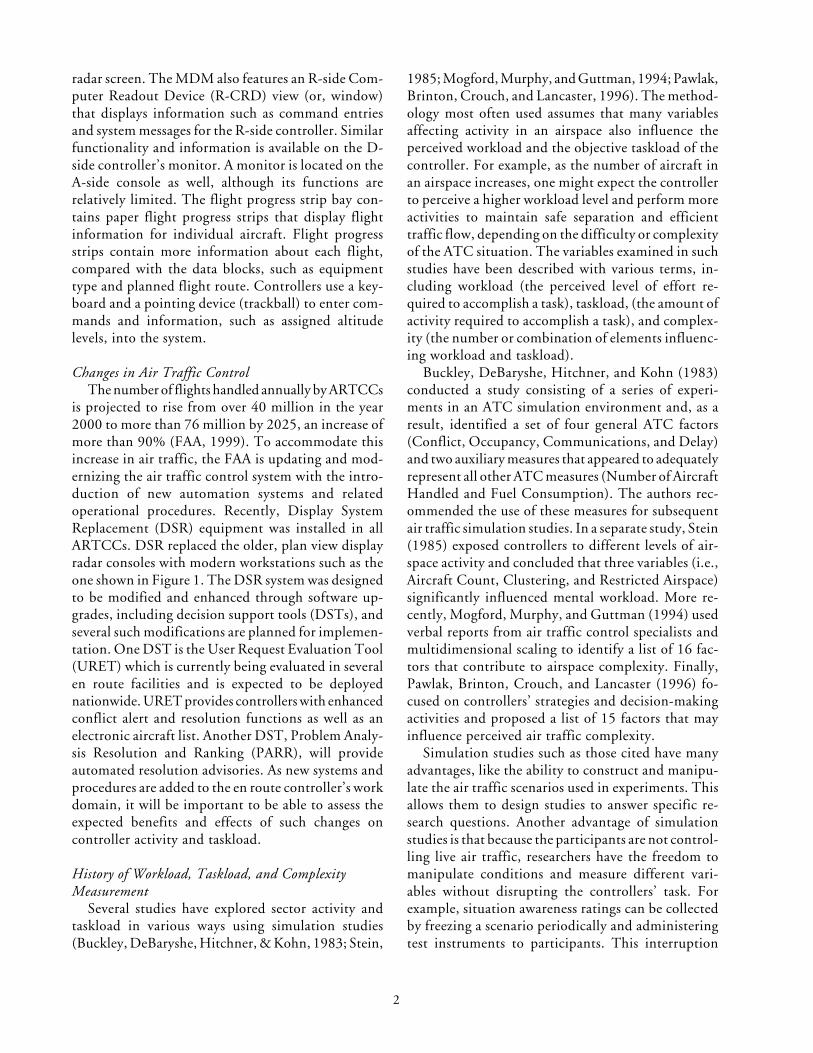
Table 2. POWER Measures
Variable Description
Number of Aircraft Controlled Count of aircraft controlled during defined timeperiod.
Maximum Number of Aircraft Controlled Simultaneously
Maximum number of aircraft being controlled atone time.
Number of Handoffs (by type — multiplemeasures)
Number of times control of an aircraft wastransferred to or from this sector.
Handoff Latency (by type, e.g., initiate,accept — multiple measures)
Average time from initiation of handoff toacceptance.
Number of Entries (by type — multiplemeasures)
Count of entries to the computer system madeby the controller.
Number of Entry Errors (by type —multiple measures)
Count of controller entries that were rejected bythe system because of errors (e.g. acceptanceof a handoff for aircraft already under control ofthe sector).
Pairs of Aircraft in Conflict Count of pairs of aircraft classified by thecomputer as being in potential trajectoryconflict.
Assigned Altitude Changes Count of number of times controlled aircraft’sassigned altitudes were changed by thecontroller.
Interim Altitude Changes Count of number of times temporary altitudeassignments were entered into the computersystem.
Heading Variation Average standard deviation of heading changesacross flights
Speed Variation Average standard deviation of speed changesacross flights
Altitude Variation Average standard deviation of transponderreported altitude changes across flights
Control Duration Average time individual aircraft were controlledby this controller.
7
converted by NDMS, the output requires only 10 to15% of the space it required in its original format.NDMS accomplishes this by storing the data in binarydatabase files instead of the original text files that containmostly formatting characters like spaces and lines.
Because the NDMS system was developed usingthe Visual Basic programming language, it allowsresearchers to quickly modify its encoding logic toaccommodate the frequent changes that occur in NASdata as the NAS software is updated. In addition,ARTCCs may add unique software “patches” or modi-fications to the NAS software at their location thatallow the programs to adapt to individual characteris-tics of that particular ARTCC. This results in minordifferences in DART and NTAP output betweenfacilities. Nevertheless, NDMS can easily be modifiedto accommodate these output differences and can, there-fore, be used to process data from any en route facility.
Another advantage of the NDMS program is that itallows for second-stage processing of data. To effi-ciently calculate several activ p“ity measures, new datastructures that incorporate information from differ-ent DART reports are needed. NDMS uses second-stage processing to build these reports after thefirst-stage encoding has been performed.
To summarize the data flow activity, ATC infor-mation is first obtained and collected on SAR record-ings (see Figure 4). The SAR tapes are then processedby the HOST computer using the DART and NTAPprograms. DART and NTAP produce the LOG,TRACK, CONFLICT, BEACON, and WEATHERreports. These files are then processed by NDMS,which runs on a Microsoft Windows computer. NDMSproduces database files which are then processed by thePOWER program to produce measures that can beanalyzed using statistical analysis packages.
POWER MeasuresThe POWER application uses NDMS database
files as input to produce a set of activity and taskloadmeasures calculated for a specified time period andairspace. The selected airspace may be an individualsector or an entire en route facility. The set of mea-sures produced can be modified or added to by re-searchers to address specific questions about ATCactivity and taskload in specific situations. A list ofPOWER measures is shown in Table 2. For a com-plete description of POWER measures and the proce-dures used to derive them, see the reference providedin Appendix A.
Applications of POWERPOWER will allow for the development of baseline
measures of controller activity and taskload for enroute ATC. These baselines will be useful for evaluat-ing the effects of changes in equipment and proce-dures used by controllers. For example, the effects ofintroducing DSR could be evaluated by comparingpre-DSR baseline POWER measures and post-DSRPOWER measures. Additionally, as new enhance-ments are added to the ATC system with softwareupgrades, the associated changes in controller activitycan be evaluated with POWER measures.
Simulation studies of en route ATC can also ben-efit from the use of POWER measures as objectiveindicators of ATC activity and taskload. For instance,POWER could be used during simulation studies toevaluate the effectiveness of proposed software orprocedural changes on controller activity or taskload.Although some problems with external validity wouldcertainly exist, the collection of POWER measures isless intrusive than other methods of assessment (e.g.,subjective over-the-shoulder ratings, and self-reportedworkload). Thus, the use of POWER would enhanceexternal validity in the simulated environment.
Finally, POWER can be used as a research tool fordeveloping new ATC metrics that will be needed tofurther assess the modernization of the ATC system.An example of developing such a metric relates to theconcept of dynamic density. Dynamic density is de-fined as “the projected workload and safety of futuretraffic in an operational environment” (Radio Tech-nical Commission for Aeronautics [RTCA], 1995).RTCA, Inc. is an organization that addresses require-ments and technical concepts for aviation and func-tions as a Federal Advisory Committee. Thisorganization has emphasized the need for a method ofassessing dynamic density so that sectors could bedynamically reconfigured, thereby increasing the ca-pacity and operational efficiency of the NAS. Re-search with POWER measures could provide valuableknowledge about the relative contributions of differ-ent variables to dynamic density.
POWER measures are constantly evolving with theseapplications in mind. A preliminary analyses is needed toidentify further required evolutions of the measures.Principal Components Analysis (PCA) is a statisticaltechnique used to identify and describe complex con-structs that may not be directly observable. Componentsextracted by PCA can contribute to our understanding ofa phenomenon by consolidating variables into parsimo-nious groups. Moreover, the results of such an analysismight provide insight into the development of newmeasures or the modification of existing ones.

8
Method
En Route Data From Jacksonville ARTCCSAR data were collected from the Jacksonville
ARTCC between 8:30-10:30 a.m. and between 12:00-2:00 p.m. for each of four consecutive days: 6/8/1998to 6/11/1998. DART and NTAP reports were pro-duced by a Host computer from the SAR data, and theresulting files were processed by the NDMS program.For the analyses reported here, POWER measureswere computed in 30-minute intervals for all activesectors. The number of sectors that were active variedslightly, with an average of 29 active sectors (SD = 2)within any given interval. This produced a total of913 observations for each POWER measure.
The 30-minute interval was chosen for the PCAbecause it was small enough to produce a sufficientnumber of observations for the analysis, yet largeenough to reduce the risk of ceiling effects in durationmeasures (i.e., Control Duration and handoff laten-cies). Control Duration, in particular, is susceptibleto these effects because control durations tend to belonger than handoff latencies. When flight durationscross processing intervals, the recorded durations areartificially shortened. This risk increases as processingintervals become shorter. For example, in Figure 5Flights A and C have 30-minute durations. Flight Bhas a total duration of 35 minutes. If POWER pro-cessing of this sample were conducted using a 15-minute interval, the average Control Duration for
Interval 1 would be 10 minutes; for Interval 2 wouldbe 15 minutes; and for Interval 3 would be 10 min-utes. If a 30-minute interval were chosen instead, theaverage control duration for Interval 4 would be 25minutes; if a 45-minute interval were chosen, theaverage control duration for Interval 5 would be 31.7minutes. Although the computed Control Durationsare accurate with respect to the individual intervals,changing the length of the interval will artificiallychange the value of the resulting measure. Thus, thechoice of the appropriate processing interval is impor-tant to obtaining meaningful values for the measures.
For these data, the length of the interval was deter-mined by computing Control Duration for all activesectors from one hour of Jacksonville center data(9:00-10:00 a.m. local) using multiple time intervals(i.e., 9:00:00 to 9:04:59 [5 min.], 9:00:00 to 9:09:59[10 min.], 9:00:00 to 9:14:59 [15 min.], . . . 9:00:00to 9:59:59 [1 hour]). A single value for ControlDuration, averaged over all sectors at the facility, wasalso computed. Data points for all intervals were thenplotted and visually examined. For a few sectors, therelationship was linear (i.e., the durations graduallyincreased as processing intervals became longer).However, in 22 of the 28 active sectors, the averageControl Duration reached asymptote between the 20-and 40-minute processing intervals and the value offacility-wide Control Duration reached asymptote atthe 30-minute processing interval. Thus, a 30-minuteinterval was chosen for all subsequent analyses.
00:00
Flight A
Flight B
Flight C
00:15 00:30 00:45
Interval 1 Interval 2 Interval 3
Interval 4
Interval 5
Figure 5. Sample Flight Durations Relative to POWER Intervals

9
ResultsDescriptive Statistics
Several POWER measures computed from thisdata sample had zero or near-zero incidence. Forexample, no Conflict Alert List Directives or Immedi-ate Alert Summaries were sent to any of the sectors.Furthermore, none of the Jacksonville controllersmade Conflict Alert Suppression entries or Holdrequests. Thus, these variables were excluded fromfurther analysis.
Table 3 shows means and standard deviations forthe POWER measures that occurred at least onceduring the data samples. Because specific data entrymeasures (i.e., Number of Pointouts, Route DisplayEntries, Track Reroute Entries, Start Track Entries,Data block Offset Entries, and Strip Request Entries)are a subset of general entry counts (i.e., R-side and D-side Entries) they cannot be used in conjunction withthe general measures. Therefore, specific entry countswere excluded from the analysis.
After eliminating several variables (as previouslydescribed), the following variables were included forfurther analysis: Number of Aircraft Controlled;Maximum Number of Aircraft Controlled Simulta-neously; Counts of Assigned and Interim AltitudeChanges, Counts of Handoffs Initiated and Accepted;Latency to accept Handoffs and latency with whichInitiated Handoffs are accepted; Control Duration;Pairs of Aircraft in Conflict, Numbers of R-side andD-side Data Entries; Numbers of R-side and D-sideData Entry Errors, and Heading, Speed, and AltitudeVariation.
Principal Components AnalysisPrior to the analysis, the Kaiser-Meyer-Olkin
(KMO) measure of sampling adequacy was examinedto test whether partial correlations among the vari-ables were small (which is desirable in PCA). KMOvalues of .6 and above are required for a good solution.A KMO of .78 was produced by the set of variablesselected. SPSS (10.0.7 for Windows) procedure FAC-TOR was employed to perform a Principal Compo-nents Analysis with Varimax rotation. The rotationconverged in seven iterations and produced five com-ponents with eigenvalues greater than 1. These com-ponents accounted for 68.18% of the variability in thedata set. The rotated component matrix is provided inTable 4.
Discussion
The amount of variability accounted for by the fiveextracted components (slightly more than 68%) wasdisappointing, but not entirely unanticipated. On theother hand, none of the selected variables failed toload on at least one of the components, and all had aloading of .30 or greater. (Note that in orthogonalrotation, loadings represent the correlations betweena variable and a component. Variables with strongerloadings are generally considered to be more represen-tative of a component’s underlying processes). More-over, most of the components were readilyinterpretable.
Component 1 –ActivityWith an eigenvalue of 4.46, Component 1 ac-
counted for about 26% of the variability in the data.The variables comprising this component (shown inTable 4) relate to Activity. The number of Radarcontroller and Radar Associate (D-side) data entriesare straightforward activity measures that relate to thenumber of commands entered. Handoff Initiates andAccepts, the Number of Aircraft Controlled, theMaximum Number of Aircraft Simultaneously Con-trolled, and Interim Altitude Changes all relate toaircraft activity in and around the sector. HandoffAccepts involve accepting the transfer of control foran aircraft entering the sector.
The fact that D-side Entries had a loading of only.37 on this component does not necessarily mean D-side Entries are less indicative of activity: Activesectors are always staffed by a radar controller, but notall sectors are worked by a control team. The reducedprevalence of D-side Entries would tend to weakenthe association.
Component 2 –Flight Path VariabilityComponent 2 had an eigenvalue of 2.33 and ac-
counted for about 14% of the variability in the data.The variables comprising this component (shown inTable 4) relate to Flight Path Variability. The compo-nent is defined by Average Heading, Speed, andAltitude Variation, although the number of Pairs ofAircraft in Conflict and number of Interim AltitudeChanges are also related.

10
Table 3. Descriptive Statistics for non-zero POWER measures (n = 913)
Variable Mean S.D.
* Number of Aircraft Controlled 17.90 6.78
* Maximum Number of Aircraft Controlled Simultaneously 8.27 3.15
* Assigned Altitude Changes 1.75 1.65
* Interim Altitude Changes 10.47 9.41
* Number of Handoff Accepts 11.71 5.05
* Handoff Accept Latency (in seconds) 101.27 60.07
* Number of Handoff Initiates 11.47 5.38
* Handoff Initiate Latency (in seconds) 84.61 48.80
* Control Duration (in seconds) 516.52 158.65
* Pairs of Aircraft in Conflict 1.06 1.08
* Number of R-side Entries 86.29 35.94
* Number of R-side Entry Errors 1.59 1.73
* Number of D-side Entries 5.97 8.25
* Number of D-side Entry Errors .56 1.39
* Heading Variation (in degrees) .86 .30
* Speed Variation (in knots) 1.01 .34
* Altitude Variation (in feet/100) .38 .33
Number of Pointouts 2.40 2.64
Route Display Entries .40 .97
Track Reroute Entries .13 .43
Start Track Entries .18 .59
Data block Offset Entries .19 .82
Strip Request Entries .11 .39
* Included in Principal Components Analysis

11
Table 4. Principal Components Analysis Rotated* Component Matrix
Component**Variable1 2 3 4 5
Number of R-side Controller Entries .90
Number of Handoff Initiates .92
Number of Handoff Accepts .91
Number of Aircraft Controlled .91
Interim Altitude Changes .60 .33 -.43
Heading Variation .86
Speed Variation .84
Altitude Variation .62
Control Duration .84
Maximum Number of A/C ControlledSimultaneously
.68 .58
Handoff Accept Latency .57
Pairs of Aircraft in Conflict .53 .34
Number of D-side Entry Errors .91
Number of D-side Entries .37 .78
Number of R-side Entry Errors .75
Latency to Accept Initiated Handoffs .39 -.39
Assigned Altitude Changes .59
* Varimax rotation with Kaiser normalization** Loadings < .30 not shown

12
However, there is an inherent difficulty in accu-rately interpreting this factor. As can be seen in Table3, the three variables – Heading, Speed, and AltitudeVariation – have limited variability. All three mea-sures represent the average standard deviation ofchanges across flights. It is doubtful that, in theirpresent form, they are sufficient to describe aircraftmovements because the distribution of standard de-viations is calculated from incremental differences,rather than actual “changes.” For instance, as anaircraft begins to change its speed the difference isrecorded as 3 knots (from 280 to 283). By the nextupdate, the aircraft might have reached 287 knots (adifference of 4 knots). At the next update, the changeis complete and the aircraft levels off at 290 knots (adifference of 3 knots). The actual speed change was 10knots, but this would not be reflected by computingthe standard deviation of the differences. In the effortto measure heading, speed, and altitude changes, itwas exceedingly difficult to establish parameters thateliminated error variance (i.e., natural deviations inreal data) and still retain the actual changes. Thecurrent variables were computed in an attempt tocircumvent such difficulties. Unfortunately, thismethod also hides pertinent information within theerror variance and produces measures that are oflimited usefulness. Thus, while Component 2 de-scribes an underlying communality between threevariables that may describe some aspect of aircraftmovement, it may also only reflect a similarity incomputational methods. The lower loadings of theother two variables with this component could indi-cate some other aspect of changes in aircraft flightpaths, or it may reflect the non-normality of theircorresponding distributions.
Component 3 – Objective WorkloadAfter rotation, Component 3 had an eigenvalue of
1.92 and accounted for about 11% of the variabilityin the data. The variables comprising this component(listed in Table 4) reflect objective workload in thatthey represent the controllers’ reactions to the eventsto which they were exposed. Generally, workload notonly refers to controllers’ reactions to events, but alsoto their perception of the effort involved in managingthose events. However, we cannot make inferencesabout the subjective experience of these controllersbased on the available data. Therefore, this compo-nent has been given the interpretive label ObjectiveWorkload.
The “marker” variable for Component 3 is ControlDuration, which represents the average amount oftime aircraft are under a sector’s control. This variable
relates to workload because the longer an aircraft is inthe sector the longer the controller must attend to it.Maximum Number of Aircraft Controlled Simulta-neously is indicative of workload as well, since themore aircraft controlled simultaneously, the moreoften the controller must assess potential conflicts andother problems. Handoff Accept Latency may also beindicative of workload since it takes longer to accepthandoffs from another sector when a controller isbusy. Likewise, Interim Altitude Changes are gener-ally avoided when the controller is busy because of theamount of data entry required to perform them, hencethe negative relationship of this variable with otherscomprising this component. Finally, Latency to AcceptInitiated Handoffs reflects workload because the sectorcontroller must attend to aircraft in handoff status untilhe/she is certain the handoff has been accepted.
One of the more interesting aspects of Component3 has to do with the combination of Control Durationand Maximum Number of Aircraft Controlled Simul-taneously. Together, they constitute a gross measureof traffic density. These variables roughly correspondto average sector flight time and peak traffic count,which are used to compute density at en route centers(see FAA, 1984, Appendix 1) to estimate requiredstaffing standards. The fact that elements of Compo-nent 3 might be an indirect measure of density sug-gests that a more direct measure might improve the setof POWER variables. The density formula (FAA,1984) was developed because it was considered im-practical to manually compute the average number ofaircraft controlled each minute, but this would beextremely simple to calculate with a minor revision tothe POWER processing code. However, the averagenumber of aircraft under the sector’s control does notconvey any information about the proximity of theaircraft. If traffic characteristics are a contributor toworkload (as proposed by Mogford et al., 1994 andPawlak et al., 1996) then it might also be advanta-geous to include one or more proximity measures inthe POWER suite. The information necessary tocompute such measures is readily available and so theaddition is feasible.
Component 4 – D-side ActivityComponent 4 had an eigenvalue of 1.56 and ac-
counted for about 9% of the variability in the data set.The variables included in the component may beconsidered to describe D-side activities, and thus,Component 3 was labeled D-side Activity. The vari-ables included in this component (listed in Table 4)are D-side data entries and errors. It must be remem-bered when interpreting this component that sectors

13
are often staffed by only one person instead of a teamof controllers. When an R-side controller is workingalone, he or she must move to the D position to makecertain data entries that cannot be entered on the R-side workstation. The only way to determine whethera sector is being worked by more than one person is toexamine sector staffing records, which are recorded inelectronic SISO (Sign In Sign Out) logs. Without thisinformation it is impossible to accurately identifywhich sectors are actually being worked by D-sidecontrollers. Unfortunately, SISO data were not avail-able for the Jacksonville Center data set. However,large SAR data sets from the Kansas City (ZKC), LosAngeles (ZLA), and Washington (ZDC) centers arecurrently being processed, and corresponding SISOdata are also available. With this additional informa-tion it will be possible to investigate the stability, corre-lates, and implications of a D-side activity component.
Component 5 – OverloadComponent 5 had an eigenvalue of 1.33 and ac-
counted for about 8% of the variability in the data setafter rotation. This component has been tentativelylabeled Overload because, as shown in Table 4, thevariable with the highest loading was R-side EntryErrors (.75). Assigned Altitude Changes might also beindicative of overload because workload can be higherin transition sectors where altitude changes are mademore often. The time measured by the Latency toAccept Initiated Handoffs variable is the time it takesanother controller to accept a handoff initiated in thecurrent sector. Perhaps the increased workload re-quired to attend to whether another controller hasaccepted a handoff contributes to overload as well.Finally, Pairs of Aircraft in Conflict may be indicativeof overload because attending to more conflict alertnotifications (which are often not an indication of areal conflict) requires time that might be better spenton other activities. Whereas the variables that loadedon the component seem to suggest overload, most ofthe loadings were small and so interpretation of thiscomponent is somewhat ambiguous.
Conclusions
POWER measures were developed to provide a plat-form for quantifying en route air traffic controller activ-ity and taskload. The development and use of suchmeasures is important for establishing baseline activitymeasures and for evaluating the effects of modificationsto ATC systems. Success depends on the selection ofvariables that are, in combination, sufficient to compre-hensively describe the ATC environment.
The value of conducting the PCA using these data,albeit restricted, is that the five components extractedsuggested possible additions or modifications thatmight improve the ability of the POWER measures todescribe air traffic controller activity and taskload.For example, the lack of a relationship between theaircraft dynamics measures and other measures ofcontroller and aircraft activity suggests that AverageHeading, Speed, and Altitude Variation may notmeasure what they were intended to measure (i.e.,they currently represent the standard deviation ofincremental differences rather than actual changes).Because of the results of the PCA, it is apparent thatadditional measures of aircraft dynamics (e.g., countsand amounts of actual changes, duration of changes,etc.) may be more effective measures of variability inaircraft movements.
The results of the PCA contribute to our under-standing of the POWER measures in other ways. Forexample, the pattern of variable loadings on Compo-nent 3 (Objective Workload) suggested that theremight be an element related to aircraft density orproximity; traffic characteristics that are not beingmeasured by the current set of POWER variables.Presently, a new measure of proximity is being devel-oped and will be added to the POWER suite. Theamount of variability explained by the POWER mea-sures before and after inclusion of the new variable willbe tested in the upcoming baseline (pre-DSR) study.
The existence of Component 4 (D-side Activity)and aspects of Component 1 (Activity) also made itclear that, in the future, separate analyses should beconducted for sectors staffed by individual controllersand those staffed with control teams. Becausecorresponding SISO data have also been collected forthe three centers involved in the baseline study, wewill be able at that time to conduct separate analysesfor sectors staffed by individual controllers and thosewith control teams.
In future POWER research we will continue toexamine the combination of variables that make upthe POWER measures and seek ways to improve theirability to describe workload and taskload. In addi-tion, we will examine information about geographicand traffic characteristics of sectors in different facili-ties and compare patterns of POWER measures insimilar and dissimilar sectors. We eventually plan toconduct additional validation research in a simulatedenvironment with the goal of further examining therelationship between POWER measures and subjec-tive measures of workload.

14
References
Buckley, E.P., DeBaryshe, B.D., Hitchner, N., & Kohn,P. (1983). Methods and measurements in real-timeair traffic control system simulation. (Report No.DOT/FAA/CT-83/26). Atlantic City, NJ: Fed-eral Aviation Administration Technical Center.
Federal Aviation Administration (1984). Establishmentand validation of en route sectors. (FAA Order No.7210.46). Washington, DC: Author.
Federal Aviation Administration (1997). National Air-space System (NAS) Architecture, Version 2.5. Of-fice of System Architecture and Program Evalua-tion (ASD-1). Washington, DC: Author.
Federal Aviation Administration (1999). FAA Long-Range Aerospace Forecast. HTTP://api.hq.faa.gov/default.htm.
Galushka, J., Frederick, J., Mogford, R., & Krois, P.(1995). Plan view display baseline research re-port. (Report No. DOT/FAA/CT-TN95/45).Atlantic City, NJ: Federal Administration Tech-nical Center.
Mogford, R.H., Murphy, E.D., & Guttman, J.A.(1994). Using knowledge exploration tools tostudy airspace complexity in air traffic control.The International Journal of Aviation Psychology,4(1), 29-45.
Pawlak, W.S., Bowles, A., Goel, V., & Brinton, C.R.(1997). Initial evaluation of the DynamicResectorization and Route Coordination (DI-RECT) System. NASA Final Contract ReportNo. NAS2-97057.
Pawlak, W.S., Brinton, C.R., Crouch, K., & Lancaster,M. (1996). A framework for the evaluation of airtraffic control complexity. Proceedings of the AIAAGuidance Navigation and Control Conference,San Diego, CA.
Rodgers, M.D., & Duke, D.A. (1993). SATORI: Situ-ation Assessment Through Re-creation of Inci-dents. The Journal of Air Traffic Control, 35(4),10-14.
RTCA (1995). Final Report of RTCA Task Force 3: FreeFlight Implementation. Washington, DC: RTCAIncorporated.
Stein, E.S. (1985). Air traffic controller workload: Anexamination of workload probe. (Report No. DOT/FAA/CT-TN84/24). Atlantic City, NJ: FederalAviation Administration Technical Center.
Tabachnick, B.G. & Fidell, L.S. (1989). Using multi-variate statistics (2nd ed.). New York: HarperCollins.

A1
APPENDIX A
Performance and Objective Workload Evaluation Research (POWER) Reference
and equipment fields remain blank.) The Certifyprogram then compares the aircraft type designa-tion with a resource database that provides addi-tional data (i.e., manufacturer, average climb anddescent rate, etc.) and writes this information to atable (TACTYPE) in the hour-long database. TheCertify program also compresses the data files toreduce storage space requirements.
The next step is the Daytrack program. As itsname suggests, the Daytrack program compileshourly Track information for each aircraft into“day-long” TK tables. These tables are written to aseparate file. Hourly files are labeled in a ddmmyyhhformat with an extension that corresponds to thethree-letter facility identifier. For example, a filelabeled 12289813.zkc contains data from 13:00:00to 13:59:59 (ZULU) recorded on 12/28/98 at theKansas City en route facility. The file created by theDaytrack program that contains all available hour-long data for the day would be labeled122898DR.zkc. The “DR” of the Daytrack files isa non-numeric two-character identifier that makesthe day-long databases easily distinguishable fromthe numeric hour-long ones.
POWER Measures Number of Aircraft Controlled
This value represents the total number of aircraftcontrolled by any given sector or facility during aspecified POWER interval. Controlling sector in-formation is derived from the TRACK file producedby the DART report. POWER compiles a tempo-rary list of controlled aircraft for any given intervalusing the CN (controlling sector) and DGTIM(digital time) fields from the TRK tables (i.e.,tables that contain Track data for each flight). Thelist is used to calculate the total number of con-trolled aircraft. Aircraft do not have to be controlledby the sector for the entire interval. Any aircraft thatis controlled by the sector at any time within theinterval is included. Table A1 contains a sample listof aircraft for the POWER interval 12:10:00 to12:29:59 in which the number of aircraft con-trolled by Sector 16 equals five.
The following is a description of the POWERsoftware system and the procedures used to deriveATC activity measures from FAA System AnalysisRecording (SAR) data. The first step in the processis a reduction of the SAR data into reports generatedby the Data Analysis Reduction Tool (DART) andNational Track Analysis Program (NTAP). Thesereports can only be generated by a National Air-space System (NAS) Host computer. Due to the sizeand format of the DART and NTAP text files, itwould be impractical to use these reports in theirraw form. Therefore, the NAS Data ManagementSystem (NDMS) was developed to organize thisinformation into Microsoft Access databases. Pre-liminary organization of the raw data provides adual advantage: It decreases the size of the data to bestored, which in turn increases the speed of POWERprocessing. Although POWER measures are com-puted exclusively from DART reports, NTAP re-ports are also processed and stored by NDMS.
NDMS organizes the messages from DART andNTAP reports into hour-long databases. Thesedatabases consist of content-specific tables. Beaconand Weather data from the NTAP reports are storedin one-minute tables (e.g., BCN_01 contains datafrom minutes 00 through 01, WTH_01 containsweather information from minutes 0 through 01,etc.). LOG input and output messages are parsed bymessage type (e.g., LOG_O_FPL contains flightplan messages output by the system). Track data areorganized by individual flights, distinguished byboth AID and CID (e.g., AAL1234_5678). Mes-sage fields are parsed and stored within separatecolumns in the tables. This format facilitates com-puter processing of the POWER measures.
Once NDMS processing is completed, the Cer-tify program is run on the hour-long data files. TheCertify program inserts an aircraft type referencetable (TYPEREF) into each database that listsaircraft type and equipment information for allAIDs, derived from flight progress strip messages.(If no flight progress strip messages are available,the AID is entered into the database, but the type

A2
Maximum Number of Aircraft ControlledSimultaneously
This value represents the maximum number ofaircraft under simultaneous control within a speci-fied POWER interval. The same list used to calcu-late the total number of controlled aircraft is used tocalculate the maximum number of aircraft undersimultaneous control. POWER checks the numberof aircraft under a sector’s control for each minuteof a given POWER interval. Using the list of aircraftin Table A1, the maximum number of aircraftunder simultaneous control in Sector 16 during thePOWER interval 12:00:00 to 12:29:59 equals three.This was calculated by first checking the number ofaircraft controlled from 12:00:00 to 12:00:59. Asno aircraft in the list were controlled by the sector,a value of 0 was retained for comparison with thenumber of aircraft that were controlled from 12:01:00to 12:01:59, and so on. From 12:10:00 to 12:10:59,DAL422 was controlled by the sector. Therefore,the stored value would be replaced with 1. From12:15:00 to 12:15:59, there were two aircraft con-trolled by the sector (i.e., EJA157 and AAL1661).This value was greater than the stored value of 1,and so the stored value was replaced. From 12:18:00to 12:18:59, there were three aircraft controlled bythe sector (i.e., EJA157, AAL1661, and AWE726)and the stored value was again replaced. BecauseAWE726 was no longer under the sector’s controlby the time the sector assumed control of AAL61,the stored value remained unaltered. The maximumnumber of aircraft controlled is equal to the storedvalue that remains after all minutes of the intervalhave been evaluated.
Control DurationThis value represents the average time aircraft
were controlled (in seconds) within a specifiedPOWER interval. At the time POWER stores atemporary list of AIDs for a given sector, it also
stores the time at which the sector took controlof the aircraft and the last recorded time beforethe aircraft left the sector’s control. For example,in Table A1 Sector 16 assumed control ofDAL422 at 12:10:08 and maintained controluntil 12:11:50. The control duration forDAL422 would be 102 seconds. The same cal-culation is made for all aircraft controlled bySector 16 during the interval. Control durationfor any given POWER interval is equal to the
mean of the durations of all aircraft controlled bythe sector within the POWER interval. Controltime occurring before or after the POWER intervalis not included in the calculations.
Heading VariationThis value represents the average standard devia-
tion of heading changes across flights. For eachflight, POWER calculates heading differences andstores all changes that do not exceed a specifiedvalue (The default value is 12°, but this value maybe set manually prior to the POWER run) into anarray (or, temporary list). POWER then calculatesthe standard deviation of the distribution of differ-ences and sends this information to a second array.When standard deviations have been collected forall flights, POWER computes the mean of thedistribution.
Speed VariationThis value represents the average standard devia-
tion of speed changes across flights. For each flight,POWER calculates differences in speed and storesall changes that do not exceed a specified value(default value is 30 knots, but this value may be setmanually prior to the POWER run) into a tempo-rary array. POWER then calculates the standarddeviation of the distribution of differences andsends that information to a second array. Whenstandard deviations have been collected for all flights,POWER computes the mean of the distribution.
Altitude VariationThis value represents the average standard devia-
tion of transponder reported altitude changes acrossflights. For each flight, POWER calculates differ-ences in altitude and stores all changes that do notexceed a specified value (default value is 10,000feet, but this value may be set manually prior to thePOWER run) into a temporary array. POWER then
Table A1. Sample List of Controlled Aircraft
AID CN START STOPDAL422 16 12:10:08 12:11:50EJA157 16 12:15:14 12:27:56AAL1661 16 12:15:26 12:30:56AWE726 16 12:18:38 12:20:38AAL61 16 12:21:08 12:25:14

A3
calculates the standard deviation of the distributionof differences and sends that information to a sec-ond array. When the standard deviations have beencollected for all flights, POWER computes themean of the distribution.
Handoff Count (total)This value represents the total number of handoffs
occurring within this sector/facility. A handoff isdefined as a change in the CN (controlling sector)field of the TRK tables in which at least one of theinvolved sectors (either the initiating sector or theaccepting sector) was this sector/facility.
Handoff Count (valid)This value represents the total number of handoffs
for which a corresponding initiate message can belocated. At the time a change in the CN field isdetected, POWER stores the information in anarray. Table A2 contains a sample of elements inthis array. These include the aircraft identifier ofthe aircraft being handed off (AID), the initiatingsector from which control was assumed (CN From),the sector that assumed control (CN To), the lastrecorded time the aircraft was under the (CN From)sector’s control, and the time the change was re-corded (Time of Change). Once this information iscollected for each item, POWER searches informa-tion recorded in DART log files for an initiate/accept message corresponding to the change (Timeof Initiate/Accept). If no initiate message is found,the handoff is excluded from the count.
Handoff LatencyThis value represents the average time between
initiation and acceptance of valid handoffs, regard-less of whether the aircraft was entering or leavingthe sector. POWER determines initiate and accepttimes from information displayed in Field E of thedata block tag. In some cases, Field E indicates thatthe data block was “busy” at the time the handoffwas accepted and the earliest Field E accept time isless accurate than the time of change noted in theCN field of the TRACK tables. In these instancesthe time of change in the CN field is substitutedand used for the latency calculation.
Handoff Accept Count (for sector)This value represents the sum of the number of
valid handoffs accepted by this sector.
Handoff Accept Latency (for sector)This value represents the mean latencies between
the time a handoff is initiated by a previous sectorand the time the handoff is accepted by this sector.
Handoff Initiate Count (for sector)This value represents the sum of all valid handoffs
initiated by this sector.
Handoff Initiate Latency (for sector)This value represents the mean latencies between
the time a handoff is initiated by this sector and thetime a handoff is accepted by the next sector.
Table A2. Sample of Data Used to Determine Valid Handoffs and Handoff Latencies
AID CN From - CN To Time of Change Time of Initiate/Accept
AAL1661 NS - 16 12:15:20 - 12:15:26 12:13:53 - 12:15:26
AAL61 15 - 16 12:21:02 - 12:21:08 12:20:29 - 12:21:08
AAL61 16 - 17 12:25:14 - 12:25:20 12:22:50 - 12:25:20
AWE726 15 - 16 12:18:32 - 12:18:38 12:17:27 - 12:18:33
AWE726 16 - 17 12:20:38 - 12:20:44 12:19:55 - 12:20:44
DAL422 16 - 17 12:11:50 - 12:11:56 12:10:02 - 12:11:56
EJA157 17 - 16 12:15:08 - 12:15:14 12:14:11 - 12:15:14
EJA157 16 - NS 12:27:56 - 12:28:02 12:26:08 - 12:28:02

A4
Conflict Alert PairsConflict alert pairs are calculated from output
messages in the LOG files of the DART reports(message type LOG_O_CA) that record all conflictalert pairs sent to the High Speed Printer (HSP).Each unique conflict alert pair is counted onceduring the analysis epoch. For individual positionprocessing, all pairs with at least one aircraft cur-rently under the sector’s control are counted. Forentire facility processing, POWER counts all pairswith at least one aircraft controlled by a sectorwithin the facility. Conflict alert pairs with bothaircraft controlled by a sector (or sectors within thefacility) are counted only once.
Conflict Alert – ZeroConflict Alert – OneConflict Alert – Two
These values are derived from Conflict Alert ListDirective (LOG_O_CALDR) output messages re-corded in the DART log files. When the initialconflict alert directive is identified (determined bythe DISPLAY value recorded in the message con-tent), POWER stores the information in an array.Elements of this array include: the time the messagewas transmitted, AIDs of the aircraft involved,controlling sectors for both aircraft, and the deviceto which the information was sent. Unique mes-sages meeting criteria for Conflict Alert Zero, One,and Two are calculated from items in the array. Thecriteria for these variables are as follows:
Conflict Alert – ZeroThe number of conflict alert messages sent to this
sector in which no aircraft were controlled by thissector. Comparable facility counts include messagessent to any sector in which neither aircraft werecontrolled by a sector within the facility.
Conflict Alert – OneThe number of conflict alert messages sent to this
sector in which one aircraft was controlled by thissector. Comparable facility counts include messagessent to any sector in which only one aircraft wascontrolled by a sector within the facility.
Conflict Alert – TwoThe number of conflict alert messages sent to this
sector in which both aircraft were controlled by thissector. Comparable facility counts include messagessent to any sector in which both aircraft werecontrolled by sectors within the facility.
Conflict Alert – TotalThis value represents the sum of all conflict alert
messages (i.e., Conflict Alert – Zero, Conflict Alert– One, and Conflict Alert – Two.)
Conflict Alert – SuppressesThis value represents the total number of conflict
alert blink suppressions initiated by this sector (or,sectors within this facility). Conflict alert sup-presses are derived from the message content ofConflict Alert List Directive (LOG_O_CALDR)output messages recorded in the DART log report.Information from the messages are stored in an arraythat contains the AIDs and unique Conflict Alertidentification number (CAID) of the conflict pair.Suppressions are correlated with the sector/facilityat which they were initiated: Controlling sectors ofthe conflict pair are not evaluated.
Conflict Alert – Immediate AlertsThis value represents the number of Immediate
Alerts in which at least one aircraft was controlledby this sector/facility. POWER calculates this valueby counting all applicable Immediate Alert Sum-mary output messages (LOG_O_IAS) in the DARTlog files.
Assigned Altitude ChangesThis value represents the number of assigned
altitude changes for this sector/facility. Assignedaltitudes for all controlled aircraft are recorded inDART track data files. For any given interval,POWER stores a temporary array of these values.POWER then searches the array for changes inaltitude and tabulates the total.
Interim Assigned Altitude ChangesThis value represents the number of interim
altitude changes entered into ATC system for thissector/facility. Interim altitude changes are identi-fied by a “T” displayed in character position B4 in

A5
Field B of the data block tag of a controller’sradarscope. This information is recorded in FullData Block (FDB) messages in the DART logreports. POWER collects and sorts Field B4 infor-mation for the pertinent sector(s) within a givenprocessing interval. Each unique interim altitude isextracted and tabulated.
Controller EntriesThese values represent frequency counts of Com-
puter Readout Device (CRD) entries for this sector/facility, sorted by R-side, D-side, and A-side. Con-troller CRD entries are recorded as input messagesin DART log reports. It is important to note thatthis value represents the number of entry messagesand does not necessarily reflect the exact number ofactual keystrokes that might be required to generatethe message. POWER classifies messages as R-, D-, orA-side according to the device. Therefore, theseentries do not necessarily identify the duties of theindividuals making the entries.
Entry ErrorsThese values represent frequency counts of the
number of entry errors appearing on the CRD forthis sector/facility, sorr“ted by R-side, D-side, andA-side. All errors displayed on the CRD are re-corded as output messages in DART log reports(LOG_O_ERROR and LOG_O_REJCT).POWER classifies errors as R-, D-, or A-side errorsby the device that displayed the error message.
Distance Reference Indicator RequestsThis value represents the number of distance
reference indicator (DRI) request entries for thissector/facility. POWER computes this value fromthe content of DRI output messages recorded inDART log reports (LOG_O_DRIDO). The mes-sage content indicates whether the entry was arequest or a delete.
Distance Reference Indicator DeletesThis value represents the number of distance
reference indicator (DRI) delete entries for thissector/facility. POWER computes this value fromthe content of DRI output messages recorded inDART log reports (LOG_O_DRIDO). The mes-sage content indicates whether the entry was arequest or a delete.
Route Display EntriesThis value represents the number of route dis-
play entries for this sector/facility. POWER com-putes this value from the content of output acceptmessages recorded in DART log reports.
Pointout EntriesThis value represent the number of pointout
entries for this sector/facility. POWER computesthis value from the content of output accept mes-sages recorded in DART log reports.
Pointout Entries (breakdown)These values represent the number of pointout
entries for this sector/facility, sorted by R-side, D-side, and A-side. POWER classifies pointouts as R-,D-, or A-side entries by the device used to make theentry.
Data Block Offset EntriesThis value represents the number of data block
offsets for this sector/facility. POWER computesthis value from the content of output accept mes-sages recorded in DART log reports.
Track Reroute EntriesThis value represents the number of track reroute
entries for this sector/facility. POWER computesthis value from the content of output accept mes-sages recorded in DART log reports.
Start Track EntriesThis value represents the number of start track
entries for this sector/facility. POWER computesthis value from the content of output accept mes-sages recorded in DART log reports.
Hold EntriesThis value represents the number of hold entries
made by this sector/facility. POWER computesthis value from the content of output accept mes-sages recorded in DART log reports.
Strip Request EntriesThis value represents the number of strip re-
quests made by this sector/facility. POWER com-putes this value from the content of output acceptmessages recorded in DART log reports.

A6