comparative analysis of orchestral performance recordings...
TRANSCRIPT

COMPARATIVE ANALYSIS OF ORCHESTRAL PERFORMANCERECORDINGS: AN IMAGE-BASED APPROACH
Cynthia C. S. LiemDelft University of TechnologyMultimedia Computing [email protected]
Alan HanjalicDelft University of TechnologyMultimedia Computing [email protected]
ABSTRACT
Traditionally, the computer-assisted comparison of mul-tiple performances of the same piece focused on perfor-mances on single instruments. Due to data availability,there also has been a strong bias towards analyzing pianoperformances, in which local timing, dynamics and artic-ulation are important expressive performance features. Inthis paper, we consider the problem of analyzing multipleperformances of the same symphonic piece, performed bydifferent orchestras and different conductors. While dif-ferences between interpretations in this genre may includecommonly studied features on timing, dynamics and ar-ticulation, the timbre of the orchestra and choices of bal-ance within the ensemble are other important aspects dis-tinguishing different orchestral interpretations from oneanother. While it is hard to model these higher-level as-pects as explicit audio features, they can usually be notedvisually in spectrogram plots. We therefore propose amethod to compare orchestra performances by examiningvisual spectrogram characteristics. Inspired by eigenfacesin human face recognition, we apply Principal Compo-nents Analysis on synchronized performance fragments tolocalize areas of cross-performance variation in time andfrequency. We discuss how this information can be usedto examine performer differences, and how beyond pair-wise comparison, relative differences can be studied be-tween multiple performances in a corpus at once.
1. INTRODUCTION
A written notation is not the final, ultimate representa-tion of music. As Babbitt proposed, music can be rep-resented in the acoustic (physical), auditory (perceived)and graphemic (notated) domain, and as Wiggins noted,in each of these, projections are observed of the abstractand intangible concept of ‘music’ [29]. In classical mu-sic, composers usually write down a notated score. Subse-quently, in performance, multiple different musicians willpresent their own artistic reading and interpretation of it.
c� Cynthia C. S. Liem, Alan Hanjalic.
Licensed under a Creative Commons Attribution 4.0 International Li-cense (CC BY 4.0). Attribution: Cynthia C. S. Liem, Alan Hanjalic.“Comparative analysis of orchestral performance recordings: an image-based approach”, 16th International Society for Music Information Re-trieval Conference, 2015.
Nowadays, increasing amounts of digital music record-ings become available. As a consequence, for musicalpieces, an increasing amount of (different) recorded per-formances can be found. Therefore, in terms of dataavailability, increasing opportunities emerge to study andcompare different recordings of the same piece. Beyondthe Music Information Retrieval (Music-IR) domain, thiscan serve long-term interests in psychology and cogni-tion on processes and manifestations of expressive playing(e.g. [6, 21, 26]), while the analysis of performance stylesand schools also is of interest to musicologists [5, 16].
In this paper, we mostly are interested in the analysisof multiple performances of the same piece from a searchengine and archive exploration perspective. If one is look-ing for a piece and is confronted with multiple alterna-tive performances, how can technology assist in givingoverviews of main differences between available perfor-mances? Given a corpus, are certain performances verysimilar or dissimilar to one another?
In contrast to common approaches in automated analy-sis of multiple performances, we will not depart from ex-plicit modeling of performance parameters from a signal.Instead, we take a more holistic approach, proposing toconsider spectrogram images. This choice has two rea-sons: first of all, we are particularly interested in findingmethods for comparative analysis of orchestra recordings.We conjecture that the richness of orchestra sounds is bet-ter captured in spectrogram images than in mid-level audiofeatures. Secondly, as we will demonstrate in this paper,we believe spectrogram images offer interpretable insightsinto performance nuances.
After discussing the state of the art in performance anal-ysis in Section 2, in Section 3, we will further motivateour choice to compare performances through visual com-parison of spectrogram images. Subsequently, Section 4details our chosen comparison method, after which wepresent the experimental setup for this paper in Section 5.We will then illustrate our approach and its outcomesthrough a case study in Section 6, with a detailed discus-sion of selected musically meaningful examples. This isfollowed by a discussion on how our method can assistcorpus-wide clustering of performances in Section 7, af-ter which the Conclusion will be presented.
302

2. STATE-OF-THE-ART REVIEW
A lot of work exists on analyzing musical performanceexpressivity. In several cases, establishing models forcomputer-rendered expressive performances was the ulti-mate goal (e.g. see [10,11]). Other works focused on iden-tifying reasons behind performance expressivity, includinglower-level perceptual processes [21]; varying score edi-tions, individual treatments of ornamentation and pedaling,and music-theoretic notions of expectation and tension-relaxation [20]; generative rules, emotional expression,random variability, motion principles and stylistic unex-pectedness [14]; and musical structure [9, 13, 20]. His-torically, the analysis of musical performance strongly fo-cused on expressivity in piano playing (e.g. [6, 20–22]).The few exceptions to this rule focused on violin perfor-mance (e.g. [4]), movement in clarinet players (e.g. [8]),and performance of trained and untrained singers (e.g. [7],inspired by [26]), but to the best of our knowledge, no sys-tematic comparative studies have been performed consid-ering larger ensembles.
A reason for the general bias towards piano perfor-mance may be that digital player pianos (e.g. the YamahaDisklavier) allow a very precise recording of mechanicalperformance parameters. When such parameters are avail-able, inter-onset-intervals (IOIs), expressing the time be-tween subsequent onsets, are frequently studied. Other-wise, performance parameters have to be extracted or an-notated from the audio signal. As a piano has a discretepitch set and percussive mechanics, expressive possibil-ities for a pianist are restricted to timing, dynamics andarticulation. As a consequence, audio-based performanceanalysis methods usually focus on local timing and dynam-ics. Since it is not trivial to find a suitable time unit forwhich these parameters should be extracted, supervised orsemi-supervised methods often have been applied to ob-tain this, e.g. by departing from manually annotating beatlabels (e.g. [24, 25]). However, it is hard (if not infeasi-ble) to realize such a (semi-)supervised approach at scale.Therefore, while a very large corpus of recorded ChopinMazurkas exists, in practice only the Mazurkas for whichannotated beat information exists have been studied in fur-ther depth (e.g. [15, 19, 24, 25]).
Alternatively, in [17, 18] an unsupervised approach forcomparing Mazurka recordings was proposed which doesnot rely on explicitly modeled higher-level performanceparameters or semantic temporal units, but rather on align-ment patterns from low-level short-time frame analyses.As such, this approach would be scalable to a larger cor-pus. Furthermore, while the choice of not adopting explicitperformance parameters makes evaluation of a clear-cutground truth less trivial, at the same time it allows for anysalient variations to emerge automatically from the analy-sis. The work of this paper follows a similar philosophy.
3. MOTIVATION FOR SPECTROGRAM IMAGES
In this paper, we focus on the comparative analysis of or-chestra recordings. An orchestra involves a mix of many
(a) Georg Solti, Chicago Symphony Orchestra, 1973.
(b) Nikolaus Harnoncourt, Chamber Orchestra of Europe, 1990.
Figure 1. Beethoven’s Eroica symphony, 2nd movement,spectrogram of bars 56-60 for two different interpretations.
instruments. Hence, the overall orchestral sound is richerthan that of a piano, although individual beat placings andnote onsets will be much smoother. Given the multitudeof involved players, an orchestra needs guidance by a con-ductor. Due to this coordinated setup, there is less roomfor individual freedom in both local dynamics and tempothan in Romantic piano music repertoire. Thus, while lo-cal tempo deviations still occur in orchestral recordings,one cannot expect these to reflect performer individualityas strongly as for example in the case of Chopin Mazurkas.
At the same time, in terms of timbre, balance and phras-ing articulation, a conductor has a much richer palette thanisolated instruments can offer. These aspects are not trivialto explicitly model or interpret from audio signals. How-ever, relevant information may be reflected in recordingspectrograms, as illustrated in Figure 1. While it is hardto point out individual instruments, a spectrogram can vi-sually reveal how rich the overall sound is, where signalenergy is concentrated, and if there are any salient soundquality developments over time, such as vibrato notes.
Indeed, spectrograms are commonly used in audio edit-ing tools for visualization, navigation and analysis pur-poses. In an ethnographic study of musicologists studyinghistorical recordings, it further was shown that examina-tion of the spectrogram helped musicologists in discover-ing and listening to performance nuances [1]. Therefore,regarding potential end users of performance analysis andexploration tools, spectrogram images may be more fa-miliar and interpretable than reduced mid-level represen-tations such as chroma.
4. METHOD
Our proposed analysis method for spectrogram imagesis inspired by the eigenfaces method of Turk and Pent-land [27], which was originally proposed in the contextof human face recognition. Since human faces sharemany common features, by applying Principal Compo-nents Analysis (PCA) on a dataset of aligned facial im-
Proceedings of the 16th ISMIR Conference, Malaga, Spain, October 26-30, 2015 303

ages, a set of basis images (‘eigenfaces’) can be found,explaining most of the variability found in the face dataset.While PCA has previously been applied as a tool in musi-cal performance analysis [23], this analysis was performedon annotation-intensive IOI data. In contrast, our analy-sis considers information which only requires alignmentof different fragments (as will described in Section 5), butno further manual annotation effort.
We apply the same principle to a set of N spectrogramimages for a time-aligned music fragment, as representedby N different recordings. Each spectrogram image x is(i · j) pixels in size. We treat each pixel in the image as afeature; as such, x is a vector of length i · j. We collect allspectrogram images in an (N ⇥ (i · j)) matrix X.
By applying PCA, we decompose X into an (N ⇥ N)matrix of principal component loadings W and an ((i ·j) ⇥ N) matrix of principal components scores T. X canbe reconstructed by performing X = T · WT .
Since the PCA is constructed such that principal com-ponents are ordered in descending order of variance, di-mension reduction can be applied by not using the full Tand W, but only the first L columns of both.
The component scores in T can now be interpreted andvisualized as basis images, each representing a linear com-ponent explaining part of the variability in the dataset.
5. EXPERIMENTAL SETUP
Unfortunately, no standardized corpora on multiple per-formances of the same orchestra piece exist. 1 Further-more, no clear-cut ground truth exists of performance sim-ilarity. We therefore consider a dataset collected for thePHENICX 2 project, consisting of 24 full-length record-ings of Beethoven’s Eroica symphony, as well as 7 record-ings of the Alpensinfonie by Richard Strauss. In theBeethoven dataset, 18 different conductors and 10 orches-tras are featured (with a major role for the recording cat-alogue of the Royal Concertgebouw Orchestra (RCO)),meaning that the same conductor may conduct multiple or-chestras, or even the same orchestra at different recordingmoments. While metadata and audio content are not fullyidentical, in two cases in the dataset (Harnoncourt, Cham-ber Orchestra of Europe (COE) 1990 and 1991; Haitink,London Symphony Orchestra (LSO) 2005 (⇥ 2)), thereare suspicions that these near-duplicates pairs consider thesame original recording. In the Strauss dataset, 6 con-ductors and 6 orchestras are featured: Haitink conductsboth the RCO and LSO, and the RCO is represented oncemore with Mariss Jansons as conductor. The oldest (Men-gelberg, RCO, 1940) and newest (Fischer, RCO, 2013)recordings are both featured in the Beethoven dataset.
We will demonstrate insights from the PCA spectro-gram analysis in two ways: (1) by highlighting severalanalysis examples in detail in Section 6, based on manualselection of musically relevant fragments and (2) by dis-cussing generalization opportunities in Section 7, based on
1 While a dataset of orchestral recordings with multiple renditions ofthe same piece was used in [2], these recordings are not publicly available.
2 http://phenicx.upf.edu
Figure 2. Eroica 1st movement, score bars 3-10.
aggregation of 4-bar analysis frames.In both cases, a similar strategy is taken: first, a mu-
sical fragment is designated, for which all recordings ofthe piece should be aligned. Alignment is performed au-tomatically using the method described in [12]. Then, theaudio fragments, which are all sampled at Fs = 44.1 kHz,are analyzed using a Hann window of 1024 samples anda hop size of 512, and the corresponding magnitude spec-trum is computed using the Essentia framework [3]. Com-bining the spectra for all frames results in a spectrogramimage. To ensure that all images have equal dimensions, aconstant heigth of 500 pixels is imposed, and the longestfragment in terms of time determines a fixed width of theimage, to which all other spectrograms are scaled accord-ingly. While all recordings are offered at 44.1 kHz, theoriginal recordings sometimes were performed at a lowersampling rate (particularly in more historical recordings).Therefore, a sharp energy cut-off may exist in the higherfrequency zones, and for analysis, we try to avoid this asmuch as possible by only considering the lower 90% ofthe image. In general, by using raw spectrogram images, arisk is that recording quality is reflected in this spectrum;nonetheless, in the next sections we will discuss how mu-sically relevant information can still be inferred.
6. CASE STUDY
In this case study, to illustrate the information revealedby PCA analysis, we will look in detail at informationobtained on two selected fragments: the start of the firstmovement of the Eroica symphony, first theme (bars 3-15),and the ‘maggiore’ part of the Eroica symphony, secondmovement (bars 69-104).
6.1 Eroica first movement, bars 3-15
A score fragment for bars 3-10 of the first movement ofthe Eroica is given in Figure 2. In our case, we considerthe full phrase up to bar 15 in our analysis.
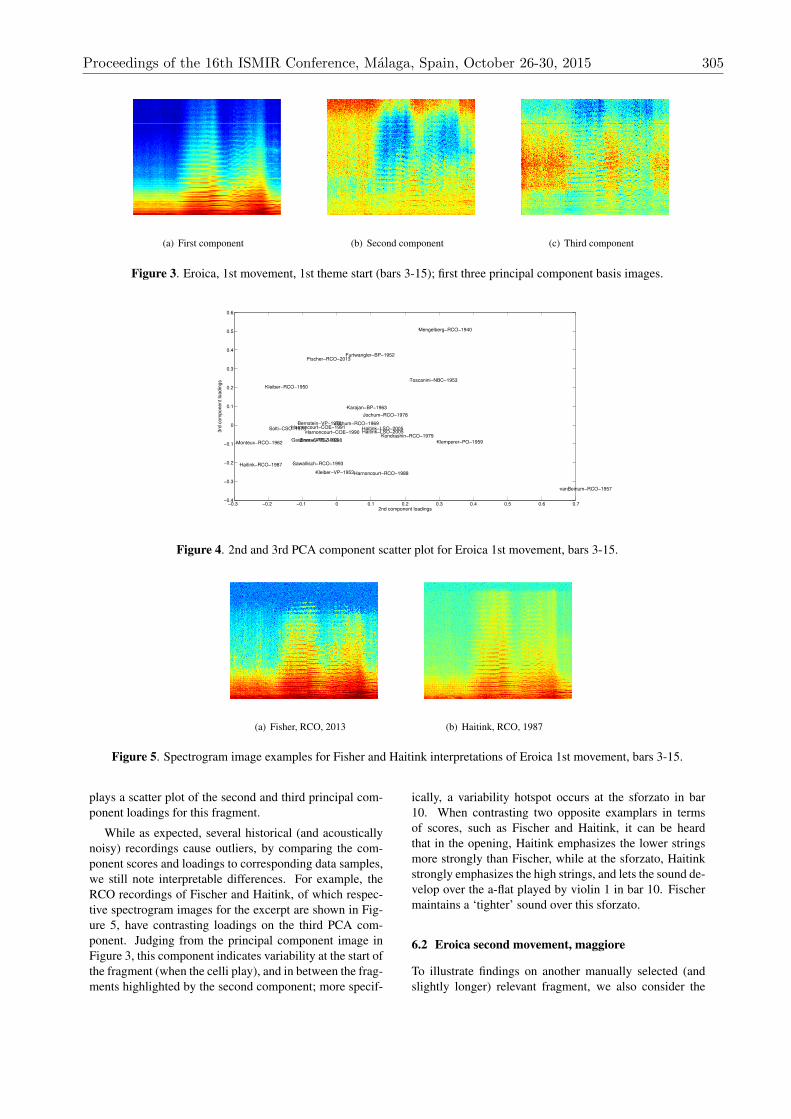
The first three basis images (component scores) result-ing from PCA analysis are shown in Figure 3. The firstcomponent of the PCA analysis gives a smoothed ‘basic’performance version of the fragment. For this very gen-eral component, it is rather hard to truly contrast perfor-mances. However, a more interesting mapping can be donein higher-order components. As an example, Figure 4 dis-
304 Proceedings of the 16th ISMIR Conference, Malaga, Spain, October 26-30, 2015
(a) First component (b) Second component (c) Third component
Figure 3. Eroica, 1st movement, 1st theme start (bars 3-15); first three principal component basis images.
−0.3 −0.2 −0.1 0 0.1 0.2 0.3 0.4 0.5 0.6 0.7−0.4
−0.3
−0.2
−0.1
0
0.1
0.2
0.3
0.4
0.5
0.6
Fischer−RCO−2013
Bernstein−VP−1978
Furtwangler−BP−1952
Gardiner−ORR−1993
Haitink−LSO−2005Harnoncourt−COE−1991
Karajan−BP−1963
Klemperer−PO−1959
Solti−CSO−1973
Toscanini−NBC−1953
Zinman−TOZ−1998
Haitink−RCO−1987
Harnoncourt−RCO−1988
Jochum−RCO−1978
Kleiber−RCO−1950
Kondrashin−RCO−1979
Mengelberg−RCO−1940
Monteux−RCO−1962
Sawallisch−RCO−1993
Jochum−RCO−1969
Harnoncourt−COE−1990
Kleiber−VP−1953
Haitink−LSO−2005
vanBeinum−RCO−1957
2nd component loadings
3rd
com
ponent lo
adin
gs
Figure 4. 2nd and 3rd PCA component scatter plot for Eroica 1st movement, bars 3-15.
(a) Fisher, RCO, 2013 (b) Haitink, RCO, 1987
Figure 5. Spectrogram image examples for Fisher and Haitink interpretations of Eroica 1st movement, bars 3-15.
plays a scatter plot of the second and third principal com-ponent loadings for this fragment.
While as expected, several historical (and acousticallynoisy) recordings cause outliers, by comparing the com-ponent scores and loadings to corresponding data samples,we still note interpretable differences. For example, theRCO recordings of Fischer and Haitink, of which respec-tive spectrogram images for the excerpt are shown in Fig-ure 5, have contrasting loadings on the third PCA com-ponent. Judging from the principal component image inFigure 3, this component indicates variability at the start ofthe fragment (when the celli play), and in between the frag-ments highlighted by the second component; more specif-
ically, a variability hotspot occurs at the sforzato in bar10. When contrasting two opposite examplars in termsof scores, such as Fischer and Haitink, it can be heardthat in the opening, Haitink emphasizes the lower stringsmore strongly than Fischer, while at the sforzato, Haitinkstrongly emphasizes the high strings, and lets the sound de-velop over the a-flat played by violin 1 in bar 10. Fischermaintains a ‘tighter’ sound over this sforzato.
6.2 Eroica second movement, maggiore
To illustrate findings on another manually selected (andslightly longer) relevant fragment, we also consider the
Proceedings of the 16th ISMIR Conference, Malaga, Spain, October 26-30, 2015 305

−0.4 −0.3 −0.2 −0.1 0 0.1 0.2 0.3 0.4−0.4
−0.2
0
0.2
0.4
0.6
0.8
1
3rd component loadings
4th
co
mp
on
en
t lo
ad
ing
s
Fischer−RCO−2013
Bernstein−VP−1978Furtwangler−BP−1952
Gardiner−ORR−1993
Haitink−LSO−2005
Harnoncourt−COE−199
Karajan−BP−1963Klemperer−PO−1959
Solti−CSO−1973
Toscanini−NBC−1953Zinman−TOZ−1998 Haitink−RCO−1987
Harnoncourt−RCO−1988Jochum−RCO−1978
Kleiber−RCO−1950
Kondrashin−RCO−1979
Mengelberg−RCO−1940
Monteux−RCO−1962
Sawallisch−RCO−1993
Jochum−RCO−1969
Harnoncourt−COE−19
Kleiber−VP−1953
Haitink−LSO−2005vanBeinum−RCO−1957
Figure 6. 3rd and 4th PCA component scatter plot for Eroica 2nd movement, maggiore. Jochum’s 1969 and 1978 record-ings occur within the marked rectangular border.
‘maggiore’ part of the second movement of the Eroica.Analyses of scatter plots and component images show thatthe second principal component is affected by historicalrecording artefacts. However, this is less so for the thirdand fourth component, of which the scatter plot is dis-played in Figure 6. It can be seen that the suspected near-duplicates of Harnoncourt’s two COE recordings havenear-identical loadings on these components. Next to this,another strong similarity is noted between the recordingsof Jochum with the RCO in 1969 and 1978. While theseboth recordings acoustically are clearly different and alsoseem to be explicitly different interpretations, there still areconsistencies in Jochum’s work with the same orchestra forthese two recordings.
7. CORPUS-WIDE CLUSTERING
As demonstrated in the previous section, PCA analysiscan be used as an exploratory tool to reveal differencesbetween selected fragments in recordings. However, se-lecting incidental manual examples will not yet allow forscalable analysis of information over the full timeline ofa piece. To do this, instead of pre-selecting designatedfragments, we perform a 4-bar sliding window PCA anal-ysis on full synchronized recordings, where bar bound-aries are obtained through the score-to-performance map-ping obtained in the alignment procedure. Instead of ex-amining individual component images, in each 4-bar anal-ysis frame, we consider vectors of component loadingsfor the minimum amount of components required to ex-plain 95% of the variance observed. From these compo-nent loading vectors, we compute the Euclidean distancebetween recordings within a frame, and aggregate these atthe recording track level. 3
3 Note that component loadings obtained for different frames cannotbe directly averaged, as the components are different per frame. How-ever, observed distances between recordings still remain valid and can beaggregated.
Based on distances found between performances, clus-tering can be performed. This reveals whether stable per-former clusters can found for different movements withina piece, and to what extent clusterings found in local frag-ments match those found for a full piece.
Regarding the first question, for each of the Eroicamovements, we calculated the average between-performerdistances per movement, and then made 5 clusters of per-formers based on Ward’s linkage method [28]. Whilespace does not allow a full cluster result report, severalclusters co-occur consistently:
• The two Harnoncourt COE recordings consistentlyform a separate cluster. These are highly likely to beduplicate recordings.
• Haitink’s two LSO recordings also consistently co-occur, and like Harnoncourt are highly likely to beduplicate recordings. However, Bernstein’s 1978 Vi-enna Philharmonic recording co-occurs with thesetwo Haitink recordings in the first three Eroicamovements, and thus may be similar in terms of in-terpretation. It is striking that Haitink’s 1987 record-ing with the RCO never co-occurs in this cluster.
• In the first three movements, a consistent cluster oc-curs with recordings by Klemperer (PhilharmoniaOrchestra, 1959), Toscanini (NBC Symphony Or-chestra, 1953) and Van Beinum (RCO, 1957). Whilethis may be due to recording artefacts, other histor-ical recordings (e.g. Kleiber, RCO 1950 / ViennaPhilharmonic 1953) do not co-occur.
• Surprisingly, Gardiner’s historically informedrecording with the Orchestre Revolutionaire etRomantique (1993) clusters with Kleiber’s 1950RCO recording for the first and last movement ofthe Eroica. Upon closer listening, Gardiner’s choiceof concert pitch matches the pitch of Kleiber’srecording, and the sound qualities of the orchestras
306 Proceedings of the 16th ISMIR Conference, Malaga, Spain, October 26-30, 2015

Karajan−BP−1980 Jaervi−SNO−1987 Luisi−SD−2007 Haitink−RCO−1985 Previn−PHO−1980Jansons−RCO−2007Haitink−LSO−2008
0.4
0.6
0.8
1
1.2
1.4
(a) ‘Sonnenaufgang’ fragment (bars 46-63).
Haitink−RCO−1985 Jaervi−SNO−1987 Luisi−SD−2007 Karajan−BP−1980 Previn−PHO−1980Jansons−RCO−2007Haitink−LSO−2008
0.6
0.7
0.8
0.9
1
1.1
1.2
1.3
1.4
(b) Average over full Alpensinfonie.
Figure 7. Dendrogram images for performer distances inthe Alpensinfonie.
are indeed similar (although in case of Kleiber, thisis caused by recording artefacts).
• The 1969 and 1978 Jochum recordings with theRCO always co-occur, though in the largest clusterof recordings. As such, they are similar, but no clearoutlier pair compared to the rest of the corpus.
Regarding consistent clusterings over the course of apiece, we further illustrate an interesting finding fromthe Alpensinfonie, in which we compare a clustering ob-tained on 18 bars from the ‘Sonnenaufgang’ movement tothe clustering obtained for average distances over the fullpiece, as visualized in the form of dendrograms in Fig-ure 7. As can be noted, the clusterings are very close, withthe only difference that within the ‘Sonnenaufgang’ move-ment, Karajan’s interpretation is unusually close to Jarvi’sinterpretation, while Haitink’s interpretation is unusuallydifferent.
8. CONCLUSION
In this paper, we proposed to analyze differences betweenorchestral performance recordings through PCA analysisof spectrogram images. As we showed, PCA analysis iscapable of visualizing areas of spectral variation betweenrecordings. It can be applied in a sliding window setupto assess differences between performers over the timeline
of a piece, and findings can be aggregated over interpre-tations of multiple movements. While spectrograms in-evitably have sensitivity to recording artefacts, we showedthat near-duplicate recordings in the corpus could be iden-tified, and historical recordings in the corpus do not con-sistently form outliers in the different analyses.
While certain interesting co-occurrences were foundbetween recordings, no conclusive evidence was found re-garding consistent clustering of the same conductor withdifferent orchestras, or the same orchestra with differentconductors. This can either be due to interference fromartefacts and different recording setups, but at the sametime may suggest that different conductors work differ-ently with different orchestras.
Several directions of future work can be identified. Firstof all, further refinement regarding the generation and anal-ysis of the spectrogram images should be performed. Atthe moment, given the linear way of plotting and highsample rate, the plain spectrogram may be biased towardshigher-frequency components, and risks to be influencedby sharp frequency cut-offs from lower original recordingsample rates.
Furthermore, it would be interesting to study moredeeply if visual inspection of spectrograms can indeed as-sist people in becoming more actively aware of perfor-mance differences. While the spectrogram images are ex-pected to already be understandable to potential end-users,appropriate techniques should still be found for visualiz-ing differences between multiple performers in a corpus.In the current paper, this was done with scatter plots anddendrograms, but for non-technical end-users, more intu-itive and less mathematically-looking visualizations maybe more appropriate.
One concern that may come up with respect to ourwork, is that it may be hard to fully associate our reportedfindings to expressive performance. As indicated, record-ing artefacts are superimposed on the signal, and effectsof different halls and choices of orchestra instruments andconcert pitch may further influence acoustic characteris-tics, which will in turn influence our analysis. Further-more, since we are dealing with commercial recordings,we are dealing with produced end results which may havebeen formed out of multiple takes, and as such do not re-flect ‘spontaneous’ performance.
However, our main interest is not in analyzing per-formance expressivity per se, but in providing novelways for archive and search engine exploration, andmaking general sense of larger volumes of unannotatedperformance recordings. In such settings, the data understudy will mostly be produced recordings with the abovecharacteristics. For this, we believe our approach isuseful and appropriate, offering interesting applicationopportunities.
Acknowledgements: The research leading to these results hasreceived funding from the European Union Seventh FrameworkProgramme FP7 / 2007–2013 through the PHENICX project un-der Grant Agreement no. 601166.
Proceedings of the 16th ISMIR Conference, Malaga, Spain, October 26-30, 2015 307

9. REFERENCES
[1] M. Barthet and S. Dixon. Ethnographic observations of musi-cologists at the British Library: implications for Music Infor-mation Retrieval. In Proceedings of the International Societyfor Music Information Retrieval Conference (ISMIR), Miami,USA, 2011.
[2] J. P. Bello. Measuring structural similarity in music. IEEETransactions on Audio, Speech and Language Processing,19(7):2013–2025, 2011.
[3] D. Bogdanov, N. Wack, E. Gomez, S. Gulati, P. Herrera,O. Mayor, G. Roma, J. Salamon, J. Zapata, and X. Serra. ES-SENTIA: an Audio Analysis Library for Music InformationRetrieval. In Proceedings of the International Society for Mu-sic Information Retrieval Conference, pages 493–498, 2013.
[4] E. Cheng and E. Chew. Quantitative Analysis of PhrasingStrategies in Expressive Performance: Computational Meth-ods and Analysis of Performances of Unaccompanied Bachfor Solo Violin. Journal of New Music Research, 37:325–338,December 2008.
[5] N. Cook. Towards the compleat musicologist? In Proceed-ings of the International Symposium on Music InformationRetrieval (ISMIR) [invited talk], London, UK, 2005.
[6] P. Desain and H. Honing. Does expressive timing in musicperformance scale proportionally with tempo? PsychologicalResearch, 56(4):285–292, July 1994.
[7] J. Devaney, M. I. Mandel, D. P. W. Ellis, and I. Fujinaga.Automatically extracting performance data from recordingsof trained singers. Psychomusicology: Music, Mind & Brain,21:108–136, 2011.
[8] M. M. Wanderley E. C. F. Teixeira, M. A. Loureiro and H. C.Yehia. Motion Analysis of Clarinet Performers. Journal ofNew Music Research, July 2014.
[9] A. Friberg and J. Sundberg. Does music performance alludeto locomotion? A model of final ritardandi derived frommeasurements of stopping runners. Journal of the AcousticSociety of America, 105(3):1469–1484, March 1999.
[10] W. Goebl, S. Dixon, G. De Poli, A. Friberg, R. Bresin, andG. Widmer. “Sense” in expressive music performance: Dataacquisition, computational studies, and models. In P. Polottiand D. Rocchesso, editors, Sound to sense, sense to sound: astate of the art in sound and music computing. Logos Verlag,2007.
[11] W. Goebl and G. Widmer. On the use of computational meth-ods for expressive music performance. In T. T. Crawfordand L. Gibson, editors, Modern Methods for Musicology:Prospects, Proposals and Realities, Digital Research in theArts and Humanities, pages 93–113. Ashgate, 2009.
[12] M. Grachten, M. Gasser, A. Arzt, and G. Widmer. AutomaticAlignment of Music Performances with Structural Differ-ences. In Proceedings of the International Society for MusicInformation Retrieval Conference (ISMIR), pages 607–612,2013.
[13] M. Grachten and G. Widmer. Who is who in the end? Recog-nizing pianists by their final ritardandi. In Proceedings of theInternational Society for Music Information Retrieval Con-ference (ISMIR), Kobe, Japan, October 2009.
[14] P. N. Juslin. Five facets of musical expression: a psycholo-gist’s perspective on music performance. Psychology of Mu-sic, 31(3):273–302, July 2003.
[15] K. Kosta, O. F. Bandtlow, and E. Chew. Practical implicationsof dynamic markings in the score: Is piano always piano?In Proceedings of the 53rd International AES Conference onSemantic Audio, London, UK, January 2014.
[16] E. Liebman, E. Ornoy, and B. Chor. A Phylogenetic Ap-proach to Music Performance Analysis. Journal of New Mu-sic Research, 41:195–222, June 2012.
[17] C. C. S. Liem and A. Hanjalic. Expressive timing from cross-performance and audio-based alignment patterns: An ex-tended case study. In Proceedings of the International Societyfor Music Information Retrieval Conference (ISMIR), Miami,Florida, USA, October 2011.
[18] C. C. S. Liem, A. Hanjalic, and C. S. Sapp. Expressivity inmusical timing in relation to musical structure and interpre-tation: A cross-performance, audio-based approach. In Pro-ceedings of the 42nd International AES Conference on Se-mantic Audio, pages 255–264, Ilmenau, Germany, July 2011.
[19] M. Muller, P. Grosche, and C. S. Sapp. What makes beattracking difficult? a case study on chopin mazurkas. In Pro-ceedings of the International Society for Music InformationRetrieval Conference (ISMIR), Utrecht, The Netherlands, Au-gust 2010.
[20] C. Palmer. Anatomy of a performance: Sources of musicalexpression. Music Perception, 13:433–453, Spring 1996.
[21] A. Penel and X. Drake. Sources of timing variations in musicperformance: a psychological segmentation model. Psycho-logical Research, 61(1):12–32, March 1998.
[22] B. Repp. A microcosm of musical expression. I. Quantitativeanalysis of pianist’s timing in the initial measures of Chopin’sEtude in E major. Journal of the Acoustic Society of America,104(2):1085–1100, August 1998.
[23] B. Repp. A microcosm of musical expression. I. Quantitativeanalysis of pianist’s timing in the initial measures of Chopin’sEtude in E major. Journal of the Acoustic Society of America,104(2):1085–1100, August 1998.
[24] C. S. Sapp. Comparative analysis of multiple musical per-formances. In Proceedings of the International Conferenceon Music Information Retrieval (ISMIR), Vienna, Austria,September 2007.
[25] C. S. Sapp. Hybrid numeric/rank similarity metrics for mu-sical performance analysis. In Proceedings of the Interna-tional Conference on Music Information Retrieval (ISMIR),Philadelphia, USA, September 2008.
[26] C. Seashore. Psychology of music. University of Iowa Press,Iowa City, 1938.
[27] M. A. Turk and A. P. Pentland. Face recognition using eigen-faces. In Proceedings of IEEE Computer Society Conferenceon Computer Vision and Pattern Recognition (CVPR), Maui,Hawaii, USA, June 1991.
[28] J. H. Ward Jr. Hierarchical grouping to optimize an objec-tive function. Journal of the American Statistical Association,58(301):236–244, 1963.
[29] G. A. Wiggins. Computer-representation of music in the re-search environment. In T. T. Crawford and L. Gibson, editors,Modern Methods for Musicology: Prospects, Proposals andRealities, Digital Research in the Arts and Humanities, pages7–22. Ashgate, Aldershot, UK, 2009.
308 Proceedings of the 16th ISMIR Conference, Malaga, Spain, October 26-30, 2015