donya farhanian-evaluation of uv-pco technology and by ... · ultraviolet photocatalytic oxidation...
TRANSCRIPT

Evaluation of UV-PCO Technology and By-Products Generation in
Full-Scale Open Test Rig
Donya Farhanian
A Thesis
in
The Department
of
Building, Civil and Environmental Engineering
Presented in Partial Fulfillment of the Requirements
for the Degree of Master of Applied Science at
Concordia University
Montreal, Quebec, Canada
August 2012
© Donya Farhanian 2012

Concordia University School of Graduate Study
This is to certify that the thesis prepared
By: Vida Safari
Entitled: A Systematic Approach to Evaluating Gaseous Filter Models
And submitted in partial fulfillment of the requirements for the degree of
Master of Applied Science
complies with the regulations of the University and meets the accepted standards with respect to originality and quality.
Signed by the final examining committee:
Dr. M. Elektorowicz Chair
Dr. S. Li Examiner
Dr. Y. Zeng Examiner
Dr. F. Haghighat Supervisor
Donya FarhanianEvaluation of UV-PCO Technology and By-Products Generation in Full-ScaleOpen Test RigEntitled: Evaluation of UV-PCO Technology and By-Products Generation in Full-Scale
Open Test Rig
Master of Applied ScienceMaster of Applied Science
Entitled:
Dr. C. Mulligan
Dr. F. Haghighat
Dr. H. D. Ng
Dr. L. Wang
Donya Farhanian
Evaluation of UV-PCO Technology and By-Products Generation in Full-Scale Open Test Rig

iii
ABSTRACT
Evaluation of UV-PCO Technology and By-Products Generation in Full-Scale Open
Test Rig
Donya Farhanian
The quantity of the outdoor air for building ventilation has a direct negative effect on the
building energy cost and the environment. Also, there are plenty of pollutants in an
indoor environment which affect building occupants’ health and comfort. This is one of
the concerns in design of sustainable buildings which leads to a balancing act between
indoor air quality (IAQ) and energy cost.
Ultraviolet photocatalytic oxidation (UV-PCO) is regarded as one of the salient
technologies for decomposition of pollutants, especially volatile organic compounds
(VOCs) and a viable alternative to activated carbon filters. Majority of the previous
research on UV-PCO was performed in an ideal bench top reactor and in ppm range of
VOCs. Also, limited research has been devoted to investigate the generation of UV-PCO
toxic by-products while this issue is one of the main drawbacks in design of sustainable
buildings.
The objectives of this study were to: (1) Develop a methodology for determining the
performance of UV-PCO technology using full scale experimental set-up; (2)
Qualification and quantification of generated by-products; (3) Comparing UV-PCO
performance either in presence or absence of ozone, and (4) Investigating the impact of
operational parameters.
iv
Results showed UV-PCO method has better performance in presence of ozone using
VUV lamps, although some by-products generated only in presence of ozone. It was
found that among tested VOCs, ethanol and 1-butanol generated more by-products,
especially acetaldehyde. Some toxic compounds including formaldehyde and
acetaldehyde were generated in all cases. Increment of flow rate and relative humidity,
decreased the UV-PCO performance for ethanol oxidation. System performance was
significantly improved by increasing the number of reactors.

To my husband and my parents

v
ACKNOWLEDGMENT
First of all, I wish to express my gratitude appreciation and respect to my supervisor, Dr.
Fariborz Haghighat, for his continuous support, inspiration and valuable guidance during
my graduate study. I would also like to acknowledge his e orts for establishing a very
friendly and stimulating atmosphere in the Indoor Air Cleaning Group.
My sincere appreciation extends Dr. Chang-Seo Lee who served as an unofficial co-
advisor and offered many enlightened ideas and comments, invaluable feedbacks,
creative innovativeness, valuable discussions and constructive suggestions and help
throughout this project.
I am thankful for the financial support by the Natural Science and Engineering Research
Council of Canada (NSERC) and Circul-aire Inc.
Very special thanks go out to my colleagues in our research group: Lexuan Zhong,
Alireza Aghighi and Mitra Bahri who their valuable assistance and friendship means a lot
to me.
It gives me immense pleasure to thank my parents for their perpetual love and
encouragement. Nothing I say can do justice to how I feel about their support. I feel very
lucky to have a family that shares my enthusiasm for academic pursuits.
I am indebted to my husband Walid Masoudimansour and I owe my heartfelt thanks and
love to him for his personal dedication, enthusiasm in sharing his knowledge and
providing valuable feedback and cooperation at various stages of this work.
Lastly, I want to thank God for the endless supply of hope that provided me with courage
and guidance throughout my life and academic studies.

vi
TABLE OF CONTENT
ABSTRACT ...................................................................................................................... iii
ACKNOWLEDGMENT .................................................................................................. v
LIST OF FIGURES .......................................................................................................... x
LIST OF TABLES ......................................................................................................... xiii
LIST OF ABBREVIATIONS ....................................................................................... xiv
LIST OF SYMBOLS ..................................................................................................... xvi
CHAPTER 1 INTRODUCTION ..................................................................................... 1
1.1 BACKGROUND .............................................................................................. 1
1.1.1 Indoor Air Quality.................................................................................... 2
1.1.2 Air Cleaners ............................................................................................. 5
1.1.2.1 Mechanical filters .............................................................................. 5
1.1.2.2 Ultraviolet germicidal irradiation (UVGI) ........................................ 7
1.1.2.3 Electronic air cleaner ........................................................................ 7
1.1.2.4 Solid sorbents ..................................................................................... 8
1.1.2.5 Ozone generators ............................................................................... 9
1.1.2.6 Photocatalytic oxidation .................................................................... 9
1.2 RESEARCH OBJECTIVES ........................................................................... 10
1.3 THESIS OUTLINE AND PUBLICATIONS ................................................. 11
CHAPTER 2 LITERATURE REVIEW ....................................................................... 12
2.1 INTRODUCTION .......................................................................................... 12
2.2 PHOTOLYSIS ................................................................................................ 12
2.2.1 Direct UV Photolysis ............................................................................. 13
2.2.2 Sensitized Photolysis .............................................................................. 14
2.3 PHOTOCHEMICAL OXIDATION WITH OZONE ..................................... 14
2.4 PHOTOCATALYTIC OXIDATION (PCO) .................................................. 17

vii
2.4.1 Photocatalytic Oxidation Mechanism .................................................... 19
2.4.2 Photocatalytic Oxidation Advantages.................................................... 22
2.4.3 Photocatalytic Oxidation Disadvantages .............................................. 23
2.5 CATALYST .................................................................................................... 23
2.5.1 Modification of Photocatalyst ................................................................ 26
2.5.2 Catalyst Deactivation and Regeneration ............................................... 28
2.6 UV-LIGHT LAMPS ....................................................................................... 30
2.7 INTERMEDIATES AND BY-PRODUCTS .................................................. 31
2.8 OPERATIONAL PARAMETERS AFFECTING PCO PROCESS ............... 33
2.8.1 Humidity ................................................................................................. 33
2.8.2 Oxygen Content ...................................................................................... 35
2.8.3 Temperature ........................................................................................... 36
2.8.4 Flow Rate ............................................................................................... 37
2.8.5 Light Intensity ........................................................................................ 38
2.8.6 Presence of Other Compounds .............................................................. 39
2.8.7 Pressure ................................................................................................. 40
2.9 RELATED WORKS ....................................................................................... 41
CHAPTER 3 EXPERIMENTAL SET-UP AND METHODOLOGY ....................... 44
3.1 INTRODUCTION .......................................................................................... 44
3.2 CHEMICALS AND REAGENTS .................................................................. 44
3.3 GENERATION SET-UP OF REAGENTS .................................................... 46
3.4 ANALYTICAL INSTRUMENTS .................................................................. 47
3.4.1 High-Performance Liquid Chromatography (HPLC) ........................... 48
3.4.2 Auto-Sampler ......................................................................................... 50
3.4.3 Multi-Gas Photoacoustic Detector ....................................................... 50
3.4.4 Ozone Analyzer ...................................................................................... 50
3.5 INSTRUMENT CALIBRATION ................................................................... 50
3.5.1 Sampling Pumps Calibration ................................................................. 51

viii
3.5.2 Multi-Gas Photoacoustic Detector ...................................................... 51
3.5.3 HPLC Calibration .................................................................................. 52
3.6 DUCT TEST RIG SPECIFICATIONS .......................................................... 53
3.7 ENVIRONMENTAL CONDITION MEASUREMENT ............................... 60
3.8 EXPERIMENTAL METHODOLOGY AND PROCEDURE ....................... 60
3.8.1 Removal Efficiency................................................................................. 62
3.8.2 Net By-product Concentration ............................................................... 63
CHAPTER 4 EXPERIMENTAL RESULTS AND DISCUSSION ............................ 64
4.1 INTRODUCTION .......................................................................................... 64
4.2 UV-PCO PERFORMANCE AND BY-PRODUCTS GENERATION USING
DIFFERENT CLASSES AND CONCENTRATIONS OF VOCS .............................. 64
4.2.1 Alcohol VOCs......................................................................................... 64
4.2.2 Alkane VOCs .......................................................................................... 69
4.2.3 Ketone VOCs .......................................................................................... 73
4.2.4 Aromatic VOCs ...................................................................................... 76
4.2.5 All Groups of VOCs ............................................................................... 80
4.3 PARAMETRIC STUDY OF THE UV-PCO SYSTEM ................................. 82
4.3.1 Repeatability Test................................................................................... 83
4.3.2 Concentration Effect .............................................................................. 83
4.3.3 Effect of Relative Humidity .................................................................... 83
4.3.4 Effect of Flow Rate................................................................................. 85
4.3.5 Effect of Number of Lamps (Irradiance) ................................................ 87
4.3.6 Removal Efficiency Improvement .......................................................... 88
CHAPTER 5 CONCLUSIONS AND FUTURE WORK ............................................ 90
5.1 SUMMARY .................................................................................................... 90
5.2 CONCLUSIONS AND MAJOR FINDINGS ................................................. 90
5.3 LIMITATIONS OF THE PRESENT STUDY ................................................. 94
5.4 RECOMMENDATIONS FOR FUTURE WORK ......................................... 94

ix
References ........................................................................................................................ 96
Appendix A: VOCs Injection Rate Calculation Using Syringe System Injection ... 104
Appendix B: HPLC and B&K Calibration Equations .............................................. 105
Appendix C: Ozone Concentration in Downstream of Ducts ................................... 106
Appendix D: Light Intensity of the UV-lamps in Catalyst Surface.......................... 109

x
LIST OF FIGURES
Figure 1-1 Mechanical filter and their installation ............................................................. 6
Figure 2-1 Mass transfer mechanism in UV-PCO process .............................................. 20
Figure 2-2 Photocatalytic oxidation molecular process .................................................... 21
Figure 2-3 Structures of rutile and anatase types of TiO2 ................................................. 24
Figure 2-4 Band gaps and VB and CB edges of common semiconductors and standard redox potentials versus NHE (NHE: normal hydrogen electrode) of the (O2 /O2
• −) and (•OH/−OH) redox couple .................................................................................... 26
Figure 2-5 Schematic diagrams of the beam techniques. ................................................. 28
Figure 2-6 Catalyst deactivation: a) Sintering b) Fouling or coking c) Poisoning .... 29
Figure 2-7 Water and oxygen molecules adsorb at different active sites. ........................ 36
Figure 2-8 Schematic diagram of UVPCO reactor showing arrangement of four photocatalytic monoliths and three banks of three UVA lamps ............................... 42
Figure 3-1 Low concentration generation system setup ................................................... 47
Figure 3-2 High-performance liquid chromatography (HPLC) ........................................ 49
Figure 3-3 a)Supelco Lp-DNPH b) Lp-DNPH cartridges Ozone Scrubber (KI Ozone scrubber) ................................................................................................................... 49
Figure 3-4 High flow rate sampling pump calibration setup. ........................................... 51
Figure 3-5 Multi-gas photoacoustic detector calibration set-up. ..................................... 52
Figure 3-6 Duct test rig picture ......................................................................................... 54
Figure 3-7 Duct apparatus dimensions ............................................................................. 54
Figure 3-8 a)Open test rig apparatus schematic diagram b)Different parts of each duct 55 Figure 3-9 UV-lamps and their configuration .................................................................. 56
Figure 3-10 Catalyst substrate A consists of TiO2 coated on fiber glass. ......................... 57

xi
Figure 3-11 Catalyst substrate B consists of TiO2 coated on the activated carbon. ......... 57
Figure 3-12 Filters of multi mix chemical media of activated carbon and chemically impregnated alumina for adsorbing VOCs and aldehydes. ...................................... 58
Figure 3-13 Ozone scrubber screen made of MnO2 catalyst. ........................................... 58
Figure 3-14 a) Cross section tubes, b) Sampling port setup. ........................................... 59
Figure 4-1 Removal efficiency of ethanol in each duct. ................................................... 65
Figure 4-2 Removal efficiency of 1-butanol in each duct. ............................................... 65
Figure 4-3 Formaldehyde generation in ethanol experiments in each duct. ..................... 66
Figure 4-4 Acetaldehyde generation in ethanol experiments in each duct. ...................... 67
Figure 4-5 Formaldehyde generation in 1-butanol experiments in each duct. ................. 67
Figure 4-6 Acetaldehyde generation in 1-butanol experiments in each duct.................... 67
Figure 4-7 Propionaldehy degeneration in 1-butanol experiments in each duct. ............. 68
Figure 4-8 Butyraldehyde generation in 1-butanol experiments in each duct. ................ 68
Figure 4-9 Removal efficiency of n-hexane in each duct. ................................................ 70
Figure 4-10 Removal efficiency of n-octane in each duct. ............................................... 70
Figure 4-11 Formaldehyde generation in n-hexane experiments in each duct. ................ 71
Figure 4-12 Acetaldehyde generation in n-hexane experiments in each duct. ................. 71
Figure 4-13 By-product generation in n-octane experiments in each duct. ...................... 72
Figure 4-14 Removal efficiency of acetone in each duct. ................................................ 73
Figure 4-15 Removal efficiency of MEK in each duct. .................................................... 73
Figure 4-16 Formaldehyde generation in acetone experiments in each duct.................... 74
Figure 4-17 Acetaldehyde generation in acetone experiments in each duct. .................... 74
Figure 4-18 Formaldehyde generation in MEK experiments in each duct. ...................... 75

xii
Figure 4-19 Acetaldehyde generation in MEK experiments in each duct. ....................... 75
Figure 4-20 Removal efficiency of toluene in each duct. ................................................. 76
Figure 4-21 Removal efficiency of p-xylene in each duct. ............................................... 77
Figure 4-22 Formaldehyde generation in toluene experiments in each duct. ................... 78
Figure 4-23 Acetaldehyde generation in toluene experiments in each duct. .................... 78
Figure 4-24 Crotonaldehyde generation in toluene experiments in each duct.................. 78
Figure 4-25 Formaldehyde generation in p-xylene experiments in each duct. ................. 79
Figure 4-26 Acetaldehyde generation in p-xylene experiments in each duct. .................. 79
Figure 4-27 Crotonaldehyde generation in p-xylene experiments in each duct. .............. 79
Figure 4-28 Removal efficiency of tested VOCs. ............................................................. 81
Figure 4-29 Generated by-products of test VOCs with 500 ppb concentration. .............. 82
Figure 4-30 Effect of relative humidity on removal efficiency of ethanol in each duct. .. 84
Figure 4-31 Formaldehyde generation in different relative humidity in each duct. ......... 84
Figure 4-32 Acetaldehyde generation in different relative humidity in each duct. .......... 85
Figure 4-33 Effect of flow rate on removal efficiency of ethanol in each duct. ............... 86
Figure 4-34 Effect of flow rate on formaldehyde generation in photocatalytic oxidation of ethanol in each duct. ................................................................................................. 86
Figure 4-35 Effect of flow rate on acetaldehyde generation in photocatalytic oxidation of
ethanol in each duct. ................................................................................................. 87

xiii
LIST OF TABLES
Table 1-1 Different classes of VOCs and their possible emission sources ......................... 3
Table 1-2 Reported air quality in different modes of public transportation (μg/m3 ) ......... 4
Table 2-1 ISO standard on determining solar irradiances ................................................ 30
Table 2-2 Light source employed in photo catalytic reactors ........................................... 31
Table 3-1 Physical specification of challenge gases ......................................................... 45
Table 3-2 Possible emission sources and potential health casualties of selected VOCs .. 46
Table 4-1 Environmental test conditions for ethanol and 1-butanol experiments. ........... 65
Table 4-2 Environmental test conditions for n-hexane and n-octane experiments. .......... 69
Table 4-3 Environmental test conditions for acetone and MEK experiments. ................. 73
Table 4-4 Environmental test conditions for toluene and p-xylene experiments. ............ 76
Table 4-5 Environmental conditions and removal efficiency for the repeatability experiments. .............................................................................................................. 83
Table 4-6 Removal efficiency and concentration of generated by-products for each duct
in irradiance experiments. ......................................................................................... 87 Table 4-7 Configuration of reaction section in each duct in irradiance experiments. ...... 88 Table 4-8 Configuration and description of the reaction section in removal efficiency
improvement experiment. ......................................................................................... 89 Table 4-9 Removal efficiency and by-products concentration of removal efficiency
improvement experiment. ......................................................................................... 89
xiv
LIST OF ABBREVIATIONS
ASHRAE American Society of Heating, Refrigerating, and Air-Conditioning
Engineers
AOP Advanced Oxidation Process
ARELs Acute Reference Exposure Levels
BL Black Light
BLB Black Light Blue
B &K Bruel & Kjaer
CB Conduction Band
cfm Cubic Feet per Minute
DAS Data Acquisition System
DCAA Dichloroacetic Acid
EPA Environmental Protection Agency
FPM Foot per Minute
FTIR Fourier-Transform Infrared Spectroscopy
GAC Granular Activated Carbon
GC/MS Gas Chromatography/Mass Spectroscopy
GC-FID/MS Gas Chromatograph/ Flame Ionization Detector /Mass Spectroscopy
HEPA High Efficiency Particulate Air
HVAC Heating, Ventilating and Air-Conditioning
IAQ Indoor Air Quality
ISO International Organization for Standardization
IR Infrared Radiation
MEK Methyl Ethyl Ketone
NHE Normal Hydrogen Electrode
OEHHA Office of Environmental Health Hazard Assessment
PC Personal Computer
ppb Parts per Billion
ppm Parts per Million

xv
ppmv Parts per Million by Volume
ppbv Parts per Billion by Volume
PTFE Polytetrafluoroethylene
PCE Perchloroethylene
PCO Photo-Catalytic Oxidation
PAS Photo-Acoustic Spectroscopy
PTR-MS Proton Transfer Reaction Mass Spectrometer
RH Relative Humidity
SEM Scanning Electron Microscope
SBS Sick Building Syndrome
TVOC Total Volatile Organic Compound
TEAM Total Exposure Assessment Methodology
TCE Trichloroethylene
TEAM Total Exposure Assessment Methodology
TPO Temperature-Programmed Oxidation
TPH Temperature-Programmed Hydrogenation
TeCE Tetrachloroethylene
UHP Ultra High Performance
UV Ultraviolet
UV-PCO Ultraviolet Photo-Catalytic Oxidation
UVGI Ultraviolet Germicidal Irradiation
UV-LED Ultraviolet Light-Emitting Diode
UVC Ultraviolet C
VB Valance Band
VOC Volatile Organic Compound
VUV Vacuum Ultraviolet
WHO World Health Organization

xvi
LIST OF SYMBOLS
English Symbols Description
[A] Concentration of the Acceptor
C Concentration
Cup,t The Upstream Challenge Gas Concentration (ppb) as a Function of Time
Cdown,t The Downstream Challenge Gas Concentration (ppb) as a Function of Time
cA Concentration of the Organics
Cup The Upstream Generated By-Product Concentration (ppb)
Cdown The Downstream Generated By-Product Concentration (ppb)
cfm Cubic Feet per Minute
D Electron Donor
Et Efficiency at Time t
eV
Electron Volt
g Gram
Ga The Net Production of Generated By-Product (ppb)
h Hour
Im Average Number of Einsteins Absorbed by the Absorbing Species per Unit Volume and Unit Time
k Constant
keV Kilo-electron Volt
K Degree Kelvin
L Liter
mM Millimole
m2 Square Meter

xvii
m3 Cubic Meter
mW Milliwatt
nm Nanometer
Pa Pascal
psia Pounds per Square Inch Absolute
Q Airflow Rate
T The Elapsed Time (min)
W or w Watt
μg Microgram
µw Microwatt

1
CHAPTER 1 INTRODUCTION
1.1 BACKGROUND
People's everyday life is tightly tied to the environment, and among all the component of
the environment, air, water and soil are the most important, and this urges more care and
attention for them. Air is the most important one among these three parameters, thus
more attention and consideration are needed to keep it clean.
Considering the population of the world and amount of time people spend in an indoor
environment and growth of new chemical materials such as detergents, petrochemical
products, etc. which are used in everyday life, clean indoor air is one of the most
important factors for building occupants' health and comfort.
There are lots of strategies to improve the quality of air, especially indoor air; however,
there are some questions to be answered. Are these methods economical? Do these
methods destroy pollutants completely or just transfer them from one phase to another,
and postpone pollutants emission into air? Can these methods completely remove the
pollutants or parts of them? Are they efficient for long term application?
For conservation of energy and subsequently reducing energy cost, people seal their
houses tightly, and use construction materials with good insulation. Moreover, they
reduce infiltration of fresh air, hence, natural ventilation decreases and, subsequently,
gaseous pollutants which are generated continuously increase (Birnie et al., 2006;
Tompkins et al., 2005a).
2
1.1.1 Indoor Air Quality
Indoor environments are non-industrial areas such as inside of dwellings, offices,
aircrafts, vehicles, metros, trains, etc. (Wang et al., 2007). Indoor air has a complex
mixture of contaminants which vary over time based on the place and even temperature
and humidity of the building.
Indoor air pollutants can be classified into two main groups: First, particles such as dust,
mist, pollen and bioaerosols; and second, gaseous pollutants including volatile organic
compounds (VOCs), combustion gases and radioactive gases. VOCs are a group of
chemical gases with carbon and hydrogen atoms in chain or ring forms. Also their vapor
pressure is higher than 1 Pa at room temperature and their concentrations are different
based on the environment. In old buildings, the mean concentration of each VOC is lower
than 50 μg/m3, but higher than 5 μg/m3; this concentration is higher in new and lower in
public buildings (Brown et al., 1994). The U.S. Environmental Protection Agency (EPA)
in Total Exposure Assessment Methodology (TEAM) studies declared that typical VOCs
concentration was 2 to 5 times higher than outdoors (U.S. EPA, 2009; Birnie at al.,
2006), and since people spend up to 80% of their life indoors (around 60% in residential
and 20% in other places), worryingly, health problems can affect people’s life (Waki et
al., 1995). VOCs cause sick building syndrome (SBS) which is related to the occupants'
comfort and health (Wang et al., 2007). Minnesota Department of Health (2009) reported
that several factors such as air volume in the building, off-gassing production rate of
VOCs, the ventilation rate in the building, VOCs outdoor concentration, and the time
people spend in an indoor activity affect VOCs level in an indoor environment. Table 1-1
shows different classes of VOCs and their sources.

3
Table 1-1 Different classes of VOCs and their possible emission sources (Cheng and Brown, 2003).
VOCs with the most concentration in aircrafts are acetone and ethanol, in subways m-/p-
xylenes and in residential and office buildings ethanol, limonene, acetone, toluene, and
methylene chloride (Wang et al., 2007). VOC emission is very important since it causes
production of photochemical oxidants such as ozone and peroxyacetyl nitrate. These
oxidant compounds are produced in the presence of sunlight irradiation and existence of
NOx, and cause significant problems such as toxicity and odor, depletion of the
stratospheric ozone layer and finally global warming (Alberici and Jardim, 1997). In most
of the cases, the emission of VOCs causes localization of pollution problems (Bouzaza et
al., 2006). Public transport vehicles are classified as indoor environments, and VOCs in
these environments are of greater concentration than others. Some of the most common
VOCs in these places are shown in Table 1-2.

4
Table 1-2 Reported air quality in different modes of public transportation (μg/m3 ) (Wang et al., 2007).
Exposure to high concentrations of some VOCs for a long time causes damage to some
vital organs such as liver, kidney, and central nervous system, or in extreme cases cancer.
Moreover, short time exposure can cause eye, nose and throat irritation, headache,
nausea, vomiting, dizziness, fatigue, allergic skin reaction, and worsening of asthma
symptoms (Minnesota Department of Health, 2009; U.S. EPA. 2009).
For improvement of indoor air quality, several solutions exist which can be classified into
three major groups:
� Controlling contaminant sources.
� Increasing air change and ventilation in the building and dilution of indoor air
with outdoor to decrease pollutants.
� Using portable air cleaners for rooms or even in duct system for the entire house.

5
But controlling pollutant sources is almost impossible. In the modern world, people's
demand for detergents, odors and paints are increasing. On the other hand, building
materials are mentioned as the largest source of VOCs in an indoor area especially in new
buildings (Wang et al., 2007). On the other hand, increasing air exchange or ventilation
rate has some disadvantages; it does not remove pollutants and just transfers them to the
outdoors. Also it increases the cost of heating and cooling, and finally outdoor air may
bring undesirable pollutants indoor. Therefore, in recent years, air cleaning technologies
have gained significant attention.
1.1.2 Air Cleaners
Heating, ventilation and air-conditioning (HVAC) system by controlling the air
temperature and humidity provides an indoor environment in which the occupants are
thermally comfortable. This is a cost demanding process, and therefore, air cleaner
systems must be designed to take this into account. Air cleaners with different
technologies such as mechanical filters, electronic air cleaners, ion generator adsorbents
or reactive adsorbents for gaseous pollutants are used for indoor buildings. Removing the
sources of pollutants is not feasible; increasing ventilation and air change is not
economical, while removing pollutants with some air cleaners is feasible and economical.
Each air cleaner is designed for specific purposes and with a special technology. Based
on their technologies, air cleaners are classified as the following (U.S. EPA, 2007):
1.1.2.1 Mechanical filters
This type can be used either as a portable device or in duct system in buildings with
central air conditioning or heating system. There are several forms of this type of filter

6
such as flat or panel filters, pleated or extended surface filters, or high efficiency
particulate air (HEPA) filters, Figure 1-1.
Figure 1-1 Mechanical filter and their installation (http://store.airmechanical.com/air-cleaner-filters/bryant-cartridge-filter-filbbcar0020.html), (http://www.epa.gov/iaq/pubs/residair.html# summary).
Flat or panel filters are made of coarse glass fibers, coated animal hair, vegetable fibers,
synthetic fibers (polyester or nylon), synthetic foams, metallic wools, or expanded metals
and foils which sometimes are treated with viscous substances such as oil, which helps
particles to stick to the fibers. Also it can be made of permanent electrically charged
materials such as resin wool, a plastic film or a fiber called “electret,” or an electro-
statically sprayed polymer. As a result of static charge, particles stick to them. This filter
has a low pressure drop and is efficient in attracting small particles. Pleated or extended
surface filters have greater surface area with packed and dense media made of fiber mats,
bonded glass fibers, synthetic fibers, cellulose fibers, wool felt, and other cotton-
polyester material blends without a large pressure drop. This type is more efficient than
the flat type. The HEPA filter is a filter with an extended surface consisting of sub-

7
micron glass fibers. Since this filter can remove suspended particles such as bacteria and
air born particles, it is more efficient than the two other types, but this filter provides a
good environment for microorganisms to live and multiply, and during the replacement in
most of the cases these particles go back into the air (Lam, 2007).
1.1.2.2 Ultraviolet germicidal irradiation (UVGI)
In this process, lamps and ozone generators are commonly used for elimination of
bacteria but this method is not efficient for airborne fungal and toxic chemicals
deactivation. Also UV-irradiation, in some cases, causes skin irritation. In addition,
ozone, which is produced during this process, causes respiratory diseases (Lam, 2007). In
this technology, low pressure mercury vapor UV lamps with 253.7 nm wavelength are
used. These lamps change microorganism’s DNA by destructing their cell structure;
therefore, it destroys the cells. UVGI lamps are located in the air duct of an HVAC
system downstream of the filter or cooling coil of upstream or even in a portable air
cleaner in the downstream of the filter. Based on the literature, efficiency of the UVGI
cleaners in killing microorganisms is different based on UV irradiation dosage. For most
of the microorganisms, including some viruses and most mold and bacterial spores, high
UV irradiation is required. Additionally, relative humidity, temperature, air velocity, and
duct reflectivity are other elements that affect the performance of this type of air cleaners.
1.1.2.3 Electronic air cleaner
Charged particles can be trapped in electrical fields. This type of air cleaner can be used
as a portable cleaner with fans or in heating or air conditioning systems. Common types
of air cleaners with this technology are electrostatic precipitators or charged-media filters

8
which have series of charged media which collect particles on the fibers. Ion generator air
cleaner does not have collecting plates, and produce ions using UV light. Ions stick into
the particles and give them charge to adhere into some surfaces such as walls, furniture,
etc. or even join the other charged particles to settle down. Although, this type is more
efficient in particle removal, it cannot remove gases or odors. On the other hand, as a
result of high voltage usage in this method, ozone is produced as a by-product, and its
concentration is increased in the environment which is risky to people’s health. In
addition, ozone can react with other environmental chemical compounds such as air
fresheners, deodorizers, certain paints, polishes, wood flooring, and carpets. Therefore, it
produces more harmful by-products such as formaldehyde, ketones, and organic acids
which, more adversely, affect people’s health (Menzies et al., 1999).
1.1.2.4 Solid sorbents
Solid sorbents like zeolites, activated aluminum, and specially activated carbon with
different packing density can be used for removal of gaseous pollutants especially VOCs
(Haghighat et al., 2008). However, performance of air cleaners based on these materials
depends on the physical, chemical, and concentration of the pollutants and sorbent, air
flow rate in sorbent bed, configuration and depth of sorbent bed in the device and also the
quantity of the sorbent and its porosity. Activated carbon is a popular sorbent for gaseous
pollutants especially hydrocarbons and non-polar gases, but it is not efficient for VOCs
with low molecular weight. Another sorbent for removing particular pollutants is
chemisorbing impregnated with active chemical materials. Impregnated activated
aluminum with potassium permanganate (KMnO4) has been used for low molecular
weight gases such as formaldehyde (Thad, 2001). Moreover, zeolites commonly are used

9
for indoor polar gases treatment such as benzene, n-hexane and formaldehyde (Chin et
al., 2006). Also, the lifetime of the sorbent and its capacity for removing pollutants is a
major problem in air cleaners design; also pollutants are just moved from one media to
another media which needs to be regenerated every so often.
1.1.2.5 Ozone generators
Ozone-generator air cleaners are based on capability of ozone for reaction with either
biological or chemical compounds. But ozone itself is an irritant compound and causes
asthma attacks, chest discomfort, and irritation of the nose, throat, and trachea; and
generally adversely affects humans’ health. Moreover, it can produce some harmful
compounds as a result of partial oxidation of chemicals; therefore, the EPA does not find
these air cleaners safe and effective (ASHRAE Handbook 2008).
1.1.2.6 Photocatalytic oxidation
In recent years, photocatalytic oxidation (PCO) and ultraviolet photocatalytic oxidation
(UV-PCO) has attracted great interest as new promising methods. The former method is
usable under visible light while the latter needs UV light. However, both of them need
verification to be used widely.
Although UV-PCO technology was first used for water treatment, its application in air
purification is more attractive than water treatment based on the following reasons (Ray,
2000): air purification needs lower UV- adsorption, prevention of reverse recombination
of electron/hole pairs and radicals as a result of higher mobility of reactants in the gas-
phase, presence of oxygen as an oxidant in an adequate amount in air, and lack of
bicarbonate and carbonate in the gas-phase.

10
Although there are some air cleaners with UV-PCO technology in the market; however,
still there are lots of unknown issues related to this technology such as the efficiency of
this type of air cleaners for one pass and for long time usage, knowledge about
operational parameters such as temperature, flow rate, etc., production of intermediates
and by-products and their toxicity, and relationship between intermediates production and
catalyst deactivation. Thus, more investigation is needed prior to the large scale
application of this technology.
1.2 RESEARCH OBJECTIVES
There are some challenges in applications of UV-PCO air cleaner in an industry, and
researchers are trying to overcome the limitations mentioned in previous paragraph. This
research focuses on this subject and the followings are the objectives of this study:
� Developing an experimental methodology for investigation of UV-PCO
performance and removal efficiency using one pass in the duct system for each
group of VOCs (including alkanes, ketones, alcohols, and aromatic) in an indoor
range concentration.
� Qualification and quantification of generated by-products for each VOCs group in
different range of concentration (including alkanes, ketones, alcohols, and
aromatic) during UV-PCO process.
� Impact of operational parameters such as light intensity, wavelength, humidity, air
flow rate etc. on the UV-PCO removal efficiency and quality and quantity of
generated by-products using ethanol as a target pollutant.
11
� Evaluation of UV-PCO performance and by-product generation in the presence
and absence of ozone (using VUV and UVC lamps).
1.3 THESIS OUTLINE AND PUBLICATIONS
The rest of this work is organized as follows:
Chapter 2 explains the fundamentals of UV-PCO technology and provides critical
reviews of previous studies on VOCs mineralization using UV-PCO technology;
characteristics and removal performance of this technology along with generated by-
products and effect of operational parameters. Chapter 3 describes the experimental set-
up and methodology. Moreover, details of set-up design, experimental procedure, target
pollutants, chemical generation system, sampling, and analysis instruments are provided
in this chapter. Chapter 4 illustrates and discusses the experimental results stemming
from this research. Chapter 5 provides the conclusion of this study and recommendations
for future work.
The results of this research have been published/submitted to the following
conferences/journals:
� Farhanian, D., Haghighat, F., Lee, C.S., Zhong, L., Lakdawala, N., “Investigation of Ultraviolet Photocatalytic Oxidation by-Products”, Accepted in ASHRAE Cold Climate HVAC Conference, 2012.
� Lee, C.S., Zhong, L., Farhanian, D., Flaherty, Ch., Haghighat, F., “Development of a parallel test system for the evaluation of UV-PCO systems”, Accepted in ASHRAE Cold Climate HVAC Conference, 2012.
� Farhanian, D., Haghighat, F., “Ultraviolet Photocatalytic Oxidation Performance Using UVC and VUV lamps” Submitted to CLIMA 2013 International Conference, 2012.
� Farhanian, D., Haghighat, F., Lee, C.S., Lakdawala, N., "Performance of Ultraviolet Photocatalytic Oxidation Air Cleaner: Parametric Study", to be submitted to the International Journal of Atmospheric Environment.

12
CHAPTER 2 LITERATURE REVIEW
2.1 INTRODUCTION
PCO is one of the benign environmental processes and it is claimed as decisively cost
effective technology. This technology is a subdivision of Advanced Oxidation Process
(AOP). There are some processes which are similar to PCO such as UV photolysis, UV
photo-oxidation in presence of oxidants such as ozone, hydrogen peroxide and hydroxyl
radicals (Ray, 2000). Some physical-chemical and biotechnological methods have been
used for removal of VOCs before UV-PCO technology but some of their limitations and
handicaps made them hardly usable. Although this process is new but at least 400 papers,
reports, and patents are published annually in this field which illustrates its importance
and applicability. Numerous studies were done in UV-PCO; however, most of them are
in part-per-million (ppm) ranges not sub-ppm or part-per-billion (ppb) levels which are
applicable for indoor environments (Wang et al., 2007).
Photocatalytic oxidation has a great potential for degradation of organic compounds and
bio-aerosols (i.e., bacteria and viruses) (Chin et al., 2006; Frazer, 2001). PCO is used in a
large number of studies for water treatment while its application in air purification is
new.
2.2 PHOTOLYSIS
Photo-dissociation, photolysis, or photodecomposition is a chemical reaction of some
chemical compounds, in this case VOCs. Photolysis occurs when VOCs are exposed to
UV-light irradiation and produce some intermediate.

13
Also, photolysis can take place for decomposition of inorganic material for instance
ozone and nitrogen. Photolysis classified as direct UV photolysis and sensitized
photolysis (Ray, 2000).
2.2.1 Direct UV Photolysis
Direct photooxidation occurs in the presence of photons while there is no photocatalyst in
the system. Photolysis was investigated for several VOCs such as alkenes group
including TCE, PCE (Bhowmick and Semmens, 1994; Yung-Shuen and Young, 1998)
and aromatics such as benzene, toluene, xylene (Wekhof, 1991). Photolysis of aromatic
compounds increases by having either greater molecule size or alkyl groups. For the
majority of VOCs except trichloroethylene (TCE) and tetrachloroethylene (TeCE) direct
photolysis is very small in comparison with the case where they are exposed to a
photocatalyst. For TCE and TeCE direct photolysis under 254 nm wavelengths led to
higher degradation similar to that in the exposure of photocatalyst, but under black light
lamp direct photolysis is less than catalyst exposure; this is due to ozone existence in the
254 nm system (Alberici and Jardim, 1997). For direct photolysis 4 eV to 7 eV or 175 nm
to 300 nm radiation are necessary and this process mathematically expressed by the
following equation (Ray, 2000):
Equation 2-1
where:
cA = concentration of the organics (ppb).

14
Φ = quantum yield of the reaction.
Im= average number of Einsteins absorbed by the absorbing species per unit volume and
unit time (Einstein is one mole equal to Avogadro’s number of photons and λ is the
wavelength of the light)
2.2.2 Sensitized Photolysis
This type of photolysis is based on the energy transfer of photochemically excited
molecule to an acceptor from. The acceptor can be oxygen or a transient reactive form of
it, like single oxygen atoms. Degradation rate for sensitized photolysis can be expressed
as Equation 2-2 (Ray, 2000).
Rate = k [A] Equation 2-2
where k is a constant containing the concentration of the sensitizer and the light
absorption rate, likewise triplet energy transfer terms and triplet quantum yield (in a
sensitized reaction, triplet is a common excited state). [A] is the concentration of the
acceptor. In this process if during the experiment the concentration of the sensitizer
changes, the expression of reaction rate becomes much more complex.
2.3 PHOTOCHEMICAL OXIDATION WITH OZONE
Ozone is an unstable tri-atomic molecule form of oxygen. Therefore, it reacts with other
compounds in the environment. It usually breaks down to an oxygen molecule (O2) and
highly reactive single oxygen (O1) atom.
Three common ozone production methods include:

15
1. Hot spark
2. Ultraviolet light
3. Cold plasma
The second method is more applicable for photochemical reaction purification for indoor
air, since it utilizes Ultraviolet germicidal lamps. Ozone, itself, is one of the most risky
by-products and WHO (World Health Organization) recommends that the level of ozone
concentration in indoor environment should be as low as 0.05 ppmv. Ozone causes the
following reactions (Pengyi et al., 2003):
Ozone is one of the species which increases VOCs degradation and is observed during n-
octane photo oxidation (Wang et al., 2007), and toluene mineralization (Pengyi et al.,
2003). Zhang and his colleagues (2003) observed that ozone plays a prohibitory role for
catalyst deactivation and by adding ozone to toluene, conversion rate increases. When
concentration of toluene increases from 5 ppmv to 20 ppmv, conversion decreases in the
following order for different systems: O3/TiO2/UV > O3/UV > TiO2/UV. In O3/UV
process, conversion decreases linearly in this concentration range. The presence of TiO2
catalyst accelerates the reaction; however, in the TiO2/UV system, conversion rapidly
dropped due to catalyst deactivation (Pengyi et al., 2003).

16
In a comparison between 254 nm germicidal lamps and 365 nm black light lamps, during
toluene photodegradation, it was found that in 254 nm wavelengths, in all 3 systems of
O3/UV, TiO2/UV, and O3/TiO2/UV toluene conversion is higher. This significant
difference is due to two reasons: first, difference in irradiation intensity which is 58 w/m2
for 254 nm, while it is 30 w/m2 for 365 nm wavelengths; which causes more photon
excitation. Second, ozone decomposition in 254 nm UV-lamp is more efficient than 365
nm UV-lamp; subsequently more hydroxyl radicals are produced as a result of ozone
decomposition (Pengyi et al., 2003). In O3/TiO2/UV process, either less hazardous
compounds or lower residual ozone is detectable. Ozone consumption in this process is
due to the following reactions: first, ozone either as a hydroxyl radical scavenger or
electron acceptor, and second ozone decomposition by UV-light. Ozone can react with
OH radicals and consume them according to the following reactions (Buckley and Birks,
1995).
Shen and Ku (2002) during TCE photo-degradation observed this phenomenon too. They
reported that ozone existence decreases removal efficiency, because it reacts with
hydroxyl radicals and causes less conversion in O3/TiO2/UV system in comparison with
the sum of TiO2/UV and O3/UV systems. They found that ozone in chlorinated
compounds undergo according to the following reactions:

17
Cl radicals increase the rate of degradation by inducing chain reactions. Single oxygen,
which is an important oxidant atom, is produced as a result of ozone photolysis according
to the following reactions (Buckley and Birks, 1995).
O3 + hν (< 310 nm) O (1D) + O2
And, if it reacts with water molecules in the air, two hydroxyl radicals are formed.
O (1D) + H2O 2OH
There is always a competition between O (1D) and Cl radicals in chlorinated systems
(Ray, 2000).
Ozone residue also can be affected by relative humidity and flow rate. Relative humidity
is related to water vapor content in the system and therefore ozone consumption is linked
with it. Flow rate causes dilution or concentration of ozone molecules, therefore, ozone
retention time in the system changes. One of the problems of using germicidal UV-lamps
which produce ozone is that in the O3/TiO2/UV system, there is always some residual
ozone, and since ozone is a harmful compound for health, this compound should not exist
in high concentration in indoor areas.
2.4 PHOTOCATALYTIC OXIDATION (PCO)
In the early 1970’s, during water cleavage on TiO2 electrodes, photocatalytic oxidation
was discovered by Fujishima and Honda. This method was used first in 1977 for water
treatment by Frank and Allen’s research (1977) in cyanide decomposition in an aqueous
TiO2 suspension. However, since the suspended catalyst (TiO2 in this case) should be
filtered, immobilized TiO2 catalyst was developed. Considering the ability of this

18
technology for removal of the organic pollutants, a new application for this method in air
purification has gained interest (Waki et al., 1995). Dibble and Raupp (1992) are the first
researchers who applied PCO for air purification and they did some experiments in TCE
as a first VOC which was remediated by this process.
In the photocatalytic oxidation method, as the name implies, photon, catalysts and also
an oxidant component are involved. This method works in existence of heterogeneous
catalyst, UV-light or even, in some cases, visible light. From the molecular point of view,
PCO mechanisms are explained based on the band gap model. In this model, electrons
from valance band (VB) are transferred into the conduction band (CB) via irradiation of
UV-light. VB is introduced as the highest energy band occupied by electrons and CB is
defined as the band without electrons and hence the lowest energy (Xu and Schoonen,
2000). VB/CB band prepare electron/hole pairs, which may precede redox (reduction/
oxidation) reactions if they have enough potential; if VB holes and CB electrons have
more positive potential than adsorbed compound and more negative potential than
adsorbents respectively. Otherwise, recombination of electron/hole pairs occur and
thereupon thermal or light energy is released (Demeestere et al., 2007). The number of
electron/hole pairs is related to the intensity of the UV-lamps and VOCs electronic
properties (Ray, 2000). As mentioned before, VB/CB potential plays a basic role in
progress of redox (reduction and oxidation) reaction, considering 3.2 eV energy band
gap, near ultraviolet (UV) photons with λ ≤ 388 nm necessary for the promotion of the
electrons and electron/hole pairs regeneration (Demeestere et al., 2007). Charge
separation causes oxidation of both organic and water molecules and reduction of oxygen
molecules which lead to redox reactions (Demeestere et al., 2007). Water molecules

19
which exist in the air produce some oxidizing agents which are called reactive oxygen
species such as oxygen (O2), peroxide (O2-2), superoxide (O2
-), and hydroxide (OH-)
(Waki et al., 1995). In this process, electrons enter water and change it to hydroxyl
radicals which can cause decomposition of organic materials. When electrons are
transferred into water, electrons from pollutants can fill the empty place, then, oxygen
molecules give their electrons to these holes producing O+ ions. UV or visible light
provides required energy for electron movement. The main products in PCO process are
CO2 and water. Moreover, HCl in the chlorinated VOCs and sulfate in sulfurous VOCs
are formed in complete mineralization. However, as a result of partial oxidation, some
intermediate and by-products are formed. UV-PCO research areas include different
conditions of pollutants such as gas-phase concentrations of both ppbv and ppmv levels,
oxygen content between 0% and 100%, light intensities from 0.1 mW/cm2 to 4300
W/cm2, diversity in reactor configurations, relative humidity between 0% and 100%,
temperatures ranged from 5 0C to 400 0C and different types of catalysts which result
removal efficiencies between 1% to 99%. This differences cause inconceivable
comparison (Demeestere et al., 2007).
2.4.1 Photocatalytic Oxidation Mechanism
The PCO gas-solid phase mechanism from the mass transfer point of view on the porous
heterogeneous photocatalyst can be explained by Figure 2-1 (Fogler, 2006). The mass
transfer mechanism is consisted of the following steps:
1. Advection.

20
2. Diffusion of the reactant(s) (e.g., species A) from the bulk of the fluid into the
catalyst external surface.
3. Diffusion of the reactant(s) from the external surface of the catalyst to vicinity of
the internal catalyst surface.
4. Adsorption of the reactant(s) into the internal catalyst surface and its porosity and
settling into the active sites.
5. Reaction of reactants with oxygen and hydroxyl molecules on the catalyst active
sites (A B).
6. Diffusion of the products from the catalyst interior surface (porosities) into the
external surface.
7. Diffusion of the products from the external surface of the catalyst into the fluid
bulk.
On the other hand, PCO process includes the following reactions (Zhong et al., 2010):
Figure 2-1 Mass transfer mechanism in UV-PCO process ( Fogler, 2006).

21
Based on Bickley and Jayanty’s research (1974) TiO2 has more Ti+3 sites which are
responsible for hole-traps and cause adsorption of more oxygen molecule and therefore
production of O2-. Since electrons and holes recombined in this method, it causes
inefficiency and waste of photons' energy, which is a limiting factor in the PCO process,
and every effort which decreases recombination of holes and electrons increases PCO
efficiency (Hugo et al., 2005). Electrons participate in the reaction with any type of
halogenated organic compound present in air and produce another type of radicals for
redox reaction. However, oxygen molecules are the best scavenger for electrons and other
type of radicals kinetically cannot compete with hydroxyl radicals. On the other hand,
reduction reaction has more important role compared to oxidation (Demeestere et al.,
2007). During photo-degradation charge transfer occurs in adsorbed species and
photocatalyst surface (Wang et al., 2007). Degradation is a combination of adsorption
Figure 2-2 Photocatalytic oxidation molecular process (Zhong et al., 2010).

22
and desorption parameters, but a lower adsorption constant does not always mean lower
degradation. For example, TCE has a lower adsorption constant but is more degradable
than toluene (Bouzaza et al., 2006).
2.4.2 Photocatalytic Oxidation Advantages
The PCO method has several advantages. For example (Bellu et al., 2007):
� There is no consumption of expensive oxidizing chemicals; the oxidant is
atmospheric oxygen and the catalyst is non-hazardous.
� The photo catalytic reaction may be driven by the natural UV component of
sunlight.
� No chemical additives, such as auxiliary fuel, are required.
� There is a high quantum yield for gas phase reactants (low-intensity UV lamps).
� The catalyst is inexpensive (titanium dioxide).
� PCO is applicable to a large number of organics.
� PCO is effective for low concentrations of pollutants.
� This method works in humid conditions.
� Catalyst activity is not destroyed by chlorinated organic.
� Low maintenance is required and it has long service life.
� Gaseous pollutants are destroyed instead of transferring them to another media.

23
� PCO has minimum pressure drop in the system.
� This process consumes low power and subsequently it is cost effective.
2.4.3 Photocatalytic Oxidation Disadvantages
Photocatalytic oxidation method also has some disadvantages which are as follows:
� Production of some hazardous intermediates and by-products.
� Catalyst deactivation.
2.5 CATALYST
In 1921 the first report regarding photoactivity of some compounds was published.
Gravelle and his colleagues (1971) were pioneers in gas-solid heterogeneous
photocatalysis applications. Some of the most common photocatalysts include TiO2,
ZnO, ZrO2, SnO2, WO3, CeO2, Fe2O3, Al2O3, ZnS and CdS (Hoffmann et al., 1995).
Catalyst has a critical role in pollutant destruction and removal efficiency of VOCs in
PCO process highly depends on it. Thus, amount of catalyst should be sized up based on
the amount of pollutants entering the photo-reactor. Since the input air volume to the
reactor is high, catalyst activity should be high enough to mineralize pollutants; therefore,
in most cases even small amounts of catalyst with high activity is enough for large
volume of polluted air. High activity of catalyst leads to better electron/hole pair
generation and it is not necessary to provide more UV-light, consequently decreasing the
cost of the process.

24
In the literature, TiO2 and ZnO are the foremost among photocatalysts for PCO process.
The surfaces of these two catalysts are hydrophilic and highly covered by water
molecules existing in the air (Peral and Ollis, 1997) and they have the following
favorable conditions compared to other catalysts (Zou et al., 2006):
1. Photo active near UV illumination and able to utilize visible and/or near-UV light.
2. Biologically and chemically inert and chemically stable.
3. Photo stable (i.e. not liable to photo corrosion).
TiO2 exists in three forms in nature: rutile, anatase and brookite. The most common form
for reaction as a catalyst is anatase, and also its combination with rutile. Commercial
form of TiO2 is Degussa P25 which is provided by flame pyrolysis and is used widely for
air purification. This type of catalyst has 70% anatase and 30% rutile and particle size of
300 nm with 50 m2g-1 surface area (Mo et al., 2009). Catalyst composition and structure
immensely affect its performance. The most important parameters which affect catalyst
activity are its surface area, porosity, pore size and amount of active sites in the surface of
the catalyst (Kittrell et al., 2006).
Figure 2-3 Structures of rutile and anatase types of TiO2 (Linsebigler et al., 1995).

25
TiO2 catalyst shows selectivity to some VOCs and this is one of the challenges in PCO
application in a mixture of VOCs. For instance, it has poor reactivity to acetone and
toluene compared to TCE (Avila et al., 1998; Hager and Bauer, 1999).
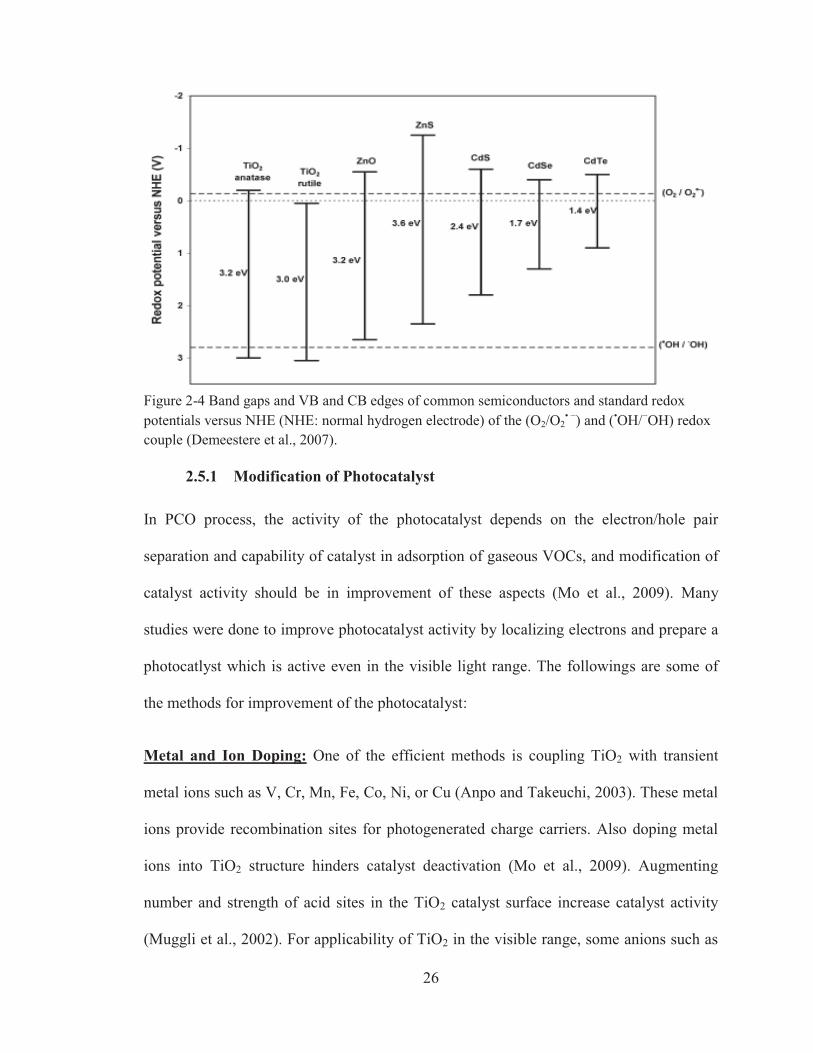
As it can be seen in Figure 2-4, both anatase and rutile TiO2 crystalline phase have more
positive potential than other catalysts for hydroxyl radicals which can carry out redox
reaction. Since negative potential of rutile is lower than O2/O2•−, compared to anatase,
converting oxygen to superoxide radicals is performed by anatase CB electrons and not
by rutile CB electrons. In most cases, combination of these two crystalline phases is used
to increase catalyst activity. Accordingly, TiO2 Degussa P25, consisting of 70% –80% of
anatase and 20% –30% of rutile, is an applicable photo catalyst (Bhatkhande et al., 2002;
Sattler and Liljestrand, 2003). On the other hand, the negative potential of the anatase
crystalline phase is close to (O2/O2•−). Therefore, combining percentages of other catalyst
such as ZnO and ZnS can improve catalyst negative potential (Demeestere et al., 2007).
ZnO is one of the photocatalysts that has almost the same band gap energy as TiO2, but it
is not stable and can be deactivated by converting to the Zn(OH)2 on the surface of the
catalyst during OH radical attendance in the environment. In some cases the combination
of TiO2 and ZnO is used as a photocatalyst. Some of the other photocatalysts are not
applicable because of photoanodic or photocathodic corrosion such as metal sulfide and
iron oxide polymorphs. Another problem which is associated with using other catalyst is
the lower surface potential (Lam, 2007).
26
Figure 2-4 Band gaps and VB and CB edges of common semiconductors and standard redox potentials versus NHE (NHE: normal hydrogen electrode) of the (O2/O2
• −) and (•OH/−OH) redox couple (Demeestere et al., 2007).
2.5.1 Modification of Photocatalyst
In PCO process, the activity of the photocatalyst depends on the electron/hole pair
separation and capability of catalyst in adsorption of gaseous VOCs, and modification of
catalyst activity should be in improvement of these aspects (Mo et al., 2009). Many
studies were done to improve photocatalyst activity by localizing electrons and prepare a
photocatlyst which is active even in the visible light range. The followings are some of
the methods for improvement of the photocatalyst:
Metal and Ion Doping: One of the efficient methods is coupling TiO2 with transient
metal ions such as V, Cr, Mn, Fe, Co, Ni, or Cu (Anpo and Takeuchi, 2003). These metal
ions provide recombination sites for photogenerated charge carriers. Also doping metal
ions into TiO2 structure hinders catalyst deactivation (Mo et al., 2009). Augmenting
number and strength of acid sites in the TiO2 catalyst surface increase catalyst activity
(Muggli et al., 2002). For applicability of TiO2 in the visible range, some anions such as

27
N3−, C4−, S4− or halides such as F−, Cl−, Br−, and I− are doped into TiO2 structure to
narrow band gap (Belver et al., 2006a). Unfortunately, there is not enough research for
investigation of N doped TiO2 catalysts in indoor pollutant levels and most of the studies
are in ppm range (Wang et al., 2007). Li et al. (2005) have mentioned that if lanthanide
ions such as La3+, Eu3+, Pr3+, Nd3+, and Sm3+ are incorporated into the TiO2 matrix, they
can promote chemical and physical adsorption ability of catalyst for organic compounds.
Photosensitized Oxidation: In this process electron is injected from the excited dye
molecules onto the TiO2 conduction band. The dye is converted to the cationic dye
radicals (Dye•+) and it can react with hydroxyl ions in the reaction environment (Lam,
2007).
Metal Ion Implantation: Implantation of metal ions into the TiO2 structure can be done
by injecting the ion beam into the catalyst sample. There are low/middle/high
acceleration energies for doping ions during interaction with the catalyst surface; low:
0.2-2 keV which causes formation of thin film on the top surface of the sample by
deposition of metal ions, middle: 5-30 keV which embeds metal ions to the surface atoms

28
of the catalyst samples, high: 50-200 keV which leads to deep bulk implementation of
metal ions by bombarding them into the catalyst (Yamashita and Anpo, 2004).
Figure 2-5 Schematic diagrams of the beam techniques (Yamashita and Anpo, 2004).
2.5.2 Catalyst Deactivation and Regeneration
Catalyst deactivation is a process in which the activity of the catalyst decreases, and it is
classified as the following (Fogler, 2006):
Deactivation by sintering (sintering or aging): this type of deactivation is due to loss
of active sites in the surface. This happens at very high temperature or irradiation, and
may occur either by crystal agglomeration and growth of the metals deposited on the
support of the catalyst or by narrowing or closing the pores inside the catalyst pellet.
Deactivation by poisoning: When some poisoning molecules chemisorbed in the
catalyst surface irreversibly, the number of active sites decreases. Therefore, fewer
compounds can react to produce the main product and in some cases impure products are
formed. This process causes catalyst deactivation and is called poisoning deactivation.

29
Figure 2-6 Catalyst deactivation: a) Sintering b) Fouling or coking c) Poisoning.
Deactivation by coking or fouling: This deactivation is due to the production of carbon
compounds such as hydrocarbons, CO2, and CO in the catalyst surface. In this process
pores are blocked.
It has been reported that catalyst deactivation in PCO process is due to reduction of
catalyst active sites and this phenomenon happens as a result of the following reasons
(Mo et al., 2009): Formation of intermediates or by-products which blocks the active sites
which is observed during mineralization of toluene and dimethylsulfide, and
trichloropropene; photopolymerization of some species especially due to the lack of
water such as benzene; mineralization of the substrate with a well-fixed species including
nitrogen and sulphur; oxidation and accumulation of inorganic compounds such as N and
S in the surface and blocking pores as a result of fouling.
For treatment of the deactivated catalyst several methods were tested: First, changing the
structure of the catalyst and combining it with other compounds to avoid or even hinder
the catalyst deactivation. For instance, some work was done to speed up poisonous
intermediates removal from the TiO2 catalyst. One method is loading platinum on the
TiO2 structure which is tested in toluene photodegradation. However, in this method, a
lower oxidation rate is achieved (Wang et al., 2007). The second method is injection of

30
some chemicals onto the catalyst surface such as injection of a vaporized H2O2 solution
(Piera et al., 2002), using chlorine radicals (d'Hennezel et al., 1998; Blount and Falconer,
2002) or ozone-purging with water vapor (Wang et al., 2003). The third technique is
thermal method for burning and oxidizing surface species and removing them from the
catalyst surface. The final method is performed by irradiation of UV-light into the
catalyst surface for complete photocatalytic oxidation of surface species.
2.6 UV-LIGHT LAMPS
UV-light is a component of a UV-PCO system, and different types of UV- lamps based
on their wavelengths were used. Since in PCO method catalysts must produce electrons
for the reactions, electrons from valance band have to be excited. This is done by
irradiation from light source into catalyst surface. The electromagnetic spectrum of
ultraviolet light can be subdivided into different bands which are described in Table 2-1.
Table 2-1 ISO standard on determining solar irradiances (ISO-DIS-21348).
Name Abbreviation Wavelength range (nanometers)
Energy per photon
Ultraviolet A, long wave, or black light UVA 400 nm – 315 nm 3.10 – 3.94 eV Near NUV 400 nm – 300 nm 3.10 – 4.13 eV Ultraviolet B or medium wave UVB 315 nm – 280 nm 3.94 – 4.43 eV Middle MUV 300 nm – 200 nm 4.13 – 6.20 eV Ultraviolet C, short wave, or germicidal UVC 280 nm – 100 nm 4.43 – 12.4 eV Far FUV 200 nm – 122 nm 6.20 – 10.2 eV
For emission of UVA spectrum, black light (or “BL”) and black light blue (or “BLB”)
lamps are designed. Ozone is produced at 185 nm wavelength and in these types of lamps
light below 240 nm does not pass through the glass; therefore, no ozone molecules are
produced (Hoffmann et al., 1995). 320 nm – 400 nm UV-light wavelength ranges are
sufficient for electron promotion and catalyst activation. However, the best UV-light for
UV-PCO process is 254 nm + 185 nm radiations, since in this range of irradiation, more
31
reactive species as a result of ozone existence were formed in the system, and due to
photochemical oxidation and photocatalytic oxidation on the TiO2 catalyst, higher
efficiency rate for VOCs was observed (Jeong et al., 2004). Typical UV-lamps include
low and medium pressure mercury lamps with 254 nm output and less (<15%) 185 nm
emission. New Xenon plasma flash lamps which have wavelengths < 250 nm are suitable
for photolysis compared to the other types of lamps. Another technology in light source is
argon ion laser with 330 nm and 360 nm emissions (Nimlos et al., 1993). The other UV
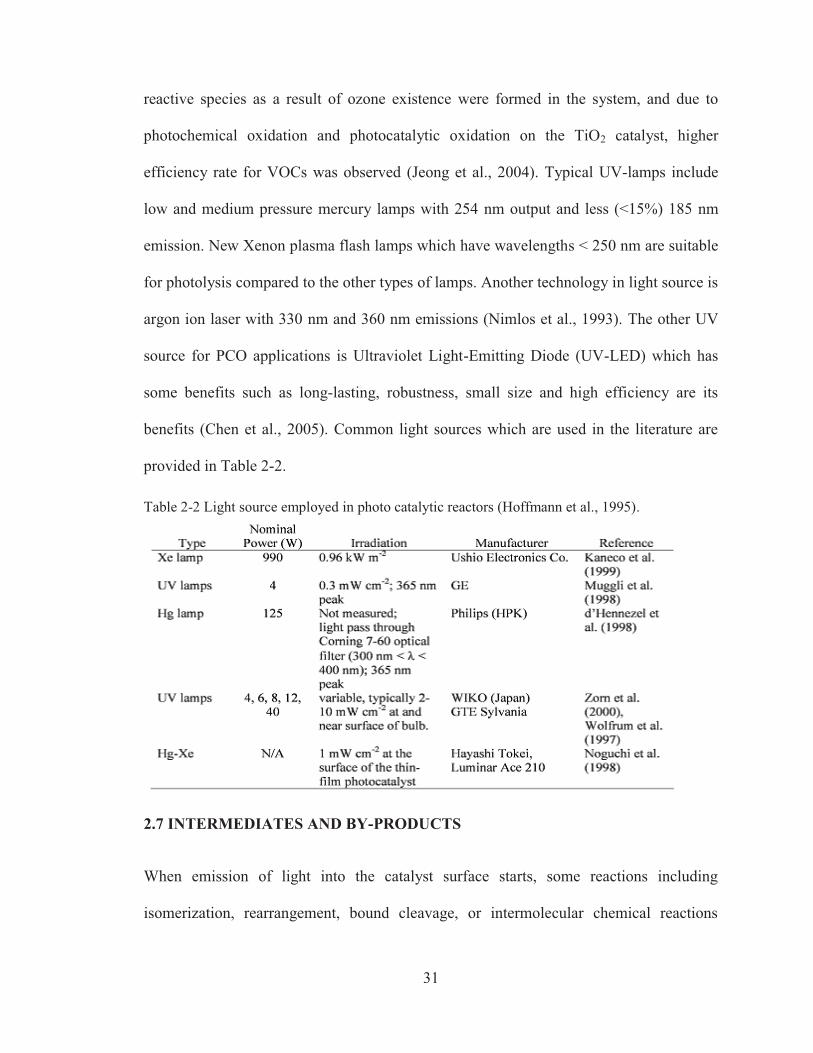
source for PCO applications is Ultraviolet Light-Emitting Diode (UV-LED) which has
some benefits such as long-lasting, robustness, small size and high efficiency are its
benefits (Chen et al., 2005). Common light sources which are used in the literature are
provided in Table 2-2.
Table 2-2 Light source employed in photo catalytic reactors (Hoffmann et al., 1995).
2.7 INTERMEDIATES AND BY-PRODUCTS
When emission of light into the catalyst surface starts, some reactions including
isomerization, rearrangement, bound cleavage, or intermolecular chemical reactions

32
occur. Therefore, in addition to CO2 and H2O as the main products, some by-products are
formed. By-products or intermediates are produced during partial oxidization of
compounds which can settle on the catalyst surface or present in the gas phase.
Generation of by-products is one of the challenges in full scale usage of PCO due to the
possibility of some more toxic VOCs generation as compared to the parent compounds.
For instance, during mineralization of TCE and PCE some by-products such as
dichloroacetyl chloride (DCAC), tricholoroacetaldehyde, and trichloroacetic acids are
formed while the DCAC toxicity is 40 times higher than TCE (Ray, 2000). DCAC also
can be hydrolyzed under water vapor existence to form dichloroacetic acid (DCAA)
based on the following reactions (Hung and Marifas, 1997; Bhowmick and Semmens,
1994):
Although some of the reports asserted no intermediate detection in concentration up to 80
ppmv, other researchers identified numerous intermediate formations (Cao et al., 2000;
Einaga et al., 2001; Ao and Lee, 2003). In some cases, production of intermediates causes
the delay in estimated half-life, and this is due to competition between intermediates and
initial compounds for finding active sites and reaction (Chang et al., 2003).
Most common intermediates due to organic compounds photo-degradation in the
atmosphere are carbonyl compounds, especially different forms of aldehyde which are
highly toxic. As a result of photo-oxidation of these compounds, secondary compounds
such as peroyacylnitrates are formed which have more toxicity than parent compounds
(Carlier and Mouvier, 1986). In most papers it is mentioned that more intermediates were

33
formed under the germicidal lamp source compared to the black-light source (Mo et al.,
2009). Oxidation process in PCO is due to either addition of the oxidant into the chemical
structure or substitution. In the first case, some compounds such as chlorine or ozone are
added in the double bound of olefin and in the second case some oxidizer atoms such as
hydroxyl radicals replace some atoms in the compound (Ray, 2000). In some cases
production of heavier VOCs compared to the parent compounds were observed. Hung
and Marifas (1997) observed production of VOCs with higher molecular weights during
photodegradation of some reactants such as hexa-chloroethane, penta- chloroethane,
1,1,2,2-tetrachloroethane. Photocatalytic oxidation of epoxide can form epoxy carbonyls
during PCO process which can react with ozone and hydroxyl radicals to form smaller
molecules (Ray, 2000).
During acetone photo-memorization at conversion of 5-20% of acetone no intermediates
are formed (Chang et al., 2003), while Xu and Raftery (2001) observed surface
intermediates such as diacetone alcohol, mesityl oxide, formic acid, propylene oxide and
acetic acid using solid-state in situ solid-state nuclear magnetic resonance spectroscope.
Jacoby et al. (1996) worked on benzene photodegredation, and they identified phenol,
hydroquinone and/or benzoquinone, and malonic acids as possible intermediates.
2.8 OPERATIONAL PARAMETERS AFFECTING PCO PROCESS
2.8.1 Humidity
Relative humidity (RH) plays a twofold role in the PCO process. In some cases, it
decreases degradation, and in other cases increases mineralization. The RH effect
depends on water vapor concentration, and affects VOCs mineralization either based on

34
water concentration or the type of VOCs and their amount which participates in the
reaction. RH provides hydroxyl radicals to expedite degradation and specific amount of it
is necessary for providing required hydroxyl radicals. Therefore, in some cases
researchers have reported that increasing RH causes high elimination of VOCs. When
amounts of hydroxyl radicals increase more than the required amount; the degradation
rate decreases due to competition between water vapors with other VOCs for catching
active sites. Moreover, when saturation occurs in the reaction environment, none of the
water molecules abandon their places (Wang et al., 1999; Demeestere et al., 2007).
Hydroxyl radicals also play a basic role in distribution of intermediates and progress of
side reactions. Besides, it is important in catalysts lifetime. For example, Dibble and
Raupp (1992) asserted water vapor necessity for long term activity of the catalyst during
trichloroethene degradation while Hager and Bauer (1999) and Hegedüs and Dombi
(2004a) observed no catalyst deactivation of tri- and tetrachloroethene in dry air
conditions.
In high RH, water vapor adsorbs on the catalyst surface to enhance partial oxidized
compound degradation and does not allow parent VOCs to oxidize due to competition
between pollutants and water vapor for catching catalyst active sites. This process is
desired, since it regenerates the catalyst. On the other hand, this process decreases parent
VOCs degradation and hence removal efficiency. Some observations confirm this idea
and some of them are in contrast with it. For example, Vorontsov and his coworkers
(2001, 2003a) asserted mineralization of 2-phenethyl-2-chloroethylminerization is higher
at RH = 38% than at RH = 1.4%. Also, they observed different compounds during
degradation of diethyl sulfide at RH ≥ 13% compared to RH =2%, less CO2 is produced

35
and catalyst is deactivated faster. Despite these different observations, explanation of less
catalyst deactivation at low RH is possible since when RH is low, lower amounts of •OH
are produced and consequently smaller amounts of VOCs are degraded. Therefore, less
carbon or other materials accumulate on the catalyst surface to deactivate it.
Amama et al. (2004) found out that the optimum relative humidity for TCE and methanol
photodegradation is 25%. In acetone degradation, when water vapor is increased from
18.7 mM to 417 mM, acetone degradation is increased too, while any further increases in
water vapor decrease the oxidation rate. If relative humidity increases from 0% to 60%, a
tenfold increase in CO2 and a fourfold increase in benzaldehyde production are observed
during toluene (80 ppm) photodegradation (Larson and Falconer, 1997).
2.8.2 Oxygen Content
The oxygen compound is one of the necessities for the PCO reaction and without oxygen,
PCO reaction does not happen. It accepts electrons and promotes the oxidation part
(Chang et al., 2003). Teichner et al. (1985) reported O2- and O- surface species as a result
of TiO2 illumination and afterwards O3- was found.
In acetone photo-degradation an increase of oxygen content from 0% to 5% increases
conversion from 20% to 70%. On the other hand, the reaction constant increases with the
increase of oxygen from 0% to 20%. Existence of oxygen molecules decreases the chance
of electron/hole pair recombination by catching electrons and forming O2– (Chang et al.,
2003).

36
It was observed that during TCE photodegradation, increasing oxygen concentration
more than 10,000 ppmv did not affect photo-degradation compared to the water vapor.
Since adsorption sites for these molecules and their radicals are different, thus, despite
the increase in water vapor, oxygen molecules neither decrease nor increase the
photodegradation rate. Figure 2-7 represents water and oxygen molecules in the catalyst
active sites during TCE mineralization (Ma and Ku, 2006; Kim et al., 2002; Hung and
Marifas, 1997).
Figure 2-7 Water and oxygen molecules adsorb at different active sites (Ma and Ku, 2006).
2.8.3 Temperature
The PCO process is done in an indoor temperature. However, generally, altering the
temperature affects VOCs adsorption–desorption and even chemical conversion
(Demeestere et al., 2007). Adsorption is an exothermic process while desorption is an
endothermic process and UV-PCO reaction also can be exothermic or endothermic which
depends on the VOC type. Therefore, increasing or decreasing the temperature has
different influences on the removal efficiency (Doucet et al., 2006). Also, the temperature
affects the product distribution by changing adsorption–desorption equilibrium and also
the rate of product formation (Demeestere et al., 2007). Kim et al. (2002) reported that
VOCs adsorption might be rate limiting at high temperatures while products desorption
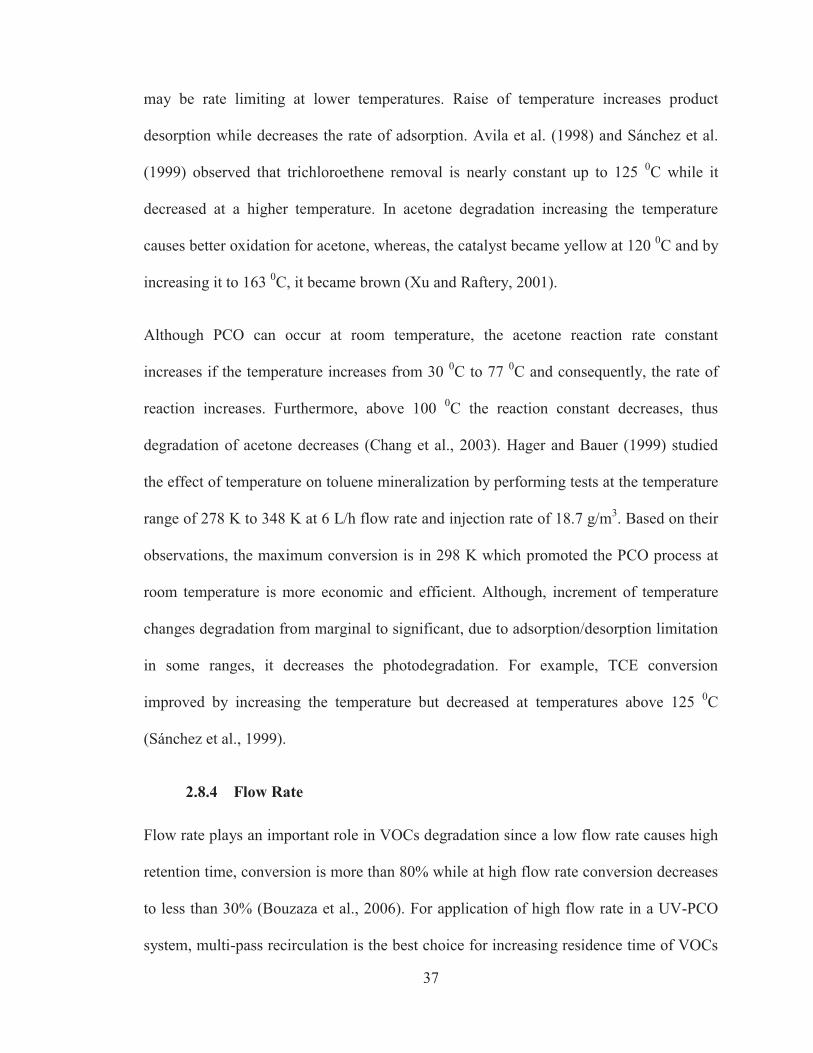
37
may be rate limiting at lower temperatures. Raise of temperature increases product
desorption while decreases the rate of adsorption. Avila et al. (1998) and Sánchez et al.
(1999) observed that trichloroethene removal is nearly constant up to 125 0C while it
decreased at a higher temperature. In acetone degradation increasing the temperature
causes better oxidation for acetone, whereas, the catalyst became yellow at 120 0C and by
increasing it to 163 0C, it became brown (Xu and Raftery, 2001).
Although PCO can occur at room temperature, the acetone reaction rate constant
increases if the temperature increases from 30 0C to 77 0C and consequently, the rate of
reaction increases. Furthermore, above 100 0C the reaction constant decreases, thus
degradation of acetone decreases (Chang et al., 2003). Hager and Bauer (1999) studied
the effect of temperature on toluene mineralization by performing tests at the temperature
range of 278 K to 348 K at 6 L/h flow rate and injection rate of 18.7 g/m3. Based on their
observations, the maximum conversion is in 298 K which promoted the PCO process at
room temperature is more economic and efficient. Although, increment of temperature
changes degradation from marginal to significant, due to adsorption/desorption limitation
in some ranges, it decreases the photodegradation. For example, TCE conversion
improved by increasing the temperature but decreased at temperatures above 125 0C
(Sánchez et al., 1999).
2.8.4 Flow Rate
Flow rate plays an important role in VOCs degradation since a low flow rate causes high
retention time, conversion is more than 80% while at high flow rate conversion decreases
to less than 30% (Bouzaza et al., 2006). For application of high flow rate in a UV-PCO
system, multi-pass recirculation is the best choice for increasing residence time of VOCs

38
in the system. At low flow rate, VOC removal efficiency increases but kinetic parameters
do not change while in a very high flow rate, since the retention time is very short,
reaction is not complete. A moderate flow rate did not show any changes in the
degradation (Demeestere et al., 2007)
2.8.5 Light Intensity
Since photons cause electron excitation and then redox reaction, light intensity is a
substantial issue in PCO process. Electron/hole pair generation or recombination is
directly related to light intensity and light wavelength. Light intensity affects removal
efficiency in two ways (Demeestere et al., 2007):
a) First order regime: in this process electron/hole pairs consumption is faster than
their recombination which is at high concentration of VOCs and low light
intensity.
b) Half order regime: this process happens at high light intensity and low
concentration of VOCs and recombination persists.
Lamp intensity affects PCO performance, and the degradation rate increases with
enhancement of light intensity. For instance, in TCE degradation rate vs. intensity, at low
concentration, the conversion rate showed square-root dependency to light intensity while
at high concentration it is linear. At high intensity, mass transfer limitation controls
degradation rate, and recombination of hydroxyl radicals occurs. Both of these issues
decrease quantum yield (Ray, 2000). Ohko et al. (1998) investigated 2-propanol and
found out that at 104-106 µw/cm2 intensity, mass transfer controls the process, whereas in
the 1-1000 ppm concentration range, the light intensity controls the process.

39
2.8.6 Presence of Other Compounds
The types of reactant have a critical role in the operational condition for complete
mineralization. Different structures of VOCs photodegradation were investigated by
researchers and they observed that the presence of some compounds cause less
mineralization while others cause more degradation. For instance, nitrogen containing
compounds remediate less than chlorine, sulfur and phosphorus containing components
(Waki et al., 1995). Also, since air has a complex mixture of contaminants, some of these
compounds can enhance photodegradation of others or decrease them. For example,
methanol (1000 ppmv) presence as an electron donor (D) increases CCl4 conversion from
0% to 10% since it minimizes the undesired electron-hole pair recombination, while O2
did not show significant effect on the CCl4 photodegradation (Waki et al., 1995).
In the formaldehyde mineralization, nitric oxide (NO) promotes photodegradation but
sulfur ions decrease remediation (Ao and Lee, 2004). The presence of NO promoted the
conversion since OH radicals are produced as a result of NO existence in the mixture.
But, due to the existence of SO2 in the mixture, sulfate ions are formed which compete
with pollutants for active sites and therefore, inhibit the conversion rate. Halogenated
VOCs as sensitizers, which provide radicals, can be used for less or non-degradable
compounds. For instance presence of chloroform in 254 nm wavelength and carbon
tetrachloride as a reactant causes mineralization of this non-degradable compound
(Bhowmick and Semmens, 1994).

40
Moreover, some contaminants have a twofold role. Lichtin et al. (1996) observed that
trichloroethylene inhibited acetone conversion while promoting trichloromethane,
dichloromethane and octane degradation. These inhibitation/promotion effects can be a
result of competition between components for achievement of catalyst active sites or even
production of side products which are absorbed on the catalyst surface and block the
active sites or they can consume driving radicals of PCO process.
2.8.7 Pressure
Pressure is another parameter which affects the PCO process in gas-phase systems.
Pressure reduction in these systems, drastically increases VOCs mineralization. For
instance, PCO performance at 6-10 psia is greater than 10-21 psia. This aspect especially
in systems with low concentration of VOCs and high water vapor concentration is
important (Raupp et al., 1997; and Ray, 2000). Generally, low pressure usage is
beneficial for removing diffusional mass transfer limitation in PCO process. In thin film
catalyst usage, mass transfer limitation is very important and high flow rate is used for
overcoming this problem. In this case, pressure reduction also increases reactant
diffusivity although at low pressure always there is a competition between VOCs and
water vapor for adsorption on the catalyst surface.
Most of the operational parameters in the UV-PCO system influence each other. For
instance, air flow rate affects radical productions which participate into the reaction. In
addition, it can affect boundary layer, mass transfer coefficient and also diffusion
coefficient of both reactants and products. Temperature induces speed of reaction and
also increases adsorption and desorption coefficient.

41
2.9 RELATED WORKS
Hodgson et al. (2003, 2005, 2005a) carried out laboratory experiments on two prototype
honeycomb monolith UV-PCO devices (12 in. by 12 in.). One had aluminum honeycomb
monoliths coated with Degussa P25 TiO2 impregnated with 3% tungsten oxide (WO3).
The other had a honeycomb monolith made of an optical polymer and coated with a thin
semitransparent silane barrier coat followed by a thin semitransparent TiO2 film serving
as the photocatalyst. They used nine UVA lamps with 46 cm (18 in) long and about 2.8
Watts total UV with peak irradiance at 368 nm, arranged in three banks. The distance
between a lamp surface and monolith is about 7 cm (Figure 2-8). They prepared steady
state concentrations in a classroom laboratory or a 20 m3 chamber and the inner duct
dimensions of the reactor were 34 cm by 41 cm (13.5in by 16 in). The air flow rate was
varied from approximately 175 m3/h to either 300 m3/h or 600 m3/h. They challenged
their UV-PCO system with several complex mixtures of ppb level VOCs concentration.
For the first device, the oxidation rates of the chemical classes of compounds followed
the approximate order of alcohols and glycol ethers (> 70% at the low flow rate of 165
m3/h and near 40% at the high flow rate of 580 m3/h) > aldehydes, ketones, and terpene
hydrocarbons > aromatic and alkane hydrocarbons > halogenated aliphatic hydrocarbons.
Formaldehyde, acetaldehyde, acetone, formic acid and acetic acid were identified in
these experiments as reaction by-products. The second device had high reaction
efficiencies for many VOCs commonly encountered in indoor environments (many
alcohols, glycol ethers, formaldehyde, hexanal, etc.), and the external mass transfer
might be the rate-limiting step for these highly reactive compounds at low flow rates.
Formaldehyde, acetaldehyde and acetone were observed as reaction by-products. In both

42
cases, no chlorine-containing by-products were reported when the UV-PCO device was
challenged by the VOC mixture containing low concentrations of trichloroethene and
other chlorinated solvents. In addition, there was no discussion about interference effects
among the multiple VOCs.
Figure 2-8 Schematic diagram of UVPCO reactor showing arrangement of four photocatalytic monoliths and three banks of three UVA lamps.
Ginestet et al. (2005) tested the UV-PCO units with different designs of catalyst
inserts, including pleated wire coarse meshes, pleated wire fine meshes and
triangular honeycomb monolith. Based on their observations, very low (near zero)
removal efficiency of the PCO in units with pleated wire meshes while the triangular
monolith unit had a removal efficiency of over 10% under the same test
conditions. They conducted further tests for the honeycomb monolith using toluene,
acetone and ethanol as test compounds and the test concentration level was 10 ppm. They
found that all these compounds could be significantly removed by the PCO unit and
formaldehyde and acetaldehyde were the main by-products.

43
Sun et al. (2005) evaluated two UV-PCO units in an aircraft cabin simulator with
relative humidity lower than 20% and supply air flow rate and outside air supply rate
were controlled at 200 L/s and 2.4 L/s per person respectively. Ethanol, isoprene and
toluene oxidation were studied in these units. Generation of formaldehyde and
acetaldehyde for both units and generation of methanol for one of the unit were observed.

44
CHAPTER 3 EXPERIMENTAL SET-UP AND
METHODOLOGY
3.1 INTRODUCTION
As mentioned in chapter 1, one of the main objectives of this research is to develop an
experimental methodology to evaluate UV-PCO performance and generated by-products
using different groups of VOCs. In this part, test rig design, chemical generation system
along with gas sampling and analysis instruments are explained.
3.2 CHEMICALS AND REAGENTS
More than 300 VOCs have been identified in an indoor environment, and more than 170
of them can be detected in an indoor environment by means of GC/MS or GC-FID/MS
(ISO 16000-6:2004(E)).VOCs for this research were selected according to VanOsdell’s
(1994) specification for target compounds which are as the following:
� Frequently exist in indoor spaces.
� Easily can be analyzed.
� Do not have serious health risks and remarkable safety notifications.
� Reasonable test performing cost.
Also, target compounds have been chosen based on their high concentration in North
American buildings (Hodgson et al., 2005). Most of these compounds have been
recommended in the ASHRAE standard 145.1 (2008) and 145.2 (2011).

45
Based on the above precautions, the following compounds were selected and purchased
from Fisher scientific company and all of these chemicals had a purity of 99%. Moreover,
for full evaluation of the PCO technology performance and comparing by-products
generation, challenge VOCs were chosen from different classes of chemical compounds
including aromatics, alcohols, ketones, and alkanes. Besides, at least two compounds
from the same chemical class were chosen to compare their by-products and facilitate
investigation of their similarity and differences. Table 3-1 lists target compound
specifications, and Table 3-2 provides information about the possible sources of these
compounds in an indoor environment.
Table 3-1 Physical specification of challenge gases.
Chemical Class.
Compound Name
Molecular Formula
Molecular Weight (g/mol)
Density (g/mL)
Boiling Point (0C)
Vapor Pressure. at 23 0C (mm Hg)
ASHRAE Std 145.1 Toxic Cat.
Aromatic Toluene C7H8 92.14 0.867 110.6 25.64 + H
p-Xylene C8H10 106.16 0.866 138
+ H
Alkane n-Hexane C6H14 86.18 0.656 69 139.88 +
n-Octane C8H18 114.23 0.703 125 12.56
Ketones
2-Butanone (MEK) C4H8O 72.11 0.8 79.64 86.95 + H
Acetone C3H6O 58.08 0.788 56.53 184.5 +
Alcohol Ethanol C2H6O 46.07 0.785 78.4 44.63 +
1-Butanol C4H10O 74.12 0.808 117 5.47
Presence on U.S. EPA Hazardous Air Pollutant lists was indicated by “H”, Compounds proposed in ASHRAE Standard 145.1 were included (indicated by “+”)

46
Table 3-2 Possible emission sources and potential health casualties of selected VOCs.
Che
mic
al
Cla
ss Compound Compounds
Source Reported air quality in different modes of public transportation
(μg/m3 ) Health problems
Name Aircraft Train Bus Subway Residential Office A
rom
atic
Toluene Polyurethane foam,
aerosols, Paints,
adhesives, gasoline,
combustion sources
4.7–86.5 7–54 15–39 13–27 12-240 2.1-40 Disorders or
diseases of the skin, eye, liver,
kidney, nervous system,
respiratory and/or
pulmonary system, lung.
P-xylene 2.0–12.5 3–9 6–48 5–50 28-120 1.4-10
Alk
ane
n-Hexane Paints,
adhesives, gasoline,
combustion products
0–3 2–6 0–6 Causes
irritation to eyes, skin and
respiratory tract. Disorders
of lung, central and peripheral
nervous system
n-Octane 3.6 0.11-13
Ket
ones
Butanone (MEK) Lacquers,
varnishes, polish
removers, adhesives
3.4–17.9 3–11 4–18 4–17 Affects central
nervous system. Causes
irritation to nose, throat,
eyes, skin and respiratory
tract. Disorders of lung.
Acetone 21.0–167.7 49–93 30–73 30–92
Alc
ohol
Ethanol Aerosols, window cleaners,
paints, paint thinners,
cosmetics, adhesives
154–3625 170–1700 50–260 130–300 130
Causes severe eye irritation and moderate skin irritation. Disorders of
kidneys, heart, central nervous system, liver. Respiratory
tract.
1-Butanol 2.3-63
3.3 GENERATION SET-UP OF REAGENTS
VOCs have low boiling points and they vaporize easily, although there are many
generation methods, for instance gas cylinders, diffusion cells, etc., direct vaporization of
VOCs is the simplest and most economical way. Since VOCs concentration in an indoor
is at the ppb-level, three concentrations which are 250, 500 and 1000 ppb were chosen.
Although, in the case of acetone, due to B&K respond limitation chosen concentrations
are 500, 1000, 2000 ppb and in the case of 1-butanol due to condensation of 1-butanol in

47
tubing 250-500, and 800 ppb were chosen. This option provides the possibility of further
investigation of UV-PCO performance and by-product generation at different
concentrations of VOCs in the contaminated air.
Selected VOCs are liquid at room pressure and temperature. Syringes (Hamilton
Company) with compressed air as a carrier gas were chosen. The injection rate was
controlled via mass flow control box and mass flow controller transducers (Matheson Gas
Products Company). The calculation procedure of the injection rate of VOCs is provided
in Appendix A. In Figure 3-1 schematic diagram of this set up is presented. In this setup,
target VOCs concentration was controlled via adjusting air flow rate with an air flow
controller and KD Scientific Syringe Pumps.
Figure 3-1 Low concentration generation system setup.
3.4 ANALYTICAL INSTRUMENTS
Different analytical instruments can be used in UV-PCO tests; for instance gas
chromatography/flame ionization detector (GC/FID), gas chromatography/mass
spectroscopy (GC/MS), high performance liquid chromatography (HPLC), Fourier-
transform infrared spectroscopy (FTIR), temperature-programmed oxidation (TPO) and
temperature-programmed hydrogenation (TPH) are instruments for intermediate

48
identification. FTIR is more applicable for catalyst surface intermediates, however it
works efficiently only when the concentration of intermediates is high (Mo et al., 2009).
At very low concentrations of intermediates, liquid nitrogen trapping and adsorbent tube
were usually used to concentrate these intermediates (Ye et al., 2006). Also, for low
concentration of VOCs, Photo-Acoustic Spectroscopy (PAS) and Proton Transfer
Reaction Mass Spectrometer (PTR-MS) are applicable for real-time monitoring of VOCs
(Obee and Hay, 1997).
3.4.1 High-Performance Liquid Chromatography (HPLC)
In this research high-performance liquid chromatography (HPLC) was used for analysis
of aldehydes and ketones, which is shown in Figure 3-2. Water and acetonitrile with 30%
and 70% ratio are used as solvents and a UV-Vis detector as a detector of HPLC. EPA
TO-11a method was adopted and aldehydes and ketones were gathered into the cartridge
coated with 2, 4-dinitrophenylhydrazine (2, 4–DNPH) (Supelco LpDNPH-SIGMA
ALDRICH Company). Lp DNPH cartridges ozone scrubber (KI Ozone scrubber-
SIGMA ALDRICH Company) was installed beyond the sampling port and 2, 4 – DNPH
cartridge. An ozone scrubber was installed in this connection to prevent ozone from
reacting with DNPH solid sorbent. Sampling cartridges were connected to the sampling
pump via PTFR tubing. Sampling pumps were calibrated into the required flow rate
based on the sampling. The sampling pump flow rate was 1.3 L/min. 2, 4 – DNPH
cartridges were extracted with 4 mL of acetonitrile which introduced by micro-volume
Bottle dispenser (1-10 ml) (Fisher Scientific co.), into the cartridge. Elute analyzed by
high-performance liquid chromatography (HPLC) with ultraviolet detection (Perkin

49
Elmer Flexar HPLC) and quantification of the elute compounds were verified using
HPLC standards and calibration curves.
Figure 3-2 High-performance liquid chromatography (HPLC).
a)
b)
Figure 3-3 a)Supelco Lp-DNPH b) Lp-DNPH cartridges Ozone Scrubber (KI Ozone scrubber).

50
3.4.2 Auto-Sampler
The CBISS MK3, an 8-channel auto sampler is a third generation computer controlled
industrial multiplexor intelligent sampling system (WINCO International) was used to
take samples from upstream and downstream of the test rig and send them to a multi-gas
photoacoustic detector (Bruel & Kjaer, Model 1302).
3.4.3 Multi-Gas Photoacoustic Detector (Bruel & Kjaer, Model 1302)
A multi-gas photoacoustic detector was applied to measure the concentration of
challenged gas in upstream and downstream of UV-PCO reactor. Rather than measuring
the concentration directly, this equipment measures the effect of absorbed energy of gas
molecule. It irradiates infrared radiation (IR) to gas molecules, and the gas molecules
adsorb the IR. After absorbing the IR energy, gas molecules convert it to kinetic energy.
Then the resulting energy is converted to sound waves as their amplitude is proportional
to the concentration of detected compound by two microphones.
3.4.4 Ozone Analyzer
Multi-Channel Industrial Hygiene Ozone Analyzer Model 465L (Teledyne Technologies
Company) is UV photometric ozone monitor which is used for taking samples from
upstream and downstream and measuring the ozone concentration.
3.5 INSTRUMENT CALIBRATION
There are a series of calibrations that must be done before the main tests, which are as
follows:

51
3.5.1 Sampling Pumps Calibration
Two types of vacuumed pumps were used, GILAIR-3 & GILAIR-5 (SENSIDYNE Co.)
which used to take samples for HPLC analysis at 1.3 L/min flow rate. The vacuum
sampling pumps were calibrated by connecting each pump with the same Lp-DNPH and
Lp-DNPH ozone scrubber cartridges and measuring the flow rate with DryCal ® DC-Lite
(Bios International Corporation) and adjusting the flow rate. The calibration was
performed three times, and each time the average of 10 readings was taken for vacuum
sampling pumps flow rate. Figure 3-4 shows the calibration set-up for aldehyde/ketone
sampling pumps.
Figure 3-4 High flow rate sampling pump calibration setup.
3.5.2 Multi-Gas Photoacoustic Detector (Bruel & Kjaer, Model 1302)
Different VOCs with different concentrations as target compounds are used for the
experiments; therefore it is necessary to calibrate B&K before analyzing the samples.

52
Compressed air at 10.11 L/min flow rate passed through the tubing as a carrier while the
flow rate was controlled by mass flow control box and mass flow controller transducers
(Matheson Gas Products Company). Each target compound of VOC with known
concentration was injected through the septum on the T-joint into the carrier compressed
air via Hamilton syringe. Contaminated compressed air total hydrocarbon concentration
is monitored by multi gas B&K detector and average of reading was considered as
instrument respond for that concentration. Different concentration of each single
compound was injected and monitored to have the calibration curves of all the target
compounds. Calibration equation of each target compound is given in Appendix B.
Figure 3-5 Multi-gas photoacoustic detector calibration set-up.
3.5.3 HPLC Calibration
HPLC was used to measure by-products generation in UV-PCO system. HPLC
calibration was done based on TO-11A method, using 15 compounds carbonyl-DNPH
mixtures standard with analytical concentration of 15 µg/ml which is included
formaldehyde, acetaldehyde, acrolein, acetone, propionaldehyde, crotonaldehyde,
butyraldehyde, benzaldehyde, isovaleraldehyde, valeraldehyde, o-tolualdehyde, m-
tolualdehyde, p- tolualdehyde, hexaldehyde, and 2, 5-dimethylbenzaldehyde. Acetonitrile
was used for dilution of the standard, and the total amount of standard was 1.5 mL. Four

53
standard solutions were prepared; dilute solution #1 with 50 µl of standard and 2450 µl of
Acetonitrile (concentration of the solution was 2%), dilute solution #2 with 400 µl of
standard and 7600 µl of Acetonitrile (concentration of the solution was 5%), dilute
solution #3 with 200 µl of standard and 800 µl of Acetonitrile (concentration of the
solution was 20%), and dilute solution #4 with 500 µl of standard and 500 µl of
Acetonitrile (concentration of the solution was 50%). Injection volumes for all of the
dilute solutions were 10 µl and 20 µl. Thus, 3, 6, 7.5, 15, 30, 60, 75, 150 ng mass injected
points for each compound were provided for calibration. For repeatability of the
injection, each calibration standard was analyzed twice and the average of the two HPLC
area respond versus injected mass was plotted. The HPLC equipment generates
calibration curves and, during the experiment gives the mass of the recognized compound
based on calibration curves. The calibration equations of each compound are listed in
Appendix B.
3.6 DUCT TEST RIG SPECIFICATIONS
The test rig is an open duct with four ducts which have the same condition. This design
makes it possible to perform four experiments in parallel. The experimental apparatus
picture and schematic diagram with dimensions are provided in Figure 3-6 and in Figure
3-7 respectively.

54
Figure 3-6 Duct test rig picture.
Figure 3-7 Duct apparatus dimensions.

55
Each duct consists of four main parts: Injection section, upstream, reaction section,
adsorption section, and sampling ports. Figure 3-8 shows the schematic drawing of the
apparatus with its different parts.
a)
b)
Figure 3-8 a) Open test rig apparatus schematic diagram. b) Different parts of each duct.
Injection section: This part is a common section to all the ducts. Laboratory air was
sucked into the ducts using radial fans. Particulate filter was installed at the entrance of
the duct to remove dust. First, air passes through the filter and mixes with the injected
VOCs, and enters the ducts. Since it is necessary to have a uniform VOC concentration in
the duct a mesh screen was installed at the duct entrance. One fan in the injection section
and four fans in each of the ducts are available. The system was calibrated in order to

56
have a flow rate of 0.047 m3/s - 0.141 m3/s (100 cfm - 300 cfm) in each duct which can
be controlled individually. Most of the tests were done at 0.047 m3/s (100 cfm) flow rate.
Upstream section: This section includes cross section tubes with holes. VOCs
concentration in upstream was measured from this part. The flow meter sensor is installed
to measure and adjust the flow rate.
Reaction section: This section consists of UV-lamps and TiO2 catalysts. It is possible to
change the number of lamps and media in this section. Catalysts media are located 2
inches away from the UV-lamps.
UV-Lamps: Two types of UV-lamps were used in the experiments: UVC and VUV
lamps with 254 nm wavelength and 185 nm + 245 nm wavelengths, respectively
(Figure 3-9). VUV lamps produce ozone as a by-product which reacts with VOCs.
Therefore, experiments can be done in the absence and the presence of ozone using
UVC and VUV lamps, respectively.
Figure 3-9 UV-lamps and their configuration.
Catalyst: Catalyst substrate A consists of TiO2 coated on fiber glass and catalyst
substrate B consists of TiO2 coated on activated carbon. The BET test result shows
the BET surface area of the catalyst substrate A and B are 105.7063 ± 1.6269 m2/g
and 887.6638 ± 10.6871 m2/g, respectively. The SEM test results for catalyst
substrates A and B are presented in Figures 3-10 and 3-11, respectively.
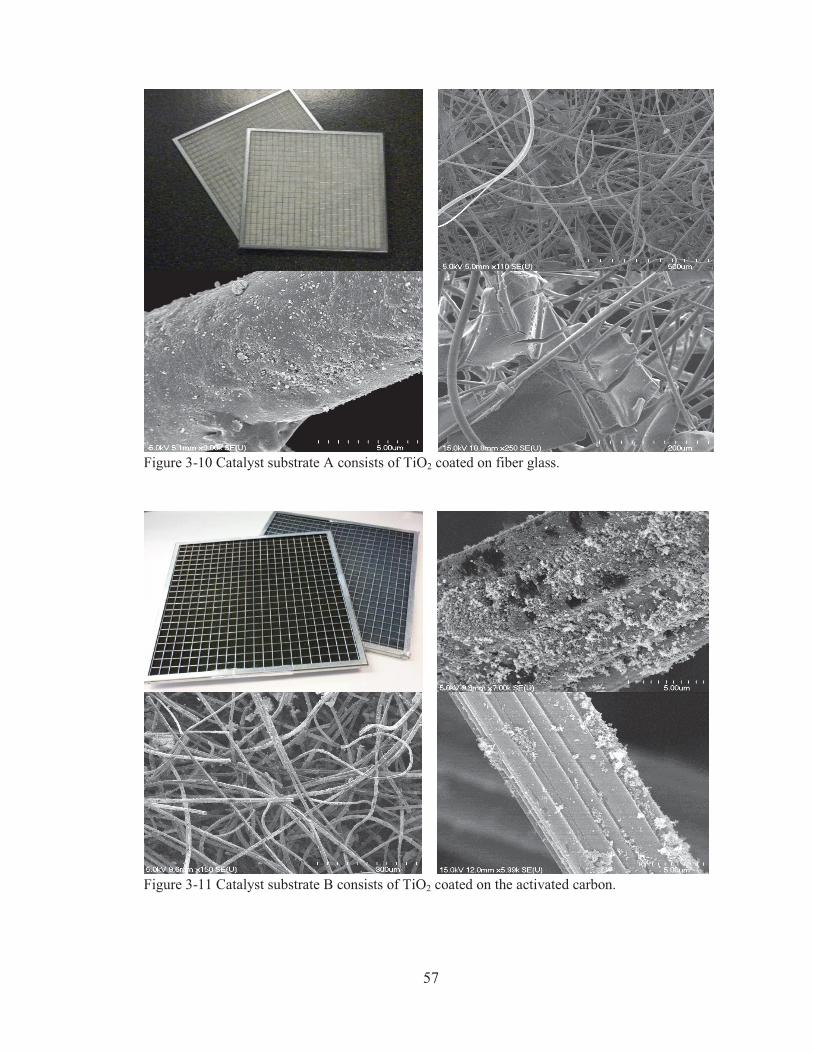
57
Figure 3-10 Catalyst substrate A consists of TiO2 coated on fiber glass.
Figure 3-11 Catalyst substrate B consists of TiO2 coated on the activated carbon.
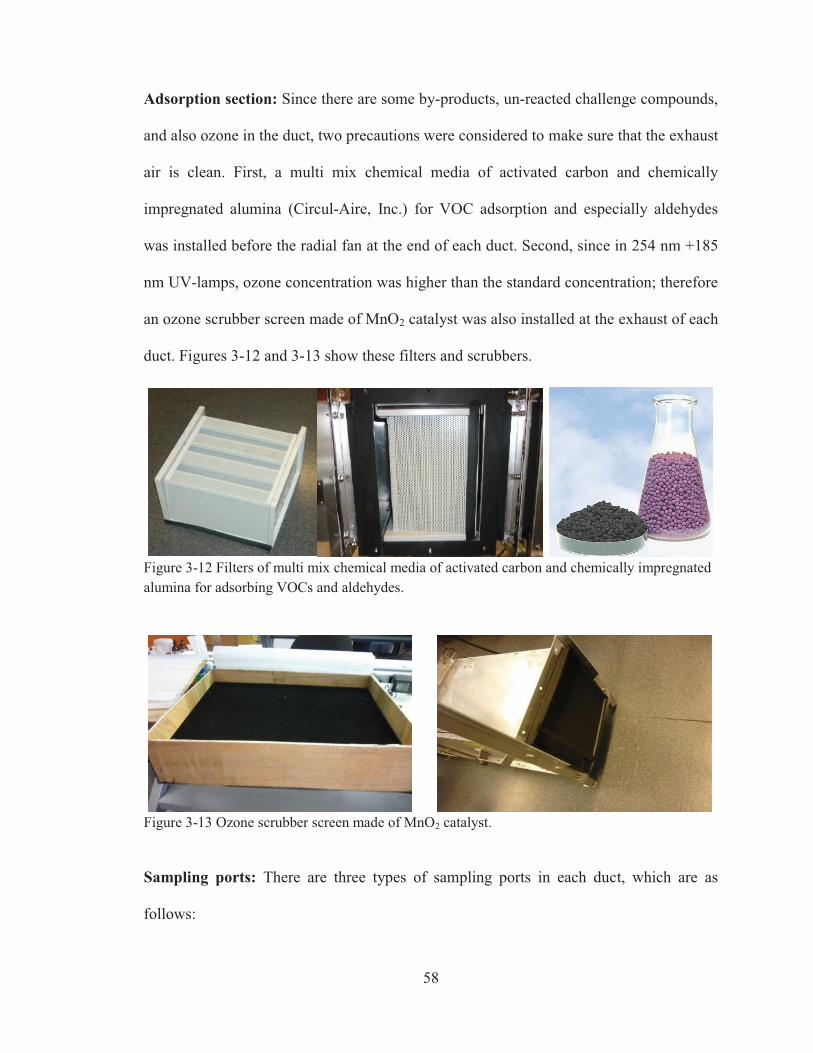
58
Adsorption section: Since there are some by-products, un-reacted challenge compounds,
and also ozone in the duct, two precautions were considered to make sure that the exhaust
air is clean. First, a multi mix chemical media of activated carbon and chemically
impregnated alumina (Circul-Aire, Inc.) for VOC adsorption and especially aldehydes
was installed before the radial fan at the end of each duct. Second, since in 254 nm +185
nm UV-lamps, ozone concentration was higher than the standard concentration; therefore
an ozone scrubber screen made of MnO2 catalyst was also installed at the exhaust of each
duct. Figures 3-12 and 3-13 show these filters and scrubbers.
Figure 3-12 Filters of multi mix chemical media of activated carbon and chemically impregnated alumina for adsorbing VOCs and aldehydes.
Figure 3-13 Ozone scrubber screen made of MnO2 catalyst.
Sampling ports: There are three types of sampling ports in each duct, which are as
follows:

59
Ozone sampling port (port C): these ports are for taking ozone samples automatically.
Each channel is connected to the sampling port (Upstream, Downstream Duct #1 to 4 and
exhaust) via tubing and it takes samples and analyzes them.
VOCs sampling port (port A): these ports which exist in Upstream, before the reaction
section, and downstream, after the reaction section, of Duct #1 to Duct #4 are connected
to the CBISS MK3 Auto sampler coupled to the multi gas detector (B&K) via tubing.
Ports are connected to the cross section tubes with some holes in them to have a uniform
concentration of the samples.
Manual VOCs sampling port (port B): these ports are for manually taking samples.
Since we want to have uniform samples of contaminated air of the duct, cross section
tubes with some holes in them are installed inside the duct. These tubes are connected to
the sampling port. Contaminated air passes through cross tubes and is gathered by air
sampling pumps. In Figure 3-14, cross section tubes and sampling ports set-up are shown.
a) b) Figure 3-14 a) Cross section tubes, b) Sampling port setup.
Pressure drop measurement port (port D): there are two ports in each duct before and
after the reaction part to measure the pressure drop.

60
3.7 ENVIRONMENTAL CONDITION MEASUREMENT
For measuring temperature and relative humidity, Vaisala HUMICAP humidity and
temperature transmitter series HMT100 were used in each duct downstream and
upstream. Flow rate which can be adjusted by changing the speed of each of the vacuum
fans, is measured by electronic low flow (ELF) sensor provided by EBTRON Thermal
Dispersion Air flow Measurement Technology Company. The ELF is a factory calibrated
from 0 to 3,000 FPM (0 to 15.24 m/s) in highly accurate wind tunnels to NIST traceable
volumetric air flow standards to provide typical air flow accuracy of 3% of reading over
the entire flow range. These instruments have probes which are mounted in the upstream
and downstream at the same section in all of the ducts, and their measured data were
transferred into a personal computer (PC) via data acquisition system (DAS) (provided
from Agilent 34970 Data Acquisition/Switch Unit). In this system, data were produced
by DC voltage difference and converted to temperature in Celsius and percentage of
relative humidity by a developed program (Agilent IO Libraries Suite) which was
installed in the PC. Analog output range for this instrument is 0-10 V which is sent to the
Agilent DAS and measured relative humidity range is 0% to 100% with accuracy of ±
1.7% RH (0% to 90% RH); ± 2.5% RH (90% to 100% RH) and the temperature range is -
40 °C to 80 °C (-40 °F to 176 °F) with ± 0.2°C accuracy.
3.8 EXPERIMENTAL METHODOLOGY AND PROCEDURE
Two types of TiO2 catalyst substrates were used in this study. Substrate A which consists
of TiO2 coated on fiber glass, and substrate B which is TiO2 coated on activated carbon
(Figure 3-10 and Figure 3-11). The experiments were performed with two types of UV-

61
lamps, UVC and VUV lamps with 254 nm wavelength and 185 nm + 245 nm
wavelengths respectively (Figure 3-9). Duct # 1 consisted of two units of PCO- reactors
including three catalyst substrates A and two UVC lamps between each two catalyst
substrates (total of four lamps). Duct #2 had two VUV lamps. The configuration of the
Duct # 3 was as same as Duct # 1 except that instead of UVC; two VUV lamps were
installed between each two catalysts (total of four lamps). Duct # 4 was supplied with two
PCO reactors including three catalyst substrates B and two VUV lamps between each two
catalyst substrates (total of four lamps). The configuration of the lamps and catalyst
substrates is provided in Figure 3-8. This configuration made it possible to study the UV-
PCO performance of each catalyst in both VUV-lamps with 185 nm + 254 nm and UVC-
lamps with 254 nm wavelength. Also, using the proposed configuration, UV-PCO
technology in the presence of ozone with VUV lamps can be investigated.
Experiments were performed at a 100 cfm air flow rate through each duct. First UV-
lamps were turned on and after stabilization of light intensity and VOCs background
measurement (which took 30 minutes), challenge gas was injected into the system from
the injection section. Ozone is one of the by-products of UV-PCO using 254 nm + 185
nm wavelength VUV-lamps; Multi-Channel Industrial Hygiene Ozone Analyzer Model
465L was exploited to measure concentration in upstream and downstream of each duct
(Port C). Target compound concentration at the upstream and downstream of each duct
was measured and recorded with an auto-sampler coupled with a calibrated B&K gas
detector (Port A). When the challenge compound concentration at the downstream was
stabilized, air samples from the upstream and downstream were taken manually using
Sigma Aldrich Supleco Lp-DNPH and KI ozone scrubber cartridges. The sampling

62
duration with Lp-DNPH cartridges was 1.5 hours at 1.3 L/min flow rate (Port B). High-
performance liquid chromatography (HPLC) (PerkinElmer Company) was used for
aldehydes and ketones analysis. UV-lamp light intensity was measured by 185 nm sensor
(International Light Inc) and 254 nm wavelength sensor (Steril-Aire Company)
(Appendix D). After completion of each experiment, when the injection was stopped, the
test rig was continued to flush out overnight at the same airflow rate in order to prevent
VOC residue in the test rig. Lamps were also remained on for 8-10 hours to activate the
catalyst substrates after each experiment.
3.8.1 Removal Efficiency
The performance of UV-PCO was quantified by removal efficiency, and it was calculated
from the measured upstream and downstream concentrations.
Removal Efficiency, 100(%),
,, ��
�tup
tdowntupt C
CCE Equation 3-1
where;
Cup,t = the upstream challenge gas concentration (ppb) as a function of time.
Cdown,t = the downstream challenge gas concentration (ppb) as a function of time.
Et= the removal efficiency as a function of time.
t= the elapsed time (min).

63
3.8.2 Net By-product Concentration
Generated by-products’ concentration in these experiments was quantified by comparing
concentration of generated compound in upstream and downstream.
Net generated by-products concentration, Ga = Cup - Cdown Equation 3-2
Cup = the upstream generated by-product concentration (ppb).
Cdown = the downstream generated by-product concentration (ppb).
Ga= the net production of generated by-product (ppb).

64
CHAPTER 4 EXPERIMENTAL RESULTS AND
DISCUSSION
4.1 INTRODUCTION
This chapter reports the experimental results based on the described methodology in
chapter 3. Experiments were carried out in two categories: Section 4.2 consists of UV-
PCO performance and by-products generation applying different classes and
concentrations of VOCs, and section 4.3 includes parametric study of the system using
ethanol as a target pollutants in order to more precisely investigate the complexity of the
system.
4.2 UV-PCO PERFORMANCE AND BY-PRODUCTS GENERATION USING DIFFERENT CLASSES AND CONCENTRATIONS OF VOCS
The UV-PCO system has a different efficiency and by-products due to catalyst substrate
specification and type of UV-Lamps. This section reports the results of four groups of
VOCs including alcohols, ketones, alkanes, and aromatics. Two compounds from each
group with three concentrations were chosen to study the trend of efficiency and
generated by-products. Average ozone concentration during the experiments for each
duct is presented in Appendix C.
4.2.1 Alcohol VOCs
Alcohols with CnH2n+1OH formulation are one of the major groups of volatile organic
compounds (VOCs) in an indoor environment. Ethanol and 1-butanol were chosen from

65
this group. Environmental test conditions are presented in Table 4-1. Removal efficiency
by the system for each compound in each duct is presented in Figures 4-1 and 4-2.
Table 4-1 Environmental test conditions for ethanol and 1-butanol experiments.
Condition Flow rate ( CFM ) Relative Humidity ( % ) Temperature ( 0C )
Ethanol 1-Butanol Ethanol 1-Butanol Ethanol 1-Butanol
Upstream - - 14.6 ± 1.0 19.8 ± 2.0 25.0± 0.1 25.0 ± 0.1
Duct #1 104.7 ± 5.9 106.4 ± 3.7 15.5 ± 0.9 17.8± 2.0 25.5 ± 0.3 25.6 ± 0.1
Duct #2 104.6 ± 5.8 105.0 ± 2.3 14.6 ± 0.9 19.3 ± 2.0 25.3 ± 0.1 25.3 ± 0.1
Duct #3 103.6 ± 6.1 103.4 ± 4.5 15.4 ± 0.9 19.1 ± 2.0 24.4 ± 0.1 25.0 ± 0.1
Duct #4 105.3 ± 2.8 99.5 ± 2.6 13.5 ± 0.8 20.0 ± 12.0 25.2 ± 0.1 25.0 ± 0.1
Figure 4-1 Removal efficiency of ethanol in each duct.
Figure 4-2 Removal efficiency of 1-butanol in each duct.
05
10152025303540
Effic
ienc
y (%
)
Ethanol concentration (ppb)
Duct#1 Duct#2 Duct#3 Duct#4
05
101520253035404550
Effic
ienc
y (%
)
1-Butanol concentration (ppb)
Duct#1 Duct#2 Duct#3 Duct#4

66
In ethanol and 1-butanol experiments, removal efficiency of Duct # 4 is higher than the
other ducts. Therefore, the catalyst substrate B has a better removal efficiency compared
to the catalyst substrate A. Duct # 3 with VUV lamps and almost 1000-1100 ppb ozone
concentration shows better removal efficiency compared to the Duct # 1 with UVC lamps
and 20 ppb ozone concentration which demonstrates that presence of ozone is in favor of
alcohol oxidation. The removal efficiency of Duct # 2 confirms the ozone role in
oxidation of alcohol, since the ozone concentration in this duct is 2000 ppb and 700 ppb
in the case of ethanol and 1-butanol respectively. The removal efficiency reduces with the
concentration increment due to the higher competition between compounds for
adsorption on the catalyst surface and oxidation in presence of the UV-lamps. The ozone
concentration in 1-butanol degradation is significantly less than ethanol which means the
heavier compound has more reaction with ozone compared to the lighter compound
(Appendix C). Figures 4-3 to 4-8 provide by-product results for ethanol and 1-butanol
experiments.
Figure 4-3 Formaldehyde generation in ethanol experiments in each duct.
05
10152025303540
Form
alde
hyde
c
once
ntra
tion
(ppb
)
Ethanol concentration (ppb)
Duct#1 Duct#2 Duct#3 Duct#4

67
Figure 4-4 Acetaldehyde generation in ethanol experiments in each duct.
Figure 4-5 Formaldehyde generation in 1-butanol experiments in each duct.
Figure 4-6 Acetaldehyde generation in 1-butanol experiments in each duct.
0
50
100
150
200
250
Acet
alde
hyde
c
once
ntra
tion
(ppb
)
Ethanol concentration (ppb)
Duct#1 Duct#2 Duct#3 Duct#4
05
1015202530354045
Form
alde
hyde
co
ncen
trat
ion
(ppb
)
1-Butanol concentration (ppb)
Duct#1 Duct#2 Duct#3 Duct#4
0
5
10
15
20
25
30
35
Acet
alde
hyde
co
ncen
trat
ion
(ppb
)
1-Butanol concentration (ppb)
Duct#1 Duct#2 Duct#3 Duct#4
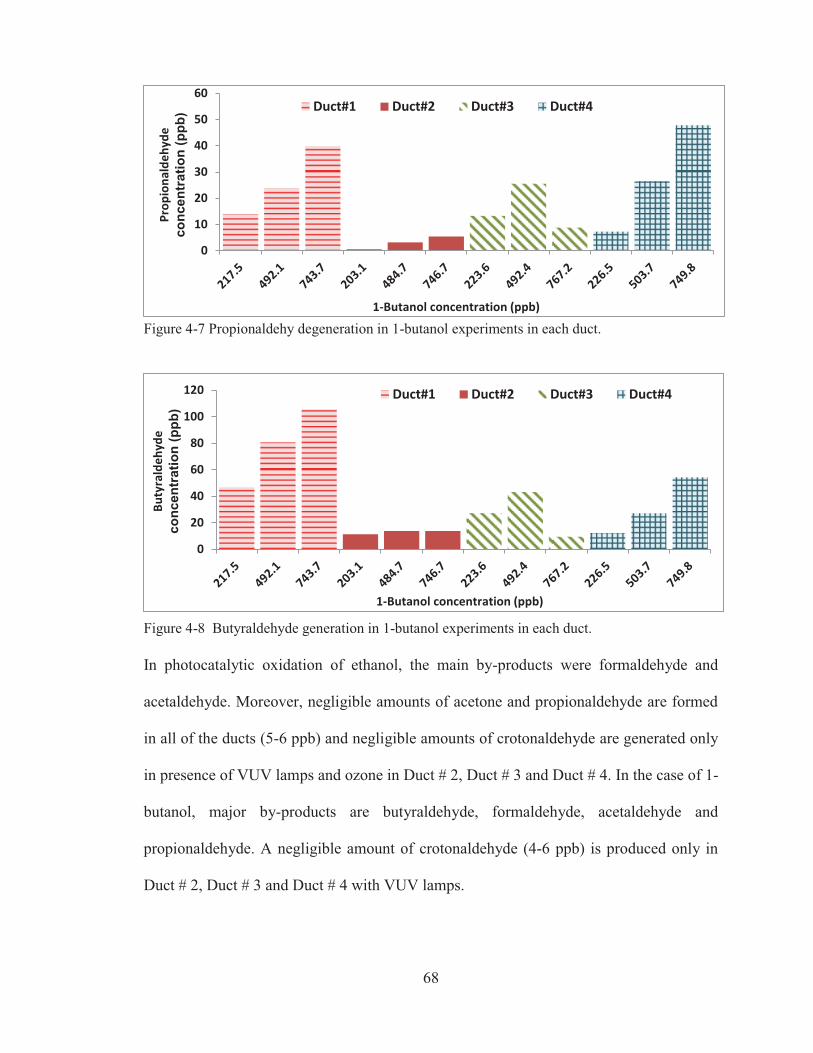
68
Figure 4-8 Butyraldehyde generation in 1-butanol experiments in each duct.
In photocatalytic oxidation of ethanol, the main by-products were formaldehyde and
acetaldehyde. Moreover, negligible amounts of acetone and propionaldehyde are formed
in all of the ducts (5-6 ppb) and negligible amounts of crotonaldehyde are generated only
in presence of VUV lamps and ozone in Duct # 2, Duct # 3 and Duct # 4. In the case of 1-
butanol, major by-products are butyraldehyde, formaldehyde, acetaldehyde and
propionaldehyde. A negligible amount of crotonaldehyde (4-6 ppb) is produced only in
Duct # 2, Duct # 3 and Duct # 4 with VUV lamps.
0
20
40
60
80
100
120
Buty
rald
ehyd
e
conc
entr
atio
n (p
pb)
1-Butanol concentration (ppb)
Duct#1 Duct#2 Duct#3 Duct#4
Figure 4-7 Propionaldehy degeneration in 1-butanol experiments in each duct.
0
10
20
30
40
50
60
Prop
iona
ldeh
yde
conc
entr
atio
n (p
pb)
1-Butanol concentration (ppb)
Duct#1 Duct#2 Duct#3 Duct#4

69
Experimental results show that although the removal efficiency decreases with the
concentration, the by-product generation increases, which means increment of
concentration increases the chance of partial oxidation. For the high concentration
experiments, VOC competition for adsorption on catalyst surface is increased. Due to the
limitation of active sites on the catalyst surface there is not enough space for all of the
contaminants to adsorb. Therefore, chance of partial oxidation and subsequently
generation of by-product is increased. Comparison between Duct # 3 and Duct # 1 with
VUV and UVC lamps shows that although the removal efficiency of Duct # 3 is higher
than Duct # 1 generated by-products concentration in Duct # 3 is lower than Duct # 1.
This fact suggests that the presence of ozone prevents by-product generation. Ozone
molecules cause chain reactions with by-products and oxidize them in the presence of
catalyst substrates. Therefore, by-product concentration deceases.
4.2.2 Alkane VOCs
N-hexane and n-octane oxidation was investigated among the alkane VOCs. In Table 4-2
the environmental test conditions are presented. The removal efficiency of the system for
each compound in each duct is reported in Figures 4-9 and 4-10.
Table 4-2 Environmental test conditions for n-hexane and n-octane experiments.
Condition Flow rate ( CFM ) Relative Humidity ( % ) Temperature ( 0C )
n-Hexane Octane n-Hexane Octane n-Hexane Octane
Upstream - - 31.1 ± 1.5 43.2 ± 1.8 25.0 ± 0.2 25.3 ± 0.2
Duct # 1 100.1 ± 4.0 98.2 ± 4.1 31.6 ± 1.5 43.3 ± 1.7 25.6 ± 0.2 25.9 ± 0.2
Duct # 2 104.2 ± 2.5 104.3 ± 2.8 31.4 ± 1.5 43.5 ± 1.8 25.1 ± 0.2 25.4 ± 0.2
Duct # 3 100.7 ± 4.7 100.1 ± 4.3 32.8 ± 1.6 45.4 ± 1.9 24.4 ± 0.2 24.7 ± 0.2
Duct # 4 104.0 ± 2.6 102.9 ± 2.7 30.0 ± 1.3 41.8 ± 1.9 25.3 ± 0.2 25.5 ± 0.2

70
For n-hexane and n-octane experiments, the removal efficiency of Duct # 4 tends to be
higher than the other ducts. Therefore, the catalyst substrate B had a better removal
efficiency compared to the catalyst substrate A. The removal efficiency of Duct # 2
which consists of just VUV lamps was significant compared to Duct # 1 with catalyst and
UVC lamps (PCO). Moreover Duct # 3 with VUV lamps shows a better removal
efficiency compared to Duct # 1 with UVC lamps which demonstrates that presence of
the ozone was in favor of alkane oxidation; considering that ozone concentration in Duct
# 3 is 900-1000 ppb while in Duct # 1 is 20 ppb. The removal efficiency of Duct # 2
corroborates the ozone role in the oxidation of alkane, since the ozone concentration in
this duct downstream is almost 700 ppb. The removal efficiency reduced with
Figure 4-9 Removal efficiency of n-hexane in each duct.
Figure 4-10 Removal efficiency of n-octane in each duct.
02468
10121416
Effic
ienc
y (%
)
n-Hexane concentration (ppb)
Duct#1 Duct#2 Duct#3 Duct#4
0
4
8
12
16
20
Effic
ienc
y (%
)
n-Octane concentration (ppb)
Duct#1 Duct#2 Duct#3 Duct#4

71
concentration increment due to the stronger competition between compounds for
adsorption on the catalyst surface and oxidation in presence of UV-lamps. Figures 4-11 to
4-13 represent by-products results for n-hexane and n-octane experiments.
Figure 4-11 Formaldehyde generation in n-hexane experiments in each duct.
05
101520253035
Form
alde
hyde
co
ncen
trat
ion
(ppb
)
n-Hexane concentration (ppb)
Duct#1 Duct#2 Duct#3 Duct#4
Figure 4-12 Acetaldehyde generation in n-hexane experiments in each duct.
0
5
10
15
20
25
30
Acet
alde
hyde
co
ncen
trat
ion
(ppb
)
n-Hexane concentration (ppb)
Duct#1 Duct#2 Duct#3 Duct#4

72
Formaldehdye and acetaldehyde are the main by-products of n-hexane and n-octane.
Propionaldehyde, as a main by-product, is generated only in the presence of VUV lamps
in n-octane photocatalytic oxidation. Although the removal efficiency decreases with
concentration increment, the by-product generation increases, which means concentration
increment is in favor of partial oxidation. For high concentration experiments, VOCs
competition for adsorption on catalyst surface increases. Due to limitation of active sites
on the catalyst surface, there is not enough space for all of the contaminants to adsorb.
Therefore, the chance of partial oxidation and more by-products generation increases.
The results of n-hexane experiment shows generation of other by-products including
acetone, propionaldehyde, butyraldehyde, crotonaldehyde, and hexanal. Concentration of
these by-products is 5 ppb to 6 ppb and in Duct # 3 (with higher ozone concentration) is
more than the other ducts. In the case of n-octane oxidation, generated by-products with 5
ppb to 6 ppb concentration are acetone crotonaldehyde, hexanal, and valaraldehyde.
Figure 4-13 By-product generation in n-octane experiments in each duct.
05
1015202530354045
237.8
423.7
879.4
218.8
398.1
784.3
221.4
391.5
834.3
237.6
398.4
816.9
Duct#1 Duct#2 Duct#3 Duct#4
By-p
rodu
cts
conc
entr
atio
n (p
pb)
Octane concentration (ppb)
Formaldehyde Acetaldehyde Propionaldehyde

73
4.2.3 Ketone VOCs
Acetone and 2-butanone are two major ketones in an indoor environment. Table 4-3
represents the environmental test conditions. Removal efficiency of the system for these
compounds in each duct is provided in Figures 4-14 and 4-15.
Table 4-3 Environmental test conditions for acetone and MEK experiments.
Condition Flow rate ( CFM ) Relative Humidity ( % ) Temperature ( 0C )
Acetone MEK Acetone MEK Acetone MEK Upstream - - 43.7 ± 0.8 21.9 ± 1.4 24.5 ± 0.2 25.5 ± 0.2 Duct # 1 100.9 ± 4.3 101.9 ± 3.7 43.3 ± 0.7 22.3 ± 1.3 25.3± 0.2 26.2 ± 0.2 Duct # 2 105.8 ± 2.4 105.5 ± 2.4 43.5 ± 0.8 21.9 ± 1.4 24.7 ± 0.2 25.7 ± 0.2 Duct # 3 97.3 ± 6.4 105.8 ± 4.2 45.5 ± 0.9 22.8 ± 1.4 24.0 ± 0.2 25.0 ± 0.3 Duct # 4 106.8 ± 3.3 103.2 ± 2.7 42.0± 0.8 20.4 ± 1.4 24.8 ± 0.2 25.9 ± 0.2
Figure 4-14 Removal efficiency of acetone in each duct.
Figure 4-15 Removal efficiency of MEK in each duct.
0
5
10
15
20
25
Effic
ienc
y (%
)
Acetone concentration (ppb)
Duct#1 Duct#2 Duct#3 Duct#4
05
101520253035
Effic
ienc
y (%
)
MEK concentration (ppb)
Duct#1 Duct#2 Duct#3 Duct#4

74
Ketones removal efficiency decreases for higher pollutant concentrations in all ducts,
because lower amounts of molecules can reach the catalyst surface to adsorb and oxidize.
Removal efficiency of the ketones in Duct # 3 is not significantly higher than Duct # 1
which demonstrates that ozone reaction with ketones is not significant considering that
the ozone concentration in downstream of Duct # 3 is almost 900-1000 ppb while in Duct
# 1 is just 20 ppb which is the same as the upstream ozone concentration. Duct # 4 shows
a higher removal efficiency compared to the other ducts which shows that the
performance of the catalyst substrate B in comparison with catalyst substrate A, although
the removal efficiency in case of increment in acetone concentration drastically
decreases. Figures 4-16 to 4-19 gives the generated by-products.
Figure 4-16 Formaldehyde generation in acetone experiments in each duct.
0
10
20
30
40
50
60
Form
alde
hyde
co
ncen
trat
ion
(ppb
)
Acetone concentration (ppb)
Duct#1 Duct#2 Duct#3 Duct#4
Figure 4-17 Acetaldehyde generation in acetone experiments in each duct.
0123456789
Acet
alde
hyde
co
ncen
trat
ion
(ppb
)
Acetone concentration (ppb)
Duct#1 Duct#2 Duct#3 Duct#4
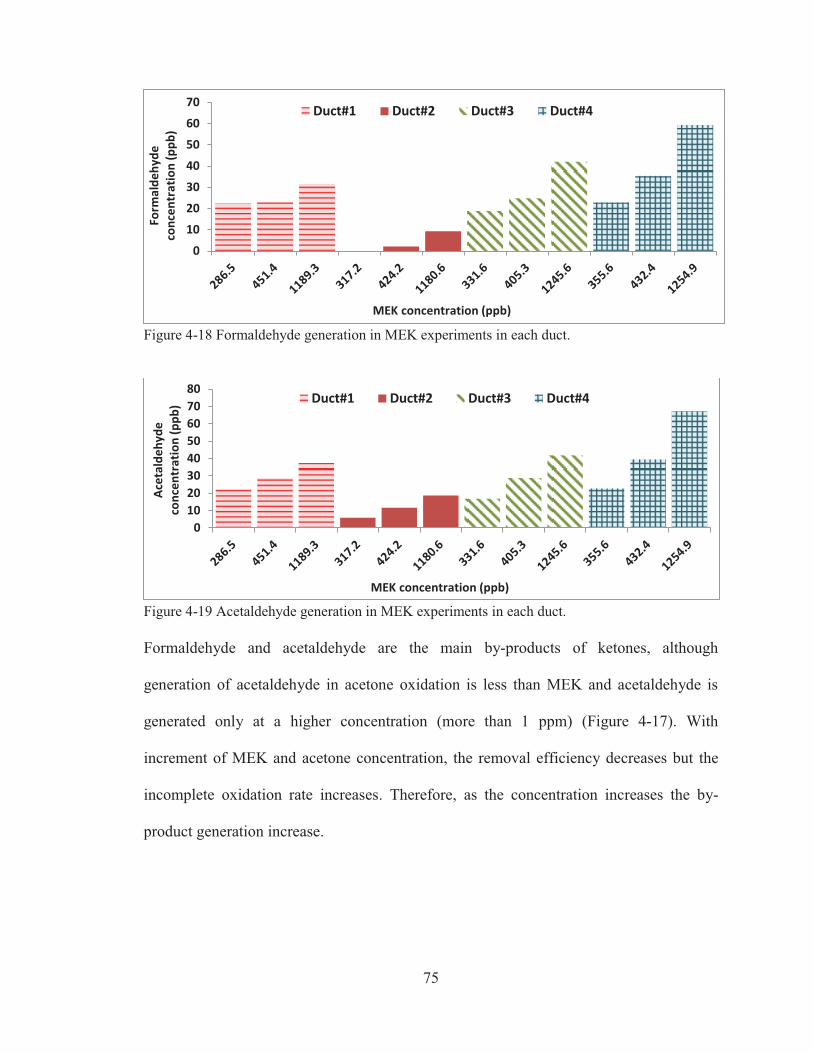
75
Figure 4-18 Formaldehyde generation in MEK experiments in each duct.
Formaldehyde and acetaldehyde are the main by-products of ketones, although
generation of acetaldehyde in acetone oxidation is less than MEK and acetaldehyde is
generated only at a higher concentration (more than 1 ppm) (Figure 4-17). With
increment of MEK and acetone concentration, the removal efficiency decreases but the
incomplete oxidation rate increases. Therefore, as the concentration increases the by-
product generation increase.
0
10
20
30
40
50
60
70
Form
alde
hyde
co
ncen
trat
ion
(ppb
)
MEK concentration (ppb)
Duct#1 Duct#2 Duct#3 Duct#4
Figure 4-19 Acetaldehyde generation in MEK experiments in each duct.
01020304050607080
Acet
alde
hyde
co
ncen
trat
ion
(ppb
)
MEK concentration (ppb)
Duct#1 Duct#2 Duct#3 Duct#4

76
4.2.4 Aromatic VOCs
Toluene and p-xylene were selected as contaminants of interest, and Table 4-4 represents
the environmental test conditions. The upstream and downstream concentrations were
applied to calculate the removal efficiency of the system, (Figures 20 and 21). Figures 4-
22 to 4-27 represent the generated by-products of aromatics in the UV-PCO system.
Table 4-4 Environmental test conditions for toluene and p-xylene experiments.
Condition Flow rate (CFM) Relative Humidity (%) Temperature ( 0C )
Toluene p-Xylene Toluene p-Xylene Toluene p-Xylene Upstream - - 44.6 ± 1.2 34.4 ± 1.80 21.4 ± 0.2 23.8 ± 1.1 Duct # 1 102.4 ± 3.4 102.0 ± 3.7 44.6 ± 1.2 34.5 ± 1.78 22.0 ± 0.2 24.5 ± 1.1 Duct # 2 101.9 ± 4.1 102.9 ± 2.5 44.7 ± 1.2 34.3 ± 1.74 21.5 ± 0.2 24.1 ± 1.1 Duct # 3 104.8 ± 5.8 105.8 ± 4.5 46.6 ± 1.2 36.1 ± 1.88 20.9 ± 0.2 23.3 ± 1.1 Duct # 4 97.7 ± 4.2 101.8 ± 2.7 42.9 ± 1.2 32.6 ± 1.69 21.7 ± 0.2 24.2 ± 1.1
Figure 4-20 Removal efficiency of toluene in each duct.
0
5
10
15
20
25
Effic
ienc
y (%
)
Toluene concentration (ppb)
Duct#1 Duct#2 Duct#3 Duct#4

77
Figures 4-20 and 4-21 show that the removal efficiency of duct # 4 is higher than the
other ducts; this indicates that catalyst substrate B has a better performance than catalyst
substrate A. Moreover, Duct # 3 has higher removal efficiency than Duct # 1. This could
be due to the presence of ozone since the ozone concentration in Duct # 3 is almost 1100
ppb while in Duct # 1, it is 16 ppb to 40 ppb. The removal efficiency of Duct # 2
corroborates the ozone role in the oxidation of aromatics due to 500 ppb and 700 ppb
downstream ozone concentration of this duct in toluene and p-xylene degradation
respectively. The removal efficiency reduces with concentration increment due to the
stronger competition between compounds for adsorption on the catalyst surface and
oxidation in the presence of UV-lamps. The role of ozone in the oxidation of aromatics is
considerable since in Duct # 2 the removal efficiency of both toluene and p-xylene is
higher than Duct # 1. The ozone concentration downstream of Duct # 2 and Duct # 1 is
500 ppb and 16 ppb - 33 ppb in the case of toluene and 700 ppb and 22 ppb - 43 ppb in
the case of p-xylene respectively.
Figure 4-21 Removal efficiency of p-xylene in each duct.
0
5
10
15
20
25
30
35
Effic
ienc
y (%
)
p-Xylene concentration (ppb)
Duct#1 Duct#2 Duct#3 Duct#4

78
Figure 4-22 Formaldehyde generation in toluene experiments in each duct.
0
5
10
15
20
25
30
35
Form
alde
hyde
co
ncen
trat
ion
(ppb
)
Toluene concentration (ppb)
Duct#1 Duct#2 Duct#3 Duct#4
Figure 4-23 Acetaldehyde generation in toluene experiments in each duct.
Figure 4-24 Crotonaldehyde generation in toluene experiments in each duct.
0
2
4
6
8
10
12
Acet
alde
hyde
co
ncen
trat
ion
(ppb
)
Toluene concentration (ppb)
Duct#1 Duct#2 Duct#3 Duct#4
0
2
4
6
8
10
12
Crot
onal
dehy
de
conc
entr
atio
n (p
pb)
Toluene concentration (ppb)
Duct#1 Duct#2 Duct#3 Duct#4

79
Figure 4-26 Acetaldehyde generation in p-xylene experiments in each duct.
Figure 4-27 Crotonaldehyde generation in p-xylene experiments in each duct.
0
2
4
6
8
10
12
14
Acet
alde
hyde
co
ncen
trat
ion
(ppb
)
p-Xylene concentration (ppb)
Duct#1 Duct#2 Duct#3 Duct#4
02468
10121416
Crot
onal
dehy
de
conc
entr
atio
n (p
pb)
p-Xylene concentration (ppb)
Duct#1 Duct#2 Duct#3 Duct#4
Figure 4-25 Formaldehyde generation in p-xylene experiments in each duct.
0
5
10
15
20
25
30
35
Form
alde
hyde
co
ncen
trat
ion
(ppb
)
P-Xylene concentration (ppb)
Duct#1 Duct#2 Duct#3 Duct#4

80
Formaldehyde, acetaldehyde and crotonaldehyde are the major by-products of toluene
and p-xylene. Results show that although the removal efficiency decreases with
concentration increment, by-products generation increase, which means concentration
increment, is in favor of partial oxidation. For high concentration experiments, VOCs
competition for adsorption on catalyst surface increases. Due to the limitation of active
sites on the catalyst surface, there is not enough space for all of the contaminants to
adsorb. Therefore, chance of partial oxidation and more by-products generation increases.
Crotonaldehyde generation mostly depends on the presence of ozone in the system, and
in photocatalytic oxidation of p-xylene, this by-product only was generated in the
presence of VUV lamps. During photocatalytic oxidation of p-xylene and toluene, some
other by-products with less than 7 ppb concentration are formed including butyraldehyde,
tolualdehyde, acetone, valeraldehyde, dimethylbenzaldehyde. Also, benzaldehyde was
generated only in toluene experiments.
4.2.5 All Groups of VOCs
The removal efficiency and concentration of commonly generated by-product of all
tested compounds at 500 ppb concentration are presented in Figures 4-28 and 4-29.
Experiments were done at a 100 ± 6 cfm flow rate, 23 ± 2 0C temperature and 35% ±
10% relative humidity.
Duct # 1 performance for all tested VOCs is as follows: acetone > 1-butanol ≥ ethanol
toluene ≥ MEK> p-xylene > n-octane ≥ n-hexane. Duct # 2 performance for all tested
VOCs is as the following: acetone > p-xylene ≥ toluene > n-octane > n-hexane > 1-
butanol > ethanol. Duct # 3 performance for all tested VOCs: 1-butanol > toluene > n-
octane ≥ ethanol ≥ acetone > MEK ≥ n-hexane > p-xylene. Finally, Duct # 4 performance

81
for all tested VOCs is as the following: 1-butanol > MEK > acetone > ethanol ≥ toluene >
p-xylene > n-hexane ≥ n-octane.
Thus, experimental results show that ozone reacts more with heavier compounds with
more stable structure. Catalyst substrate A with UVC lamps has greater performance for
oxidation of light compounds while catalyst substrate B has a higher performance for
heavier compounds. Both catalyst substrates A and B with UVC and VUV lamps show
low performance for alkane compounds. Generally, catalyst substrate B is better than
catalyst substrate A and VUV lamps are more efficient than UVC lamps. Figure 4-29
shows the common by-products concentration for the tested VOCs.
Figure 4-28 Removal efficiency of tested VOCs.
0
5
10
15
20
25
30
35
40
45
Ethanol 1-Butanol n-Hexane n-Octane MEK Acetone Toluene P-xylene
Effic
ienc
y (%
)
Compound name
Duct#1 Duct#2 Duct#3 Duct#4

82
Figure 4-29 Generated by-products of test VOCs with 500 ppb concentration.
Formaldehyde and acetaldehyde are the major by-products of all VOCs using UVC and
VUV lamps, and also generation of these by-products depends on ozone concentration
and target compound in the system. Ethanol generates the highest amount of
acetaldehyde in comparison with other VOCs followed by MEK in the second place.
Aromatics including toluene and p-xylene and also acetone generate less acetaldehyde. In
the presence of VUV (ozone), first ethanol and then n-octane generate more
formaldehyde compared to the others. These compounds are announced as carcinogenic
and inhalation toxicants. Environmental Health Hazard Assessment (OEHHA) has
recommended Acute Reference Exposure Levels (ARELs) of 55 µg/m3 (44 ppb) in 3 h
for formaldehyde and ARELs of 470 µg/m3 (261 ppb) for acetaldehyde.
4.3 PARAMETRIC STUDY OF THE UV-PCO SYSTEM
For parametric study of the system ethanol as a target pollutant was chosen. The effect of
relative humidity, different numbers of lamps and different numbers of UV-PCO reactors
have been considered in this section.
0102030405060708090
100
Duct#1 Duct#2 Duct#3 Duct#4 Duct#1 Duct#2 Duct#3 Duct#4
Formaldehyde Acetaldehyde
By-p
rodu
ct
conc
entr
atio
n (p
pb)
Ethanol 1-Butanol n-Hexane n-OctaneMEK Acetone Toluene P-xylene

83
4.3.1 Repeatability Test
Experiments on ethanol as a target pollutant with 500 ppb concentration at 100 cfm were
done in different days with the same condition to investigate the repeatability of the
experiments. Experiments showed good repeatability, and removal efficiency of ducts in
are close. In Table 4-5 environmental conditions of the experiments and removal
efficiency in each duct are presented.
Table 4-5 Environmental conditions and removal efficiency for the repeatability experiments.
Condition Flow rate ( CFM ) Relative Humidity ( % ) Temperature ( 0C ) Removal Efficiency
( % )
Test 1 Test 2 Test 1 Test 2 Test 1 Test 2 Test 1 Test 2
Upstream - - 15.0 ± 0.8 14.4 ± 0.5 22.3 ± 0.2 25.0 ± 0.1 - -
Duct # 1 100.6 ± 3.1 104.5 ± 8.2 16.0 ± 0.8 15.3 ± 0.4 22.7 ± 0.2 25.6 ± 0.4 15.5 18.5
Duct # 2 102.0 ± 2 106.2 ± 8.3 15.2 ± 0.8 14.3 ± 0.5 22.5 ± 0.2 25.3 ± 0.2 6.7 7.0
Duct # 3 99.2 ± 3.0 105.8 ± 7.2 16.1 ± 0.8 15.2 ± 0.5 21.5 ± 0.2 24.4 ± 0.1 22.2 22. 3
Duct # 4 100.9 ± 2.9 105.2 ± 2.9 13.8 ± 0.6 13.2 ± 0.3 22.4 ± 0.2 25.2 ± 0.1 36.6 30.0
4.3.2 Concentration Effect
This part was discussed in section 4.2.1 using ethanol in three concentrations in an open
test rig.
4.3.3 Effect of Relative Humidity
For investigation of relative humidity, experiments were done in 4 to 5 different relative
humidity levels in each duct with 500 ± 20 ppb ethanol as a target pollutant at 100 ±6
CFM flow rate and 21 ± 2 0C. Duct # 1 at 9%, 15%, 20%, 42% and 60%; Duct # 2 at 9%,
15%, 20%, 30% and 42%; Duct # 3 at 9%, 15%, 30%, 42% , 60% and Duct # 4 at 9%,
15%, 30%, 42%, and 60%. Figure 4-30 represents the effect of relative humidity on
removal efficiency in each duct. Generated by-products at different relative humidity are
provided in Figures 4-31 and 4-32.

84
Figure 4-30 Effect of relative humidity on removal efficiency of ethanol in each duct.
In Ducts # 1, 3, and 4 of the UV-PCO system, when the relative humidity increases,
removal efficiency decreases. An increase of water vapor molecules increases the
competition of water and VOCs molecules for adsorption on the catalyst surface. Due to
the acidic structure of TiO2 and preference for adsorbing water vapor molecules
compared to VOCs with less polarity, at higher relative humidity, lower amounts of VOC
molecules adsorb on the surface to oxidize. Therefore, removal efficiency decreases. In
Duct # 2, the removal efficiency increases with relative humidity which is because of the
generation of radicals including OH radicals at higher amounts for oxidization of VOCs.
Figure 4-31 Formaldehyde generation in different relative humidity in each duct.
05
1015202530354045
0 10 20 30 40 50 60 70
Effic
ienc
y (%
)
Relative Humidity (%)
Duct#1 Duct#3Duct#4 Duct#2
05
101520253035404550
Form
alde
hyde
co
ncen
trat
ion
(ppb
)
Relative Humidity (%)
Duct#1 Duct#2 Duct#3 Duct#4

85
Figure 4-32 Acetaldehyde generation in different relative humidity in each duct.
Increase of relative humidity favors by-product generation in Duct # 2, 3, and 4 since
presence of ozone (Duct # 2, 3, and 4) causes more radical production especially OH
radicals. Due to enhancement of radical generation, partial oxidation in the presence of
catalyst increases. Therefore, although the removal efficiency decreases, the by-product
generation increases which means most of the reactions lead to partial oxidation.
Formaldehyde generation drastically increases in presence of ozone and high relative
humidity. In the case of Duct # 1, by-products generation decreases at higher relative
humidity since the removal efficiency decreases and there are no ozone molecules in the
system to promote radical generation. Reduction of by-products concentration in high
relative humidity means that, in the absence of ozone, complete oxidation will happen.
4.3.4 Effect of Flow Rate
The flow rate is one of the main parameters which affect the performance of UV-PCO
technology. Experiments were carried out at 500 ± 20 ppb ethanol and 45 ± 10% relative
humidity and 22 ± 2 0C. Figure 4-33 shows the removal efficiency trend versus the flow
rate in each duct. When the flow rate increases, the residence time in the reaction part
decreases, and removal efficiency will decrease. Duct # 1 with catalyst substrate A shows
020406080
100120140160180200
Acet
alde
hdye
co
ncen
trat
ion
(ppb
)
Relative Humidity (%)
Duct#1 Duct#2 Duct#3 Duct#4

86
less dependency on the flow compared to the others while Duct # 4 removal efficiency
drastically decreases with flow rate increment.
Figure 4-33 Effect of flow rate on removal efficiency of ethanol in each duct.
Figures 4-34 and 4-35 show the generated by-products in ethanol oxidation under
different flow rates. Samples for by-products only were taken at three flow rates which
are around 75, 100 and 150 cfm.
Figure 4-34 Effect of flow rate on formaldehyde generation in photocatalytic oxidation of ethanol in each duct.
0
10
20
30
40
50
60
70
0 25 50 75 100 125 150 175
Effic
ienc
y (%
)
Flow rate (cfm)
Duct #1 Duct #3 Duct #4
0
10
20
30
40
50
60
70
Form
alde
hyde
co
ncen
trat
ion
(ppb
)
Flow rate (CFM)
Duct#1 Duct#3 Duct#4
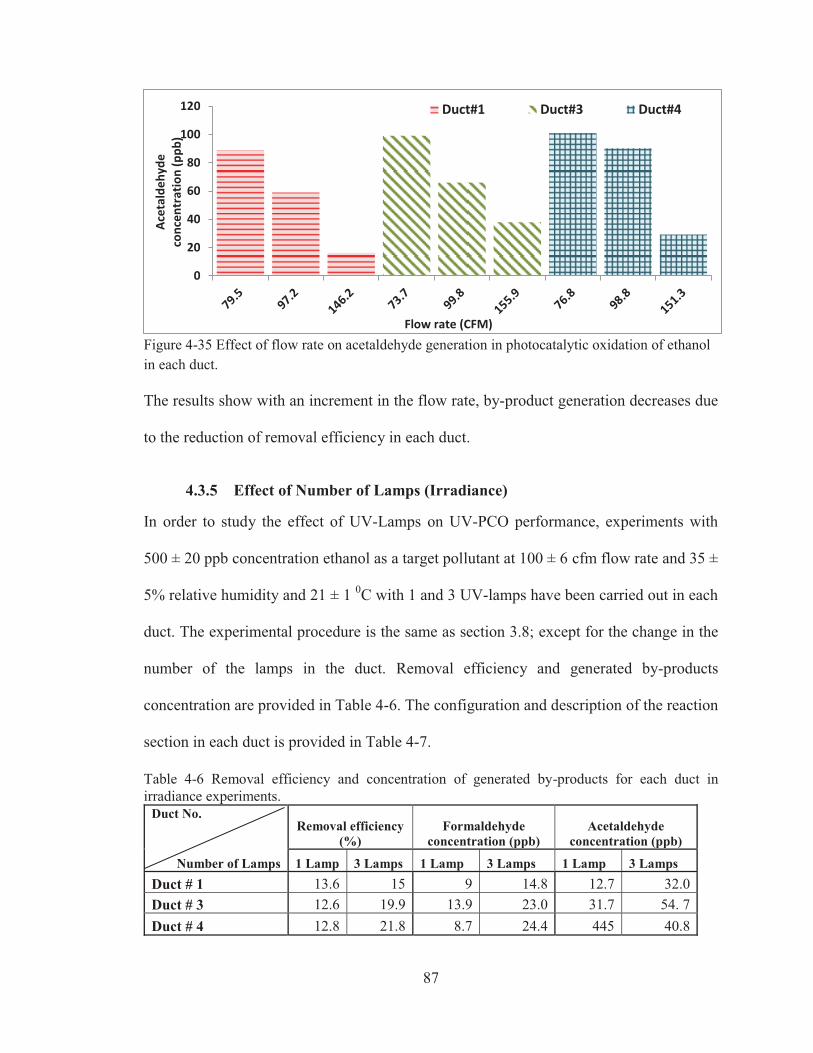
87
Figure 4-35 Effect of flow rate on acetaldehyde generation in photocatalytic oxidation of ethanol in each duct.
The results show with an increment in the flow rate, by-product generation decreases due
to the reduction of removal efficiency in each duct.
4.3.5 Effect of Number of Lamps (Irradiance)
In order to study the effect of UV-Lamps on UV-PCO performance, experiments with
500 ± 20 ppb concentration ethanol as a target pollutant at 100 ± 6 cfm flow rate and 35 ±
5% relative humidity and 21 ± 1 0C with 1 and 3 UV-lamps have been carried out in each
duct. The experimental procedure is the same as section 3.8; except for the change in the
number of the lamps in the duct. Removal efficiency and generated by-products
concentration are provided in Table 4-6. The configuration and description of the reaction
section in each duct is provided in Table 4-7.
Table 4-6 Removal efficiency and concentration of generated by-products for each duct in irradiance experiments.
Duct No. Removal efficiency
(%) Formaldehyde
concentration (ppb) Acetaldehyde
concentration (ppb)
Number of Lamps 1 Lamp 3 Lamps 1 Lamp 3 Lamps 1 Lamp 3 Lamps Duct # 1 13.6 15 9 14.8 12.7 32.0 Duct # 3 12.6 19.9 13.9 23.0 31.7 54. 7 Duct # 4 12.8 21.8 8.7 24.4 445 40.8
0
20
40
60
80
100
120
Acet
alde
hyde
co
ncen
trat
ion
(ppb
)
Flow rate (CFM)
Duct#1 Duct#3 Duct#4

88
Removal efficiency increases with the number of UV-Lamps, and consequently by-
product generation increases. The number of UV-lamps in Duct # 1 does not affect the
removal efficiency significantly, while in Duct # 3 and Duct # 4 it is considerable, which
is a sign of the ozone effect on pollutant oxidation.
4.3.6 Removal Efficiency Improvement
Since removal efficiency is one of the basic parameters for evaluation of UV-PCO
technology, improvement of this parameter is of high importance. Therefore, an
experiment with a new configuration based on the described procedure in section 3.8 was
performed. Ethanol concentration in an indoor building is close to 250 ppb. Therefore,
the experiment was carried out at 250 ± 25 ppb concentration at a 100 ± 5 cfm flow rate,
50 ± 5% relative humidity and 21± 2 0C. The configuration and description of the
reaction section are presented in Table 4-8. Removal efficiency and by-products
concentration are provided in Table 4-9.
Table 4-7 Configuration of reaction section in each duct in irradiance experiments. Duct No. 1 Lamp test
configuration 3 Lamps test configuration
Descriptions
Duct # 1
Catalyst substrate A
UVC lamps
Duct # 3
Catalyst substrate A
VUV lamps
Duct # 4
Catalyst substrate B
VUV lamps
Duct # 2 Empty Empty -

89
Table 4-8 Configuration and description of the reaction section in removal efficiency improvement experiment.
Duct No. Reaction section configuration Descriptions
Duct # 1
Catalyst substrate A UVC lamp
Duct # 3
Catalyst substrate A VUV lamps
Duct # 4
Catalyst substrate B VUV lamps
Duct # 2
Empty -
Table 4-9 Removal efficiency and by-products concentration of removal efficiency improvement experiment.
Duct No. Removal efficiency
(%) Formaldehyde
concentration (ppb) Acetaldehyde
concentration (ppb)
Duct # 1 36.3 93. 9 3.6 Duct # 3 37.3 60. 8 0.0 Duct # 4 59.7 50.0 4.3
Experimental results in Table 4-9 demonstrate that this configuration increases the
removal efficiency. Duct # 4 shows a higher removal efficiency and lower by-products
generation compared to other ducts; therefore, catalyst substrate B has a better
performance. Duct # 3 shows the same removal efficiency but lower by-products
generation in comparison with Duct # 1 which means that VUV lamps performance is
better than UVC lamps for pollutants oxidation in UV-PCO technology. Formaldehyde
generation in this configuration is higher than acetaldehyde. Since this compound is one
of the carcinogenic compounds, finding methods for its removal must be considered.

90
CHAPTER 5 CONCLUSIONS AND FUTURE WORK
5.1 SUMMARY
The main objective of this study is to evaluate UV-PCO performance and identify and
quantify possible by-products for different groups of VOCs. Moreover, the impact of
relative humidity, flow rate, number of lamps and UV-PCO reactors on the removal
efficiency and generated by-products concentration using ethanol as a target were
investigated. To fully investigate the UV-PCO performance for mineralization of VOCs,
an open loop mode test rig with four parallel ducts was designed and implemented. Each
duct has a 0.3 m × 0.3 m cross-sectional area. Four groups of VOCs, including alcohol,
alkane, aromatic, and ketones and two compounds from each group were selected:
Ethanol and 1-butanol from alcohols, n-hexane and n-octane from alkanes, toluene and p-
xylene from aromatics and acetone and MEK from ketones. All objectives were achieved
in this study.
Based on collected experimental results, the performance of UV-PCO technology and its
limitations were investigated and discussed. A repeatability test for ethanol was
conducted to examine the reliability of the developed method.
5.2 CONCLUSIONS AND MAJOR FINDINGS
The conclusions of this study are as follows:
� The repeatability of the developed method was verified for ethanol as a target
compound. The results obtained from the repeatability tests with identical conditions
were in agreement.

91
� The extension of the reaction section to three lamps and four catalyst substrates
(three UV-PCO reactors) in ethanol test increased the irradiance and contact with
catalyst and consequently improved the removal performance of the system.
� The removal capacity of the UV-PCO technology decreases if the catalyst is not
activated. For this purpose, after each test the catalyst was activated by emission
of UV-lamps and a flow of fresh air through the duct.
� Based on the experimental data from this study, ozone reacted more with heavier
compounds with a more stable structure. Catalyst substrate A with UVC lamps had
more preference for oxidation of light compounds while catalyst substrate B
performed better for heavier compounds although both of them in the case of ethanol
showed very good performance.
� Both catalyst substrates A and B with UVC and VUV lamps showed low
performance for alkane compounds.
� Generally, catalyst substrate B is better than catalyst substrate A and VUV lamps
are more efficient than UVC lamps
� It was found that among different groups of VOCs, ethanol generates more by-
products, especially acetaldehyde, during photocatalytic oxidation.
� All VOCs had a common behavior when their concentration increased. They all
showed a decrease in removal efficiency and increase in generated by-products
concentration. This phenomenon was due to the fact that when the concentration of
VOCs increases the competition for adsorption on catalyst surface increases and

92
lower amounts of target compounds can reach the catalyst and adsorb UV light for
oxidation, and partial oxidation rate will increase.
� Formaldehyde and acetaldehyde were the major by-products of all VOCs. This
conclusion is in agreement with results reported in previous studies. Environmental
Health Hazard Assessment (OEHHA) has recommended Acute Reference Exposure
Levels (ARELs) of 55 µg/m3 (44 ppb) in 3h for formaldehyde and ARELs of 470
µg/m3 (261 ppb) for acetaldehyde. Therefore, it would be necessary to decrease
generation of these compounds and their level of concentration either by
improvement of UV-PCO technology or combination of this technology with other
technologies.
� In photocatalytic oxidation of 1-butanol, major by-products are butyraldehyde,
formaldehyde, acetaldehyde and propionaldehyde. A negligible amount of
crotonaldehyde was produced only in Duct # 2, Duct # 3 and Duct # 4 with VUV
lamps; while in ethanol degradation only formaldehyde and acetaldehyde were
formed.
� In photocatalytic oxidation of n-hexane other by-products including acetone,
propionaldehyde, butyraldehyde, crotonaldehyde, and hexanal were generated and in
case of n-octane oxidation, generated by-products were acetone crotonaldehyde,
hexanal, and valaraldehyde.
� Formaldehyde, acetaldehyde and crotonaldehyde are the major by-products of
toluene and p-xylene. During photocatalytic oxidation of p-xylene and toluene, some
other by-products including butyraldehyde, tolualdehyde, acetone, valeraldehyde,

93
and dimethylbenzaldehyde were produced. Also benzaldehyde was generated just in
toluene experiments.
� Ethanol degradation and consequently by-products generation decreased when the
flow rate increased. When the flow rate increases, residence time in the reaction part
decreases and therefore, removal efficiency will decrease.
� Generation of some by-products mostly depends on the presence of ozone in the
system; for instance, crotonaldehyde and propionaldehyde mostly were generated in
the presence of O3/UV/TiO2.
� A significant difference was found in ethanol photocatalytic oxidation when the
relative humidity increased. In Duct # 1, 3, and 4 of the UV-PCO system, when the
relative humidity increased, removal efficiency decreased. Increment of water vapor
molecules increases the completion of water and VOC molecules for adsorption on
the catalyst surface. Due to the acidic structure of TiO2 and a stronger desire for
adsorbing water vapor molecules compared to VOCs with less polarity, at higher
relative humidity lower amounts of VOC molecules adsorb on the surface to oxidize,
and removal efficiency decreases. In Duct # 2, removal efficiency increased with
relative humidity which is because of the higher generation of radicals including OH
radicals for oxidization of VOCs.
� Removal efficiency increased with increment of UV-lamps, and consequently by-
products generation increased. Increment of UV-lamps in Duct # 1 did not affect the
removal efficiency significantly while in Duct # 3 and Duct # 4 was considerable
which demonstrates the effect of ozone on pollutant oxidation.

94
5.3 LIMITATIONS OF THE PRESENT STUDY
� Among the VOCs chosen, acetone and 1-butanol were tested in different
concentration compared to the others since acetone showed a lower sensitivity to
B&K and 1-butanol condensates in the tubing which made it impossible to
continue the experiment at the same concentrations of the other compounds.
� One of the difficulties of the system was to have a constant background
concentration of laboratory air. The system was sensitive to the variation in air
ventilation. Therefore, even a slight variation in the pressure influenced the
challenge compound concentration in the duct.
� Catalyst deactivation was one of the concerns which was observed in the
preliminary test. Therefore, the catalyst activation process was needed based on
the previous experiment duration and compound structure (Heavier compounds
need more time to desorb from catalyst surface).
� It was not possible to control the humidity in the laboratory. Therefore,
experiments were done in different days in which relative humidity are almost
equal.
5.4 RECOMMENDATIONS FOR FUTURE WORK
Based on the findings of this study, recommendations for future research on the
application of UV-PCO technology for the removal of indoor VOCs are as follows:

95
� Establishing a standard apparatus for UV-PCO technology, test conditions, test
procedure and reporting format (similar to ASHRAE Std 145.1 for sorbent media)
for catalyst performance evaluation.
� Preparing a VOCs index with removal efficiency and generated by-products,
considering both type and concentration levels with their acceptable levels for
occupants in indoor buildings based on their odors, irritation and health effects.
� Conducting more detailed investigations on mechanisms for generation of
specific compounds that lead to harmful by-products.
� A mathematical model is needed to predict the UV-PCO performance and by-
product concentration for different VOCs based on the flow rate, light intensity,
wavelength, ozone concentration, temperature and relative humidity.
� Performing experiments either on a single or mixture of VOC in each group to
identify possible by-products and study the UV-PCO system.
� Conducting experiments to find the best conditions for less by-product generation
with a high removal efficiency of the target pollutants.
� More investigations on removal of generated by-products using UV-PCO or other
technologies for design of air cleaner with less side effects and a high removal
efficiency for having immune indoor buildings.
� Improvement of the TiO2 catalyst for less deactivation, higher removal efficiency
and the possibility of application under visible light.
96
REFERENCES
ASHRAE. 2011. ASHRAE Std. SPC 145.2: "Method of testing gaseous contaminant air-cleaning devices for removal efficiency", American Society of Heating, Refrigerating and Air-Conditioning Engineers, Inc. ASHRAE. 2008. ASHRAE Std. 145.1: "Laboratory test method of assessing the performance of gas-phase air cleaning media", American Society of Heating, Refrigerating and Air-Conditioning Engineers, Inc. ASHRAE Handbook, Chapter 28, Air Cleaners for Particulate Contaminants. Heating, Ventilating, and Air-Conditioning: Systems and Equipment: 2008. American Society of Heating, Refrigerating and Air-Conditioning Engineers, Inc. Alberici, R.M. and Jardim, W.F. 1997. "Photocatalytic destruction of VOCs in the gas-phase using titanium dioxide." Applied Catalysis B: Environmental 14:55-68. Amama, P.B., Itoh, K., and Murabayashi, M. 2004. "Photocatalytic degradation of trichloroethylene in dry and humid atmospheres: role of gas-phase reactions." Journal of Molecular Catalysis A: Chemical 217:109-115. Anpo, M. and Takeuchi, M. 2003. "The design and development of highly reactive titanium oxide photocatalysts operating under visible light irradiation." Journal of Catalysis 216:505-516. Ao, C.H. and Lee, S.C. 2003. "Enhancement effect of TiO2 immobilized on activated carbon filter for the photodegradation of pollutants at typical indoor air level." Applied Catalysis B: Environmental 44:191-205. Ao, C.H. and Lee, S.C. 2004. "Combination effect of activated carbon with TiO2 for the photodegradation of binary pollutants at typical indoor air level." Journal of Photochemistry and Photobiology A: Chemistry 161:131-140. Avila, P., Bahamonde, A., Blanco, J., Sanchez, B., Cardona, A.I. and Romero, M. 1998. "Gas-phase photo-assisted mineralization of volatile organic compounds by monolithic titania catalysts." Applied Catalysis B: Environmental 17:75-88. Belver, C., Bellod, R., Fuerte, A., and Fernandez-Garcia, M. 2006. "Nitrogen-containing TiO2 photocatalysts: Part 1. Synthesis and solid characterization." Applied Catalysis B: Environmental 65:301-308. Bellu, E. 2007, "Detection, analysis, and photocatalytic destruction of the freshwater taint compound geosmin", Doctoral Thesis, Robert Gordon University. Bhatkhande, D.S., Pan garkar, V.G. and Beenackers, A.A. 2002. "Photocatalytic degradation for environmental

97
applications–a review." Journal of Chemical Technology & Biotechnology 77:102-116. Bhowmick, M. and Semmens, M.J. 1994. "Ultraviolet photooxidation for the destruction of VOCs in air." Water Research 28:2407-2415. Bickley, R.I. and Jayanty, R.K.M. 1974. "Photo-adsorption and photo-catalysis on titanium dioxide surfaces. Photo-adsorption of oxygen and the photocatalyzed oxidation of isopropanol." Faraday Discuss. Chem. Soc. 58:194-204. Birnie, M., Riffat, S., and Gillott, M. 2006a. "Photocatalytic reactors: design for effective air purification." International Journal of Low-Carbon Technologies 1:47. Blount, M.C. and Falconer, J.L. 2001. "Characterization of adsorbed species on TiO2 after photocatalytic oxidation of toluene." Journal of Catalysis 200:21-33. Blount, M.C. and Falconer, J.L. 2002. "Steady-state surface species during toluene photocatalysis." Applied Catalysis B: Environmental 39:39-50. Bouzaza, A., Vallet, C. and Laplanche, A. 2006. "Photocatalytic degradation of some VOCs in the gas phase using an annular flow reactor: Determination of the contribution of mass transfer and chemical reaction steps in the photodegradation process." Journal of Photochemistry and Photobiology A: Chemistry 177:212-217. Brown, S.K, Sim, M.R., Abramson, M.J. and Gray, C.N. 1994. "Concentrations of volatile organic compounds in indoor air–a review." Indoor Air 4:123-134. Buckley, P.T. and Birks, J.W. 1995. "Evaluation of visible-light photolysis of ozone-water cluster molecules as a source of atmospheric hydroxyl radical and hydrogen peroxide." Atmospheric Environment 29:2409-2415. Cao, L., Gao, Z., Suib, S.L., Obee, T.N., Hay, S.O., and Freihaut, J.D. 2000. "Photocatalytic oxidation of toluene on nanoscale TiO2 catalysts: studies of deactivation and regeneration." Journal of Catalysis 196:253-261. Carlier, P., Hannachi, H. and Mouvier, G. 1986. "The chemistry of carbonyl compounds in the atmosphere-A review." Atmospheric Environment (1967) 20:2079-2099. Chang, C.P., Chen, J.N. and Lu, M.C. 2003. "Heterogeneous photocatalytic oxidation of acetone for airpurification by near UV-irradiated titanium dioxide." Journal of Environmental Science & Health Part A 38:1131-1143. Chen, D.H., Ye, X. and Li, K. 2005. "Oxidation of PCE with a UV LED photocatalytic reactor." Chemical engineering & technology 28:95-97. Cheng, M., Brown, S.K. 2003. "VOCs identified in Australian indoor air and product emission environments". Proceedings of National Clean Air Conference: 23–7

98
Newcastle. Chin, P., Yang, L.P., and Ollis, D.F. 2006. "Formaldehyde removal from air via a rotating adsorbent combined with a photocatalyst reactor: Kinetic modeling." Journal of Catalysis 237:29-37. d'Hennezel, O., Pichat, P. and Ollis, D.F. 1998a. "Benzene and toluene gas-phase photocatalytic degradation over H2O and HCL pretreated TiO2: by-products and mechanisms." Journal of Photochemistry and Photobiology A: Chemistry 118:197-204. Demeestere, K., Dewulf, J., and Langenhove, H.V. 2007. "Heterogeneous Photocatalysis as an Advanced Oxidation Process for the Abatement of Chlorinated, Monocyclic Aromatic and Sulfurous Volatile Organic Compounds in Air: State of the Art." Critical Reviews in Environmental Science and Technology 37:489-538. Dibble, L.A. and Raupp, G.B. 1992. "Fluidized-bed photocatalytic oxidation of trichloroethylene in contaminated air streams." Environmental Science & Technology 26:492-495. Doucet, N., Bocquillon, F., Zahraa, O., and Bouchy, M. 2006. "Kinetics of photocatalytic VOCs abatement in a standardized reactor." Chemosphere 65:1188-1196. Einaga, H., Futamura, S. and Ibusuki, T. 2001. "Complete oxidation of benzene in gas phase by platinized titania photocatalysts." Environmental science & technology 35:1880-1884. EPA TO-11a method for carbonyl compounds: http://www.epa.gov/ttn/amtic/files /ambient/airtox/to-11ar.pdf). Frank, S.N. and Allen, J.B. 1977. "Heterogeneous photocatalytic oxidation of cyanide and sulfite in aqueous solutions at semiconductor powders." The Journal of Physical Chemistry 81:1484-1488. Frazer, L. 2001. "Titanium dioxide: Environmental white knight?” Environmental Health Perpectives, 109(4): A174-A177. Fogler, H.S. 2006. Elements of Chemical Reaction Engineering, Fourth Edition, Pearson Education, Inc. Fujishima, A. and Honda, K. 1972. "Electrochemical photolysis of water at a semiconductor electrode." Nature 238:37-38. Gravelle, P.C., Juillet, F., Meriaudeau, P., and Teichner, S.J. 1971. "Surface reactivity of reduced titanium dioxide." Discussions of the Faraday Society 52:140-148. Ginestet, A., Pugnet, D., Rowley, J., Bull, K. and Yeomans, H. 2005. "Development of a new photocatalytic oxidation air filter for aircraft cabin. " Indoor Air 15: 326-334.
99
Hager, S. and Bauer, R. 1999. "Heterogeneous photocatalytic oxidation of organics for air purification by near UV irradiated titanium dioxide." Chemosphere 38:1549-1559. Haghighat, F., Lee, Ch.S., Pant, B., , G., Lakdawala, N. and Bastani, A. 2008. "Evaluation of various activated carbons for air cleaning - Towards design of immune and sustainable buildings." Atmospheric Environment 42:8176-8184. Hegedüs, M., and Dombi, A. 2004a. "Comparative study of heterogeneous photocatalytic decomposition of tetrachloroethene and trichloroethene in the gas phase." Applied Catalysis A: General 271:177-184. Hoffmann, M.R., Martin, S.T., Choi, W.Y. and Bahnemann, D.W. 1995. "Environmental applications of semiconductor photocatalysis." Chemical Reviews 95:69-96. Hodgson, A.T. and Levin, H. 2003. "Volatile organic compounds in indoor air – a review of concentrations measured in north American since 1990". Lawrence Berkeley National Laboratory (LBNL), No.51715. Hodgson, A.T., Sullivan, D.P, and Fisk, W.J. 2005a. "Evaluation of ultra-violet photocatalytic oxidation (UV-PCO) for indoor air applications: conversion of volatile organic compounds at low part-per-billion concentrations". Lawrence Berkeley National Laboratory (LBNL) Report, No. 58936. Hodgson, A.T., Sullivan, D.P. and Fisk, W.J. 2005b. “Parametric evaluation of an innovative ultra-violet photocatalytic oxidation (UVPCO) air cleaning technology for indoor applications.” Lawrence Berkeley National Laboratory (LBNL) Report, No. 59074. Hodgson, A.T. and Levin, H. 2003. "Volatile organic compounds in indoor air: a review of concentrations measured in North America since 1990, Lawrence Berkeley National Laboratory (LBNL) Report, No. 51715. Hung, Ch.H. and Marifas, B.J. 1997a. "Role of chlorine and oxygen in the photocatalytic degradation of trichloroethylene vapor on TiO2 films." Environmental Science & Technology 31:562-568. Hugo I.D.L., Salaices, M., Serrano, B. 2005. "Photocatalytic reaction engineering". Springer-Verlag New York Inc., 110-150. International Organization for Standardization. 1992. Water quality: evaluation of the aerobic biodegradability of organic compounds in an aqueous medium: semi-continious activated sludge method (SCAS) = Qualite de l'eau : evaluation, en milieu aqueux, de la biodegradabilite aerobie des composes organiques : methode semi-continue par boues activees (Methode SCAS). [Geneva]: ISO. Jacoby, W.A., Blake, D.M., Fennell, J.A., Boulter, J.E., Vargo, L.M., George, M.C. and

100
Dolberg, S.K. 1996. "Heterogeneous photocatalysis for control of volatile organic compounds in indoor air." Journal of the Air & Waste Management Association 46:891-898. Jeong, J., Sekiguchi, K. and Sakamoto, K. 2004. "Photochemical and photocatalytic degradation of gaseous toluene using short-wavelength UV irradiation with TiO2 catalyst: comparison of three UV sources." Chemosphere 57:663-671. Kim, S.B., Hwang, H.T. and Hong, S.C. 2002. "Photocatalytic degradation of volatile organic compounds at the gas-solid interface of a TiO2 photocatalyst." Chemosphere 48:437-444. Kim, S.B., and Hong, S.C. 2002. "Kinetic study for photocatalytic degradation of volatile organic compounds in air using thin film TiO2 photocatalyst." Applied Catalysis B: Environmental 35:305-315. Kittrell, J.R., Dupre, C.R., and Gerrish, D.A. 2006. "Advances in photocatalytic remediation technology." Remediation Journal 16:81-91. Larson, S.A. and Falconer, J.L. 1997. "Initial reaction steps in photocatalytic oxidation of aromatics." Catalysis letters 44:57-65. Lam, Ch.W. 2007. “Development of photocatalytic oxidation technology for purification of air and water." Thesis for the degree of Master of Philosophy at the University of Hong Kong. Li, X.Z., Li, F.B., Xie, Y.B., 2005. "Photocatalytic oxidation using lanthanide ion-doped titanium dioxide catalysts for water and wastewater treatment." Trends in Water Pollution Research, 31–74. Lichtin, NN, Avudaithai, M., Berman, E. and Grayfer, A. 1996. "TiO2-photocatalyzed oxidative degradation of binary mixtures of vaporized organic compounds." Solar energy 56:377-385. Linsebigler, A.L., Lu, G. and Yates, J.T. 1995. "Photocatalysis on TiO2 surfaces: principles, mechanisms, and selected results." Chemical Reviews 95:735-758. Ma, C.M. and Ku, Y. 2006. "Photocatalytic oxidation of gaseous trichloroethylene by UV/TiO 2 process." Reaction Kinetics and Catalysis Letters 89:293-301. Menzies, D., Pasztor, J., Rand, T., and Bourbeau, J. 1999. "Germicidal ultraviolet irradiation in air-conditioning systems: effect on office worker health and wellbeing: A pilot study." Occupational and Environmental Medicine. 56: 397-402. Minnesota Department of Health. 2009. "Volatile organic compounds (VOCs) in your home". Retrieved 02/20, 2009, from http://www.health.state.mn.us/divs/eh/indoorair/voc/

101
Mo, J., Zhang, Y., Xu, Q., Lamson, J.J., and Zhao, R. 2009. "Photocatalytic purification of volatile organic compounds in indoor air: A literature review." Atmospheric Environment 43:2229-2246. Muggli, D.S., Ding, L. and Odland, M.J. 2002a. "Improved catalyst for photocatalytic oxidation of acetaldehyde above room temperature." Catalysis Letters 78:23-31. Nimlos, M.R., Jacoby, W.A., Blake, D.M. and Milne, T.A. 1993. "Direct mass spectrometric studies of the destruction of hazardous wastes. 2. Gas-phase photocatalytic oxidation of trichloroethylene over titanium oxide: products and mechanisms." Environmental Science & Technology 27:732-740. Obee, T.N. and Hay, S.O. 1997. "Effects of moisture and temperature on the photooxidation of ethylene on titania." Environmental science & technology 31:2034-2038. Ohko, Y., Fujishima, A. and Hashimoto. K. 1998. "Kinetic analysis of the photocatalytic degradation of gas-phase 2-pmpanoi under mass transport-limited conditions with a Ti02 film photocatalyst, " The Journal of Physical Chemistry. B 102:1724-1729. Office of Environmental Health Hazard Assessment (OEHHA):http://oehha.ca.gov/tcdb/ index .asp Pengyi, Z., Fuyan, L., Gang, Y., Qing, C. and Wanpeng, Z. 2003. "A comparative study on decomposition of gaseous toluene by O3/UV, TiO2/UV and O3/TiO2/UV." Journal of Photochemistry and Photobiology A: Chemistry 156:189-194. Peral, J., Domènech, X., and Ollis, D.F. 1997. "Heterogeneous photocatalysis for purification, decontamination and deodorization of air." Journal of Chemical Technology & Biotechnology 70:117-140. Peral, J. and Ollis, D.F. 1997a. "TiO2 photocatalyst deactivation by gas-phase oxidation of heteroatom organics." Journal of Molecular Catalysis A: Chemical 115:347-354. Piera, E., Ayllón, J.A., Doménech, X. and Peral, J. 2002. "TiO2 deactivation during gas-phase photocatalytic oxidation of ethanol." Catalysis Today 76:259-270. Raupp, G.B., Nico, J.A., Annangi, S., Changrani, R., and Annapragada, R. 1997. "Two flux radiation field model for an annular packed bed photocatalytic oxidation reactor." AIChE Journal 43:792-801. Ray, M.B. 2000. "Photodegradation of the volatile organic compounds in the gas phase: a review." Department of Chemical and Environmental Engineering, The National University of Singapore, 405-439. Sattler, M.L. and Liljestrand, H.M. 2003. "Method for predicting photocatalytic oxidation rates of organic compounds." Journal of the Air & Waste Management Association 53:3-

102
12. Shen, Y. S. and Ku, Y. 2002. "Decomposition of gas-phase trichloroethene by the UV/TiO2 process in the presence of ozone." Chemosphere 46:101-107. Sánchez, B., Cardona, A.I., Romero, M., Avila, P. and Bahamonde, A. 1999. "Influence of temperature on gas-phase photo-assisted mineralization of TCE using tubular and monolithic catalysts." Catalysis Today 54:369-377. Sun, Y.X., Fang, L., Wyon, D.P., Wisthaler, A., Lagercrantz, L., and Tejsen, P.S. 2005. “Experimental research on photocatalytic oxidation air purification technology applied to aircraft cabins”, Proceedings of Indoor Air 2005 Conference. Teichner, S.J. and Formenti, M. 1985. "Heterogeneous photocatalysis in photoelectrochemistry,photocatalysis and photoreactors", ed. M. Schiavello. Reidel Publishing Company, 457-89 Thad, G. 2001. "Indoor Environmental Quality". Lewis Publishers. Tompkins, D.T., Lawnicki, B.J., Zeltner, W.A., and Anderson, M.A. 2005. "Evaluation of photocatalysis for gas-phase air cleaning–Part 1: Process, technical and sizing considerations." ASHRAE transactions 111:60-84. U.S. EPA. 2009. An introduction to indoor air quality - organic gases (volatile organic compounds-VOCs). Retrieved 01/28, 2009, from http://www.epa.gov/iaq/voc.html. U.S. EPA. 2007. Residential air cleaning devices. Retrieved 01/03, 2009, from http://www.epa.gov/iaq/pubs/residair.html VanOsdell, D.W. 1994. Evaluation of test methods for determining the effectiveness and capability of gas-phase air filtration equipment for indoor air applications-phase I: literature review and test recommendations. ASHRAE Trans. 100: 511-523 Vorontsov, A.V., Lion, Cl., Savinov, E.N. and Smirniotis, P.G. 2003. "Pathways of photocatalytic gas phase destruction of HD simulant 2-chloroethyl ethyl sulfide." Journal of Catalysis 220:414-423. Vorontsov, A.V., Savinov, E.V., Davydov, L. and Smirniotis, P.G. 2001. "Photocatalytic destruction of gaseous diethyl sulfide over TiO2." Applied Catalysis B: Environmental 32:11-24. Waki, K., Wang, L., Nohara, K. and Hidaka, H. 1995. "Photocatalyzed mineralization of nitrogen-containing compounds at TiO2/H2O interfaces." Journal of Molecular Catalysis A: Chemical 95:53-59. Wang, K.H., Hsieh, Y.H., Lin, C.H., and Chung, C.Y. 1999. "The study of the photocatalytic degradation kinetics for dichloroethylene in vapor phase." Chemosphere

103
39:1371-1384. Wang, S., Ang, H.M. and Tade, M.O. 2007. "Volatile organic compounds in indoor environment and photocatalytic oxidation: state of the art." Environment international 33:694-705. Wang, W., Chiang, L.W. and Ku, Y. 2003. "Decomposition of benzene in air streams by UV/TiO2 process." Journal of hazardous materials 101:133-146. Wekhof, A. 1991. "Treatment of Contaminated Water, Air and Soil with UV Flashlamps." Environmental Progress lO 4: 241-247. Xu, W. and Raftery, D. 2001. "In situ solid-state nuclear magnetic resonance studies of acetone photocatalytic oxidation on titanium oxide surfaces." Journal of Catalysis 204:110-117. Xu, Y. and Schoonen, M.A.A. 2000. "The absolute energy positions of conduction and valence bands of selected semiconducting minerals." American Mineralogist 85:543. Yamashita, H., Anpo, M., 2004. "Application of an ion beam technique for the design of visible light-sensitive, highly efficient and highly selective photocatalysts: ion-implantation and ionized cluster beam methods. " Catalysis surveys from Asia 8: 35-45. Yung-Shuen, S. and Young, K. 1998. "Decomposition of gas-phase chloroethenes by UV/O3 process", Water . Resources, 32(9): 2669-2679. Ye, X., Chen, D., Gossage, J. and Li, K. 2006. "Photocatalytic oxidation of aldehydes: Byproduct identification and reaction pathway." Journal of Photochemistry and Photobiology A: Chemistry 183:35-40. Zhang, Y., Yang, R. and Zhao, R. 2003. "A model for analyzing the performance of photocatalytic air cleaner in removing volatile organic compounds." Atmospheric Environment 37:3395-3399. Zhong, L., Haghighat, F., Blondeau, P., and Kozinski, J. 2010a. "Modeling and physical interpretation of photocatalytic oxidation efficiency in indoor air applications." Building and Environment 45:2689-2697. Zhou, L., Zhu, B. 2006."Oxidation processes for degradation of organic pollutants in water, literature review" Report for Smart Water Project, Institute of Sustainability and Innovation Victoria University.

104 A
ppendix A: VO
Cs Injection R
ate Calculation U
sing Syringe System Injection
Com
pound N
ame
C (ppb)
C (ppm
) M
w
(g/mole)
T (k)
Factor
(kg/m3)
C
(mg/m
3) D
(g/m
l) D
(m
g/ul) C
(ul/m
3)
Q in
duct (f 3/m
in) Q
(m
3/min)
Injection rate (ul/m
in)
Toluene 1000
1 92.14
296.15 3.79
3.79 0.867
0.867 4.37
400 11.33
49.54 500
0.5 92.14
296.15 3.79
1.90 0.867
0.867 2.19
400 11.33
24.77 250
0.25 92.14
296.15 3.79
0.95 0.867
0.867 1.09
400 11.33
12.38
p-Xylene
1000 1
106.16 296.15
4.37 4.37
0.866 0.866
5.04 400
11.33 57.14
500 0.5
106.16 296.15
4.37 2.18
0.866 0.866
2.52 400
11.33 28.57
250 0.25
106.16 296.15
4.37 1.09
0.866 0.866
1.26 400
11.33 14.29
n-Hexane
1000 1
86.18 296.15
3.55 3.55
0.656 0.656
5.41 400
11.33 61.24
500 0.5
86.18 296.15
3.55 1.77
0.656 0.656
2.70 400
11.33 30.62
250 0.25
86.18 296.15
3.55 0.89
0.656 0.656
1.35 400
11.33 15.31
n-Octane
1000 1
114.23 296.15
4.70 4.70
0.703 0.703
6.69 400
11.33 75.74
500 0.5
114.23 296.15
4.70 2.35
0.703 0.703
3.34 400
11.33 37.87
250 0.25
114.23 296.15
4.70 1.18
0.703 0.703
1.67 400
11.33 18.93
Butanone (M
EK)
1000 1
72.11 296.15
2.97 2.97
0.8 0.8
3.71 400
11.33 42.02
500 0.5
72.11 296.15
2.97 1.48
0.8 0.8
1.85 400
11.33 21.01
250 0.25
72.11 296.15
2.97 0.74
0.8 0.8
0.93 400
11.33 10.50
Acetone
2000 2
58.08 296.15
2.39 4.78
0.788 0.788
6.07 400
11.33 68.71
1000 1
58.08 296.15
2.39 2.39
0.788 0.788
3.03 400
11.33 34.36
500 0.5
58.08 296.15
2.39 1.20
0.788 0.788
1.52 400
11.33 17.18
Ethanol
1000 1
46.07 296.15
1.90 1.90
0.785 0.785
2.42 400
11.33 27.36
500 0.5
46.07 296.15
1.90 0.95
0.785 0.785
1.21 400
11.33 13.68
250 0.25
46.07 296.15
1.90 0.47
0.785 0.785
0.60 400
11.33 6.84
1-Butanol
800 0.8
74.12 296.15
3.05 2.44
0.808 0.808
3.02 400
11.33 34.21
500 0.5
74.12 296.15
3.05 1.53
0.808 0.808
1.89 400
11.33 21.38
250 0.25
74.12 296.15
3.05 0.76
0.808 0.808
0.94 400
11.33 10.7
C: C
oncentration, Mw
: Molecular w
eight, T: Temperature, D
: Density, Q
: Flow rate.

105
Appendix B: HPLC and B&K Calibration Equations
B&K Calibration Equations:
Toluene: y=1.1501x - 1.1658 p-Xylene: y=0.6533x - 0.4847
n-Hexane: y=0.1668x - 0.1708 n-Octane: y=0.1322x - 0.0867
Ethanol: y=0.5124x - 0.4817 1-Butanol: y=0.2684x - 0.2851
Acetone: y=2.0547x - 1.84 MEK: y=0.7316x - 0.7727
x: B&K Respond y: Actual Concentration (ppm)
HPLC Calibration Curves:
Formaldehyde: y=2.90× 10-05x - 0.4393 Acetaldehyde: y=3.86× 10-05x - 0.6429
Acrolein: y=3.41× 10-05x + 1.9120 Acetone: y=6.26× 10-05x - 5.6148
Propionaldehyde: y=5.34× 10-05x - 1.6360 Crotonaldehyde: y=5.62× 10-05x - 0.4802
Butyraldehyde: y=5.98× 10-05x + 1.2372 Benzaldehyde: y=8.28× 10-05x - 0.5071
Isovaleraldehyde: y=6.97× 10-05x + 0.1900 Valeraldehyde: y=7.01× 10-05x + 2.3971
o-Tolualdehyde: y=9.56× 10-05 x + 0.6782 m-Tolualdehyde: y=9.41× 10-05x + 0.5761
p-Tolualdehyde: y=1.12× 10-05x - 4.3515 Hexanal: y=4.76× 10-05x - 0.5020
Dimethylbenzaldehyde: y=4.76× 10-05x - 0.2702
x: HPLC Respond y: Compound Mass(ng)

106
Appendix C
: Ozone C
oncentration in Dow
nstream of D
ucts
Section in
Thesis
Test N
ame
Target C
ompound
&
Ozone
Concentration
Duct N
o.
Duct#1 or U
pstream
Duct#2
Duct#3
Duct#4
4.2.1 E
thanol C
oncentration T
est
Ethanol
concentration(ppb) 293.29
462.78 966.24
320.95 466.25
761.89 293.17
469.03 734.88
283.77 472.26
1017.97
Ozone
concentration(ppb) 15.59
21.57 21.14
2065.85 1999.51
2047.61 1180.92
1111.16 1110.93
1262.95 1268.29
1267.15
4.2.1 1-B
utanol C
oncentration T
est
1-Butanol
concentration(ppb) 217.48
492.07 743.71
203.11 484.69
746.75 223.62
492.39 767.24
226.46 503.70
749.79
Ozone
concentration(ppb) 20.00
22.91 23.87
687.34 720.64
712.77 1032.74
1060.03 1110.93
1390.96 1396.53
1393.17
4.2.2 n-H
exane C
oncentration T
est
n-Hexane
concentration(ppb) 278.15
520.40 1072.60
251.28 494.56
1060.85 252.04
493.66 999.56
264.42 533.58
1134.39
Ozone
concentration(ppb) 6.91
19.67 21.03
648.05 709.88
693.43 995.53
1053.18 990.95
1312.24 1322.78
1300.48
4.2.2 n-O
ctane C
oncentration T
est
n-Octane
concentration(ppb) 237.85
423.70 879.38
218.76 398.14
784.33 221.36
391.53 834.28
237.64 398.36
816.94
Ozone
concentration(ppb) 19.18
22.86 24.39
706.76 743.55
710.37 927.33
975.09 931.72
1340.51 1326.32
1332.10
4.2.3 A
cetone C
oncentration T
est
Acetone
concentration(ppb) 623.09
1017.96 2869.24
525.44 989.68
3306.93 664.70
967.67 2918.30
642.95 1022.58
3441.76
Ozone
concentration(ppb) 16.92
22.24 27.85
614.90 628.32
638.46 939.61
1063.47 976.71
1192.76 1191.46
1255.91
4.2.3 M
EK
Concentration
Test
MEK
concentration(ppb)
286.49 451.40
1189.28 317.20
424.22 1180.62
331.62 405.28
1245.62 355.56
432.43 1254.94
Ozone
concentration(ppb) 17.11
19.63 22.29
806.21 766.34
790.25 991.99
952.93 971.81
1428.15 1409.10
1399.60
4.2.4 T
oluene C
oncentration T
est
Toluene
concentration(ppb) 356.53
461.00 977.59
450.18 483.04
980.46 353.98
493.58 881.60
325.44 458.69
1072.69
Ozone
concentration(ppb) 16.36
26.27 33.62
500.61 486.39
490.83 1102.82
1070.76 1114.69
1068.41 1053.39
1060.07
4.2.4 p-X
ylene C
oncentration T
est
p-Xylene
concentration(ppb) 278.74
513.68 1096.82
269.60 483.94
1027.36 261.88
483.94 945.90
243.35 507.11
1033.09
Ozone
concentration(ppb) 22.83
27.96 43.92
757.49 709.68
681.89 1126.76
1055.84 1003.17
1286.90 1257.89
1149.26

107
Section in
Thesis
Test N
ame
Target C
ompound &
O
zone Concentration
Duct N
o. D
uct#1 or U
pstream
Duct#2
Duct#3
Duct#4
4.3.1 R
epeatability T
est
Ethanol concentration(ppb)
500.00
Ozone concentration(ppb)
Test 4 A
pril 12 23.57
2188.13 2381.48
1055.43
Ozone concentration(ppb)
Test 7 M
ay 12 21.57
1999.51 1111.16
1268.29
Section in Thesis
Test N
ame
Target C
ompound
Duct N
o. R
elative Hum
idity (%)
Ozone concentration
(ppb)
4.3.3 E
ffect of Relative
Hum
idity Ethanol 500 ppb
Duct#1 or
Upstream
9 20.60
15 23.57
20 13.16
42 13.88
60 38.42
Duct#2
9 2248.84
15 2188.13
20 2014.29
30 516.44
42 760.75
Duct#3
9 2368.83
15 2381.48
30 1322.99
42 1018.40
60 904.43
Duct#4
9 1015.85
15 1055.43
30 1117.75
42 1439.71
60 1076.50

108
Section in T
hesis T
est Nam
e T
arget C
ompound
Duct N
o. Flow
Rate (cfm
) O
zone concentration (ppb)
4.3.4 Effect
of Flow
Rate
Ethanol
500 ppb
Duct#1 or
Upstream
49.2 14.50
79.5 12.44
97.17 19.80
111.2 20.00
146.24 20.63
Duct#3
38.9 4318.80
73.7 2379.45
98.57 1322.99
99.82 1098.60
155.92 837.36
Duct#4
23.7 9926.80
46.6 3864.50
76.82 1657.52
98.77 1117.75
151.32 1327.73
Section
in T
hesis T
est Nam
e T
arget Com
pound &
Ozone C
oncentration D
uct No.
4.3.5 E
ffect of N
umber of
UV
-Lam
ps
Ethanol concentration(ppb)
500
Duct N
o. D
uct#1 or Upstream
D
uct#3 D
uct#4
Num
ber of Lam
ps 3 L
amps
1Lam
ps 3 L
amps
1Lam
ps 3 L
amps
1Lam
ps
Ozone concentration(ppb)
17.45 15.33
2185.91 917.46
1710.79 511.54
4.3.6 E
fficiency Im
provement
Ethanol concentration(ppb)
250
Duct N
o. D
uct#1 or Upstream
D
uct#3 D
uct#4
Num
ber of Lam
ps 3
3 3
Ozone concentration(ppb)
8.08 5835.16
2183.60

109
Appendix D: Light Intensity of the UV-lamps in Catalyst Surface For measuring light intensity of the UV-lamps in UV-PCO system, 254 nm and 185 nm
wavelength sensors were applied. Two UV-lamps together were measured since in each
UV-PCO reactor two lamps were installed. Light intensity was measured 2 inched away
the lamps for 10 minutes and average of the reading in different point of the catalyst
surface was taken as that point adsorbed light intensity.
1 2 3 4 5 6 7 8 9
Light intensity measured by 254 nm wavelength sensor 2 inches away from the lamps in catalyst surface
place (mW/cm2)
Point
1 Point
2 Point
3 Point
4 Point
5 Point
6 Point
7 Point
8 Point
9 Average of all points
Duct # 1 0.195 0.131 0.195 7.66 4.04 5.99 3.36 2.06 2.02 2.850 Duct # 3 0.713 0.118 0.343 7.6 3.28 8.08 2.39 1.71 3.8 3.115 Duct # 4 0.378 0.125 0.382 6.33 3.97 7.68 4.2 2.1 3.24 3.156
Light intensity measured by 185nm wavelength sensor 2 inches away from the lamps in catalyst
surface place (mW/cm2)
Duct No. Average of all points Duct # 1 - Duct # 3 0.88 Duct # 4 0.99