does edtech substitute for traditional learning ...movement to higher isoquants) is due to input...
TRANSCRIPT

March, 2020
Working Paper No. 20-010
DOES EDTECH SUBSTITUTE FOR TRADITIONAL LEARNING?
EXPERIMENTAL ESTIMATES OF THE EDUCATIONAL PRODUCTION FUNCTION
Eric Bettinger Stanford University
& NBER
Robert Fairlie University of California,
Santa Cruz & NBER
Anastasia Kapuza National Research University Higher School of Economics
Elena Kardanova National Research University Higher School of Economics
Prashant Loyalka
Stanford University
Andrey Zakharov National Research University Higher School of Economics

Does EdTech Substitute for Traditional Learning? Experimental
Estimates of the Educational Production Function
Eric Bettinger, Robert Fairlie, Anastasia Kapuza, Elena Kardanova, Prashant Loyalka, and Andrey Zakharov1
March 31, 2020
Abstract
Experimental studies rarely consider the shape and nature of the education production function, which is useful for deriving optimal levels of input substitution in increasingly resource constrained environments. Because of the rapid expansion of EdTech as a substitute for traditional learning around the world and against the backdrop of full-scale temporary substitution due to the coronavirus pandemic, we explore the educational production function by using a large randomized controlled trial that varies dosage of computer-assisted learning (CAL) as a substitute for traditional learning. Results show production is concave in CAL. Moving from zero to a low level of CAL, the marginal rate of technical substitution (MRTS) of CAL for traditional learning is greater than one. Moving from a lower to a higher level of CAL, production remains on the same or a lower isoquant and the MRTS is equal to or less than one. The estimates are consistent with the general form of a Cobb-Douglas production function and imply that a blended approach of CAL and traditional learning is optimal. The findings have direct implications for the rapidly expanding use of educational technology worldwide and its continued substitution for traditional learning.
Keywords: education production, randomized experiment, computer-assisted learning, EdTech, ICT, student learning
JEL Codes: I21, O15
1 Bettinger: Stanford University, CERAS Room 522, 520 Galvez Mall, Stanford CA 94305 and NBER ([email protected]). Fairlie: University of California, Department of Economics, Santa Cruz, CA 95064 and NBER (email: [email protected]); Kapuza: National Research University Higher School of Economics, Moscow, Russia (e-mail: [email protected]); Kardanova: National Research University Higher School of Economics, Moscow, Russia (e-mail: [email protected]); Loyalka: Stanford University, Encina Hall East Wing Room 413, 616 Serra St., Stanford, CA 94305 (email: [email protected]); Zakharov: National Research University Higher School of Economics, Moscow, Russia (e-mail:[email protected]). We would like to thank Yandex Inc. for data and support for the study. We thank Natalia Lazzati, Jesse Li and Jon Robinson, and seminar participants at UC Berkeley for comments and suggestions. The study was pre-registered at the AEA RCT registry prior to endline data collection. The article was prepared within the framework of the HSE University Basic Research Program and funded by the Russian Academic Excellence Project '5-100'.

2
1 Introduction
Numerous educational interventions have been used to improve academic achievement and
increase human capital among schoolchildren in developing countries. Among these interventions,
technology-based interventions have shown promise relative to other popular interventions such
as teacher training, smaller classes, and performance incentives (McEwan 2014). It has been
argued that EdTech, such as computer-assisted learning (CAL), can offset deficiencies that
commonly plague schools, such as low teacher quality, high rates of teacher and student
absenteeism, low levels of student motivation, and many students being below grade level, among
others (World Bank 2018; Economist 2018; Brookings 2019). These arguments are consistent with
the rapid substitution of EdTech for traditional teaching methods and explosion of expenditures
on EdTech throughout the world. More recently, a whole-scale temporary substitution from
traditional learning to EdTech has resulted in response to the coronavirus outbreak (COVID-19).
A review of the literature reveals, however, that there is substantial heterogeneity in
findings on the effectiveness of CAL ranging from null effects to extremely large positive effects.2
To gain insight into this heterogeneity and place some structure on estimates, we design and
implement a randomized controlled trial (RCT) involving approximately 6,000 grade 3 students in
343 classes (one per school) from two regions in Russia.3 The RCT includes three treatment arms:
i) CAL for 45 minutes per week, ii) a “double dosage” CAL for 90 minutes per week, and iii) a
control that receives no CAL. Estimates of the two treatment effects allow us to trace out the
general shape of the educational production function in CAL. Importantly, CAL use was directly
substituted for traditional learning, avoiding problems associated with identifying separate
technology versus increased learning time effects (Yue et al. 2019).
Although extant evidence is from field experiments, heterogeneity in results may stem from
curvature in the production function, variation in input substitution, and the educational setting.
The focus in the previous literature on estimating the average productivity of CAL for a fixed
2 Studies of the effects of computer assisted learning (CAL) on educational outcomes include Banerjee et al. 2007; Linden 2008; Carillo et al. 2011; Lai et al. 2013, 2015; Mo et al. 2014; Muralidharan et al. 2019; Rouse and Krueger 2004; Dynarski et al. 2007; Barrow et al. 2009; Campuzano et al. 2009; Rockoff 2015; Falck, Mang, and Woessmann 2018. See Glewwe et al. (2013), Bulman and Fairlie (2016), andEscueta (2017) for recent reviews of the literature. 3 With a GDP per capita of 10,743 current US dollars in 2017, Russia is classified as a developing country (World Bank Database 2019). Russia’s GDP per capita in current US dollars is just below Costa Rica (11,677 US dollars), and Maldives (11,151 US dollars) and just above Brazil (9,821 US dollars), China (8,827 US dollars), and Mexico (8,910 US dollars). The two regions where the experiment is conducted, Altai Krai (93 schools) and Novosibirsk (250 schools), have GDP per capita below the national average (OECD 2019 Database).
3
amount of time on CAL provides only limited evidence on the shape of the educational production
function. It does not provide information relevant to important questions regarding concavity in
the production function, input substitutability, and whether the marginal rate of technical
substitution (MRTS) changes with CAL levels, which are essential for advancing the discussion
from program evaluation to underlying fundamentals. In fact, surprisingly, there is a dearth of
evidence in the previous literature on the productivity and substitutability of any input in the
educational production function.4 Another problem is that evaluating only one level of treatment
intensity could be misleading if the level chosen for the experiment is too low or too high relative
to other substitutable inputs. In either case, production might be constrained to a relatively low
isoquant and thus be suboptimal (see Figure 1). Unfortunately, similar to many other inputs in
educational production, theory provides only limited guidance on optimal levels.
This study is the first to discern how the effects of CAL change exogenously with respect
to usage levels within the same educational setting.5 It is the first to estimate the general shape of
the educational production function in CAL and shed light on broad classifications of functional
forms (i.e. Leontief, Cobb-Douglas, or linear). Our study is also one of the only studies that
evaluates the CAL input in educational production as a direct substitute for traditional learning
instead of being provided as a supplemental after-school program, which likely influences impact
estimates. 6 Examining the role of CAL as a direct substitute for traditional learning is also
important as countries increasingly mandate limitations on time children spend in after-school
programs and on homework.7 Finally, and perhaps most importantly, direct substitution between
4 For example, the one-to-one laptop or home computer programs that have been previously studied do not structure or exogenously determine time use, which is needed to study marginal productivity or input substitutability (e.g. Fairlie and Robinson 2013; Beuermann et al. 2015; Cristia et al. 2017; Hull 2019). On the other hand, the extensive literature on class size effects implicitly estimates an approximate marginal productivity of teacher effort in educational production (e.g. Hanushek 1986; Hoxby 2000). 5 Hypothetically, a meta-analysis using estimates from previous studies could be used to trace out a production function, but the CAL programs used in these studies differ by more than usage time (e.g. substitution vs. supplemental program, country, student preparation, grade level, and the presence of additional instructional support). Thus, we cannot assume that estimates from various studies lie on the same production function. 6 For the less common use of CAL as a direct substitute for regular teacher instruction in the classroom, the evidence tends to show null effects (Dynarski et al. 2007, Campuzano et al. 2009; Linden 2008; Barrow et al. 2009; Carillo et al. 2011). However, this might depend on how computers are used (Falck, Mang, and Woessmann 2018). Yue et al. (2019) further show that supplemental time on CAL does not significantly improve student achievement over supplemental time on a content-equivalent workbook intervention, and Muralidharan et al. (2019) find evidence of large positive effects of their after-school program that included computer instruction compared to the null effects found in a similar after-school program in India without computer instruction (Berry and Mukherjee 2016). 7 Policies to reduce time on homework exist, for example, in China (MOE, 2018), France (MNE, 2019), and Russia (SanPiN, 2010).
4
the two inputs in the field experiment ensures that any changes in educational production (i.e.
movement to higher isoquants) is due to input substitution and not higher inputs. Isolating these
effects provides more guidance on the shape of isoquants and thus whether and how the MRTS
changes with the level of CAL.
We find positive effects of CAL on math test scores at the base dosage level. Doubling the
amount of CAL input, we find similar effect sizes relative to the control. We find evidence that
the educational production function is concave in CAL. Moving from zero to the base level of
CAL, the marginal rate of technical substitution (MRTS) of CAL for traditional learning is greater
than one. But, moving from the base level of CAL to the higher level of CAL, production remains
on the same isoquant and MRTS is equal to one. We can rule out several general functional forms
of the educational production function in CAL, but we find some support for a Cobb-Douglas
production function with a higher factor return on CAL than traditional learning. CAL and
traditional learning do not appear to be perfect substitutes.
For impacts on less-studied language achievement, we find positive effects of CAL at the
base level, but much stronger concavity in the production function. We find an MRTS that is
greater than one when moving from zero to the base level of CAL, but a shift to a lower isoquant
moving from the base level of CAL to the higher level and thus an MRTS that is less than one. For
language, we find some support for a Cobb-Douglas production with equal factor returns. These
general characteristics and shape of the production function for math and language in CAL do not
differ when we shift the focus from mean impacts to impacts throughout the distribution (i.e.
quantile treatment effects).
The findings from this analysis are important for understanding the optimal investment in
CAL relative to traditional learning. Identifying optimal levels of investment in CAL is especially
important as governments, schools and families are currently investing heavily in EdTech and
likely to increase expenditures in the future. The global EdTech industry is projected to grow to
more than $250 billion by 2020 and $340 billion by 2025 (Escueta et al. 2017). This is especially
true for the rapidly growing use of new technologies and their substitution for traditional learning
methods in educating schoolchildren in developing countries. Our findings suggest that CAL
improves academic achievement, but that substituting too heavily into EdTech might be a mistake
because production appears to have a strong diminishing marginal rate of technical substitution.
5
2 Research Design 2.1 Field Experiment To explore the shape and nature of the educational production function in CAL, we design and
implement an RCT involving approximately 6,000 third grade schoolchildren in 343
classes/schools in two provinces of Russia. The RCT includes three treatment arms: an “X” dosage
CAL arm where students receive 10 items per subject using the software, which (as communicated
to the treatment group) is approximately 20-25 minutes per week of math CAL and 20-25 minutes
of (Russian) language CAL; a “2X” dosage CAL arm in which (as communicated to the treatment
group) students receive 20 items per subject which is approximately 40-50 minutes of math CAL
and 40-50 minutes of language CAL; and a control arm.8 With this design, we can trace out three
points along the educational production function in CAL.
The field experiment is conducted among primary schools in Russia. Specifically, 343
schools from 2 regions were sampled to participate in the experiment. In each school, one third
grade class was sampled, and each class has an average of 18.3 students per class. For each third
grade class there is one teacher that teaches both math and language. Altogether, 6,253 students
and their 343 teachers were sampled and surveyed.
In the second half of October 2018 (near the start of the school year), we conducted a
baseline survey of the sampled students, their teachers and principals. After the baseline survey,
we randomized classes to treatment conditions. Students participated in the treatment from
December 2018 until mid-May 2019. In mid May 2019, the end of the Russian school year, we
administered a follow-up survey with students, teachers, and principals.
2.2 Baseline Survey We administered three baseline surveys to students and teachers. The student survey collected
basic background information such as student gender and time spent on math and language
homework. As part of the baseline survey, we administered exams in four areas: math, language,
reading, vocabulary (math and language achievement were our pre-determined main academic
8 Unfortunately, the company was unable to provide complete data on CAL usage across the Dosage 1X and Dosage 2X groups (which was a goal for data collection stated in our pre-analysis plan). Interviews with Russian teachers revealed that they generally complied with instructions, which is consistent with bi-weekly follow-ups by the provider on usage of the software.
6
outcomes).9 As noted in Appendix A, the exams have good psychometric properties. The teacher
survey further collected information on the degree to which teachers use information and
computing technology (ICT) at home and their self-efficacy with ICT.
2.3 Randomized Design and Statistical Power To maximize statistical power, we created the sample strata or blocks by placing the six classes
with the closest mean grade three math scores in a region in a strata.10 Adjusting for strata, the
resulting intraclass correlation coefficients were extremely low for our two main outcomes: 0.000
in math achievement and 0.053 in language achievement. Classes were then randomly allocated
within strata to one of three different treatment conditions (T1 = CAL Dosage 1X, T2 = CAL
Dosage 2X, or C = Control or No CAL):
A. CAL Dosage 1X (T1) 115 classes (in 115 schools)
B. CAL Dosage 2X (T2) 113 classes (in 113 schools)
C. Control (C) 115 classes (in 115 schools)
The large number of schools per treatment arm, extremely low ICCs, and rich set of baseline
controls provide substantial statistical power with which to measure effects. 11 Even without
controlling for baseline test scores, minimum detectable effect sizes (MDESs) are approximately
0.09 SDs (for math) and 0.12 SDs (for language) for pairwise treatment comparisons.
2.4 Balance Checks
9 Details of the baseline data collection (and proposed analyses) were described in a pre-analysis plan written and filed with the American Economic Association registry before endline data were available for analysis (https://www.socialscienceregistry.org/trials). Due to minor technical difficulties in the baseline survey (before randomization), not all 6,253 students took all four tests. Rather, 6,052 students in the baseline took math and vocabulary tests, while 5,839 students took language and reading tests. We deal with missing values for these and other baseline controls by including missing value dummies (as detailed in the pre-analysis plan). 10 Because the number of schools in each region was not divisible by 6, we placed 9 schools (with the closest mean grade 3 math scores) in the first region in one stratum and 10 schools (with the closest mean grade 3 math scores) in the second region in one stratum. 11 Based on a previous longitudinal study in primary schools in Russia using the same test instruments, the estimated R-squared between the baseline and follow-up scores is approximately 0.50. Other parameters for the power calculation include: 18 students per class/school, an alpha of 0.05 and power = 0.8.

7
Table A1 (in Appendix A of this document) presents tests for balance on baseline observables
across the treatment arms. The table presents the results from a total of 24 tests comparing average
variable values among the treatment and control arms. These tests were conducted by regressing
each baseline variable on a treatment group indicator and controlling for strata. For tests of student-
level variables, standard errors are clustered at the school/class level.
Out of the 24 tests, only one was statistically significant (different from zero) at the 10%
level and none were significant at the 5% or 1% levels. The results from Table A1 indicate that
balance was achieved across the three arms, especially as a small number of significant differences
are to be expected (by random chance). A joint test of all baseline covariates simultaneously shows
no significant difference between T1 and C (p-value: 0.445), T2 and C (p-value: 0. 417) or T1 and
T2 (p-value = 0.700). Key baseline covariates (baseline math and language test scores, not to
mention reading and vocabulary scores) were not statistically different between any of the three
treatment arms (even at the 10% level).
2.5 Program (Treatment) Administration The provider of the CAL software is one of the largest online technology companies in Russia
(hereafter “the provider”). The provider’s platform has more than 10,000 items across various
math and language sub-content areas for grades 2 to 4. The items and associated content areas
align with national educational standards and curricula for primary schools.
The CAL software is similar to that used in previous studies. It has a graphics-based and
attractive user-interface and dynamic, engaging tasks. It allows multiple tries per question and
provides scaffolded feedback after each student response. The software also allows teachers to
track and compare the performance of individual students both overall and at a granular level in
subject-specific content and sub-content areas Appendix B presents example screenshots of these
different aspects of the CAL software.
In both the CAL Dosage 1X and CAL Dosage 2X treatment arms, the provider asked
teachers to assign CAL items through their registered accounts.12 Teachers were given instructions
to use assigned CAL items during homework, but were also allowed to use them in class.13 One
12 The dosages were chosen based on numerous pilot interviews that the provider conducted with teachers outside of the study sample and prior to the experiment. In the experimental intervention, the provider introduced the online educational platform and dosages through separate training webinars with the Dosage X and Dosage 2X teachers. 13 Interviews with teachers revealed that class use was minimal relative to use for homework.
8
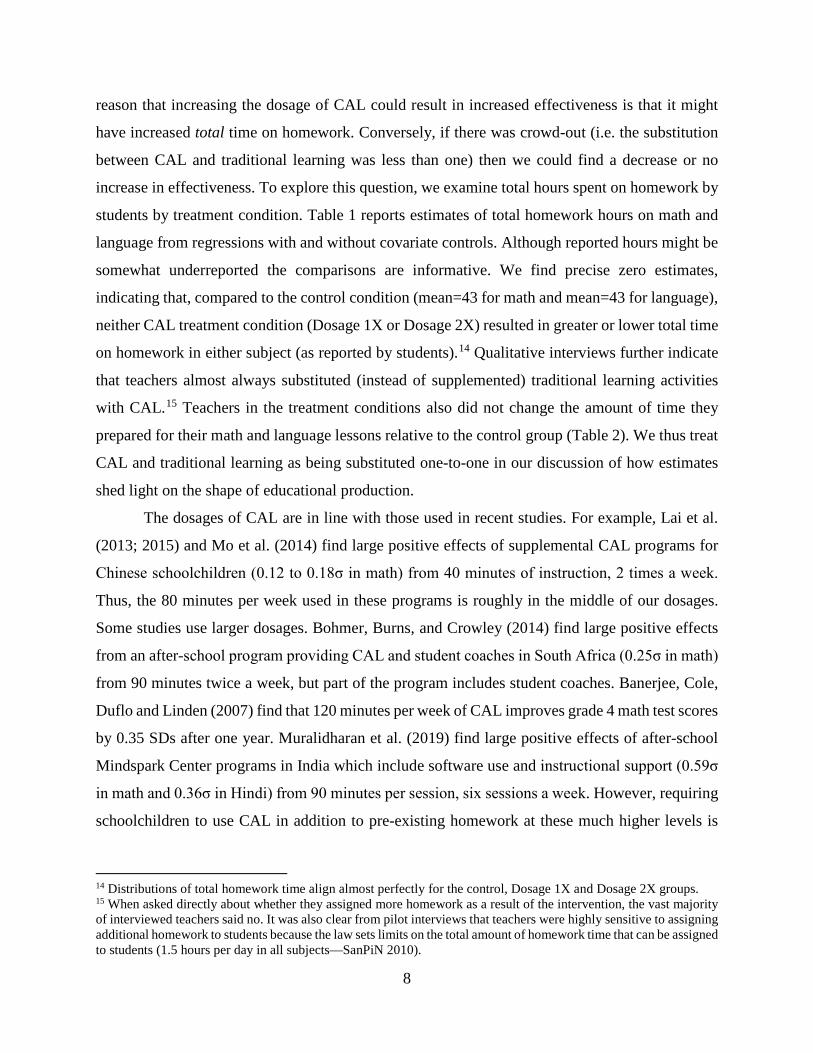
reason that increasing the dosage of CAL could result in increased effectiveness is that it might
have increased total time on homework. Conversely, if there was crowd-out (i.e. the substitution
between CAL and traditional learning was less than one) then we could find a decrease or no
increase in effectiveness. To explore this question, we examine total hours spent on homework by
students by treatment condition. Table 1 reports estimates of total homework hours on math and
language from regressions with and without covariate controls. Although reported hours might be
somewhat underreported the comparisons are informative. We find precise zero estimates,
indicating that, compared to the control condition (mean=43 for math and mean=43 for language),
neither CAL treatment condition (Dosage 1X or Dosage 2X) resulted in greater or lower total time
on homework in either subject (as reported by students).14 Qualitative interviews further indicate
that teachers almost always substituted (instead of supplemented) traditional learning activities
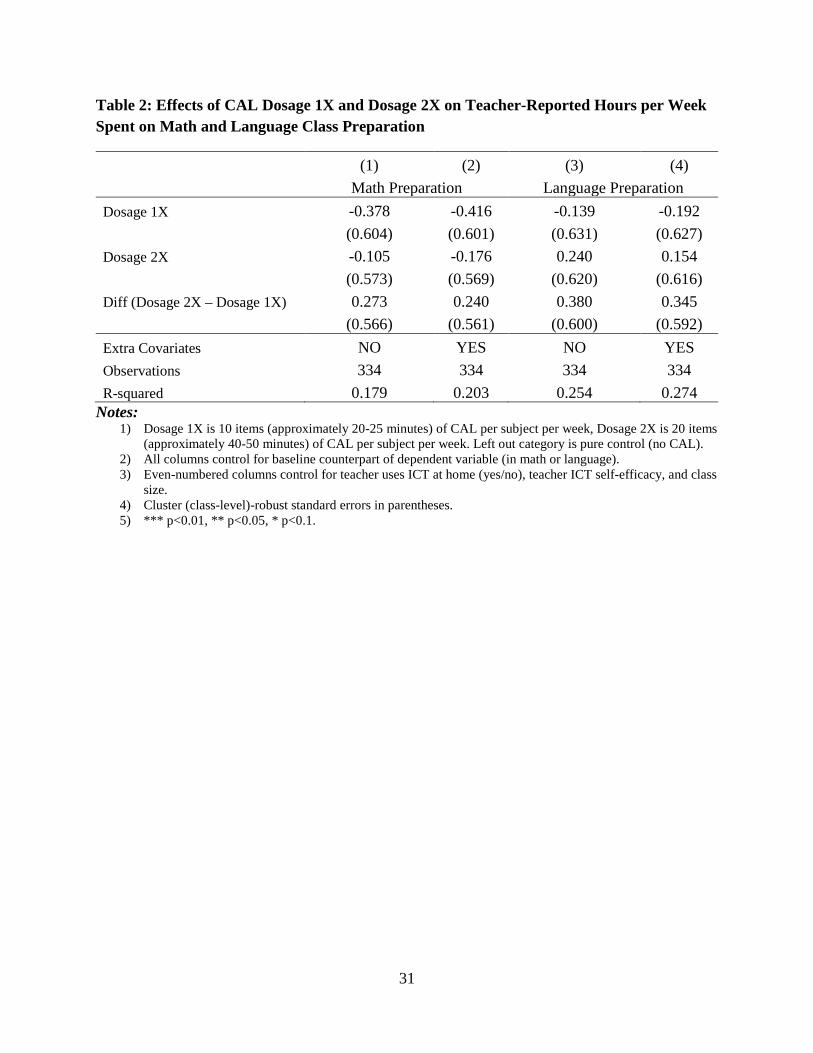
with CAL.15 Teachers in the treatment conditions also did not change the amount of time they
prepared for their math and language lessons relative to the control group (Table 2). We thus treat
CAL and traditional learning as being substituted one-to-one in our discussion of how estimates
shed light on the shape of educational production.
The dosages of CAL are in line with those used in recent studies. For example, Lai et al.
(2013; 2015) and Mo et al. (2014) find large positive effects of supplemental CAL programs for
Chinese schoolchildren (0.12 to 0.18σ in math) from 40 minutes of instruction, 2 times a week.
Thus, the 80 minutes per week used in these programs is roughly in the middle of our dosages.
Some studies use larger dosages. Bohmer, Burns, and Crowley (2014) find large positive effects
from an after-school program providing CAL and student coaches in South Africa (0.25σ in math)
from 90 minutes twice a week, but part of the program includes student coaches. Banerjee, Cole,
Duflo and Linden (2007) find that 120 minutes per week of CAL improves grade 4 math test scores
by 0.35 SDs after one year. Muralidharan et al. (2019) find large positive effects of after-school
Mindspark Center programs in India which include software use and instructional support (0.59σ
in math and 0.36σ in Hindi) from 90 minutes per session, six sessions a week. However, requiring
schoolchildren to use CAL in addition to pre-existing homework at these much higher levels is
14 Distributions of total homework time align almost perfectly for the control, Dosage 1X and Dosage 2X groups. 15 When asked directly about whether they assigned more homework as a result of the intervention, the vast majority of interviewed teachers said no. It was also clear from pilot interviews that teachers were highly sensitive to assigning additional homework to students because the law sets limits on the total amount of homework time that can be assigned to students (1.5 hours per day in all subjects—SanPiN 2010).

9
just not possible in most countries. As noted above, many countries mandate limitations on time
children spend in after-school programs and on homework (e.g. China (MOE, 2018); France
(MNE, 2019); and Russia SanPiN, 2010); in the United States many school districts have already
or are considering implementing homework restrictions (Tawnell, 2018).
2.6 Endline Survey and Primary Outcomes We conducted the follow-up survey with students and teachers in mid May 2019 at the end of the
school year. As in the baseline, we administered a 2-hour exam that covers math, language,
reading, and vocabulary to students. We also asked students about their homework time on
different subjects, and we asked teachers about their preparation time for teaching different
subjects.
The primary outcome variables for the trial are student math and language achievement at
the end of the school year (as measured by the exam). In the analyses, we convert the math and
language endline exam scores into z-scores (subtracting each students’ endline subject-specific
score by the average endline subject-specific score of the control sample and dividing the standard
deviation of the endline subject-specific score of the control sample). Other outcome variables
include the degree to which students are interested in studying math and language subjects (using
a standard subjective scale, converted into z-scores), student reports of time spent on subject-
specific homework (average minutes per week), and teacher reports of time spent preparing for
teaching different subjects (average minutes per week).16
3 Empirical Methods and Hypothesis Tests Our general approach for estimating treatment effects is to regress math and language outcomes
on indicator variables for treatment assignment, baseline controls and strata (county-grade) fixed
effects using the following model:
𝑌𝑌𝑖𝑖𝑖𝑖 = 𝛼𝛼 + 𝛾𝛾1𝐷𝐷1𝑖𝑖 + 𝛾𝛾2𝐷𝐷2𝑖𝑖 + Xij𝛽𝛽 + 𝜏𝜏𝑠𝑠 + 𝜀𝜀𝑖𝑖𝑖𝑖 (1)
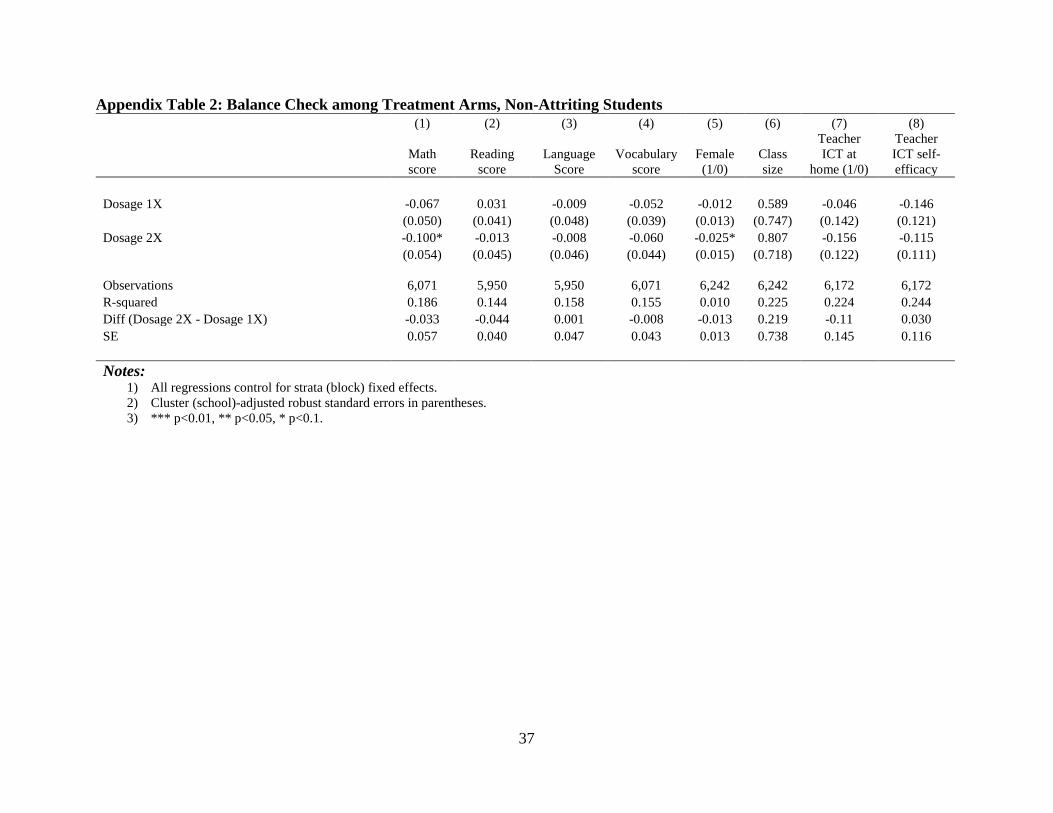
16 The rate of attrition from the baseline to endline survey was extremely low (2.9 percent). Balance in baseline covariates across pairwise treatment comparisons was maintained among the non-attriting students. Out of 24 tests, only two were statistically significant (different from zero) at the 10% level and none were significant at the 5% or 1% levels (Appendix Table 2), as would be expected by chance.

10
where 𝑌𝑌𝑖𝑖𝑖𝑖 is the outcome of interest measured at endline for student i in school j; 𝐷𝐷1𝑖𝑖 and 𝐷𝐷2𝑖𝑖 are
dummy variables indicating the treatment assignments of Dosage 1X and Dosage 2X; Xij is a
vector of baseline control variables, and 𝜏𝜏𝑠𝑠 is a set of strata fixed effects.17 In all specifications, Xij
includes the baseline value of the dependent variable (when available). We also estimate treatment
effects using an expanded set of baseline controls. For student-level outcomes, this expanded set
of baseline controls includes all baseline test scores (math, language, reading, and vocabulary),
student gender, an indicator for whether the teacher uses ICT at home, teacher ICT self-efficacy,
and class size.18 Standard errors are clustered at the school/class level.
The key parameters of interest in Equation (1) are 𝛾𝛾1 and 𝛾𝛾2. They allow one to trace out
the production function in CAL and determine its general shape and other characteristics. For
example, they allow for a test of whether the production function is concave in CAL. The finding
of a positive estimate of 𝛾𝛾1 and an estimate of 𝛾𝛾2 that is less than 2𝛾𝛾1 indicates a concave
relationship. Estimates of 𝛾𝛾1 and 𝛾𝛾2 also allow one to determine if substitution between the CAL
and traditional learning inputs result in shifts to higher isoquants. Shifts in isoquants then reveal
information about whether the rate of technical substitution changes in the level of CAL. We can
specifically examine whether there is diminishing MRTS with higher levels of CAL. Using this
information we can rule out some general functional forms of the production function and provide
suggestive evidence supporting others. Having three treatment arms of different dosage (including
the control arm where dosage is zero) in the RCT allows us to explore these questions for the first
time in the literature.
Although estimates of the production function are local, we chose the Dosage 1X and
Dosage 2X levels of CAL use because, as noted above, they fall within the range of what teachers
believe are reasonable amounts, are within policy regulations, and line up well with levels
implemented in the previous literature. Another important point of the experimental design is that
we are increasing CAL by substituting away from traditional learning which is different than
adding a supplemental CAL program. This allows us to isolate productivity changes resulting from
17 Our primary outcome is student achievement as measured by standardized test scores (in math or language). Course grades for students were not available from all schools. 18 We address missing values for the baseline controls by creating a missing value dummy variable and including it in the regression. We also check that the results are not sensitive to this treatment of missing values by comparing them with results that exclude those observations. We find that the results are not substantively sensitive to the inclusion of missing dummy variables and observations with missing values for controls.

11
input substitution instead of productivity changes due to changing inputs (i.e. returns to scale).
This is an important distinction because schools and students face restrictions on in-school and
after-school time commitments.
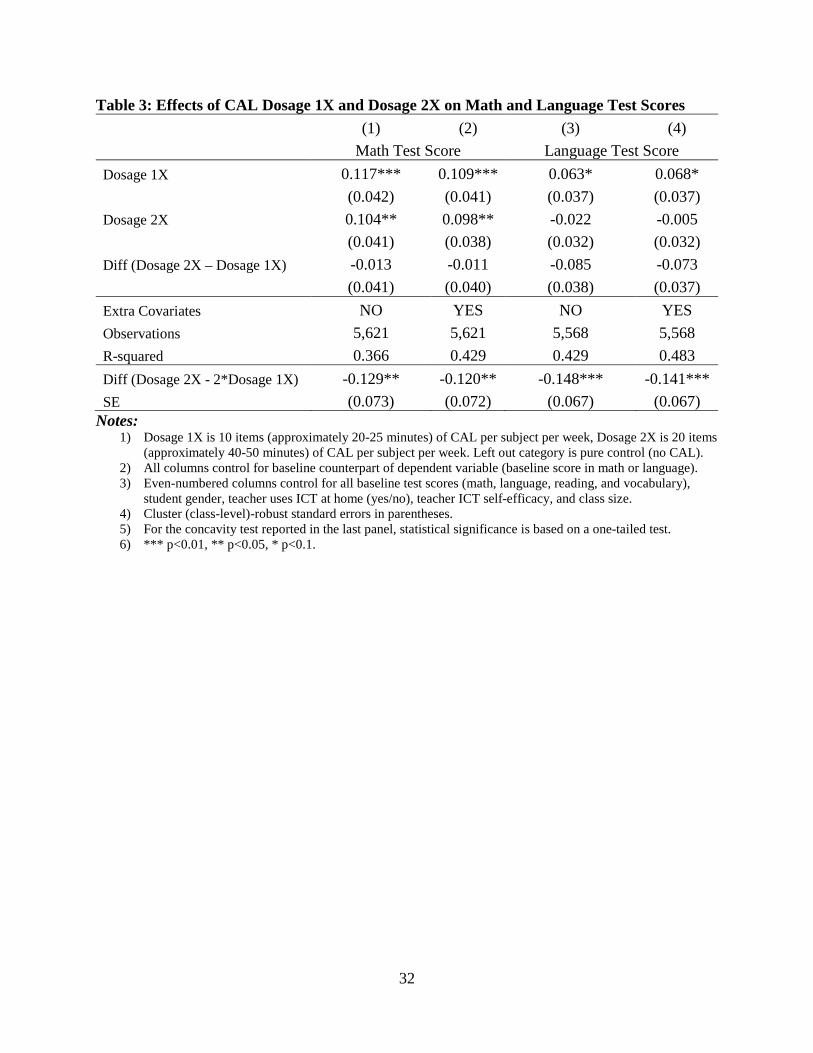
4 Results 4.1 Math Scores Table 3 reports estimates of math test scores on treatment arms. Both specifications with and
without covariate controls are reported. For Dosage 1X we find positive and statistically significant
effects on math test scores (0.11 to 0.12σ). Using CAL increased test scores and the increase at the
base level of time resulted in effect sizes that are roughly comparable to estimates reported in
previous studies at similar dosage levels. For example, Lai et al. (2013; 2015) and Mo et al. (2014)
find 0.12 to 0.18σ effects in math from CAL programs for Chinese schoolchildren from 80 minutes
per week.
After doubling the dosage level, we also find positive and statistically significant treatment
effects on math test scores. More importantly, however, we find point estimates that are roughly
similar to the first dosage level. Increasing the dosage level thus resulted in no additional increase
in effects on math test scores. To our knowledge, these estimates are the first showing no additional
effect of a higher dosage of CAL beyond the base level.
One question of interest is whether the production function in CAL is concave. If there is
a Cobb-Douglas production function with equal factor returns then concavity is implied because
of the curvature in isoquants. In this case, production is assumed to have a diminishing MRTS of
CAL for traditional learning as one input is expanded beyond roughly equal levels. Figure 1
displays a typical isoquant map for a Cobb-Douglas production function with equal factor returns.
As educational production relies more on the CAL input, one possibility is that each additional
unit becomes less productive because students become less interested or engaged in the video-
based and gamified learning with more use. Another possibility is that higher levels of CAL use
increase the likelihood that students become distracted with other software, apps and entertainment
on the computer. On the other hand, production might not be Cobb-Douglas, and the production
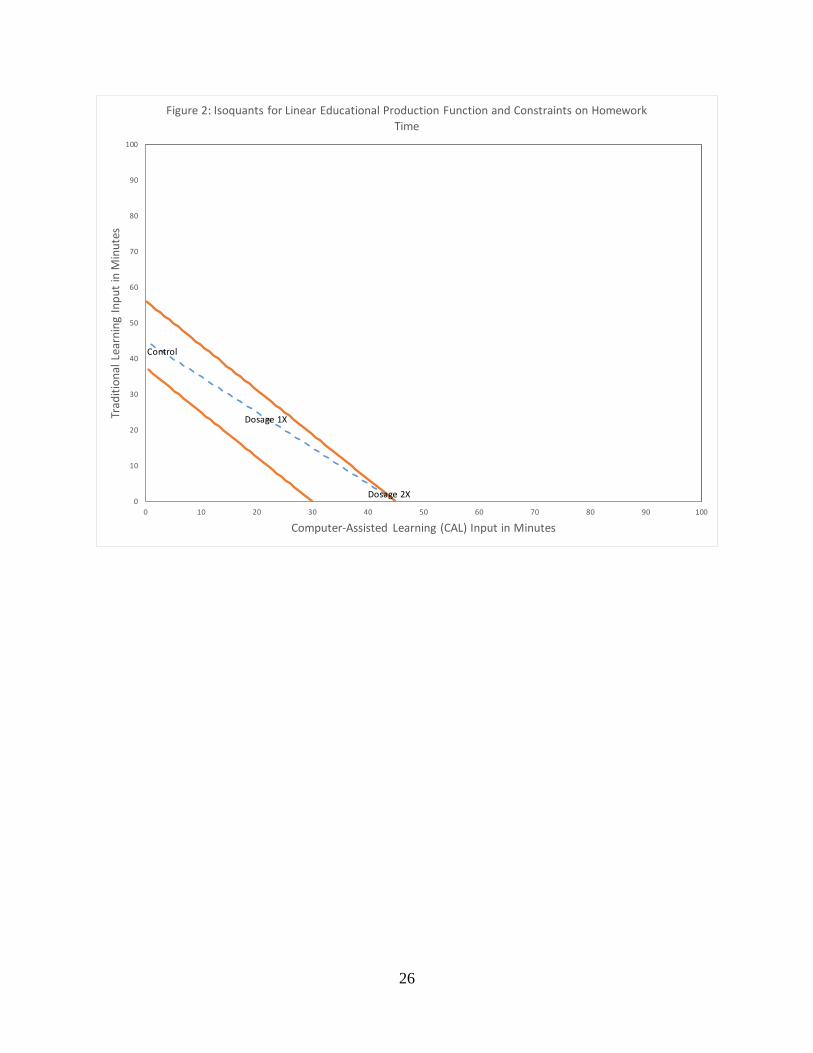
function in CAL might not be concave (i.e. constant or increasing MRTS). The case of a linear
production function in which both inputs have similar returns (i.e. linear isoquants with slope -1)
12
provides an example (Figure 2). In this case, CAL and traditional learning are perfect substitutes
for each other across all levels.
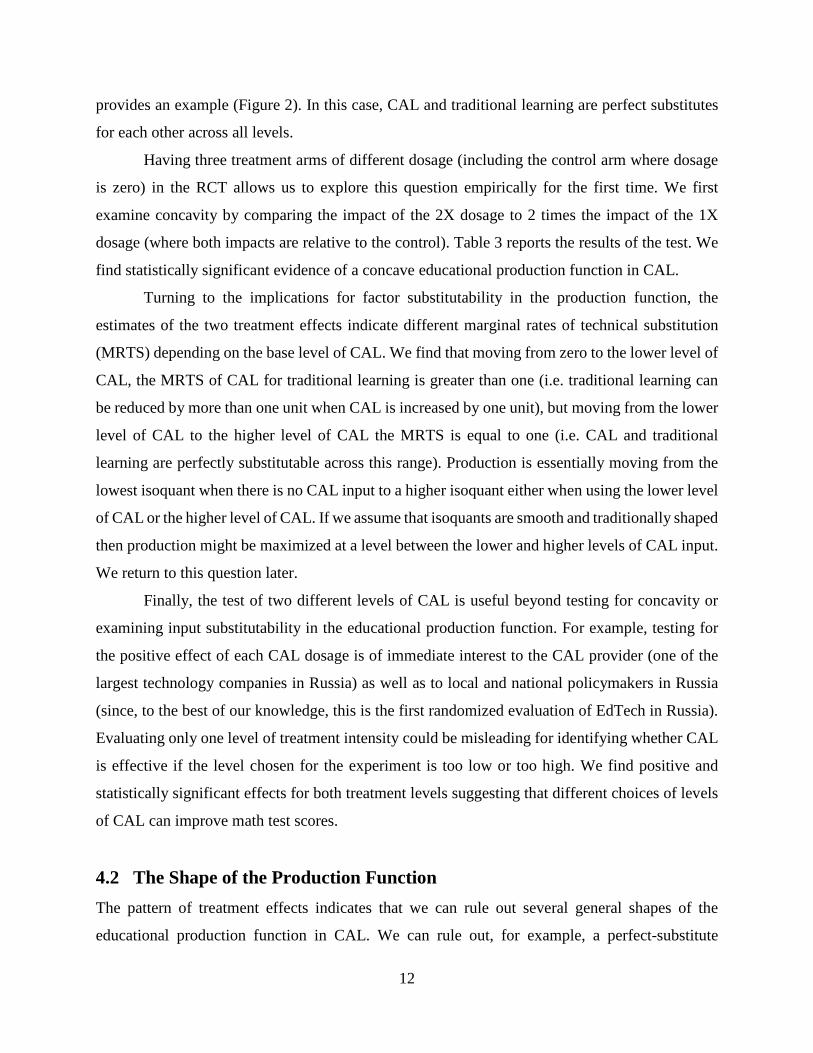
Having three treatment arms of different dosage (including the control arm where dosage
is zero) in the RCT allows us to explore this question empirically for the first time. We first
examine concavity by comparing the impact of the 2X dosage to 2 times the impact of the 1X
dosage (where both impacts are relative to the control). Table 3 reports the results of the test. We
find statistically significant evidence of a concave educational production function in CAL.
Turning to the implications for factor substitutability in the production function, the
estimates of the two treatment effects indicate different marginal rates of technical substitution
(MRTS) depending on the base level of CAL. We find that moving from zero to the lower level of
CAL, the MRTS of CAL for traditional learning is greater than one (i.e. traditional learning can
be reduced by more than one unit when CAL is increased by one unit), but moving from the lower
level of CAL to the higher level of CAL the MRTS is equal to one (i.e. CAL and traditional
learning are perfectly substitutable across this range). Production is essentially moving from the
lowest isoquant when there is no CAL input to a higher isoquant either when using the lower level
of CAL or the higher level of CAL. If we assume that isoquants are smooth and traditionally shaped
then production might be maximized at a level between the lower and higher levels of CAL input.
We return to this question later.
Finally, the test of two different levels of CAL is useful beyond testing for concavity or
examining input substitutability in the educational production function. For example, testing for
the positive effect of each CAL dosage is of immediate interest to the CAL provider (one of the
largest technology companies in Russia) as well as to local and national policymakers in Russia
(since, to the best of our knowledge, this is the first randomized evaluation of EdTech in Russia).
Evaluating only one level of treatment intensity could be misleading for identifying whether CAL
is effective if the level chosen for the experiment is too low or too high. We find positive and
statistically significant effects for both treatment levels suggesting that different choices of levels
of CAL can improve math test scores.
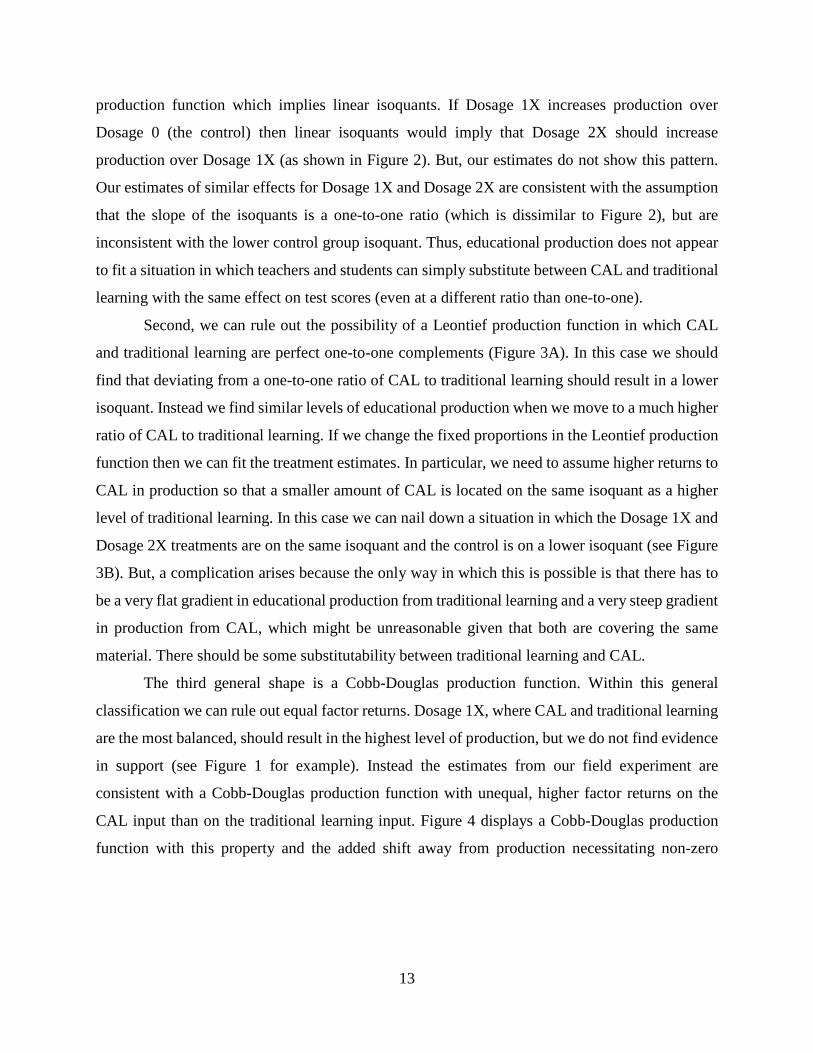
4.2 The Shape of the Production Function The pattern of treatment effects indicates that we can rule out several general shapes of the
educational production function in CAL. We can rule out, for example, a perfect-substitute
13
production function which implies linear isoquants. If Dosage 1X increases production over
Dosage 0 (the control) then linear isoquants would imply that Dosage 2X should increase
production over Dosage 1X (as shown in Figure 2). But, our estimates do not show this pattern.
Our estimates of similar effects for Dosage 1X and Dosage 2X are consistent with the assumption
that the slope of the isoquants is a one-to-one ratio (which is dissimilar to Figure 2), but are
inconsistent with the lower control group isoquant. Thus, educational production does not appear
to fit a situation in which teachers and students can simply substitute between CAL and traditional
learning with the same effect on test scores (even at a different ratio than one-to-one).
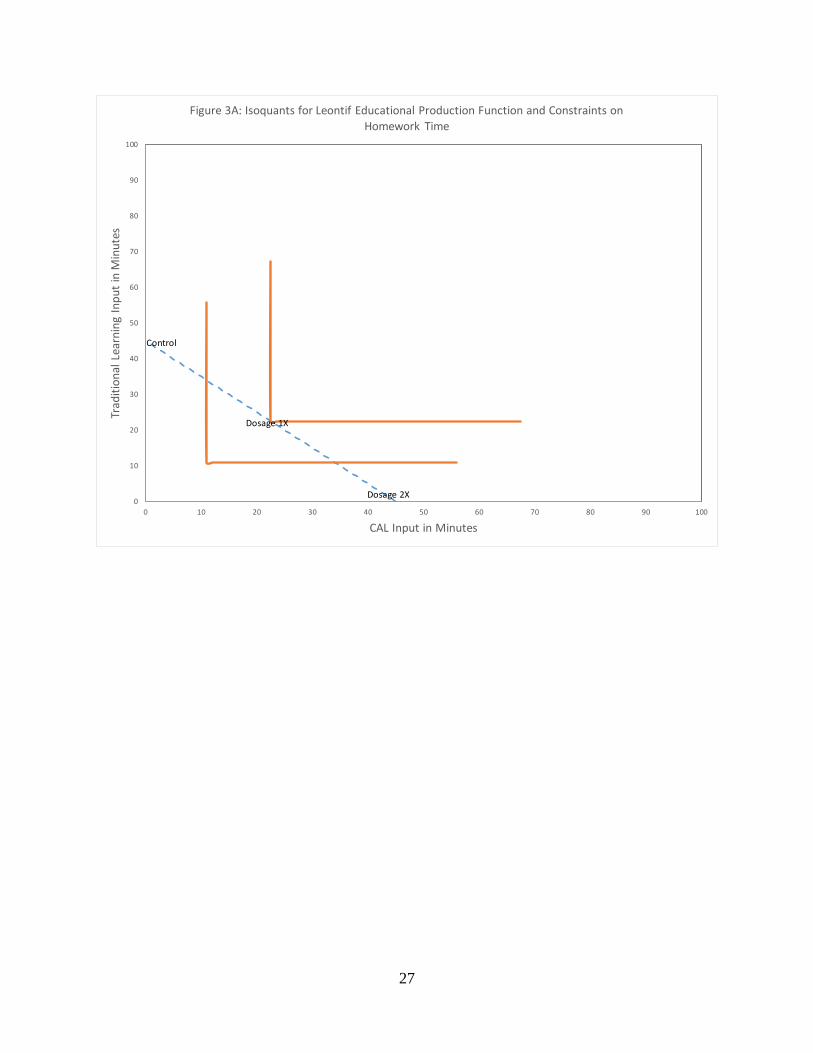
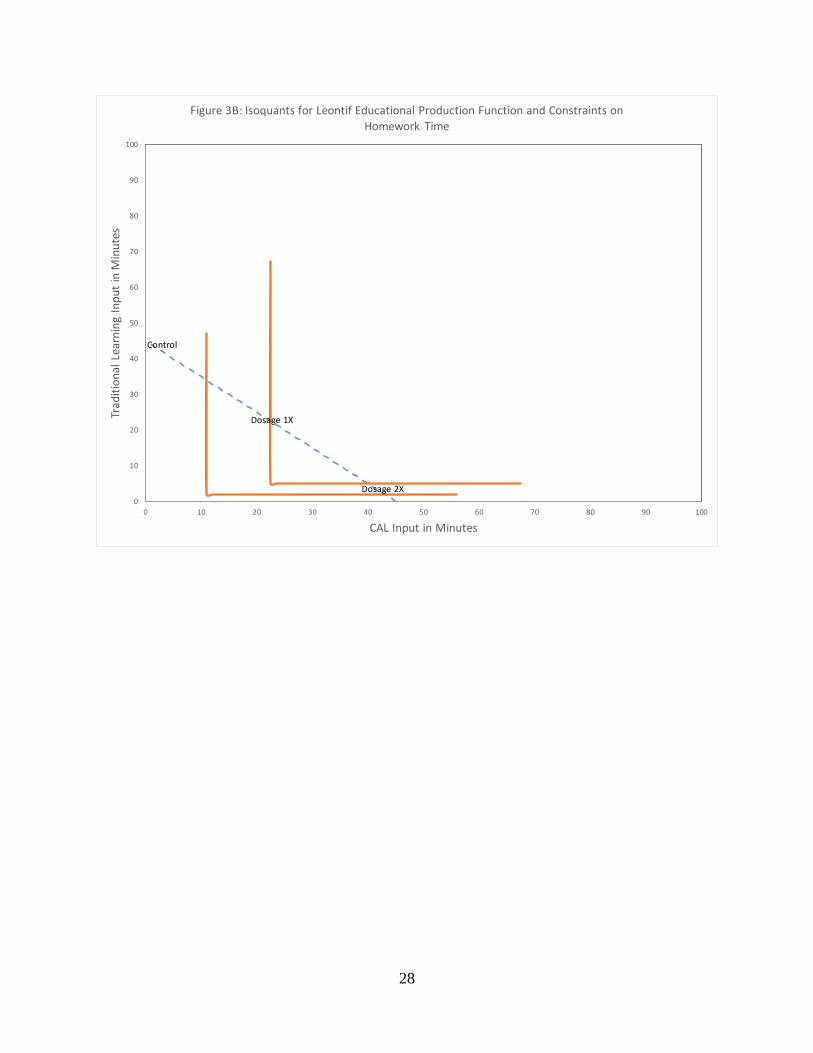
Second, we can rule out the possibility of a Leontief production function in which CAL
and traditional learning are perfect one-to-one complements (Figure 3A). In this case we should
find that deviating from a one-to-one ratio of CAL to traditional learning should result in a lower
isoquant. Instead we find similar levels of educational production when we move to a much higher
ratio of CAL to traditional learning. If we change the fixed proportions in the Leontief production
function then we can fit the treatment estimates. In particular, we need to assume higher returns to
CAL in production so that a smaller amount of CAL is located on the same isoquant as a higher
level of traditional learning. In this case we can nail down a situation in which the Dosage 1X and
Dosage 2X treatments are on the same isoquant and the control is on a lower isoquant (see Figure
3B). But, a complication arises because the only way in which this is possible is that there has to
be a very flat gradient in educational production from traditional learning and a very steep gradient
in production from CAL, which might be unreasonable given that both are covering the same
material. There should be some substitutability between traditional learning and CAL.
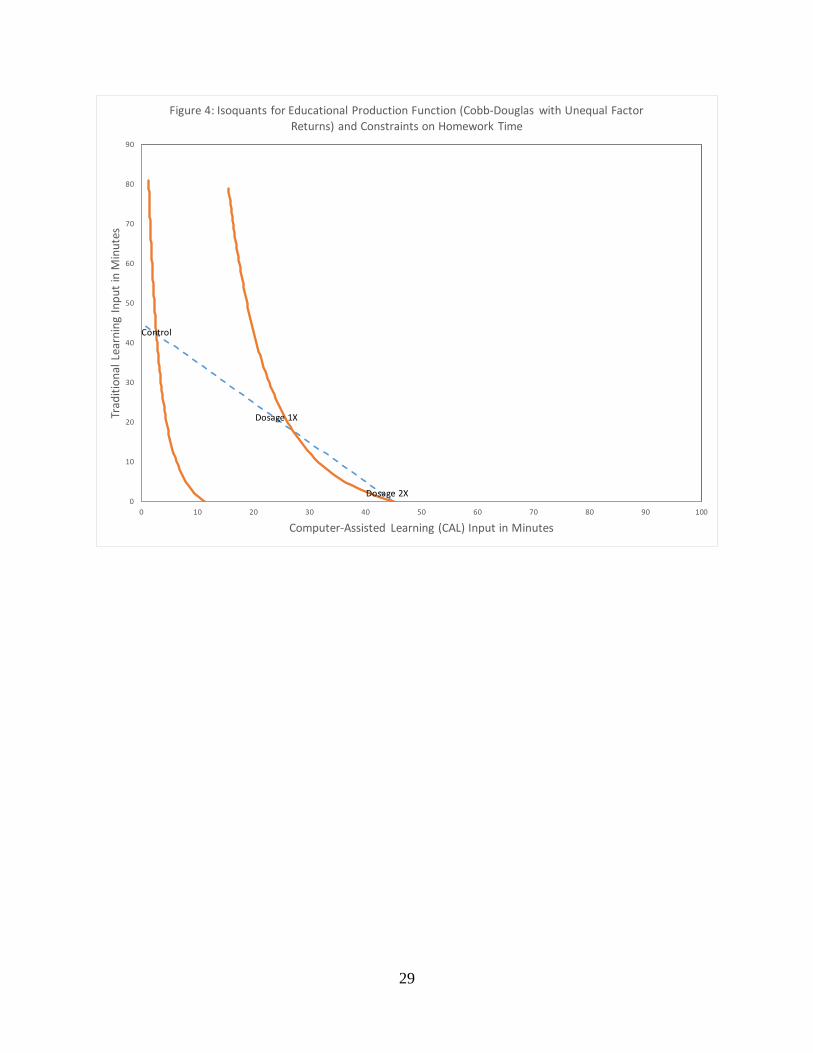
The third general shape is a Cobb-Douglas production function. Within this general
classification we can rule out equal factor returns. Dosage 1X, where CAL and traditional learning
are the most balanced, should result in the highest level of production, but we do not find evidence
in support (see Figure 1 for example). Instead the estimates from our field experiment are
consistent with a Cobb-Douglas production function with unequal, higher factor returns on the
CAL input than on the traditional learning input. Figure 4 displays a Cobb-Douglas production
function with this property and the added shift away from production necessitating non-zero

14
investments in both inputs.19 In this case the isoquants generally line up with our estimates. We
should note the caveat, however, that we are not directly estimating the form of the production
function and that estimates from the experiment only provide suggestive evidence on these general
forms.
The findings from the experiment are important because they provide evidence on two
characteristics of educational production in CAL. First, CAL is found to be more productive than
traditional learning for our chosen levels of inputs. Students might benefit from the video-based
and partly gamified method of learning more than traditional ways of doing homework. Second,
at the same time there is an advantage to providing both types of homework. In the isoquant map
displayed in Figure 4, for example, the optimal level of CAL is likely somewhere between the two
treatment dosages. This combination of both CAL and traditional learning results in higher levels
of educational production than using only traditional learning or only CAL. The graphic and
engaging nature of CAL might enhance learning when used at reasonable levels, but at very high
levels then this engagement force may diminish because of waning interest, increased fatigue, or
distractions from using the computer for entertainment.
4.3 Language Scores We also examine treatment effects on language test scores. The previous literature focuses
primarily on math test scores and less on language test scores. In addition to drawing less attention
in the CAL literature, languages differ in each country making it difficult to choose base levels
and compare estimates across studies. Additionally, we might expect that educational production
in CAL differs between math and language. Although math learning is mostly through school and
homework, language learning is broader because reading for pleasure and family interactions also
play key roles in learning.
Table 3 reports estimates for language test scores. Both specifications with and without
covariate controls are reported. For Dosage 1X we find positive and statistically significant effects
(at 0.10 level) on language test scores. After doubling the dosage level, the treatment effect
estimates become close to zero.
19 The isoquants displayed in Figure 4 are from the Cobb-Douglas production function, Q=A(C+a)3/4 (T+a)1/4, where a is an arbitrary shift parameter so that production does not equal zero when either CAL or traditional learning are zero.
15
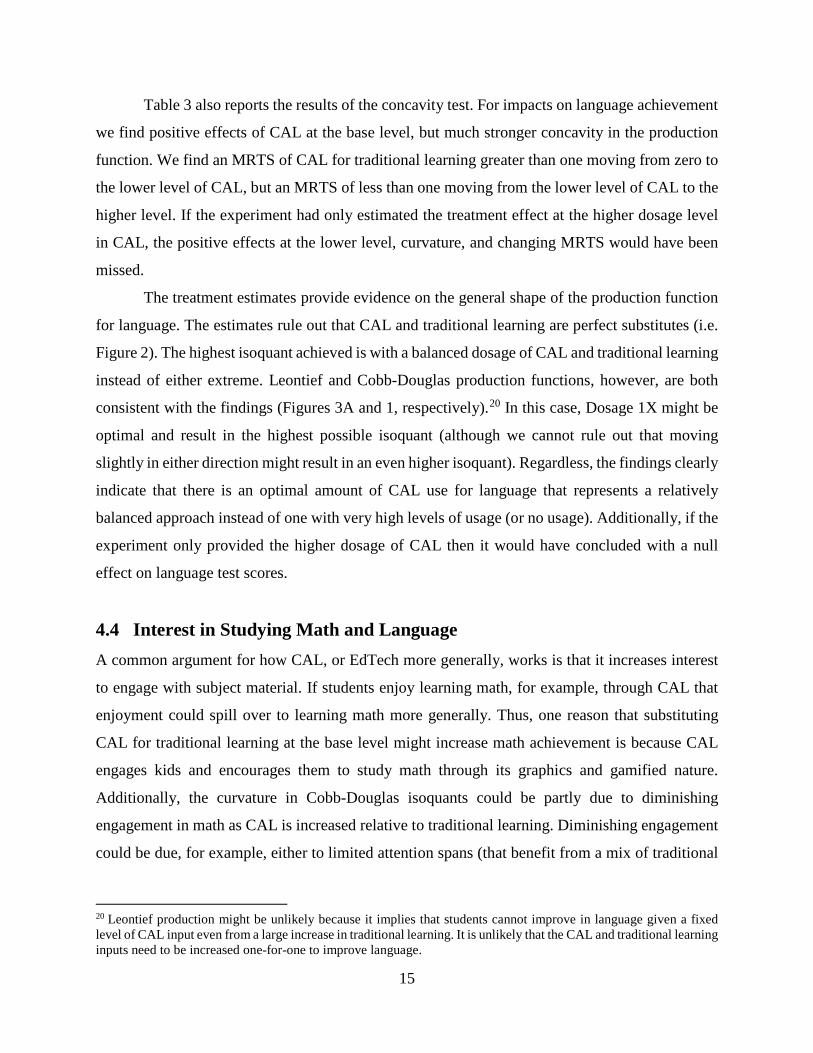
Table 3 also reports the results of the concavity test. For impacts on language achievement
we find positive effects of CAL at the base level, but much stronger concavity in the production
function. We find an MRTS of CAL for traditional learning greater than one moving from zero to
the lower level of CAL, but an MRTS of less than one moving from the lower level of CAL to the
higher level. If the experiment had only estimated the treatment effect at the higher dosage level
in CAL, the positive effects at the lower level, curvature, and changing MRTS would have been
missed.
The treatment estimates provide evidence on the general shape of the production function
for language. The estimates rule out that CAL and traditional learning are perfect substitutes (i.e.
Figure 2). The highest isoquant achieved is with a balanced dosage of CAL and traditional learning
instead of either extreme. Leontief and Cobb-Douglas production functions, however, are both
consistent with the findings (Figures 3A and 1, respectively).20 In this case, Dosage 1X might be
optimal and result in the highest possible isoquant (although we cannot rule out that moving
slightly in either direction might result in an even higher isoquant). Regardless, the findings clearly
indicate that there is an optimal amount of CAL use for language that represents a relatively
balanced approach instead of one with very high levels of usage (or no usage). Additionally, if the
experiment only provided the higher dosage of CAL then it would have concluded with a null
effect on language test scores.
4.4 Interest in Studying Math and Language A common argument for how CAL, or EdTech more generally, works is that it increases interest
to engage with subject material. If students enjoy learning math, for example, through CAL that
enjoyment could spill over to learning math more generally. Thus, one reason that substituting
CAL for traditional learning at the base level might increase math achievement is because CAL
engages kids and encourages them to study math through its graphics and gamified nature.
Additionally, the curvature in Cobb-Douglas isoquants could be partly due to diminishing
engagement in math as CAL is increased relative to traditional learning. Diminishing engagement
could be due, for example, either to limited attention spans (that benefit from a mix of traditional
20 Leontief production might be unlikely because it implies that students cannot improve in language given a fixed level of CAL input even from a large increase in traditional learning. It is unlikely that the CAL and traditional learning inputs need to be increased one-for-one to improve language.
16
and computer-based homework) or greater fatigue (because of the more intense, interactive nature
of the CAL exercises).
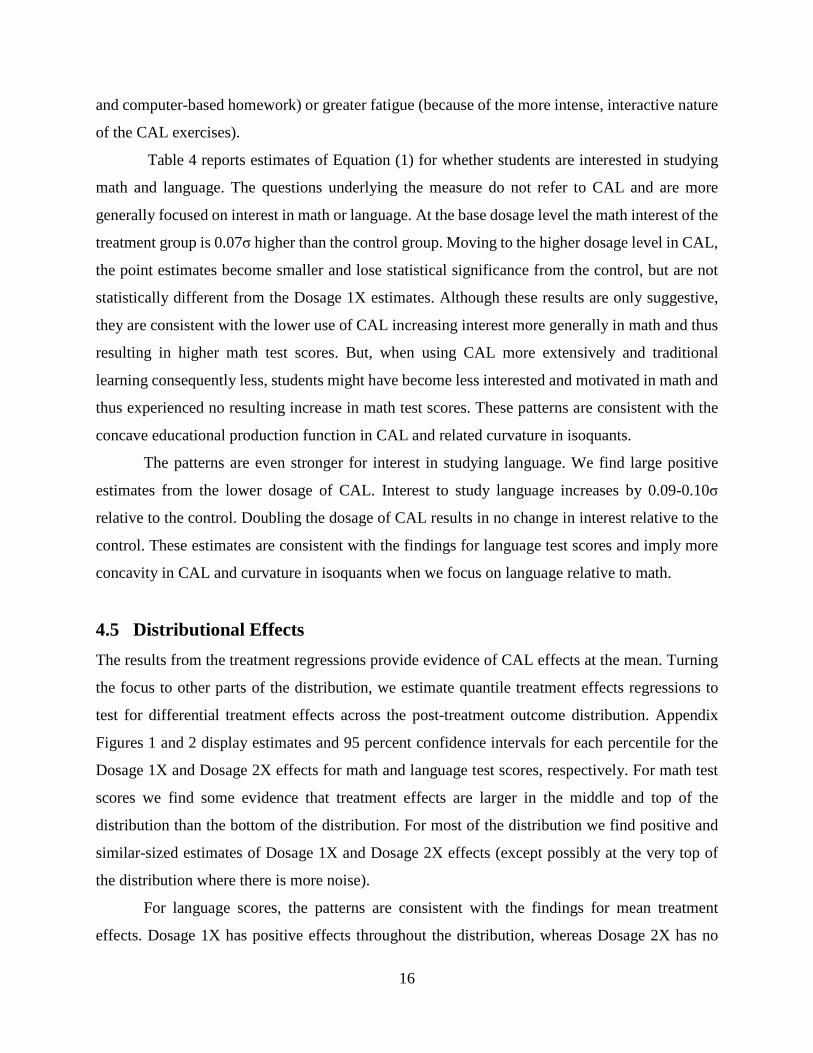
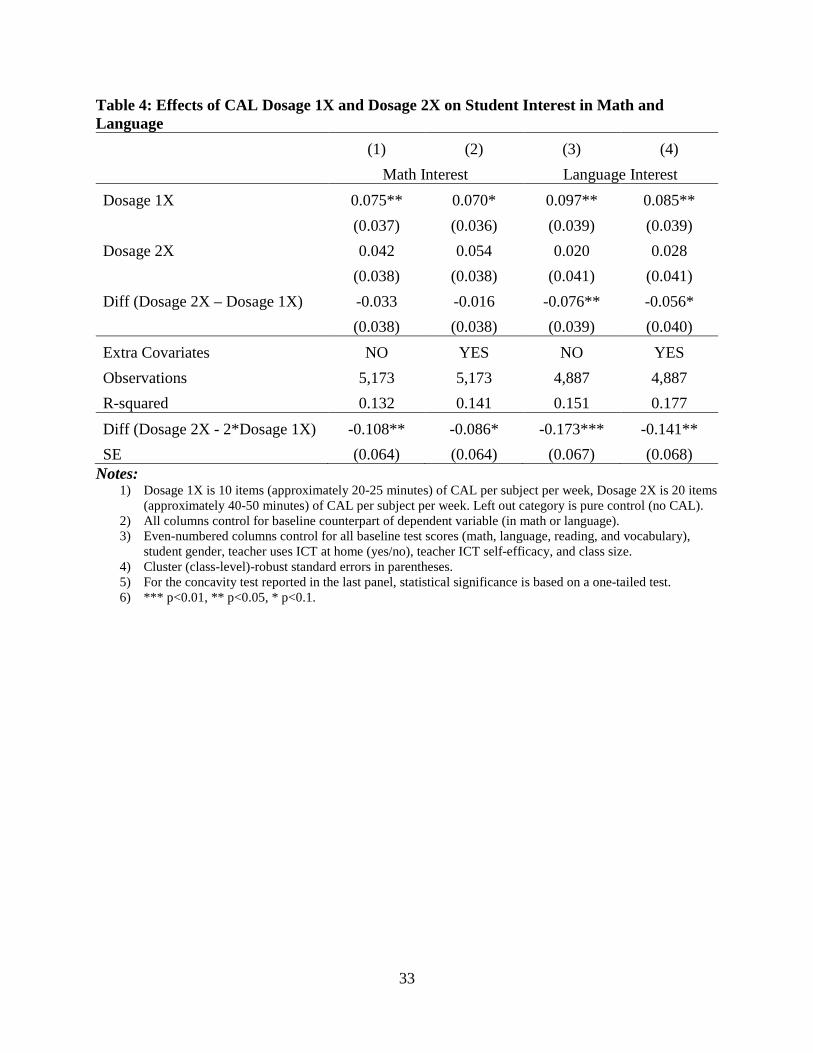
Table 4 reports estimates of Equation (1) for whether students are interested in studying
math and language. The questions underlying the measure do not refer to CAL and are more
generally focused on interest in math or language. At the base dosage level the math interest of the
treatment group is 0.07σ higher than the control group. Moving to the higher dosage level in CAL,
the point estimates become smaller and lose statistical significance from the control, but are not
statistically different from the Dosage 1X estimates. Although these results are only suggestive,
they are consistent with the lower use of CAL increasing interest more generally in math and thus
resulting in higher math test scores. But, when using CAL more extensively and traditional
learning consequently less, students might have become less interested and motivated in math and
thus experienced no resulting increase in math test scores. These patterns are consistent with the
concave educational production function in CAL and related curvature in isoquants.
The patterns are even stronger for interest in studying language. We find large positive
estimates from the lower dosage of CAL. Interest to study language increases by 0.09-0.10σ
relative to the control. Doubling the dosage of CAL results in no change in interest relative to the
control. These estimates are consistent with the findings for language test scores and imply more
concavity in CAL and curvature in isoquants when we focus on language relative to math.
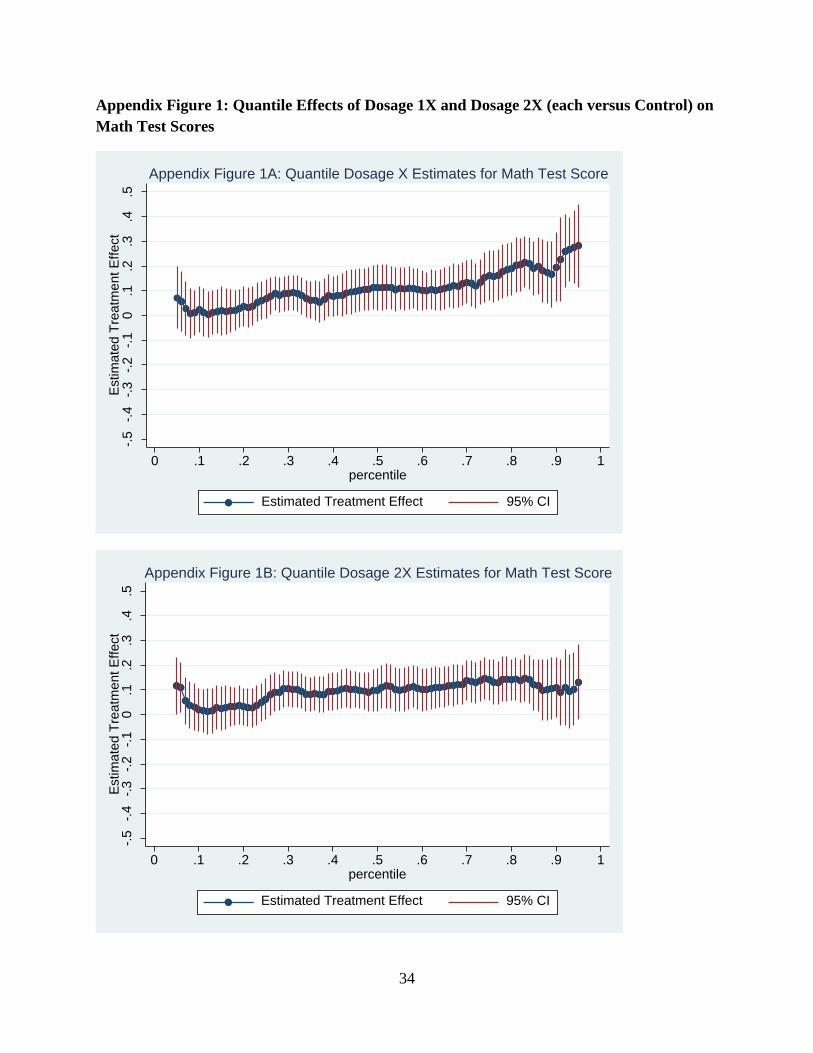
4.5 Distributional Effects The results from the treatment regressions provide evidence of CAL effects at the mean. Turning
the focus to other parts of the distribution, we estimate quantile treatment effects regressions to
test for differential treatment effects across the post-treatment outcome distribution. Appendix
Figures 1 and 2 display estimates and 95 percent confidence intervals for each percentile for the
Dosage 1X and Dosage 2X effects for math and language test scores, respectively. For math test
scores we find some evidence that treatment effects are larger in the middle and top of the
distribution than the bottom of the distribution. For most of the distribution we find positive and
similar-sized estimates of Dosage 1X and Dosage 2X effects (except possibly at the very top of
the distribution where there is more noise).
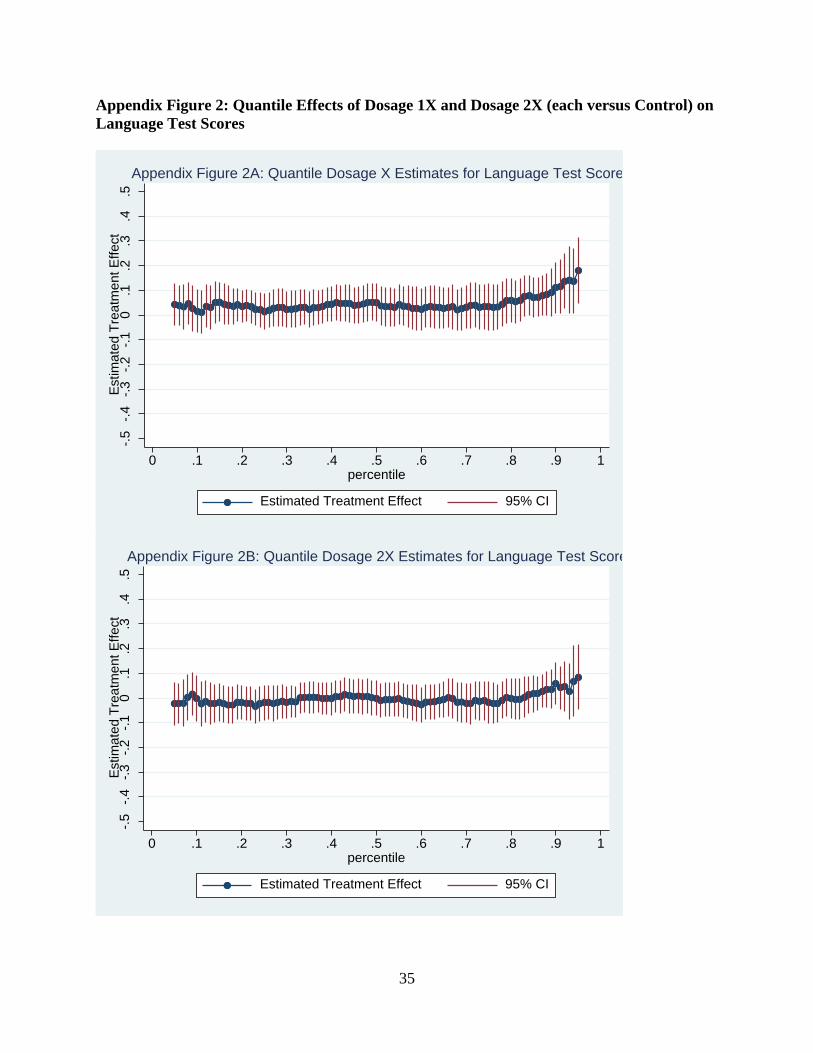
For language scores, the patterns are consistent with the findings for mean treatment
effects. Dosage 1X has positive effects throughout the distribution, whereas Dosage 2X has no
17
effects. There is some evidence of larger effects at the very top of the distribution but these
estimates are somewhat noisy. Although the quantile treatment estimates are not as precisely
measured they do not change the conclusion from the mean impacts reported in Table 3. Mean
impact estimates do not appear to be concealing differential effects at different parts of the
distribution.
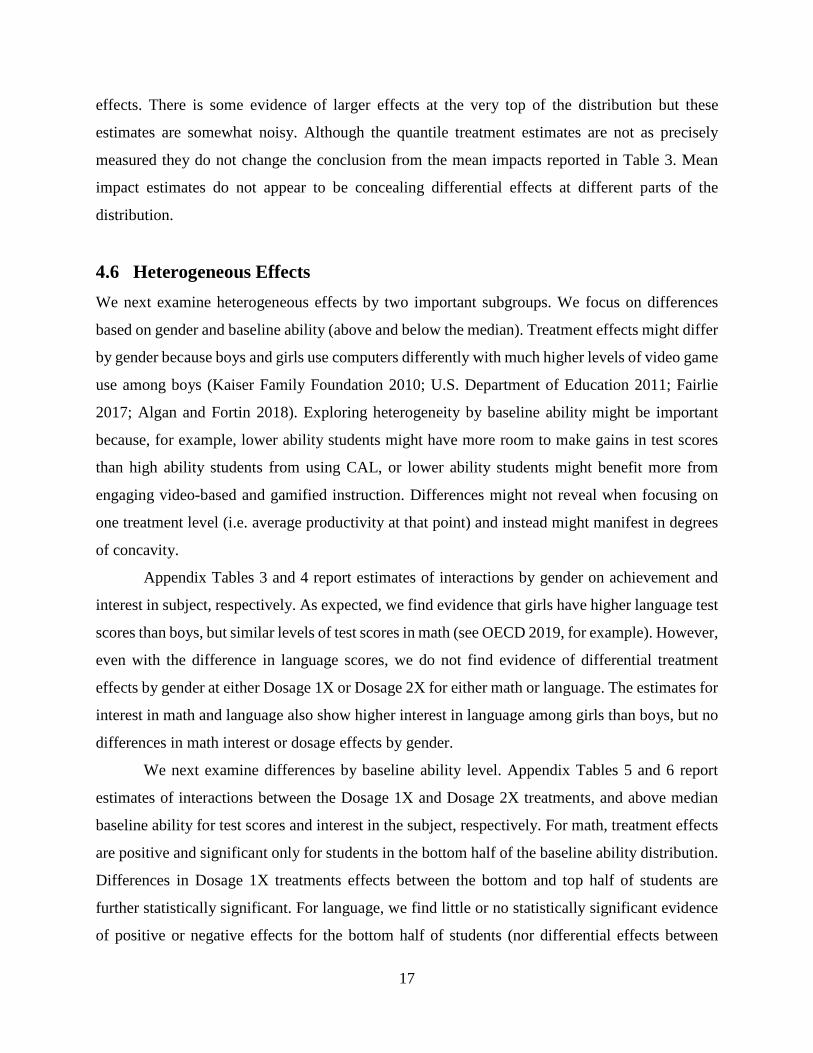
4.6 Heterogeneous Effects We next examine heterogeneous effects by two important subgroups. We focus on differences
based on gender and baseline ability (above and below the median). Treatment effects might differ
by gender because boys and girls use computers differently with much higher levels of video game
use among boys (Kaiser Family Foundation 2010; U.S. Department of Education 2011; Fairlie
2017; Algan and Fortin 2018). Exploring heterogeneity by baseline ability might be important
because, for example, lower ability students might have more room to make gains in test scores
than high ability students from using CAL, or lower ability students might benefit more from
engaging video-based and gamified instruction. Differences might not reveal when focusing on
one treatment level (i.e. average productivity at that point) and instead might manifest in degrees
of concavity.
Appendix Tables 3 and 4 report estimates of interactions by gender on achievement and
interest in subject, respectively. As expected, we find evidence that girls have higher language test
scores than boys, but similar levels of test scores in math (see OECD 2019, for example). However,
even with the difference in language scores, we do not find evidence of differential treatment
effects by gender at either Dosage 1X or Dosage 2X for either math or language. The estimates for
interest in math and language also show higher interest in language among girls than boys, but no
differences in math interest or dosage effects by gender.
We next examine differences by baseline ability level. Appendix Tables 5 and 6 report
estimates of interactions between the Dosage 1X and Dosage 2X treatments, and above median
baseline ability for test scores and interest in the subject, respectively. For math, treatment effects
are positive and significant only for students in the bottom half of the baseline ability distribution.
Differences in Dosage 1X treatments effects between the bottom and top half of students are
further statistically significant. For language, we find little or no statistically significant evidence
of positive or negative effects for the bottom half of students (nor differential effects between
18
students in the bottom and top half of the baseline language ability distribution). For liking subjects
the estimates are noisier but generally line up with the test score results. At least for math, and
possibly for language, the positive and statistically significant treatment effects for the entire
sample (Tables 3 and 4) appear to be largely driven by the positive and statistically significant
treatment effects for students in the bottom half of the ability distribution.
5 Conclusion Billions of dollars are spent on computer-based learning in schools in developing countries each
year and even more during the recent shift to remove learning due to Covid-19, but are these
expenditures optimal (Escueta et al. 2017)? Unfortunately, there is limited theoretical guidance on
what optimal levels of CAL should be, and the newness of EdTech in developing countries does
not provide a long enough track record to determine what works, what does not work, and what
are the impacts of the continued substitution of CAL for traditional learning. The empirical
evidence, even from RCTs, is decidedly mixed and focuses exclusively on one dosage level in
CAL. To remedy this deficiency in the literature, we study for the first time: i) the effectiveness of
CAL on the educational outcomes of school children at different levels of treatment intensity, and
ii) the general shape and nature of the educational production function in CAL. Our field
experiment involving more than six thousand Russian schoolchildren and three treatment arms
varying dosage levels in CAL generates exogenous variation in CAL use. CAL is substituted
directly for traditional learning in the experiment, and thus any changes in educational production
(i.e. movement across isoquants) is due to input substitution and not higher input levels.
Estimates from the field experiment indicate that CAL increases math test scores at both
the base and higher dosage levels. As traditional learning is substituted for CAL from the base
level to the higher level, however, we find similar effect sizes. Thus, the marginal rate of technical
substitution (MRTS) of CAL for traditional learning is greater than one when moving from zero
to the base level of CAL, but essentially equals one when moving from the base level of CAL to
the higher level of CAL. After ruling out several general forms of the educational production
function in CAL, we find estimates that are consistent with a Cobb-Douglas production function
with a higher factor return on CAL than traditional learning and that optimal levels are above a
one-to-one ratio of CAL to traditional learning. Turning to language achievement, which has been
studied much less extensively in the previous literature, we find stronger evidence of: i) concavity

19
in educational production in CAL, ii) diminishing MRTS in CAL, and iii) curvature in isoquants.
The experimental estimates for language are generally consistent with a Cobb-Douglas production
function with roughly equal factor returns.
An important finding is that educational production does not appear to fit a situation in
which teachers and students can simply substitute between CAL and traditional learning at any
level with the same result. For both math and language achievement we find evidence of
diminishing MRTS of CAL for traditional learning. The marginal costs of shifting from a lower
level to a higher level of CAL are very low because students already have computers and the
software is online and can be replicated for essentially no cost). Although there are fixed costs of
developing the software and keeping it up-to-date, the provider made it free of charge to all schools
and teachers in the country. In any case, we do not expect that costs will shift the optimal levels
much beyond what we find without detailed measures of costs. The primary constraint in this
setting is total homework time mandated by the government.
Why do we find evidence of diminishing MRTS? Inherently, it is much more difficult to
identify the underlying causes of concavity in educational production (or curvature of the
isoquants) than identifying the general shape. One possibility that is at least consistent with our
experimental findings is based on changes in interest and engagement in the subject matter. We
find that for both math and language, the base level of CAL resulted in the highest levels of interest.
When the dosage level of CAL was doubled students reported lower levels of interest. The finding
of diminishing MRTS might be due to these effects on interest and engagement in subject material.
Another possibility is that at base level dosages of CAL students gain from being more engaged
in learning the material through the technology, but at higher dosages they lose out on the positive
effects of traditional learning. In the end, a blended approach might be the optimal solution for
schools and students. The blended approach might keep students engaged, but at the same time
expose students to more beneficial methods of learning or just keep students switching around.
More research is needed on these important underlying questions regarding how students learn
using technology. Findings from future research along these lines will build on the novel findings
presented here on the shape and nature of the production function and help further identify optimal
levels of investment in CAL, which is imperative as governments, schools and families around the
world are rapidly increasing investments in EdTech and substituting EdTech for traditional
learning methods without a complete understanding of its effectiveness in educational production.

20
In addition to these longer-term trends, the findings have important implications for the full-scale,
comprehensive, global movement to EdTech at all levels of education in response to the
coronavirus pandemic.
21
References
Algan, Yann, and Nicole M. Fortin. 2018. "Computer Gaming and the Gender Math Gap: Cross-Country Evidence among Teenagers." In Transitions through the Labor Market: Work, Occupation, Earnings and Retirement, pp. 183-228. Emerald Publishing Limited.
Auriol, E. and Warlters, M., 2012. The Marginal Cost of Public Funds and Tax Reform in Africa. Journal of Development Economics, 97(1), pp.58-72.
Bai, Y., Tang, T., Wang, B., Mo, D., Zhang, L., Rozelle, S., Auden E., and Mandell, B. 2018. “Impact of Online Computer Assisted Learning on Education: Evidence from a Randomized Controlled Trial in China,” REAP Working Paper.
Banerjee, A., Cole, S., Duflo, E. and Linden, L. 2007. "Remedying Education: Evidence from Two Randomized Experiments in India," Quarterly Journal of Economics 122(3): 1235-1264.
Barrow, L., Markman, L. and Rouse, C.E. 2009. "Technology's Edge: The Educational Benefits of Computer-Aided Instruction," American Economic Journal: Economic Policy 1(1): 52-74.
Beuermann, D.W., Cristia, J., Cueto, S., Malamud, O., and Cruz-Aguayo, Y. 2015. "One laptop per child at home: Short-term impacts from a randomized experiment in Peru." American Economic Journal: Applied Economics 7(2): 53-80.
Böhmer, B., Burns, J., and Crowley, L. 2014. "Testing Numeric: Evidence from a Randomized Controlled Trial of a Computer Based Mathematics Intervention in Cape Town High Schools.” Unpublished manuscript.
Brookings 2016. “Classroom technologies narrow education gap in developing countries,” Steven Livingston, August 23, 2016, https://www.brookings.edu/blog/techtank/2016/08/23/classroom-technologies-narrow-education-gap-in-developing-countries/
Bulman, G., and Fairlie, R.W. 2015. "Technology and Education: Computers, Software, and the Internet," Handbook of the Economics of Education, Vol. 5, eds Eric Hanushek, Steve Machin, and Ludger Woessmann, North-Holland, Chapter 6: 239-280.
Burguillo, J. C. 2010. Using Game Theory and Competition-based Learning to Stimulate Student Motivation and Performance. Computers & Education, 55(2): 566–575. Campuzano, L., M. Dynarski, R. Agodini, K. Rall, and A. Pendleton. 2009. Effectiveness of reading and mathematics software products: Findings from two student cohorts." Unpublished manuscript. Washington, DC: Mathematica Policy Research.
Carrillo, P., Onofa, M., and Ponce, J. 2010. "Information Technology and Student Achievement: Evidence from a Randomized Experiment in Ecuador." Inter-American Development Bank Working Paper.
Cristia, Julian, Pablo Ibarrarán, Santiago Cueto, Ana Santiago, and Eugenio Severín. 2017. "Technology and child development: Evidence from the one laptop per child program." American Economic Journal: Applied Economics 9, no. 3: 295-320.
22
Dynarski, M., R. Agodini, S. Heaviside, T. Novak, N. Carey, L. Campuzano, B. Means, R. Murphy, W. Penuel, H. Javitz, D. Emery, and W. Sussex. 2007. Effectiveness of Reading and Mathematics Software Products: Findings from the First Student Cohort." Unpublished manuscript. Washington, DC: Mathematica Policy Research.
Economist. 2018. In poor countries technology can make big improvements to education, Economist, November 17, 2018. https://www.economist.com/international/2018/11/17/in-poor-countries-technology-can-make-big-improvements-to-education
Escueta, M., Quan, V., Nickow, A.J. and Oreopoulos, P. 2017. “Education Technology: An Evidence-Based Review.” NBER Working Paper w23744.
Ebner, M. & Holzinger, A. 2007. Successful Implementation of User-centered Game Based Learning in Higher Education: an Example from Civil Engineering. Computers & Education, 49, 3, 873–890. Fairlie, Robert W. 2016. "Do Boys and Girls Use Computers Differently, and Does it Contribute to Why Boys Do Worse in School than Girls?." The BE Journal of Economic Analysis & Policy 16.1: 59-96. Fairlie, R.W., and Robinson, J. 2013. "Experimental Evidence on the Effects of Home Computers on Academic Achievement among Schoolchildren," American Economic Journal: Applied Economics 5(3): 211-240. Falck, O., Mang, C., and Woessmann, L. 2018. "Virtually No Effect? Different Uses of Classroom Computers and their Effect on Student Achievement." Oxford Bulletin of Economics and Statistics 80(1): 1-38.
Hobbs, T.D. “Down With Homework, Say U.S. School Districts,” The Wall Street Journal, December 12, 2018, available at https://www.wsj.com/articles/no-homework-its-the-new-thing-in-u-s-schools-11544610600.
Hoxby, C. M. (2000). The effects of class size on student achievement: New evidence from population variation. The Quarterly Journal of Economics, 115(4), 1239-1285.
Hull, Marie, and Katherine Duch. 2019. "One-to-One Technology and Student Outcomes: Evidence From Mooresville’s Digital Conversion Initiative." Educational Evaluation and Policy Analysis 41.1: 79-97.
Glewwe, Paul W., Eric A. Hanushek, Sarah D. Humpage, and Renato Ravina. 2013. “School resources and educational outcomes in developing countries: A review of the literature from 1990 to 2010,” in Education Policy in Developing Countries (ed. Paul Glewwe): University of Chicago Press: Chicago.
Kaiser Family Foundation. 2010. Generation M2: Media in the Lives of 8- to 18-Year Olds. Kaiser Family Foundation Study.

23
Lai, F., Zhang, L., Hu, X., Qu, Q., Shi, Y., Qiao, Y., ... & Rozelle, S. (2013). Computer Assisted Learning as Extracurricular Tutor? Evidence from a Randomised Experiment in Rural Boarding Schools in Shaanxi. Journal of Development Effectiveness, 5(2): 208-231. Lai, F., Luo, R., Zhang, L., Huang, X., & Rozelle, S. (2015). Does Computer-assisted Learning Improve Learning Outcomes? Evidence from a Randomized Experiment in Migrant Schools in Beijing. Economics of Education Review, 47: 34-48. LeBlanc, A.G., Katzmarzyk, P.T., Barreira, T.V., Broyles, S.T., Chaput, J., Church, T.S.,
Fogelholm, M. et al. 2015. "Correlates of Total Sedentary Time and Screen Time in 9–11 Year-old Children around the World: the International Study of Childhood Obesity, Lifestyle and the Environment." PloS One 10(6): e0129622.
Levin, H.M. and Belfield, C. 2015. "Guiding the Development and Use of Cost-effectiveness Analysis in Education." Journal of Research on Educational Effectiveness 8(3): 400-418.
Li, Y.Y., Li, G.R., Liu, C.F., Loyalka, P., Rozelle, S. 2019. Learning Trajectories among Middle School Students in Developing Contexts: Evidence from Rural China.” REAP Working Paper.
Linden, L.L. 2008. "Complement or Substitute? The Effect of Technology on Student Achievement in India.” Unpublished manuscript.
List, J.A., Sadoff, S. and Wagner, M. 2011. "So you Want to Run an Experiment, Now What? Some Simple Rules of Thumb for Optimal Experimental Design." Experimental Economics 14(4): 439.
McEwan, P. J. 2015. Improving Learning in Primary Schools of Developing Countries: A Meta-analysis of Randomized Experiments. Review of Educational Research, 85(3): 353-394.
McClelland, G.H. 1997. "Optimal Design in Psychological Research." Psychological Methods 2(1): 3-19.
Ministry of Education, 2011. 2010 National Statistical Report on Education Development. China Geology Education, 2011(3): 93-96.
Ministry of Education. 2018. Notice of the Ministry of Education and Nine Other Departments on the Issuance of Burden Reduction Measures for Primary and Secondary School Students. http://www.moe.gov.cn/srcsite/A06/s3321/201812/t20181229_365360.html
MNE. (2019). Encouraging student success: Homework Done. www.education.gouv.fr. Retrieved from http://www.education.gouv.fr/cid131710/encouraging-student-success-homework-done.html.
Mo, D., Swinnen, J., Zhang, L., Yi, H., Qu, Q., Boswell, M. and Rozelle, S., 2013. Can One-to-one Computing Narrow the Digital Divide and the Educational Gap in China? The Case of Beijing Migrant Schools. World Development, 46: 14-29.
Mo, D., Zhang, L.X., Luo, R.F., Qu, Q.H., Huang, W.M., Wang, J.F., Qiao, Y.J., Boswell, M., and Rozelle, S. 2014. "Integrating Computer-assisted Learning into a Regular Curriculum: Evidence
24
from a Randomised Experiment in Rural Schools in Shaanxi." Journal of Development Effectiveness 6(3): 300-323.
Mo, D., Huang, W., Shi, Y., Zhang, L., Boswell, M., & Rozelle, S. 2015. Computer Technology in Education: Evidence from a Pooled Study of Computer Assisted Learning Programs among Rural Students in China. China Economic Review, 36: 131-145.
Muralidharan, K., Singh, A., and Ganimian, A.J. 2019. Disrupting Education? Experimental Evidence on Technology-Aided Instruction in India. American Economic Review 109(4): 1426-60.
OECD. 2019. PISA 2018 Results (Volume I): What Students Know and Can Do, PISA, OECD Publishing, Paris.
Rockoff, J.E. 2015. “Evaluation Report on the School of One i3 Expansion." Unpublished manuscript. New York, NY: Columbia University.
Rouse, C.E. and Krueger, A.B. 2004. Putting Computerized Instruction to the Test: a Randomized Evaluation of a “Scientifically Based” Reading Program." Economics of Education Review 23(4): 323–338.
SanPiN. 2010. “Sanitary and Epidemiological Requirements for Conditions and Organization of Educational Process in Schools.” Decree of the Chief State Sanitary Doctor of the Russian Federation, December 29, 2010. Approved 2.4.2.2821-10
Schaefer, S. and Warren, J. 2004. Teaching Computer Game Design and Construction." Computer-Aided Design, 36(14): 1501-1510.
World Bank. 2018. World Bank Education Overview: New Technologies, Washington, D.C. : World Bank Group. http://documents.worldbank.org/curated/en/731401541081357776/World-Bank-Education-Overview-New-TechnologiesVan der Kleij, F. M., Feskens, R. C., & Eggen, T. J. 2015. Effects of Feedback in a Computer-based Learning Environment on Students’ Learning Outcomes: A Meta-analysis. Review of Educational Research, 85(4): 475-511.

25
0
10
20
30
40
50
60
70
80
90
100
0 10 20 30 40 50 60 70 80 90 100
Trad
ition
al L
earn
ing
Inpu
t in
Min
utes
Computer-Assisted Learning (CAL) Input in Minutes
Figure 1: Isoquants for Educational Production Function (Cobb-Douglas) and Constraints on Homework Time
Low iinvestment in CAL
High iinvestment in CAL
Optimal investment in CAL
26
0
10
20
30
40
50
60
70
80
90
100
0 10 20 30 40 50 60 70 80 90 100
Trad
ition
al L
earn
ing
Inpu
t in
Min
utes
Computer-Assisted Learning (CAL) Input in Minutes
Figure 2: Isoquants for Linear Educational Production Function and Constraints on Homework Time
Control
Dosage 1X
Dosage 2X
27
0
10
20
30
40
50
60
70
80
90
100
0 10 20 30 40 50 60 70 80 90 100
Trad
ition
al L
earn
ing
Inpu
t in
Min
utes
CAL Input in Minutes
Figure 3A: Isoquants for Leontif Educational Production Function and Constraints on Homework Time
Control
Dosage 1X
Dosage 2X
28
0
10
20
30
40
50
60
70
80
90
100
0 10 20 30 40 50 60 70 80 90 100
Trad
ition
al L
earn
ing
Inpu
t in
Min
utes
CAL Input in Minutes
Figure 3B: Isoquants for Leontif Educational Production Function and Constraints on Homework Time
Control
Dosage 1X
Dosage 2X
29
0
10
20
30
40
50
60
70
80
90
0 10 20 30 40 50 60 70 80 90 100
Trad
ition
al L
earn
ing
Inpu
t in
Min
utes
Computer-Assisted Learning (CAL) Input in Minutes
Figure 4: Isoquants for Educational Production Function (Cobb-Douglas with Unequal Factor Returns) and Constraints on Homework Time
Control
Dosage 1X
Dosage 2X

Table 1: Effects of CAL Dosage 1X and Dosage 2X on Student-Reported Minutes per Week of Math and Language Homework (1) (2) (3) (4)
Time Math Homework Time Language Homework Dosage 1X -1.434 -1.847 -0.995 -1.122
(1.441) (1.489) (1.251) (1.294) Dosage 2X -0.254 -0.853 0.234 -0.145
(1.323) (1.368) (1.174) (1.186) Diff (Dosage 2X – Dosage 1X) 1.180 0.994 1.229 0.977 (1.310) (1.377) (1.167) (1.218) Extra Covariates NO YES NO YES Observations 5,315 5,315 5,305 5,305 R-squared 0.058 0.091 0.063 0.097
Notes: 1) Dosage 1X is 10 items (approximately 20-25 minutes) of CAL per subject per week, Dosage 2X is 20 items
(approximately 40-50 minutes) of CAL per subject per week. Left out category is pure control (no CAL). 2) All columns control for baseline counterpart of dependent variable (in math or language). 3) Even-numbered columns control for all baseline test scores (math, language, reading, and vocabulary),
student gender, teacher uses ICT at home (yes/no), teacher ICT self-efficacy, and class size. 4) Cluster (class-level)-robust standard errors in parentheses. 5) *** p<0.01, ** p<0.05, * p<0.1.
31
Table 2: Effects of CAL Dosage 1X and Dosage 2X on Teacher-Reported Hours per Week Spent on Math and Language Class Preparation
(1) (2) (3) (4) Math Preparation Language Preparation
Dosage 1X -0.378 -0.416 -0.139 -0.192
(0.604) (0.601) (0.631) (0.627) Dosage 2X -0.105 -0.176 0.240 0.154
(0.573) (0.569) (0.620) (0.616) Diff (Dosage 2X – Dosage 1X) 0.273 0.240 0.380 0.345 (0.566) (0.561) (0.600) (0.592) Extra Covariates NO YES NO YES Observations 334 334 334 334 R-squared 0.179 0.203 0.254 0.274
Notes: 1) Dosage 1X is 10 items (approximately 20-25 minutes) of CAL per subject per week, Dosage 2X is 20 items
(approximately 40-50 minutes) of CAL per subject per week. Left out category is pure control (no CAL). 2) All columns control for baseline counterpart of dependent variable (in math or language). 3) Even-numbered columns control for teacher uses ICT at home (yes/no), teacher ICT self-efficacy, and class
size. 4) Cluster (class-level)-robust standard errors in parentheses. 5) *** p<0.01, ** p<0.05, * p<0.1.
32
Table 3: Effects of CAL Dosage 1X and Dosage 2X on Math and Language Test Scores (1) (2) (3) (4)
Math Test Score Language Test Score Dosage 1X 0.117*** 0.109*** 0.063* 0.068*
(0.042) (0.041) (0.037) (0.037) Dosage 2X 0.104** 0.098** -0.022 -0.005
(0.041) (0.038) (0.032) (0.032) Diff (Dosage 2X – Dosage 1X) -0.013 -0.011 -0.085 -0.073 (0.041) (0.040) (0.038) (0.037) Extra Covariates NO YES NO YES Observations 5,621 5,621 5,568 5,568 R-squared 0.366 0.429 0.429 0.483 Diff (Dosage 2X - 2*Dosage 1X) -0.129** -0.120** -0.148*** -0.141*** SE (0.073) (0.072) (0.067) (0.067)
Notes: 1) Dosage 1X is 10 items (approximately 20-25 minutes) of CAL per subject per week, Dosage 2X is 20 items
(approximately 40-50 minutes) of CAL per subject per week. Left out category is pure control (no CAL). 2) All columns control for baseline counterpart of dependent variable (baseline score in math or language). 3) Even-numbered columns control for all baseline test scores (math, language, reading, and vocabulary),
student gender, teacher uses ICT at home (yes/no), teacher ICT self-efficacy, and class size. 4) Cluster (class-level)-robust standard errors in parentheses. 5) For the concavity test reported in the last panel, statistical significance is based on a one-tailed test. 6) *** p<0.01, ** p<0.05, * p<0.1.
33
Table 4: Effects of CAL Dosage 1X and Dosage 2X on Student Interest in Math and Language (1) (2) (3) (4)
Math Interest Language Interest Dosage 1X 0.075** 0.070* 0.097** 0.085**
(0.037) (0.036) (0.039) (0.039) Dosage 2X 0.042 0.054 0.020 0.028
(0.038) (0.038) (0.041) (0.041) Diff (Dosage 2X – Dosage 1X) -0.033 -0.016 -0.076** -0.056* (0.038) (0.038) (0.039) (0.040) Extra Covariates NO YES NO YES Observations 5,173 5,173 4,887 4,887 R-squared 0.132 0.141 0.151 0.177 Diff (Dosage 2X - 2*Dosage 1X) -0.108** -0.086* -0.173*** -0.141** SE (0.064) (0.064) (0.067) (0.068)
Notes: 1) Dosage 1X is 10 items (approximately 20-25 minutes) of CAL per subject per week, Dosage 2X is 20 items
(approximately 40-50 minutes) of CAL per subject per week. Left out category is pure control (no CAL). 2) All columns control for baseline counterpart of dependent variable (in math or language). 3) Even-numbered columns control for all baseline test scores (math, language, reading, and vocabulary),
student gender, teacher uses ICT at home (yes/no), teacher ICT self-efficacy, and class size. 4) Cluster (class-level)-robust standard errors in parentheses. 5) For the concavity test reported in the last panel, statistical significance is based on a one-tailed test. 6) *** p<0.01, ** p<0.05, * p<0.1.
34
Appendix Figure 1: Quantile Effects of Dosage 1X and Dosage 2X (each versus Control) on Math Test Scores
-.5-.4
-.3-.2
-.10
.1.2
.3.4
.5Es
timat
ed T
reat
men
t Effe
ct
0 .1 .2 .3 .4 .5 .6 .7 .8 .9 1percentile
Estimated Treatment Effect 95% CI
Appendix Figure 1A: Quantile Dosage X Estimates for Math Test Score
-.5-.4
-.3-.2
-.10
.1.2
.3.4
.5Es
timat
ed T
reat
men
t Effe
ct
0 .1 .2 .3 .4 .5 .6 .7 .8 .9 1percentile
Estimated Treatment Effect 95% CI
Appendix Figure 1B: Quantile Dosage 2X Estimates for Math Test Score
35
Appendix Figure 2: Quantile Effects of Dosage 1X and Dosage 2X (each versus Control) on Language Test Scores
-.5-.4
-.3-.2
-.10
.1.2
.3.4
.5Es
timat
ed T
reat
men
t Effe
ct
0 .1 .2 .3 .4 .5 .6 .7 .8 .9 1percentile
Estimated Treatment Effect 95% CI
Appendix Figure 2A: Quantile Dosage X Estimates for Language Test Score
-.5-.4
-.3-.2
-.10
.1.2
.3.4
.5Es
timat
ed T
reat
men
t Effe
ct
0 .1 .2 .3 .4 .5 .6 .7 .8 .9 1percentile
Estimated Treatment Effect 95% CI
Appendix Figure 2B: Quantile Dosage 2X Estimates for Language Test Score

Appendix Table 1: Balance Check among Treatment Arms (Dosage 2X, Dosage 1X, and No Dosage)
(1) (2) (3) (4) (5) (6) (7) (8)
Math score
Reading score
Language score
Vocabulary score
Female (1/0)
Teacher ICT at home (1/0)
Teacher ICT self-efficacy
Class size
Dosage 1X -0.003 0.054 0.024 -0.053 0.014 0.011 0.085 0.398
(0.006) (0.040) (0.042) (0.040) (0.013) (0.060) (0.072) (0.749) Dosage2X 0.005 0.002 0.014 -0.027 0.023 0.096* -0.035 0.748
(0.005) (0.043) (0.041) (0.043) (0.014) (0.057) (0.075) (0.697) Dosage 2x – Dosage 1X 0.00791 -0.0522 -0.00995 0.0253 0.00880 0.0843 -0.120 0.350 SE 0.00619 0.0388 0.0365 0.0433 0.0136 0.0608 0.0795 0.718 N 6,052 5,839 5,839 6,052 5,742 5,903 5,903 6,253 R2 0.238 0.150 0.159 0.163 0.011 0.248 0.224 0.236
Notes: 1) All regressions control for strata (block) fixed effects. 2) Cluster (school)-adjusted robust standard errors in parentheses. 3) *** p<0.01, ** p<0.05, * p<0.1. 4) Joint tests of all baseline covariates simultaneously shows no significant difference between Dosage 1X and Control (p-value: 0.445), Dosage 2X and
Control (p-value: 0.417) or Dosage 2X and Dosage 1X (p-value = 0.700).
37
Appendix Table 2: Balance Check among Treatment Arms, Non-Attriting Students (1) (2) (3) (4) (5) (6) (7) (8)
Math score
Reading score
Language Score
Vocabulary score
Female (1/0)
Class size
Teacher ICT at
home (1/0)
Teacher ICT self-efficacy
Dosage 1X -0.067 0.031 -0.009 -0.052 -0.012 0.589 -0.046 -0.146
(0.050) (0.041) (0.048) (0.039) (0.013) (0.747) (0.142) (0.121) Dosage 2X -0.100* -0.013 -0.008 -0.060 -0.025* 0.807 -0.156 -0.115
(0.054) (0.045) (0.046) (0.044) (0.015) (0.718) (0.122) (0.111) Observations 6,071 5,950 5,950 6,071 6,242 6,242 6,172 6,172 R-squared 0.186 0.144 0.158 0.155 0.010 0.225 0.224 0.244 Diff (Dosage 2X - Dosage 1X) -0.033 -0.044 0.001 -0.008 -0.013 0.219 -0.11 0.030 SE 0.057 0.040 0.047 0.043 0.013 0.738 0.145 0.116 Notes:
1) All regressions control for strata (block) fixed effects. 2) Cluster (school)-adjusted robust standard errors in parentheses. 3) *** p<0.01, ** p<0.05, * p<0.1.

Appendix Table 3: Heterogeneous Effects of CAL Dosage 1X and Dosage 2X on Math and Language Test Scores, by Student Gender (1) (2) (3) (4)
Math Test Score Language Test Score Dosage 1X 0.104** 0.100** 0.060 0.074
(0.049) (0.046) (0.046) (0.045) Dosage 2X 0.083* 0.074 0.007 0.018
(0.048) (0.045) (0.041) (0.041) Female 0.032 -0.028 0.110*** 0.103*** (0.038) (0.036) (0.038) (0.036) Female * Dosage 1X 0.024 0.016 0.008 -0.012
(0.055) (0.052) (0.054) (0.051) Female * Dosage 2X 0.042 0.045 -0.052 -0.043
(0.055) (0.053) (0.051) (0.048) Extra Covariates NO YES NO YES Observations 5,621 5,621 5,568 5,568 R-squared 0.367 0.429 0.431 0.483
Notes: 1) Dosage 1X is 10 items (approximately 20-25 minutes) of CAL per subject per week, Dosage 2X is 20 items
(approximately 40-50 minutes) of CAL per subject per week. Left out category is pure control (no CAL). 2) All columns control for baseline counterpart of dependent variable (baseline score in math or language). 3) Even-numbered columns control for all baseline test scores (math, language, reading, and vocabulary),
student gender, teacher uses ICT at home (yes/no), teacher ICT self-efficacy, and class size. 4) Cluster (class-level)-robust standard errors in parentheses. 5) *** p<0.01, ** p<0.05, * p<0.1.

39
Appendix Table 4: Effects of CAL Dosage 1X and Dosage 2X on Interest in Math and Language, by Gender (1) (2) (3) (4)
Math Interest Language Interest Dosage 1X 0.079 0.071 0.093 0.082
(0.051) (0.049) (0.057) (0.056) Dosage 2X 0.063 0.075 0.027 0.026
(0.054) (0.053) (0.061) (0.061) Female 0.011 0.021 0.245*** 0.229*** (0.052) (0.051) (0.052) (0.053) Female * Dosage 1X -0.007 -0.016 0.007 0.006
(0.068) (0.067) (0.068) (0.068) Female * Dosage 2X -0.041 -0.039 0.003 0.005
(0.071) (0.070) (0.073) (0.074) Extra Covariates NO YES NO YES Observations 5,173 5,173 4,887 4,887 R-squared 0.132 0.141 0.167 0.177
Notes: 1) Dosage 1X is 10 items (approximately 20-25 minutes) of CAL per subject per week, Dosage 2X is 20 items
(approximately 40-50 minutes) of CAL per subject per week. Left out category is pure control (no CAL). 2) All columns control for baseline counterpart of dependent variable (in math or language). 3) Even-numbered columns control for all baseline test scores (math, language, reading, and vocabulary),
student gender, teacher uses ICT at home (yes/no), teacher ICT self-efficacy, and class size. 4) Cluster (class-level)-robust standard errors in parentheses. 5) For the concavity test is last panel, statistical significance is based on a one-tailed test. 6) *** p<0.01, ** p<0.05, * p<0.1.
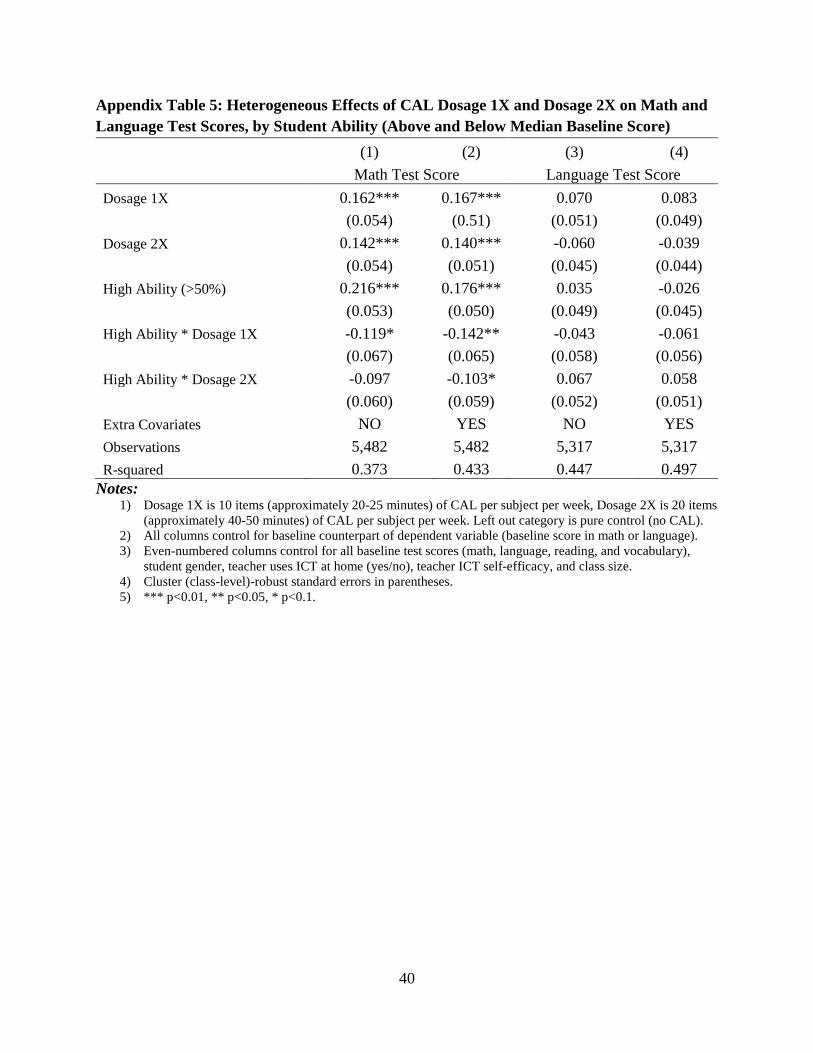
40
Appendix Table 5: Heterogeneous Effects of CAL Dosage 1X and Dosage 2X on Math and Language Test Scores, by Student Ability (Above and Below Median Baseline Score) (1) (2) (3) (4)
Math Test Score Language Test Score Dosage 1X 0.162*** 0.167*** 0.070 0.083
(0.054) (0.51) (0.051) (0.049) Dosage 2X 0.142*** 0.140*** -0.060 -0.039
(0.054) (0.051) (0.045) (0.044) High Ability (>50%) 0.216*** 0.176*** 0.035 -0.026 (0.053) (0.050) (0.049) (0.045) High Ability * Dosage 1X -0.119* -0.142** -0.043 -0.061
(0.067) (0.065) (0.058) (0.056) High Ability * Dosage 2X -0.097 -0.103* 0.067 0.058
(0.060) (0.059) (0.052) (0.051) Extra Covariates NO YES NO YES Observations 5,482 5,482 5,317 5,317 R-squared 0.373 0.433 0.447 0.497
Notes: 1) Dosage 1X is 10 items (approximately 20-25 minutes) of CAL per subject per week, Dosage 2X is 20 items
(approximately 40-50 minutes) of CAL per subject per week. Left out category is pure control (no CAL). 2) All columns control for baseline counterpart of dependent variable (baseline score in math or language). 3) Even-numbered columns control for all baseline test scores (math, language, reading, and vocabulary),
student gender, teacher uses ICT at home (yes/no), teacher ICT self-efficacy, and class size. 4) Cluster (class-level)-robust standard errors in parentheses. 5) *** p<0.01, ** p<0.05, * p<0.1.

41
Appendix Table 6: Effects of CAL Dosage 1X and Dosage 2X on Interest in Math and Language, by Student Ability (Above and Below Baseline Median Score) (1) (2) (3) (4)
Math Interest Language Interest Dosage 1X 0.123** 0.120** 0.086* 0.081
(0.053) (0.52) (0.052) (0.052) Dosage 2X 0.078 0.089* -0.040 -0.031
(0.049) (0.048) (0.056) (0.056) High Ability (>50%) 0.178** 0.089 0.087* -0.011 (0.052) (0.059) (0.049) (0.058) High Ability * Dosage 1X -0.094 -0.105 -0.007 -0.021
(0.073) (0.073) (0.064) (0.065) High Ability * Dosage 2X -0.069 -0.071 0.083 0.081
(0.066) (0.066) (0.069) (0.068) Extra Covariates NO YES NO YES Observations 5,053 5,053 4,696 4,696 R-squared 0.134 0.140 0.154 0.177
Notes: 1) Dosage 1X is 10 items (approximately 20-25 minutes) of CAL per subject per week, Dosage 2X is 20 items
(approximately 40-50 minutes) of CAL per subject per week. Left out category is pure control (no CAL). 2) All columns control for baseline counterpart of dependent variable (in math or language). 3) Even-numbered columns control for all baseline test scores (math, language, reading, and vocabulary),
student gender, teacher uses ICT at home (yes/no), teacher ICT self-efficacy, and class size. 4) Cluster (class-level)-robust standard errors in parentheses. 5) For the concavity test is last panel, statistical significance is based on a one-tailed test. 6) *** p<0.01, ** p<0.05, * p<0.1.

42
Appendix A: Psychometric Properties of the Exams The exams (collectively known as the PROGRESS toolkit) were specifically developed to assess student achievement in grade 3 in Russian schools. The exams are typically (as in our study) administrated twice: once at the beginning of the school year and once at the end of the school year.
The exams cover four areas: math, language, reading and vocabulary. Exam items for these areas were chosen based on the Russian Federal Standards for primary education. The math and language areas include 5 thematic blocks each with respectively 30 and 66 items in total. The reading and vocabulary areas include two blocks of items each with 42 and 39 items in total. The items are of different formats such as multiple choice, short answer, and matching. All items are scored dichotomously.
Testing is conducted during two 40-minute sessions. One session tests language and reading, while another session tests math and vocabulary. Testing is computer-based and adaptive. Students are assessed in schools’ computer rooms under the supervision of one trained adult per classroom.
The dichotomous Rasch model (Wright & Stone, 1979; Bond and Fox 2015) is used in the psychometric analysis of the exams. In this model, each item is characterized by one parameter (difficulty), and each student is also characterized by one parameter (ability). Rasch analysis places students and items on the same log-odds measurement scale (Linacre J. M., 2011).
In our study, the exams exhibited good psychometric properties. The constructs underlying the four exam areas (math, language, reading, and vocabulary) were essentially unidimensional. All items demonstrated good model fit. Exam reliability (Cronbach’s alpha and Person reliability) varied from 0.82 to 0.96. No items demonstrated floor or ceiling effects (during the baseline or the endline). There was no evidence of differential item functioning (DIF) by gender or local region.
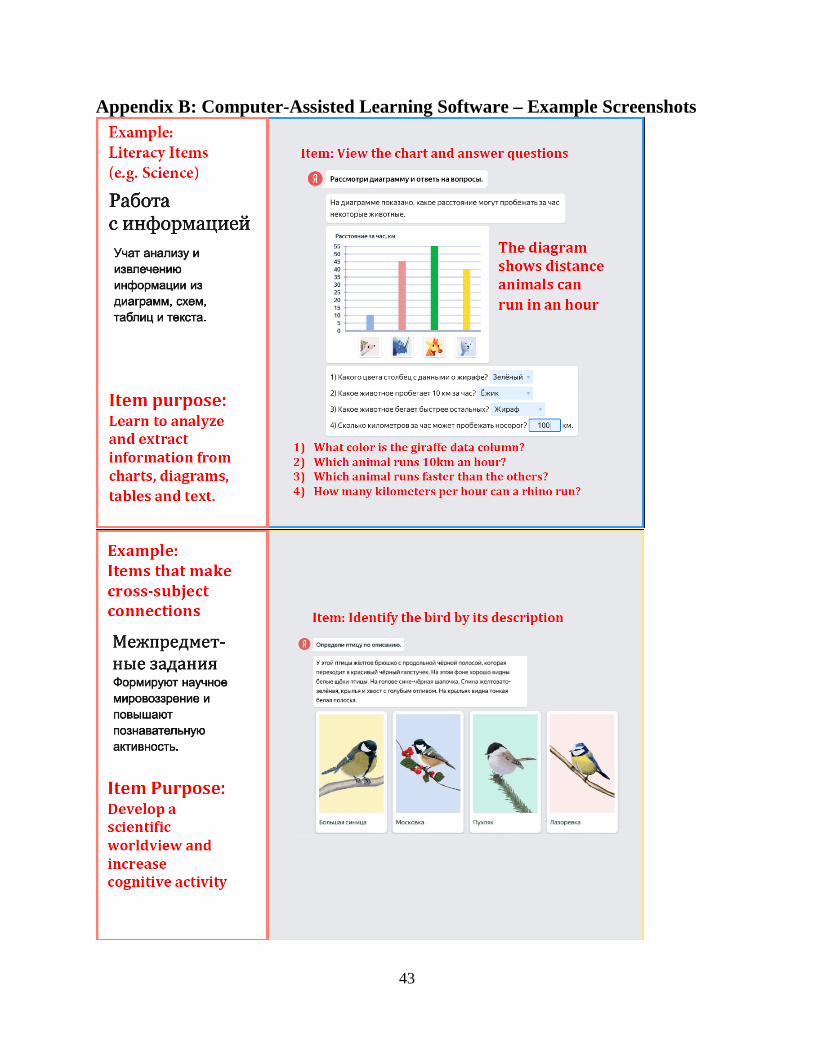
43
Appendix B: Computer-Assisted Learning Software – Example Screenshots
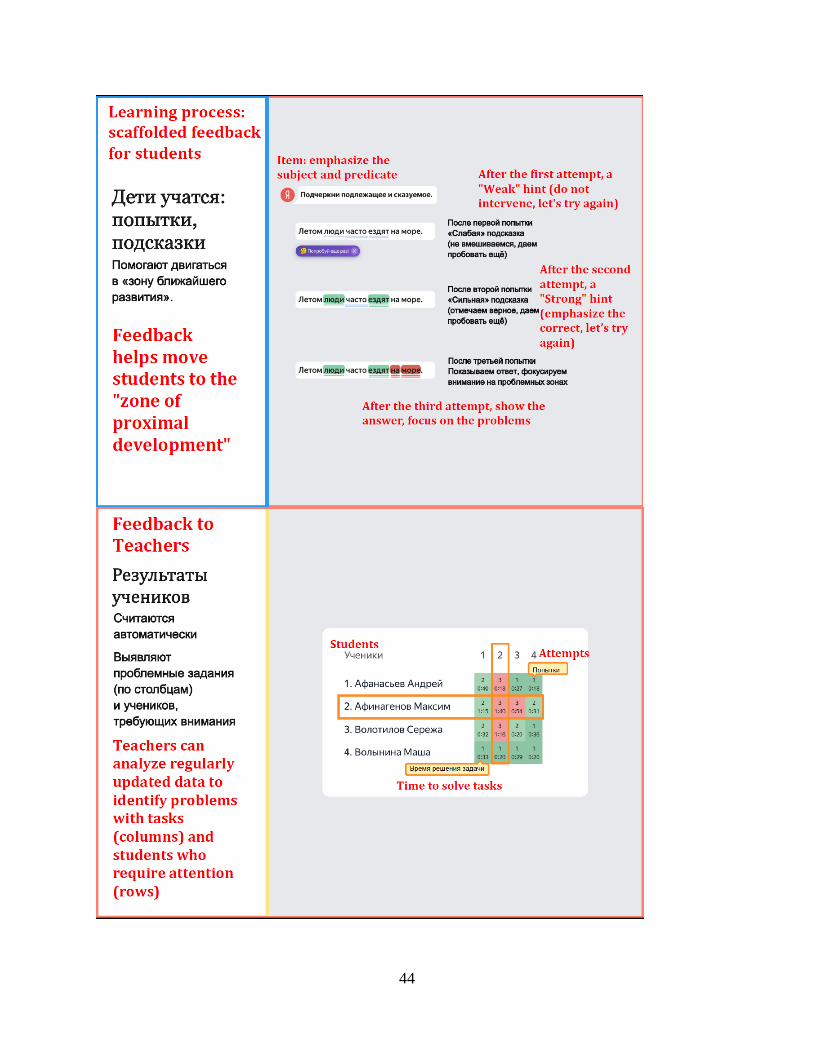
44