document resume - eric - education resources ... resume ed c86 751 ud 013 977 author goettee,...
TRANSCRIPT

DOCUMENT RESUME
ED C86 751 UD 013 977
AUTHOR Goettee, MargaretTITLE Interdependent Learning in an Open Classroom Setting;
Dean Rusk Elementary School, 1972-73. Research andDevelopment Report, Volume 7, Number 7, August1973.
INSTITUTION Atlanta Public Schools, Ga.PUB DATE Aug 73NOTE 43p.
EDRS PRICEDESCRIPTORS
IDENTIFIERS
ABSTRACT
MF-$0.65 HC-$3.29*Compensatory Education Programs; *ElementarySchools; Paraprofessional School Personnel; ProgramEvaluation; Reading Instruction; Teaching Methods;*Urban SchoolsCareer Opportunities Program; ComprehensiveInstructional Program; Elementary Secondary EducationAct; ESEA Title I Programs; ESEA Title IV A Programs;Follow Through; Georgia
All special programs at Dean Rusk Elementary School,funded in part under Title I of the 1965 Elementary SecondaryEducation Act, combined to facilitate individualized instruction inthe nongrarled, open classroom setting of the school. To better meetthe needs of the pupils during the 1972-73 school year, the FollowThrough Program included, for the first time, the pupils in levelscorresponding to grade three. As a result, the Follow Through Programoperated in levels corresponding to grades Kindergarten throughthree:. In addition, the Title I Program was restructured so that themost educationally deprived pupils were taken from the classroom forone hour of intensive reading instruction each day. The CareerOpportunitie;5 Prog'-am paid all college costs for aides to attendaccredited c ,lleges or universities. Three aides at Dean RuskElementary S:'hool participated in COP. The ComprehensiveInstructiona_ Program was concerned with curriculum improvement andteacher inse vice training. Follow Through made use of theInterdepend t Learning Model, a games approach to learning. Theproject util.zed a specialized method of teaching phonic skills andoffered spec _al instruction in music, art, speech, and inactivecommunicatiul. The Title IV-A program consisted of a breakfastprogram and 3n extended day program for pupils six through 12 yearsold. (Author,JM)
RESEARCH AND DEVELOPMENT REPORT
Vol. VII, No. 7 August, 1973
INTi:RDEPENDENT LEARNING IN ANOPEN CLASSROOM SETTING
Dean Rusk Elementary School1972-73
Thomas E. RudolphPrincipal
Doll Shirley Mrs. Grace ThompkirisTitle I Lead Teacher Follow Through Program Assistant
Prepared by
Margaret D. GoetteeResearch Assistant
Dr. Jarvis BarnesAssistant Superintendent
for Research and Development
Dr. Alonzo A. CrimSuperintendent
Atlanta Public Schools224 Central Avenue, S.W.Atlanta, Georgia 30303
U.S DEPARTMENT OF HEALTH.EDUCATION & WELFARENATIONAL INSTITUTE OF
EDUCATIONTHIS DOCUMENT HAS BEEN REPRODUCl0 EXACTLY AS RECEIVED FROMTHE PERSON OR ORGANIZATION ORIGINATING IT POINTS OF VIEW OR OPINIONSSTATFO DO NOT NECESSARILY kEPRESENT OFFICIAL NATIONAL INSTITUTE OFEDUCATION POSITION OR POLICY

Word Processing Staff: Lois Denton and Jane Hooper

TABLE OF CONTENTS
Page
RATIONALE 1
SUPPORTING PROJECTS
Career Opportunities Program 1
Comprehersive Instructional Program 2
Follow Through Program 2
Elementary and Secondary Education Act (ESEA),Title I . 2
Title IV-A Extended Day 2
NEEDS OF THE PUPILS 3
GOALS, OBJECTIVES , CRITICAL VARIABLES 3
MANAGEMENT AND CONTROL
Management and Control of Title I 5
Management and Control of Follow Through 6
PROCESS
Process of the Title I Program 6
Process of the Follow Through Program 7
DIAGNOSIS 8
EVALUATION 9
Performance of the Follow Through Pupils 10
Phonic Skills 10Mathematics and Reading Performance of theFollow Through Pupils 15
Self-Concept of the Follow Through Pupils 19Follow Through Home Visitation 25Follow Through Parent Participation 25Psychological Services 26Follow Through Health Services 26Follow Through Social Services 27
TABLE OF CONTENTS (CONT'D)
Page
Performance of the Title I Pupils 27Career Opportunities Program 30Pupil Attendance 31
COST ANALYSIS 31
CONCLUSIONS 33
RECOMMENDATIONS 36
LIST OF TABLES
Number Page
1 Pupil Achievement Study Using the Ilwa Testsof Basic Skills, April, 1973, Dean RuskElementary School 11
2 Phonic Skills Test Performance of the KindergartenPupils, 1972-73 12
3 Phonic Skills Test Performance of the Pod I (FirstGrade) Pupils, November, 1972 13
4 The Phonic Skills Test Scores of the Pod II (SecondGrade) Pupils, November, 19 72 14
5 Analysis of Variance of the Phonic Skills Test RawScores Among the Pod II (Second Grade) Pupils . 14
6 The Phonic Skills Test Performance of the Pod II(Third Grade) Pupils, November, 1972 16
7 Analysis of Variance of the Phonic Skills Test RawScores of the Pod II (Third Grade) Pupils,November, 1972 17
8 A Comparison of the Iowa Tests of Basic SkillsPerformance of the Pod I (First Grade) Pupils --1972 -73 18
9 A Comparison of the Iowa Tests of Basic SkillsScores of the Pod II (Second Grade) 1972-73 . 20
10 Analysis of Variance of the Iowa Tests of BasicSkills Scores Among Pod II (Second Grade)Pupils -- 1972-73 21
11 A Comparison of the Iowa Tests of Basic SkillsScores of the Pod II (Third Grade) Pupil1972-73
12 Analysis of Variance of the Iowa Tests of BasicSkills Scores Among Pod H (Third Grade) Pupils --1972 -73
22
23
LIST OF TABLES (CONT'D)
Number Page
13 Self-Appraisal Inventory_ Follow Through Pupils1972-73 24
14 Follow Through Home Visitation, 1972-73 25
15 Follow Through Health Service Data, 1972-73 . 26
16 Follow Through Social Services Contact Report,1972-73 2r'
17 Self-Appraisal of the Title I Pupils, 1972-73 . . 28
18 Metropolitan Achievement Tests, Title 1 Pupils,1972-73 N = 75 29
19 Opinionnaire on Attitudes Toward Education,1972-73 30
20 Cost Analysis, 1972-73, Total Average DailyAttendance (K-7) = 530 32
I. RATIONALE
Dean Rusk Elementary School was found to have both effectivereading and effective rr.athematics programs during the 1971-72school year based on the "Effective? Acceptable?" study conductedby the Division of Research and Development. .liowever, in orderfor a program to be designated as acceptable during 1971-72, thepupils had to perform on the Metropolitan Achievement Tests (MAT)at levels corresponding to their grade levels. (Performance atgrade level on the standardized test indicated the pupils were performingat the national norm.) The median performance levels of the pupilsat Dean Rusk School were from one to two levels below grade levelin mathematics and from one to three levels below grade levelin reading.
To better meet the needs of the pupils at Dean Rusk ElementarySchool during the 1972-73 school year, the Follow Through Programincluded, for the first time, the pupils in levels correspondingto grade three. As a result, the Follow Through Program operatedin levels corresponding to grades K-3 at Dean Rusk ElementarySchool. In addition, the Title I Program was restructured so thatthe most educationally deprived pupils were taken from the classroomfor one hour of intensive reading instruction each day. Dean RuskSchool had the benefit of the Career Opportunities Program (COP)and the Comprehensive Instructional Program (CIP) also.
All special programs at Dean Rusk Elmentary School combinedto facilitate individualized instruction in the nongraded, open classroomsetting of the school.
II. SUPPORTING PROJECTS
A. Career Opportunities Program
The Career Opportunities Program (COP) was a trainingprogram through which participants pursued professionalcertification. Although COP paid no salaries for aides,it did pay all college costs (tuition, books, and supplies)for aides to attend accredited colleges or universities.Three aides at Dean Rusk Elementary School participatedin COP.
-1-

B. Comprehensive Instructional Program
The Comprehensive Instructional Program (CIP) wasconcerned with curriculum improvement and teacher inservicetraining. Reading and mathematics instruction in grades 1-3of the Atlanta Public Schools was stressed. Through theCIP each school was encouraged to develop behaviorallystated objectives directed at improving the reading andmathematics instruction.
C. Follow Through Program
The Follow Through Program was designed for disadvantagedpupils. At Dean Rusk Elementary School all pupils inthe kindergarten through levels corresponding to gradethree had benefit of the Follow Through instructional program.
Follow Through made use of the Interdependent LearningModel (ILM) , a games approach to learning. The projectutilized a specialized method of teaching phonic skills,and offered special instruction in music, art, speech, andinactive communication. In addition, medical and dentalcare and psychological guidance were offered to all eligiblepupils (pupils from homes designated as low-income bythe Economic Opportunity Atlanta (EOA) sliding scale) .
D. Elementary and Secondary Education Act (ESEA), Title I
The emphasis of the Title I program at Dean RuskElementary School was on improving the reading skillsof the most educationally deprived pupils. Toward thiseffort, a lead teacher and five aides were hired throughTitle I funds.
E. Title N -A Extended Day
The Title IV:A. program at Dean Rusk Elementary Schoolconsisted of a breakfast program and an extended day programfor pupils 6-12 years old. The program operated untilDecember, 1972, at which time federal funding ceased.
-2-

III. NEEDS OF THE PUPILS
The Follow Through pupils at Dean Rusk Elementary Schoolwere recognized as having the following needs:
A . To learn to read.
B. To develop mathematical ability .
C. To deiielop positive self-concepts and positive attitudestoward school, teachers, and peers.
D. To become independent learners.
E. To receive parental reinforcement for the Follow Throughinstructional program.
F . To receive medical and dental care.
G. To have psychological services available when needed.
IV. GOALS, OBJECTIVES, CRITICAL VARIABLES'
A. Goal: To enable pupils to read.
1. Phonic Skills Objective for Follow Through Pupils:The pupils will increase their competence in phonicskills so that they will achieve the following raw scoreson the Phonic Skills Test (PST) posttest. Kindergarten,19; Pod I (grade one), 31; Pod II (grade itwo) , 43;and Pod II (grade .three), 61.
Critical Variable: Phonic skills.
2. Reading Objective for all Pupils in Pods II-IV (Grades2-7): The pupils will achieve the projected levelon the Iowa Tests of Basic Skills (ITBS) as definedby the Pupil Achievement Study conducted by the Divisionof Research and Development.
Critical Variable: Reading skills.
-3-

3. Reading Objective for the Title I Pupils: Pupils whoparticipate in the English-Reading activity will showa gain, between the pretest and posttest of the MetropolitanAchievement Tests (MAT) , of at least one month foreach month in the program in word knowledge andreading.
Critical Variables: Word knowledge and reading.
B. Goal: To enable pupils to develop mathematics skills.
Objective for the Pupils in Pods II-IV (Grades 2-7): Thepupils will achieve the projected level as defined by thePupil Achievement Study conducted by the Division of,Research and Development.
Critical Variable: Mathematics skills.
C. Goal: To enable pupils to develop positive self concepts.
1. Objective of Follow Through: The Follow Throughpupils will demonstrate positive self-concepts on theSelf-Appraisal Inventory (SAI) .
2. Objective of Title I Participants: Pupils will showimprovement in self-concept and will demonstrate positiveself-concepts on the Self-Appraisal Inventory (SAI) .
Critical Variable: Self-concept.
The following objectives pertain to the Follow Throlgh Programonly:
D. Goal: To promote parental involvement in the Follow ThroughProgram.
Objective: An increased number of parents will participatein parent meetings, in classroom visitation, and in parentvolunteer groups during the 1972-73 school year as measuredby a comparison of records kept by the Follow Throughpersonnel.
Critical Variable: Parental Involvement.
-4-
E. Goal: To provide medical and dental care for all eligibleFollow Through pupils.
Objective: Each eligible Follow Through child will receivemedical and dental check-ups during the year and, whenindicated, additional treatment. Individual medical recordsin the form of a survey-checklist will be kept for eachchild.
Critical Variable: Health.
F. Goal: To provide psychological services to pupils.
Objective: Psychological services will be made availableto all eligible pupils as needed. Referrals to psychologistswill be made by teachers, social workers, or Follow Throughstaff when a need is observed so that the reason for referralwill be eliminated.
Critical Variable: Psychological health.
V. MANAGEMENT AND CONTROL
The principal was the chief administrator of Dean Rusk ElementalrySchool. Serving under the principal were all staff members atthe school, including special project personnel. The role of theleaders of special projects within the school was that of coordinatingthe instructional and special activities of the projects. The leadteacher for Title I supervised the Title I Program; the programassistant for Follow Through coordinated Follow Through activities.
1
A. Management and Control of Title I
The Title I staff consisted of the Title I lead teacherand five Title I aides. Since there were a total of 102pupils from Pods I-IV (grades 1-7) in the program, threeof. the aides each worked with 20 pupils during the school'day and two of the aides each worked with 21 pupils.However, each aide did not work with her total assignedgroup as a class; rather, the pupils were divided intofive small groups consisting of three to six pupils, andeach small group was tutored during one instructionalperiod.
-5-

There were five one-hour instructional periods duringthe school day. Each period was divided as follows:10 minutes for preparation by aide, 45 minutes for instruction,and 5 minutes for a break. The sixth period of the daywas used by the lead teacher and the aides for evaluationof the pupils' progress and for inservice training.
Title I reading instruction took place outside the classroomin one of several small rooms designated for Title I activities,but care was taken in scheduling so that no child missedthe basic reading and mathematics instructiou in his classroom.
B. Management and Control of Follow Through
In addition to the program assistant, the local FollowThrough staff included the following: (1) one parent assistant,(2) three parent workers, (3) classroom teachers at levelscorresponding to grades K-3, and (4) one educationalaide for each Follow Through classroom. As the nameimplies, the parent assistant and parent workers wereparents of Follow Through pupils. The parent assistanthandled all clerical work for Follow Through; and theparent workers visited the homes of each eligible FollowThrough pupil, supervised the transportation of FollowThrough pupils to the dentist and physician, and soughtparent volunteers for Follow Through.
VI. PROCESS
in the opeil (.,,Rssroom setting of Dean Rusk Elementary School,the pupils were grouped into four nongraded clusters or pods.With4.n each pod the following levels operated: Pod I, levels 1-4;Pod II, levels 5-11; Pod III, levels 12-15; and Pod IV, levels 16-20.
A. Process of the Title I Program
The Title I Program was designed for teaching readingskills to the most educationally deprived pupils in grades 1-7.The 102 pupils were selected for participation on the followingbasis: Metropolitan Achievement Tests (MAT) scores,Comprehensive Instructional Program (CIP) scores, andteacher recommendations.
-6-
The following reading skills were taught in the program:
1. To identify and write capital and lower case lettersof the alphabet.
2. To sound the letters individually.
3. To sound long and short vowels.
4. To sound initial consonants, blends, digraphs, dipthongs,and phonograms.
5. To identify root words, prefixes, suffixes, and compounds.
6. To identify synonyms, antonyms, and homonyms.
7. To divide wards into syllables, thus helping in pronunciation.
8. To identify contractions.
9. To identify main and implied ideas from sentences,paragraphs, and stories.
10. To spell.
11. To communicate using correct English.
A variety of materials were used in the program to facilitateinstruction. They were as follows: (1) stencils, (2) paper andpencil, (3) flannel boards, (4) a record player, (6) a languagemaster, (6) a tape recorder, (7) a television, (8) flash cards,(9) talking books, and (10) instructional games. No basal readerswere used in the program; they were used in general classroomreading instruction.
B. Process of the Follow Through Program
The Interdependent Learning Model (ILM) was the basicmodel for teaching all Follow Through classes. The modelmade use of a game format for reinforcing classroom instructionand strengthening skills. The games, which were madeby the Follow Through staff and parent volunteers, weredeveloped as needed.
An important component of the ILM was the methodutilized for teaching phonic skills. All Follow Through
-7-

classes at Dean Rusk were taught the Direct Approachto Decoding (DAD) . The DAD was used along with basalreaders.
A Follow Through aide was assigned to each FollowThrough class. The aide worked under the guidance ofthe classroom teacher and served mainly as a tutor forsmall groups of pupils.
The three parent workers worked with the Follow Throughsocial worker and directly under the Follow Through programassistant. They visited the home of each eligible child,explained the Follow Through program, and attempted toenlist the active support of parents for the Follow Throughprogram.
In addition to the specialized instructional program,Follow Through offered each eligible child medicaland dental care. Also, psychological services were madeavailable to pupils who demonstrated emotional pro,)lemswhich affected classroom participation and learning.
VII. DIAGNOSIS
The following instruments were used in the evaluation of theDean Rusk Elementary School program:
A. The Metropolitan Readiness Tests (MRT) and the MetropolitanAchievement Tests (MAT) which were administered to allTitle I participants in October, 1972, and May, 1973.
B. The Iowa Tests of Basic Skills (ITBS) which was administeredto all pupils (excluding the educable mentally retardedpupils) in May, 1973.
C. The Phonic Skills Test which was administered to all FollowThrough pupils as pretest and posttest.
D. The Self-Appraisal Inventory (SAI) which was administeredto the Follow Through pupils and the Title I pupils inMarch, 1973.
-8--
E. The Opinionnaire On Attitudes Toward Education whichwas anonymously answered by the teachers and aides ofDean Rusk Elementary School.
F. Follow Through medical and dental surveys and parentparticipation records.
VIII. EVALUATION
The Pupil Achievement Study was conducted by the Divisionof Research and Development in order to compare the progressof all the elementary pupils of Atlanta Public Schools by schooland by grade level. There were eight factors involved in predictingthe scores for each grade level. The factors were as follows:
A. The 1971-72 Metropolitan Achievement Tests (MAT) readingposttest scores.
B. The 1971-72 Metropolitan Achievement Tests (MAT) mathematicscomputation posttest scores.
C. Per cent of paid lunches.
D. Per cent of paid lunches squared.
E. Per cent of pupil attendance.
F . Actual grade levels of the pupils.
G. Teacher/pupil ratio.
H. Stability index.
At Dean Rusk Elementary School the pupils achieved the predictedscores, based on the eight factors, in both reading and mathematics.Therefore, both the reading program and the mathematics programwere effective. This was the second consecutive year that themathematics program at Dean Rusk Elementary School was foundto be effective, and the third consecutive year that the readingprogram was found to be effective. (Mathematics performance wasnot included in the "Effective? Acceptable" study of 1970-71.)
-9-
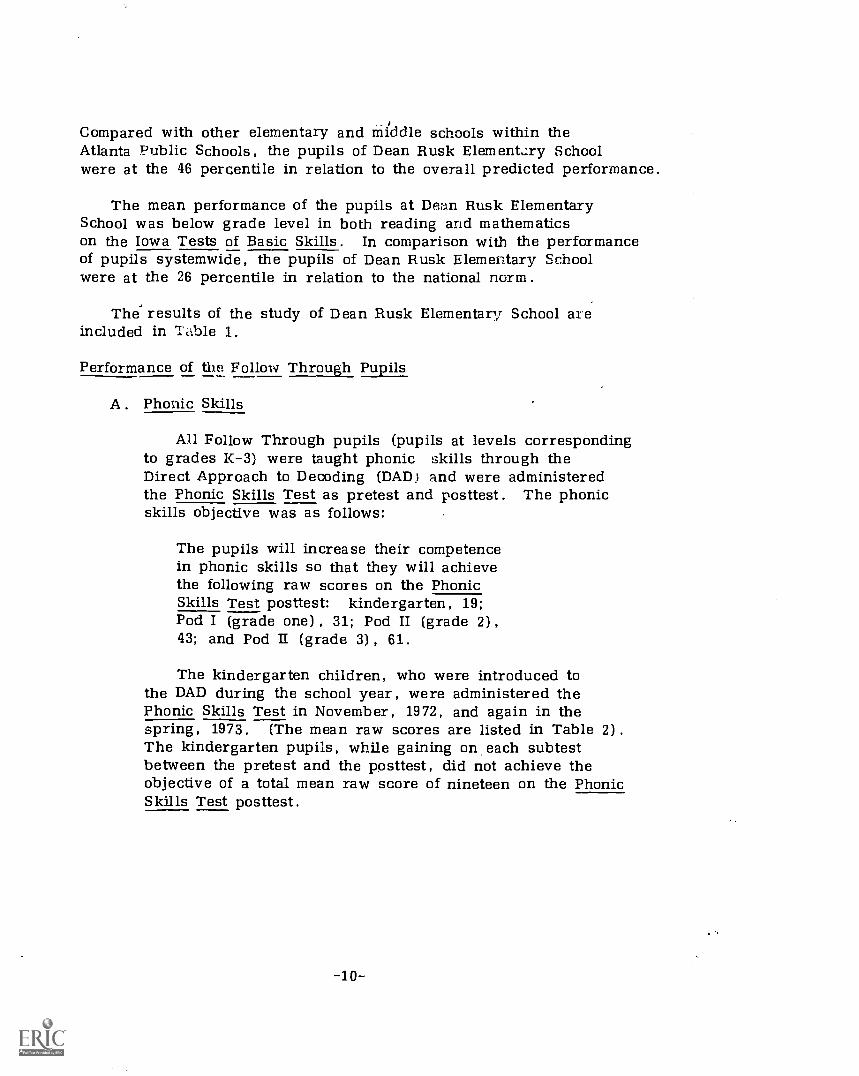
Compared with other elementary and middle schools within theAtlanta Public Schools, the pupils of Dean Rusk Elementary Schoolwere at the 46 percentile in relation to the overall predicted performance.
The mean performance of the pupils at Dean Rusk ElementarySchool was below grade level in both reading and mathematicson the Iowa Tests of Basic Skills. In comparison with the performanceof pupils systemwide, the pupils of Dean Rusk Elementary Schoolwere at the 26 percentile in relation to the national norm.
Thee results of the study of Dean Rusk Elementary School areincluded in Table 1.
Performance of the Follow Through Pupils_
A. Phonic Skills
All Follow Through pupils (pupils at levels correspondingto grades K-3) were taught phonic skills through theDirect Approach to Decoding (DAD) and were administeredthe Phonic Skills Test as pretest and posttest. The phonicskills objective was as follows:
The pupils will increase their competencein phonic skills so that they will achievethe following raw scores on the PhonicSkills Test posttest: kindergarten, 19;Pod I (grade one) , 31; Pod II (grade 2) ,
43; and Pod II (grade 3), 61.
The kindergarten children, who were introduced tothe DAD during the school year , were administered thePhonic Skills Test in November, 1972, and again in thespring, 1973. (The mean raw scores are listed in Table 2).The kindergarten pupils, while gaining on each subtestbetween the pretest and the posttest, did not achieve theobjective of a total mean raw score of nineteen on the PhonicSkills Test posttest.
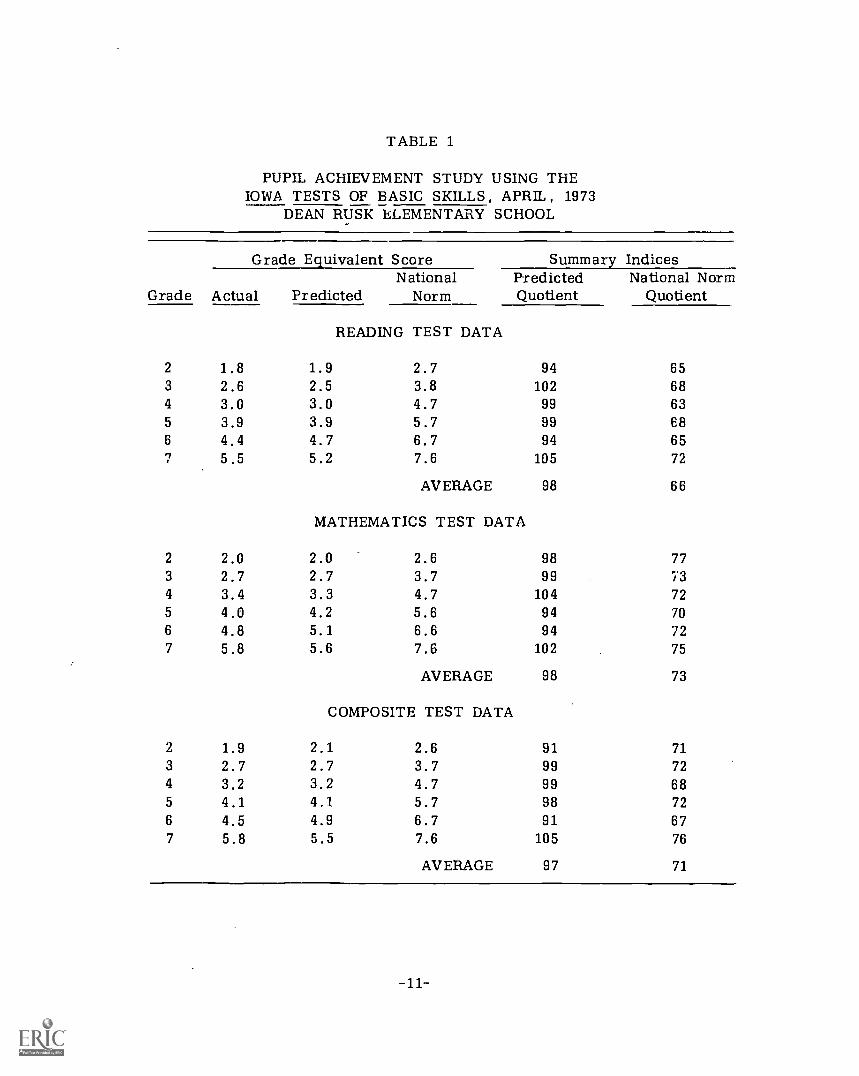
TABLE 1
PUPIL ACHIEVEMENT STUDY USING THEIOWA TESTS OF BASIC SKILLS, APRIL, 1973
DEAN RUSK ELEMENTARY SCHOOL
Grade Equivalent Score Summary IndicesNational Predicted National Norm
Grade Actual Predicted Norm Quotient Quotient
READING TEST DATA
2 1.8 1.9 2.7 94 653 2.6 2.5 3.8 102 684 3.0 3.0 4.7 99 635 3.9 3.9 5.7 99 686 4.4 4.7 6.7 94 657 5.5 5.2 7.6 105 72
AVERAGE 98 66
MATHEMATICS TEST DATA
2 2.0 2.0 2.6 98 773 2.7 2.7 3.7 99 i34 3.4 3.3 4.7 104 725 4.0 4.2 5.6 94 706 4.8 5.1 6.6 94 727 5.8 5.6 7.6 102 75
AVERAGE 98 73
COMPOSITE TEST DATA
2 1.9 2.1 2.6 91 713 2.7 2.7 3.7 99 724 3.2 3.2 4.7 99 685 4.1 4.1 5.7 98 726 4.5 4.9 6.7 91 677 5.8 5.5 7.6 105 76
AVERAGE 97 71

TABLE 2
PHONIC SKILLS TEST PERFORMANCEOF THE KINDERGARTEN PUPILS
1972-73
SubtestsPretest MeanRaw Score
Posttest MeanRaw Score
Letter Sounds 2.7 4.1Decoding 1.8 2.4Auditory Blending 1.4 3.0Oral Reading 1.0 2.4Total 6.1 17.5
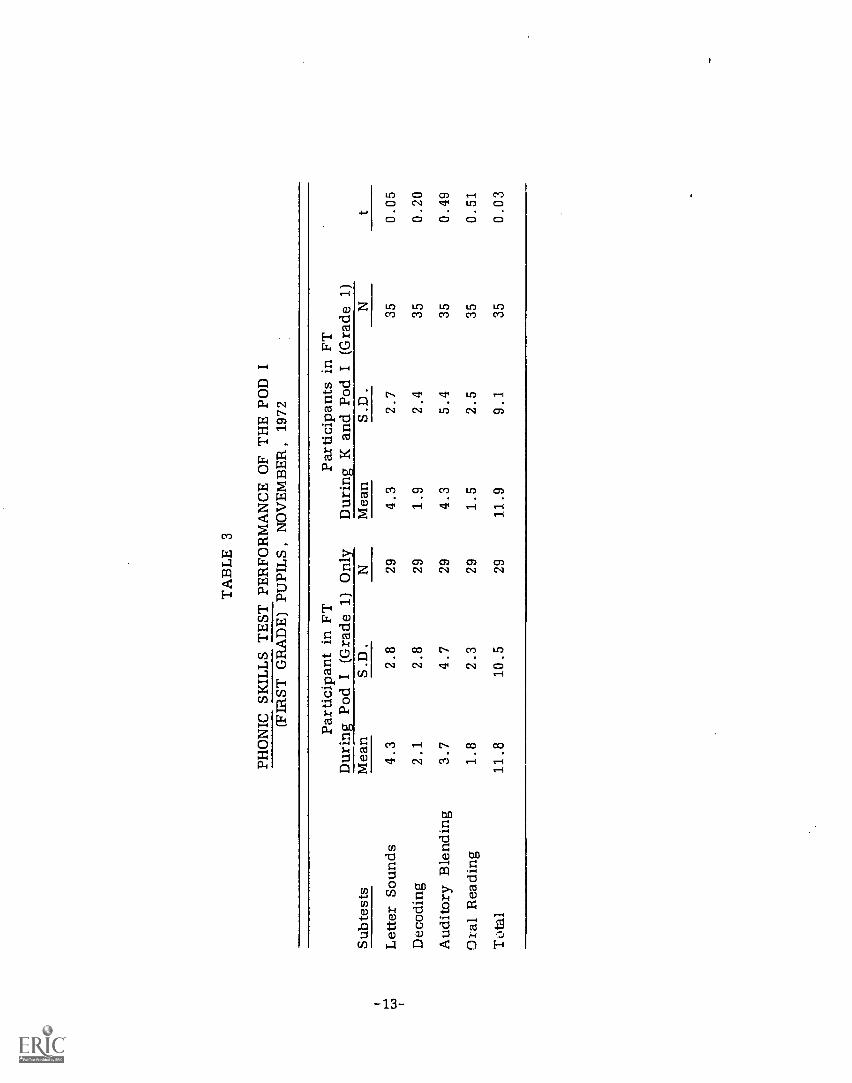
The Phonic Skills Test pretest scores of the Pod I(first grade) pupils who had attended Follow Throughkindergarten were compared with the scores of pupilswho had participated in Follow Through during thePod I only . (The comparison of the mean raw scoresis listed in Table 3.) There was no significant differencein the pretest performance of the two groups.
When given as a posttest, the mean performance ofthe total Pod I (first grade) group was as follows: Lettersounds, 7.0; .',ecoding , 3.7; auditory blending, 10.8; oralreading, 5.0; and the total test score, 26.5. Therefore,the objective rd. a total mean raw posttest score of 31 wasnot achieved the Pod I pupils.
The Pod II (second grade) pupils were divided intothree Follow Through experience groups for analysis of thePhonic Skills Test pretest performance. (The mean raw scoresof the pupils are listed in Table 4 and the analysis of varianceis shown in Table 5.) There were no significant differences(.05 level) among the scores of the Pod II (second grade)pupils who participated in Follow Through from kindergartenthrough Pod II (grade 2) , the pupils who participated duringPods I and II (first and second grades), and the pupils whoparticipated during Pod II (second grad) only. The PhonicSkills Test posttest scores for the total Pod II (second grade)group were analyzed and the mean raw scores were as follow,:Letter sounds, 9.4; decoding, 13.7; auditory blending, 22.8;oral reading, 17.7; and test total, 63.6. The second gradepupils, therefore, achieved the objective by exceeding thepredicted total test score of 43.
-12-
TA
BL
E 3
PHO
NIC
SK
ILL
S T
EST
PE
RFO
RM
AN
CE
OF
TH
E P
OD
I(F
IRST
GR
AD
E)
PUPI
LS,
NO
VE
MB
ER
, 197
2
Part
icip
ant i
n FT
Dur
ing
Pod
I (G
rade
1)
Onl
yPa
rtic
ipan
ts in
FT
Dur
ing
K a
nd P
od I
(G
rade
1)
Subt
ests
Mea
nS
.D.
NM
ean
S.D
.1 ) 03
Let
ter
Soun
ds4.
32.
829
4.3
2.7
350.
05
Dec
odin
g2.
12.
829
1.9
2.4
350.
20
Aud
itory
Ble
ndin
g3.
74.
729
4.3
5.4
350.
49
Oia
l Rea
ding
1.8
2.3
291.
52.
535
0.51
Tot
al11
.810
.529
11.9
9.1
350.
03

TA
BL
E 4
TH
E P
HO
NIC
SK
ILL
S T
EST
SC
OR
ES
OF
TH
E P
OD
II
(SE
CO
ND
GR
AD
E)
PUPI
LS,
NO
VE
MB
ER
,19
72A
O.
FT P
artic
ipan
tsD
urin
g Po
d II
(Sec
ond
Gra
de)
Onl
y
FT P
artic
ipan
tsD
urin
g Po
ds I
and
II
(Fir
st a
nd S
econ
d G
rade
s)
FT P
artic
ipan
tsD
urin
g K
thro
ugh
Pod
II (
K-g
rade
2)
Subt
ests
Mea
n R
aw S
core
S.D
.N
Mea
n R
aw S
core
S.D
.N
Mea
n R
aw S
core
S.D
.N
Let
ter
Soun
ds9.
400.
7010
8.21
2.39
148.
362.
3358
Dec
odin
g5.
703.
5910
8.71
6.58
148.
475.
2258
Aud
itory
Ble
ndin
g12
.30
6.58
1013
.43
6.57
1413
.16
6.33
58
Ora
l Rea
ding
8.00
5.53
109.
867.
5514
10.0
47.
3858
Tot
al35
.40
12.5
010
40.2
119
.33
1439
.83
19.3
058
TA
BL
E 5
AN
AL
YSI
S O
F V
AR
IAN
CE
'7 T
HE
PH
ON
IC S
KIL
LS
TE
STR
AW
SC
OR
ES
AM
ON
G T
HE
F.L
W I
I (S
EC
ON
D G
RA
DE
) PU
PIL
S
Deg
rees
of
Sum
of
Squa
res
Deg
rees
of
Sum
of
Squa
res
Free
dom
Subt
ests
Bet
wee
n G
roup
sFr
eedo
m B
etw
een
Gro
ups
With
in G
roup
sW
ithin
Gro
up
Let
ter
Soun
ds10
.24
239
0.15
791.
04D
ecod
ing
70.2
22
2,89
1.39
790.
96A
udito
ry B
lend
ing
8.09
23,
239.
1379
0.10
Ora
l Rea
ding
35.3
62
4,01
7.64
79J.
34T
otal
179.
712
27,5
05.0
379
0.26

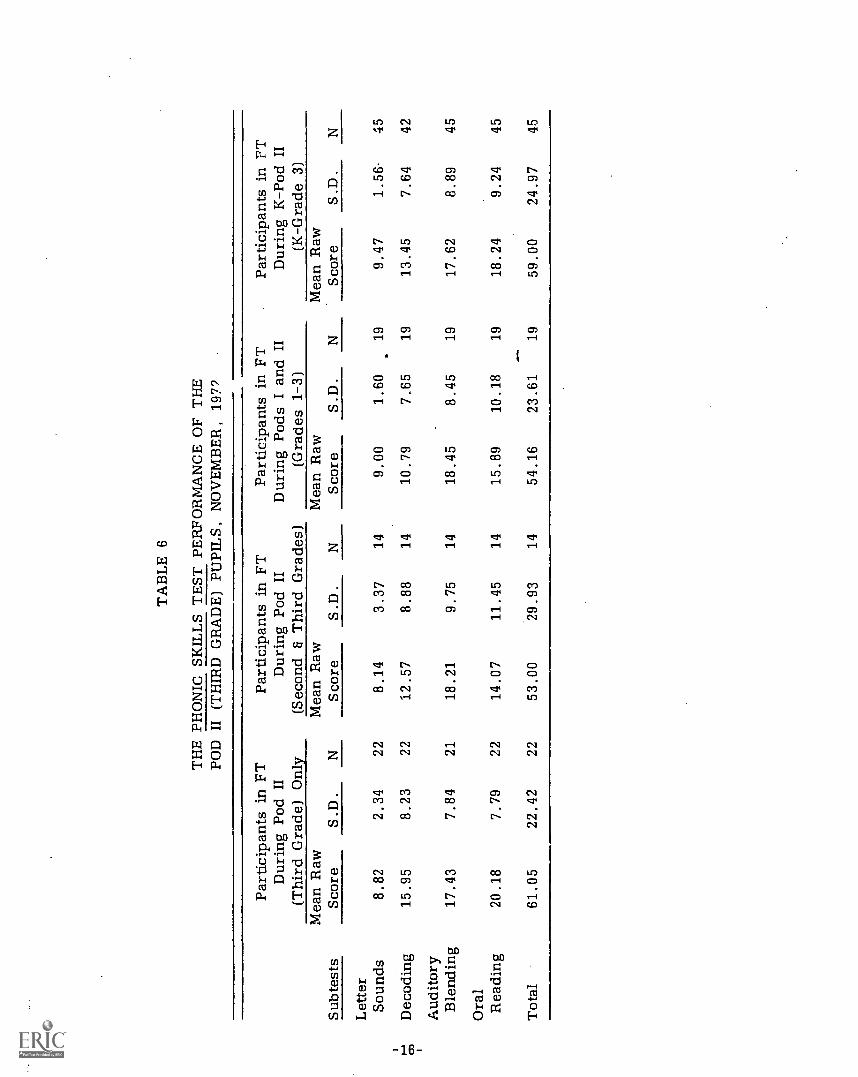
Using the salve procedures for analysis as used withthe other Follow Through levels, a comparison of the Pod II(third grade) pretest scores of the Phonic Skills Test wasmade to determine if the number of years in Follow Throughwas a factor in the performance levels of the pupils. (Themean raw scores are listed in Table 6 and the analysisof variance in Table 7.) No significant differences (.05level) in scoring were found among the four .groups.The total Pod II (third grade) mean raw scores on thePhonic Skills Test administered as posttest were as follows:Letter sounas , 9.7; decoding, 19.9; auditory blending,26.4; oral reading, 23.9; and test total, 79.8. The pupilsexceeded the predicted test total score of 61, thereby achievingthe phonic skills objective.
B. Mathematics and Reading Performance of the Follow ThroughPupils
The Follow Through Pod II (second and third grades)was included in the Pupil Achievement Study conductedby the Research and Development. Division, and the pupilswere found to be performing on the Iowa Tests of BasicSkills (ITBS) as predicted in both reading and mathematics.The scores of the Pod I (first grade) pupils were not includedin the study.
The ITBS scores of the Pod I (first grade) pupils whohad participated in the Follow Through kindergarten werecompared with the scores of the Pod I pupils who had notattended Follow Through kindergarten. (See Table 8.)There was no significant difference (.05 level) betweenthe scores.
TA
BL
E 6
TH
E P
HO
NIC
SK
ILL
S T
EST
PE
RFO
RM
AN
CE
OF
TH
EPO
D I
I (T
HIR
D G
RA
DE
) PU
PIL
S, N
OV
EM
BE
R, 1
979
Part
icip
ants
in F
TD
urin
g Po
d II
(Thi
rd G
rade
) O
nly
Part
icip
ants
in F
TD
urin
g Po
d II
(Sec
ond
& T
hird
Gra
des)
Part
icip
ants
in F
TD
urin
g Po
ds I
and
II
(Gra
des
1-3)
Part
icip
ants
in F
TD
urin
g K
-Pod
II
(K-G
rade
3)
Mea
n R
awM
ean
Raw
Mea
n R
awM
ean
Raw
Subt
ests
Scor
eS.
D.
NSc
ore
S.D
.N
Scor
eS.
D.
Scor
eS.
D.
N
Let
ter
Soun
ds8.
822.
3422
8.14
3.37
149.
001.
6019
9.47
1.56
45
Dec
odin
g15
.95
8.23
2212
.57
8.88
1410
.79
7.65
1913
.45
7.64
42
Aud
itory
Ble
ndin
g17
.43
7.84
2118
.21
9.75
1418
.45
8.45
1917
.62
8.89
45
Ora
lR
eadi
ng20
.18
7.79
2214
.07
11.4
514
15.8
910
.18
1918
.24
9.24
45
Tot
al61
.05
22.4
222
53.0
029
.93
1454
.16
23.6
119
59.0
024
.97
45

TA
BL
E 7
AN
AL
YSI
S O
F V
AR
IAN
CE
OF
TH
E P
HO
NIC
SK
ILL
S T
EST
RA
W S
CO
RE
S O
F T
HE
PO
D I
I (T
HIR
D G
RA
DE
) PU
PIL
S, N
OV
EM
BE
R, 1
972
Subt
ests
Sum
of
Squa
res
Bet
wee
n G
roup
sD
egre
es o
f Fr
eedo
mB
etw
een
Gro
ups
Sum
of
Squa
res
With
in G
roup
sD
egre
es o
f Fr
eedo
mW
ithin
Gro
ups
F
Let
ter
Soun
ds20
.56
341
6.19
961.
581
Dec
odin
g28
2.69
35,
905.
9593
1.48
Aud
itory
Ble
ndin
g15
.27
37,
246.
8195
0.07
Ora
l Rea
ding
394.
743
8,80
8.30
961.
43
Tot
al86
9,91
359
,683
.48
960.
47

TA
BL
E 8
A C
OM
PAR
ISO
N O
F T
HE
IO
WA
TE
STS
OF
BA
SIC
SK
ILL
SPE
RFO
RM
AN
CE
OF
TH
E P
OD
I (
FIR
ST G
RA
DE
) PU
PIL
S --
197
2-73
Sub
test
s
Part
icip
ants
in F
TD
urin
g Po
d I
Onl
yPa
rtic
ipan
ts in
FT
Dur
ing
K a
nd P
od I
Mea
n G
rade
Equ
ival
ent
S .D
.N
Mea
n G
rade
Equ
ival
ent
S .D
.N
t
Voc
abul
ary
1.45
0.60
331.
380.
5636
0.57
1W
ord
Ana
lysi
s1.
430.
6633
1.30
0.46
350.
97I-
-03
Rea
ding
-om
preh
ensi
on1.
720.
5234
1.91
0.54
351.
41
Spel
ling
1.68
0.51
351.
390.
3935
2.72
Mat
h C
once
pts
1.39
0.42
351.
260.
3835
1.33
Mat
h Pr
oble
m S
olvi
ng1.
450.
6734
1.53
0.56
340.
54
Mat
h T
otal
1.44
0.50
331.
410.
4234
0.30
Tes
t Tot
al1.
540.
4436
1.46
0.33
350.
79

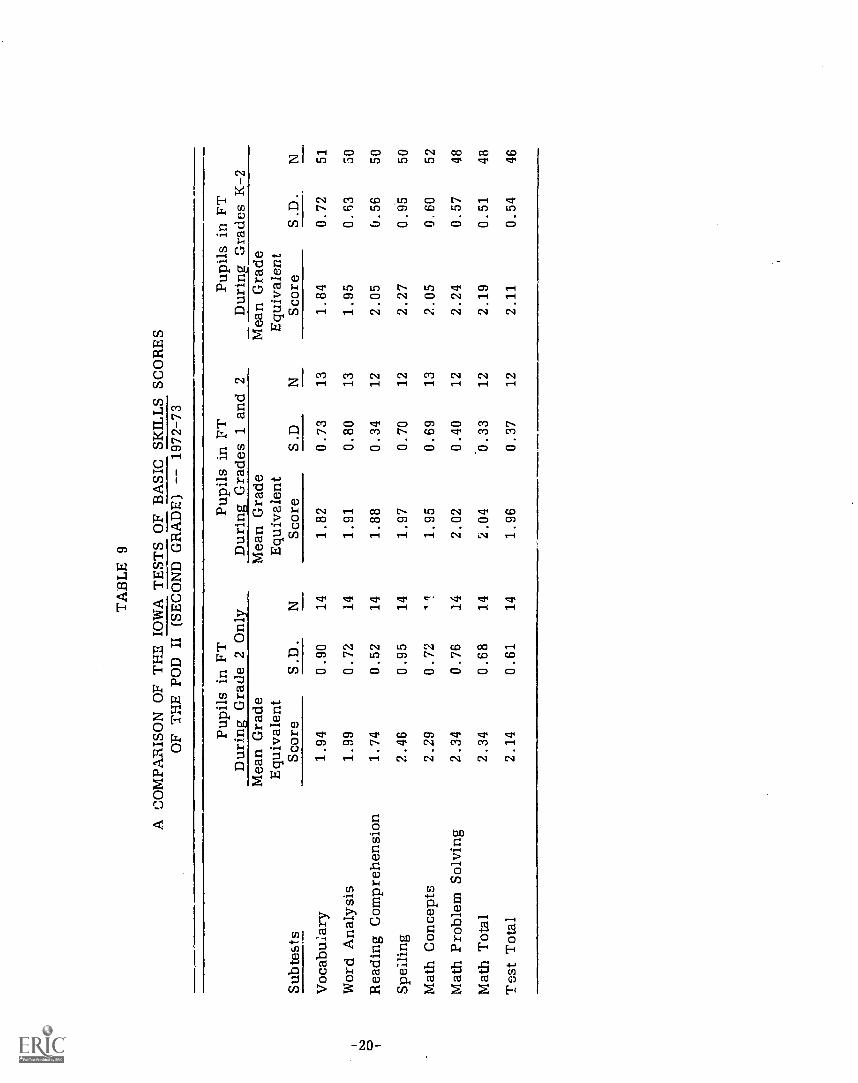
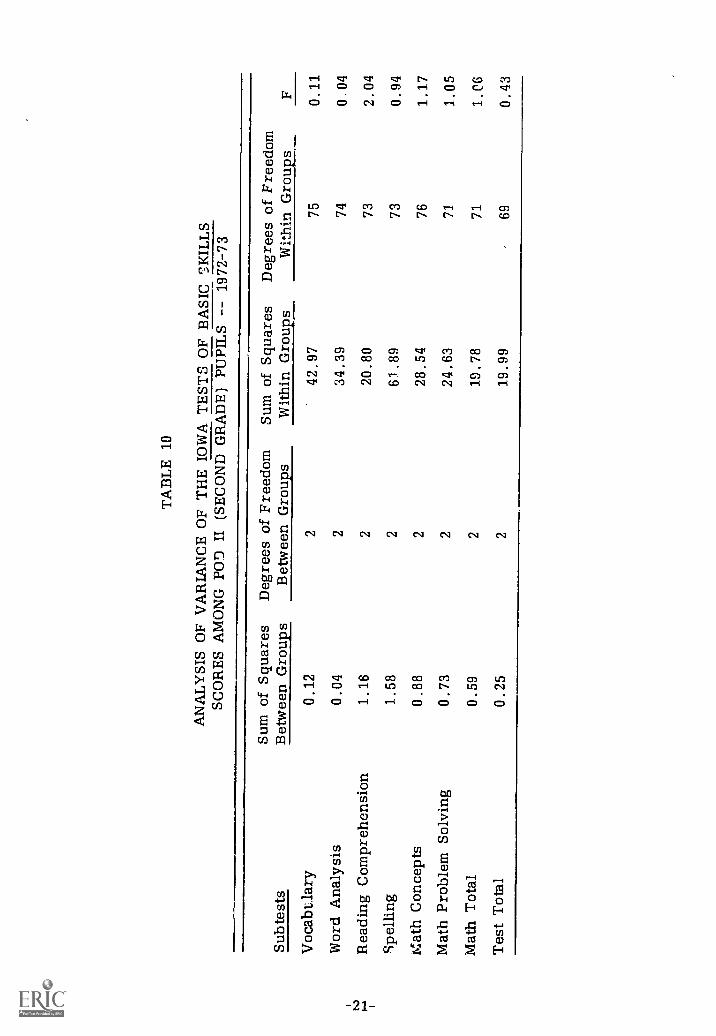
The ITBS performance of the Pod II (second grade)pupils who participated in Follow Through from kindergartenthrough Pod II (second grade) was compared with theperformance of the pupils who had participated duringPods I and II (first and second grades) and the pupilswho had participated during Pod II (second grade) only(The scores are listed in Table 9 and the analysis ofvariance in Table 10.) No significant differences werefound among the three groups.
The ITBS scores of the Pod II (third grade) pupilswere analyzed on the basis of the number of years ofFollow Through experience. (The scores are listed inTable 11 and the analysis ?f variance in Table 12.)There was no significant difference found based on thenumber of years participation in Follow Through.
C. Self-Concept of the Follow Through Pupils
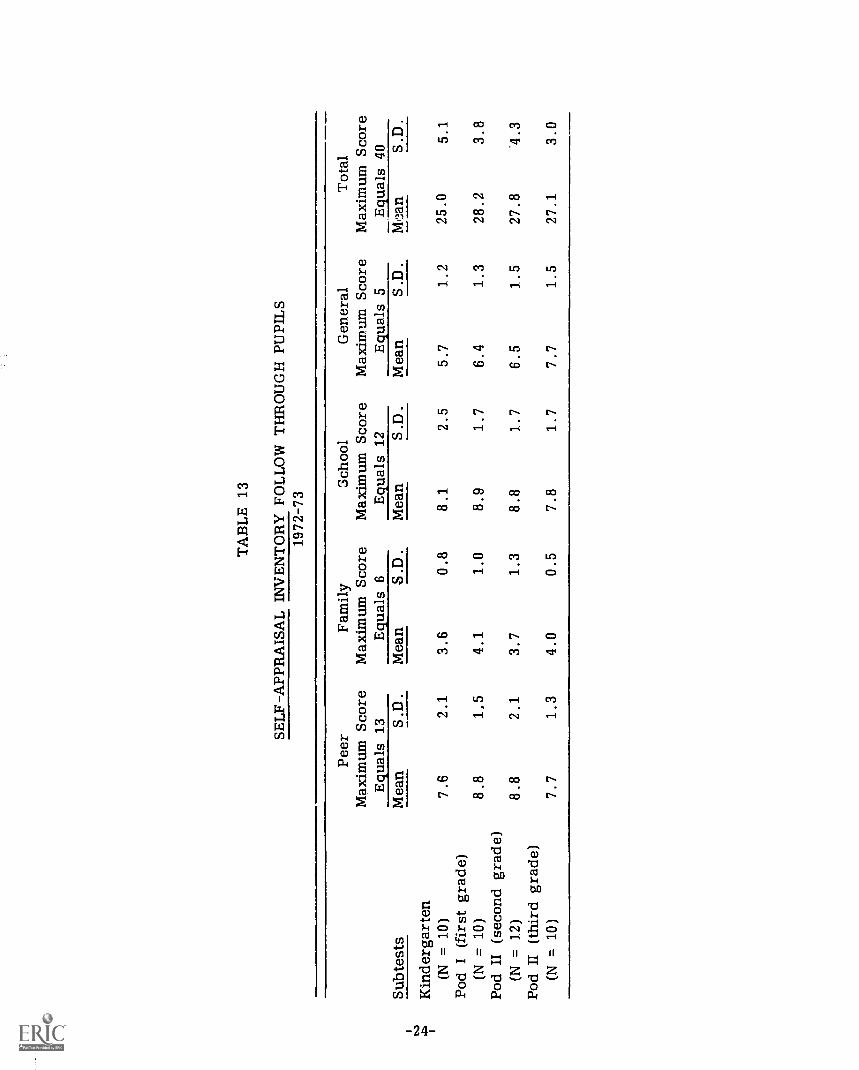
A sample of forty-two Follow Through pupils, matchedby sex, was administered the Self-Appraisal Inventory,in March, 1973, by a team from the Division of Researchand Development. The inventory measured attitudes infour areas: peer, family, school, and general. Theresults of the inventory, shown in Table 13, indicatedthe pupils had generally positive attitudes in all fourareas.
-19-
TA
BL
E 9
A C
OM
PAR
ISO
N O
F T
HE
IO
WA
TE
STS
OF
BA
SIC
SK
ILL
S SC
OR
ES
OF
TH
EPO
D I
I (S
EC
ON
D G
RA
DE
) --
1972
-73
Pupi
ls in
FT
Dur
ing
Gra
de 2
Onl
yPu
pils
in F
TD
urin
g G
rade
s 1
and
2Pu
pils
in F
TD
urin
g G
rade
s K
-2M
ean
Gra
deM
ean
Gra
deM
ean
Gra
deE
quiv
alen
tE
quiv
alen
tE
quiv
alen
tSu
b te
sts
Scor
eS.
D.
NSc
ore
S.D
NSc
ore
S.D
.N
Voc
abul
ary
1.94
0.90
141.
820.
7313
1.84
0.72
51
Wor
d A
naly
sis
1.99
0.72
141.
910.
8013
1.95
0.63
50
Rea
ding
Com
preh
ensi
on1.
740.
5214
1.88
0.34
122.
050.
5650
Spel
ling
2.46
0.95
141.
970.
7012
2.27
0.95
50
Mat
h C
once
pts
2.29
0.72
11.
950.
6913
2.05
0.60
52
Mat
h Pr
oble
m S
olvi
ng2.
340.
7614
2.02
0.40
122.
240.
5748
Mat
h T
otal
2.34
0.68
142.
040.
3312
2.19
0.51
48
Tes
t Tot
al2.
140.
6114
1.96
0.37
122.
110.
5446
TA
BL
E 1
0
AN
AL
YSI
S O
FSC
OR
ES
AM
ON
GV
AR
IAN
CE
OF
TH
E I
OW
A T
EST
S O
F B
ASI
C S
KIL
LS
POO
II
(SE
CO
ND
GR
AD
E)
PUPI
LS
1972
-73
Subt
ests
Sum
of
Squa
res
Bet
wee
n G
roup
sD
egre
es o
f Fr
eedo
mB
etw
een
Gro
ups
Sum
of
Squa
res
With
in G
roup
sD
egre
es o
f Fr
eedo
mW
ithin
Gro
ups
F
ARIcabtlary
0.12
242.97
75
0.11
Wor
d A
naly
sis
0.04
234
.39
740.
04tv 1. 1
Rea
ding
Com
preh
ensi
on1.
162
20.8
073
2.04
Spel
ling
1.58
261
.89
730.
94M
ath
Con
cept
s0.
882
28.5
476
1.17
Mat
h Pr
oble
m S
olvi
ng0.
732
24.6
371
1.05
Mat
h T
otal
0.59
219
.78
711.
06
Tes
t Tot
al0.
252
19.9
969
0.43

TABLE
11
A COMPARISON OF THE IOWA TESTS OF BASIC SKILLS SCORES
OF THEPOD
II (
TH
IRD
GR
AD
E)
PUPI
L -
- 19
72-7
3
Subtests
Pupils in FT
During Grade 3 Only
Pupils in FT
During Grades
2 a
3Pupils in FT
During Grades 1-3
Pupils in FT
During Grades K-3
Mean
Gra
deE
quiv
alen
tSc
ore
S.D.
N
Mea
n G
rade
Equ
ival
ent
Scor
eS.D.
N
Mean Grade
Equivalent
Score
S.D.
N
Mean Grade
Equivalent
Scor
eS.D.
N
Vocabulary
3.01
1.04
19
2.82
0.92
14
2.78
0.72
20
2.67
0.77
46
Reading
Com
preh
ensi
on2.91
0.93
19
2.91
0.77
14
2.71
0.86
20
2.72
0.67
46
Spel
ling
3.67
1.53
21
3.49
1.35
14
3.51
1.67
20
3.80
1.45
46
Cap
italiz
atio
n3.41
1.11
19
3.42
1.04
14
3.31
1.11
18
3.03
0.86
43
Punc
tuat
ion
3.52
1.34
19
3.34
1.04
14
3.37
1.27
20
3.02
1.09
43
Lan
guag
e U
sage
2.74
1.02
19
2.81
0.76
14
2.43
0.87
20
2.50
0.66
43
Map
Ski
lls2.57
0.89
19
2.89
0.72
14
2.67
0.91
20
2.48
0.73
46
Gra
ph T
able
2.51
0.86
19
2.50
0.83
14
2.74
0.74
20
3.09
0.48
45
Ref
eren
ceM
ater
ials
3.03
0.65
19
3.09
0.59
14
2.72
0.75
20
2.95
0.66
46
Mat
h C
once
pts
2.83
0.79
19
2.64
0.68
14
2.74
0.74
20
2.85
0.75
46
Mat
h Pr
oble
mSo
lvin
g3.25
1.00
19
2.93
0.90
14
2.79
0.59
20
2.76
0.91
46
Lan
guag
e T
otal
3.35
0.89
19
3.26
0.70
14
3.18
0.92
20
3.08
0.67
46
Wor
k St
udy
Skills Total
2.78
0.63
19
2.84
0.52
14
2.72
0.50
20
2.61
0.55
46
Mat
h T
otal
3.03
0.79
19
2.76
0.58
14
2.86
0.7G
20
2.82
0.73
46
Tes
tTotal
3.02
0.67
19
2.96
0.59
14
2.89
0.67
20
2.83
0.56
46

TA
BL
E 1
2
AN
AL
YSI
S O
F V
AR
IAN
CE
OF
TH
E I
OW
A T
EST
S O
F B
ASI
C S
KIL
LS
SCO
RE
SA
MO
NG
PO
D I
I (T
HIR
D G
RA
DE
) PU
PIL
S19
72-7
3
Sub
test
sSu
m o
f Sq
uare
sB
etw
een
Gro
ups
Deg
rees
of
Free
dom
Bet
wee
n G
roup
sSu
m o
f Sq
uare
sW
ithin
Gro
ups
Deg
rees
of
Free
dom
With
in G
roup
s
Voc
abul
ary
1.55
367
.54
950.
73R
eadi
ng C
ompr
ehen
sion
0.88
358
.66
950.
48Sp
ellin
g1.
763
218.
2995
0.26
Cap
italiz
atio
n2.
883
89.5
490
0.97
Punc
tuat
ion
3.99
312
7.47
920.
96L
angu
age
Usa
ge1.
963
61.4
992
0.98
w co 1
Map
s Sk
ills
Gra
ph T
able
1.95
6.70
3 361
.44
917.
8095 94
1.00
0.23
Ref
eren
ce M
ater
ials
1.45
342
.93
951.
07M
ath
Con
cept
s0.
533
53.5
195
0.31
Mat
h Pr
oble
m S
olvi
ng3.
403
75.0
695
1.43
Lan
guag
e T
otal
1.07
358
.32
950.
58W
ork
Stud
y Sk
ills
Tot
al0.
733
29.3
295
0.79
Mat
h T
otal
0.73
349
.32
950.
47T
est T
otal
0.56
335
.48
950.
50
TA
BL
E 1
3
SEL
F-A
PPR
AIS
AL
IN
VE
NT
OR
Y F
OL
LO
W T
HR
OU
GH
PU
PIL
S19
72-7
3
Subt
ests
Peer
Max
imum
Equ
als
Scor
e13
Fam
ilyM
axim
um S
core
Equ
als
6
Scho
olM
axim
um S
core
Equ
als
12
Gen
eral
Max
imum
Sco
reE
qual
s 5
Tot
alM
axim
um S
core
Equ
als
40M
ean
S .D
.M
ean
S .D
.M
ean
S .D
.M
ean
S .D
.M
ean
S .D
.
Kin
derg
arte
n(N
= 1
0)7.
62.
13.
60.
88.
12.
55.
71.
225
.05.
1Po
d I
(fir
st g
rade
)(N
= 1
0)8.
81,
54.
11.
08.
91.
76.
41.
328
.23.
8Po
d II
(se
cond
gra
de)
(N =
12)
8.8
2.1
3.7
1.3
8.8
1.7
6.5
1.5
27.8
'4.3
Pod
II(t
hird
gra
de)
(N =
10)
7.7
1.3
4.0
0.5
7.8
1.7
7.7
1.5
27.1
3.0

D. Follow Through Home Visitation
The parent workers at Dean Rusk Elementary Schoolvisited the homes of the eligible Follow Through children.(The data is included in Table 14.) In addition to explainingthe Follow Through instructional program to the parentsof the pupils, the parent workers obtained necessary demographicinformation about the children and discussed the healthrelated services provided by Follow Through.
TABLE 14
FOLLOW THROUGH HOME VISITATION1972-73
Number Active Follow ThroughFamilies at Beginning of School Year 216
Number Active Families at Year End 229
Number Families Visited Duringthe Year 153
Number Home Visits Made Duringthe Year 229
Average Number of Visits perFamily 1 4
Percentage of Families Visited 70 8
E. Follow Through Parent Participation
There was a total of 229 parents representing the FollowThrough pupils. Of the total number, 145 parents or 63.3per cent of the parents participated by attending meetingsof the Parent Advisory Committee, the Follow Throughparent organization, and by volunteering for service inthe classroom, the health program, or field trips.
-25-
F . Psychological Services
Psychological services were provided for Follow Througheligible children by two Follow Through psychologists.Referrals were made by the classrooms teachers, the socialworkers, or other Follow Through staff when the needwas recognized so that the need would be eliminated.
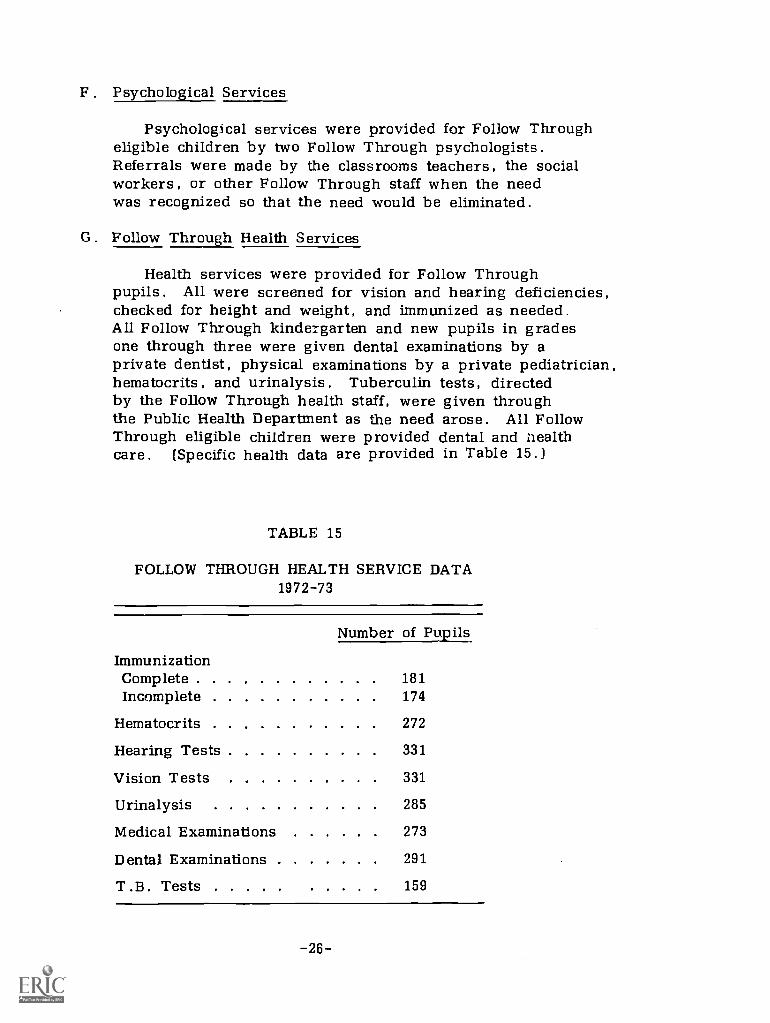
G. Follow Through Health Services
Health services were provided for Follow Throughpupils. All were screened for vision and hearing deficiencies,checked for height and weight, and immunized as needed.All Follow Through kindergarten and new pupils in gradesone through three were given dental examinations by aprivate dentist, physical examinations by a private pediatrician,hematocrits, and urinalysis. Tuberculin tests, directedby the Follow Through health staff, were given throughthe Public Health Department as the need arose. All FollowThrough eligible children were provided dental and healthcare. (Specific health data are provided in Table 15.)
TABLE 15
FOLLOW THROUGH HEALTH SERVICE DATA1972-73
Number of Pupils
ImmunizationComplete 181Incomplete 174
Hematocrits 272
Hearing Tests 331
Vision Tests 331
Urinalysis 285
Medical Examinations 273
Dental Examinations 291
T.B. Tests 159
-26-
H. Follow Through Social Services
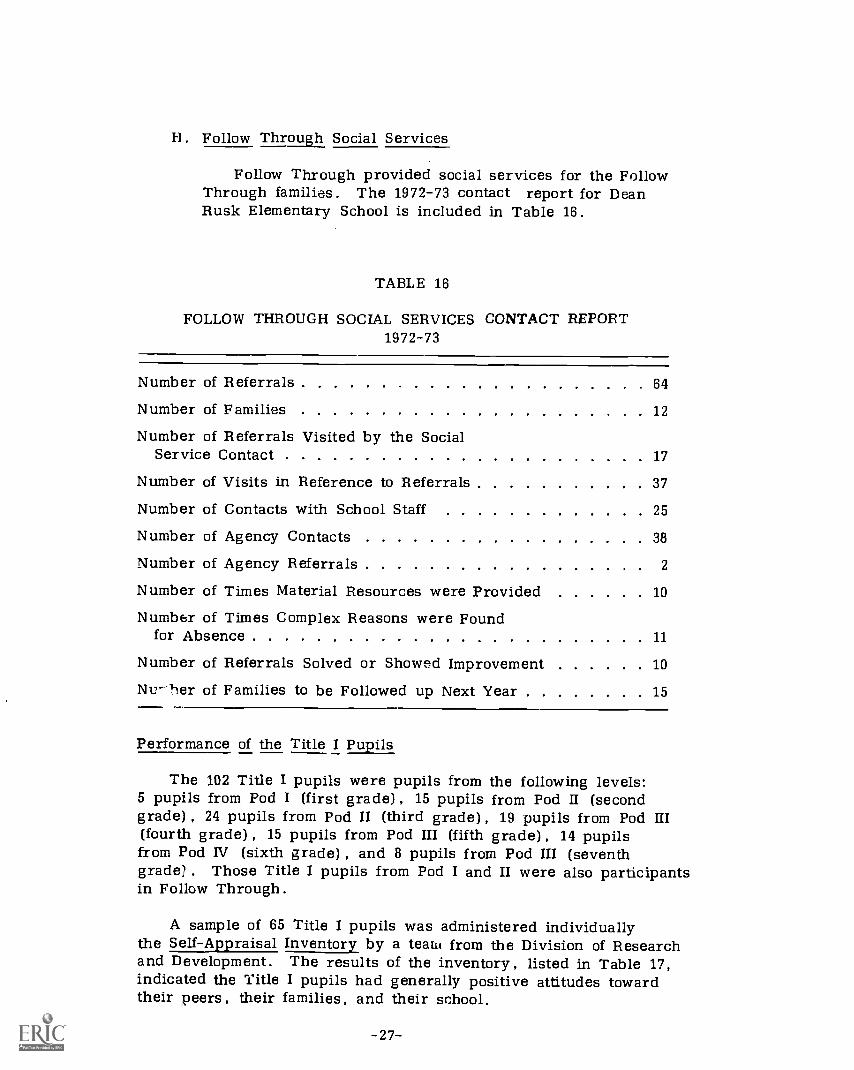
Follow Through provided social services for the FollowThrough families. The 1972-73 contact report for DeanRusk Elementary School is included in Table 16.
TABLE 16
FOLLOW THROUGH SOCIAL SERVICES CONTACT REPORT1972-73
Number of Referrals 64
Number of Families 12
Number of Referrals Visited by the SocialService Contact 17
Number of Visits in Reference to Referrals 37
Number of Contacts with School Staff 25
Number of Agency Contacts 38
Number of Agency Referrals 2
Number of Times Material Resources were Provided 10
Number of Times Complex Reasons were Foundfor Absence 11
Number of Referrals Solved or Showed Improvement 10
Nu-11er of Families to be Followed up Next Year 15
Performance of the Title I Pupils
The 102 Title I pupils were pupils from the following levels:5 pupils from Pod I (first grade), 15 pupils from Pod II (secondgrade) , 24 pupils from Pod II (third grade), 19 pupils from Pod III(fourth grade) , 15 pupils from Pod III (fifth grade) , 14 pupilsfrom Pod IV (sixth grade) , and 8 pupils from Pod III (seventhgrade) . Those Title I pupils from Pod I and II were also participantsin Follow Through.
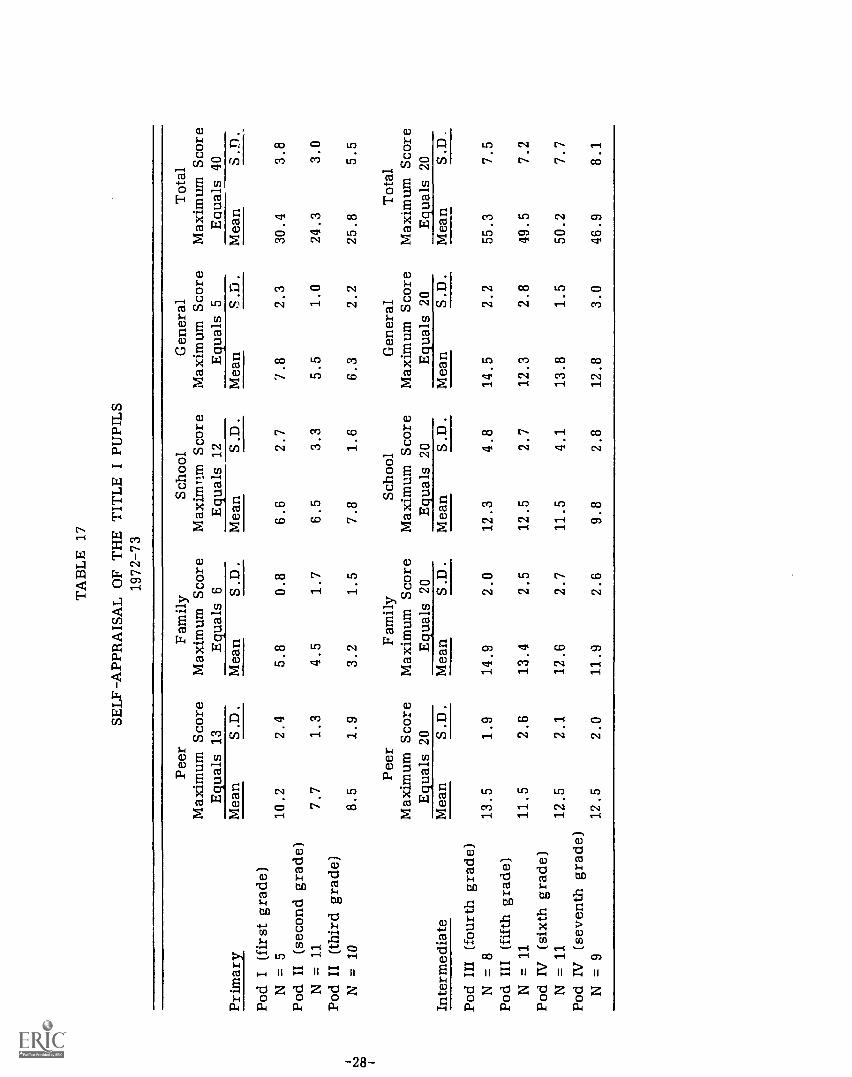
A sample of 65 Title I pupils was administered individuallythe Self-Appraisal Inventory by a team, from the Division of Researchand Development. The results of the inventory, listed in Table 17,indicated the Title I pupils had generally positive attitudes towardtheir peers, their families, and their school.
-27-
TA
BL
E 1
7
SEL
F-A
PPR
AIS
AL
OF
TH
E T
ITL
E I
PU
PIL
S19
72-7
3
Peer
Fam
ilySc
hool
Gen
eral
Tot
alM
axim
umSc
ore
Max
imum
Scor
eM
axim
nmSc
ore
Max
imum
Scor
eM
axim
um S
core
Equ
als
13E
qual
s6
Equ
als
12E
qual
s5
Equ
als
40Pr
imar
yM
ean
S .D
.M
ean
S .D
.M
ean
S.D
.M
ean
S .D
.M
ean
S.D
.
Pod
I(f
irst
gra
de)
N =
510
.22.
45.
80.
86.
62.
77.
82.
330
.43.
8Po
d II
(se
cond
gra
de)
N =
11
7.7
1.3
4.5
1.7
6.5
3.3
5.5
1.0
24.3
3.0
Pod
II (
thir
d gr
ade)
N =
10
8.5
1.9
3.2
1.5
7.8
1.6
6.3
2.2
25.8
5.5
Inte
rmed
iate
Peer
Max
imum
Equ
als
Scor
e20
Fam
ilyM
axim
umE
qual
sSc
ore
20
Scho
olM
axim
um S
core
Equ
als
20
Gen
eral
Max
imum
Sco
reE
qual
s 20
Tot
alM
axim
um S
core
Equ
als
20M
ean
S .D
.M
ean
S .D
.M
ean
S.D
.M
ean
S.D
.M
ean
S.D
.
Pod
III
(fou
rth
grad
e)N
= 8
13.5
1.9
14.9
2.0
12.3
4.8
14.5
2.2
55.3
7.5
Pod
III
(fif
th g
rade
)N
= 1
111
.52.
613
.42.
512
.52.
712
.32.
849
.57.
2Po
d IV
(si
xth
grad
e)N
= 1
112
.52.
112
.62.
711
.54.
113
.81.
550
.27.
7Po
d IV
(se
vent
h gr
ade)
N =
912
.52.
011
.92.
69.
82.
812
.83.
046
.98.
1

The five Title I pupils from Pod I (first grade) were administeredthe Metropolitan Readiness Tests (MRT) as pretest. They achievedthe following mean scores on the Metropolitan Achievement Tests(MAT) given as posttest: First grade, seven months in wordknowledge; first grade, six months in word anlaysis; first grade,five months in reading; and first grade, five months in totalreading. Therefore, the Pod I pupils achieved the objectiveof one month for each month in the program in word knowledgeand word analysis.
Only 70 of the 97 Title I pupils from Pod II through Pod IVtook both the pretest and posttest word knowledge and readingsubtests of the Metropolitan Achievement Tests. As a total groupthe Title I pupils were performing at the second grade levelon both the pretest and the posttest. (The scores are listedin Table 18.) Since the pupils gained three months in wordknowledge and less than one month in reading, the objectiveof a gain of one month for each month in the Title I programwas not satisfied. However, 22 pupils (31 pei cent of the pupilstaking both tests) achieved the objective in word knowledge and11 pupils (16 per cent of the pupils taking both tests) achievedthe objective in reading.
TABLE 18
METRO.POLITAN ACHIEVEMENT TESTS, TITLE I PUPILS1972-73 N = 75
Pretest Posttest GainMean Grade Mean Grade (Grade
Subtests Equivalent S .D . Equivalent S .D . Equivalent)
Word Knowledge 2.22 0.63 2.54 0.78 0.32
Reading 2.37 0.81 2.41 0.91 0.04
The analysis of the performance of Title I pupils made useof a Pearson's r to determine the correlation between the MetropolitanAchievement Tests reading performance and the Iowa Tests ofBasic Skills reading comprehension performance. There wasa correlation of 0.54, which was significant at the .01 level.
-29-

Career Opportunities Program
There were four aides at Dean Rusk Elementary School whoparticipated in the Career Opportunities Program (COP). Sincethe performance of the Follow Through pupils was analyzed onthe basis of the number of years the pupils had participatedin Follow Through rather than a comparison of class performance,the effect of the COP aides was not a component of the evaluation.However, in conjunction with COP, the teachers and aides ofDean Rusk Elementary School were asked to complete anonymouslythe Opinionnaire on Attitudes Toward Education.
The Opinionnaire on Attitudes Toward Education was administeredto determine whether the instructional staff was child-centeredor subject-matter centered. A score of zero indicated totallysubject-matter centered attitude and a score of 50 indicated totallychild-centered attitude. The mean scores of the instructionalstaff of Dean Rusk Elementary School are shown in Table 19,and they indicated that both teachers and aides tended towardchild-centered attitudes.
TABLE 19
OPINIONNAIRE ON ATTITUDES TOWARD EDUCATION1972-73
N Mean S .D .
Teachers With Aides 11 37.4 4.78
Teachers Without Aides 11 36.8 5.40
COP Aides 3 31.7 2.08
Non-COP Aides 4 32.5 3.32
A Pearson's r correlation using the scores of the Opinionnaireon Attitudes Toward Education and the pupil achievement levelsof the schools with COP aides were utilized in the analysis ofthe total COP for the 1972-73 school year. No correlation wasfound between the staff attitudes and the pupil achievement.
-30-

Pupil Attendance
The per cent of pupil attendance at Dean Rusk ElementarySchool ranged from 86 per cent in the kindergarten to 93 percent in Pod III (fourth and fifth grades) and Pod IV (seventhgrade), with an average of 91 per cent. The averagecitywide pupil attendance was 91.4 per cent.
The pupil mobility index for Dean Rusk Elementary Schoolwas 0.23, which was approximately the same as the previousyear (0.22) .
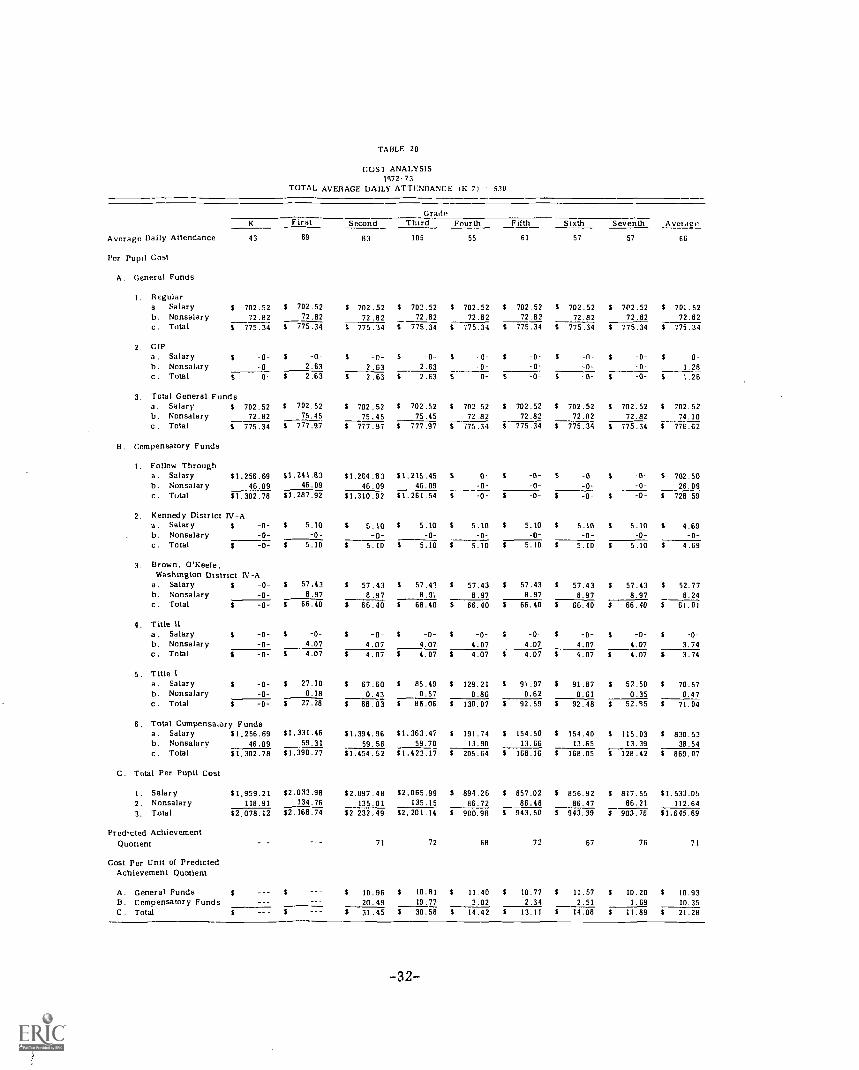
IX . COST ANALYSIS
A cost analysjs was performed in order to determine therelative cost for each unit of predicted achievement based uponthe Iowa Tests of Basic Skills (ITBS) performance of the pupilsand the amount spent during 1972-73. Data from the AtlantaPublic Schools, General Funds Report, July, 1973, and the Trustand Agency Report, June, 1973, were used. Included in theanalysis were the general funds and the compensatory fundsfrom special projects.
Actual per pupil costs at Dean Rusk Elementary School during 1972-73
ranged from approximately $2,078 to $2,232 in the Follow Throughlevels (grades K through 3) and from approximately $903 to $981
in non-Follow Through levels, with the average per pupil costbeing approximately $1,646. Therefore, the cost per unit ofachievement ranged from approximately $12 in Pod IV (grade7) to approximately $31 in Pod II (grade 2) . (See Table 20.)
TAHLE 20
COS1 ANALYSIS1972-73
TOTAL AVERAGE DAILY ATTENDANCE IK 7) 530
GradeK First Second Third Fourth Fifth Sixth Seventh Average
Average Daily Attendance
Per Pupil Cost
A. General Funds
1 Regular
43 69 83 105 55 61 57 57 66
a. Salary $ 702.52 $ 702.52 $ 702.52 $ 702.52 $ 702.52 $ 702.52 $ 702.52 $ 702.52 $
b. Nonsalary 72.82 72.82 72.82 72.82 72.82 72.82 72.82 72.82 72.82
c. Total $ 775.34 $ 775.34 S 775.34 $ 775.34 $ 775.34 $ 775.34 $ 775.34 $ 775.34 $ 775,34
2 CIPa. Salary $ -o- s -o- s -n- $ 0 $ -0- $ -0- $ -n- s -0- $ O-
b. Nonsalary -0- 2.63 2.63 2.63 -o -0- -0- -0- 1.28
c. Total S -0- S 2.63 $ 2.63 $ 2.63 $ -0- $ -0- S -0- $ -0- $ 1.28
3 Total General Funds
a. Salary $ 702.52 $ 702.52 $ 702.52 $ 702.52 $ 702 52 $ 702.52 $ 702.52 $ 702.52 $ 702.52
b. Nonsalary 72.82 75.45 75.45 75.45 72.82 72.82 72.82 72.82 74.10
c. Total S 775.34 $ 777.97 $ 777.97 $ 777.97 S 775.34 S 775.34 $ 775.34 $ 775.34 $ 776.62
B. Compensatory Funds
1. Follow Througha. Salary $1,256.69 $1,241.83 $1,264.83 $1,215.45 $ -0- S -0- S -0- $ -0- $ 702.50
b. Nonsalary 46.09 46.09 46.09 46.09 -0- -0- -0- -0- 26.09
c. Total $1,302.78 $1.287.92 $1.310.92 $1.261.54 $ -o- s -o- $ -0- $ -0- $ 728.59
2. Kennedy District Pi-A
a. Salary $ -0- $ 5.10 $ 5.10 $ 5.10 S 5.10 $ 5.10 $ 5.10 $ 5.10 $ 4.69b. Nonsalary -0- -0- -0- -0- -0- -0- -0- -0- -0-
c. Total $ -0- $ 5.10 $ 5.10 $ 5.10 $ 5.10 $ 5.10 $ 5.10 $ 5.10 $ 4.69
3. Brown, O'Keefe,Washington District 11.:-A
a. Salary $ -0- $ 57.43 $ 57.43 $ 57.41 $ 57.43 $ 57.43 $ 57.43 $ 57.43 $ 52.77
b. Nonsalary -0- 8.97 8.97 8.9'. 8.97 8.97 8.97 8.97 8.24
c. Total $ -0- S 66.40 $ 66.40 $ 66.40 S 66.40 $ 66.40 $ 66.40 $ 66.40 $ 61.01
4. Title 11
a. Salary $ -o- s -0- $ -o- s -0- $ -o- s -0- $ -0- $ -0- $ -0-
b. Nonsalary -0- 4.07 4.07 4.07 4.07 4.07 4.07 4.07 3.74
c. Total $ -0- $ 4.07 $ 4.07 $ 4.07 $ 4.07 $ 4.07 $ 4.07 $ 4.07 $ 3.74
5. Title I
a. Salary $-0- $ 27.10 $ 67.60 $ 85.49 $ 129.21 $ 91.97 $ 91.87 $ 52.50 $ 70.57
b. Nonsalary -0- 0.18 0.43 0.57 0.86 0.62 0.61 0.35 0.47
c. Total $ -0- $ 27.28 $ 68.03 $ 86.06 $ 130.07 $ 92.59 $ 92.48 $ 52.95 $ 71.04
6. Total Compensatory Fundsa. Salary $1,256.69 $1,331.46 $1,394.96 $1,363.47 $ 191.74 $ 154.50 $ 154.40 $ 115.03 $ 830.53
b. Nonsalary_ 46.09 59.31 59.56 59.70 13.90 13.66 13.65 13.39 38.54
c. Total $1,302.78 $1,390.77 $1,454.52 $1,423.17 $ 205.64 $ 168.16 $ 168.05 $ 128.42 $ 869.07
C. Total Per Pupil Cost
I. Salary $1,959.21 $2,033.98 $2.097.48 $2,065.99 $ 894.26 $ 857.02 $ 856.92 $ 817.55 $1.533.05
2. Nonsalary 118.91 134.76 135.01 135.15 86.72 86.48 86.47 86,21 112.64
3. Total $2,078.12 $2,168.74 $2 232,49 $2,201.14 $ 980.98 $ 943.50 $ 943.39 $ 903.76 $1,645.69
Predicted Achievement
Quotient 71 72 68 72 67 76 71
Cost Per Unit of Predicted
Achievement Quotient
A. General Funds $ $ 10.96 $ 10.81 $ 11.40 $ 10.77 $ 11.57 $ 10.20 $ 10.93
B. Compensatory Funds 20.49 19.77 3.02 2.34 2.51 1.69 10.35
C . Total $ $ 31.45 $ 30.58 $ 14.42 $ 13.11 $ 14.08 $ 11.89 $ 21.28
-32-

X. CONCLUSIONS
In viewing the total program of Dean Rusk Elementary School,conclusions were reached as follows:
A . The Pupil Achievement Study for Dean Rusk ElementarySchool, conducted by the Division of Research and Development,revealed the overall reading program to be effectivefor the third consecutive year and the overall mathematicsprogram to be effective for the second consecutive year.(Mathematics was not included in the study of 1970-71.)The pupils achieved as predicted and were in the forty-sixthpercentile of the performance in the school system.
B. The pupils of Dean Rusk Elementary School performedbelow the national norm in reading and mathematics ofthe Iowa Tests of Basic Skills (ITBS) and were in the lowerfourth of the school system's percentile rank.
C. The per cent of pupil attendance was approximately equalto the citywide average.
D. The pupil population of Dean Rusk Elementary Schoolwas mobile. Over one-fifth of the pupils either movedinto or out of the school during the school year.
E. The mobility of the pupil population was reflected inthe Follow Through Program at Dean Rusk ElementarySchool. Approximately one-half of the Pod I (first grade)pupils had participated in Follow Through during kindergarten;at the Pod II (second grade) level, approximately two-thirds of the pupils had participated in Follow Throughsince kindergarten; while at the Pod II (third grade)level, less than one-half of the pupils had participatedin Follow Through since kindergarten.
F. Regarding the Direct Approach to Decoding (DAD) ofthe Follow Through Program, the following conclusionswere reached:
1. The kindergarten pupils did not achieve the totalPhonic Skills Test posttest score predicted by Dr.Ellis Richardson, the Follow Through consultantwho developed the DAD materials.
2. There was no significant difference in the performanceof the Pod I (first grade) pupils who had attendedFollow Through kindergarten and those who had
-33-

not attended Follow Through kindergarten on thePhonic Skills Test, The total Phonic Skills Testposttest score, predicted by Dr. Ellis Richardson,was not achieved by the Pod I pupils.
3. There were no significant differences among thePhonic Skills Test pretest scores of the Pod II (secondgrade) pupils who had entered Follow Through inkindergarten, those who had entered Follow Throughin the Pod I (first grade), and those who had enteredFollow Through in the Pod II ;second grade) . ThePod II (second grade) pupils exceeded the total posttestscore predicted by Dr. Ellis Richardson.
4. Then., were no significant differences among thePhonic Skills Test pretest scores of the Pod II (thirdgrade) pupils based on the number of years thepupils had participated in Follow Through. However,the pupils exceeded the total Phonic Skills Test posttestscore predicted by Dr. Ellis Richardson.
G. Conclusions regarding the Iowa Tests of Basic Skills(ITBS) were as follows:
1. There was no significant difference (.05 level) betweenthe performance of the Pod I (first grade) pupilswho had attended Follow Through kindergarten andthose who had not. Both groups were performingat the first grade level.
2. The Pod II (second grade) pupils who participatedin Follow Through from the kindergarten throughthe Pod II (second grade) level performed significantlyhigher (.05 level) in reading comprehension thanthe pupils who entered Follow Through at the PodI level and those who had entered at the Pod II level.All three Pod II (second grade) groups performedat latter first grade or second grade levels on theITBS subtests.
3. There were no significant differences in scoring,based on the number of years of Follow Throughparticipation, among the Pod II (third grade). Allfour groups performed at latter second grade or lowthird grade levels on all subtests of the ITBS.
-34-

H. Approximately 71 per cent of the families of eligible FollowThrough pupils were visited by the Follow Through staffduring the school year, with the average number ofvisits per family being 1.4.
I. Psychological services were provided for eligible FollowThrough pupils when the need was recognized by theFollow Through staff and continued until the need waseliminated.
J. All eligible Follow Through pupils were screened forvision and hearing deficiencies, checked for height andweight, and immunized. All Follow Through kindergartenand new pupils were given dental examinations by aprivate dentist, physical examinations by a private pediatrician,hematocrits, and urinalyses. Tuberculin tests weregiven through the Public Health Department. As theneed arose all eligible Follow Through pupils were provide:Ihealth care.
K. Approximatley sixty-three per cent of the parents ofFollow Through pupils participated in the Follow ThroughProgram by attending parent meetings or volunteeringfor service.
L. Of the sixty-four referrals to the Follow Through socialservice contacts, the problems of ten of those referredwere solved or showed improvement.
M. The attitudes, indicated by the Self- Appraisal Inventory,of both the Follow Through and the Title I pupils weregenerally positive in the following four areas: peer,family, school, and general. (The Title I pupils fromPods I and II were Follow Through participants.)
N. Of the 102 Title I participants, only 75 took both theMetropolitan Achievement Tests (MAT) pretest and posttest.The five Title I participants from to Pod I (first grade)level achieved the Title I objective of a gain of one monthfor each month in the program in word knowledge andword analysis. Of the 70 Tile I pupils from Pods II-IV (grades two through seven) who took 'Joth the MATpretest and posttest, 31 per cent achieved the objectiveof a gain of one month for each month in the programin word knowledge and 16 per cent achieved the gainin reading.
-35-
O . There was a significant correlation (.01 level) betweenthe Metropolitan Achievement Tests (MAT) reading scoresand the Iowa Tests of Basic Skills (ITBS) reading comprehensionscores of the Title I pupils.
P . The teachers and aides at Dean Rusk Elementary Schooltended to have child-centered, as opposed to subject-mattercentered, attitudes toward education as measured by theOpinionnaire on Attitudes Toward Education.
Q. The per pupil cost for a Follow Through pupil was overtwice as much as the per pupil cost for a non-Follow Throughpupil at Dean Rusk Elementary School although there waslittle variance in the predicted achievement index amongthe grades.
XI. RECOMMENDATIONS
In viewing the total program of Dean Rusk Elementary School,the following recommendations are made:
A. Continue the effective reading and mathematics programsat Dean Rusk Elementary School.
B . Continue the effective effort in involving parents in theFollow Through Program at Dean Rusk Elementary School,attempting to raise the percentage of parents participating.
C. Attempt to solve a larger percentage of the problems referredto the social service contact of Follow Through.
D . Identify the skill areas, indicated by the Iowa Testsof Basic Skills, in which the pupils were weak and stressthe skills in the instructional program of Dean RuskElementary School.
E . Observe closely the Title I Program at Dean Rusk ElementarySchool during the 1973-74, school year, identifying bothstrengths and weaknesses of the program, in order tomaximize the instructional benefits for the Title I pupils.
-36-

F . De.,elop and implement a plan which would promote apositive correlation between achievement and expenditures.Above all, reduce the excessively high expenditureswithout commensurate achievement.
G. Limit Title I activities to non Follow Through gradelevels.