rusk cookies
TRANSCRIPT
7/25/2019 Rusk Cookies
http://slidepdf.com/reader/full/rusk-cookies 1/15
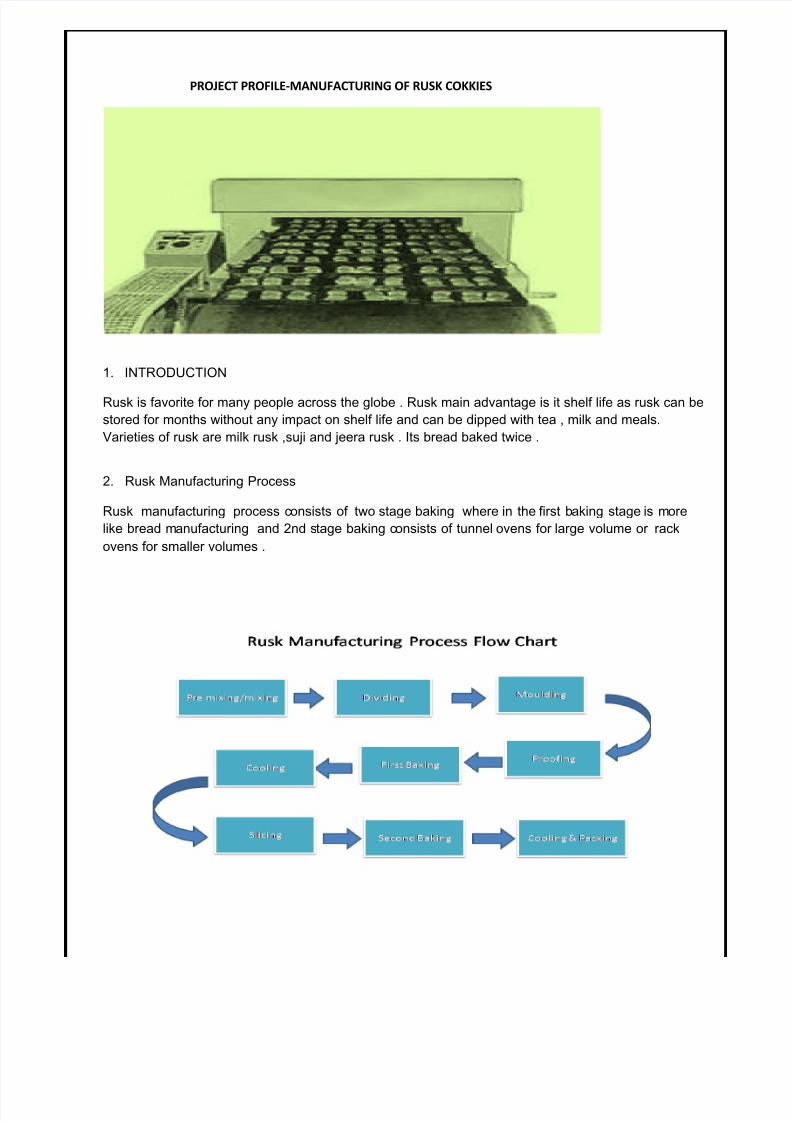
PROJECT PROFILE-MANUFACTURING OF RUSK COKKIES
1. INTRODUCTION
Rusk is favorite for many people across the globe . Rusk main advantage is it shelf life as rusk can be
stored for months without any impact on shelf life and can be dipped with tea , milk and meals.
Varieties of rusk are milk rusk ,suji and jeera rusk . Its bread baked twice .
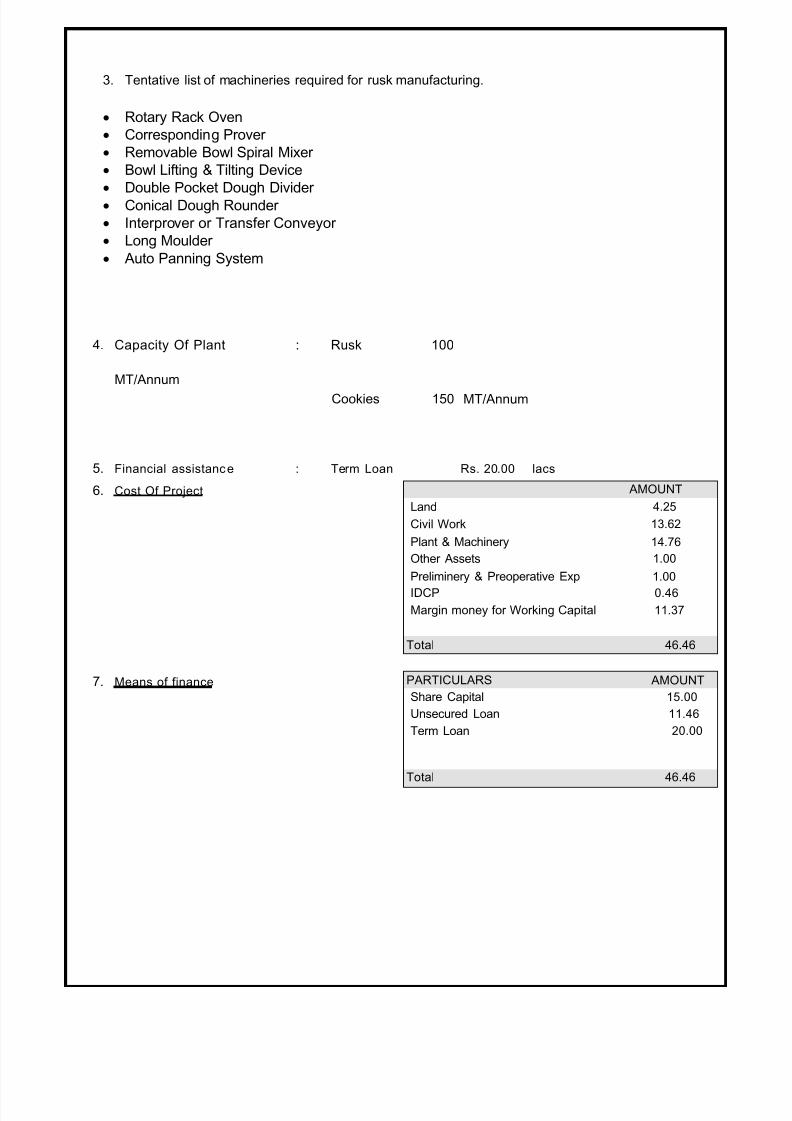
2. Rusk Manufacturing Process
Rusk manufacturing process consists of two stage baking where in the first baking stage is more
like bread manufacturing and 2nd stage baking consists of tunnel ovens for large volume or rack
ovens for smaller volumes .
7/25/2019 Rusk Cookies
http://slidepdf.com/reader/full/rusk-cookies 2/15
3. Tentative list of machineries required for rusk manufacturing.
Rotary Rack Oven
Corresponding Prover
Removable Bowl Spiral Mixer
Bowl Lifting & Tilting Device
Double Pocket Dough Divider
Conical Dough Rounder
Interprover or Transfer Conveyor
Long Moulder
Auto Panning System
4. Capacity Of Plant : Rusk 100
MT/Annum
Cookies 150 MT/Annum
5. Financial assistance : Term Loan Rs. 20.00 lacs
6. Cost Of Project AMOUNT
Land 4.25
Civil Work 13.62
Plant & Machinery 14.76
Other Assets 1.00
Preliminery & Preoperative Exp 1.00
IDCP 0.46
Margin money for Working Capital 11.37
Total 46.46
7. Means of finance PARTICULARS AMOUNT
Share Capital 15.00
Unsecured Loan 11.46
Term Loan 20.00
Total 46.46
7/25/2019 Rusk Cookies
http://slidepdf.com/reader/full/rusk-cookies 3/15
8. PR OJ ECTED P ROFI TABIL I TY STATEMENT
PARTICULARS 2014-15 2015-16 2016-17 2017-18 2018-19 2019-20 2020-21
A) SALES
Gross Sale
Misc Income( Waste Product)
Total (A)
B) COST OF SALES
Raw Material Consumed
Packing Material
Electricity Expenses
Other manufacturing Exp
Labour & Wages
Depreciation
Cost of Producti on
Add : Opening Sto ck /WIP
Less: Closing Stock /WIP
Cost of Sales (B)
C) GROSS PROFIT (A-B)
D) Bank Interest (Term Loan )
Bank Interest ( C.C. Limit )
E) Selling & Adm Expenses Exp.
F) Exp W/off
TOTAL (D+F)
G) NET PROFIT
H) Taxation
I) PROFIT (After Tax)
J) DRAWINGS
K) RETAINED PROFIT
161.31 358.00 394.79 423.09 451.39 452.80 452.80
0.15 0.32 0.34 0.37 0.39 0.39 0.39
161.46 358.31 395.13 423.45 451.78 453.19 453.19
73.73 159.76 172.04 184.33 196.62 196.62 196.62
6.49 14.06 15.14 16.23 17.31 17.31 17.31
5.77 12.51 13.47 14.43 15.39 15.39 15.39
1.47 4.79 5.16 5.53 5.90 5.90 5.90
8.71 17.42 19.17 21.08 23.19 24.35 24.84
1.83 3.42 2.99 2.62 2.29 2.00 1.76
98.01 211.97 227.98 244.22 260.70 261.58 261.81
- 9.10 18.31 19.71 21.12 21.54 21.97
9.10 18.31 19.71 21.12 21.54 21.97 22.41
88.91 202.76 226.57 242.81 260.28 261.14 261.37
72.55 155.55 168.56 180.64 191.50 192.05 191.82
3.13 2.68 2.10 1.52 0.94 0.36 -
0.60 1.30 1.30 1.30 1.30 1.30 1.30
9.69 25.08 27.66 29.64 31.62 31.72 31.72
0.10 0.10 0.10 0.10 0.10 0.10 0.10
13.51 29.16 31.16 32.56 33.97 33.49 33.12
59.04 126.39 137.40 148.08 157.53 158.56 158.70
- 12.64 13.74 14.81 15.75 15.86 15.87
59.04 113.75 123.66 133.27 141.78 142.71 142.83
0.90 1.20 1.80 2.40 3.00 3.60 4.50
58.14 112.55 121.86 130.87 138.78 139.11 138.33
7/25/2019 Rusk Cookies
http://slidepdf.com/reader/full/rusk-cookies 4/15
9. STATEMENT OF RAW-MATERIALS AND PACKING MATERIAL
(At Optimum Capacity Utilisation)
A RAW MATERIALS
S.NO. PARTICULARS QUANTITY RATE (Rs.) TOTAL COST
I FOR RUSK
1 Maida 118,333 Kg. 20.00
2 Suji 11,827 Kg. 22.00
3 Suger 47,340 Kg. 45.00
4 Ghee 9,455 Kg. 80.00
5 Improver 353 Kg. 240.00
6 Elaychi Dana 353 Kg. 500.00
7 Saunf 180 Kg. 100.00
8 Salt 885 Kg. 10.00
9 Refind Oil 1,776 Kg. 100.00
10 Yeast 4,141 Kg. 60.00
11 Milk Powder 1,186 Kg. 200.00
12 Water - Ltr. -
Total 77,494
II FOR COOKIES
1 Maida 239785 Kg 25.00
2 Sugar 119892.5 Kg 40.00
3 Bakery Fat 119892.5 Kg 75.00
4 Salt 5222.88 Kg 10.00
5 Essences 522.288 Kg 900.00
6 Ghee 435.24 Kg 95.00
7 Milk Powder 372.775 Kg 200.00
8 Baking Powder 181.35 Kg 80.00
9 Dry Fruits 80.6 Kg 400.00
10 Custered Powder 181.35 Kg 70.00
486,566
42.67
TOTAL ANNUAL COST OF RAW MATERIAL (Rs. In lacs)
At 60% Capacit y Ut il i sat io n (6 Months) Rs. 73.73 Lacs
At 65 % Capaci ty Util i sat io n Rs. 159.76 Lacs
At 70 % Capac it y Ut il is ation Rs. 172.04 Lacs
At 75 % Capaci ty Util i sat io n Rs. 184.33 Lacs
At 80 % Capaci ty Util i sat io n Rs. 196.62 Lacs
At 80 % Capac it y Ut il is ation Rs. 196.62 Lacs
2,366,667
260,192
2,130,288
756,410
84,615
176,282
18,000
8,846
177,557
248,452
237,170
-
4,097,813
5,994,625
4,795,700
8,991,938
52,229
470,059
41,348
74,555
14,508
32,240
12,695
20,479,896
245.78
7/25/2019 Rusk Cookies
http://slidepdf.com/reader/full/rusk-cookies 5/15
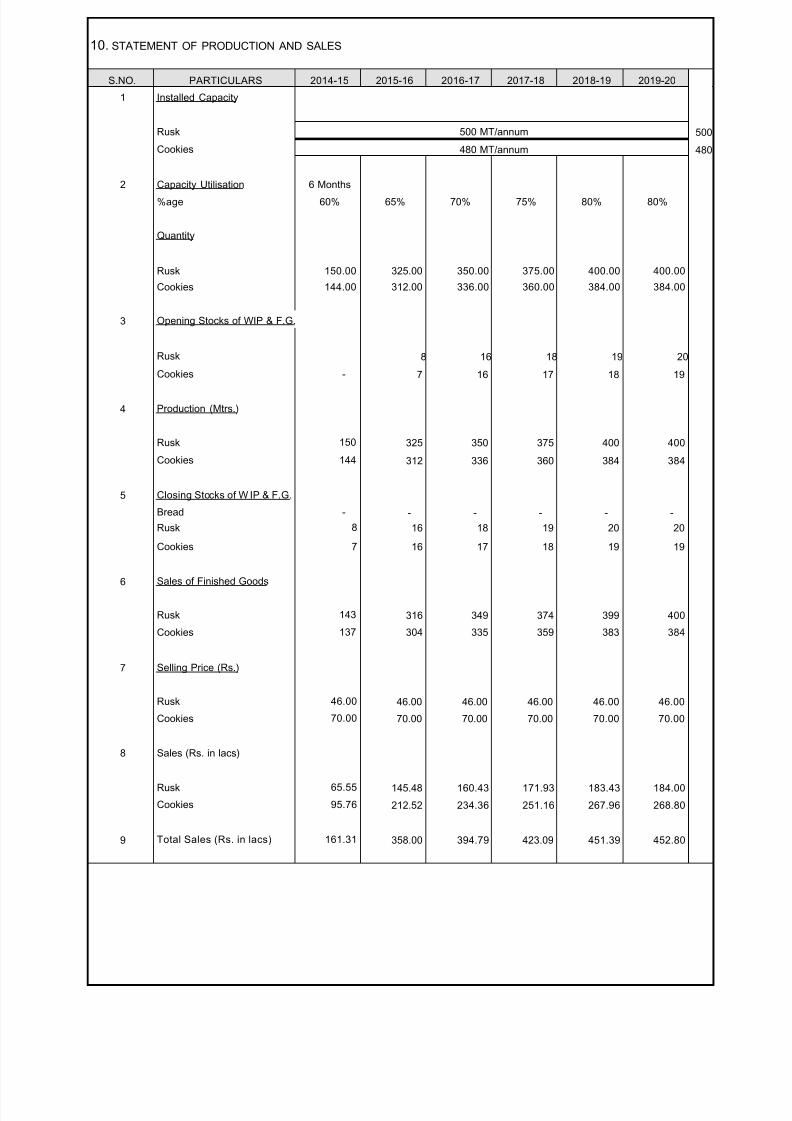
10. STATEMENT OF PRODUCTION AND SALES
S.NO. PARTICULARS 2014-15 2015-16 2016-17 2017-18 2018-19 2019-20
500
480
1
2
3
4
5
6
7
8
9
Installed Capacity
Rusk
Cookies
Capacity Utilisation
%age
Quantity
Rusk
Cookies
500 MT/annum
480 MT/annum
6 Months
60%
150.00
144.00
65%
325.00
312.00
8
7
325
312
-
16
16
316
304
46.00
70.00
145.48
212.52
358.00
70%
350.00
336.00
16
16
350
336
-
18
17
349
335
46.00
70.00
160.43
234.36
394.79
75%
375.00
360.00
18
17
375
360
-
19
18
374
359
46.00
70.00
171.93
251.16
423.09
80%
400.00
384.00
19
18
400
384
-
20
19
399
383
46.00
70.00
183.43
267.96
451.39
80%
400.00
384.00
20
19
400
384
-
20
19
400
384
46.00
70.00
184.00
268.80
452.80
Opening Stocks of WIP & F.G.
Rusk
Cookies
Production (Mtrs.)
Rusk
Cookies
Closing Stocks of W IP & F.G.
Bread
Rusk
Cookies
Sales of Finished Goods
Rusk
Cookies
Selling Price (Rs.)
Rusk
Cookies
Sales (Rs. in lacs)
Rusk
Cookies
Total Sales (Rs. in lacs)
-
150
144
-
8
7
143
137
46.00
70.00
65.55
95.76
161.31

7/25/2019 Rusk Cookies
http://slidepdf.com/reader/full/rusk-cookies 6/15
11. COMP UTATI ON OF CLOSI NG STOCK & WORK I NG CAP I TAL
PARTICULARS 2014-15 2015-16 2016-17 2017-18 2018-19 2019-20
WIP/FINSHED GOODS
(15 Days requirement) 9.10 18.31 19.71 21.12 21.54 21.97
Raw Material
(15 Days requirement) 6.14 6.85 7.37 7.90 8.43 8.43
Packing Material
(30 Days requirement) 0.56 1.21 1.30 1.39 1.48 1.48
Closing Stock 15.81 26.36 28.38 30.41 31.45 31.88
COMPUTATION OF WORKING CAPITAL REQUIREMENT
Particulars Total Own Bank
Amo unt Margin Finance
Stock in Hand 26.36 25% 6.59 75% 19.77
Sundry Debtors 11.94 40% 4.78 60% 7.17
38.30 11.37 26.94
Sundry Creditors 2.66 - 2.66
35.64 11.37 24.27
WORKING CAPITAL (HYP) FRESH DEMAND 10.00
7/25/2019 Rusk Cookies
http://slidepdf.com/reader/full/rusk-cookies 7/15
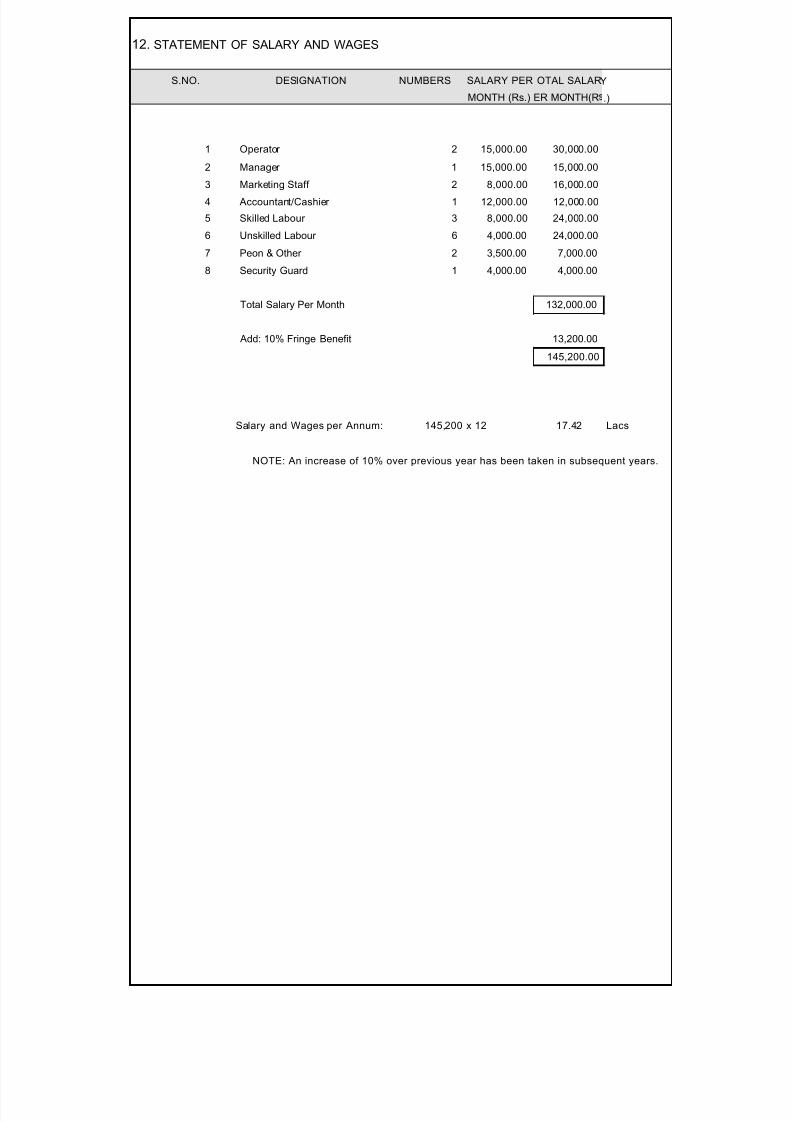
12. STATEMENT OF SALARY AND WAGES
S.NO. DESIGNATION NUMBERS SALARY PER OTAL SALAR
MONTH (Rs.) ER MONTH(R
Y
.)
1 Operator 2 15,000.00 30,000.00
2 Manager 1 15,000.00 15,000.00
3 Marketing Staff 2 8,000.00 16,000.00
4 Accountant/Cashier 1 12,000.00 12,000.00
5 Skilled Labour 3 8,000.00 24,000.00
6 Unskilled Labour 6 4,000.00 24,000.00
7 Peon & Other 2 3,500.00 7,000.00
8 Security Guard 1 4,000.00 4,000.00
Total Salary Per Month 132,000.00
Add: 10% Fringe Benefit 13,200.00
145,200.00
Salary and Wages per Annum: 145,200 x 12 17.42 Lacs
NOTE: An increase of 10% over previous year has been taken in subsequent years.
7/25/2019 Rusk Cookies
http://slidepdf.com/reader/full/rusk-cookies 8/15
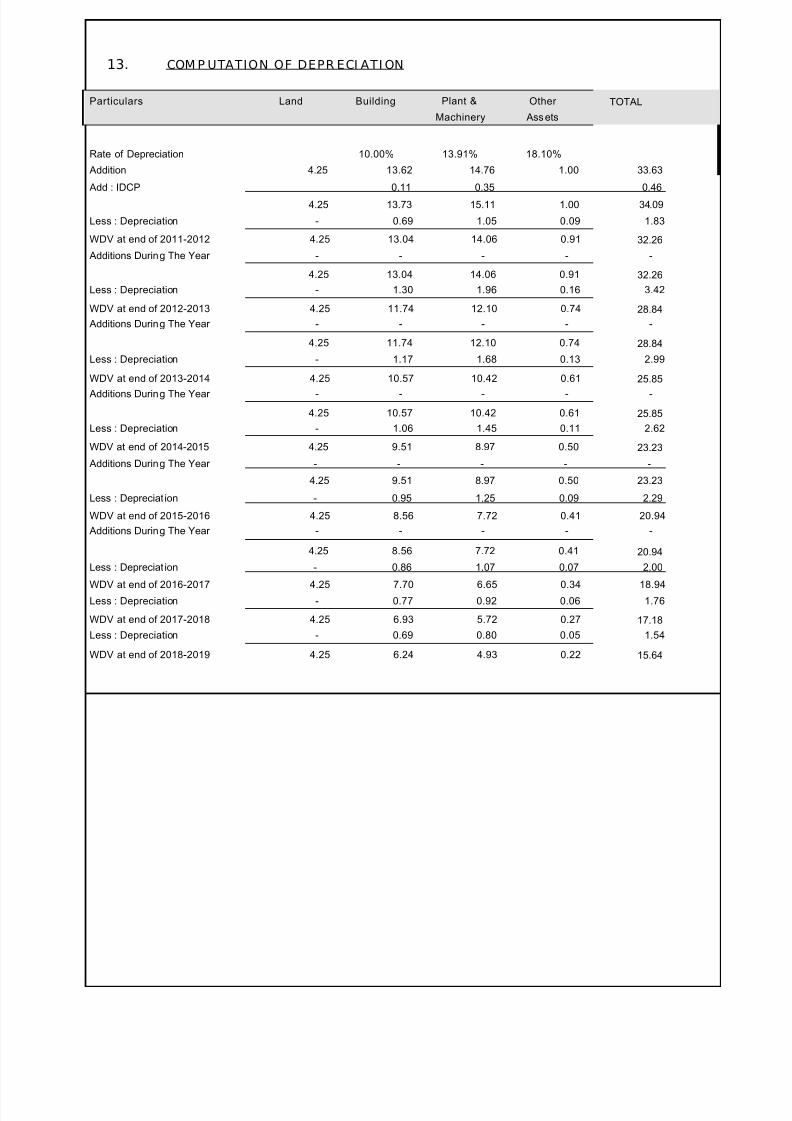
13. COM P UTATION OF DEPR ECI ATI ON
Particulars Land Building Plant &
Machinery
Other
Assets
TOTAL
Rate of Depreciation 10.00% 13.91% 18.10%
Addition 4.25 13.62 14.76 1.00 33.63
Add : IDCP 0.11 0.35 0.46
4.25 13.73 15.11 1.00 34.09
Less : Depreciation - 0.69 1.05 0.09 1.83
WDV at end of 2011-2012 4.25 13.04 14.06 0.91 32.26
Additions During The Year - - - - -
4.25 13.04 14.06 0.91 32.26
Less : Depreciation - 1.30 1.96 0.16 3.42
WDV at end of 2012-2013 4.25 11.74 12.10 0.74 28.84
Additions During The Year - - - - -
4.25 11.74 12.10 0.74 28.84
Less : Depreciation - 1.17 1.68 0.13 2.99
WDV at end of 2013-2014 4.25 10.57 10.42 0.61 25.85
Additions During The Year - - - - -
4.25 10.57 10.42 0.61 25.85
Less : Depreciation - 1.06 1.45 0.11 2.62
WDV at end of 2014-2015 4.25 9.51 8.97 0.50 23.23
Additions During The Year - - - - -
4.25 9.51 8.97 0.50 23.23
Less : Depreciat ion - 0.95 1.25 0.09 2.29
WDV at end of 2015-2016 4.25 8.56 7.72 0.41 20.94
Additions During The Year - - - - -
4.25 8.56 7.72 0.41 20.94
Less : Depreciat ion - 0.86 1.07 0.07 2.00
WDV at end of 2016-2017 4.25 7.70 6.65 0.34 18.94Less : Depreciation - 0.77 0.92 0.06 1.76
WDV at end of 2017-2018 4.25 6.93 5.72 0.27 17.18
Less : Depreciation - 0.69 0.80 0.05 1.54
WDV at end of 2018-2019 4.25 6.24 4.93 0.22 15.64

7/25/2019 Rusk Cookies
http://slidepdf.com/reader/full/rusk-cookies 9/15
14. REP AYM ENT SCHEDULE OF TERM LOAN 15%
Year Particulars Amoun t Add it io n Total Interest Repayment Cl Balance
2013-14 Opening Balance
Ist Quarter - 10.00 10.00 0.10 - 10.00
Iind Quarter 10.00 10.00 20.00 0.36 - 20.00
IIIrd Quarter 20.00 - 20.00 2.40 - 20.00
Ivth Quarter 20.00 - 20.00 0.73 - 20.00
3.59 -
2014-15 Opening Balance
Ist Quarter 20.00 - 20.00 0.73 1.00 19.00
Iind Quarter 19.00 - 19.00 0.69 1.00 18.00
IIIrd Quarter 18.00 - 18.00 0.65 1.00 17.00
Ivth Quarter 17.00 17.00 0.62 1.00 16.00
2.68 4.00
2015-16 Opening Balance
Ist Quarter 16.00 - 16.00 0.58 1.00 15.00
Iind Quarter 15.00 - 15.00 0.54 1.00 14.00
IIIrd Quarter 14.00 - 14.00 0.51 1.00 13.00
Ivth Quarter 13.00 13.00 0.47 1.00 12.00
2.10 4.00
2016-17 Opening Balance
Ist Quarter 12.00 - 12.00 0.44 1.00 11.00
Iind Quarter 11.00 - 11.00 0.40 1.00 10.00
IIIrd Quarter 10.00 - 10.00 0.36 1.00 9.00
Ivth Quarter 9.00 9.00 0.33 1.00 8.00
1.52 4.00
2017-18 Opening Balance
Ist Quarter 8.00 - 8.00 0.29 1.00 7.00
Iind Quarter 7.00 - 7.00 0.25 1.00 6.00
IIIrd Quarter 6.00 - 6.00 0.22 1.00 5.00
Ivth Quarter 5.00 5.00 0.18 1.00 4.000.94 4.00
2018-19 Opening Balance
Ist Quarter 4.00 - 4.00 0.15 1.00 3.00
Iind Quarter 3.00 - 3.00 0.11 1.00 2.00
IIIrd Quarter 2.00 - 2.00 0.07 1.00 1.00
Ivth Quarter 1.00 1.00 0.04 1.00 -
0.36 4.00
7/25/2019 Rusk Cookies
http://slidepdf.com/reader/full/rusk-cookies 10/15
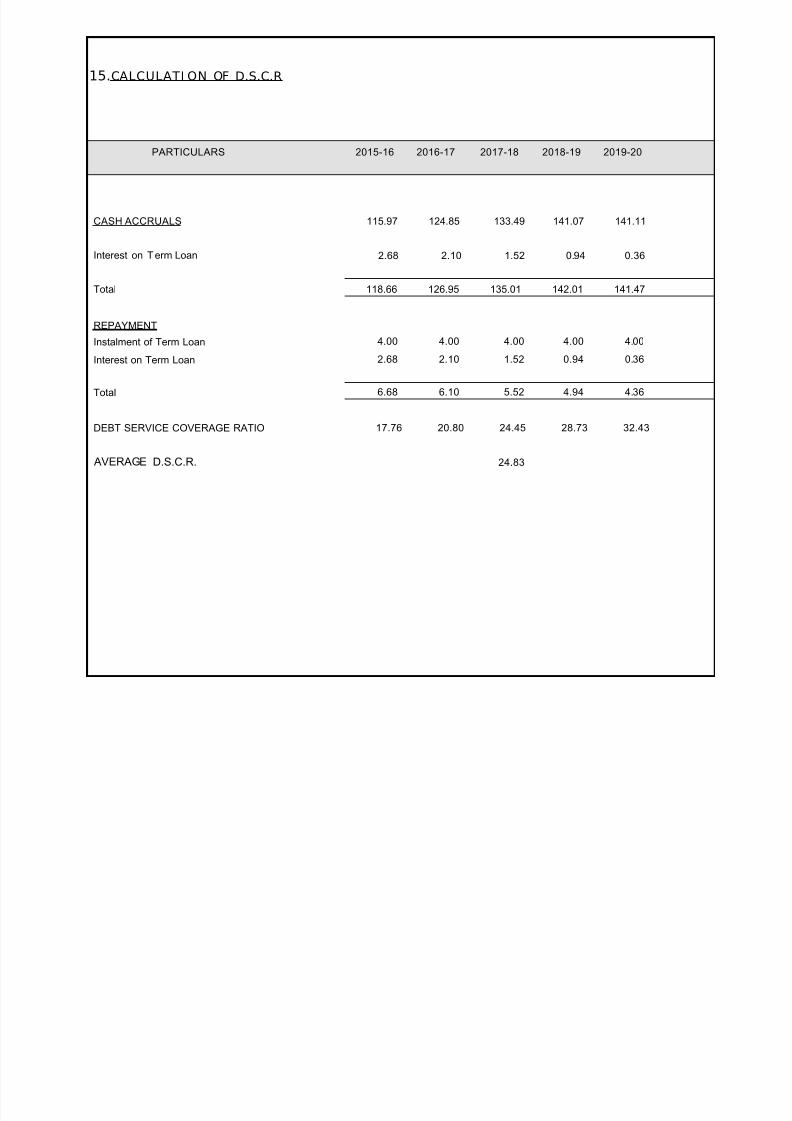
15. CALCULATI ON OF D.S.C.R
PARTICULARS 2015-16 2016-17 2017-18 2018-19 2019-20
CASH ACCRUALS
Interest on T erm Loan
Total
REPAYMENT
Instalment of Term Loan
Interest on Term Loan
Total
DEBT SERVICE COVERAGE RATIO
AVERAGE D.S.C.R.
115.97 124.85 133.49 141.07 141.11
2.68 2.10 1.52 0.94 0.36
118.66 126.95 135.01 142.01 141.47
4.00 4.00 4.00 4.00 4.00
2.68 2.10 1.52 0.94 0.36
6.68 6.10 5.52 4.94 4.36
17.76 20.80 24.45 28.73 32.43
24.83
7/25/2019 Rusk Cookies
http://slidepdf.com/reader/full/rusk-cookies 11/15
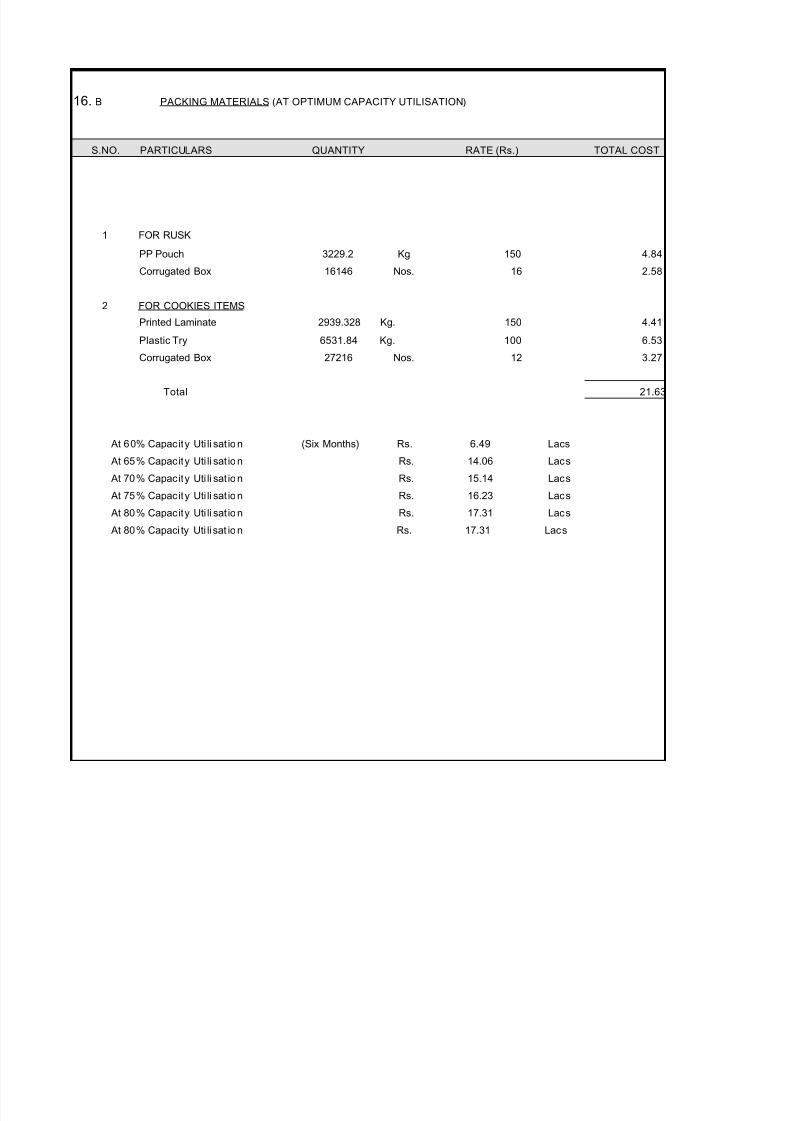
16. B PACKING MATERIALS (AT OPTIMUM CAPACITY UTILISATION)
S.NO. PARTICULARS QUANTITY RATE (Rs.) TOTAL COST
1 FOR RUSK
PP Pouch 3229.2 Kg 150
Corrugated Box 16146 Nos. 16
2 FOR COOKIES ITEMS
Printed Laminate 2939.328 Kg. 150
Plastic Try 6531.84 Kg. 100
Corrugated Box 27216 Nos. 12
Total
At 60% Capacity Uti li sat io n (Six Months) Rs. 6.49 Lacs
At 65% Capacity Uti li sat io n Rs. 14.06 Lacs
At 70% Capacity Uti li sat io n Rs. 15.14 Lacs
At 75% Capacity Uti li sat io n Rs. 16.23 Lacs
At 80% Capacity Uti li sat io n Rs. 17.31 Lacs
At 80% Capaci ty Uti li sat io n Rs. 17.31 Lacs
4.84
2.58
4.41
6.53
3.27
21.63
7/25/2019 Rusk Cookies
http://slidepdf.com/reader/full/rusk-cookies 12/15
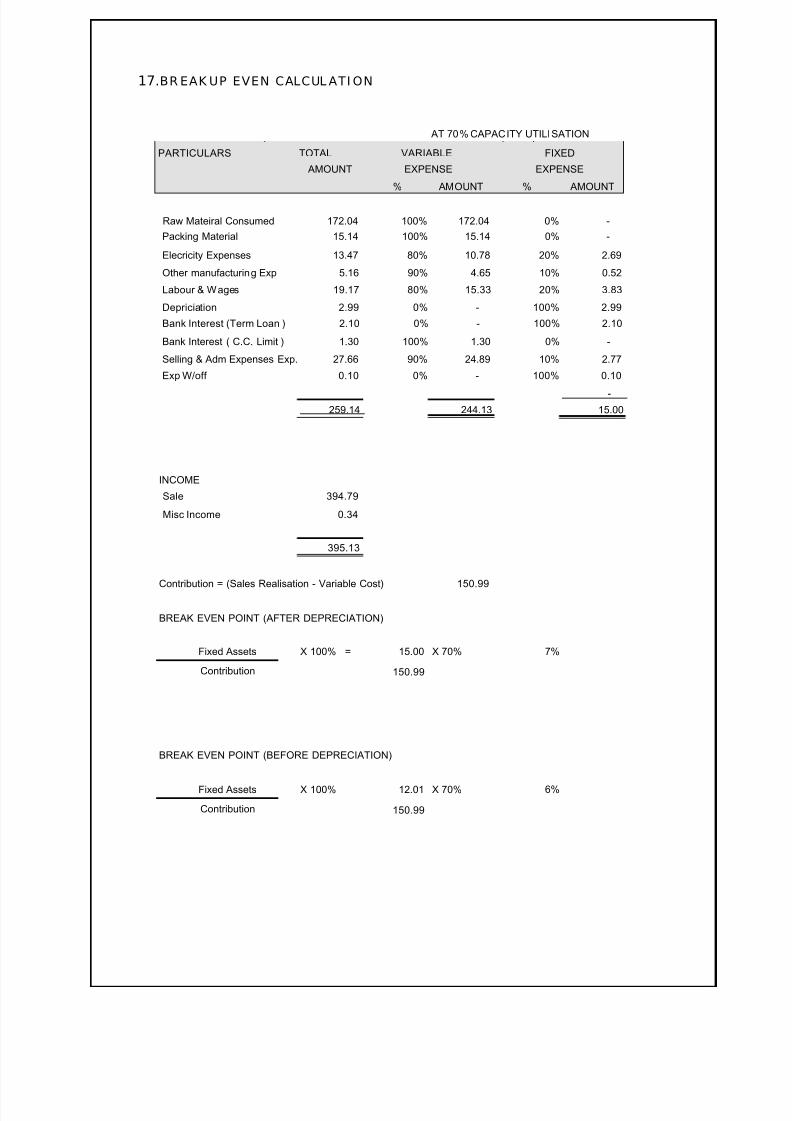
17. BR EAK UP EVEN CALCUL ATI ON
AT 70% CAPACITY UTILISATION
PARTICULARS TOTAL VARIABLE FIXED
AMOUNT EXPENSE EXPENSE
% AMOUNT % AMOUNT
Raw Mateiral Consumed 172.04 100% 172.04 0% -
Packing Material 15.14 100% 15.14 0% -
Elecricity Expenses 13.47 80% 10.78 20% 2.69
Other manufacturing Exp 5.16 90% 4.65 10% 0.52
Labour & Wages 19.17 80% 15.33 20% 3.83
Depriciation 2.99 0% - 100% 2.99
Bank Interest (Term Loan ) 2.10 0% - 100% 2.10
Bank Interest ( C.C. Limit ) 1.30 100% 1.30 0% -
Selling & Adm Expenses Exp. 27.66 90% 24.89 10% 2.77
Exp W/off 0.10 0% - 100% 0.10
-
259.14 244.13 15.00
INCOME
Sale 394.79
Misc Income 0.34
395.13
Contribution = (Sales Realisation - Variable Cost) 150.99
BREAK EVEN POINT (AFTER DEPRECIATION)
Fixed Assets X 100% = 15.00 X 70% 7%
Contribution 150.99
BREAK EVEN POINT (BEFORE DEPRECIATION)
Fixed Assets X 100% 12.01 X 70% 6%
Contribution 150.99
7/25/2019 Rusk Cookies
http://slidepdf.com/reader/full/rusk-cookies 13/15
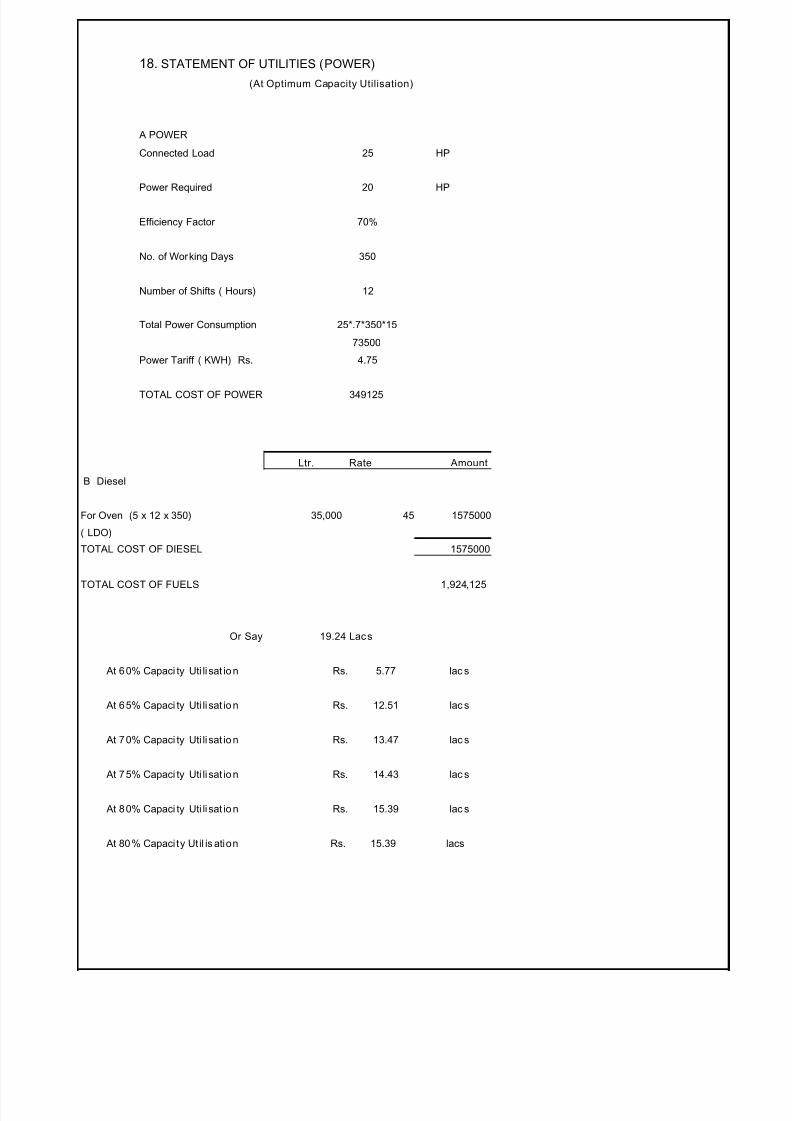
18. STATEMENT OF UTILITIES (POWER)
(At Optimum Capacity Utilisation)
A POWER
Connected Load 25 HP
Power Required 20 HP
Efficiency Factor 70%
No. of Working Days 350
Number of Shifts ( Hours) 12
Total Power Consumption 25*.7*350*15
73500
Power Tariff ( KWH) Rs. 4.75
TOTAL COST OF POWER 349125
B Diesel
Ltr. Rate Amount
For Oven (5 x 12 x 350) 35,000 45 1575000
( LDO)
TOTAL COST OF DIESEL 1575000
TOTAL COST OF FUELS 1,924,125
Or Say 19.24 Lacs
At 60% Capaci ty Uti li sat io n Rs. 5.77 lac s
At 65% Capaci ty Uti li sat io n Rs. 12.51 lac s
At 70% Capaci ty Uti li sat io n Rs. 13.47 lac s
At 75% Capaci ty Uti li sat io n Rs. 14.43 lac s
At 80% Capaci ty Uti li sat io n Rs. 15.39 lac s
At 80% Capaci ty Ut il is ation Rs. 15.39 lacs

7/25/2019 Rusk Cookies
http://slidepdf.com/reader/full/rusk-cookies 14/15
19. P ROJ ECTED BALANCE SHEE T
PARTICULARS 2014-15 2015-16 2016-17 2017-18 2018-19 2019-20 2020-21
SOURCES OF FUND
Capital Account
Retained Profit
Unsecured Loan
Term Loan
Capital Subsidy
Cash Credit
Sundry Creditors
Provisions & Other Liab
TOTAL :
APPLICATION OF FUND
Fixed Assets ( Gross)
Gross Dep.
Net Fixed Assets
Current Assets
Sundry Debtors
Stores & Consumables
Stock in Hand
Cash and Bank
Deposit of Capital Subsidy
Preliminery Expenses
TOTAL :
15.00 15.00 15.00 15.00 15.00 15.00 15.00
58.14 170.69 292.54 423.42 562.19 701.30 839.63
11.46 11.46 11.46 11.46 11.46 11.46 11.46
20.00 16.00 12.00 8.00 4.00 - -
- - - - - - -
10.00 10.00 10.00 10.00 10.00 10.00 10.00
1.23 2.66 2.87 3.07 3.28 3.28 3.28
0.30 0.60 0.66 0.73 0.80 0.88 0.97
116.13 226.41 344.53 471.67 606.73 741.92 880.33
34.09 34.09 34.09 34.09 34.09 34.09 34.09
1.83 5.25 8.24 10.86 13.15 15.15 16.91
32.26 28.84 25.85 23.23 20.94 18.94 17.18
10.76 11.94 13.17 14.12 15.06 15.11 15.11
6.00 6.60 7.26 7.99 8.78 9.66 10.63
15.81 26.36 28.38 30.41 31.45 31.88 33.48
50.39 151.87 269.17 395.33 529.99 665.93 803.63
- - - - - - -
0.90 0.80 0.70 0.60 0.50 0.40 0.30
116.13 226.41 344.53 471.67 606.73 741.92 880.33
7/25/2019 Rusk Cookies
http://slidepdf.com/reader/full/rusk-cookies 15/15
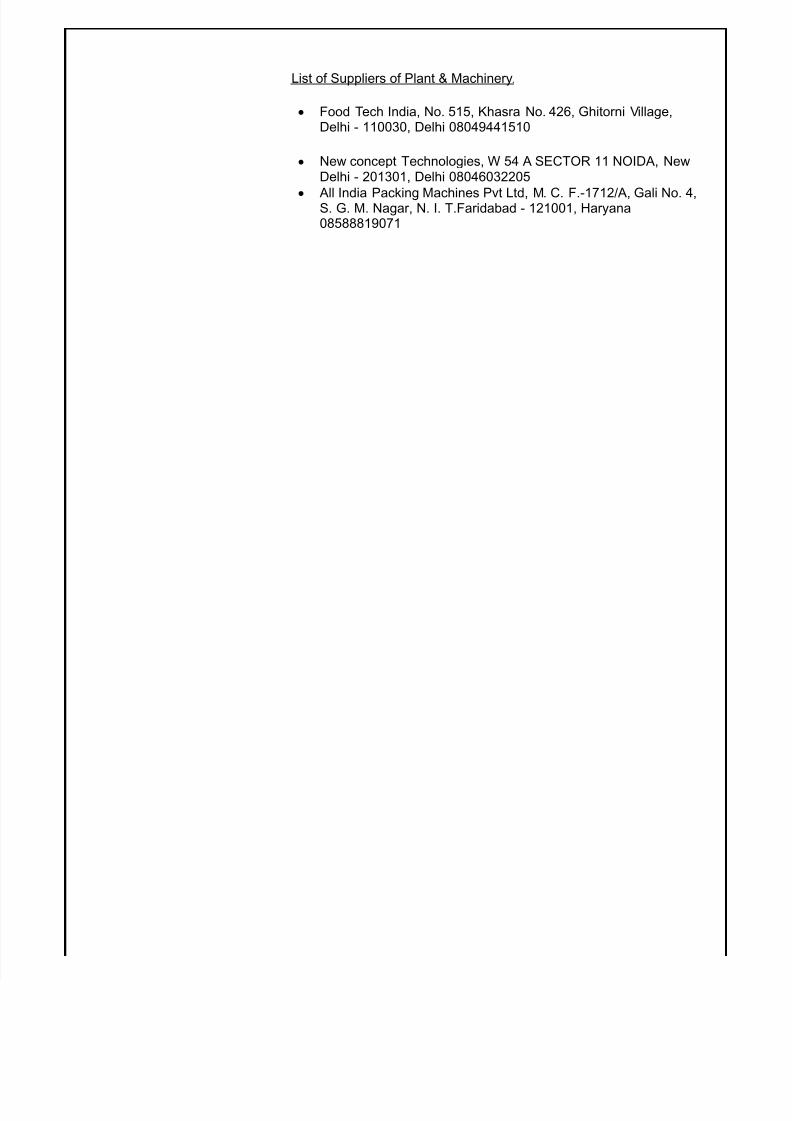
List of Suppliers of Plant & Machinery.
Food Tech India, No. 515, Khasra No. 426, Ghitorni Village,Delhi - 110030, Delhi 08049441510
New concept Technologies, W 54 A SECTOR 11 NOIDA, NewDelhi - 201301, Delhi 08046032205
All India Packing Machines Pvt Ltd, M. C. F.-1712/A, Gali No. 4,S. G. M. Nagar, N. I. T.Faridabad - 121001, Haryana08588819071