‘do you still like to play with him?
TRANSCRIPT

ARTICLE
‘Do you still like to play with him?’
Variability and the dynamic nature of children’s sociometric ratings
Henderien Steenbeek � Paul van Geert
Keywords Peer status � sociometric ratings � dynamic
systems approach � variability � stability � sociometric
status
There is a wealth of research on the relation of sociome-
tric status and other psychological constructs and beha-
vioural properties. Surprisingly, few studies focus on the
stability of sociometric status. Existing studies focus on
long-term stability, on short-term variability as a form of
measurement error, and are limited to ratings that child-
ren receive from others. The present article argues that
stability and variability are inextricably bound together.
We investigate repeated short-term stability and variabi-
lity in 6- to 8-year-old children’s given and received
ratings. In addition to stability, children show a charac-
teristic pattern of fluctuation and variability. In their
patterns of giving ratings to others, children have a cert-
ain relatively constant ‘style’. The focus of the present
article lies on the presentation of new methodological
approaches to the study of variability and stability of
sociometric ratings in children. (Netherlands Journal of
Psychology 63, 86-101.)
In 1934, Moreno defined sociometry as ‘the inquiry
into the evolution and organisation of groups and the
position of individuals within them’ (Moreno, 1934).
Since then, the sociometric perspective has been used to
gain insight into the social development of children.
Moreno (1943) mentions two-way relations between
individuals as a central aspect of sociometry. More pre-
cisely, a child receives ratings from and gives ratings to
other children in the group, defining the child’s sociome-
tric status and the child’s rating behaviour or rating style,
respectively.
Moreno’s definition emphasises the dynamic nature of
groups and sociometric measures (see also Moreno,
1943, p. 316). Change and stability of sociometric mea-
sures over time reflect this dynamic nature. Both indivi-
dual and group factors have an influence on stability and
stand in a complex interaction. Not much is known,
however, about the relative importance of these indivi-
dual and group factors and how this may change across
development (Cillessen & Bukowski, 2000).
In this article, we will address the short-term stability
of given and received ratings, in an attempt to come to a
better understanding of the dynamic nature of children’s
social preferences and focus on the discussion of methods
and designs.
Sociometry and the study of development
Sociometric status: effects on development
Sociometric status is often seen as an adequate reflection
of the social competence of a child (Black & Logan, 1995;
Parker & Asher, 1987), which refers to a child’s ability to
engage successfully in interactions, relationships and
groups (Rubin, Bukowski, & Parker, 1998; Cillesen &
Mayeux 2004). Status has also been studied in relation to
friendship, (Bukowski, Pizzamiglio & Newcomb, 1996;
Kupersmidt, DeRosier & Patterson, 1995), quality of
(attachment) relation with parents (Armentrout, 1972;
Henderien Steenbeek, and, (*)Department of Clinical and Developmental Psychology,University of GroningenCorrespondence to: HenderienSteenbeek, Department of Clinical and DevelopmentalPsychology, Heymansgebouw, Grote Kruisstraat 2/1, NL 9712TS Groningen, E-mail: [email protected] June 2007; revision accepted 27 June 2007.
Netherlands Journal of Psychology (March 2007) 63:79–92
DOI 10.1007/BF03061069
13

Patterson, Kupersmidt & Griesler, 1990; Franz & Gross,
1996; Pettit, Harris, Bates & Dodge, 1991), maternal
disciplinary and supervisory behaviour (Finnie & Rus-
sell, 1988; Hart, Ladd & Burleson, 1990), impressions of
relationships with peers (Patterson, et al., 1990), self-
concepts, such as the feeling of self-in-relations (DeKoei-
jer, 2001; Verschueren, Marcoen & Schoefs, 1996;
Rudolph, Hammen&Burgi, 1995; Bradley &Newhouse,
1975), socially dominating behaviour (Pettit, Bakshi,
Dodge & Coy, 1990), academic performance (Wentzel
& Asher, 1995; Wentzel & Caldwell, 1997), amount and
complexity of fantasy play (Connolly & Doyle, 1984),
awareness of specific peers that like or dislike this child
(MacDonald & Cohen, 1995), school adjustment (Ladd,
Kochenderfer & Coleman, 1997) and recent life events
(Patterson, Vaden & Kupersmidt, 1991).
It has become clear that rejected children are likely to
encounter problems in their everyday life (Bierman,
2004). Children interpret behaviours of low status child-
ren more negatively than behaviour of children of other
status groups (Hymel, 1986). Rejected children use more
agonistic and fewer prosocial solutions to social dilem-
mas (Asarnow&Callan, 1985; Quiglle, Garber, Panak &
Dodge, 1992; Rubin & Daniels-Beirness, 1983). Espe-
cially if this rejected status remains relatively stable, the
child runs the risk of encountering problems later in life
(Haselager et al., 2002; Cillessen, Van IJzendoorn, &Van
Lieshout, 1992; DeRosier, Kupersmidt & Patterson,
1994; Kupersmidt &Coie, 1990). This gives an indication
of the developmental importance of information about
the stability of statuses of children (Parker & Asher,
1987; Coie, Lochman, Terry, & Hyman, 1992).
Behavioural properties of social status groups
Concerning behaviour in general, each sociometric group
has distinct behavioural repertoires that influence the
quality of their social relations (Coie, Dodge & Kupers-
midt, 1990; Newcomb, Bukowski & Pattee, 1993). For
example, rejected children show higher levels of inappro-
priate behaviour and aggression (Dodge, Coie & Brakke,
1982; Coie, Dodge & Coppotelli, 1982). In addition, they
are inclined to break rules and show hyperactivity and
disruptive behaviour (Coie, et al., 1990).
Several studies have found significant differences in
status groups with regard to specific interaction skills,
(Hazen & Black, 1984, 1989, 1990, Masters & Furman,
1981). In preschool children, Hazen and Black (1984)
found that popular subjects were the most efficient in
their ability to direct their communications to others and
had a wide range of social initiation strategies. Major
differences were found between popular and rejected
children in their communication with parents (Black &
Logan 1995; Markell & Asher, 1984) and with peers
(Gerrits, 2004).
Why is it important to know more about stability?
The very small number of studies on the stability of the
status of children is surprising, given the pervasive use of
status types in the literature (Cillessen, Bukowski, &
Haselager, 2000; Newcomb, et al., 1993). Most research
about the stability of sociometric status focuses on the
long-term stability, during a period of a year or more.
Little research is done on short-term stability, during a
couple of months or shorter and on stability of both
given and received ratings. By paying attention to the
aspect of fluctuation and variability (relating to short-
term stability or fluctuation), a better view will be obtai-
ned of the evolution of interpersonal relations in child-
hood (relating to long-term stability or change), such as
the acquaintanceship process (Furman, 1987) and
aggressive dyadic behaviour (Dodge, Price, Coie &
Christopoulos, 1990).
An overview of research on stability
Themajority of the literature has focused on the question
of the stability of received ratings. Short-term stability,
defined over intervals of less than a year, is conceived of
as reliability of the test, which is a methodological issue
(Cillessen & Ten Brink, 1991) provided the ratings have
been taken under unchanged conditions (Maassen,
Steenbeek & Van Geert, 2003). Long-term stability is
seen as real stability and is based on repeated status
measurements with the same children over intervals
longer than twelve months. Long-term variability is con-
ceived of as real change, which is a developmental issue.
Cillessen & Bukowski (2000) define short-term research
through intervals of three months or shorter. Wu, Hart,
Draper and Olsen (2001) distinguish between reliability
(measurement error) and stability (real agreement) on a
short term of eight weeks.
In a general research context, stability is defined as the
consistency of the relative positions of individual persons
on a measured property over a certain time span (Koops
& Van der Werff, 1987). An alternative point of view,
which we will take in the remainder of the article, is that
the inverse of stability, the variability of ratings, is
equally (or more) important as source of information
about sociometric processes, than stability itself. Varia-
bility is an inherent property of developmental processes,
which occurs over any possible time interval. This point
of view is in accordance with dynamic systems theory
(Thelen & Smith, 1994), which claims that there is no
80 Netherlands Journal of Psychology (March 2007) 63:79–92
13
qualitative difference between short-term and long-term
variability and that psychological properties, such as a
child’s preferences for his or her peers, are inherently
context-specific and variable.
Stability and variability of received ratings
Stability can be determined over distinct time intervals,
for distinct age groups, for distinct sociometric con-
structs such as acceptance and rejection and for distinct
methods (the nomination method, Newcomb &
Bukowski (1983) and the ratings method, Maassen,
Akkermans & Van der Linden (1996)). It can be specified
in terms of various statistical measures, such as correla-
tions, Cohen’s kappa or percentage agreement. Stability
calculations vary as much as the criteria that determine
to which status group a child belongs (Asher & Dodge,
1986). Because of that, it is difficult to give an unambi-
guous picture of the results of stability research. Howe-
ver, in their review article Cillessen and Bukowski (2000)
conclude that in general the stability of peer status
increases with children’s age and decreases with the
length of the test-retest interval. Finally, popular, rejec-
ted and average groups of children are more stable than
the neglected and controversial groups, which are highly
unstable (Ollendick, Greene, Francis & Baum 1991;
Asher & Dodge, 1986; Newcomb & Bukowski, 1983).
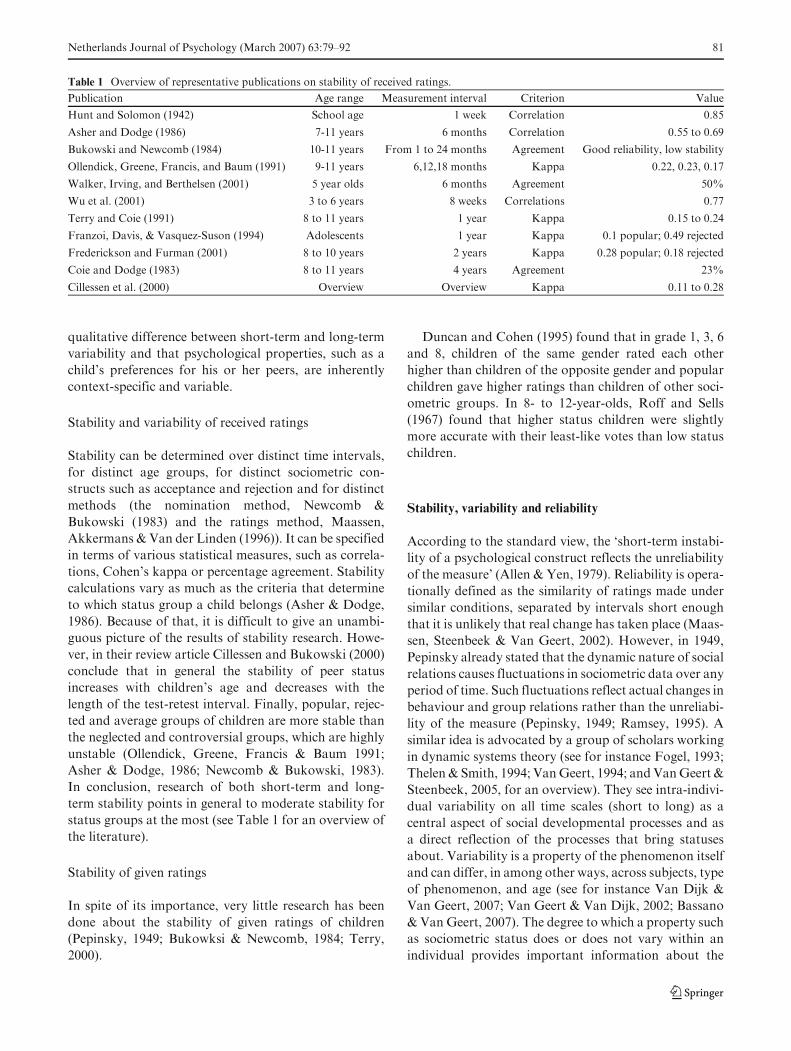
In conclusion, research of both short-term and long-
term stability points in general to moderate stability for
status groups at the most (see Table 1 for an overview of
the literature).
Stability of given ratings
In spite of its importance, very little research has been
done about the stability of given ratings of children
(Pepinsky, 1949; Bukowksi & Newcomb, 1984; Terry,
2000).
Duncan and Cohen (1995) found that in grade 1, 3, 6
and 8, children of the same gender rated each other
higher than children of the opposite gender and popular
children gave higher ratings than children of other soci-
ometric groups. In 8- to 12-year-olds, Roff and Sells
(1967) found that higher status children were slightly
more accurate with their least-like votes than low status
children.
Stability, variability and reliability
According to the standard view, the ‘short-term instabi-
lity of a psychological construct reflects the unreliability
of the measure’ (Allen & Yen, 1979). Reliability is opera-
tionally defined as the similarity of ratings made under
similar conditions, separated by intervals short enough
that it is unlikely that real change has taken place (Maas-
sen, Steenbeek & Van Geert, 2002). However, in 1949,
Pepinsky already stated that the dynamic nature of social
relations causes fluctuations in sociometric data over any
period of time. Such fluctuations reflect actual changes in
behaviour and group relations rather than the unreliabi-
lity of the measure (Pepinsky, 1949; Ramsey, 1995). A
similar idea is advocated by a group of scholars working
in dynamic systems theory (see for instance Fogel, 1993;
Thelen& Smith, 1994; VanGeert, 1994; andVanGeert &
Steenbeek, 2005, for an overview). They see intra-indivi-
dual variability on all time scales (short to long) as a
central aspect of social developmental processes and as
a direct reflection of the processes that bring statuses
about. Variability is a property of the phenomenon itself
and can differ, in among other ways, across subjects, type
of phenomenon, and age (see for instance Van Dijk &
Van Geert, 2007; Van Geert & Van Dijk, 2002; Bassano
& Van Geert, 2007). The degree to which a property such
as sociometric status does or does not vary within an
individual provides important information about the
Table 1 Overview of representative publications on stability of received ratings.
Publication Age range Measurement interval Criterion Value
Hunt and Solomon (1942) School age 1 week Correlation 0.85
Asher and Dodge (1986) 7-11 years 6 months Correlation 0.55 to 0.69
Bukowski and Newcomb (1984) 10-11 years From 1 to 24 months Agreement Good reliability, low stability
Ollendick, Greene, Francis, and Baum (1991) 9-11 years 6,12,18 months Kappa 0.22, 0.23, 0.17
Walker, Irving, and Berthelsen (2001) 5 year olds 6 months Agreement 50%
Wu et al. (2001) 3 to 6 years 8 weeks Correlations 0.77
Terry and Coie (1991) 8 to 11 years 1 year Kappa 0.15 to 0.24
Franzoi, Davis, & Vasquez-Suson (1994) Adolescents 1 year Kappa 0.1 popular; 0.49 rejected
Frederickson and Furman (2001) 8 to 10 years 2 years Kappa 0.28 popular; 0.18 rejected
Coie and Dodge (1983) 8 to 11 years 4 years Agreement 23%
Cillessen et al. (2000) Overview Overview Kappa 0.11 to 0.28
Netherlands Journal of Psychology (March 2007) 63:79–92 81
13

individual person in question and about how develop-
mental mechanisms operate to create specific develop-
mental trajectories (Steenbeek & Van Geert, 2006, 2007).
A reliable repeated measurement of a fluctuating phe-
nomenon must of course reflect this fluctuation in the
variability of this measurement. In other words, short-
term fluctuation is never in itself an indicator of (un)
reliability. Existing research mostly conceives of socio-
metric status as some sort of objective characteristic of
children, measured in a group-based sociometric proce-
dure, neglecting the fact that important information is
present in rating processes of individual children. Thus
we need an approach that is more oriented towards
individual rating processes. Following the initiators of
sociometric measurement as well as dynamic systems
thinking, we assume that individual rating processes of
young children have a characteristic bandwidth of vari-
ability that may differ among individual children (or age,
but this aspect was not investigated in the present study).
The view on reliability presented here does not imply
that reliability as such is not an issue. We see the reliabi-
lity of the sociometric rating, for instance, in the fact that
children answer ‘in good faith’ and are not up to decei-
ving the researchers, that they understand the questions
we ask, that they recognise the pictures of their classma-
tes, etc. It is true that we do not know for sure whether
these conditions held during the test administrations.
The only thing a researcher can do is to create test condi-
tions that optimise their likelihood. Finally, a distinction
should be made between a reliable measurement as such
and the reliability of the measurement with regard to
certain decisions one wishes to make on the basis of the
measurement. For instance, if preferences of children for
their peers are in reality highly variable, one should not
rely on themeasurement of those preferences for dividing
the class into subgroups, for instance.
Measures of stability reported in the literature are
often based on correlations. However, even a high corre-
lation (e.g. 0.6) still implies a considerable amount of
variability that merits further research (see also Terry &
Coie, 1991). Secondly, since sociometric status is the
result of rating processes of individual children, it follows
that the total rating (given choices) of the whole group
can be stable, but at the same time the individual judge-
ments of separate children can fluctuate. For example, is
a child’s popularity based on loyal child friends or a
highly varying group of friends?
Finally, there is only little information about variabi-
lity over long intervals (e.g. six months). For instance, is a
particular child’s broadband of variability a stable cha-
racteristic of that child, or does the bandwidth itself show
considerable variation (e.g. from highly variable to
highly similar ratings). This is the issue of variability-of-
variability that we will explicitly address in the current
article. At least three measurements are required to pro-
vide information about variability-of-variability.
Research questions
Our view focuses on sociometric ratings as an activity
carried out by or addressed towards individual children.
We view both the short-term and the long-term corres-
pondences and differences as a mixture of fluctuation,
change and stability and assign equal importance to the
giving and the receiving of ratings.
Our first question concerns the definition of stability
and its relation to variability.Wewill then use this notion
of variability and stability to answer the following empi-
rical questions:
a. What is the variability of (1) received / (2) given
ratings of each separate child between two measurement
occasions and what are the consequences for the stability
in (1) received / (2) given ratings?
b. To what extent is the variability of (1) received /
(2) given ratings itself variable over more than two mea-
surement occasions?
Method
Subjects
Eighty-three children (47 boys and 36 girls) from grade 1
participated in the study. The average age of the children
was 6.5 years, with an upper limit of 8.8 and a lower limit
of 5.8 years. These children came from three schools for
regular primary education (for further details we refer to
the web materials which can be accessed at www.gmw.
rug.nl/~model)
The rating test
SSRAT, a two-dimensional ratings method for the deter-
mination of sociometric status (Maassen, et al., 1996)
was used. Subsequently two different methods, fre-
quency and quality, were presented. In the frequency
measure the question ‘How often do you play with this
particular child?’ was posed and was answered on a
three-point scale (never, sometimes, often). The quality
measure consisted of the question ‘do you like playing
with this particular child?’. Possible answers were ’no’
(1), ’indifferent’ (2) and ’yes’ (3).
In the quality method, every time a child received the
response ‘yes’ (3), he or she obtained a point on the
sympathy score, while every time a child got a score
‘no’ (1), he or she received a point on the antipathy
82 Netherlands Journal of Psychology (March 2007) 63:79–92
13
score. As regards the frequency measure, the response
‘often’, or (3), leads to a point on the sympathy score, and
the response ‘never’, or (1), leads to a point on the anti-
pathy score. Thus, sympathy scores were calculated by
transforming 3-choices into 1 point for sympathy; whe-
reas antipathy scores were obtained by transforming 1-
choices into 1 point for antipathy. This procedure is
common in sociometric tests, in which the sympathy
score and antipathy score are used to calculate the pre-
ference score and impact score of a particular child
(S+A = P, S-A = I).
Procedure
The computerised sociometric test was presented indivi-
dually, with randomised presentation of the photos of
the classmates one at a time, together with the written
and symbolic form of the response alternatives. The test
was administered three times in four months, with an
interval of approximately six weeks. The first round of
the testing was in February/March. The three measure-
ments (M1, M2 and M3) correspond with two occasions
for specifying stability, namely M1-M2 and M2-M3.
Thus, our sociometric procedure consisted of two
methods (frequency and quality), three measurements
(M1, M2 and M3) and two stability occasions (M1-M2
and M2-M3).
Statistical design
Measures of stability
The stability of a child’s ratings given to or received from
his or her classmates are obviously represented by the
agreement or similarity of the ratings across repeated
measurements. The simplest possible expression of
agreement is therefore proportion similar ratings over
two measurements, and should thus be recommended
as standard practice (Bakeman & Gottman, 1997; Uber-
sax, 2007). In spite of this recommendation, (develop-
mental) psychologists customarily use measures of
agreement that are not the most informative or intuiti-
vely interpretable. We have seen that various studies
reported correlations as a stability measure. A correla-
tion measure is based on a number of mathematical
transformations of the data that conceal a great deal of
the (dis)similarities in the original datasets (for a more
thorough explanation we refer to Van Geert and Steen-
beek (in preparation, see also web materials). Another
widely used measure is Cohen’s kappa. Its major disad-
vantage in terms of presenting a transparent measure of
similarity is that it mathematically corrects for chance
agreement in a way that does not correspond with exis-
ting theories of rating, raters and the structure of the
rated phenomena, and for this reason researchers should
in general be advised against using it (Ubersax, 1987,
1988; see Van Geert & Van Dijk, 2003, for an overview
of the literature). The reason why researchers continue to
use correlations and kappa’s is that these measures ena-
ble them to calculate a p value, and thus to make a claim
about possible chance dependency of the agreement.
However, chance probabilities can also be calculated
for simple agreement measures, but this procedure requi-
res that the researcher first decides on the nature and
origin of his chance agreement model. In other words,
the researcher must construct an explicit null hypothesis
model. If the situation is relatively complex, such as with
sociometric ratings from individual children in a class,
the null hypothesis model is correspondingly complex.
For instance, the given and received ratings are interde-
pendent, the distributions are not necessarily symmetric
or normal, the numbers of cases are small, there may be
outliers, etc. In such cases, it is recommended that the
researcher builds a simulation model of the chance
model. This approach is known as the Monte Carlo
approach to statistical testing, and includes techniques
such as random permutation and bootstrapping (Good,
1999; Manly, 1997; Todman & Dugard, 2001). Interde-
pendencies, small sample sizes, outliers and so forth can
be built into suchMonte Carlomodels, similar to the way
they occur in the dataset. The resulting p values and
chance distributions thus automatically account for
these properties and do not require any additional statis-
tical corrections.
Defining stability and variability in the current research
In order to determine stability, we transform the original
ratings into sympathy scores as described earlier, and
proceed by determining the proportion of similarity in
the sociometric ratings (received and given) of each indi-
vidual child over two consecutive measurements. The
proportion of similarity is the number of times the child’s
rating remains equal (0-0 or 1-1), divided by the total
number of ratings made. The next step is to transform
this similarity into an index of stability.
We conceive of stability as the inverse of variability.
Maximal variability (i.e., minimal stability) is what
results from (imaginary) raters whomake chance ratings.
These imaginary raters represent our null hypothesis
model that agreement is based on chance alone. For the
present research, we decided to adopt the simplest possi-
ble model of chance assignment of ratings, namely a
model-of-maximally-unconstrained-rating. It is a model
where raters have no preference at all. Thus, a model-
Netherlands Journal of Psychology (March 2007) 63:79–92 83
13

of-maximally-unconstrained-rating is a model in which
there are no constraints on the ratings, except for the fact
that the ratings must be given in terms of a specified set of
response alternatives (1, 2 and 3 in our case). Thus, there
are no preferences for particular persons, every rating is
completely independent of any preceding rating and
there are no preferences for any of the response alterna-
tives. This simplest possible null hypothesis model can be
used as a kind of ‘benchmark test’ and in further research
be refined by more realistic null hypothesis models,
which for instance account for gender- or age-specific
biases in ratings (e.g. more positive than negative; see
Van Geert & Steenbeek (in preparation, see also web
materials). Finally, we define the variability of a particu-
lar child’s sociometric ratings as the probability that a
model-of-maximally-unconstrained-rating produces a
proportion of similarity that is equal to or higher than
the observed similarity.
TheMonte Carlo (i.e., simulation) model was set up as
follows. We first defined a structure of ratings similar to
that of the observed children and classes (similar in terms
of number of children, missing children across occasions,
and ratings given and received). A single rating was
simulated by randomly assigning 1s, 2s and 3s based on
equal probabilities (33.3% for each). Second, we trans-
formed the simulated 1, 2 and 3 ratings into sympathy
choices or antipathy choices. Third, we calculated the
proportion of similarity between these simulated measu-
rements. Fourth, the three steps were repeated 10,000
times, thus resulting in 10,000 simulated proportions of
similarity. Finally, we calculated how many of the simu-
lated similarities were equal to or greater than the obser-
ved similarity. This number divided by 10,000 gives the p
value of the observed similarity, for each child separately.
According to our definition, this p value is equal to the
variability of this particular child, i.e., the chance that a
model-of-unconstrained-rating produces this particular
similarity. Because we have defined stability as the
inverse of variability, stability can be expressed as 1-p.
Figure 1 represents the relation between the propor-
tion of similarity of each child and the child’s stability.
The stability index as a transition function
Inspection of figure 1 suggests that stability can be repre-
sented as a transition function, more precisely a sigmoid
function of the proportion of similarity (for mathematical
details, see the webmaterials). Based on the sigmoid equa-
tion, we can calculate the stability that corresponds with
any possible proportion of similarity, including propor-
tions of similarity that were not present in our sample.
Figure 2 represents the stability values that correspond
with proportions of similarity ranging from 0 to 1.
Figure 2 shows that the index of stability can be con-
ceived of as a non-linear property of the proportion of
similarity (e.g. a proportion of similarity of 0.76 and 0.96
differ only very little in stability, whereas similarities of
0.56 and 0.76, a similar 0.2 difference, differ greatly in
stability). It also shows that the non-linearity of the
similarity-stability relationship can be used as a means
for dividing the curve into three separate sections. Sec-
tion 1 represents a stable group, in which 1-p > 0.95,
which corresponds with a proportion of similarity =
0.78.
Section 2 represents a transition group, in which 0.05>
1-p < 0.95. The corresponding proportion of similarity
of this group lies between 0.38 and 0.78.
Section 3 represents an unstable group, in which
1-p < 0.05, in which the proportion of similarity is
Figure 1 Stability, with on the x-axis the proportion of similarity,on the y-axis the 1-p value, which is our index of stability.
Figure 2 The relation between the proportion of similarity (on thex-axis) and the stability of individual children (on the y-axis, 1-p).Three groups of distinct stability categories are represented: astable group (upper-right), transition group (in the middle), and anunstable group (bottom-left).
84 Netherlands Journal of Psychology (March 2007) 63:79–92
13

< 0.38. Children in this unstable group consistently
switch their ratings.
The use of the proportion of similarity has an impor-
tant advantage, namely that its meaning is intuitively
clear (there are no corrections or transformations, as in
other indices of agreement, see Uebersax, 2007). Why,
then, use the apparent detour of the stability index and
not simply stick to the proportion of similarity? The first
reason is that we intend to use the proportion of simila-
rity formaking a categorical statement, for instance ‘This
child has made a stable rating (or not)’. The proportion
of similarity is a simple linear function (see figure 3),
which has no ‘natural’ or salient boundary that separates
the stable from the unstable ratings. On the other hand, a
discontinuous transition function (figure 3, black line)
clearly defines a separation between unstable (agreement
index of 0) and stable (agreement index of 1) ratings,
separated by a group of intermediary values. Thirdly, a
sigmoid stability function is even better, because it is
continuous, but nevertheless shows a somewhat fuzzy
but sufficiently salient distinction between a group of
unstable ratings (agreement almost 0) and stable ratings
(agreement almost 1).
The second reason for using the stability function is
that it provides a flexible method for categorising the
ratings into a stable and an unstable group. To begin
with, the exact form (steepness) of the curve depends on
the number of ratings given by a particular child. Thus,
the distinction between stable and unstable ratings can be
easily adapted to the actual number of ratings, which
differs among children andmeasurements. An additional
advantage – which we do not explore in the present
article – is that the transition function can be freely
adapted to different null hypothesis models (examples
of different outcomes under different null hypotheses
are given in Van Geert & Steenbeek, in preparation; see
web materials).
Results
Received stability
Received ratings: the distribution of stability levels
Figure 4 shows the frequencies of received ratings for
both stability occasions (M1M2 and M2M3) and both
methods (frequency and quality). First, the stability bet-
ween 0.95 and 1 occurs with a considerably higher fre-
quency than all the others. Second, there is a statistically
significant decreasing trend, from 0.95 to 0.05. The third
point considers the transition group, which consists of
Figure 3 A linear functioncompared with adiscontinuous transitionfunction and a sigmoidtransition function; thetransition functions allow for acategorical distinction betweenstable sets (approximately 0 orapproximately 1) separated bya transition set.
Figure 4 Frequencies ofchildren with different levels ofstability.
Netherlands Journal of Psychology (March 2007) 63:79–92 85
13
minimally 19 (10+9) and maximally 35 (17+18) child-
ren (table 2). The position of the median stability value is
asymmetric. For example, in the frequency measure at
occasion M1M2 half of the transition group falls bet-
ween 0.05 to 0.829, the other half lies between 0.83 to
0.95. Finally, there are no children in the unstable group.
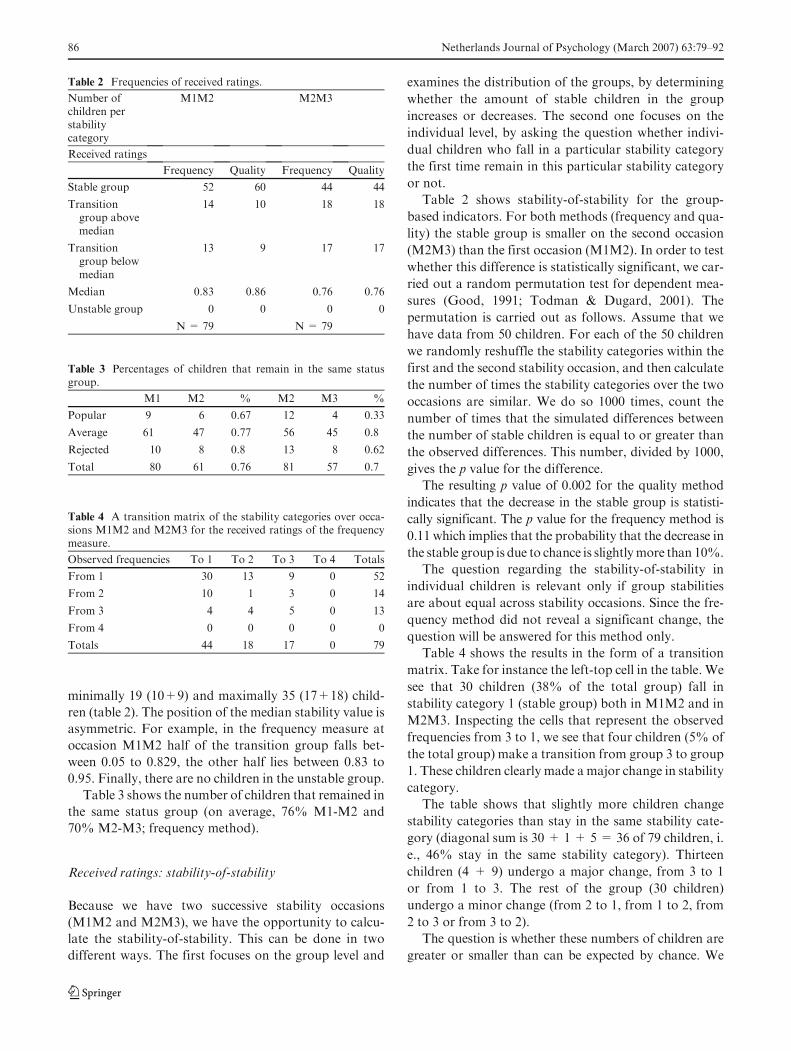
Table 3 shows the number of children that remained in
the same status group (on average, 76% M1-M2 and
70% M2-M3; frequency method).
Received ratings: stability-of-stability
Because we have two successive stability occasions
(M1M2 and M2M3), we have the opportunity to calcu-
late the stability-of-stability. This can be done in two
different ways. The first focuses on the group level and
examines the distribution of the groups, by determining
whether the amount of stable children in the group
increases or decreases. The second one focuses on the
individual level, by asking the question whether indivi-
dual children who fall in a particular stability category
the first time remain in this particular stability category
or not.
Table 2 shows stability-of-stability for the group-
based indicators. For both methods (frequency and qua-
lity) the stable group is smaller on the second occasion
(M2M3) than the first occasion (M1M2). In order to test
whether this difference is statistically significant, we car-
ried out a random permutation test for dependent mea-
sures (Good, 1991; Todman & Dugard, 2001). The
permutation is carried out as follows. Assume that we
have data from 50 children. For each of the 50 children
we randomly reshuffle the stability categories within the
first and the second stability occasion, and then calculate
the number of times the stability categories over the two
occasions are similar. We do so 1000 times, count the
number of times that the simulated differences between
the number of stable children is equal to or greater than
the observed differences. This number, divided by 1000,
gives the p value for the difference.
The resulting p value of 0.002 for the quality method
indicates that the decrease in the stable group is statisti-
cally significant. The p value for the frequency method is
0.11 which implies that the probability that the decrease in
the stable group is due to chance is slightlymore than 10%.
The question regarding the stability-of-stability in
individual children is relevant only if group stabilities
are about equal across stability occasions. Since the fre-
quency method did not reveal a significant change, the
question will be answered for this method only.
Table 4 shows the results in the form of a transition
matrix. Take for instance the left-top cell in the table. We
see that 30 children (38% of the total group) fall in
stability category 1 (stable group) both in M1M2 and in
M2M3. Inspecting the cells that represent the observed
frequencies from 3 to 1, we see that four children (5% of
the total group) make a transition from group 3 to group
1. These children clearly made a major change in stability
category.
The table shows that slightly more children change
stability categories than stay in the same stability cate-
gory (diagonal sum is 30 + 1+ 5= 36 of 79 children, i.
e., 46% stay in the same stability category). Thirteen
children (4 + 9) undergo a major change, from 3 to 1
or from 1 to 3. The rest of the group (30 children)
undergo a minor change (from 2 to 1, from 1 to 2, from
2 to 3 or from 3 to 2).
The question is whether these numbers of children are
greater or smaller than can be expected by chance. We
Table 2 Frequencies of received ratings.
Number ofchildren perstabilitycategory
M1M2 M2M3
Received ratings
Frequency Quality Frequency Quality
Stable group 52 60 44 44
Transitiongroup abovemedian
14 10 18 18
Transitiongroup belowmedian
13 9 17 17
Median 0.83 0.86 0.76 0.76
Unstable group 0 0 0 0
N = 79 N = 79
Table 3 Percentages of children that remain in the same statusgroup.
M1 M2 % M2 M3 %
Popular 9 6 0.67 12 4 0.33
Average 61 47 0.77 56 45 0.8
Rejected 10 8 0.8 13 8 0.62
Total 80 61 0.76 81 57 0.7
Table 4 A transition matrix of the stability categories over occa-sions M1M2 and M2M3 for the received ratings of the frequencymeasure.
Observed frequencies To 1 To 2 To 3 To 4 Totals
From 1 30 13 9 0 52
From 2 10 1 3 0 14
From 3 4 4 5 0 13
From 4 0 0 0 0 0
Totals 44 18 17 0 79
86 Netherlands Journal of Psychology (March 2007) 63:79–92
13
defined a chance distribution based on the null hypothesis
that the stability category that the child receives the first
occasion is independent of the stability category that the
child receives the second occasion. The frequencies of 1, 2 ,
and 3 groups are the only constant factor over occasions.
We simulated this null hypothesis by randomly permuting
(1,000 times) all ratings from occasion 1 over all the child-
ren. We did the same for occasion 2. Next, we counted
how often the randomly arranged groups resembled each
other and how often amajor (3-1, 1-3) orminor change (2-
1, 1-2, 2-3, 3-2) occurred over both occasions. The p value
is defined as the number of times that the chance proce-
dure yields a number that is bigger than or equal to the
observed numbers, divided by 10,000.
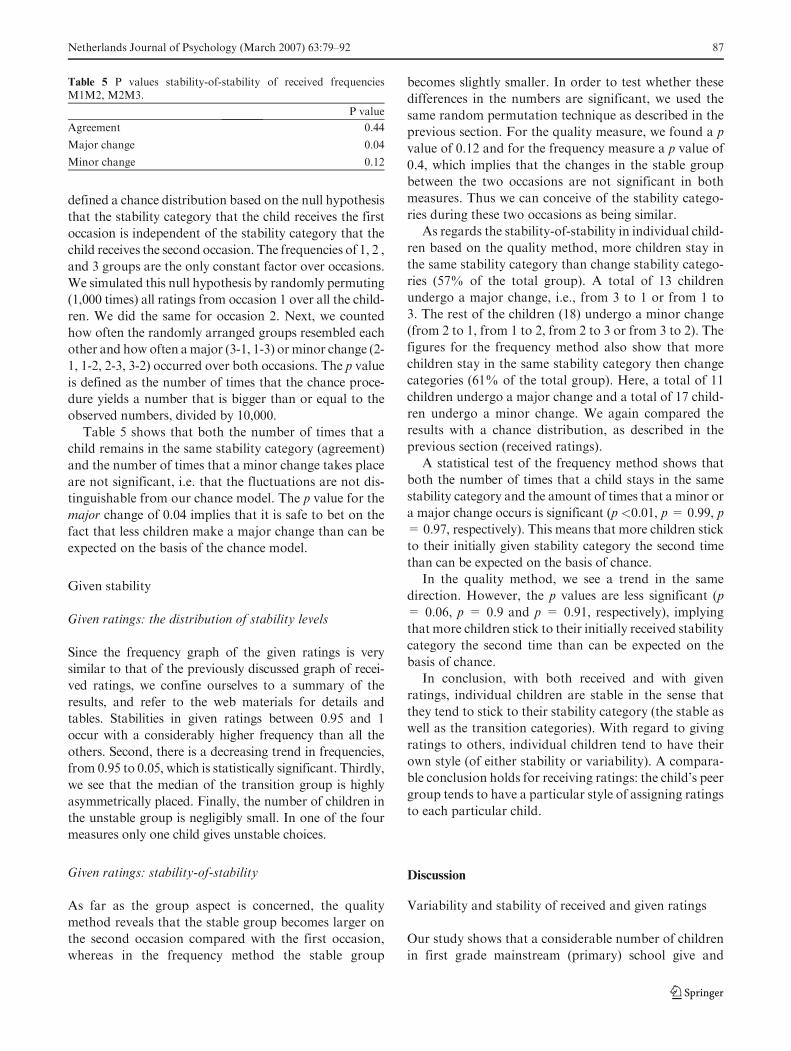
Table 5 shows that both the number of times that a
child remains in the same stability category (agreement)
and the number of times that a minor change takes place
are not significant, i.e. that the fluctuations are not dis-
tinguishable from our chance model. The p value for the
major change of 0.04 implies that it is safe to bet on the
fact that less children make a major change than can be
expected on the basis of the chance model.
Given stability
Given ratings: the distribution of stability levels
Since the frequency graph of the given ratings is very
similar to that of the previously discussed graph of recei-
ved ratings, we confine ourselves to a summary of the
results, and refer to the web materials for details and
tables. Stabilities in given ratings between 0.95 and 1
occur with a considerably higher frequency than all the
others. Second, there is a decreasing trend in frequencies,
from 0.95 to 0.05, which is statistically significant. Thirdly,
we see that the median of the transition group is highly
asymmetrically placed. Finally, the number of children in
the unstable group is negligibly small. In one of the four
measures only one child gives unstable choices.
Given ratings: stability-of-stability
As far as the group aspect is concerned, the quality
method reveals that the stable group becomes larger on
the second occasion compared with the first occasion,
whereas in the frequency method the stable group
becomes slightly smaller. In order to test whether these
differences in the numbers are significant, we used the
same random permutation technique as described in the
previous section. For the quality measure, we found a p
value of 0.12 and for the frequency measure a p value of
0.4, which implies that the changes in the stable group
between the two occasions are not significant in both
measures. Thus we can conceive of the stability catego-
ries during these two occasions as being similar.
As regards the stability-of-stability in individual child-
ren based on the quality method, more children stay in
the same stability category than change stability catego-
ries (57% of the total group). A total of 13 children
undergo a major change, i.e., from 3 to 1 or from 1 to
3. The rest of the children (18) undergo a minor change
(from 2 to 1, from 1 to 2, from 2 to 3 or from 3 to 2). The
figures for the frequency method also show that more
children stay in the same stability category then change
categories (61% of the total group). Here, a total of 11
children undergo a major change and a total of 17 child-
ren undergo a minor change. We again compared the
results with a chance distribution, as described in the
previous section (received ratings).
A statistical test of the frequency method shows that
both the number of times that a child stays in the same
stability category and the amount of times that a minor or
a major change occurs is significant (p <0.01, p= 0.99, p
=0.97, respectively). This means that more children stick
to their initially given stability category the second time
than can be expected on the basis of chance.
In the quality method, we see a trend in the same
direction. However, the p values are less significant (p
= 0.06, p = 0.9 and p = 0.91, respectively), implying
that more children stick to their initially received stability
category the second time than can be expected on the
basis of chance.
In conclusion, with both received and with given
ratings, individual children are stable in the sense that
they tend to stick to their stability category (the stable as
well as the transition categories). With regard to giving
ratings to others, individual children tend to have their
own style (of either stability or variability). A compara-
ble conclusion holds for receiving ratings: the child’s peer
group tends to have a particular style of assigning ratings
to each particular child.
Discussion
Variability and stability of received and given ratings
Our study shows that a considerable number of children
in first grade mainstream (primary) school give and
Table 5 P values stability-of-stability of received frequenciesM1M2, M2M3.
P value
Agreement 0.44
Major change 0.04
Minor change 0.12
Netherlands Journal of Psychology (March 2007) 63:79–92 87
13

receive stable ratings over a time interval of six weeks.
This is also the case when a second, consecutive period of
six weeks is measured (occasion M2M3), and is found
with two methods (frequency and quality). What is noti-
ceable is that children within the stable group vary con-
siderably in the proportion of similarity of their ratings.
It goes without saying that further research on truly
demographically representative samples is required in
order to arrive at reliable estimations of how variability
of sociometric rating is distributed over the entire popu-
lation of school children. In addition, sociometric ratings
are not meant to be indirect measures of actual interac-
tion between children, although the two are of course
related, as our overview of studies has shown.
Secondly, a somewhat smaller number of children
belong to the transition group. Both the fluctuations
and the constancy of their ratings look like that of an
unconstrained random rating model. Concerning the
ratings a particular child receives, some children change
their opinion about this child, others do not, in a coin-
cidental pattern. Probably, a teacher who works with a
group of children on a daily basis will be able to recognise
such variable patterns, but will never be able to predict
them.
Hardly any children belong to the unstable group, a
group that makes deliberate switches, i.e., considerably
more switches than can be expected on the basis of
chance (represented in our null hypothesis model).
The stability-of-stability
Whereas in the received ratings children become more
variable in the way they are rated by their peers, in the
given ratings more stability-of-stability is present, indica-
ting that if a child has a certain ‘style’ of giving ratings
this style seems to remain relatively constant for a longer
time. Note that this ‘style’ can be constant as well as
typically variable. Over stability occasions, the children
in the ‘stable style’ group are basically the same children.
The difference between the findings concerning received
and given stability-of-stability can be explained in the
following way. Apparently, there is a rather considerable
number of children in stability categories 2 and 3 (transi-
tion group above median and below median) in the given
ratings. These children vary considerably in their given
ratings, but are fairly consistent in their variability. This
seems to account for the considerable number of children
that change their received stability category.
An alternative view on stability and variability
In this article, we have presented an alternative view
which focuses on individual children’s stability by
calculating whether their stability sufficiently differs
from the stability produced by a research-specific null
hypothesis model of rating.We used the simplest possible
method, i.e., the unconstrained rating model. One of the
advantages of this approach is that researchers can flexi-
bly use other null hypotheses, for instance that choices
are biased (e.g. more 1’s than 2’s or 3’s), are gender and
age specific, etc. This procedure can be carried out over
all kinds of time intervals.
Our examination of each child’s given as well as recei-
ved ratings separately resulted in a more refined under-
standing of how individual children repeatedly choose or
are being chosen (for a discussion of the difference bet-
ween inter-individual and intra-individual variability, see
Molenaar, 2004; Molenaar, Huizenga & Nesselroade,
2003; Hamaker, Dolan & Molenaar, 2003). Notice that
in accordance with common methods, we used sympathy
scores as starting point for our calculations for each
individual child, instead of the original three response
alternatives, which unfortunately implies a certain loss of
information.
Traditionally, stability is understood as consistency of
a measured property over a certain period of time and
fluctuation is conceived of as measurement error (in
status over shorter time periods) or real change in the
measured property (in status over longer time periods).
Alternatively, we see stability as one side of a coin, inex-
tricably bound up with variability. Our conception of
stability tolerates quite a considerable level of variation.
Even if a child belongs to a group that the researcher calls
‘stable’, a characteristic pattern of fluctuation and vari-
ability can still be present in the child’s ratings. The
difference between a child in a ‘transition’ group is that
this child’s pattern of variability can not be distinguished
from the chosen null hypothesis model.
Another aspect of our concept of stability is the extent
to which a child differs from a chance model. A chance
model yields amaximally ‘capricious’, ‘whimsical’ rating.
Notice that this kind of variability is not the same as
maximal inconstancy, which results from consistent alte-
rations in the ratings. Finally, we see a major advantage
of our method of stability assessment in the fact that it
defines stability, and its twin concept variability, in rela-
tion to an explicitly formulated model of chance, and
thus obliges the researcher to specify which form of
variable rating is seen as the alternative of the stable
rating he or she hopes to find in the children under study.
The existing literature unfortunately pays little atten-
tion to the stability-of-stability and confines itself to
comparing two measurements. Thus, no insight is gained
into the interplay between child-specific and context-
specific influences and how they intertwine. For example,
is the context so important that no child-specific ‘style’
88 Netherlands Journal of Psychology (March 2007) 63:79–92
13

can be distinguished over four months? In our research
we measured social preferences three times. We could
thus see whether a specific pattern or ‘style’ of stability
and variability repeated itself or not.
Traditionally used agreement measures, such as
Cohen’s kappa, are often associated with arbitrary dis-
tinctions between stability categories (e.g. Landis &
Koch, 1977; Franzoi et al., 1994, p. 469). Using a sigmoid
transition curve makes boundaries between stable, tran-
sition and unstable categories more visible. Another
advantage is that it shows variability and stability as
complementary properties. A third advantage is its flexi-
bility. The curve can be adjusted in accordance with the
specific null hypothesis used, which results in the possi-
bility of group and person-specific testing.
Suggestions for further research and concluding remarks
Berndt, Hawkins and Hoyle (1986) and Coie (1990) have
already emphasised the need for having insight into fac-
tors that account for continuity in liking and disliking of
peers. For example, is the (lack of) stability in received
and given ratings in a particular child context or person
specific? Does it correspond with specific personality and
behavioural characteristics? Is it a predictor of specific
developmental outcomes? Especially the children with
the greatest variability deserve more attention.
A second point is that we only used the sympathy
scores in our research. It is worthwhile to look at chil-
dren’s antipathy ratings too, because antipathy scores
tell us something about variability in the low value, i.e.
‘dislike’ ratings. In addition, it would be interesting to
examine culture-specific and gender-specific differences
in rating patterns of children, in particular the stability
characteristics of such ratings. For instance, do children
showmore stability in their rating of children of the same
ethnic minority compared with their rating of other
children?
By looking at patterns of individual children, insight is
gained into the individual range width of the measured
psychological construct, which is for instance expressed
in the fluctuations in given ratings of a child over four
months. By looking at fluctuations in a developmental
process, one gets a better idea about how development
originates (Van Geert & Van Dijk, 2002; Pepinsky, 1949;
Fogel, 1994; Newcomb & Bukowski, 1993; Wu et al.,
2001). Thus, instead of focusing uniquely on stability
(as the underlying, real construct that awaits discovery),
the alternative approach presented in this article is based
on the idea that variability is an essential feature of
development. This variability can be seen in all kinds of
processes, over all kinds of time periods (Thelen & Smith,
1994). This fact suggests that if variability is found in
measurements over a short time period, it is not necessa-
rily implied that the reliability of the test is at stake.
Reliability means that a procedure must provide a relia-
ble representation of a process. Processes can be stable,
but in a developmental context, one is likely to find
processes that spontaneously fluctuate on the short-
term time scale and show considerable changes on the
long-term time scale of development.
Author’s note
This study was supported by NWO, the Netherlands
Organisation for Scientific Research, by Grant 575-28-
014 from this organisation’s Social Science Research
Council.
References
Allen, M.J. & Yen, W.M. (1979). Introduction to measurementtheory. Monterey, California: Brooks/Cole.
Armentrout, J.A. (1972). Sociometric classroom popularity andchildren’s reports of parental child-rearing behaviors. Psycho-logical Reports, 30, 261-262.
Asarnow, J.R. & Callan, J.W. (1985). Boys with peer adjustmentproblems: social cognitive processes. Journal of Consulting andClinical Psychology, 53, 80-87.
Asher, S.R. & Dodge, K.A. (1986). Identifying children who arerejected by their peers. Developmental Psychology, 4, 444-449.
Bakeman, R. & Gottman, J. M. (1997). Observing interaction: Anintroduction to sequential analysis (2nd ed.). New York, NY,US: Cambridge University Press.
Bassano, D. & Van Geert, P. (2007). Modeling Continuity andDiscontinuity in Utterance Length: A quantitative approachto changes, transitions and intra-individual variability in earlygrammatical development.Developmental Science, 10 (5), inpress.
Berndt, T.J., Hawkins, J.A. & Hoyle, S.G. (1986). Changes infriendship during a school year: Effects on children’s andadolescent’s impressions of friendship and sharing withfriends. Child Development, 57, 1284-1297.
Bierman, K.L. (2004). Peer rejection; developmental processes andintervention strategies. New York, Guildford Press.
Black, B. & Logan, A. (1995). Links between communication ofmother-child, father-child, and child-child peer interactionsand children’s social status. Child Development, 66, 255-271.
Bradley, F.O. & Newhouse, R.C. (1975). Sociometric choice andself-perception of upper elementary school children. Psycho-logy in the Schools, 12, 219-222.
Bukowski, W.M. & Newcomb, A.F. (1984). Stability and determi-nants of sociometric status and friendship choice: A longitu-dinal perspective. Developmental Psychology, 20, 941-952.
Bukowski, W.M. , Pizzamiglio, M.T. & Newcomb, A.F. (1996).Popularity as an affordance for friendship: The link betweengroup and dyadic experience. Social Development, 2, 189-202.
Cillessen, A.H.N. & Bukowski, W.M. (2000). Recent advances inthe measurement of acceptance and rejection in the peer system.New directions for child and adolescent development. Number88, summer 2000. San Francisco. Jossey-Bass.
Netherlands Journal of Psychology (March 2007) 63:79–92 89
13
Cillessen, A.H.N., Bukowski, W.M. & Haselager, G.J.T. (2000).Stability of sociometric categories. In: Cillessen, A.H.N. &Bukowski, W.M. (2000). Recent advances in the measurementof acceptance and rejection in the peer system. New directionsfor child and adolescent development. Number 88, summer2000. San Francisco. Jossey-Bass.
Cillessen, A, & Mayeux, L. (2004). Sociometric status and peergroup behavior: Previous findings and current directions. InJ.B. Kupersmidt & K.A. Dodge (Eds.), Children’s peer rela-tions: From development to intervention. (pp. 3-20). Washing-ton, DC, US: American Psychological Association.
Cillessen, A.H.N. & Ten Brink, P.W.M. (1991). Vaststelling vanrelaties met leeftijdsgenootjes. Pedagogische Studien 68, 1-14.
Cillessen, A.H.N., Van IJzendoorn, H.W. & Van Lieshout, C.F.M.(1992). Heterogenity among peer-rejected boys: subtypes andstabilities. Child Development, 63, 893-905.
Coie, J.D. (1990). Towards a theory of peer rejection. In S. Asher &J.D. Coie (Eds.). Peer rejection in childhood (365-401). Cam-bridge, MA: Cambridge University Press.
Coie, J.D. & Dodge K.A. (1983). Continuities and changes inchildren’s social status: A five year longitudinal study. Mer-rill-Palmer Quarterly, 29, 261-282.
Coie, J.D., Dodge, K.A. & Coppotelli, H. (1982). Dimensions andtypes of social status: A cross-age perspective. DevelopmentPsychology, 18, 557-570.
Coie, J.D., Dodge, K. & Kupersmidt, J.B. (1990). Peer groupbehavior and social status. In S.R. Asher & J.D. Coie (eds.),Peer rejection in childhood, 17-59. New York: CambridgeUniversity Press.
Coie, J.D., Lochman, J.E., Terry, R. & Hyman, C. (1992). Predic-ting early adolescent disorder from childhood aggression andpeer rejection. Journal of Consulting and Clinical Psychology,60, 783-792.
Connolly, J.A. &Doyl, A. (1984). Relation of social fantasy play tosocial competence in preschoolers.Developmental Psychology,5, 797-806.
De Koeyer, I. (2001). Peer acceptance, parent-child fantasy playinteractions, and subjective experience of the self-in-relation; astudy of 4- to 5-year-old children.Doctoral Dissertation. Veen-endaal, the Netherlands: Universal Press.
DeRosier, M., Kupersmidt, J. & Patterson, C. (1994). Children’sacademic and behavioral adjustment as a function of thechronicity and proximity of peer rejection.Child Development,65, 1799-1813.
Dodge, K.A., Coie, J.D. & Brakke, N.P. (1982). Behavioral pat-terns of socially rejected and neglected preadolescent ‘s role ofsocial approach and aggression. Journal of Abnormal ChildPsychology. 10, 389-410.
Dodge, K.A., Price, J.M., Coie, J.D. & Christopoulos, C. (1990).On the development of aggressive dyadic relationships in boys’peer groups. Human Development, 33, 260-270.
Duncan,M.K. & Cohen, R. (1995). Liking within the peer group asa function of children’s sociometric status and sex.Child StudyJournal, 4, 265-288.
Finnie, V. & Russell, A. (1988). Preschool children’s social statusand their mothers’ behavior and knowledge in the supervisoryrole. Developmental Psychology, 24, 789-801.
Fogel, A. (1993). Developing through relationships; origins of com-munication, self and culture. The developing body and mindseries. Harvester Wheatsheaf, New York.
Franz, D.Z. & Gross, A. (1996). Parental correlates of sociallyneglected, rejected, and average children; a laboratory study.Behavior Modification, 2, 170-182.
Franzoi, S.L., Davis, M.H. & Vasquez-Suson, K.A. (1994). Twosocial worlds: social correlates and stability of adolescentstatus groups. Journal of Personality and Social Psychology,3, 462-473.
Frederickson, N.L. &Furman, A.F. (2001). The long-term stabilityof sociometric status classification: a longitudinal study ofincluded pupils who have moderate learning difficulties andtheir mainstream peers. Journal of Child Psychology and Psy-chiatry, 5, 581-592.
Furman, W. (1987). Acquaintanceship in middle childhood. Deve-lopmental Psychology, 23, 563-570.
Gerrits, M.H. (2004). Perceived security, self-representation, anddyadic child-parent and child-peer play interactions; a longitu-dinal study. Doctoral Dissertation, University of Utrecht, theNetherlands.
Good, P. I. (1999). Resampling methods: A practical guide to dataanalysis. Boston: Birkhauser.
Hamaker, E.L., Dolan, C.V., & Molenaar, P.C.M. (2005). Statis-ticalModeling of the Individual: Rationale and Application ofMultivariate Stationary Time Series Analysis. MultivariateBehavioral Research, 40, 207-233.
Haselager, G.J.T., Lieshout, C.F.M. van, Riksen-Walraven, J.M.A, Cillessen, A.H.N. & Hartup, W.W. (2002). Heterogeneityamong peer-rejected boys across middle childhood: Develop-mental pathways of social behavior. Developmental Psycho-logy, 3, 446-456.
Hart, C.H., Ladd, G.W. &Burleson, B.R. (1990). Children’s expec-tations of the outcomes of social strategies: relations withsociometric status and maternal disciplinary styles. ChildDevelopment, 61, 127-137.
Hazen, N.L. & Black, B. (1984). Social acceptance: strategies child-ren use and how teachers can help children learn them. YoungChildren, 6, 26-36.
Hazen, N.L. & Black, B. (1989). Preschool peer communicationskills: the role of social status and intervention context. ChildDevelopment, 4, 867-876.
Hazen, N.L. & Black, B. (1990). Social status and patterns ofcommunication in acquainted and unacquainted preschoolchildren. Developmental Psychology, 26(3), 379-387.
Hunt, J. & Solomon, R. (1942). The stability and some groupcorrelates of group status in a summer camp group of youngboys. American Journal of Psychology, 55, 33-45.
Hymel, S. (1986). Interpretations of peer behavior: Affective bias inchildhood and adolescence. Child Development, 57, 431-445.
Koops, W. & van der Werf, J.J. (1987) Overzicht van de empirischeontwikkelingspsychologie 1: grondkenmerken van het vak.Gro-ningen, the Netherlands, Wolters-Noordhoff.
Kupersmidt, J.B. & Coie, J.D. (1990). Preadolescent peer status,aggression, and school adjustment as predictors of externali-sing problems in adolescence. Child Development, 61, 1350-1362.
Kupersmidt, J.B., deRosier, M.E. & Patterson, C.P. (1995). Simi-larity as the basis for children’s friendships: the role of socio-metric status, aggressive and withdrawn behavior, academicachievement and demographic characteristics. Journal ofSocial and Personal Relationships, 3, 439-452.
Ladd, G.W., Kochenderfer, B.J. & Coleman, C.C. (1997). Class-room peer acceptance, friendship and victimization: distinctrelational systems that contribute uniquely to children’sschool adjustment? Child Development, 6, 1181-1197.
Landis, J.R. & Koch, G.C. (1977). The measurement of observeragreement for categorical data. Biometrics, 33, 159-174.
90 Netherlands Journal of Psychology (March 2007) 63:79–92
13

Maassen, G.H., Akkermans, W. & van der Linden, J.L. (1996).Two-dimensional sociometric status determination withrating scales. Small Group Research, 27(1), 56-78.
Maassen, G.H., Steenbeek, H.W. & van Geert, P.L.C. (2004).Stability of three methods for two-dimensional sociometricstatus determination based on the procedure of Asher, Sing-leton, Tinsley andHymel. International Journal of Social Beha-vior and Personality, 32(6), 535-550.
MacDonald, C. M. & Cohen, R. (1995). Children’s awareness ofwhich peers like them and which peers dislike them. SocialDevelopment, 4(2), 182-193.
Manly, B. F. (1997). Randomization, Bootstrap and Monte Carlomethods in Biology (2nd ed.). Boca Raton: Chapman & Hall.
Markell, R.A. & Asher, S.R. (1984). Children’s interactions indyads: interpersonal influence and sociometric status. ChildDevelopment, 55, 1412-1424.
Masters, J. C. & Furman,W. (1981). Popularity, individual friends-hip selection, and specific peer interaction among children.Developmental Psychology, 17, 344-350.
Molenaar, P.C.M. (2004). A Manifesto on Psychology as Idiogra-phic Science: Bringing the Person Back Into Scientific Psycho-logy, This Time Forever. Measurement: InterdisciplinaryResearch & Perspectives, 2, 201-218.
Molenaar, P.C.M., Huizenga, H.M., & Nesselroade, J.R. (2003).The relationship between the structure of interindividual andintraindividual variability: A theoretical and empirical vindica-tion of developmental systems theory (pp. 339-360). Dordrecht,Netherlands: Kluwer Academic Publishers.
Moreno, J.L. (1934) . Who shall survive? A new approach to theproblem of human interrelations. Washington, D.C.: Nervousand Mental Diseases Publishing Co., 1934
Moreno, J.L. (1943). Sociometry and the cultural order. Sociometriymonographs, no. 2. Beacon House, New York.
Newcomb, A.F. & Bukowski, W.M. (1983). Social impact andsocial preferences as determinants of children’s peer groupstatus. Developmental Psychology, 19, 856-867.
Newcomb, A. F. & Bukowski, W.M. & Pattee, L. (1993). Chil-dren’s peer relations: Ameta-analytic review of popular, rejec-ted, neglected, controversial, and average sociometric status.Psychological Bulletin, 113, 99-128.
Ollendick, T.H., Greene, R.W., Francis, G & Baum, C.G. (1991).Sociometric status: its stability and validity among neglected,rejected and popular children. Journal of Child Psychology andPsychiatry and Allied Disciplines, 3, 525-534.
Parker, J. G. &Asher. S.R. (1987). Peer relations and later personaladjustment: are low-accepted children at risk? PsychologicalBulletin, 102(3), 357-389
Patterson, C.J., Kupersmidt, J.B. & Griesler, P.C. (1990). Chil-dren’s perceptions of self and relations with others as a func-tion of sociometric status. Child Development, 61, 1335-1349.
Patterson, C.J., Vaden, N.A. & Kupersmidt, J.B. (1991). Familybackground, recent life events, and peer rejection during child-hood. Journal of Social and Personal Relationships, 8, 347-361.
Pepinsky, P.N. (1949). The meaning of ‘validity’ and ‘reliability’ asapplied to sociometric tests. Educational andPsychologicalmeasurement, 9, 39-49. Washington.
Pettit, G.S., Bakshi, A., Dodge, K.A. & Coie, J.D. (1990). Theemergence of social dominance in young boys’ play groups:developmental differences and behavioural correlates. Deve-lopmental Psychology, 26 (6), 1017-1025
Pettit, G.S., Harris, A.W., Bates, J.E. & Dodge, K.A. (1991).Family interaction, social cognition and children’s subsequentrelations with peers at kindergarten. Journal of Social andPersonal Relationships, 8, 383-402.
Quiggle, N., Garber, J., Panak, W. & Dodge, K.A. (1992). Socialinformation processing in aggressive and depressed children.Child Development, 63, 1305-1320.
Ramsey, P.G. (1995). Changing social dynamics in early childhoodclassroom. Child Development, 66, 764-773.
Roff, M. & Sells, B.B. (1967). The relations between the status ofchooser and chosen in a sociometric situation at the gradeschool level. Psychology in The Schools, 4(2), 99-111.
Rubin, K.H., Bukowski, W. & Parker, J.G. (1998). Peer interacti-ons, relationships, and groups. In M. Damon & N. Eisenberg(Eds.) (1998). Handbook of child psychology. Volume III.Social, emotional, and personality development. (pp. 619-700).New York: Wiley & Sons.
Rubin, K.H. & Daniels-Beirness, T. (1983). Concurrent and pre-dictive correlates of sociometric status in kindergarten andgrade one children. Merrill-Palmer Quarterly, 29, 337-351.
Rudolph, K.D, Hammen, C. & Burgi, D. (1995). Cognitive repre-sentations of self, family, and peers in school-age children:links with social competence and sociometric status. ChildDevelopment, 66, 1385-1402.
Steenbeek, H.W. &Van Geert, P.L.C. (2006). A Theory andDyna-mic Model of Dyadic Interaction: Concerns, Appraisals andContagiousness in A Developmental Context. DevelopmentalReview, 27, 1- 40.
Steenbeek, H.W. & Van Geert, P.L.C. (2007). A dynamic systemsmodel of dyadic child-peer interaction. An Empirical Valida-tion Of A Dynamic Systems Model Of Interaction: Do Child-ren Of Different Sociometric Statuses Differ In Their DyadicPlay? Developmental Science, in press.
Terry, R. (2000). Recent advances in measurement theory and theuse of sociometric techniques. In: Cillessen, A.H.N. &Bukowski, W.M. (2000). Recent advances in the measurementof acceptance and rejection in the peer system. New directionsfor child and adolescent development. Number 88, summer2000. San Fransisco. Jossey-Bass
Terry, R. & Coie, J.D. (1991). A comparison of methods for defi-ning sociometric status among children. Developmental Psy-chology, 27, 867-881.
Thelen, E. & Smith, L.B. (1994).A dynamic systems approach to thedevelopment of cognition and action. Cambridge, MA: MITpress.
Todman, J.B. & Dugard, P. (2001). Single-case and small-n experi-mental designs: A practical guide to randomization tests. Mah-wah (NJ): Erlbaum.
Uebersax, J. S. (1987). Diversity of decision-makingmodels and themeasurement of interrater agreement. Psychological Bulletin,101, 140-146.
Uebersax, J. S. (1988). Validity inferences from interobserveragreement. Psychological Bulletin, 104, 405-416.
Uebersax, J. (2007). Statistical methods for rater agreement.http://ourworld.compuserve.com/homepages/jsuebersax/agree.htm.
Van Dijk, M. & Van Geert, P. (2007). Wobbles, humps and suddenjumps: A case study of continuity, discontinuity and variabi-lity in early language development.Infant and Child Develop-ment, 16 (1), 7-33
VanGeert, P.L.C. (1994).Dynamic systems of development: Changebetween complexity and chaos. New York: HarvesterWheatsheaf.
Van Geert, P. & Steenbeek, H. (2005). Explaining after by before.Basic aspects of a dynamic systems approach to the study ofdevelopment. Developmental Review, 25(3-4), 408-442.
Van Geert & Steenbeek (in preparation). Stability/variability andthe issue of reliability. www.gmw.rug.nl/~model
Netherlands Journal of Psychology (March 2007) 63:79–92 91
13

Van Geert, P. & van Dijk, M. (2002). Focus on variability: Newtools to study intra-individual variability in developmentaldata. Infant Behavior & Development, 151, 1–35.
Van Geert, P.L.C. & van Dijk, M. (2003). The problem of inter-observer reliability in ambiguous observation data. FirstLanguage, 23(3):259-284.
Verschueren, K., Marcoen, A. & Schoefs, V. (1996). The internalworkingmodel of the self, attachment, and competence in five-year-olds. Child Development. 67, 2493-2511.
Walker, S., Irving, K. & Berthelsen, D. (2001) Stability of statuses.Poster presented at SRCD, Minneapolis, 2001.
Wentzel, K. R. & Asher, S. R. (1995). The academic lives ofneglected, rejected, popular, and controversial children.Child Development, 66, 754-763.
Wentzel, K.R., Caldwell, K. (1997). Friendships, peer acceptanceand group membership: relations to academic achievement inmiddle school. Child Development, 6, 1198-1209.
Wu, X., Hart, C.H., Draper, T.W. & Olsen, J.A. (2001). Peer andteacher sociometrics for preschool children: cross-informantconcordance, temporal stability and reliability. Merrill-Pal-mer Quarterly, 3, 416-443.
92 Netherlands Journal of Psychology (March 2007) 63:79–92
13