dnb fund - velkommen til dnb fund - eco absolute return page 42 dnb fund - tmt absolute return page...
TRANSCRIPT

ANNUAL REPORT 2011
DNB FUND(formerly CARLSON FUND)
DNB Fund
Table of Contents
Page 1
Management and Administration
Page 2
Board of Directors
Page 2
Independent Auditor’s Report
Page 3
Information about DNB Fund
Page 5
DNB Fund Combined
Page 7
DNB Fund - Far East Page 8 DNB Fund - Global SRI Page 10 DNB Fund - North America Page 12 DNB Fund - Asian Small Cap Page 13 DNB Fund - Scandinavia Page 15 DNB Fund - Europe Page 17 DNB Fund - Global Emerging Markets SRI Page 18 DNB Fund - Navigator Page 20 DNB Fund - Technology Page 22 DNB Fund - Renewable Energy Page 24 DNB Fund - Private Equity Page 26 DNB Fund - BRIC Page 28 DNB Fund - China Page 30 DNB Fund - China Century Page 31 DNB Fund - India Page 32 DNB Fund - Global Value & Momentum Page 33 DNB Fund - Global Energy Page 37 DNB Fund SEK Long Bond Page 39 DNB Fund SEK Short Bond Page 41 DNB Fund - ECO Absolute Return Page 42 DNB Fund - TMT Absolute Return Page 44 Notes to the Financial Statements Page 46
Additional information (unaudited) Page 59
Subscriptions can only be received on the basis of the latest prospectus accompanied by the latest annual report as well as by the latest semi-annual report, if published after the latest annual report.
DNB Fund
Management and Administration
Page 2
MANAGEMENT COMPANY ADMINISTRATION AGENT, CUSTODIAN AND PAYING AGENT
DNB Asset Management S.A. 5, Allée Scheffer L - 2520 Luxembourg Grand Duchy of Luxembourg
CACEIS Bank Luxembourg S.A. 5, Allée Scheffer L - 2520 Luxembourg Grand Duchy of Luxembourg
INDEPENDENT AUDITOR
PROMOTER
Ernst & Young S.A. 7, rue Gabriel Lippmann Parc d’Activité Syrdall 2 L - 5365 Munsbach Grand Duchy of Luxembourg
DNB Financial Holding AB Kungsgatan 18 SE - 105 88 Stockholm Sweden
INVESTMENT MANAGER
DNB Asset Management AB Kungsgatan 18 SE - 105 88 Stockholm Sweden
Board of Directors
CHAIRMAN Mr Anders Jonsson, Managing Director, DNB Asset Management AB, Kungsgatan 18, SE - 105 88 Stockholm, Sweden (until November 1, 2011) Mr Jorgen Hjemdal, Executive Director, DNB Asset Management AS, Ovre Slottsgate 3, N - 0021 Oslo, Norway (since November 1, 2011) DIRECTORS Mr Hans Christian Gjövik, Managing Director, DNB Asset Management S.A., 26, Cité Millewee, L - 8064 Bertrange, Grand Duchy of Luxembourg (until November 1, 2011 and since November 7, 2011) Mr Frode Ekeli, Executive Vice President, DNB AS, Støperigaten 2, N - 0021 Oslo, Norway (until November 7, 2011) Mrs Trine Loe, Chief Executive Officer, DNB Bank ASA London Branch, 20 Street Dunstan’s Hill, London EC3R 8HY, United Kingdom (since November 7, 2011) Mr Ola Melgard, Executive Vice President, DNB Kapitalforvaltning AS, Ovre Slottsgate 3, N - 0021 Oslo, Norway (until November 1, 2011) Mr Jorgen Hjemdal, Executive Director, DNB Asset Management AS, Ovre Slottsgate 3, N - 0021 Oslo, Norway (until November 1, 2011)
DNB Fund
Independent Auditor’s Report
Page 3
To the Unitholders of DNB Fund (formerly CARLSON Fund) 5, Allée Scheffer, L-2520 Luxembourg We have audited the accompanying financial statements of DNB Fund (formerly CARLSON Fund) (the “Fund”) and of each of its sub-funds, which comprise the statement of net assets and the statement of investments as at December 31, 2011, and the statement of operations and the statement of changes in net assets for the year then ended, and a summary of significant accounting policies and other explanatory notes to the financial statements. Responsibility of the Board of Directors of the Management Company of the Fund for the financial statements The Board of Directors of the Management Company is responsible for the preparation and fair presentation of these financial statements in accordance with Luxembourg legal and regulatory requirements relating to the preparation and presentation of the financial statements and for such internal control as the Board of Directors of the Management Company determines is necessary to enable the preparation and presentation of financial statements that are free from material misstatement, whether due to fraud or error. Responsibility of the “réviseur d’entreprises agréé” Our responsibility is to express an opinion on these financial statements based on our audit. We conducted our audit in accordance with International Standards on Auditing as adopted for Luxembourg by the “Commission de Surveillance du Secteur Financier”. Those standards require that we comply with ethical requirements and plan and perform the audit to obtain reasonable assurance about whether the financial statements are free from material misstatement. An audit involves performing procedures to obtain audit evidence about the amounts and disclosures in the financial statements. The procedures selected depend on the judgement of the “réviseur d’entreprises agréé”, including the assessment of the risks of material misstatement of the financial statements, whether due to fraud or error. In making those risk assessments, the “réviseur d’entreprises agréé” considers internal control relevant to the entity’s preparation and fair presentation of the financial statements in order to design audit procedures that are appropriate in the circumstances, but not for the purpose of expressing an opinion on the effectiveness of the entity’s internal control. An audit also includes evaluating the appropriateness of accounting policies used and the reasonableness of accounting estimates made by the Board of Directors of the Management Company of the Fund, as well as evaluating the overall presentation of the financial statements. We believe that the audit evidence we have obtained is sufficient and appropriate to provide a basis for our audit opinion.
DNB Fund
Independent Auditor’s Report (continued)
Page 4
Opinion In our opinion, the financial statements give a true and fair view of the financial position of DNB Fund (formerly CARLSON Fund) and of each of its sub-funds as of December 31, 2011, and of the results of their operations and changes in their net assets for the year then ended in accordance with Luxembourg legal and regulatory requirements relating to the preparation and presentation of the financial statements. Other matter Supplementary information included in the annual report has been reviewed in the context of our mandate but has not been subject to specific audit procedures carried out in accordance with the standards described above. Consequently, we express no opinion on such information. However, we have no observation to make concerning such information in the context of the financial statements taken as a whole. ERNST & YOUNG Société Anonyme Cabinet de révision agréé Kerry Jane Nichol Luxembourg, April 19, 2012 Only the English version of the present Annual Report has been reviewed by the auditors. Consequently, the audit report only refers to the English version of the report; other versions result from a conscientious translation made under the responsibility of the Board of Directors of the Fund. In case of difference between the English version and the translation, the English version should be retained.

Information about DNB Fund
Page 5
Managers DNB Fund (the “Fund”) is managed by DNB Asset Management S.A. (the “Management Company”) in Luxembourg. This Management Company has entered into an investment management agreement with DNB Asset Management AB regarding the management of all sub-funds. Managers for the respective sub-funds are specified in the Fund information for each sub-fund. Custodian bank CACEIS Bank Luxembourg S.A. acts as custodian bank for the Fund’s assets. The custodian bank is also responsible for calculating the value of units and for issuing and redeeming units in the sub-funds. Tax regulations for the Fund The Fund has no liability to tax in Luxembourg for capital gains, dividends or interest revenue. Instead, the Fund pays a subscription tax (“taxe d’abonnement”) of 0.05% p.a. on the value of the Fund except in the case of DNB Fund SEK Short Bond and the Institutional Share Class in DNB Fund SEK Long Bond where the subscription tax is 0.01% p.a. In certain instances depending on the country of origin, the Fund pays withholding tax on dividends received. However, Luxembourg does not impose a withholding tax on dividends paid from the Fund to unitholders. Unit value The value of units is calculated each working day as defined in the prospectus and is calculated on the latest available prices for the Fund’s securities. The unit value can be found in selected newspapers as well as on DNB’s website. Dividends The Management Company will decide from time to time if and to what extent dividends should be paid to holders of “B”-Units (distribution unit) of a sub-fund out of the net results of the operations attributable to the “B”-Units of that specific sub-fund. Such dividends will be paid to holders of “B”-Units as soon as practicable after the decision.
The “A” -Units are not entitled to the dividend payments. Charges Please refer to the Statement of the respective sub-fund, at the caption “Statement of Operations” and to the Notes 4 and 5 in the Notes to the Financial Statements. Subscription and redemption of units The issue and redemption of units takes place daily, or otherwise, as provided for in each sub-fund, and if this day is not a business day in Luxembourg or in a market which is the principal market for a significant part (defined as 50 per cent or more) of a sub-fund’s investments, on the immediately following business day which is not a bank holiday in Luxembourg or in a market affecting a Sub-Fund. Purchase of units Subscription orders can be placed through a number of financial institutions in the countries where the Fund is registered for public distribution. The initial subscription must be for a minimum amount equivalent to EUR 1,000.00. No minimum is required for subsequent subscriptions. For any further information, please contact DNB Asset Management S.A. or any of the DNB Asset Management offices. Exchange and redemption of units Unitholders who have instructed DNB Asset Management S.A. to hold their units should apply in writing to DNB Asset Management S.A. with their instructions to exchange and redeem their units. Unitholders who have their units registered with an account other than DNB are recommended to apply to their bank or stockbroker holding their units.
Information about DNB Fund
Page 6
Information DNB Fund issues an audited annual Fund Report and an unaudited semi-annual Fund Report. In addition, the net asset values, performance figures and other useful information can be found on DNB’s website. Official prospectus For further information, please refer to the official prospectus that may be obtained from: DNB Asset Management S.A. 5, Allée Scheffer L - 2520 Luxembourg Grand Duchy of Luxembourg Tel: +352 45 49 45 1 Fax: +352 45 49 45 555 email: [email protected] Or downloaded from: www.dnb.no/lu Socially responsible investments DNB Asset Management S.A. aspires to be a responsible corporate citizen, to have a positive impact on society and to contribute to a sustainable development by focusing on environmental, ethical and social issues. At the core of our asset management business are basic ethical guidelines for all investment activities. Our basic ethical guidelines stipulate that we must be particularly cautious with transactions that may constitute an unacceptable risk of contributing to violations of human rights, labor rights, corruption and the destruction of the environment. The evaluation of companies is based on the following internationally accepted standards: UN Global Compact - which aims to promote global sustainable development; OECD Guidelines for Multinational Companies - which aims to promote ethical responsibility within companies; Ottawa convention - which is a ban against landmines. In addition, we do not invest in companies involved in the production of cluster weapons, weapons of mass destruction or tobacco. Implementation of our basic ethical guidelines includes using our influence as an investor to promote positive action in companies where we see the need for change. Based on available
information, we develop an overall understanding of a company and also consider steps the company takes to rectify any incongruities. If a company shows little desire to implement positive changes, we may exclude the company from our investment universe. Web site www.dnb.no/lu

7The accompanying notes form an integral part of these financial statements
Page
DNB Fund Combined
Assets 1,910,542.04Securities at market value 1,828,827.782Bank accounts 49,651.13Receivable from units issued 8,356.98Receivable from securities sold 812.35Unrealised profit on financial futures 36.83Unrealised profit on forward foreign exchange contracts 640.64Other accounts receivable 22,216.32
Liabilities 19,801.59Bank overdraft 381.72Accrued expenditures 4,695.02Payable on units redeemed 2,427.48Payable on securities purchased 11,999.03Other accounts payable 298.34
Net Asset Value 1,890,740.44
Statement of Net Assets as at 31/12/11
Figures in thousands of EUR
Note
Income 58,407.70Dividends received 17,998.352Bank interest 165.732Interest on securities 40,243.622
Expenditure 33,185.04Management fees 21,494.234Performance fees 3,620.435Interest on equity swaps 1,681.55Taxe d'abonnement 642.813Professional expenses 122.22Transactions fees 5,126.46Other expenses 497.332
Net income from investments 25,222.66Net realised result on sales of investment securities -8,740.012Net realised result on foreign exchange -13,867.862Net realised result on financial futures 513.46Net realised result on forward foreign exchangecontracts
2,405.142
Net realised result on swaps 12,798.90Variation in unrealised result -283,442.88
Securities portfolio -283,081.99Financial futures 26.71Forward foreign exchange contracts -387.60
Decrease in net assets as a result of operations -265,110.59
Statement of Operations from 01/01/11 to 31/12/11
Figures in thousands of EUR
Note
Net asset value at beginning of the year 2,105,316.081Units issued during the year 1,275,536.21Units redeemed during the year -1,238,679.04Dividends distributed -1,773.676Decrease in net assets during the year -265,110.59Reevaluation of opening combined NAV 15,451.46Net asset value at end of the year 1,890,740.44
Statement of Changes in Net Assets from 01/01/11 to 31/12/11
Figures in thousands of EUR
Note
8The accompanying notes form an integral part of these financial statements
Page
DNB Fund - Far East
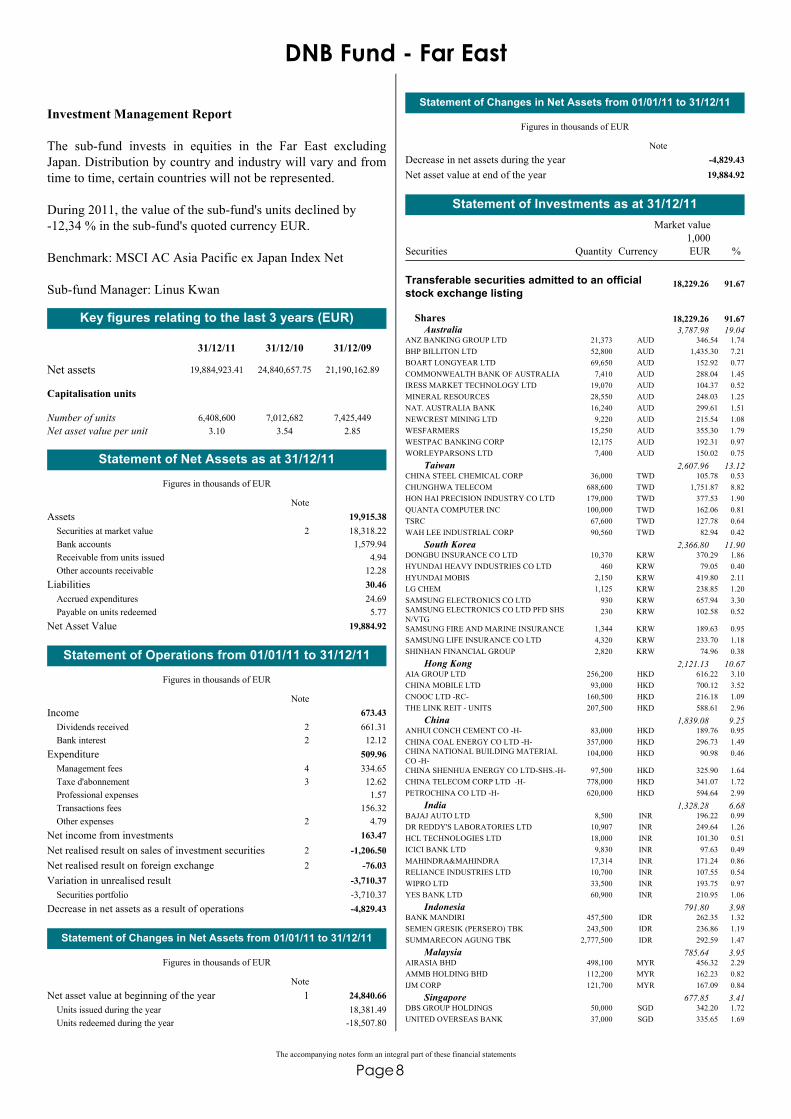
Investment Management Report
The sub-fund invests in equities in the Far East excludingJapan. Distribution by country and industry will vary and fromtime to time, certain countries will not be represented.
During 2011, the value of the sub-fund's units declined by -12,34 % in the sub-fund's quoted currency EUR.
Benchmark: MSCI AC Asia Pacific ex Japan Index Net
Sub-fund Manager: Linus Kwan
Key figures relating to the last 3 years (EUR)
Net assets
31/12/11 31/12/10 31/12/09
19,884,923.41 24,840,657.75 21,190,162.89
Capitalisation units
Number of unitsNet asset value per unit
6,408,6003.10
7,012,6823.54
7,425,4492.85
Assets 19,915.38Securities at market value 18,318.222Bank accounts 1,579.94Receivable from units issued 4.94Other accounts receivable 12.28
Liabilities 30.46Accrued expenditures 24.69Payable on units redeemed 5.77
Net Asset Value 19,884.92
Statement of Net Assets as at 31/12/11
Figures in thousands of EUR
Note
Income 673.43Dividends received 661.312Bank interest 12.122
Expenditure 509.96Management fees 334.654Taxe d'abonnement 12.623Professional expenses 1.57Transactions fees 156.32Other expenses 4.792
Net income from investments 163.47Net realised result on sales of investment securities -1,206.502Net realised result on foreign exchange -76.032Variation in unrealised result -3,710.37
Securities portfolio -3,710.37Decrease in net assets as a result of operations -4,829.43
Statement of Operations from 01/01/11 to 31/12/11
Figures in thousands of EUR
Note
Statement of Changes in Net Assets from 01/01/11 to 31/12/11
Figures in thousands of EUR
Net asset value at beginning of the year 24,840.66118,381.49Units issued during the year
-18,507.80Units redeemed during the year
Note
Statement of Changes in Net Assets from 01/01/11 to 31/12/11
Figures in thousands of EUR
Decrease in net assets during the year -4,829.43Net asset value at end of the year 19,884.92
Note
Currency
Market value
QuantitySecurities %1,000
ANZ BANKING GROUP LTD 21,373 AUD 346.54 1.74
Transferable securities admitted to an officialstock exchange listing
18,229.26 91.67
Shares 18,229.26 91.67Australia 3,787.98 19.04
BHP BILLITON LTD 52,800 AUD 1,435.30 7.21BOART LONGYEAR LTD 69,650 AUD 152.92 0.77COMMONWEALTH BANK OF AUSTRALIA 7,410 AUD 288.04 1.45IRESS MARKET TECHNOLOGY LTD 19,070 AUD 104.37 0.52MINERAL RESOURCES 28,550 AUD 248.03 1.25NAT. AUSTRALIA BANK 16,240 AUD 299.61 1.51NEWCREST MINING LTD 9,220 AUD 215.54 1.08WESFARMERS 15,250 AUD 355.30 1.79WESTPAC BANKING CORP 12,175 AUD 192.31 0.97WORLEYPARSONS LTD 7,400 AUD 150.02 0.75
CHINA STEEL CHEMICAL CORP 36,000 TWD 105.78 0.53Taiwan 2,607.96 13.12
CHUNGHWA TELECOM 688,600 TWD 1,751.87 8.82HON HAI PRECISION INDUSTRY CO LTD 179,000 TWD 377.53 1.90QUANTA COMPUTER INC 100,000 TWD 162.06 0.81TSRC 67,600 TWD 127.78 0.64WAH LEE INDUSTRIAL CORP 90,560 TWD 82.94 0.42
DONGBU INSURANCE CO LTD 10,370 KRW 370.29 1.86South Korea 2,366.80 11.90
HYUNDAI HEAVY INDUSTRIES CO LTD 460 KRW 79.05 0.40HYUNDAI MOBIS 2,150 KRW 419.80 2.11LG CHEM 1,125 KRW 238.85 1.20SAMSUNG ELECTRONICS CO LTD 930 KRW 657.94 3.30SAMSUNG ELECTRONICS CO LTD PFD SHSN/VTG
230 KRW 102.58 0.52
SAMSUNG FIRE AND MARINE INSURANCE 1,344 KRW 189.63 0.95SAMSUNG LIFE INSURANCE CO LTD 4,320 KRW 233.70 1.18SHINHAN FINANCIAL GROUP 2,820 KRW 74.96 0.38
AIA GROUP LTD 256,200 HKD 616.22 3.10Hong Kong 2,121.13 10.67
CHINA MOBILE LTD 93,000 HKD 700.12 3.52CNOOC LTD -RC- 160,500 HKD 216.18 1.09THE LINK REIT - UNITS 207,500 HKD 588.61 2.96
ANHUI CONCH CEMENT CO -H- 83,000 HKD 189.76 0.95China 1,839.08 9.25
CHINA COAL ENERGY CO LTD -H- 357,000 HKD 296.73 1.49CHINA NATIONAL BUILDING MATERIALCO -H-
104,000 HKD 90.98 0.46
CHINA SHENHUA ENERGY CO LTD-SHS.-H- 97,500 HKD 325.90 1.64CHINA TELECOM CORP LTD -H- 778,000 HKD 341.07 1.72PETROCHINA CO LTD -H- 620,000 HKD 594.64 2.99
BAJAJ AUTO LTD 8,500 INR 196.22 0.99India 1,328.28 6.68
DR REDDY'S LABORATORIES LTD 10,907 INR 249.64 1.26HCL TECHNOLOGIES LTD 18,000 INR 101.30 0.51ICICI BANK LTD 9,830 INR 97.63 0.49MAHINDRA&MAHINDRA 17,314 INR 171.24 0.86RELIANCE INDUSTRIES LTD 10,700 INR 107.55 0.54WIPRO LTD 33,500 INR 193.75 0.97YES BANK LTD 60,900 INR 210.95 1.06
BANK MANDIRI 457,500 IDR 262.35 1.32Indonesia 791.80 3.98
SEMEN GRESIK (PERSERO) TBK 243,500 IDR 236.86 1.19SUMMARECON AGUNG TBK 2,777,500 IDR 292.59 1.47
AIRASIA BHD 498,100 MYR 456.32 2.29Malaysia 785.64 3.95
AMMB HOLDING BHD 112,200 MYR 162.23 0.82IJM CORP 121,700 MYR 167.09 0.84
DBS GROUP HOLDINGS 50,000 SGD 342.20 1.72Singapore 677.85 3.41
UNITED OVERSEAS BANK 37,000 SGD 335.65 1.69
Statement of Investments as at 31/12/11
EUR
9The accompanying notes form an integral part of these financial statements
Page
Currency
Market value
QuantitySecurities %1,000
CHEUNG KONG INFRASTRUCTUREHOLDINGS
80,000 HKD 361.03 1.82Bermuda 624.89 3.14
KUNLUN ENERGY 218,000 HKD 239.14 1.20ORIENTAL WATCH HOLDINGS LTD 70,000 HKD 24.72 0.12
GOLDEN AGRI-RESOURCES 1,062,000 SGD 451.11 2.27Mauritius 451.11 2.27
AMATA CORPORATION PUBLIC N-VTG DEPREC.
169,200 THB 52.05 0.26Thailand 427.31 2.15
BANGKOK BANK PUBLIC CO UNITS-NVDR 28,400 THB 106.44 0.54HOME PRODUCT CENTER PCL 142,900 THB 38.38 0.19KASIKORNBANK UNITS NVDR 46,900 THB 139.70 0.70SIAM COMMERC.BK UNITS/NON-VOTINGDEP.REC
31,900 THB 90.74 0.46
BELLE INTERNAIONAL HOLDING 69,000 HKD 92.66 0.47Cayman Islands 419.43 2.11
CHINA RESOURCES CEMENT 182,000 HKD 104.52 0.52ENN ENERGY HOLDINGS LTD 40,000 HKD 98.79 0.50FOOK WOO GROUP HOLDINGS LTD 444,000 HKD 60.33 0.30LEE AND MAN CHEMICAL 136,000 HKD 63.13 0.32
PACIFIC HOSPITAL 45,592 TWD 88.96 0.45
Other transferable securities 88.96 0.45
Shares 88.96 0.45Taiwan 88.96 0.45
Total securities 18,318.22 92.12
Other assets 1,566.70 7.88
Net Asset Value 19,884.92 100.00
EUR
10The accompanying notes form an integral part of these financial statements
Page
DNB Fund - Global SRI
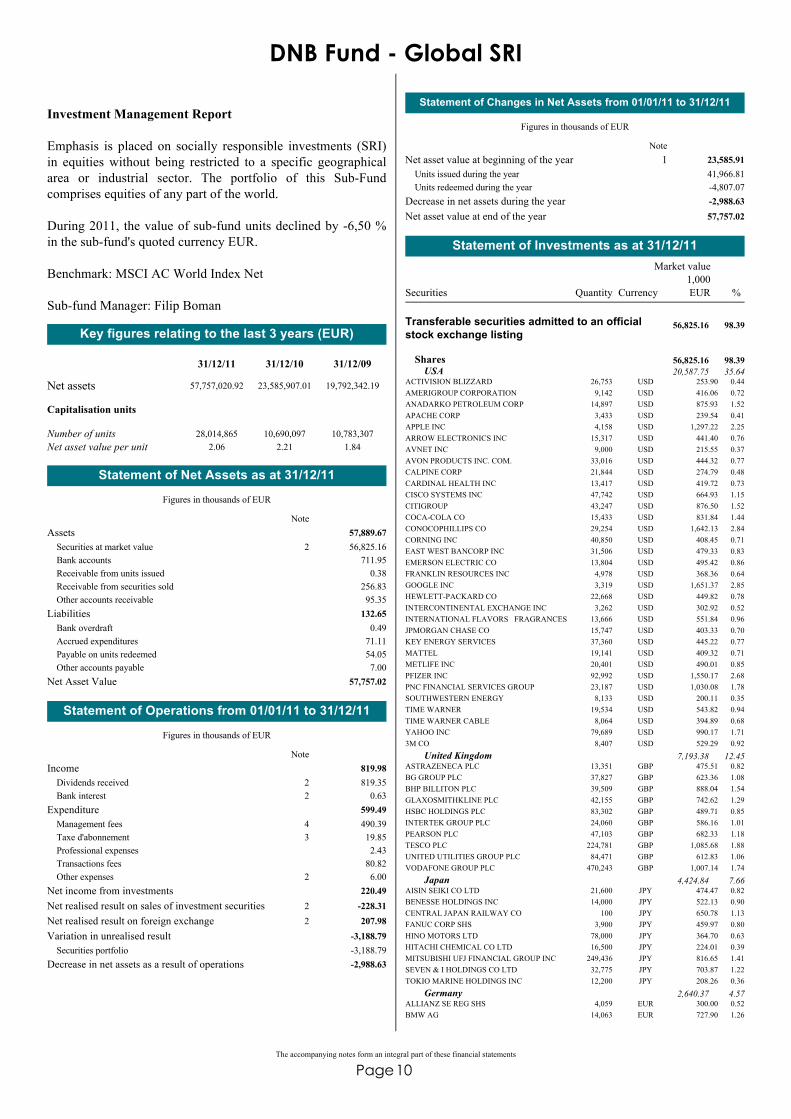
Investment Management Report
Emphasis is placed on socially responsible investments (SRI)in equities without being restricted to a specific geographicalarea or industrial sector. The portfolio of this Sub-Fundcomprises equities of any part of the world. During 2011, the value of sub-fund units declined by -6,50 %in the sub-fund's quoted currency EUR.
Benchmark: MSCI AC World Index Net
Sub-fund Manager: Filip Boman
Key figures relating to the last 3 years (EUR)
Net assets
31/12/11 31/12/10 31/12/09
57,757,020.92 23,585,907.01 19,792,342.19
Capitalisation units
Number of unitsNet asset value per unit
28,014,8652.06
10,690,0972.21
10,783,3071.84
Assets 57,889.67Securities at market value 56,825.162Bank accounts 711.95Receivable from units issued 0.38Receivable from securities sold 256.83Other accounts receivable 95.35
Liabilities 132.65Bank overdraft 0.49Accrued expenditures 71.11Payable on units redeemed 54.05Other accounts payable 7.00
Net Asset Value 57,757.02
Statement of Net Assets as at 31/12/11
Figures in thousands of EUR
Note
Income 819.98Dividends received 819.352Bank interest 0.632
Expenditure 599.49Management fees 490.394Taxe d'abonnement 19.853Professional expenses 2.43Transactions fees 80.82Other expenses 6.002
Net income from investments 220.49Net realised result on sales of investment securities -228.312Net realised result on foreign exchange 207.982Variation in unrealised result -3,188.79
Securities portfolio -3,188.79Decrease in net assets as a result of operations -2,988.63
Statement of Operations from 01/01/11 to 31/12/11
Figures in thousands of EUR
Note
Statement of Changes in Net Assets from 01/01/11 to 31/12/11
Figures in thousands of EUR
Net asset value at beginning of the year 23,585.91141,966.81Units issued during the year-4,807.07Units redeemed during the year
Decrease in net assets during the year -2,988.63Net asset value at end of the year 57,757.02
Note
Currency
Market value
QuantitySecurities %1,000
ACTIVISION BLIZZARD 26,753 USD 253.90 0.44
Transferable securities admitted to an officialstock exchange listing
56,825.16 98.39
Shares 56,825.16 98.39USA 20,587.75 35.64
AMERIGROUP CORPORATION 9,142 USD 416.06 0.72ANADARKO PETROLEUM CORP 14,897 USD 875.93 1.52APACHE CORP 3,433 USD 239.54 0.41APPLE INC 4,158 USD 1,297.22 2.25ARROW ELECTRONICS INC 15,317 USD 441.40 0.76AVNET INC 9,000 USD 215.55 0.37AVON PRODUCTS INC. COM. 33,016 USD 444.32 0.77CALPINE CORP 21,844 USD 274.79 0.48CARDINAL HEALTH INC 13,417 USD 419.72 0.73CISCO SYSTEMS INC 47,742 USD 664.93 1.15CITIGROUP 43,247 USD 876.50 1.52COCA-COLA CO 15,433 USD 831.84 1.44CONOCOPHILLIPS CO 29,254 USD 1,642.13 2.84CORNING INC 40,850 USD 408.45 0.71EAST WEST BANCORP INC 31,506 USD 479.33 0.83EMERSON ELECTRIC CO 13,804 USD 495.42 0.86FRANKLIN RESOURCES INC 4,978 USD 368.36 0.64GOOGLE INC 3,319 USD 1,651.37 2.85HEWLETT-PACKARD CO 22,668 USD 449.82 0.78INTERCONTINENTAL EXCHANGE INC 3,262 USD 302.92 0.52INTERNATIONAL FLAVORS FRAGRANCES 13,666 USD 551.84 0.96JPMORGAN CHASE CO 15,747 USD 403.33 0.70KEY ENERGY SERVICES 37,360 USD 445.22 0.77MATTEL 19,141 USD 409.32 0.71METLIFE INC 20,401 USD 490.01 0.85PFIZER INC 92,992 USD 1,550.17 2.68PNC FINANCIAL SERVICES GROUP 23,187 USD 1,030.08 1.78SOUTHWESTERN ENERGY 8,133 USD 200.11 0.35TIME WARNER 19,534 USD 543.82 0.94TIME WARNER CABLE 8,064 USD 394.89 0.68YAHOO INC 79,689 USD 990.17 1.713M CO 8,407 USD 529.29 0.92
ASTRAZENECA PLC 13,351 GBP 475.51 0.82United Kingdom 7,193.38 12.45
BG GROUP PLC 37,827 GBP 623.36 1.08BHP BILLITON PLC 39,509 GBP 888.04 1.54GLAXOSMITHKLINE PLC 42,155 GBP 742.62 1.29HSBC HOLDINGS PLC 83,302 GBP 489.71 0.85INTERTEK GROUP PLC 24,060 GBP 586.16 1.01PEARSON PLC 47,103 GBP 682.33 1.18TESCO PLC 224,781 GBP 1,085.68 1.88UNITED UTILITIES GROUP PLC 84,471 GBP 612.83 1.06VODAFONE GROUP PLC 470,243 GBP 1,007.14 1.74
AISIN SEIKI CO LTD 21,600 JPY 474.47 0.82Japan 4,424.84 7.66
BENESSE HOLDINGS INC 14,000 JPY 522.13 0.90CENTRAL JAPAN RAILWAY CO 100 JPY 650.78 1.13FANUC CORP SHS 3,900 JPY 459.97 0.80HINO MOTORS LTD 78,000 JPY 364.70 0.63HITACHI CHEMICAL CO LTD 16,500 JPY 224.01 0.39MITSUBISHI UFJ FINANCIAL GROUP INC 249,436 JPY 816.65 1.41SEVEN & I HOLDINGS CO LTD 32,775 JPY 703.87 1.22TOKIO MARINE HOLDINGS INC 12,200 JPY 208.26 0.36
ALLIANZ SE REG SHS 4,059 EUR 300.00 0.52Germany 2,640.37 4.57
BMW AG 14,063 EUR 727.90 1.26
Statement of Investments as at 31/12/11
EUR

11The accompanying notes form an integral part of these financial statements
Page
Currency
Market value
QuantitySecurities %1,000
COMMERZBANK AG 125,314 EUR 163.28 0.28E.ON AG REG SHS 14,207 EUR 236.83 0.41FRESENIUS MEDICAL CARE AG & CO KGAA 8,203 EUR 430.66 0.75SIEMENS AG REG SHS 10,572 EUR 781.70 1.35
HYUNDAI MOBIS 3,125 KRW 610.18 1.06South Korea 2,365.52 4.10
SAMSUNG ELECTRONICS CO LTD 1,993 KRW 1,409.99 2.44SHINSEGAE CO LTD 2,108 KRW 345.35 0.60
INMET MINING CORP 10,639 CAD 527.18 0.91Canada 1,987.71 3.44
ROGERS COMMUNICATIONS -B- 33,422 CAD 992.41 1.72TORONTO DOMINION BANK 8,111 CAD 468.12 0.81
AKZO NOBEL NV 18,604 EUR 695.05 1.20The Netherlands 1,695.96 2.94
UNILEVER NV 37,671 EUR 1,000.91 1.74
CHINA MOBILE LTD 86,000 HKD 647.42 1.13Hong Kong 1,593.25 2.76
HONG KONG LAND HOLDINGS LTD 161,000 USD 563.06 0.97SHANGRI - LA ASIA LTD 288,000 HKD 382.77 0.66
ABB LTD REG SHS 34,721 CHF 505.70 0.88Switzerland 1,551.29 2.69
LONZA GROUP NOM. 7,925 CHF 362.33 0.63TYCO INTERNATIONAL LTD 18,989 USD 683.26 1.18
AXA SA 38,213 EUR 383.85 0.66France 1,312.42 2.27
TOTAL SA 23,508 EUR 928.57 1.61
ENEL SPA 73,043 EUR 229.65 0.40Italy 1,299.84 2.25
PRADA SPA 129,200 HKD 450.43 0.78SARAS RAFFINERIE SARDE SPA 382,976 EUR 370.14 0.64UNICREDIT SPA 38,881 EUR 249.62 0.43
BUNGE LTD 11,655 USD 513.55 0.89Bermuda 1,219.13 2.11
CHINA YURUN FOOD GROUP LTD 261,000 HKD 264.05 0.46RENAISSANCERE HOLDINGS LTD 7,707 USD 441.53 0.76
CTRIP.COM INTL - SHS ADR REPR.1/4THSHS
26,446 USD 476.71 0.83Cayman Islands 1,032.77 1.79
FOCUS MEDIA HOLDING LTD ADR REPR.05SHS
37,037 USD 556.06 0.96
CHINA COMM CONSTRUCTION -H- 578,000 HKD 347.99 0.60China 937.96 1.62
CHINA CONSTRUCTION BANKCORPORATION -H-
1,097,460 HKD 589.97 1.02
ITAUUNIBANCO PFD SHS 11,600 BRL 162.84 0.28Brazil 919.64 1.59
PETROLEO BRASILEIRO PFD ADR.REP 2PFD 16,348 USD 295.82 0.51USIMINAS PREF. -A- 12,900 BRL 54.08 0.09VALE ADR REP 1SH 24,626 USD 406.90 0.71
COVIDIEN PLC 11,600 USD 402.20 0.70Ireland 881.00 1.53
WARNER CHILCOTT 41,081 USD 478.80 0.83
CARNIVAL CORP 24,708 USD 621.24 1.08Panama 621.24 1.08
ARCELORMITTAL SA REG SHS 20,617 EUR 291.32 0.51Luxembourg 575.89 1.00
TENARIS SA - REG.SHS 19,928 EUR 284.57 0.49
AMERICA MOVIL SHS -L- ADR REPR.20 SHS 29,074 USD 506.16 0.88Mexico 506.16 0.88
OPERA SOFTWARE ASA 130,938 NOK 491.82 0.85Norway 491.82 0.85
DBS GROUP HOLDINGS 69,000 SGD 472.23 0.82Singapore 472.23 0.82
AIRASIA BHD 495,100 MYR 453.57 0.79Malaysia 453.57 0.79
NOKIA OYJ 111,985 EUR 422.41 0.73Finland 422.41 0.73
WPP PLC 52,149 GBP 421.72 0.73Jersey Island 421.72 0.73
STANDARD BANK GROUP LIMITED 40,637 ZAR 382.89 0.66South Africa 382.89 0.66
GAZPROM OAO ADR 42,285 USD 347.92 0.60Russia 347.92 0.60
TURKIYE IS BANKASI AS 202,684 TRY 273.64 0.47Turkey 273.64 0.47
SKF AB -B- 13,009 SEK 212.84 0.37Sweden 212.84 0.37
EUR Currency
Market value
QuantitySecurities %1,000
FIRST HORIZON NATIONAL CORP 43,300 USD 0.00 0.00
Other transferable securities 0.00 0.00
Shares 0.00 0.00USA 0.00 0.00
BRADFORD AND BINGLEY PLC 23,319 GBP 0.00 0.00United Kingdom 0.00 0.00
Total securities 56,825.16 98.39
Other assets 931.86 1.61
Net Asset Value 57,757.02 100.00
EUR
12The accompanying notes form an integral part of these financial statements
Page
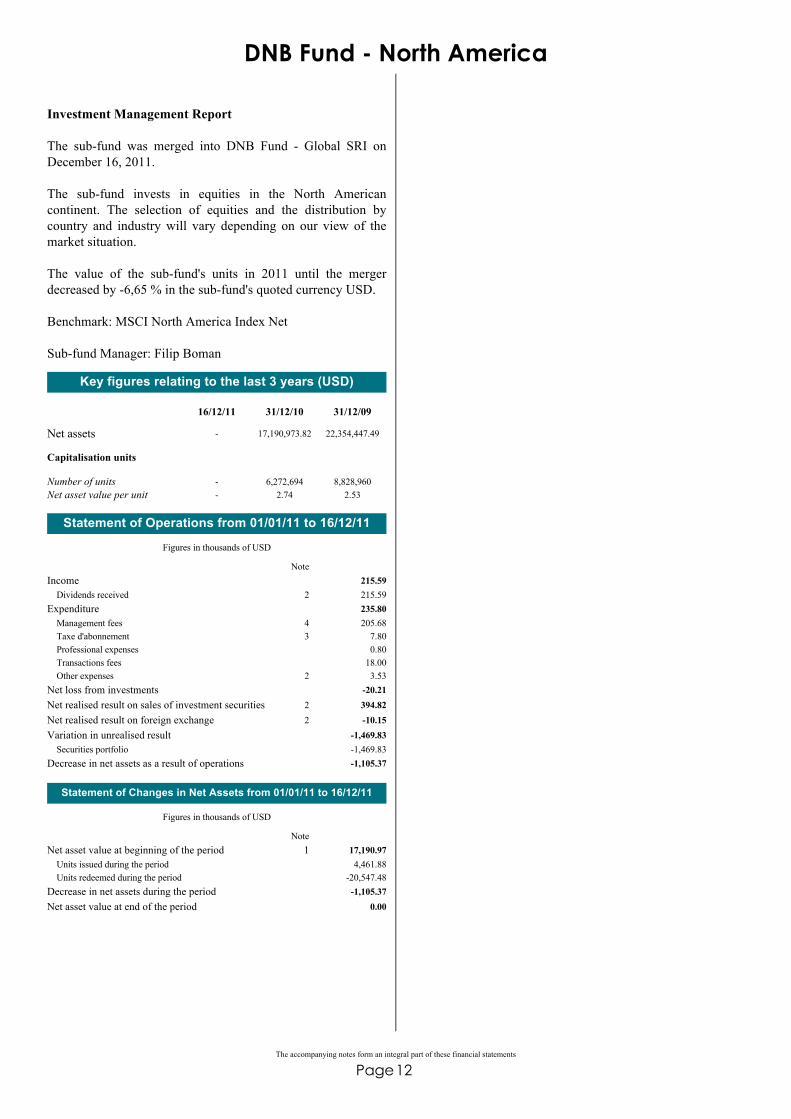
DNB Fund - North America
Investment Management Report
The sub-fund was merged into DNB Fund - Global SRI onDecember 16, 2011.
The sub-fund invests in equities in the North Americancontinent. The selection of equities and the distribution bycountry and industry will vary depending on our view of themarket situation.
The value of the sub-fund's units in 2011 until the mergerdecreased by -6,65 % in the sub-fund's quoted currency USD.
Benchmark: MSCI North America Index Net
Sub-fund Manager: Filip Boman
Key figures relating to the last 3 years (USD)
Net assets
16/12/11 31/12/10 31/12/09
- 17,190,973.82 22,354,447.49
Capitalisation units
Number of unitsNet asset value per unit
--
6,272,6942.74
8,828,9602.53
Income 215.59Dividends received 215.592
Expenditure 235.80Management fees 205.684Taxe d'abonnement 7.803Professional expenses 0.80Transactions fees 18.00Other expenses 3.532
Net loss from investments -20.21Net realised result on sales of investment securities 394.822Net realised result on foreign exchange -10.152Variation in unrealised result -1,469.83
Securities portfolio -1,469.83Decrease in net assets as a result of operations -1,105.37
Statement of Operations from 01/01/11 to 16/12/11
Figures in thousands of USD
Note
Statement of Changes in Net Assets from 01/01/11 to 16/12/11
Figures in thousands of USD
Net asset value at beginning of the period 17,190.9714,461.88Units issued during the period
-20,547.48Units redeemed during the periodDecrease in net assets during the period -1,105.37Net asset value at end of the period 0.00
Note

13The accompanying notes form an integral part of these financial statements
Page
DNB Fund - Asian Small Cap
Investment Management Report
The sub-fund invests in small and medium sized companies inthe Far East, excluding Japan. The sub-fund's investmentstrategy is a pronounced "bottom-up" strategy. This means thatthe sub-fund concentrates on identifying companies thatrepresent good acquisition value irrespective of where thecompany is based. Distribution by country and industry willvary and from time-to-time, certain countries will not berepresented.
During 2011, the value of the sub-fund's units declined by -36,35 % in the sub-fund's quoted currency EUR.
Benchmark: MSCI AC Asia Pacific ex Japan Index Net
Sub-fund Manager: Parameswara Krishnan
Key figures relating to the last 3 years (EUR)
Net assets
31/12/11 31/12/10 31/12/09
217,036,642.71 487,356,444.43 567,096,716.60
Capitalisation units
Number of unitsNet asset value per unit
63,936,8883.39
91,065,7685.35
123,280,9574.60
Assets 221,191.33Securities at market value 201,641.112Bank accounts 19,420.64Receivable from units issued 43.00Other accounts receivable 86.58
Liabilities 4,154.69Accrued expenditures 368.26Payable on units redeemed 339.36Payable on securities purchased 3,447.06
Net Asset Value 217,036.64
Statement of Net Assets as at 31/12/11
Figures in thousands of EUR
Note
Income 4,651.74Dividends received 4,620.562Bank interest 19.352Interest on securities 11.822
Expenditure 7,770.17Management fees 5,405.644Taxe d'abonnement 136.733Professional expenses 16.39Transactions fees 2,142.92Other expenses 68.482
Net loss from investments -3,118.43Net realised result on sales of investment securities 14,235.842Net realised result on foreign exchange -9,873.892Variation in unrealised result -144,515.00
Securities portfolio -144,515.00Decrease in net assets as a result of operations -143,271.49
Statement of Operations from 01/01/11 to 31/12/11
Figures in thousands of EUR
Note
Statement of Changes in Net Assets from 01/01/11 to 31/12/11
Figures in thousands of EUR
Net asset value at beginning of the year 487,356.44139,003.20Units issued during the year
-166,051.52Units redeemed during the yearDecrease in net assets during the year -143,271.49Net asset value at end of the year 217,036.64
Note
Currency
Market value
QuantitySecurities %1,000
ALLSEC TECHNOLOGIES LTD 498,816 INR 86.47 0.04
Transferable securities admitted to an officialstock exchange listing
201,482.41 92.84
Shares 201,482.41 92.84India 84,121.17 38.77
BAJAJ AUTO LTD 225,000 INR 5,194.00 2.39CIPLA LTD 850,000 INR 3,944.33 1.82COROMANDEL INTERNATIONAL LTD 296,000 INR 1,189.14 0.55DR REDDY'S LABORATORIES LTD 350,000 INR 8,011.26 3.69GLODYNE TECHNOSERVE 250,000 INR 867.26 0.40INDIAN BANK 800,000 INR 2,146.27 0.99INDUSIND BANK LTD 2,100,000 INR 6,879.85 3.17INFINITE COMPUTER SOLUTIONS 1,550,000 INR 1,347.91 0.62IPCA LABORATORIES LTD 1,625,000 INR 6,502.29 3.00KOTAK MAHINDRA BANK 900,000 INR 5,620.90 2.59LUPIN LTD 355,000 INR 2,306.22 1.06PETRONET LNG 3,800,000 INR 8,587.98 3.96POLARIS FINANCIAL TECHNOLOGY 1,200,000 INR 2,154.97 0.99PRISM CEMENT LTD 1,850,000 INR 1,004.99 0.46REDINGTON INDIA 4,250,000 INR 5,033.67 2.32SHREE RENUKA SUGARS LTD 13,000,000 INR 4,733.22 2.18STRIDES ARCOLAB LTD 2,050,000 INR 11,928.90 5.51YES BANK LTD 1,900,000 INR 6,581.54 3.03
CHINA MENGNIU DAIRY 3,233,000 HKD 5,823.26 2.68Cayman Islands 50,875.36 23.44
CN HIGH PRECISION AUTOMATION GRP 14,719,000 HKD 3,919.83 1.81COMBA TELECOM SYST 10,786,550 HKD 6,697.33 3.09ENN ENERGY HOLDINGS LTD 3,250,000 HKD 8,026.52 3.69EVA PRECISION INDUSTRIAL HOLDINGSLTD
38,042,000 HKD 7,093.59 3.27
GEELY AUTOMOBILE 27,200,000 HKD 4,586.30 2.11KINGDEE INTL SOFTWARE GROUP CO LTD 10,000,000 HKD 2,072.96 0.96SINO BIOPHARMACEUTICAL 24,900,000 HKD 5,705.00 2.63WUXI PHARMA TECH SPONSORED ADRREPR 8
440,000 USD 3,741.94 1.72
ZHONGSHENG GROUP 2,500,000 HKD 3,208.63 1.48
ANHUI CONCH CEMENT CO -H- 1,874,000 HKD 4,284.35 1.97China 39,891.78 18.38
CHINA LONGYUAN POWER GROUP CORP -H-
4,732,000 HKD 2,848.91 1.31
CHINA SOUTHERN AIRLINES -H- 15,592,000 HKD 6,077.70 2.80CHINA SUNTIEN GREEN ENERGY CORPLTD-H-
16,124,000 HKD 2,174.99 1.00
SHANDONG WEIGAO GRP -H- 9,228,096 HKD 6,397.85 2.95WEICHAI POWER -H- 1,522,000 HKD 5,766.64 2.66XINYI GLASS HOLDINGS LTD 10,252,000 HKD 4,535.11 2.09ZTE CORPORATION -H- 3,232,200 HKD 7,806.23 3.60
CHINA YURUN FOOD GROUP LTD 6,345,000 HKD 6,419.13 2.96Bermuda 20,542.22 9.46
GOME ELECTRICAL APP 27,504,000 HKD 4,910.36 2.26KUNLUN ENERGY 5,028,000 HKD 5,515.63 2.54SKYWORTH DIGITAL HOLDINGS LTD 13,704,000 HKD 3,697.10 1.70
WILMAR INTERNATIONAL LTD 1,175,000 SGD 3,490.27 1.61Singapore 3,490.27 1.61
POLY (HONG KONG)INVESTMENTS LTD 7,521,000 HKD 2,513.91 1.16Hong Kong 2,513.91 1.16
CHINA CDM EXCHANGE 8,300,000 GBP 47.70 0.02Jersey Island 47.70 0.02
Statement of Investments as at 31/12/11
EUR

14The accompanying notes form an integral part of these financial statements
Page
Currency
Market value
QuantitySecurities %1,000
DR REDDY S LABORATOR 9.25 11-1417/03A
2,250,000 INR 158.70 0.07
Money Market Instruments 158.70 0.07
Bonds 158.70 0.07India 158.70 0.07
Total securities 201,641.11 92.91
Other assets 15,395.54 7.09
Net Asset Value 217,036.64 100.00
EUR
15The accompanying notes form an integral part of these financial statements
Page
DNB Fund - Scandinavia
Investment Management Report
The sub-fund invests in equities in Sweden, Finland, Denmarkand Norway. The selection of equities and the distribution bycountry and industry will vary depending on our view of themarket situation.
During 2011, the value of the sub-fund's units declined by -24,75 % in the sub-fund's quoted currency EUR.
Benchmark: VINX Capped SEK Index Net
Sub-fund Managers: Karl G Høgtun and Kjell MortenHjørnevik
Key figures relating to the last 3 years (EUR)
Net assets
31/12/11 31/12/10 31/12/09
78,731,049.66 90,830,796.63 17,455,179.17
Capitalisation units
Number of unitsNet asset value per unit
36,868,8242.14
32,393,7572.80
8,440,8382.07
Assets 79,156.83Securities at market value 77,808.662Bank accounts 1,181.78Receivable from units issued 7.35Receivable from securities sold 129.25Other accounts receivable 29.80
Liabilities 425.78Accrued expenditures 96.04Payable on units redeemed 92.71Payable on securities purchased 214.16Other accounts payable 22.87
Net Asset Value 78,731.05
Statement of Net Assets as at 31/12/11
Figures in thousands of EUR
Note
Income 2,126.58Dividends received 2,120.652Bank interest 5.932
Expenditure 1,412.43Management fees 1,178.364Taxe d'abonnement 46.163Professional expenses 5.86Transactions fees 166.55Other expenses 15.502
Net income from investments 714.15Net realised result on sales of investment securities -4,725.072Net realised result on foreign exchange 885.072Variation in unrealised result -25,324.00
Securities portfolio -25,324.00Decrease in net assets as a result of operations -28,449.84
Statement of Operations from 01/01/11 to 31/12/11
Figures in thousands of EUR
Note
Statement of Changes in Net Assets from 01/01/11 to 31/12/11
Figures in thousands of EUR
Net asset value at beginning of the year 90,830.80155,380.53Units issued during the year
-39,030.45Units redeemed during the yearDecrease in net assets during the year -28,449.84Net asset value at end of the year 78,731.05
Note
Currency
Market value
QuantitySecurities %1,000
ABB REG.SHS 134,290 SEK 1,954.16 2.48
Transferable securities admitted to an officialstock exchange listing
77,808.66 98.83
Shares 77,808.66 98.83Sweden 34,946.37 44.39
ASTRAZENECA 32,240 SEK 1,144.80 1.45ATLAS COPCO AB -A- 115,656 SEK 1,923.43 2.44BIOINVENT 1,032,020 SEK 1,867.07 2.37ELECTROLUX -B- FREE 34,510 SEK 425.40 0.54ENEA 183,854 SEK 599.13 0.76FASTIGHETS BALDER -B 184,326 SEK 524.03 0.67HENNES & MAURITZ AB -B- FREE 164,447 SEK 4,089.34 5.20INVESTMENT AB KINNEVIK -B- 58,719 SEK 884.82 1.12INVESTOR -B- FREE 193,357 SEK 2,789.79 3.54MEDIVIR -B- 66,189 SEK 494.60 0.63NOBIA 196,995 SEK 542.34 0.69NORDEA BANK 600,863 SEK 3,595.34 4.57SANDVIK AB 200,693 SEK 1,904.49 2.42SECURITAS -B- FREE 52,589 SEK 351.02 0.45SKF AB -B- 108,693 SEK 1,778.32 2.26SWEDBANK -A- 59,302 SEK 594.07 0.75TELEFON AB L.M.ERICSSON 274,851 SEK 2,174.29 2.76TELE2 AB 50,392 SEK 758.21 0.96TELIASONERA AB 405,561 SEK 2,131.43 2.71VOLVO -B- FREE 522,409 SEK 4,420.29 5.62
BOUVET SHS 17,098 NOK 154.49 0.20Norway 17,748.21 22.54
DNB 252,907 NOK 1,911.34 2.43EDB ERGOGROUP ASA 171,823 NOK 216.24 0.27MORPOL 438,095 NOK 469.35 0.60NORECO 837,457 NOK 503.73 0.64NORSK HYDRO ASA 336,418 NOK 1,204.58 1.53OPERA SOFTWARE ASA 260,970 NOK 980.24 1.25PETROLEUM GEO-SERVICES ASA 62,928 NOK 531.62 0.68RENEWABLE ENERGY CORPORATION AS 1,251,463 NOK 536.30 0.68ROYAL CARIBBEAN CRUISES 93,501 NOK 1,801.88 2.29SEVAN DRILLING ASA 861,089 NOK 566.85 0.72STATOIL ASA 178,538 NOK 3,537.43 4.48SUBSEA 7 SA 108,162 NOK 1,549.70 1.97TELENOR AS 168,695 NOK 2,136.09 2.71YARA INTERNATIONAL ASA 53,210 NOK 1,648.37 2.09
A.P. MOELLER-MAERSK -A- 344 DKK 1,658.82 2.11Denmark 12,495.99 15.87
CARLSBERG AS -B- 17,063 DKK 929.79 1.18DANSKE BANK 251,376 DKK 2,467.31 3.13FLSMIDTH & CO. SHS 25,949 DKK 1,178.33 1.50NOVO-NORDISK -B- 65,889 DKK 5,851.01 7.42PANDORA 36,381 DKK 264.33 0.34VESTAS WIND SYSTEMS AS 17,550 DKK 146.40 0.19
CARGOTEC -B- 13,393 EUR 307.77 0.39Finland 11,605.52 14.74
FORTUM CORP 92,792 EUR 1,530.14 1.94METSO CORP 52,888 EUR 1,515.24 1.92NOKIA OYJ 825,840 EUR 3,115.08 3.97NOKIAN TYRES PLC 60,152 EUR 1,496.58 1.90SAMPO OYJ -A- 71,463 EUR 1,369.95 1.74STORA ENSO -R- 284,188 EUR 1,315.22 1.67TALVIVAARA MINING 177,273 EUR 441.76 0.56WARTSILA CORPORATION -B- 23,019 EUR 513.78 0.65
LUNDIN MINING CORP SWEDISH SDR 247,377 SEK 723.85 0.92Canada 723.85 0.92
Statement of Investments as at 31/12/11
EUR

16The accompanying notes form an integral part of these financial statements
Page
Currency
Market value
QuantitySecurities %1,000
SONGA OFFSHORE 122,229 NOK 288.72 0.37Cyprus 288.72 0.37
CARNEGIE INVESTMENT 793 SEK 0.00 0.00
Other transferable securities 0.00 0.00
Shares 0.00 0.00Sweden 0.00 0.00
Total securities 77,808.66 98.83
Other assets 922.39 1.17
Net Asset Value 78,731.05 100.00
EUR

17The accompanying notes form an integral part of these financial statements
Page
DNB Fund - Europe
Investment Management Report
The sub-fund was merged into DNB Fund - Global SRI onDecember 16, 2011.
The sub-fund invests in equities throughout Europe. Thebreakdown between countries and industries depends on ouropinion of their market situations.
The value of the sub-fund's units in 2011 until the mergerdecreased by -15,95 % in the sub-fund's quoted currency EUR.
Benchmark: MSCI Europe Index Net
Sub-fund Manager: Einar Johansen
Key figures relating to the last 3 years (EUR)
Net assets
16/12/11 31/12/10 31/12/09
- 10,220,299.09 14,596,769.67
Capitalisation units
Number of unitsNet asset value per unit
--
10,403,5570.98
16,580,9470.88
Income 281.99Dividends received 281.992
Expenditure 130.65Management fees 102.504Taxe d'abonnement 3.433Professional expenses 0.45Transactions fees 22.80Other expenses 1.472
Net income from investments 151.34Net realised result on sales of investment securities -1,498.812Net realised result on foreign exchange 171.672Variation in unrealised result -724.63
Securities portfolio -724.63Decrease in net assets as a result of operations -1,900.43
Statement of Operations from 01/01/11 to 16/12/11
Figures in thousands of EUR
Note
Statement of Changes in Net Assets from 01/01/11 to 16/12/11
Figures in thousands of EUR
Net asset value at beginning of the period 10,220.3012,195.14Units issued during the period
-10,515.01Units redeemed during the periodDecrease in net assets during the period -1,900.43Net asset value at end of the period 0.00
Note

18The accompanying notes form an integral part of these financial statements
Page
DNB Fund - Global Emerging Markets SRI
Investment Management Report
The sub-fund invests in equities in the emerging markets of theworld like the Far East, Latin America and Eastern Europe.The selection of equities and the distribution by country andindustry will vary depending on our view of the marketsituation.
During 2011 the value of the sub-fund units declined by -22,67% in the sub-fund's quoted currency USD.
Benchmark: MSCI Emerging Markets Index Net
Sub-fund Manager: Kalapi Darmeci
The sub-fund was renamed from December 16, 2011. Pleaserefer to Note 1 in the Notes to the Financial Statements.
Key figures relating to the last 3 years (USD)
Net assets
31/12/11 31/12/10 31/12/09
140,080,918.64 179,468,289.44 157,550,717.67
Capitalisation units
Number of unitsNet asset value per unit
61,658,3492.27
61,241,4282.93
61,121,9682.58
Assets 141,398.80Securities at market value 134,730.912Bank accounts 6,548.75Receivable from units issued 1.00Other accounts receivable 118.14
Liabilities 1,317.88Accrued expenditures 232.20Payable on units redeemed 15.77Payable on securities purchased 1,069.92
Net Asset Value 140,080.92
Statement of Net Assets as at 31/12/11
Figures in thousands of USD
Note
Income 3,763.26Dividends received 3,763.262
Expenditure 3,958.02Management fees 2,882.624Interest on equity swaps 139.93Taxe d'abonnement 79.443Professional expenses 9.60Transactions fees 796.60Other expenses 49.822
Net loss from investments -194.76Net realised result on sales of investment securities 4,034.902Net realised result on foreign exchange 209.182Variation in unrealised result -45,086.15
Securities portfolio -45,086.15Decrease in net assets as a result of operations -41,036.82
Statement of Operations from 01/01/11 to 31/12/11
Figures in thousands of USD
Note
Statement of Changes in Net Assets from 01/01/11 to 31/12/11
Figures in thousands of USD
Net asset value at beginning of the year 179,468.29114,581.78Units issued during the year
-12,932.33Units redeemed during the yearDecrease in net assets during the year -41,036.82Net asset value at end of the year 140,080.92
Note
Currency
Market value
QuantitySecurities %1,000
BANCO BRADESCO PREF. 123,520 BRL 2,036.34 1.45
Transferable securities admitted to an officialstock exchange listing
133,565.77 95.34
Shares 133,565.77 95.34Brazil 20,959.57 14.95
BMF BOVESPA 103,440 BRL 543.48 0.39BRF FOODS 62,114 BRL 1,212.82 0.87DIAGNOSTICOS AMERICA 136,901 BRL 1,137.64 0.81GERDAU PREF. 119,348 BRL 927.79 0.66ITAUUNIBANCO PFD SHS 151,000 BRL 2,751.66 1.95JULIO SIMOES LOGISTICA SA 68,744 BRL 344.23 0.25MAGAZINE LUIZA SA 108,002 BRL 552.39 0.39MILLS ESTRUTURAS E SERVICOS DEENGENH SA
96,638 BRL 917.04 0.65
MRV ENGENHARIA PARTICIPACOES SA 165,433 BRL 949.02 0.68OGX PETROLEO E GAS PARTICIPACOES SA 156,772 BRL 1,144.76 0.82PDG REALTY 393,464 BRL 1,244.58 0.89PETROLEO BRASILEIRO 48,748 BRL 601.11 0.43PETROLEO BRASILEIRO -PETROBRAS-PREF.
177,669 BRL 2,046.99 1.46
PETROLEO BRASILEIRO PFD ADR.REP 2PFD 23,813 USD 559.37 0.40RAIA DROGASIL SA 138,940 BRL 966.13 0.69REDECARD SHS 70,456 BRL 1,102.60 0.79VALE ADR REP 1SH 89,586 USD 1,921.62 1.37
DONGBU INSURANCE CO LTD 55,290 KRW 2,562.92 1.83South Korea 18,625.17 13.30
HYUNDAI HEAVY INDUSTRIES CO LTD 5,780 KRW 1,289.46 0.92HYUNDAI MOBIS 8,680 KRW 2,200.14 1.57KIA MOTORS 23,120 KRW 1,338.63 0.96LG CHEM 7,310 KRW 2,014.69 1.44SAMSUNG ELECTRONICS CO LTD 5,500 KRW 5,051.21 3.60SAMSUNG FIRE AND MARINE INSURANCE 10,933 KRW 2,002.49 1.43SAMSUNG LIFE INSURANCE CO LTD 23,743 KRW 1,667.37 1.19SHINHAN FINANCIAL GROUP 14,440 KRW 498.26 0.36
APEX BIOTECHNOLOGY 250,000 TWD 498.70 0.36Taiwan 14,990.82 10.70
CHINA STEEL CHEMICAL CORP 117,000 TWD 446.30 0.32CHUNGHWA TELECOM 1,480,800 TWD 4,890.51 3.48FORMOSA PLASTICS CORP 329,000 TWD 877.94 0.63HON HAI PRECISION INDUSTRY CO LTD 1,094,000 TWD 2,995.23 2.14QUANTA COMPUTER INC 537,000 TWD 1,129.72 0.81TAIWAN SEMICONDUCTORMANUFACTURING CO LT
742,750 TWD 1,859.39 1.33
TSRC 526,900 TWD 1,292.93 0.92WAH LEE INDUSTRIAL CORP 841,165 TWD 1,000.10 0.71
ANGLO AMERICAN PLATINUM LIMITED 9,896 ZAR 652.10 0.47South Africa 11,061.64 7.90
ANGLOGOLD ASHANTI LTD-REG.SHS 29,148 ZAR 1,239.80 0.89FIRSTRAND LTD 448,039 ZAR 1,150.98 0.82GOLD FIELDS 69,177 ZAR 1,067.63 0.76IMPALA PLATINUM HOLDINGS LTD 23,453 ZAR 486.15 0.35KUMBA IRON ORE 3,816 ZAR 236.33 0.17MTN GROUP LTD 135,208 ZAR 2,407.09 1.71NASPERS -N- 28,885 ZAR 1,263.64 0.90SASOL LTD 29,246 ZAR 1,396.48 1.00SPAR GROUP LTD 85,600 ZAR 1,151.35 0.82STANDARD BANK GROUP LIMITED 825 ZAR 10.09 0.01
CHINA CONSTRUCTION BANKCORPORATION -H-
4,776,057 HKD 3,333.02 2.38China 10,817.81 7.72
INDUS.AND COMMERCIAL BANK OF CHINA-H-
4,294,217 HKD 2,548.91 1.82
PETROCHINA CO LTD -H- 2,060,000 HKD 2,564.86 1.83ZTE CORPORATION -H- 756,252 HKD 2,371.02 1.69
Statement of Investments as at 31/12/11
USD

19The accompanying notes form an integral part of these financial statements
Page
Currency
Market value
QuantitySecurities %1,000
BAJAJ AUTO LTD 41,000 INR 1,228.65 0.88India 8,902.19 6.36
DR REDDY'S LABORATORIES LTD 55,485 INR 1,648.67 1.18HCL TECHNOLOGIES LTD 104,000 INR 759.76 0.54ICICI BANK LTD 49,031 INR 632.13 0.45MAHINDRA&MAHINDRA 89,734 INR 1,152.07 0.82RELIANCE INDUSTRIES LTD 57,610 INR 751.73 0.54WIPRO LTD 167,000 INR 1,253.80 0.90YES BANK LTD 328,100 INR 1,475.38 1.05
GAZPROM OAO ADR 132,491 USD 1,415.14 1.01Russia 8,086.31 5.77
LUKOIL HOLDINGS ADR REPR.1 SHS 13,524 USD 719.48 0.51MECHEL OJSC ADR REPR.1 SHS 36,564 USD 310.79 0.22MOBILE TELESYSTEMS ADR REPR.2 SHS 55,473 USD 814.34 0.58NOVATEK GDR REPR 1/100 SHS REG-S 14,888 USD 1,863.97 1.33NOVOLIPETSK STEEL - GDR - REPR SHSREG S
20,569 USD 403.98 0.29
ROSNEFT OIL-GDR- 199,780 USD 1,318.55 0.94SBERBANK ADR 4 SHS 125,006 USD 1,240.06 0.89
ENN ENERGY HOLDINGS LTD 580,000 HKD 1,859.50 1.32Cayman Islands 7,332.51 5.23
GEELY AUTOMOBILE 7,200,000 HKD 1,575.98 1.13KINGDEE INTL SOFTWARE GROUP CO LTD 2,599,200 HKD 699.45 0.50TIANNENG POWER INTERNATIONAL LTD 3,208,000 HKD 1,445.68 1.03YUANDA CHINA HOLDINGS LTD 13,210,000 HKD 1,751.90 1.25
AMERICA MOVIL SHS -L- ADR REPR.20 SHS 124,962 USD 2,824.14 2.02Mexico 6,545.97 4.67
CEMEX ADR REPR 10 CPO 91,114 USD 491.10 0.35COCA COLA FEMSA -L- (KOFL) 49,894 MXN 474.51 0.34GMEXICO -B- 372,356 MXN 973.09 0.69GRUPO BIMBO -SHS- -A- 218,752 MXN 446.27 0.32GRUPO FINANCIERO BANORTE -O- 185,552 MXN 562.69 0.40TLEVISAORD.PART.CERT.REPR.(SHS1A+1L+1D)
183,957 MXN 774.17 0.55
AMMB HOLDING BHD 851,100 MYR 1,597.48 1.14Malaysia 4,508.86 3.22
IJM CORP 988,980 MYR 1,762.69 1.26MALAYAN BANKING BHD 424,400 MYR 1,148.69 0.82
BANK MANDIRI 1,912,000 IDR 1,423.32 1.02Indonesia 4,380.80 3.13
SEMEN GRESIK (PERSERO) TBK 1,129,000 IDR 1,425.65 1.02SUMMARECON AGUNG TBK 11,201,500 IDR 1,531.83 1.09
AMATA CORPORATION PUBLIC N-VTG DEPREC.
920,100 THB 367.46 0.26Thailand 3,864.29 2.76
BANGKOK BANK PUBLIC CO LTD -F- 95,900 THB 498.50 0.36CHAROEN POKPHAND FOODS PUBLICS CO-F-REG
1,349,500 THB 1,411.51 1.00
HOME PRODUCT CENTER PCL 1,080,500 THB 376.72 0.27KASIKORNBANK -F- 129,800 THB 512.21 0.37SIAM COMMERC.BK UNITS/NON-VOTINGDEP.REC
189,000 THB 697.89 0.50
CHINA MOBILE LTD 247,479 HKD 2,418.52 1.73Hong Kong 3,429.16 2.45
CNOOC LTD -RC- 578,000 HKD 1,010.64 0.72
CHINA YURUN FOOD GROUP LTD 641,000 HKD 841.84 0.60Bermuda 2,168.21 1.55
GOME ELECTRICAL APP 5,723,000 HKD 1,326.37 0.95
BANCO SANTANDER -CHILE 7,870,097 CLP 566.79 0.41Chile 2,108.67 1.51
EMPRESA NACIONAL DE ELECTRIC 285,261 CLP 420.69 0.30EMPRESAS CMPC 105,760 CLP 388.27 0.28EMPRESAS COPEC SA 29,737 CLP 397.24 0.28ENERSIS SA 954,822 CLP 335.68 0.24
POLSKI KONCERN NAFTOWY ORLEN SA 41,511 PLN 409.80 0.29Poland 1,808.08 1.29
POLSKIE GORNICTWO NAFTOWE I 418,219 PLN 496.90 0.35POWSZECHNY ZAKLAD UBEZPIECZEN 10,017 PLN 901.38 0.65
BIM BIRLESIK MAGAZALAR 19,400 TRY 539.29 0.38Turkey 1,631.74 1.16
TOFAS TURK OTOMOBIL FABRIKASI AS 175,000 TRY 548.54 0.39TURKIYE IS BANKASI AS 310,340 TRY 543.91 0.39
SOUTHERN COPPER CORP 19,826 USD 598.35 0.43USA 598.35 0.43
KOMERCNI BANKA AS 3,413 CZK 578.53 0.41Czech Republic 578.53 0.41
MOL HUNGARIAN OIL AND GAS PLC -A- 6,074 HUF 434.62 0.31Hungary 434.62 0.31
ORASCOM CONS INDUSTRIE GRD REP 1SHREG-S
7,942 USD 269.24 0.19Egypt 409.65 0.29
ORASCOM TELECOM GDR REPR.5 SH REG-S 48,586 USD 140.41 0.10
BUENAVENTURE SP ADR-SHS- 8,420 USD 322.82 0.23Peru 322.82 0.23
USD Currency
Market value
QuantitySecurities %1,000
X5 RETAIL GROUP GDR REPR 0.25 SHS REG-S
43,860 USD 1,001.76 0.72
Transferable securities dealt in on anotherregulated market
1,001.76 0.72
Shares 1,001.76 0.72The Netherlands 1,001.76 0.72
PACIFIC HOSPITAL 64,496 TWD 163.38 0.12
Other transferable securities 163.38 0.12
Shares 163.38 0.12Taiwan 163.38 0.12
Total securities 134,730.91 96.18
Other assets 5,350.01 3.82
Net Asset Value 140,080.92 100.00
USD

20The accompanying notes form an integral part of these financial statements
Page
DNB Fund - Navigator
Investment Management Report
The sub-fund will mainly invest in the equity of shippingcompanies and companies in the offshore oil-industry, but canalso invest in cruise and oil companies. Geographically thesub-fund will have full flexibility to invest in all such marketsthat are deemed to have the greatest potential at various times.
During 2011, the value of the sub-fund's units declined by -24,55 % in the sub-fund's quoted currency NOK.
Benchmark: 50% OSE101010 / 50% OSE203030
Sub-fund Manager: Rune Kaland
The sub-fund was renamed from November 11, 2011. Pleaserefer to Note 1 in the Notes to the Financial Statements.
Key figures relating to the last 3 years (NOK)
Net assets
31/12/11 31/12/10 31/12/09
120,621,545.16 497,042,618.34 75,398,346.70
Number of unitsNet asset value per unit
Capitalisation units
153,037788.19
477,9461,039.96
92,578814.43
Navigator A
Assets 125,565.57Securities at market value 123,351.452Bank accounts 2,149.78Receivable from units issued 51.62Other accounts receivable 12.72
Liabilities 4,944.03Accrued expenditures 323.35Payable on units redeemed 4,620.67
Net Asset Value 120,621.55
Statement of Net Assets as at 31/12/11
Figures in thousands of NOK
Note
Income 7,060.16Dividends received 7,017.012Bank interest 43.162
Expenditure 5,773.67Management fees 4,450.234Performance fees 135.955Taxe d'abonnement 116.013Professional expenses 17.59Transactions fees 973.11Other expenses 80.772
Net income from investments 1,286.50Net realised result on sales of investment securities 438.442Net realised result on foreign exchange -4,809.972Variation in unrealised result -93,827.05
Securities portfolio -93,827.05
Statement of Operations from 01/01/11 to 31/12/11
Figures in thousands of NOK
Note
Decrease in net assets as a result of operations -96,912.08
Statement of Operations from 01/01/11 to 31/12/11
Figures in thousands of NOK
Note
Statement of Changes in Net Assets from 01/01/11 to 31/12/11
Figures in thousands of NOK
Net asset value at beginning of the year 497,042.621
469,049.18Navigator AUnits issued during the year
-748,558.18Navigator AUnits redeemed during the year
Decrease in net assets during the year -96,912.08Net asset value at end of the year 120,621.55
Note
Currency
Market value
QuantitySecurities %1,000
AGR GROUP -A- 319,096 NOK 4,435.43 3.68
Transferable securities admitted to an officialstock exchange listing
123,276.25 102.20
Shares 123,276.25 102.20Petroleum 70,911.71 58.79
ARCHER REGS 41,800 NOK 672.98 0.56BAKER HUGHES INC 13,896 USD 4,033.75 3.34BW OFFSHORE LTD 390,872 NOK 3,693.74 3.06CAMERON INTERNATIONAL CORP 4,500 USD 1,321.04 1.10DOCKWISE LTD 22,274 NOK 2,143.87 1.78FAIRSTAR HEAVY 169,729 NOK 1,442.70 1.20FRED OLSEN ENERGY 17,210 NOK 3,459.21 2.87HALLIBURTON CO 5,994 USD 1,234.49 1.02NATIONAL OILWELL VARCO INC 7,900 USD 3,205.51 2.66PETROLEUM GEO-SERVICES ASA 93,511 NOK 6,120.29 5.07ROWAN COMPANIES INC 6,877 USD 1,244.79 1.03SCHLUMBERGER LTD 8,525 USD 3,475.39 2.88SEABIRD EXPLORATION LTD 465,963 NOK 107.17 0.09SEADRILL LTD 59,454 NOK 11,890.80 9.85SHAWCOR -A- SUB. VOTING 5,250 CAD 888.64 0.74SIEM OFFSHORE 190,920 NOK 1,584.64 1.31SONGA OFFSHORE 169,932 NOK 3,109.76 2.58SUBSEA 7 SA 104,347 NOK 11,582.52 9.60TGS NOPEC GEOPHYSICAL ASA 32,546 NOK 4,312.35 3.58TRANSOCEAN LTD 4,158 USD 952.64 0.79
ELECTROMAGNETIC GEO 411,403 NOK 5,471.66 4.54Miscellaneous services 26,718.20 22.15
POLARCUS 417,396 NOK 1,168.71 0.97STOLT NIELSEN LTD 100,005 NOK 12,000.61 9.95WILH. WILHELM HOLDINGS ASA -B- 20,521 NOK 2,729.29 2.26WILH WILHELMSEN -A- 39,179 NOK 5,347.93 4.43
DRYSHIPS INC 49,300 USD 588.44 0.49Transportation 15,371.49 12.74
GOLDEN OCEAN GROUP LTD 466,054 NOK 1,757.02 1.46JINHUI SHIPPING AND TRANSPORTATIONLTD
97,443 NOK 872.11 0.72
NORVEGIAN CAR CARRIERS ASA 839,267 NOK 1,510.68 1.25ODFJELL -A- 126,056 NOK 4,538.02 3.76STAR REEFERS 2,513 NOK 183.45 0.15TTS GROUP 50,455 NOK 477.81 0.40WILH WILHEMSE - SHS OPPSTARTSFASE 1 190,348 NOK 5,443.96 4.51
AKER SOLUTIONS 66,311 NOK 4,174.28 3.46Utilities 4,174.28 3.46
KVAERNER 61,529 NOK 599.91 0.50Machine and apparatus construction 1,764.51 1.46
SEVAN DRILLING ASA 228,354 NOK 1,164.60 0.96
NOBLE CORP 8,346 USD 1,505.21 1.25Holding and finance companies 1,505.21 1.25
BERGEN GROUP 145,268 NOK 717.62 0.59Miscellaneous sectors 1,364.80 1.13
PACIFIC DRILLING 12,342 USD 647.18 0.54
Statement of Investments as at 31/12/11
NOK
21The accompanying notes form an integral part of these financial statements
Page
Currency
Market value
QuantitySecurities %1,000
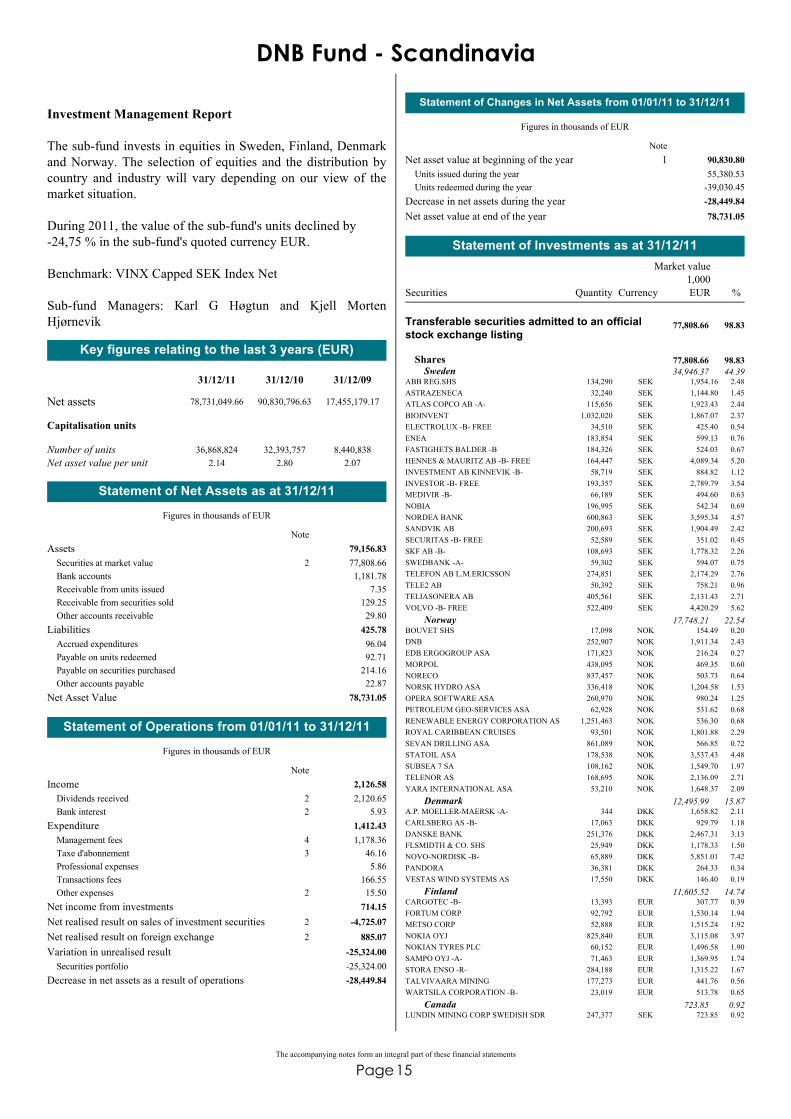
OCEAN RIG UDW INC 15,081 USD 1,098.03 0.91Coal mining and steel industry 1,098.03 0.91
EITZEN CHEMICAL ASA 2,300,138 NOK 368.02 0.31Chemicals 368.02 0.31
SEABIRD EXPLORATION LIMITED 324,000 NOK 74.52 0.06
Other transferable securities 75.20 0.06
Shares 75.20 0.06Petroleum 74.52 0.06
THE CONTAINERSHIP CO 68,198 NOK 0.68 0.00Transportation 0.68 0.00
Total securities 123,351.45 102.26
Other assets -2,729.91 -2.26
Net Asset Value 120,621.55 100.00
NOK

22The accompanying notes form an integral part of these financial statements
Page
DNB Fund - Technology
Investment Management Report
Emphasis is placed on investments in the equities of companiesoperating in or associated with the technology, media andtelecom sectors. Geographically the Sub-Fund has fullflexibility.
During 2011, the value of the sub-fund's units increased by0,15 % in the sub-fund's quoted currency EUR.
Benchmark: Custom TMT (indices: 66% MSCI Technology, 12% MSCI Media, 22% MSCI Telecom)
Sub-fund Managers: Anders Tandberg-Johansen, SverreBergland and Erling Thune
The sub-fund was renamed from November 11, 2011. Pleaserefer to Note 1 in the Notes to the Financial Statements.
Key figures relating to the last 3 years (EUR)
Net assets
31/12/11 31/12/10 31/12/09
6,633,880.88 5,036,695.58 4,116,374.87
Number of unitsNet asset value per unit
Capitalisation units
48,336137.25
36,793136.89
39,055105.40
Technology A
Assets 6,674.61Securities at market value 6,464.072Bank accounts 127.70Receivable from units issued 16.69Receivable from securities sold 54.71Other accounts receivable 11.45
Liabilities 40.73Accrued expenditures 18.54Payable on units redeemed 11.22Other accounts payable 10.97
Net Asset Value 6,633.88
Statement of Net Assets as at 31/12/11
Figures in thousands of EUR
Note
Income 80.69Dividends received 80.692
Expenditure 127.23Management fees 90.004Performance fees 9.175Taxe d'abonnement 3.033Professional expenses 0.36Transactions fees 17.81Other expenses 6.852
Net loss from investments -46.54Net realised result on sales of investment securities 315.282Net realised result on foreign exchange 63.522
Statement of Operations from 01/01/11 to 31/12/11
Figures in thousands of EUR
Note
Variation in unrealised result -418.70Securities portfolio -418.70
Decrease in net assets as a result of operations -86.44
Statement of Operations from 01/01/11 to 31/12/11
Figures in thousands of EUR
Note
Statement of Changes in Net Assets from 01/01/11 to 31/12/11
Figures in thousands of EUR
Net asset value at beginning of the year 5,036.701
4,531.92Technology AUnits issued during the year
-2,848.29Technology AUnits redeemed during the year
Decrease in net assets during the year -86.44Net asset value at end of the year 6,633.88
Note
Currency
Market value
QuantitySecurities %1,000
ACTIVISION BLIZZARD 18,700 USD 177.47 2.68
Transferable securities admitted to an officialstock exchange listing
6,464.07 97.44
Shares 6,464.07 97.44USA 3,324.51 50.12
APPLE INC 1,317 USD 410.88 6.19CISCO SYSTEMS INC 13,585 USD 189.21 2.85DELL INC 22,958 USD 258.73 3.90EMC CORP 8,100 USD 134.40 2.03GOOGLE INC 1,267 USD 630.41 9.51HEWLETT-PACKARD CO 8,001 USD 158.77 2.39LEXMARK INTERNATIONAL INC -A- 5,748 USD 146.43 2.21MICROSOFT CORP 26,228 USD 524.50 7.91NETGEAR INC 3,377 USD 87.33 1.32OCLARO 35,154 USD 76.37 1.15ORACLE CORP 7,500 USD 148.19 2.23RUBICON TECHNOLOGY INC 5,531 USD 40.01 0.60WESTERN DIGITAL CORP 1,300 USD 30.99 0.47YAHOO INC 24,957 USD 310.10 4.67ZYNGA INC 100 USD 0.72 0.01
BOUVET SHS 18,623 NOK 168.27 2.54Norway 666.27 10.04
OPERA SOFTWARE ASA 96,080 NOK 360.88 5.43RENEWABLE ENERGY CORPORATION AS 319,963 NOK 137.12 2.07
HISOFT TECH ADR REPR 19 SHS 41,466 USD 294.83 4.44Cayman Islands 563.36 8.49
ISOFTSTONE HLDG -ADR- REP 10 SHS 10,000 USD 67.40 1.02O2MICRO INTERNATIONAL LTDADR 50REPR
31,100 USD 95.59 1.44
VANCELNFO TECH ADR 1 SH 15,106 USD 105.54 1.59
ALCATEL-LUCENT SA 79,733 EUR 96.24 1.45France 542.62 8.18
GAMELOFT 68,996 EUR 333.94 5.04PARROT SA 391 EUR 6.78 0.10UBISOFT ENTERTAINMENT 20,433 EUR 105.66 1.59
LOGITECH NAMEN AKT 50,285 CHF 303.85 4.58Switzerland 303.85 4.58
BETSON - SHS -B- 5,732 SEK 97.57 1.47Sweden 248.03 3.74
ENEA 21,219 SEK 69.15 1.04TELEFON AB L.M.ERICSSON 10,278 SEK 81.31 1.23
NOKIA OYJ 64,068 EUR 241.66 3.64Finland 241.66 3.64
ADVA OPTICAL NETWORKING 25,088 EUR 90.94 1.38Germany 190.09 2.87
DRILLISCH 4,786 EUR 34.04 0.51WIRECARD AG 5,242 EUR 65.11 0.98
SEAGATE TECHNOLOGY PLC 8,700 USD 109.91 1.66Ireland 109.91 1.66
Statement of Investments as at 31/12/11
EUR
23The accompanying notes form an integral part of these financial statements
Page
Currency
Market value
QuantitySecurities %1,000
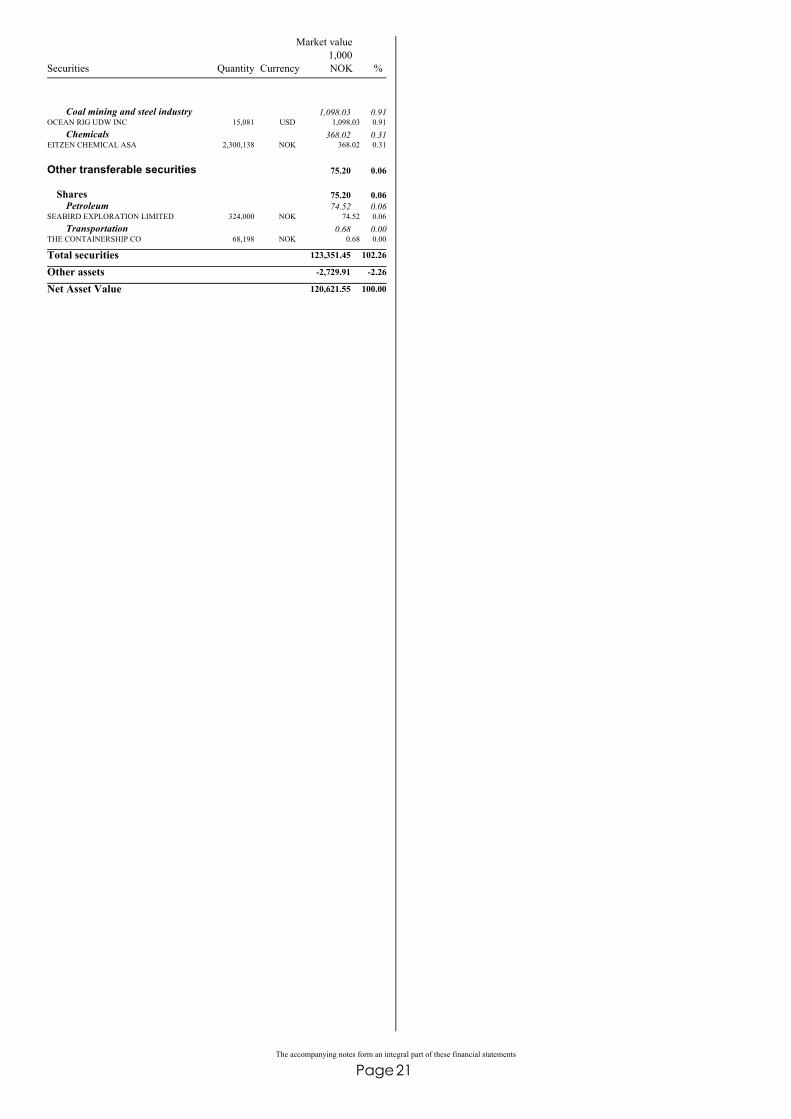
NINTENDO CO LTD 800 JPY 84.90 1.28Japan 84.90 1.28
SIMCORP 710 DKK 83.78 1.26Denmark 83.78 1.26
RESEARCH IN MOTION 6,600 CAD 73.90 1.11Canada 73.90 1.11
TOMTOM NV 10,219 EUR 31.19 0.47The Netherlands 31.19 0.47
Total securities 6,464.07 97.44
Other assets 169.81 2.56
Net Asset Value 6,633.88 100.00
EUR

24The accompanying notes form an integral part of these financial statements
Page
DNB Fund - Renewable Energy
Investment Management Report
Emphasis is placed on investments in the equities of companiesoperating in the renewable energy sector. Geographically theSub-Fund has full flexibility.
During 2011, the value of the sub-fund's units declined by -31,58 % in the sub-fund's quoted currency EUR.
Benchmark: WilderHill New Energy Global Innovation Index
Sub-fund Managers: Jon Sigurdsen and Christian Rom
The sub-fund was renamed from November 11, 2011. Pleaserefer to Note 1 in the Notes to the Financial Statements.
Key figures relating to the last 3 years (EUR)
Net assets
31/12/11 31/12/10 31/12/09
45,317,322.42 38,391,020.50 40,568,804.63
Number of unitsNet asset value per unit
Capitalisation units
698,10764.91
404,73394.86
463,38187.55
Renewable Energy A
Assets 47,540.20Securities at market value 44,902.172Bank accounts 2,605.46Receivable from units issued 21.60Other accounts receivable 10.98
Liabilities 2,222.88Accrued expenditures 1,455.86Payable on units redeemed 584.30Payable on securities purchased 182.71
Net Asset Value 45,317.32
Statement of Net Assets as at 31/12/11
Figures in thousands of EUR
Note
Income 384.62Dividends received 312.372Bank interest 4.902Interest on securities 67.362
Expenditure 2,246.02Management fees 677.904Performance fees 1,389.875Taxe d'abonnement 23.043Professional expenses 2.69Transactions fees 139.93Other expenses 12.592
Net loss from investments -1,861.40Net realised result on sales of investment securities -5,191.612Net realised result on foreign exchange -264.112Variation in unrealised result -10,140.25
Securities portfolio -10,140.25Decrease in net assets as a result of operations -17,457.35
Statement of Operations from 01/01/11 to 31/12/11
Figures in thousands of EUR
Note
Statement of Changes in Net Assets from 01/01/11 to 31/12/11
Figures in thousands of EUR
Net asset value at beginning of the year 38,391.021
42,575.36Renewable Energy AUnits issued during the year
-18,191.71Renewable Energy AUnits redeemed during the year
Decrease in net assets during the year -17,457.35Net asset value at end of the year 45,317.32
Note
Currency
Market value
QuantitySecurities %1,000
ALLEGHENY TECHNOLOGIES INC 26,300 USD 968.41 2.14
Transferable securities admitted to an officialstock exchange listing
44,902.17 99.08
Shares 44,902.17 99.08USA 19,983.63 44.10
AMERYS 68,818 USD 611.76 1.35CODEXIS 37,332 USD 152.42 0.34DARLING INTERNATIONAL INC 64,555 USD 660.89 1.46ENERNOC INC 140,253 USD 1,174.40 2.59ENERSYS 20,700 USD 414.11 0.91EXIDE TECHNOLOGIES 468,272 USD 948.70 2.09FUEL SYSTEMS SOLUTIONS 98,311 USD 1,248.81 2.76FUEL TECH 182,165 USD 923.35 2.04FUELCELL ENERGY 1,220,304 USD 819.71 1.81GENERAL CABLE CORPORATION 92,900 USD 1,789.80 3.95GEVO 35,000 USD 169.59 0.37GREEN PLAINS RENEWABLE ENERGY 276,581 USD 2,079.44 4.60ITRON INC 22,700 USD 625.49 1.38JOHNSON CONTROLS INC 72,300 USD 1,741.01 3.84MEMC ELECTRONIC MATERIALS 569,462 USD 1,728.37 3.81REGAL BELOIT 26,100 USD 1,024.78 2.26SOLAZYME INC 112,367 USD 1,030.06 2.27STR HOLDINGS 213,728 USD 1,354.99 2.99VEECO INSTRUMENTS 32,300 USD 517.54 1.14
ABENGOA SA 104,142 EUR 1,707.93 3.77Spain 6,067.90 13.39
ACCIONA SA 27,615 EUR 1,842.75 4.07EDP RENOVAVEIS SA 532,407 EUR 2,517.22 5.55
CHINA SUNTIEN GREEN ENERGY CORPLTD-H-
13,426,000 HKD 1,811.06 4.00China 3,432.35 7.57
HUANENG RENEWABLES CORPORATIONLTD-H-
7,696,000 HKD 1,465.58 3.23
XINYI GLASS HOLDINGS LTD 352,000 HKD 155.71 0.34
CHINA METAL RECYCLING HOLDINGS 1,984,800 HKD 1,653.64 3.65Cayman Islands 3,034.13 6.70
TIANNENG POWER INTERNATIONAL LTD 3,976,678 HKD 1,380.49 3.05
NEXANS SA 24,102 EUR 966.49 2.13France 2,318.29 5.12
SCHNEIDER ELECTRIC SA 33,230 EUR 1,351.80 2.99
GLOBAL & YUASA 28,610 KRW 840.81 1.86South Korea 2,299.65 5.07
LG INDUSTRIAL SYSTEMS LTD 13,385 KRW 595.20 1.31LS CABLE 16,994 KRW 863.64 1.90
PRYSMIAN SPA 158,266 EUR 1,518.56 3.35Italy 1,518.56 3.35
VERBUND AG 68,662 EUR 1,423.71 3.14Austria 1,423.71 3.14
ADVANCED METALLURGICAL GROUP NV 172,598 EUR 1,311.74 2.89The Netherlands 1,311.74 2.89
FORTUM CORP 68,426 EUR 1,128.34 2.49Finland 1,128.34 2.49
PRAJ INDUSTRIES LTD 651,152 INR 708.41 1.56India 708.41 1.56
INFIGEN ENERGY - TRIPLE STAPLEDSECURITY
1,801,390 AUD 384.12 0.85Australia 384.12 0.85
HORIBA 7,300 JPY 169.56 0.38Japan 334.28 0.74
NGK INSULATORS LTD 18,000 JPY 164.72 0.36
Statement of Investments as at 31/12/11
EUR

25The accompanying notes form an integral part of these financial statements
Page
Currency
Market value
QuantitySecurities %1,000
PURSUIT DYNAMICS PLC 69,942 GBP 56.10 0.12United Kingdom 293.72 0.65
SIG 236,292 GBP 237.62 0.53
WASION GROUP SHS 1,188,000 HKD 271.01 0.60Hong Kong 271.01 0.60
CHINA WINDPOWER 8,220,000 HKD 236.44 0.52Bermuda 236.44 0.52
BORALEX INC -A- 28,900 CAD 155.89 0.34Canada 155.89 0.34
Total securities 44,902.17 99.08
Other assets 415.15 0.92
Net Asset Value 45,317.32 100.00
EUR

26The accompanying notes form an integral part of these financial statements
Page
DNB Fund - Private Equity
Investment Management Report
The sub-fund will mainly invest in the global private equitysector through exposure in listed equities of companies whichthemselves invest in the private equity sector. Derivatives(including in particular options and futures contracts) on theabove mentioned listed equities might also be used, on anancillary basis, in order to obtain exposure to the private equitysector. Geographically the sub-fund has full flexibility.
During 2011, the value of the sub-fund's units declined by -16,85 % in the sub-fund's quoted currency EUR.
Benchmark: MSCI World
Sub-fund Manager: Per-Erling Mikkelsen
The sub-fund was renamed from November 11, 2011. Pleaserefer to Note 1 in the Notes to the Financial Statements.
Key figures relating to the last 3 years (EUR)
Net assets
31/12/11 31/12/10 31/12/09
11,885,417.72 17,256,622.55 4,971,629.25
Number of unitsNet asset value per unitDividend per unit
Distribution units
201,63558.95
-
242,89171.05
-
99,46849.98
-
Private Equity B
Assets 11,963.09Securities at market value 11,659.292Bank accounts 223.47Receivable from units issued 6.00Other accounts receivable 74.32
Liabilities 77.67Accrued expenditures 20.03Payable on units redeemed 35.64Other accounts payable 22.00
Net Asset Value 11,885.42
Statement of Net Assets as at 31/12/11
Figures in thousands of EUR
Note
Income 466.57Dividends received 466.572
Expenditure 332.72Management fees 300.484Taxe d'abonnement 8.213Professional expenses 1.04Transactions fees 20.53Other expenses 2.462
Net income from investments 133.85Net realised result on sales of investment securities -24.872Net realised result on foreign exchange 185.252
Statement of Operations from 01/01/11 to 31/12/11
Figures in thousands of EUR
Note
Variation in unrealised result -4,036.43Securities portfolio -4,036.43
Decrease in net assets as a result of operations -3,742.20
Statement of Operations from 01/01/11 to 31/12/11
Figures in thousands of EUR
Note
Statement of Changes in Net Assets from 01/01/11 to 31/12/11
Figures in thousands of EUR
Net asset value at beginning of the year 17,256.621
10,336.97Private Equity BUnits issued during the year
-11,965.98Private Equity BUnits redeemed during the year
Decrease in net assets during the year -3,742.20Net asset value at end of the year 11,885.42
Note
Currency
Market value
QuantitySecurities %1,000
AMERICAN CAPITAL STRATEGIES 98,416 USD 510.22 4.29
Transferable securities admitted to an officialstock exchange listing
11,659.29 98.10
Shares 10,205.19 85.87USA 3,675.37 30.93
APOLLO INVESTMENT 70,691 USD 350.69 2.95ARES CAPITAL CORP 47,734 USD 568.11 4.79BLACKSTONE GROUP PARTNERSHIP UNITS 52,353 USD 565.01 4.75GLADSTONE CAPITAL CORP 20,201 USD 118.73 1.00HERCULES TECHNOLOGY GROWTHCAPITAL INC
27,739 USD 201.71 1.70
KKR PARTNERSHIP UNITS 67,266 USD 664.81 5.60MCG CAPITAL CORP 36,917 USD 113.47 0.95MVC CAPITAL INC 18,888 USD 168.63 1.42SAFEGUARD SCIENTIFICS INC 15,658 USD 190.46 1.60TICC CAPITAL 33,547 USD 223.53 1.88
ICG 114,108 GBP 312.56 2.63United Kingdom 1,534.87 12.91
IP GROUP 411,563 GBP 385.55 3.243I GROUP PLC 386,163 GBP 836.76 7.04
EURAZEO SA 20,891 EUR 574.40 4.83France 1,329.38 11.19
WENDEL SA 14,660 EUR 754.98 6.36
HBM BIO VENTURES NAM.AKT 4,833 CHF 159.06 1.34Switzerland 941.90 7.92
PARTNERS GROUP HLDG NAMEN AKT 5,798 CHF 782.84 6.58
RATOS AB -B- FREE 76,885 SEK 697.64 5.87Sweden 697.64 5.87
ONEX CORP SUB.VOTING 21,612 CAD 542.49 4.56Canada 542.49 4.56
JAFCO CO LTD 20,900 JPY 295.67 2.49Japan 491.16 4.13
JAPAN ASIA INVESTMENT CO LTD 375,490 JPY 195.49 1.64
GIMV SA 8,443 EUR 311.38 2.62Belgium 311.38 2.62
DEA CAPITAL SPA 123,205 EUR 163.86 1.38Italy 163.86 1.38
DEUTSCHE BETEILIGUNGS 8,207 EUR 127.87 1.08Germany 127.87 1.08
CHINA MERCHANTS CHINA DIRECT 109,711 HKD 103.38 0.87Hong Kong 103.38 0.87
CAPMAN -SHS-B- 101,110 EUR 102.12 0.86Finland 102.12 0.86
DINAMIA 24,007 EUR 94.83 0.80Spain 94.83 0.80
K1 VENTURES LTD 1,969,879 SGD 88.94 0.75Singapore 88.94 0.75
Statement of Investments as at 31/12/11
EUR
27The accompanying notes form an integral part of these financial statements
Page
Currency
Market value
QuantitySecurities %1,000
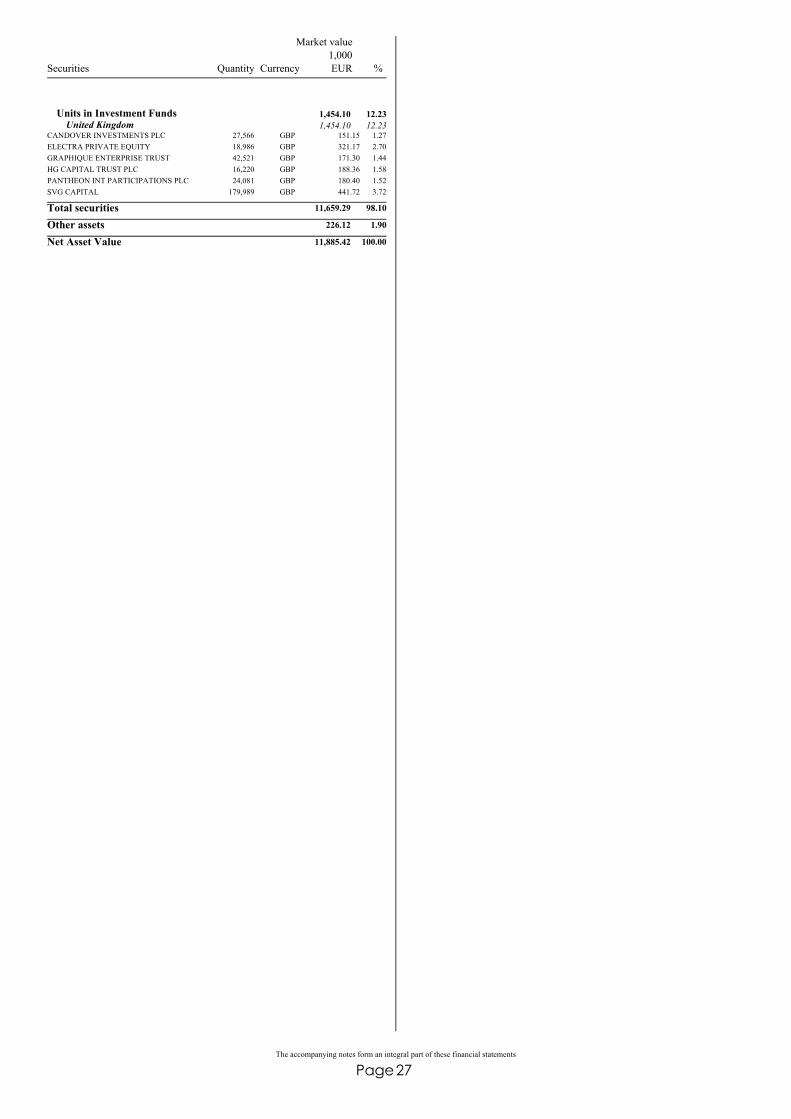
CANDOVER INVESTMENTS PLC 27,566 GBP 151.15 1.27
Units in Investment Funds 1,454.10 12.23United Kingdom 1,454.10 12.23
ELECTRA PRIVATE EQUITY 18,986 GBP 321.17 2.70GRAPHIQUE ENTERPRISE TRUST 42,521 GBP 171.30 1.44HG CAPITAL TRUST PLC 16,220 GBP 188.36 1.58PANTHEON INT PARTICIPATIONS PLC 24,081 GBP 180.40 1.52SVG CAPITAL 179,989 GBP 441.72 3.72
Total securities 11,659.29 98.10
Other assets 226.12 1.90
Net Asset Value 11,885.42 100.00
EUR

28The accompanying notes form an integral part of these financial statements
Page
DNB Fund - BRIC
Investment Management Report
Emphasis is placed on investments in the stock markets of anyor all of what has been labelled the BRIC-countries; Brazil,Russia, India and China.
During 2011, the value of the sub-fund's units declined by -25,98 % in the sub-fund's quoted currency EUR.
Benchmark: MSCI Daily TR Net Emerging Markets BRIC
Sub-fund Manager: Kalapi Darmeci
Key figures relating to the last 3 years (EUR)
Net assets
31/12/11 31/12/10 31/12/09
7,587,538.02 9,597,029.54 8,301,951.35
Capitalisation units
Number of unitsNet asset value per unit
101,02975.10
94,417101.65
95,94386.53
Assets 8,654.93Securities at market value 7,411.492Bank accounts 841.96Receivable from units issued 4.35Receivable from securities sold 189.70Other accounts receivable 207.42
Liabilities 1,067.39Accrued expenditures 10.89Payable on units redeemed 25.26Payable on securities purchased 831.25Other accounts payable 200.00
Net Asset Value 7,587.54
Statement of Net Assets as at 31/12/11
Figures in thousands of EUR
Note
Income 159.79Dividends received 159.792
Expenditure 168.75Management fees 113.844Performance fees 1.315Taxe d'abonnement 3.723Professional expenses 0.43Transactions fees 39.41Other expenses 10.042
Net loss from investments -8.95Net realised result on sales of investment securities -376.492Net realised result on foreign exchange -44.072Variation in unrealised result -1,909.13
Securities portfolio -1,909.13Decrease in net assets as a result of operations -2,338.65
Statement of Operations from 01/01/11 to 31/12/11
Figures in thousands of EUR
Note
Statement of Changes in Net Assets from 01/01/11 to 31/12/11
Figures in thousands of EUR
Net asset value at beginning of the year 9,597.0313,544.46Units issued during the year
-3,215.30Units redeemed during the yearDecrease in net assets during the year -2,338.65Net asset value at end of the year 7,587.54
Note
Currency
Market value
QuantitySecurities %1,000
AMBEV PREF SHS 2,559 BRL 71.13 0.94
Transferable securities admitted to an officialstock exchange listing
7,297.48 96.18
Shares 7,297.48 96.18Brazil 2,419.08 31.89
BANCO BRADESCO PREF. 15,901 BRL 201.94 2.66BMF BOVESPA 13,642 BRL 55.21 0.73BRAZIL PHARMA SA 30,000 BRL 105.31 1.39BRF FOODS 9,482 BRL 142.62 1.88CETIP 1,695 BRL 18.87 0.25DIAGNOSTICOS AMERICA 11,575 BRL 74.10 0.98GERDAU PREF. 10,191 BRL 61.03 0.80ITAUUNIBANCO PFD SHS 23,903 BRL 335.53 4.43LOJAS RENNER 3,696 BRL 73.89 0.97MAGAZINE LUIZA SA 6,112 BRL 24.08 0.32MILLS ESTRUTURAS E SERVICOS DEENGENH SA
14,267 BRL 104.29 1.37
MRV ENGENHARIA PARTICIPACOES SA 15,300 BRL 67.61 0.89OGX PETROLEO E GAS PARTICIPACOES SA 16,971 BRL 95.46 1.26PDG REALTY 34,203 BRL 83.34 1.10PETROLEO BRASILEIRO 17,733 BRL 168.44 2.22PETROLEO BRASILEIRO -PETROBRAS-PREF.
22,061 BRL 195.80 2.58
PETROLEO BRASILEIRO PFD ADR.REP 2PFD 1,151 USD 20.83 0.27RAIA DROGASIL SA 11,433 BRL 61.24 0.81REDECARD SHS 10,503 BRL 126.62 1.67TELEF BRASIL PFD SHS 1,982 BRL 42.48 0.56VALE DO RIO DOCE 6,513 BRL 106.11 1.40VALE DO RIO DOCE PREF -A- 11,726 BRL 183.15 2.41
ANHUI CONCH CEMENT CO -H- 50,500 HKD 115.45 1.52China 1,521.56 20.06
CHINA BLUECHEMICAL SHS.H- 202,000 HKD 117.81 1.55CHINA COAL ENERGY CO LTD -H- 138,000 HKD 114.70 1.51CHINA CONSTRUCTION BANKCORPORATION -H-
421,960 HKD 226.85 2.99
CHINA LIFE INSURANCE CO LTD 49,000 HKD 93.31 1.23CHINA LONGYUAN POWER GROUP CORP -H-
200,000 HKD 120.41 1.59
CHINA PETROLEUM AND CHEMICAL -H- 132,000 HKD 106.96 1.41CHINA SUNTIEN GREEN ENERGY CORPLTD-H-
606,000 HKD 81.74 1.08
CHINA TELECOM CORP LTD -H- 150,000 HKD 65.76 0.87INDUS.AND COMMERCIAL BANK OF CHINA-H-
410,120 HKD 187.52 2.47
PETROCHINA CO LTD -H- 174,000 HKD 166.89 2.20ZTE CORPORATION -H- 51,408 HKD 124.16 1.64
AMBUJA CEMENTS -SHS- 26,951 INR 60.73 0.80India 1,024.44 13.50
BAJAJ AUTO LTD 1,900 INR 43.86 0.58COROMANDEL INTERNATIONAL LTD 15,000 INR 60.26 0.79DR REDDY'S LABORATORIES LTD 3,000 INR 68.67 0.91HINDUSTAN UNILEVER 10,800 INR 63.82 0.84ICICI BANK LTD 8,500 INR 84.43 1.11INDUSIND BANK LTD 21,700 INR 71.09 0.94INFOSYS LTD 1,800 INR 72.26 0.95IPCA LABORATORIES LTD 17,000 INR 68.02 0.90MAHINDRA&MAHINDRA 3,600 INR 35.60 0.47PETRONET LNG 24,500 INR 55.37 0.73PTC INDIA LTD 40,000 INR 22.54 0.30RELIANCE INDS.GDR REPR.2 SHS -144A-REGS
2,216 USD 45.41 0.60
RELIANCE INDUSTRIES LTD 5,200 INR 52.27 0.69STRIDES ARCOLAB LTD 19,332 INR 112.50 1.47TATA CONSULTANCY SERVICES LTD 3,300 INR 55.56 0.73WIPRO LTD 9,000 INR 52.05 0.69
Statement of Investments as at 31/12/11
EUR

29The accompanying notes form an integral part of these financial statements
Page
Currency
Market value
QuantitySecurities %1,000
GAZPROM OAO ADR 28,699 USD 236.14 3.12Russia 877.96 11.57
LUKOIL HOLDINGS ADR REPR.1 SHS 2,499 USD 102.41 1.35MECHEL OJSC ADR REPR.1 SHS 4,047 USD 26.50 0.35MOBILE TELESYSTEMS ADR REPR.2 SHS 10,966 USD 124.01 1.63NOVATEK GDR REPR 1/100 SHS REG-S 1,463 USD 141.10 1.86NOVOLIPETSK STEEL - GDR - REPR SHSREG S
1,967 USD 29.76 0.39
ROSNEFT OIL-GDR- 19,299 USD 98.12 1.29SBERBANK ADR 4 SHS 8,941 USD 68.32 0.90SBERBANK ADR 4 SHS 6,835 EUR 51.60 0.68
ENN ENERGY HOLDINGS LTD 44,000 HKD 108.67 1.43Cayman Islands 838.00 11.04
GEELY AUTOMOBILE 700,000 HKD 118.03 1.56KINGDEE INTL SOFTWARE GROUP CO LTD 136,000 HKD 28.19 0.37SILVER BASE 252,000 HKD 157.47 2.08TENCENT HOLDINGS LTD 9,300 HKD 143.99 1.90TIANNENG POWER INTERNATIONAL LTD 304,000 HKD 105.53 1.39YUANDA CHINA HOLDINGS LTD 1,724,000 HKD 176.12 2.31
CHINA MOBILE LTD 45,500 HKD 342.53 4.51Hong Kong 469.14 6.18
CNOOC LTD -RC- 94,000 HKD 126.61 1.67
GOME ELECTRICAL APP 607,000 HKD 108.37 1.43Bermuda 108.37 1.43
YANDEX N.V. 2,565 USD 38.93 0.51The Netherlands 38.93 0.51
MAGNIT GDR 3,836 USD 62.53 0.82
Transferable securities dealt in on anotherregulated market
114.01 1.50
Shares 114.01 1.50Russia 62.53 0.82
X5 RETAIL GROUP GDR REPR 0.25 SHS REG-S
2,926 USD 51.48 0.68The Netherlands 51.48 0.68
Total securities 7,411.49 97.68
Other assets 176.05 2.32
Net Asset Value 7,587.54 100.00
EUR
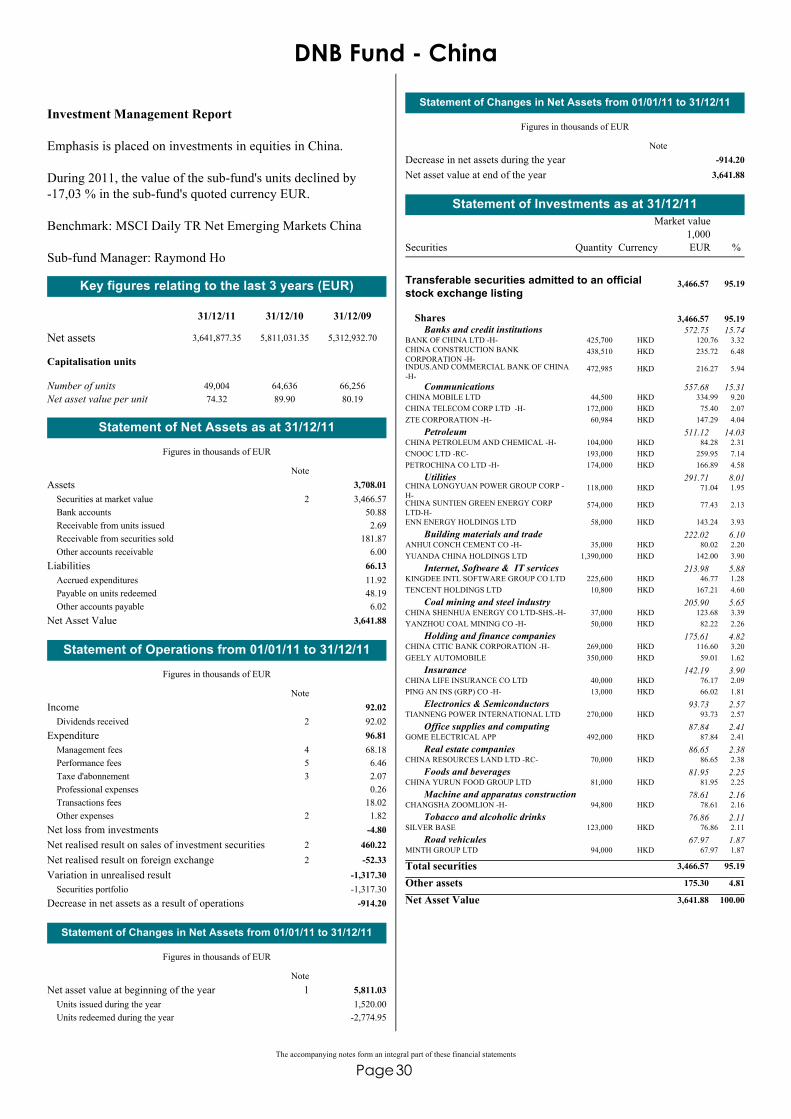
30The accompanying notes form an integral part of these financial statements
Page
DNB Fund - China
Investment Management Report
Emphasis is placed on investments in equities in China.
During 2011, the value of the sub-fund's units declined by -17,03 % in the sub-fund's quoted currency EUR.
Benchmark: MSCI Daily TR Net Emerging Markets China
Sub-fund Manager: Raymond Ho
Key figures relating to the last 3 years (EUR)
Net assets
31/12/11 31/12/10 31/12/09
3,641,877.35 5,811,031.35 5,312,932.70
Capitalisation units
Number of unitsNet asset value per unit
49,00474.32
64,63689.90
66,25680.19
Assets 3,708.01Securities at market value 3,466.572Bank accounts 50.88Receivable from units issued 2.69Receivable from securities sold 181.87Other accounts receivable 6.00
Liabilities 66.13Accrued expenditures 11.92Payable on units redeemed 48.19Other accounts payable 6.02
Net Asset Value 3,641.88
Statement of Net Assets as at 31/12/11
Figures in thousands of EUR
Note
Income 92.02Dividends received 92.022
Expenditure 96.81Management fees 68.184Performance fees 6.465Taxe d'abonnement 2.073Professional expenses 0.26Transactions fees 18.02Other expenses 1.822
Net loss from investments -4.80Net realised result on sales of investment securities 460.222Net realised result on foreign exchange -52.332Variation in unrealised result -1,317.30
Securities portfolio -1,317.30Decrease in net assets as a result of operations -914.20
Statement of Operations from 01/01/11 to 31/12/11
Figures in thousands of EUR
Note
Statement of Changes in Net Assets from 01/01/11 to 31/12/11
Figures in thousands of EUR
Net asset value at beginning of the year 5,811.0311,520.00Units issued during the year
-2,774.95Units redeemed during the year
Note
Statement of Changes in Net Assets from 01/01/11 to 31/12/11
Figures in thousands of EUR
Decrease in net assets during the year -914.20Net asset value at end of the year 3,641.88
Note
Currency
Market value
QuantitySecurities %1,000
BANK OF CHINA LTD -H- 425,700 HKD 120.76 3.32
Transferable securities admitted to an officialstock exchange listing
3,466.57 95.19
Shares 3,466.57 95.19Banks and credit institutions 572.75 15.74
CHINA CONSTRUCTION BANKCORPORATION -H-
438,510 HKD 235.72 6.48
INDUS.AND COMMERCIAL BANK OF CHINA-H-
472,985 HKD 216.27 5.94
CHINA MOBILE LTD 44,500 HKD 334.99 9.20Communications 557.68 15.31
CHINA TELECOM CORP LTD -H- 172,000 HKD 75.40 2.07ZTE CORPORATION -H- 60,984 HKD 147.29 4.04
CHINA PETROLEUM AND CHEMICAL -H- 104,000 HKD 84.28 2.31Petroleum 511.12 14.03
CNOOC LTD -RC- 193,000 HKD 259.95 7.14PETROCHINA CO LTD -H- 174,000 HKD 166.89 4.58
CHINA LONGYUAN POWER GROUP CORP -H-
118,000 HKD 71.04 1.95Utilities 291.71 8.01
CHINA SUNTIEN GREEN ENERGY CORPLTD-H-
574,000 HKD 77.43 2.13
ENN ENERGY HOLDINGS LTD 58,000 HKD 143.24 3.93
ANHUI CONCH CEMENT CO -H- 35,000 HKD 80.02 2.20Building materials and trade 222.02 6.10
YUANDA CHINA HOLDINGS LTD 1,390,000 HKD 142.00 3.90
KINGDEE INTL SOFTWARE GROUP CO LTD 225,600 HKD 46.77 1.28Internet, Software & IT services 213.98 5.88
TENCENT HOLDINGS LTD 10,800 HKD 167.21 4.60
CHINA SHENHUA ENERGY CO LTD-SHS.-H- 37,000 HKD 123.68 3.39Coal mining and steel industry 205.90 5.65
YANZHOU COAL MINING CO -H- 50,000 HKD 82.22 2.26
CHINA CITIC BANK CORPORATION -H- 269,000 HKD 116.60 3.20Holding and finance companies 175.61 4.82
GEELY AUTOMOBILE 350,000 HKD 59.01 1.62
CHINA LIFE INSURANCE CO LTD 40,000 HKD 76.17 2.09Insurance 142.19 3.90
PING AN INS (GRP) CO -H- 13,000 HKD 66.02 1.81
TIANNENG POWER INTERNATIONAL LTD 270,000 HKD 93.73 2.57Electronics & Semiconductors 93.73 2.57
GOME ELECTRICAL APP 492,000 HKD 87.84 2.41Office supplies and computing 87.84 2.41
CHINA RESOURCES LAND LTD -RC- 70,000 HKD 86.65 2.38Real estate companies 86.65 2.38
CHINA YURUN FOOD GROUP LTD 81,000 HKD 81.95 2.25Foods and beverages 81.95 2.25
CHANGSHA ZOOMLION -H- 94,800 HKD 78.61 2.16Machine and apparatus construction 78.61 2.16
SILVER BASE 123,000 HKD 76.86 2.11Tobacco and alcoholic drinks 76.86 2.11
MINTH GROUP LTD 94,000 HKD 67.97 1.87Road vehicules 67.97 1.87
Total securities 3,466.57 95.19
Other assets 175.30 4.81
Net Asset Value 3,641.88 100.00
Statement of Investments as at 31/12/11
EUR

31The accompanying notes form an integral part of these financial statements
Page
DNB Fund - China Century
Investment Management Report
Emphasis is placed on investments in small and midcapitalization companies in China, and especially in listedequities or equity-related securities (such as convertible bonds,global depositary receipts and participatory notes).
During 2011, the value of the sub-fund's units declined by -36,02 % in the sub-fund's quoted currency EUR.
Benchmark: MSCI Daily TR Net Emerging Markets China
Sub-fund Manager: Davina Tang
Key figures relating to the last 3 years (EUR)
Net assets
31/12/11 31/12/10 31/12/09
14,231,708.03 52,950,136.02 105,035,852.43
Capitalisation units
Number of unitsNet asset value per unit
218,51465.13
517,995102.22
1,183,09088.78
Assets 14,376.50Securities at market value 13,755.962Bank accounts 580.02Receivable from units issued 20.42Other accounts receivable 20.09
Liabilities 144.79Accrued expenditures 36.72Payable on units redeemed 108.07
Net Asset Value 14,231.71
Statement of Net Assets as at 31/12/11
Figures in thousands of EUR
Note
Income 571.28Dividends received 570.712Bank interest 0.572
Expenditure 847.75Management fees 470.284Performance fees 15.005Taxe d'abonnement 12.513Professional expenses 1.54Transactions fees 336.29Other expenses 12.142
Net loss from investments -276.48Net realised result on sales of investment securities 3,114.922Net realised result on foreign exchange -1,854.132Variation in unrealised result -14,931.83
Securities portfolio -14,931.83Decrease in net assets as a result of operations -13,947.52
Statement of Operations from 01/01/11 to 31/12/11
Figures in thousands of EUR
Note
Statement of Changes in Net Assets from 01/01/11 to 31/12/11
Figures in thousands of EUR
Net asset value at beginning of the year 52,950.14118,090.69Units issued during the year
-42,861.60Units redeemed during the yearDecrease in net assets during the year -13,947.52Net asset value at end of the year 14,231.71
Note
Currency
Market value
QuantitySecurities %1,000
CHINA CDM EXCHANGE 200,000 GBP 1.15 0.01
Transferable securities admitted to an officialstock exchange listing
13,755.96 96.66
Shares 13,209.11 92.82Holding and finance companies 2,296.08 16.12
CREDIT CHINA HOLDINGS 11,432,000 HKD 918.43 6.44DAPHNE INTERNATIONAL HOLDINGS LTD 796,000 HKD 682.93 4.80THE LINK REIT - UNITS 244,500 HKD 693.57 4.87
CHANGSHA ZOOMLION -H- 859,000 HKD 712.28 5.01Machine and apparatus construction 1,574.08 11.06
EVA PRECISION INDUSTRIAL HOLDINGSLTD
3,362,000 HKD 626.90 4.40
INTERNATIONAL MINING MACHINERYHOLDINGS
277,000 HKD 234.90 1.65
AJISEN (CHINA) HOLDINGS LTD 615,000 HKD 521.53 3.66Foods and beverages 1,288.03 9.05
CHINA YURUN FOOD GROUP LTD 395,000 HKD 399.62 2.81DAQING DAIRY HOLDINGS LTD 2,551,000 HKD 366.88 2.58
CN ALL ACCESS 3,330,000 HKD 544.97 3.83Internet, Software & IT services 1,100.52 7.73
KINGDEE INTL SOFTWARE GROUP CO LTD 2,680,000 HKD 555.55 3.90
CHINA COMM CONSTRUCTION -H- 453,000 HKD 272.73 1.92Transportation 954.95 6.71
JIANGSU EXPRESSWAY CO LTD -H- 962,000 HKD 682.22 4.79
AV CONCEPT HOLDINGS LIMITED 7,282,000 HKD 505.59 3.55Electronics & Semiconductors 942.00 6.62
TC INTERCONNECT 2,500,000 HKD 436.41 3.07
COMBA TELECOM SYST 1,168,203 HKD 725.34 5.10Communications 810.85 5.70
TAI SHING INTL 4,514,000 HKD 85.51 0.60
ORIENTAL WATCH HOLDINGS LTD 2,122,800 HKD 749.56 5.27Retail trade, department stores 749.56 5.27
ASIAN CITRUS HLDGS 1,361,000 HKD 552.11 3.88Agriculture and fishery 552.11 3.88
FOCUS MEDIA HOLDING LTD ADR REPR.05SHS
36,400 USD 546.50 3.84Graphic art and publishing 546.50 3.84
CHINA LONGYUAN POWER GROUP CORP -H-
864,000 HKD 520.17 3.66Utilities 520.17 3.66
JIANGXI COPPER -H- 251,000 HKD 417.74 2.94Non-ferrous metals 417.74 2.94
BANK OF CHINA LTD -H- 1,353,000 HKD 383.80 2.70Banks and credit institutions 383.80 2.70
CHINA VANKE CO LTD -B 500,000 HKD 380.87 2.68Real estate companies 380.87 2.68
GOME ELECTRICAL APP 2,032,000 HKD 362.78 2.55Office supplies and computing 362.78 2.55
CN TAIPING INSURANCE HOLDINGS CO 230,400 HKD 329.07 2.31Insurance 329.07 2.31
MERRILL LYNCH (GANSU) 10.08.15 WAR 222,000 USD 246.96 1.74
Options, warrants, rights 546.85 3.84Holding and finance companies 546.85 3.84
MERRILL LYNCH (TANGSHAN) 10.08.15WAR
147,000 USD 299.89 2.10
Total securities 13,755.96 96.66
Other assets 475.74 3.34
Net Asset Value 14,231.71 100.00
Statement of Investments as at 31/12/11
EUR
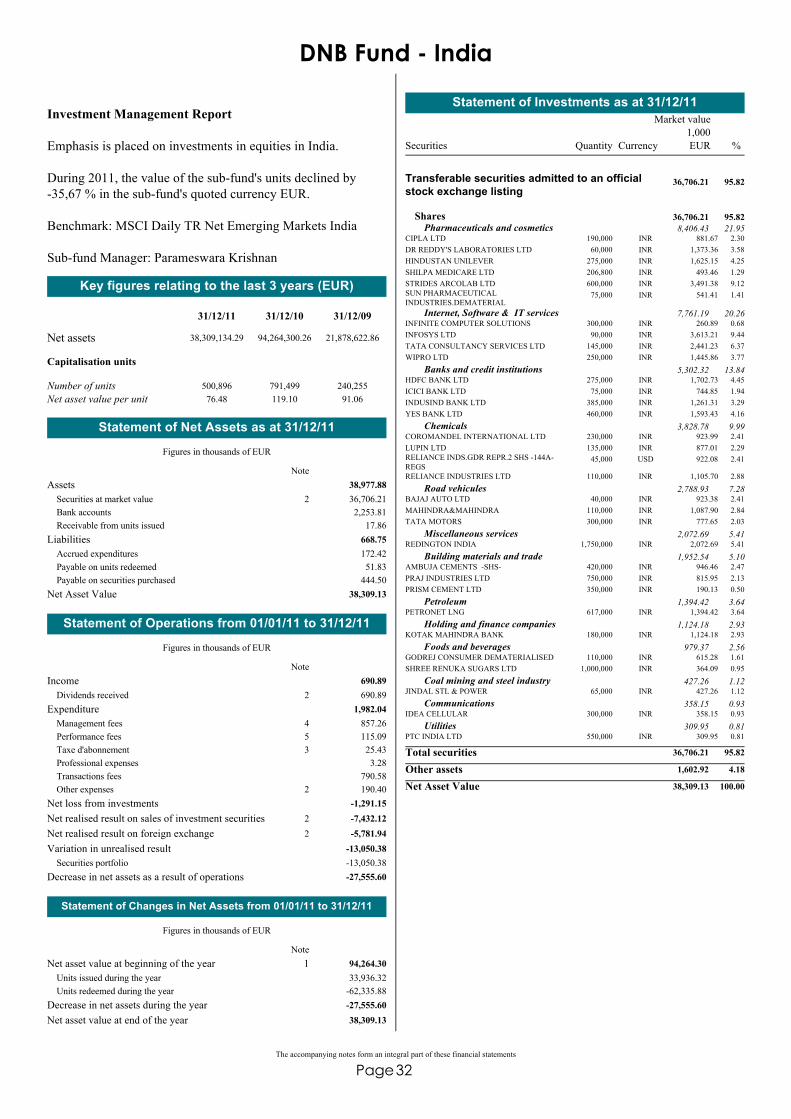
32The accompanying notes form an integral part of these financial statements
Page
DNB Fund - India
Investment Management Report
Emphasis is placed on investments in equities in India.
During 2011, the value of the sub-fund's units declined by -35,67 % in the sub-fund's quoted currency EUR.
Benchmark: MSCI Daily TR Net Emerging Markets India
Sub-fund Manager: Parameswara Krishnan
Key figures relating to the last 3 years (EUR)
Net assets
31/12/11 31/12/10 31/12/09
38,309,134.29 94,264,300.26 21,878,622.86
Capitalisation units
Number of unitsNet asset value per unit
500,89676.48
791,499119.10
240,25591.06
Assets 38,977.88Securities at market value 36,706.212Bank accounts 2,253.81Receivable from units issued 17.86
Liabilities 668.75Accrued expenditures 172.42Payable on units redeemed 51.83Payable on securities purchased 444.50
Net Asset Value 38,309.13
Statement of Net Assets as at 31/12/11
Figures in thousands of EUR
Note
Income 690.89Dividends received 690.892
Expenditure 1,982.04Management fees 857.264Performance fees 115.095Taxe d'abonnement 25.433Professional expenses 3.28Transactions fees 790.58Other expenses 190.402
Net loss from investments -1,291.15Net realised result on sales of investment securities -7,432.122Net realised result on foreign exchange -5,781.942Variation in unrealised result -13,050.38
Securities portfolio -13,050.38Decrease in net assets as a result of operations -27,555.60
Statement of Operations from 01/01/11 to 31/12/11
Figures in thousands of EUR
Note
Statement of Changes in Net Assets from 01/01/11 to 31/12/11
Figures in thousands of EUR
Net asset value at beginning of the year 94,264.30133,936.32Units issued during the year
-62,335.88Units redeemed during the yearDecrease in net assets during the year -27,555.60Net asset value at end of the year 38,309.13
Note
Currency
Market value
QuantitySecurities %1,000
CIPLA LTD 190,000 INR 881.67 2.30
Transferable securities admitted to an officialstock exchange listing
36,706.21 95.82
Shares 36,706.21 95.82Pharmaceuticals and cosmetics 8,406.43 21.95
DR REDDY'S LABORATORIES LTD 60,000 INR 1,373.36 3.58HINDUSTAN UNILEVER 275,000 INR 1,625.15 4.25SHILPA MEDICARE LTD 206,800 INR 493.46 1.29STRIDES ARCOLAB LTD 600,000 INR 3,491.38 9.12SUN PHARMACEUTICALINDUSTRIES.DEMATERIAL
75,000 INR 541.41 1.41
INFINITE COMPUTER SOLUTIONS 300,000 INR 260.89 0.68Internet, Software & IT services 7,761.19 20.26
INFOSYS LTD 90,000 INR 3,613.21 9.44TATA CONSULTANCY SERVICES LTD 145,000 INR 2,441.23 6.37WIPRO LTD 250,000 INR 1,445.86 3.77
HDFC BANK LTD 275,000 INR 1,702.73 4.45Banks and credit institutions 5,302.32 13.84
ICICI BANK LTD 75,000 INR 744.85 1.94INDUSIND BANK LTD 385,000 INR 1,261.31 3.29YES BANK LTD 460,000 INR 1,593.43 4.16
COROMANDEL INTERNATIONAL LTD 230,000 INR 923.99 2.41Chemicals 3,828.78 9.99
LUPIN LTD 135,000 INR 877.01 2.29RELIANCE INDS.GDR REPR.2 SHS -144A-REGS
45,000 USD 922.08 2.41
RELIANCE INDUSTRIES LTD 110,000 INR 1,105.70 2.88
BAJAJ AUTO LTD 40,000 INR 923.38 2.41Road vehicules 2,788.93 7.28
MAHINDRA&MAHINDRA 110,000 INR 1,087.90 2.84TATA MOTORS 300,000 INR 777.65 2.03
REDINGTON INDIA 1,750,000 INR 2,072.69 5.41Miscellaneous services 2,072.69 5.41
AMBUJA CEMENTS -SHS- 420,000 INR 946.46 2.47Building materials and trade 1,952.54 5.10
PRAJ INDUSTRIES LTD 750,000 INR 815.95 2.13PRISM CEMENT LTD 350,000 INR 190.13 0.50
PETRONET LNG 617,000 INR 1,394.42 3.64Petroleum 1,394.42 3.64
KOTAK MAHINDRA BANK 180,000 INR 1,124.18 2.93Holding and finance companies 1,124.18 2.93
GODREJ CONSUMER DEMATERIALISED 110,000 INR 615.28 1.61Foods and beverages 979.37 2.56
SHREE RENUKA SUGARS LTD 1,000,000 INR 364.09 0.95
JINDAL STL & POWER 65,000 INR 427.26 1.12Coal mining and steel industry 427.26 1.12
IDEA CELLULAR 300,000 INR 358.15 0.93Communications 358.15 0.93
PTC INDIA LTD 550,000 INR 309.95 0.81Utilities 309.95 0.81
Total securities 36,706.21 95.82
Other assets 1,602.92 4.18
Net Asset Value 38,309.13 100.00
Statement of Investments as at 31/12/11
EUR

33The accompanying notes form an integral part of these financial statements
Page
DNB Fund - Global Value & Momentum
Investment Management Report
The sub-fund invests globally, and seeks to generate long-termcapital gains by screening the universe for companies that arecheaply priced relative to book value (i.e. “value” stocks) andcompanies that have experienced positive momentum in theirshare price over a period of time. The sub-fund then invests inthe shares that most convincingly exhibit the value andmomentum characteristics.
During 2011, the value of the sub-fund's units declined by -21,32 % in the sub-fund's quoted currency USD.
Benchmark: MSCI World Index Net
Sub-fund Manager: Espen Lundstrøm
The sub-fund was renamed from November 11, 2011. Pleaserefer to Note 1 in the Notes to the Financial Statements.
Key figures relating to the last 3 years (USD)
Net assets
31/12/11 31/12/10 31/12/09
117,137,445.93 205,676,807.85 91,659,695.35
Capitalisation units
Number of unitsNet asset value per unit
925,504126.57
1,281,791160.46
665,839137.66
Assets 117,805.96Securities at market value 114,749.832Bank accounts 2,900.03Receivable from units issued 15.15Unrealised profit on financial futures 47.66Other accounts receivable 93.29
Liabilities 668.52Bank overdraft 493.27Accrued expenditures 175.25
Net Asset Value 117,137.45
Statement of Net Assets as at 31/12/11
Figures in thousands of USD
Note
Income 3,958.41Dividends received 3,958.072Interest on securities 0.352
Expenditure 3,468.97Management fees 2,828.094Taxe d'abonnement 87.013Professional expenses 11.53Transactions fees 505.25Other expenses 37.092
Net income from investments 489.44Net realised result on sales of investment securities -1,327.062Net realised result on foreign exchange 4,662.602Net realised result on financial futures 664.37Variation in unrealised result -41,863.32
Statement of Operations from 01/01/11 to 31/12/11
Figures in thousands of USD
Note
Securities portfolio -41,897.88Financial futures 34.56
Decrease in net assets as a result of operations -37,373.98
Statement of Operations from 01/01/11 to 31/12/11
Figures in thousands of USD
Note
Statement of Changes in Net Assets from 01/01/11 to 31/12/11
Figures in thousands of USD
Net asset value at beginning of the year 205,676.81185,073.13Units issued during the year
-136,238.52Units redeemed during the yearDecrease in net assets during the year -37,373.98Net asset value at end of the year 117,137.45
Note
Currency
Market value
QuantitySecurities %1,000
ABERCROMBIE AND FITCH -A- 5,100 USD 249.08 0.21
Transferable securities admitted to an officialstock exchange listing
114,167.17 97.47
Shares 114,167.17 97.47USA 32,097.77 27.39
AETNA INC 4,100 USD 172.98 0.15ALCOA INC 29,400 USD 254.31 0.22ALEXION PHARMACEUTICALS 6,000 USD 429.00 0.37ALPHA NATURAL RESOURCES INC 14,200 USD 290.11 0.25ALTERA CORP 10,700 USD 396.97 0.34AMAZON.COM INC 1,400 USD 242.34 0.21AMERCIAN WATER WORKS CO INC 5,500 USD 175.23 0.15AMERICAN NATIONAL INSURANCE CO 2,698 USD 197.03 0.17ANADARKO PETROLEUM CORP 5,100 USD 389.28 0.33APPLE INC 800 USD 324.00 0.28ASSURANT INC 8,300 USD 340.80 0.29AUTOZONE INC 872 USD 283.37 0.24BANK OF AMERICA CORP 44,022 USD 244.76 0.21BANK OF NEW YORK MELLON CORP 17,500 USD 348.43 0.30BED BATH AND BEYOND INC 5,500 USD 318.84 0.27BIOGEN IDEC INC 4,000 USD 440.20 0.38BLACKROCK INC 2,000 USD 356.48 0.30BORG WARNER 5,757 USD 366.95 0.31BRISTOL-MYERS SQUIBB CO 5,100 USD 179.72 0.15BROWN-FORMAN CORP -B- NON VOTING 2,100 USD 169.07 0.14CABOT OIL AND GAS CORP -A- 5,500 USD 417.45 0.36CAPITAL ONE FINANCIAL CORP 8,167 USD 345.38 0.29CBS -B- 14,300 USD 388.10 0.33CELANESE CORP-A- 7,400 USD 327.60 0.28CENTERPOINT ENERGY 8,600 USD 172.77 0.15CERNER CORP 2,800 USD 171.50 0.15CF INDUSTRIES HOLDINGS INC 2,600 USD 376.95 0.32CHIPOTLE MEXICAN GRILL -A- 1,200 USD 405.29 0.35CHIQUITA BRANDS INTERNATIONAL INC 20,300 USD 169.30 0.14CHURCH AND DWIGHT 3,900 USD 178.46 0.15CIT GROUP 10,607 USD 369.87 0.32CITIGROUP 12,601 USD 331.53 0.28CITIZENS REPUBLIC CORP 12,028 USD 137.12 0.12CME GROUP -A- 1,300 USD 316.77 0.27COMERICA INC 13,400 USD 345.72 0.30CONCHO RES 4,000 USD 375.00 0.32CONSOLIDATED EDISON INC 2,900 USD 179.89 0.15CONSTELLATION ENRGY GROUP 4,300 USD 170.58 0.15COSTCO WHOLESALE CORP 2,000 USD 166.64 0.14COVENTRY HEALTH CARE INC 11,500 USD 349.26 0.30CVS CAREMARK CORP 4,400 USD 179.43 0.15DISCOVER FINANCIAL SERVICES - SHS WI 16,900 USD 405.60 0.35DOMINION RESOURCES INC 3,300 USD 175.16 0.15EL PASO CORP 13,100 USD 348.07 0.30ESTEE LAUDER COMPANIES INC -A- 4,503 USD 505.79 0.42FAIRPOINT COMMUNICATIONS INC 21,466 USD 92.95 0.08
Statement of Investments as at 31/12/11
USD
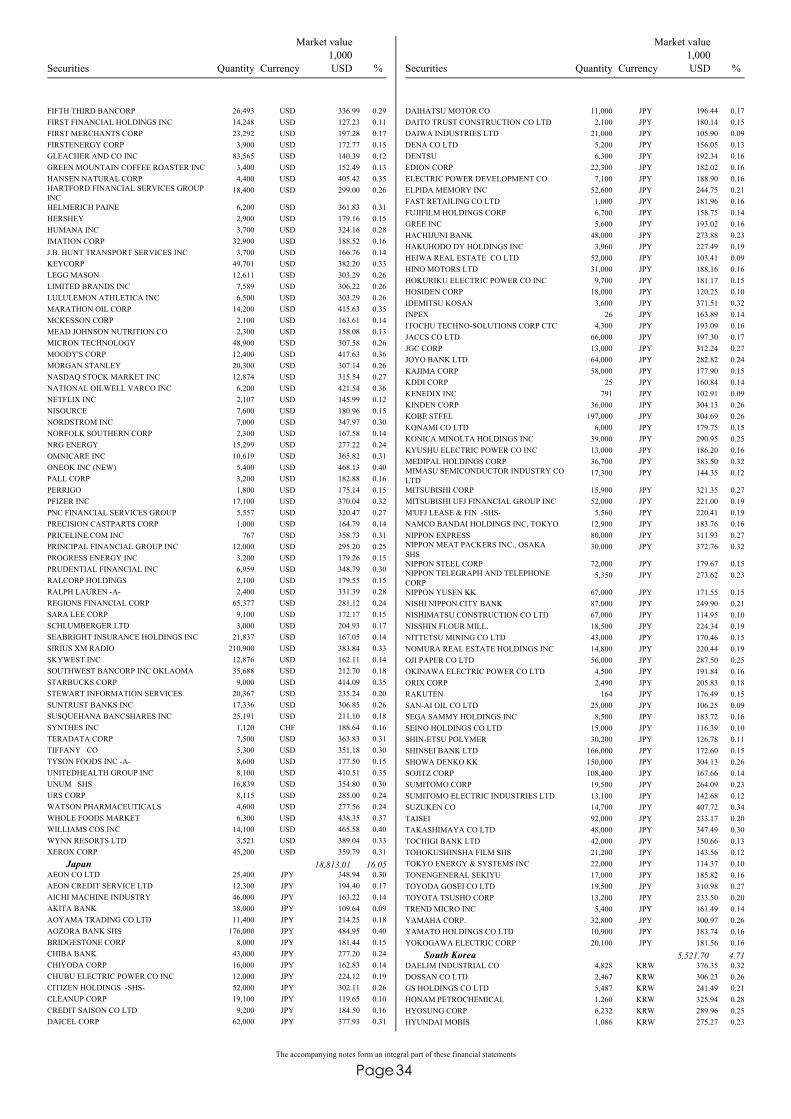
34The accompanying notes form an integral part of these financial statements
Page
Currency
Market value
QuantitySecurities %1,000
FIFTH THIRD BANCORP 26,493 USD 336.99 0.29FIRST FINANCIAL HOLDINGS INC 14,248 USD 127.23 0.11FIRST MERCHANTS CORP 23,292 USD 197.28 0.17FIRSTENERGY CORP 3,900 USD 172.77 0.15GLEACHER AND CO INC 83,565 USD 140.39 0.12GREEN MOUNTAIN COFFEE ROASTER INC 3,400 USD 152.49 0.13HANSEN NATURAL CORP 4,400 USD 405.42 0.35HARTFORD FINANCIAL SERVICES GROUPINC
18,400 USD 299.00 0.26
HELMERICH PAINE 6,200 USD 361.83 0.31HERSHEY 2,900 USD 179.16 0.15HUMANA INC 3,700 USD 324.16 0.28IMATION CORP 32,900 USD 188.52 0.16J.B. HUNT TRANSPORT SERVICES INC 3,700 USD 166.76 0.14KEYCORP 49,701 USD 382.20 0.33LEGG MASON 12,611 USD 303.29 0.26LIMITED BRANDS INC 7,589 USD 306.22 0.26LULULEMON ATHLETICA INC 6,500 USD 303.29 0.26MARATHON OIL CORP 14,200 USD 415.63 0.35MCKESSON CORP 2,100 USD 163.61 0.14MEAD JOHNSON NUTRITION CO 2,300 USD 158.08 0.13MICRON TECHNOLOGY 48,900 USD 307.58 0.26MOODY'S CORP 12,400 USD 417.63 0.36MORGAN STANLEY 20,300 USD 307.14 0.26NASDAQ STOCK MARKET INC 12,874 USD 315.54 0.27NATIONAL OILWELL VARCO INC 6,200 USD 421.54 0.36NETFLIX INC 2,107 USD 145.99 0.12NISOURCE 7,600 USD 180.96 0.15NORDSTROM INC 7,000 USD 347.97 0.30NORFOLK SOUTHERN CORP 2,300 USD 167.58 0.14NRG ENERGY 15,299 USD 277.22 0.24OMNICARE INC 10,619 USD 365.82 0.31ONEOK INC (NEW) 5,400 USD 468.13 0.40PALL CORP 3,200 USD 182.88 0.16PERRIGO 1,800 USD 175.14 0.15PFIZER INC 17,100 USD 370.04 0.32PNC FINANCIAL SERVICES GROUP 5,557 USD 320.47 0.27PRECISION CASTPARTS CORP 1,000 USD 164.79 0.14PRICELINE.COM INC 767 USD 358.73 0.31PRINCIPAL FINANCIAL GROUP INC 12,000 USD 295.20 0.25PROGRESS ENERGY INC 3,200 USD 179.26 0.15PRUDENTIAL FINANCIAL INC 6,959 USD 348.79 0.30RALCORP HOLDINGS 2,100 USD 179.55 0.15RALPH LAUREN -A- 2,400 USD 331.39 0.28REGIONS FINANCIAL CORP 65,377 USD 281.12 0.24SARA LEE CORP 9,100 USD 172.17 0.15SCHLUMBERGER LTD 3,000 USD 204.93 0.17SEABRIGHT INSURANCE HOLDINGS INC 21,837 USD 167.05 0.14SIRIUS XM RADIO 210,900 USD 383.84 0.33SKYWEST INC 12,876 USD 162.11 0.14SOUTHWEST BANCORP INC OKLAOMA 35,688 USD 212.70 0.18STARBUCKS CORP 9,000 USD 414.09 0.35STEWART INFORMATION SERVICES 20,367 USD 235.24 0.20SUNTRUST BANKS INC 17,336 USD 306.85 0.26SUSQUEHANA BANCSHARES INC 25,191 USD 211.10 0.18SYNTHES INC 1,120 CHF 188.64 0.16TERADATA CORP 7,500 USD 363.83 0.31TIFFANY CO 5,300 USD 351.18 0.30TYSON FOODS INC -A- 8,600 USD 177.50 0.15UNITEDHEALTH GROUP INC 8,100 USD 410.51 0.35UNUM SHS 16,839 USD 354.80 0.30URS CORP 8,115 USD 285.00 0.24WATSON PHARMACEUTICALS 4,600 USD 277.56 0.24WHOLE FOODS MARKET 6,300 USD 438.35 0.37WILLIAMS COS INC 14,100 USD 465.58 0.40WYNN RESORTS LTD 3,521 USD 389.04 0.33XEROX CORP 45,200 USD 359.79 0.31
AEON CO LTD 25,400 JPY 348.94 0.30Japan 18,813.01 16.05
AEON CREDIT SERVICE LTD 12,300 JPY 194.40 0.17AICHI MACHINE INDUSTRY 46,000 JPY 163.22 0.14AKITA BANK 38,000 JPY 109.64 0.09AOYAMA TRADING CO LTD 11,400 JPY 214.25 0.18AOZORA BANK SHS 176,000 JPY 484.95 0.40BRIDGESTONE CORP 8,000 JPY 181.44 0.15CHIBA BANK 43,000 JPY 277.20 0.24CHIYODA CORP 16,000 JPY 162.83 0.14CHUBU ELECTRIC POWER CO INC 12,000 JPY 224.12 0.19CITIZEN HOLDINGS -SHS- 52,000 JPY 302.11 0.26CLEANUP CORP 19,100 JPY 119.65 0.10CREDIT SAISON CO LTD 9,200 JPY 184.50 0.16DAICEL CORP 62,000 JPY 377.93 0.31
USD Currency
Market value
QuantitySecurities %1,000
DAIHATSU MOTOR CO 11,000 JPY 196.44 0.17DAITO TRUST CONSTRUCTION CO LTD 2,100 JPY 180.14 0.15DAIWA INDUSTRIES LTD 21,000 JPY 105.90 0.09DENA CO LTD 5,200 JPY 156.05 0.13DENTSU 6,300 JPY 192.34 0.16EDION CORP 22,300 JPY 182.02 0.16ELECTRIC POWER DEVELOPMENT CO 7,100 JPY 188.90 0.16ELPIDA MEMORY INC 52,600 JPY 244.75 0.21FAST RETAILING CO LTD 1,000 JPY 181.96 0.16FUJIFILM HOLDINGS CORP 6,700 JPY 158.75 0.14GREE INC 5,600 JPY 193.02 0.16HACHIJUNI BANK 48,000 JPY 273.88 0.23HAKUHODO DY HOLDINGS INC 3,960 JPY 227.49 0.19HEIWA REAL ESTATE CO LTD 52,000 JPY 103.41 0.09HINO MOTORS LTD 31,000 JPY 188.16 0.16HOKURIKU ELECTRIC POWER CO INC 9,700 JPY 181.17 0.15HOSIDEN CORP 18,000 JPY 120.25 0.10IDEMITSU KOSAN 3,600 JPY 371.51 0.32INPEX 26 JPY 163.89 0.14ITOCHU TECHNO-SOLUTIONS CORP CTC 4,300 JPY 193.09 0.16JACCS CO LTD 66,000 JPY 197.30 0.17JGC CORP 13,000 JPY 312.24 0.27JOYO BANK LTD 64,000 JPY 282.82 0.24KAJIMA CORP 58,000 JPY 177.90 0.15KDDI CORP 25 JPY 160.84 0.14KENEDIX INC 791 JPY 102.91 0.09KINDEN CORP 36,000 JPY 304.13 0.26KOBE STEEL 197,000 JPY 304.69 0.26KONAMI CO LTD 6,000 JPY 179.75 0.15KONICA MINOLTA HOLDINGS INC 39,000 JPY 290.95 0.25KYUSHU ELECTRIC POWER CO INC 13,000 JPY 186.20 0.16MEDIPAL HOLDINGS CORP 36,700 JPY 383.50 0.32MIMASU SEMICONDUCTOR INDUSTRY COLTD
17,300 JPY 144.35 0.12
MITSUBISHI CORP 15,900 JPY 321.35 0.27MITSUBISHI UFJ FINANCIAL GROUP INC 52,000 JPY 221.00 0.19M'UFJ LEASE & FIN -SHS- 5,560 JPY 220.41 0.19NAMCO BANDAI HOLDINGS INC, TOKYO 12,900 JPY 183.76 0.16NIPPON EXPRESS 80,000 JPY 311.93 0.27NIPPON MEAT PACKERS INC., OSAKASHS
30,000 JPY 372.76 0.32
NIPPON STEEL CORP 72,000 JPY 179.67 0.15NIPPON TELEGRAPH AND TELEPHONECORP
5,350 JPY 273.62 0.23
NIPPON YUSEN KK 67,000 JPY 171.55 0.15NISHI NIPPON CITY BANK 87,000 JPY 249.90 0.21NISHIMATSU CONSTRUCTION CO LTD 67,000 JPY 114.95 0.10NISSHIN FLOUR MILL. 18,500 JPY 224.34 0.19NITTETSU MINING CO LTD 43,000 JPY 170.46 0.15NOMURA REAL ESTATE HOLDINGS INC 14,800 JPY 220.44 0.19OJI PAPER CO LTD 56,000 JPY 287.50 0.25OKINAWA ELECTRIC POWER CO LTD 4,500 JPY 191.84 0.16ORIX CORP 2,490 JPY 205.83 0.18RAKUTEN 164 JPY 176.49 0.15SAN-AI OIL CO LTD 25,000 JPY 106.25 0.09SEGA SAMMY HOLDINGS INC 8,500 JPY 183.72 0.16SEINO HOLDINGS CO LTD 15,000 JPY 116.39 0.10SHIN-ETSU POLYMER 30,200 JPY 126.78 0.11SHINSEI BANK LTD 166,000 JPY 172.60 0.15SHOWA DENKO KK 150,000 JPY 304.13 0.26SOJITZ CORP 108,400 JPY 167.66 0.14SUMITOMO CORP 19,500 JPY 264.09 0.23SUMITOMO ELECTRIC INDUSTRIES LTD 13,100 JPY 142.68 0.12SUZUKEN CO 14,700 JPY 407.72 0.34TAISEI 92,000 JPY 233.17 0.20TAKASHIMAYA CO LTD 48,000 JPY 347.49 0.30TOCHIGI BANK LTD 42,000 JPY 150.66 0.13TOHOKUSHINSHA FILM SHS 21,200 JPY 143.56 0.12TOKYO ENERGY & SYSTEMS INC 22,000 JPY 114.37 0.10TONENGENERAL SEKIYU 17,000 JPY 185.82 0.16TOYODA GOSEI CO LTD 19,500 JPY 310.98 0.27TOYOTA TSUSHO CORP 13,200 JPY 233.50 0.20TREND MICRO INC 5,400 JPY 161.49 0.14YAMAHA CORP. 32,800 JPY 300.97 0.26YAMATO HOLDINGS CO LTD 10,900 JPY 183.74 0.16YOKOGAWA ELECTRIC CORP 20,100 JPY 181.56 0.16
DAELIM INDUSTRIAL CO 4,828 KRW 376.35 0.32South Korea 5,521.70 4.71
DOSSAN CO LTD 2,467 KRW 306.23 0.26GS HOLDINGS CO LTD 5,487 KRW 241.49 0.21HONAM PETROCHEMICAL 1,260 KRW 325.94 0.28HYOSUNG CORP 6,232 KRW 289.96 0.25HYUNDAI MOBIS 1,086 KRW 275.27 0.23
USD
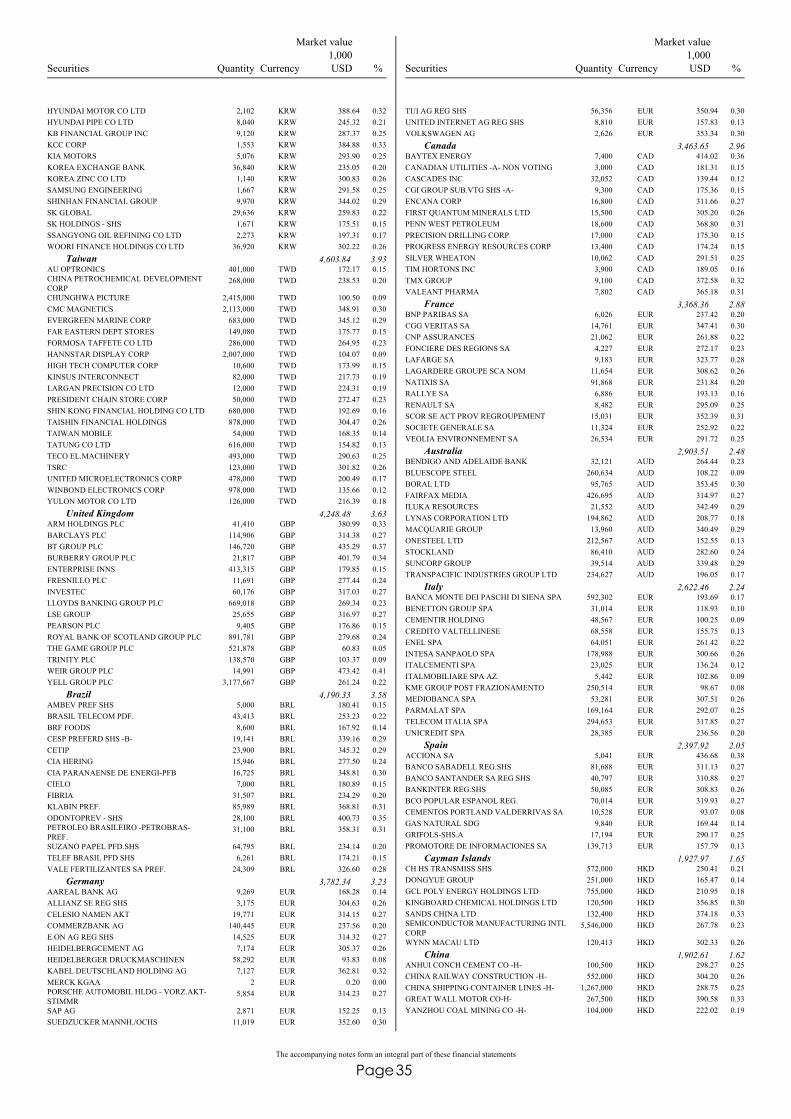
35The accompanying notes form an integral part of these financial statements
Page
Currency
Market value
QuantitySecurities %1,000
HYUNDAI MOTOR CO LTD 2,102 KRW 388.64 0.32HYUNDAI PIPE CO LTD 8,040 KRW 245.32 0.21KB FINANCIAL GROUP INC 9,120 KRW 287.37 0.25KCC CORP 1,553 KRW 384.88 0.33KIA MOTORS 5,076 KRW 293.90 0.25KOREA EXCHANGE BANK 36,840 KRW 235.05 0.20KOREA ZINC CO LTD 1,140 KRW 300.83 0.26SAMSUNG ENGINEERING 1,667 KRW 291.58 0.25SHINHAN FINANCIAL GROUP 9,970 KRW 344.02 0.29SK GLOBAL 29,636 KRW 259.83 0.22SK HOLDINGS - SHS 1,671 KRW 175.51 0.15SSANGYONG OIL REFINING CO LTD 2,273 KRW 197.31 0.17WOORI FINANCE HOLDINGS CO LTD 36,920 KRW 302.22 0.26
AU OPTRONICS 401,000 TWD 172.17 0.15Taiwan 4,603.84 3.93
CHINA PETROCHEMICAL DEVELOPMENTCORP
268,000 TWD 238.53 0.20
CHUNGHWA PICTURE 2,415,000 TWD 100.50 0.09CMC MAGNETICS 2,113,000 TWD 348.91 0.30EVERGREEN MARINE CORP 683,000 TWD 345.12 0.29FAR EASTERN DEPT STORES 149,080 TWD 175.77 0.15FORMOSA TAFFETE CO LTD 286,000 TWD 264.95 0.23HANNSTAR DISPLAY CORP 2,007,000 TWD 104.07 0.09HIGH TECH COMPUTER CORP 10,600 TWD 173.99 0.15KINSUS INTERCONNECT 82,000 TWD 217.73 0.19LARGAN PRECISION CO LTD 12,000 TWD 224.31 0.19PRESIDENT CHAIN STORE CORP 50,000 TWD 272.47 0.23SHIN KONG FINANCIAL HOLDING CO LTD 680,000 TWD 192.69 0.16TAISHIN FINANCIAL HOLDINGS 878,000 TWD 304.47 0.26TAIWAN MOBILE 54,000 TWD 168.35 0.14TATUNG CO LTD 616,000 TWD 154.82 0.13TECO EL.MACHINERY 493,000 TWD 290.63 0.25TSRC 123,000 TWD 301.82 0.26UNITED MICROELECTRONICS CORP 478,000 TWD 200.49 0.17WINBOND ELECTRONICS CORP 978,000 TWD 135.66 0.12YULON MOTOR CO LTD 126,000 TWD 216.39 0.18
ARM HOLDINGS PLC 41,410 GBP 380.99 0.33United Kingdom 4,248.48 3.63
BARCLAYS PLC 114,906 GBP 314.38 0.27BT GROUP PLC 146,720 GBP 435.29 0.37BURBERRY GROUP PLC 21,817 GBP 401.79 0.34ENTERPRISE INNS 413,315 GBP 179.85 0.15FRESNILLO PLC 11,691 GBP 277.44 0.24INVESTEC 60,176 GBP 317.03 0.27LLOYDS BANKING GROUP PLC 669,018 GBP 269.34 0.23LSE GROUP 25,655 GBP 316.97 0.27PEARSON PLC 9,405 GBP 176.86 0.15ROYAL BANK OF SCOTLAND GROUP PLC 891,781 GBP 279.68 0.24THE GAME GROUP PLC 521,878 GBP 60.83 0.05TRINITY PLC 138,570 GBP 103.37 0.09WEIR GROUP PLC 14,991 GBP 473.42 0.41YELL GROUP PLC 3,177,667 GBP 261.24 0.22
AMBEV PREF SHS 5,000 BRL 180.41 0.15Brazil 4,190.33 3.58
BRASIL TELECOM PDF. 43,413 BRL 253.23 0.22BRF FOODS 8,600 BRL 167.92 0.14CESP PREFERD SHS -B- 19,141 BRL 339.16 0.29CETIP 23,900 BRL 345.32 0.29CIA HERING 15,946 BRL 277.50 0.24CIA PARANAENSE DE ENERGI-PFB 16,725 BRL 348.81 0.30CIELO 7,000 BRL 180.89 0.15FIBRIA 31,507 BRL 234.29 0.20KLABIN PREF. 85,989 BRL 368.81 0.31ODONTOPREV - SHS 28,100 BRL 400.73 0.35PETROLEO BRASILEIRO -PETROBRAS-PREF.
31,100 BRL 358.31 0.31
SUZANO PAPEL PFD.SHS 64,795 BRL 234.14 0.20TELEF BRASIL PFD SHS 6,261 BRL 174.21 0.15VALE FERTILIZANTES SA PREF. 24,309 BRL 326.60 0.28
AAREAL BANK AG 9,269 EUR 168.28 0.14Germany 3,782.34 3.23
ALLIANZ SE REG SHS 3,175 EUR 304.63 0.26CELESIO NAMEN AKT 19,771 EUR 314.15 0.27COMMERZBANK AG 140,445 EUR 237.56 0.20E.ON AG REG SHS 14,525 EUR 314.32 0.27HEIDELBERGCEMENT AG 7,174 EUR 305.37 0.26HEIDELBERGER DRUCKMASCHINEN 58,292 EUR 93.83 0.08KABEL DEUTSCHLAND HOLDING AG 7,127 EUR 362.81 0.32MERCK KGAA 2 EUR 0.20 0.00PORSCHE AUTOMOBIL HLDG - VORZ.AKT-STIMMR
5,854 EUR 314.23 0.27
SAP AG 2,871 EUR 152.25 0.13SUEDZUCKER MANNH./OCHS 11,019 EUR 352.60 0.30
USD Currency
Market value
QuantitySecurities %1,000
TUI AG REG SHS 56,356 EUR 350.94 0.30UNITED INTERNET AG REG SHS 8,810 EUR 157.83 0.13VOLKSWAGEN AG 2,626 EUR 353.34 0.30
BAYTEX ENERGY 7,400 CAD 414.02 0.36Canada 3,463.65 2.96
CANADIAN UTILITIES -A- NON VOTING 3,000 CAD 181.31 0.15CASCADES INC 32,052 CAD 139.44 0.12CGI GROUP SUB.VTG SHS -A- 9,300 CAD 175.36 0.15ENCANA CORP 16,800 CAD 311.66 0.27FIRST QUANTUM MINERALS LTD 15,500 CAD 305.20 0.26PENN WEST PETROLEUM 18,600 CAD 368.80 0.31PRECISION DRILLING CORP 17,000 CAD 175.30 0.15PROGRESS ENERGY RESOURCES CORP 13,400 CAD 174.24 0.15SILVER WHEATON 10,062 CAD 291.51 0.25TIM HORTONS INC 3,900 CAD 189.05 0.16TMX GROUP 9,100 CAD 372.58 0.32VALEANT PHARMA 7,802 CAD 365.18 0.31
BNP PARIBAS SA 6,026 EUR 237.42 0.20France 3,368.36 2.88
CGG VERITAS SA 14,761 EUR 347.41 0.30CNP ASSURANCES 21,062 EUR 261.88 0.22FONCIERE DES REGIONS SA 4,227 EUR 272.17 0.23LAFARGE SA 9,183 EUR 323.77 0.28LAGARDERE GROUPE SCA NOM 11,654 EUR 308.62 0.26NATIXIS SA 91,868 EUR 231.84 0.20RALLYE SA 6,886 EUR 193.13 0.16RENAULT SA 8,482 EUR 295.09 0.25SCOR SE ACT PROV REGROUPEMENT 15,031 EUR 352.39 0.31SOCIETE GENERALE SA 11,324 EUR 252.92 0.22VEOLIA ENVIRONNEMENT SA 26,534 EUR 291.72 0.25
BENDIGO AND ADELAIDE BANK 32,121 AUD 264.44 0.23Australia 2,903.51 2.48
BLUESCOPE STEEL 260,634 AUD 108.22 0.09BORAL LTD 95,765 AUD 353.45 0.30FAIRFAX MEDIA 426,695 AUD 314.97 0.27ILUKA RESOURCES 21,552 AUD 342.49 0.29LYNAS CORPORATION LTD 194,862 AUD 208.77 0.18MACQUARIE GROUP 13,960 AUD 340.49 0.29ONESTEEL LTD 212,567 AUD 152.55 0.13STOCKLAND 86,410 AUD 282.60 0.24SUNCORP GROUP 39,514 AUD 339.48 0.29TRANSPACIFIC INDUSTRIES GROUP LTD 234,627 AUD 196.05 0.17
BANCA MONTE DEI PASCHI DI SIENA SPA 592,302 EUR 193.69 0.17Italy 2,622.46 2.24
BENETTON GROUP SPA 31,014 EUR 118.93 0.10CEMENTIR HOLDING 48,567 EUR 100.25 0.09CREDITO VALTELLINESE 68,558 EUR 155.75 0.13ENEL SPA 64,051 EUR 261.42 0.22INTESA SANPAOLO SPA 178,988 EUR 300.66 0.26ITALCEMENTI SPA 23,025 EUR 136.24 0.12ITALMOBILIARE SPA AZ. 5,442 EUR 102.86 0.09KME GROUP POST FRAZIONAMENTO 250,514 EUR 98.67 0.08MEDIOBANCA SPA 53,281 EUR 307.51 0.26PARMALAT SPA 169,164 EUR 292.07 0.25TELECOM ITALIA SPA 294,653 EUR 317.85 0.27UNICREDIT SPA 28,385 EUR 236.56 0.20
ACCIONA SA 5,041 EUR 436.68 0.38Spain 2,397.92 2.05
BANCO SABADELL REG.SHS 81,688 EUR 311.13 0.27BANCO SANTANDER SA REG SHS 40,797 EUR 310.88 0.27BANKINTER REG.SHS 50,085 EUR 308.83 0.26BCO POPULAR ESPANOL REG. 70,014 EUR 319.93 0.27CEMENTOS PORTLAND VALDERRIVAS SA 10,528 EUR 93.07 0.08GAS NATURAL SDG 9,840 EUR 169.44 0.14GRIFOLS-SHS.A 17,194 EUR 290.17 0.25PROMOTORE DE INFORMACIONES SA 139,713 EUR 157.79 0.13
CH HS TRANSMISS SHS 572,000 HKD 250.41 0.21Cayman Islands 1,927.97 1.65
DONGYUE GROUP 251,000 HKD 165.47 0.14GCL POLY ENERGY HOLDINGS LTD 755,000 HKD 210.95 0.18KINGBOARD CHEMICAL HOLDINGS LTD 120,500 HKD 356.85 0.30SANDS CHINA LTD 132,400 HKD 374.18 0.33SEMICONDUCTOR MANUFACTURING INTLCORP
5,546,000 HKD 267.78 0.23
WYNN MACAU LTD 120,413 HKD 302.33 0.26
ANHUI CONCH CEMENT CO -H- 100,500 HKD 298.27 0.25China 1,902.61 1.62
CHINA RAILWAY CONSTRUCTION -H- 552,000 HKD 304.20 0.26CHINA SHIPPING CONTAINER LINES -H- 1,267,000 HKD 288.75 0.25GREAT WALL MOTOR CO-H- 267,500 HKD 390.58 0.33YANZHOU COAL MINING CO -H- 104,000 HKD 222.02 0.19
USD
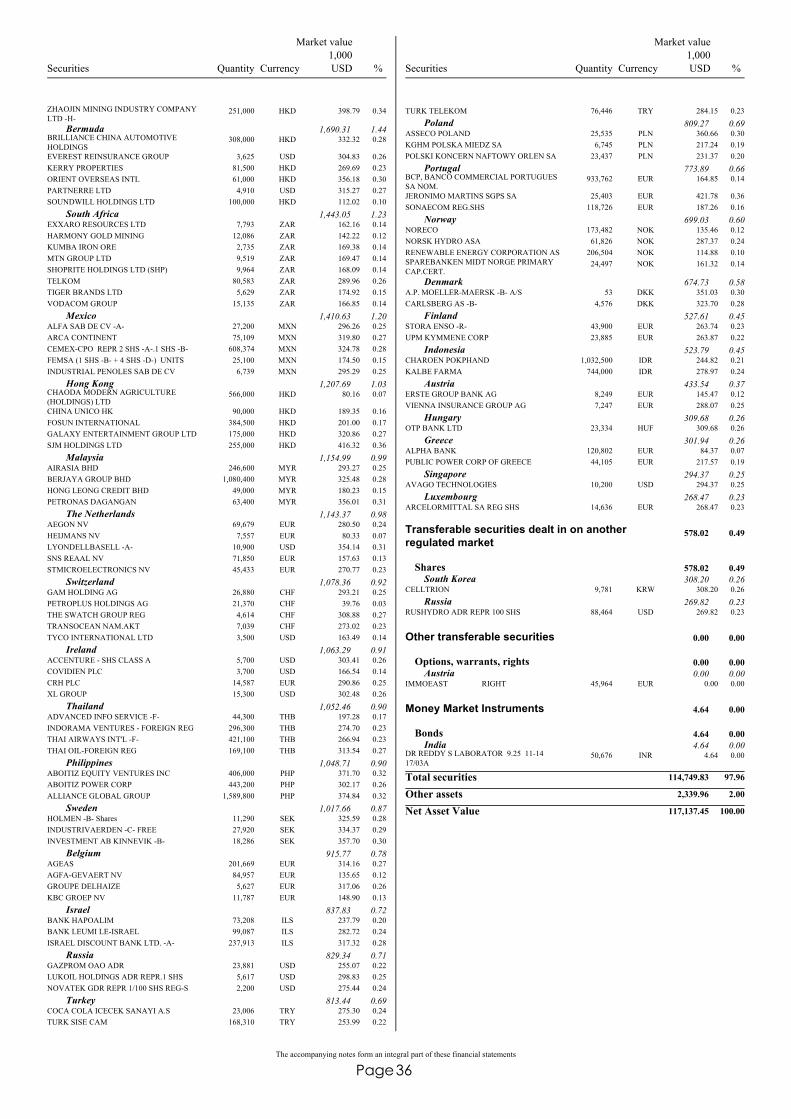
36The accompanying notes form an integral part of these financial statements
Page
Currency
Market value
QuantitySecurities %1,000
ZHAOJIN MINING INDUSTRY COMPANYLTD -H-
251,000 HKD 398.79 0.34
BRILLIANCE CHINA AUTOMOTIVEHOLDINGS
308,000 HKD 332.32 0.28Bermuda 1,690.31 1.44
EVEREST REINSURANCE GROUP 3,625 USD 304.83 0.26KERRY PROPERTIES 81,500 HKD 269.69 0.23ORIENT OVERSEAS INTL 61,000 HKD 356.18 0.30PARTNERRE LTD 4,910 USD 315.27 0.27SOUNDWILL HOLDINGS LTD 100,000 HKD 112.02 0.10
EXXARO RESOURCES LTD 7,793 ZAR 162.16 0.14South Africa 1,443.05 1.23
HARMONY GOLD MINING 12,086 ZAR 142.22 0.12KUMBA IRON ORE 2,735 ZAR 169.38 0.14MTN GROUP LTD 9,519 ZAR 169.47 0.14SHOPRITE HOLDINGS LTD (SHP) 9,964 ZAR 168.09 0.14TELKOM 80,583 ZAR 289.96 0.26TIGER BRANDS LTD 5,629 ZAR 174.92 0.15VODACOM GROUP 15,135 ZAR 166.85 0.14
ALFA SAB DE CV -A- 27,200 MXN 296.26 0.25Mexico 1,410.63 1.20
ARCA CONTINENT 75,109 MXN 319.80 0.27CEMEX-CPO REPR 2 SHS -A-.1 SHS -B- 608,374 MXN 324.78 0.28FEMSA (1 SHS -B- + 4 SHS -D-) UNITS 25,100 MXN 174.50 0.15INDUSTRIAL PENOLES SAB DE CV 6,739 MXN 295.29 0.25
CHAODA MODERN AGRICULTURE(HOLDINGS) LTD
566,000 HKD 80.16 0.07Hong Kong 1,207.69 1.03
CHINA UNICO HK 90,000 HKD 189.35 0.16FOSUN INTERNATIONAL 384,500 HKD 201.00 0.17GALAXY ENTERTAINMENT GROUP LTD 175,000 HKD 320.86 0.27SJM HOLDINGS LTD 255,000 HKD 416.32 0.36
AIRASIA BHD 246,600 MYR 293.27 0.25Malaysia 1,154.99 0.99
BERJAYA GROUP BHD 1,080,400 MYR 325.48 0.28HONG LEONG CREDIT BHD 49,000 MYR 180.23 0.15PETRONAS DAGANGAN 63,400 MYR 356.01 0.31
AEGON NV 69,679 EUR 280.50 0.24The Netherlands 1,143.37 0.98
HEIJMANS NV 7,557 EUR 80.33 0.07LYONDELLBASELL -A- 10,900 USD 354.14 0.31SNS REAAL NV 71,850 EUR 157.63 0.13STMICROELECTRONICS NV 45,433 EUR 270.77 0.23
GAM HOLDING AG 26,880 CHF 293.21 0.25Switzerland 1,078.36 0.92
PETROPLUS HOLDINGS AG 21,370 CHF 39.76 0.03THE SWATCH GROUP REG 4,614 CHF 308.88 0.27TRANSOCEAN NAM.AKT 7,039 CHF 273.02 0.23TYCO INTERNATIONAL LTD 3,500 USD 163.49 0.14
ACCENTURE - SHS CLASS A 5,700 USD 303.41 0.26Ireland 1,063.29 0.91
COVIDIEN PLC 3,700 USD 166.54 0.14CRH PLC 14,587 EUR 290.86 0.25XL GROUP 15,300 USD 302.48 0.26
ADVANCED INFO SERVICE -F- 44,300 THB 197.28 0.17Thailand 1,052.46 0.90
INDORAMA VENTURES - FOREIGN REG 296,300 THB 274.70 0.23THAI AIRWAYS INT'L -F- 421,100 THB 266.94 0.23THAI OIL-FOREIGN REG 169,100 THB 313.54 0.27
ABOITIZ EQUITY VENTURES INC 406,000 PHP 371.70 0.32Philippines 1,048.71 0.90
ABOITIZ POWER CORP 443,200 PHP 302.17 0.26ALLIANCE GLOBAL GROUP 1,589,800 PHP 374.84 0.32
HOLMEN -B- Shares 11,290 SEK 325.59 0.28Sweden 1,017.66 0.87
INDUSTRIVAERDEN -C- FREE 27,920 SEK 334.37 0.29INVESTMENT AB KINNEVIK -B- 18,286 SEK 357.70 0.30
AGEAS 201,669 EUR 314.16 0.27Belgium 915.77 0.78
AGFA-GEVAERT NV 84,957 EUR 135.65 0.12GROUPE DELHAIZE 5,627 EUR 317.06 0.26KBC GROEP NV 11,787 EUR 148.90 0.13
BANK HAPOALIM 73,208 ILS 237.79 0.20Israel 837.83 0.72
BANK LEUMI LE-ISRAEL 99,087 ILS 282.72 0.24ISRAEL DISCOUNT BANK LTD. -A- 237,913 ILS 317.32 0.28
GAZPROM OAO ADR 23,881 USD 255.07 0.22Russia 829.34 0.71
LUKOIL HOLDINGS ADR REPR.1 SHS 5,617 USD 298.83 0.25NOVATEK GDR REPR 1/100 SHS REG-S 2,200 USD 275.44 0.24
COCA COLA ICECEK SANAYI A.S 23,006 TRY 275.30 0.24Turkey 813.44 0.69
TURK SISE CAM 168,310 TRY 253.99 0.22
USD Currency
Market value
QuantitySecurities %1,000
TURK TELEKOM 76,446 TRY 284.15 0.23
ASSECO POLAND 25,535 PLN 360.66 0.30Poland 809.27 0.69
KGHM POLSKA MIEDZ SA 6,745 PLN 217.24 0.19POLSKI KONCERN NAFTOWY ORLEN SA 23,437 PLN 231.37 0.20
BCP, BANCO COMMERCIAL PORTUGUESSA NOM.
933,762 EUR 164.85 0.14Portugal 773.89 0.66
JERONIMO MARTINS SGPS SA 25,403 EUR 421.78 0.36SONAECOM REG.SHS 118,726 EUR 187.26 0.16
NORECO 173,482 NOK 135.46 0.12Norway 699.03 0.60
NORSK HYDRO ASA 61,826 NOK 287.37 0.24RENEWABLE ENERGY CORPORATION AS 206,504 NOK 114.88 0.10SPAREBANKEN MIDT NORGE PRIMARYCAP.CERT.
24,497 NOK 161.32 0.14
A.P. MOELLER-MAERSK -B- A/S 53 DKK 351.03 0.30Denmark 674.73 0.58
CARLSBERG AS -B- 4,576 DKK 323.70 0.28
STORA ENSO -R- 43,900 EUR 263.74 0.23Finland 527.61 0.45
UPM KYMMENE CORP 23,885 EUR 263.87 0.22
CHAROEN POKPHAND 1,032,500 IDR 244.82 0.21Indonesia 523.79 0.45
KALBE FARMA 744,000 IDR 278.97 0.24
ERSTE GROUP BANK AG 8,249 EUR 145.47 0.12Austria 433.54 0.37
VIENNA INSURANCE GROUP AG 7,247 EUR 288.07 0.25
OTP BANK LTD 23,334 HUF 309.68 0.26Hungary 309.68 0.26
ALPHA BANK 120,802 EUR 84.37 0.07Greece 301.94 0.26
PUBLIC POWER CORP OF GREECE 44,105 EUR 217.57 0.19
AVAGO TECHNOLOGIES 10,200 USD 294.37 0.25Singapore 294.37 0.25
ARCELORMITTAL SA REG SHS 14,636 EUR 268.47 0.23Luxembourg 268.47 0.23
CELLTRION 9,781 KRW 308.20 0.26
Transferable securities dealt in on anotherregulated market
578.02 0.49
Shares 578.02 0.49South Korea 308.20 0.26
RUSHYDRO ADR REPR 100 SHS 88,464 USD 269.82 0.23Russia 269.82 0.23
IMMOEAST RIGHT 45,964 EUR 0.00 0.00
Other transferable securities 0.00 0.00
Options, warrants, rights 0.00 0.00Austria 0.00 0.00
DR REDDY S LABORATOR 9.25 11-1417/03A
50,676 INR 4.64 0.00
Money Market Instruments 4.64 0.00
Bonds 4.64 0.00India 4.64 0.00
Total securities 114,749.83 97.96
Other assets 2,339.96 2.00
Net Asset Value 117,137.45 100.00
USD
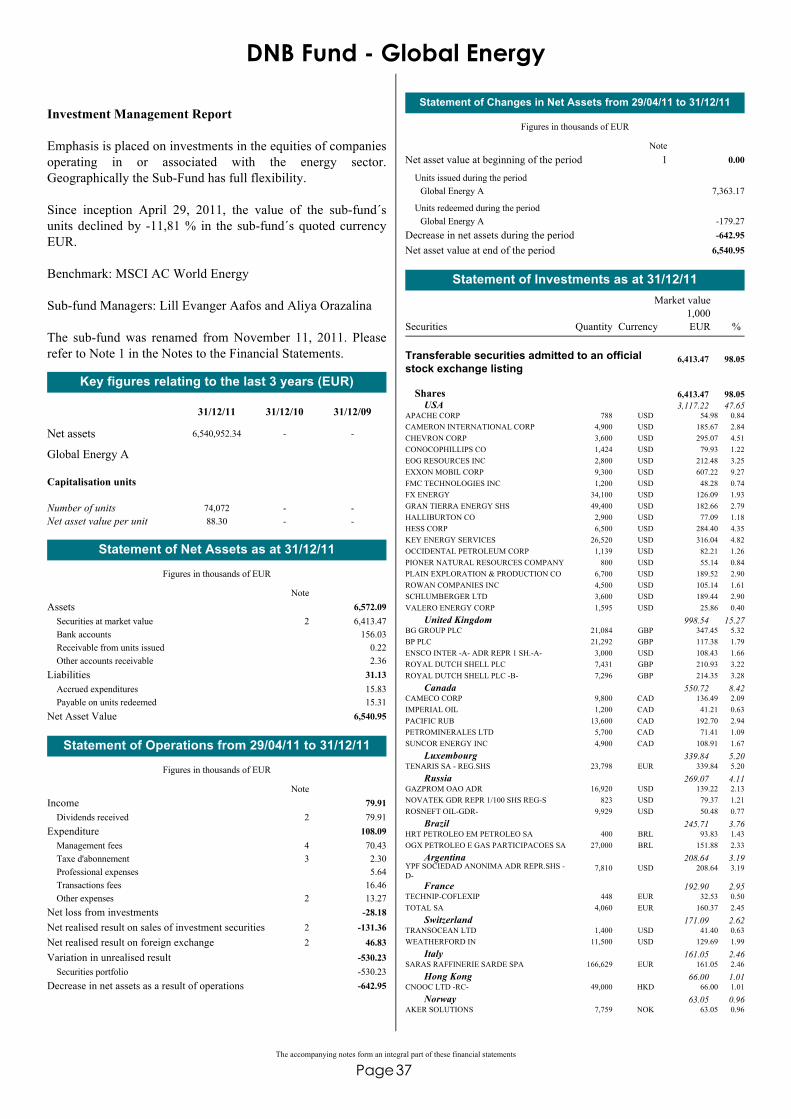
37The accompanying notes form an integral part of these financial statements
Page
DNB Fund - Global Energy
Investment Management Report
Emphasis is placed on investments in the equities of companiesoperating in or associated with the energy sector.Geographically the Sub-Fund has full flexibility.
Since inception April 29, 2011, the value of the sub-fund´sunits declined by -11,81 % in the sub-fund´s quoted currencyEUR.
Benchmark: MSCI AC World Energy
Sub-fund Managers: Lill Evanger Aafos and Aliya Orazalina
The sub-fund was renamed from November 11, 2011. Pleaserefer to Note 1 in the Notes to the Financial Statements.
Key figures relating to the last 3 years (EUR)
Net assets
31/12/11 31/12/10 31/12/09
6,540,952.34 - -
Number of unitsNet asset value per unit
Capitalisation units
74,07288.30
--
--
Global Energy A
Assets 6,572.09Securities at market value 6,413.472Bank accounts 156.03Receivable from units issued 0.22Other accounts receivable 2.36
Liabilities 31.13Accrued expenditures 15.83Payable on units redeemed 15.31
Net Asset Value 6,540.95
Statement of Net Assets as at 31/12/11
Figures in thousands of EUR
Note
Income 79.91Dividends received 79.912
Expenditure 108.09Management fees 70.434Taxe d'abonnement 2.303Professional expenses 5.64Transactions fees 16.46Other expenses 13.272
Net loss from investments -28.18Net realised result on sales of investment securities -131.362Net realised result on foreign exchange 46.832Variation in unrealised result -530.23
Securities portfolio -530.23Decrease in net assets as a result of operations -642.95
Statement of Operations from 29/04/11 to 31/12/11
Figures in thousands of EUR
Note
Statement of Changes in Net Assets from 29/04/11 to 31/12/11
Figures in thousands of EUR
Net asset value at beginning of the period 0.001
7,363.17Global Energy AUnits issued during the period
-179.27Global Energy AUnits redeemed during the period
Decrease in net assets during the period -642.95Net asset value at end of the period 6,540.95
Note
Currency
Market value
QuantitySecurities %1,000
APACHE CORP 788 USD 54.98 0.84
Transferable securities admitted to an officialstock exchange listing
6,413.47 98.05
Shares 6,413.47 98.05USA 3,117.22 47.65
CAMERON INTERNATIONAL CORP 4,900 USD 185.67 2.84CHEVRON CORP 3,600 USD 295.07 4.51CONOCOPHILLIPS CO 1,424 USD 79.93 1.22EOG RESOURCES INC 2,800 USD 212.48 3.25EXXON MOBIL CORP 9,300 USD 607.22 9.27FMC TECHNOLOGIES INC 1,200 USD 48.28 0.74FX ENERGY 34,100 USD 126.09 1.93GRAN TIERRA ENERGY SHS 49,400 USD 182.66 2.79HALLIBURTON CO 2,900 USD 77.09 1.18HESS CORP 6,500 USD 284.40 4.35KEY ENERGY SERVICES 26,520 USD 316.04 4.82OCCIDENTAL PETROLEUM CORP 1,139 USD 82.21 1.26PIONER NATURAL RESOURCES COMPANY 800 USD 55.14 0.84PLAIN EXPLORATION & PRODUCTION CO 6,700 USD 189.52 2.90ROWAN COMPANIES INC 4,500 USD 105.14 1.61SCHLUMBERGER LTD 3,600 USD 189.44 2.90VALERO ENERGY CORP 1,595 USD 25.86 0.40
BG GROUP PLC 21,084 GBP 347.45 5.32United Kingdom 998.54 15.27
BP PLC 21,292 GBP 117.38 1.79ENSCO INTER -A- ADR REPR 1 SH.-A- 3,000 USD 108.43 1.66ROYAL DUTCH SHELL PLC 7,431 GBP 210.93 3.22ROYAL DUTCH SHELL PLC -B- 7,296 GBP 214.35 3.28
CAMECO CORP 9,800 CAD 136.49 2.09Canada 550.72 8.42
IMPERIAL OIL 1,200 CAD 41.21 0.63PACIFIC RUB 13,600 CAD 192.70 2.94PETROMINERALES LTD 5,700 CAD 71.41 1.09SUNCOR ENERGY INC 4,900 CAD 108.91 1.67
TENARIS SA - REG.SHS 23,798 EUR 339.84 5.20Luxembourg 339.84 5.20
GAZPROM OAO ADR 16,920 USD 139.22 2.13Russia 269.07 4.11
NOVATEK GDR REPR 1/100 SHS REG-S 823 USD 79.37 1.21ROSNEFT OIL-GDR- 9,929 USD 50.48 0.77
HRT PETROLEO EM PETROLEO SA 400 BRL 93.83 1.43Brazil 245.71 3.76
OGX PETROLEO E GAS PARTICIPACOES SA 27,000 BRL 151.88 2.33
YPF SOCIEDAD ANONIMA ADR REPR.SHS -D-
7,810 USD 208.64 3.19Argentina 208.64 3.19
TECHNIP-COFLEXIP 448 EUR 32.53 0.50France 192.90 2.95
TOTAL SA 4,060 EUR 160.37 2.45
TRANSOCEAN LTD 1,400 USD 41.40 0.63Switzerland 171.09 2.62
WEATHERFORD IN 11,500 USD 129.69 1.99
SARAS RAFFINERIE SARDE SPA 166,629 EUR 161.05 2.46Italy 161.05 2.46
CNOOC LTD -RC- 49,000 HKD 66.00 1.01Hong Kong 66.00 1.01
AKER SOLUTIONS 7,759 NOK 63.05 0.96Norway 63.05 0.96
Statement of Investments as at 31/12/11
EUR

38The accompanying notes form an integral part of these financial statements
Page
Currency
Market value
QuantitySecurities %1,000
ORIGIN ENERGY LTD 2,813 AUD 29.64 0.45Australia 29.64 0.45
Total securities 6,413.47 98.05
Other assets 127.48 1.95
Net Asset Value 6,540.95 100.00
EUR
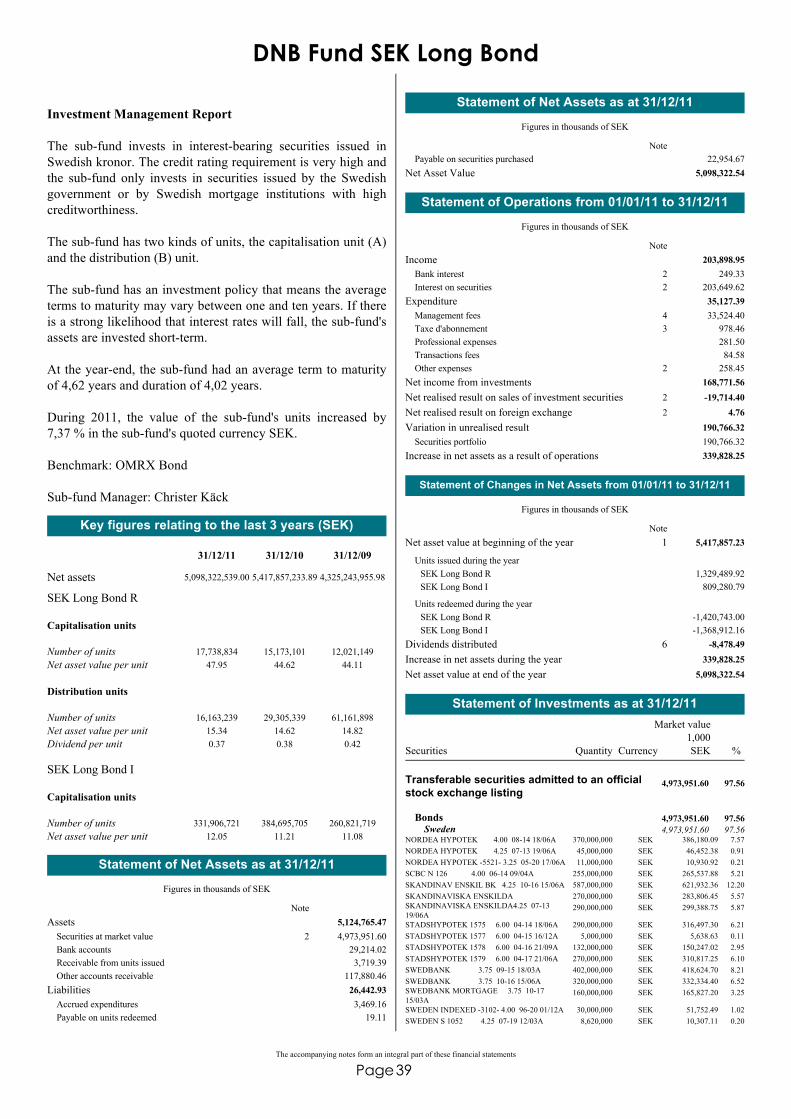
39The accompanying notes form an integral part of these financial statements
Page
DNB Fund SEK Long Bond
Investment Management Report
The sub-fund invests in interest-bearing securities issued inSwedish kronor. The credit rating requirement is very high andthe sub-fund only invests in securities issued by the Swedishgovernment or by Swedish mortgage institutions with highcreditworthiness. The sub-fund has two kinds of units, the capitalisation unit (A)and the distribution (B) unit.
The sub-fund has an investment policy that means the averageterms to maturity may vary between one and ten years. If thereis a strong likelihood that interest rates will fall, the sub-fund'sassets are invested short-term.
At the year-end, the sub-fund had an average term to maturityof 4,62 years and duration of 4,02 years.
During 2011, the value of the sub-fund's units increased by7,37 % in the sub-fund's quoted currency SEK.
Benchmark: OMRX Bond
Sub-fund Manager: Christer Käck
Key figures relating to the last 3 years (SEK)
Net assets
31/12/11 31/12/10 31/12/09
5,098,322,539.00 5,417,857,233.89 4,325,243,955.98
Number of unitsNet asset value per unit
Capitalisation units
17,738,83447.95
15,173,10144.62
12,021,14944.11
Number of unitsNet asset value per unitDividend per unit
Distribution units
16,163,23915.340.37
29,305,33914.620.38
61,161,89814.820.42
SEK Long Bond R
Number of unitsNet asset value per unit
Capitalisation units
331,906,72112.05
384,695,70511.21
260,821,71911.08
SEK Long Bond I
Assets 5,124,765.47Securities at market value 4,973,951.602Bank accounts 29,214.02Receivable from units issued 3,719.39Other accounts receivable 117,880.46
Liabilities 26,442.93Accrued expenditures 3,469.16Payable on units redeemed 19.11
Statement of Net Assets as at 31/12/11
Figures in thousands of SEK
Note
Payable on securities purchased 22,954.67Net Asset Value 5,098,322.54
Statement of Net Assets as at 31/12/11
Figures in thousands of SEK
Note
Income 203,898.95Bank interest 249.332Interest on securities 203,649.622
Expenditure 35,127.39Management fees 33,524.404Taxe d'abonnement 978.463Professional expenses 281.50Transactions fees 84.58Other expenses 258.452
Net income from investments 168,771.56Net realised result on sales of investment securities -19,714.402Net realised result on foreign exchange 4.762Variation in unrealised result 190,766.32
Securities portfolio 190,766.32Increase in net assets as a result of operations 339,828.25
Statement of Operations from 01/01/11 to 31/12/11
Figures in thousands of SEK
Note
Statement of Changes in Net Assets from 01/01/11 to 31/12/11
Figures in thousands of SEK
Net asset value at beginning of the year 5,417,857.231
1,329,489.92SEK Long Bond R809,280.79SEK Long Bond I
Units issued during the year
-1,420,743.00SEK Long Bond R-1,368,912.16SEK Long Bond I
Units redeemed during the year
Dividends distributed -8,478.496Increase in net assets during the year 339,828.25Net asset value at end of the year 5,098,322.54
Note
Currency
Market value
QuantitySecurities %1,000
NORDEA HYPOTEK 4.00 08-14 18/06A 370,000,000 SEK 386,180.09 7.57
Transferable securities admitted to an officialstock exchange listing
4,973,951.60 97.56
Bonds 4,973,951.60 97.56Sweden 4,973,951.60 97.56
NORDEA HYPOTEK 4.25 07-13 19/06A 45,000,000 SEK 46,452.38 0.91NORDEA HYPOTEK -5521- 3.25 05-20 17/06A 11,000,000 SEK 10,930.92 0.21SCBC N 126 4.00 06-14 09/04A 255,000,000 SEK 265,537.88 5.21SKANDINAV ENSKIL BK 4.25 10-16 15/06A 587,000,000 SEK 621,932.36 12.20SKANDINAVISKA ENSKILDA 270,000,000 SEK 283,806.45 5.57SKANDINAVISKA ENSKILDA4.25 07-1319/06A
290,000,000 SEK 299,388.75 5.87
STADSHYPOTEK 1575 6.00 04-14 18/06A 290,000,000 SEK 316,497.30 6.21STADSHYPOTEK 1577 6.00 04-15 16/12A 5,000,000 SEK 5,638.63 0.11STADSHYPOTEK 1578 6.00 04-16 21/09A 132,000,000 SEK 150,247.02 2.95STADSHYPOTEK 1579 6.00 04-17 21/06A 270,000,000 SEK 310,817.25 6.10SWEDBANK 3.75 09-15 18/03A 402,000,000 SEK 418,624.70 8.21SWEDBANK 3.75 10-16 15/06A 320,000,000 SEK 332,334.40 6.52SWEDBANK MORTGAGE 3.75 10-1715/03A
160,000,000 SEK 165,827.20 3.25
SWEDEN INDEXED -3102- 4.00 96-20 01/12A 30,000,000 SEK 51,752.49 1.02SWEDEN S 1052 4.25 07-19 12/03A 8,620,000 SEK 10,307.11 0.20
Statement of Investments as at 31/12/11
SEK
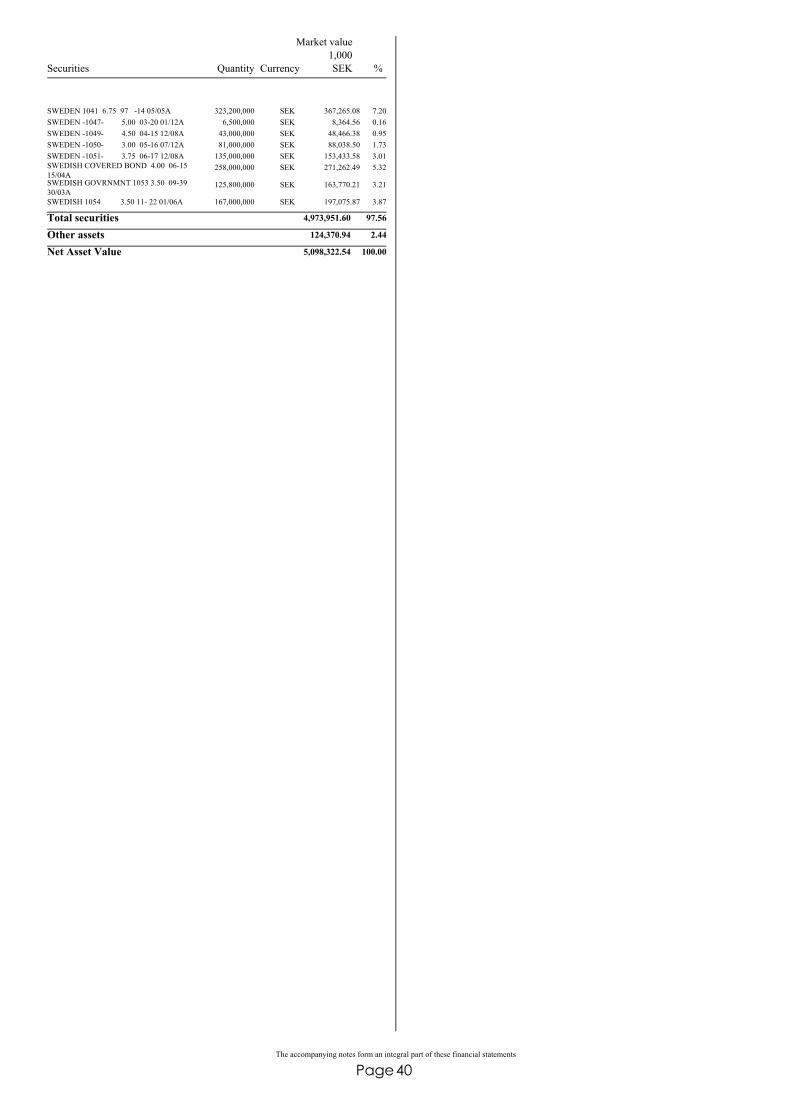
40The accompanying notes form an integral part of these financial statements
Page
Currency
Market value
QuantitySecurities %1,000
SWEDEN 1041 6.75 97 -14 05/05A 323,200,000 SEK 367,265.08 7.20SWEDEN -1047- 5.00 03-20 01/12A 6,500,000 SEK 8,364.56 0.16SWEDEN -1049- 4.50 04-15 12/08A 43,000,000 SEK 48,466.38 0.95SWEDEN -1050- 3.00 05-16 07/12A 81,000,000 SEK 88,038.50 1.73SWEDEN -1051- 3.75 06-17 12/08A 135,000,000 SEK 153,433.58 3.01SWEDISH COVERED BOND 4.00 06-1515/04A
258,000,000 SEK 271,262.49 5.32
SWEDISH GOVRNMNT 1053 3.50 09-3930/03A
125,800,000 SEK 163,770.21 3.21
SWEDISH 1054 3.50 11- 22 01/06A 167,000,000 SEK 197,075.87 3.87
Total securities 4,973,951.60 97.56
Other assets 124,370.94 2.44
Net Asset Value 5,098,322.54 100.00
SEK

41The accompanying notes form an integral part of these financial statements
Page
DNB Fund SEK Short Bond
Investment Management Report
The sub-fund invests in Swedish interest-bearing securities thatare issued in Swedish kronor. The credit rating requirement isvery high and the sub-fund only invests in securities issued bythe government or institutions with high creditworthiness.
The sub-fund has two kinds of units, the capitalisation unit (A)and the distribution (B) unit.
The sub-fund has an investment policy that means that theaverage term to maturity can vary between one and twelvemonths. The short-dated maturity of securities in which thesub-fund invests means that the sub-fund is relativelyinsensitive to interest rate fluctuations.
At the year-end, the average term to maturity was 0,63 yearsand duration 0,63 years.
During 2011, the value of the sub-fund's units increased by2,11 % in the sub-fund's quoted currency SEK.
Benchmark: OMRX MM
Sub-fund Manager: Maud Ljungqvist
Key figures relating to the last 3 years (SEK)
Net assets
31/12/11 31/12/10 31/12/09
4,268,562,543.54 2,151,171,003.37 2,025,000,326.70
Capitalisation units
Number of unitsNet asset value per unit
143,882,11326.50
68,910,38425.94
71,028,26125.87
Distribution units
Number of unitsNet asset value per unitDividend per unit
45,241,02810.070.1500
36,315,49510.010.0450
18,739,98910.020.3200
Assets 4,302,379.08Securities at market value 4,205,741.552Bank accounts 9,730.95Receivable from units issued 28,795.14Other accounts receivable 58,111.44
Liabilities 33,816.54Accrued expenditures 1,687.26Payable on units redeemed 1,144.54Payable on securities purchased 30,984.74
Net Asset Value 4,268,562.54
Statement of Net Assets as at 31/12/11
Figures in thousands of SEK
Note
Income 140,999.71Bank interest 312.482
Statement of Operations from 01/01/11 to 31/12/11
Figures in thousands of SEK
Note
Interest on securities 140,687.232Expenditure 13,884.33
Management fees 12,977.024Taxe d'abonnement 406.763Professional expenses 229.58Transactions fees 72.92Other expenses 198.042
Net income from investments 127,115.38Net realised result on sales of investment securities -50,021.042Net realised result on foreign exchange 3.982Variation in unrealised result 3,206.96
Securities portfolio 3,206.96Increase in net assets as a result of operations 80,305.28
Statement of Operations from 01/01/11 to 31/12/11
Figures in thousands of SEK
Note
Statement of Changes in Net Assets from 01/01/11 to 31/12/11
Figures in thousands of SEK
Net asset value at beginning of the year 2,151,171.0014,699,623.43Units issued during the year
-2,655,208.68Units redeemed during the yearDividends distributed -7,328.486Increase in net assets during the year 80,305.28Net asset value at end of the year 4,268,562.54
Note
Currency
Market value
QuantitySecurities %1,000
NORDEA HYPOTEK -5524- 4.00 06-12 20/06A 533,000,000 SEK 537,783.68 12.60
Transferable securities admitted to an officialstock exchange listing
4,205,741.55 98.53
Bonds 4,205,741.55 98.53Sweden 4,205,741.55 98.53
SKANDINAVISKA ENSKILDA 440,000,000 SEK 444,367.00 10.41STADSHYPOTEK 1573 6.00 04-12 19/12A 1,000,000,0
00SEK 1,037,519.9
924.31
SWEDBANK MORTAGE 4.25 07-12 20/06A 485,000,000 SEK 489,910.63 11.48SWEDEN TREASURY BILLS -12 15/02U 5,000,000 SEK 4,983.08 0.12SWEDEN TREASURY BILLS -12 18/01U 1,000,000 SEK 996.49 0.02SWEDEN TREASURY BILLS -12 20/06U 275,000,000 SEK 273,165.84 6.40SWEDEN TREASURY BILLS -12 21/03U 10,000,000 SEK 9,932.33 0.23SWEDEN 1041 6.75 97 -14 05/05A 500,000 SEK 568.17 0.01SWEDEN -1046- 5.50 01-12 08/10A 951,000,000 SEK 983,614.55 23.04SWEDISH COVERED BOND 4.00 06-1211/04A
420,800,000 SEK 422,899.79 9.91
Total securities 4,205,741.55 98.53
Other assets 62,821.00 1.47
Net Asset Value 4,268,562.54 100.00
Statement of Investments as at 31/12/11
SEK
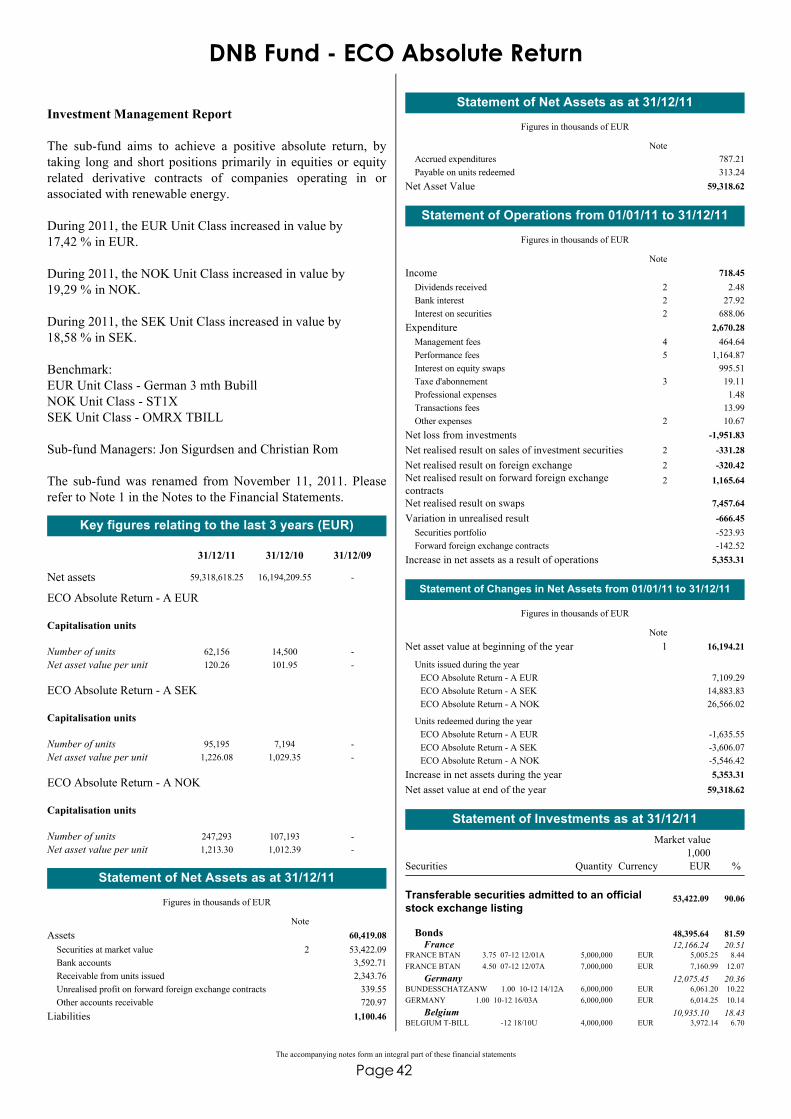
42The accompanying notes form an integral part of these financial statements
Page
DNB Fund - ECO Absolute Return
Investment Management Report
The sub-fund aims to achieve a positive absolute return, bytaking long and short positions primarily in equities or equityrelated derivative contracts of companies operating in orassociated with renewable energy.
During 2011, the EUR Unit Class increased in value by 17,42 % in EUR.
During 2011, the NOK Unit Class increased in value by 19,29 % in NOK.
During 2011, the SEK Unit Class increased in value by 18,58 % in SEK.
Benchmark: EUR Unit Class - German 3 mth Bubill NOK Unit Class - ST1X SEK Unit Class - OMRX TBILL
Sub-fund Managers: Jon Sigurdsen and Christian Rom
The sub-fund was renamed from November 11, 2011. Pleaserefer to Note 1 in the Notes to the Financial Statements.
Key figures relating to the last 3 years (EUR)
Net assets
31/12/11 31/12/10 31/12/09
59,318,618.25 16,194,209.55 -
Number of unitsNet asset value per unit
Capitalisation units
62,156120.26
14,500101.95
--
ECO Absolute Return - A EUR
Number of unitsNet asset value per unit
Capitalisation units
95,1951,226.08
7,1941,029.35
--
ECO Absolute Return - A SEK
Number of unitsNet asset value per unit
Capitalisation units
247,2931,213.30
107,1931,012.39
--
ECO Absolute Return - A NOK
Assets 60,419.08Securities at market value 53,422.092Bank accounts 3,592.71Receivable from units issued 2,343.76Unrealised profit on forward foreign exchange contracts 339.55Other accounts receivable 720.97
Liabilities 1,100.46
Statement of Net Assets as at 31/12/11
Figures in thousands of EUR
Note
Accrued expenditures 787.21Payable on units redeemed 313.24
Net Asset Value 59,318.62
Statement of Net Assets as at 31/12/11
Figures in thousands of EUR
Note
Income 718.45Dividends received 2.482Bank interest 27.922Interest on securities 688.062
Expenditure 2,670.28Management fees 464.644Performance fees 1,164.875Interest on equity swaps 995.51Taxe d'abonnement 19.113Professional expenses 1.48Transactions fees 13.99Other expenses 10.672
Net loss from investments -1,951.83Net realised result on sales of investment securities -331.282Net realised result on foreign exchange -320.422Net realised result on forward foreign exchangecontracts
1,165.642
Net realised result on swaps 7,457.64Variation in unrealised result -666.45
Securities portfolio -523.93Forward foreign exchange contracts -142.52
Increase in net assets as a result of operations 5,353.31
Statement of Operations from 01/01/11 to 31/12/11
Figures in thousands of EUR
Note
Statement of Changes in Net Assets from 01/01/11 to 31/12/11
Figures in thousands of EUR
Net asset value at beginning of the year 16,194.211
7,109.29ECO Absolute Return - A EUR14,883.83ECO Absolute Return - A SEK26,566.02ECO Absolute Return - A NOK
Units issued during the year
-1,635.55ECO Absolute Return - A EUR-3,606.07ECO Absolute Return - A SEK-5,546.42ECO Absolute Return - A NOK
Units redeemed during the year
Increase in net assets during the year 5,353.31Net asset value at end of the year 59,318.62
Note
Currency
Market value
QuantitySecurities %1,000
FRANCE BTAN 3.75 07-12 12/01A 5,000,000 EUR 5,005.25 8.44
Transferable securities admitted to an officialstock exchange listing
53,422.09 90.06
Bonds 48,395.64 81.59France 12,166.24 20.51
FRANCE BTAN 4.50 07-12 12/07A 7,000,000 EUR 7,160.99 12.07
BUNDESSCHATZANW 1.00 10-12 14/12A 6,000,000 EUR 6,061.20 10.22Germany 12,075.45 20.36
GERMANY 1.00 10-12 16/03A 6,000,000 EUR 6,014.25 10.14
BELGIUM T-BILL -12 18/10U 4,000,000 EUR 3,972.14 6.70Belgium 10,935.10 18.43
Statement of Investments as at 31/12/11
EUR

43The accompanying notes form an integral part of these financial statements
Page
Currency
Market value
QuantitySecurities %1,000
BELGIUM T-BILL -12 19/04U 7,000,000 EUR 6,962.96 11.73
FINLAND 4.25 07-12 15/09A 7,000,000 EUR 7,211.75 12.16Finland 7,211.75 12.16
NETHERLANDS 2.50 09-12 15/01A 6,002,000 EUR 6,007.10 10.13The Netherlands 6,007.10 10.13
ADA ES INC 137,500 USD 2,398.03 4.03
Shares 5,026.45 8.47USA 3,367.09 5.67
SOLAZYME INC 21,200 USD 194.34 0.33STR HOLDINGS 122,200 USD 774.72 1.31
HUANENG RENEWABLES CORPORATIONLTD-H-
5,404,000 HKD 1,029.11 1.73China 1,029.11 1.73
ECOSYNTHETIX INC 120,100 CAD 454.29 0.77Canada 454.29 0.77
CHINA METAL RECYCLING HOLDINGS 211,200 HKD 175.96 0.30Cayman Islands 175.96 0.30
Total securities 53,422.09 90.06
Other assets 5,896.52 9.94
Net Asset Value 59,318.62 100.00
EUR
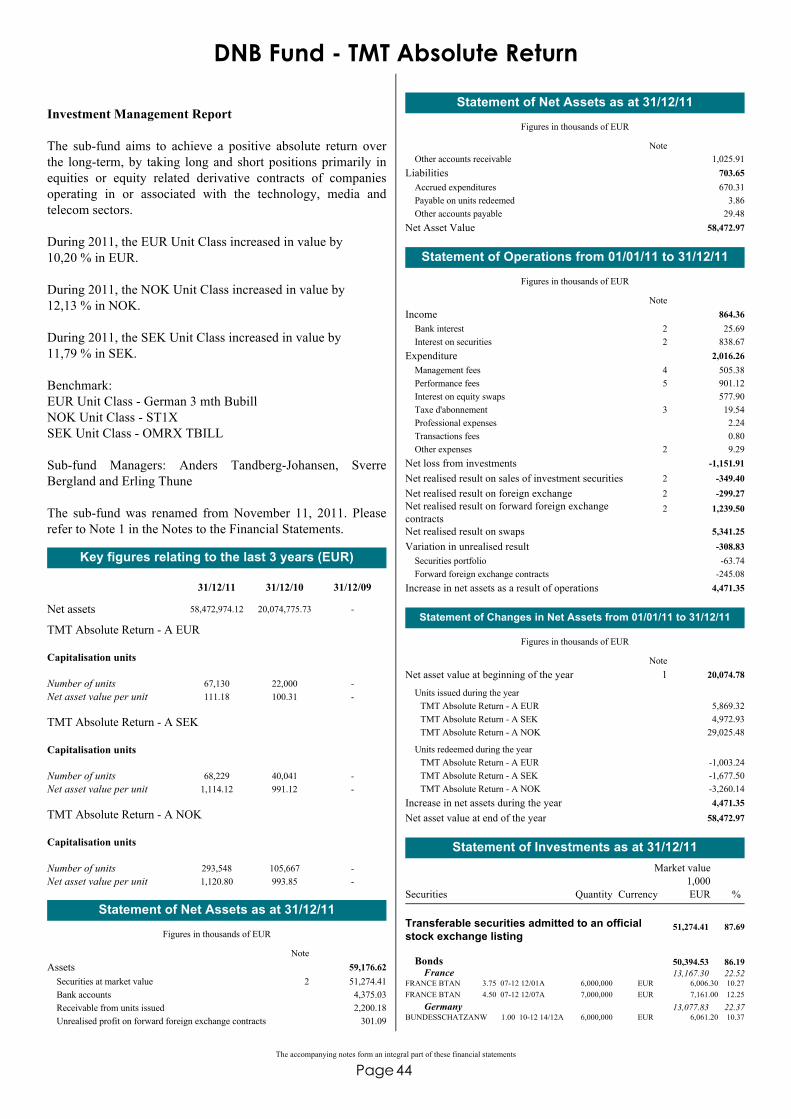
44The accompanying notes form an integral part of these financial statements
Page
DNB Fund - TMT Absolute Return
Investment Management Report
The sub-fund aims to achieve a positive absolute return overthe long-term, by taking long and short positions primarily inequities or equity related derivative contracts of companiesoperating in or associated with the technology, media andtelecom sectors.
During 2011, the EUR Unit Class increased in value by 10,20 % in EUR.
During 2011, the NOK Unit Class increased in value by 12,13 % in NOK.
During 2011, the SEK Unit Class increased in value by 11,79 % in SEK.
Benchmark: EUR Unit Class - German 3 mth Bubill NOK Unit Class - ST1X SEK Unit Class - OMRX TBILL
Sub-fund Managers: Anders Tandberg-Johansen, SverreBergland and Erling Thune
The sub-fund was renamed from November 11, 2011. Pleaserefer to Note 1 in the Notes to the Financial Statements.
Key figures relating to the last 3 years (EUR)
Net assets
31/12/11 31/12/10 31/12/09
58,472,974.12 20,074,775.73 -
Number of unitsNet asset value per unit
Capitalisation units
67,130111.18
22,000100.31
--
TMT Absolute Return - A EUR
Number of unitsNet asset value per unit
Capitalisation units
68,2291,114.12
40,041991.12
--
TMT Absolute Return - A SEK
Number of unitsNet asset value per unit
Capitalisation units
293,5481,120.80
105,667993.85
--
TMT Absolute Return - A NOK
Assets 59,176.62Securities at market value 51,274.412Bank accounts 4,375.03Receivable from units issued 2,200.18Unrealised profit on forward foreign exchange contracts 301.09
Statement of Net Assets as at 31/12/11
Figures in thousands of EUR
Note
Other accounts receivable 1,025.91Liabilities 703.65
Accrued expenditures 670.31Payable on units redeemed 3.86Other accounts payable 29.48
Net Asset Value 58,472.97
Statement of Net Assets as at 31/12/11
Figures in thousands of EUR
Note
Income 864.36Bank interest 25.692Interest on securities 838.672
Expenditure 2,016.26Management fees 505.384Performance fees 901.125Interest on equity swaps 577.90Taxe d'abonnement 19.543Professional expenses 2.24Transactions fees 0.80Other expenses 9.292
Net loss from investments -1,151.91Net realised result on sales of investment securities -349.402Net realised result on foreign exchange -299.272Net realised result on forward foreign exchangecontracts
1,239.502
Net realised result on swaps 5,341.25Variation in unrealised result -308.83
Securities portfolio -63.74Forward foreign exchange contracts -245.08
Increase in net assets as a result of operations 4,471.35
Statement of Operations from 01/01/11 to 31/12/11
Figures in thousands of EUR
Note
Statement of Changes in Net Assets from 01/01/11 to 31/12/11
Figures in thousands of EUR
Net asset value at beginning of the year 20,074.781
5,869.32TMT Absolute Return - A EUR4,972.93TMT Absolute Return - A SEK
29,025.48TMT Absolute Return - A NOK
Units issued during the year
-1,003.24TMT Absolute Return - A EUR-1,677.50TMT Absolute Return - A SEK-3,260.14TMT Absolute Return - A NOK
Units redeemed during the year
Increase in net assets during the year 4,471.35Net asset value at end of the year 58,472.97
Note
Currency
Market value
QuantitySecurities %1,000
FRANCE BTAN 3.75 07-12 12/01A 6,000,000 EUR 6,006.30 10.27
Transferable securities admitted to an officialstock exchange listing
51,274.41 87.69
Bonds 50,394.53 86.19France 13,167.30 22.52
FRANCE BTAN 4.50 07-12 12/07A 7,000,000 EUR 7,161.00 12.25
BUNDESSCHATZANW 1.00 10-12 14/12A 6,000,000 EUR 6,061.20 10.37Germany 13,077.83 22.37
Statement of Investments as at 31/12/11
EUR
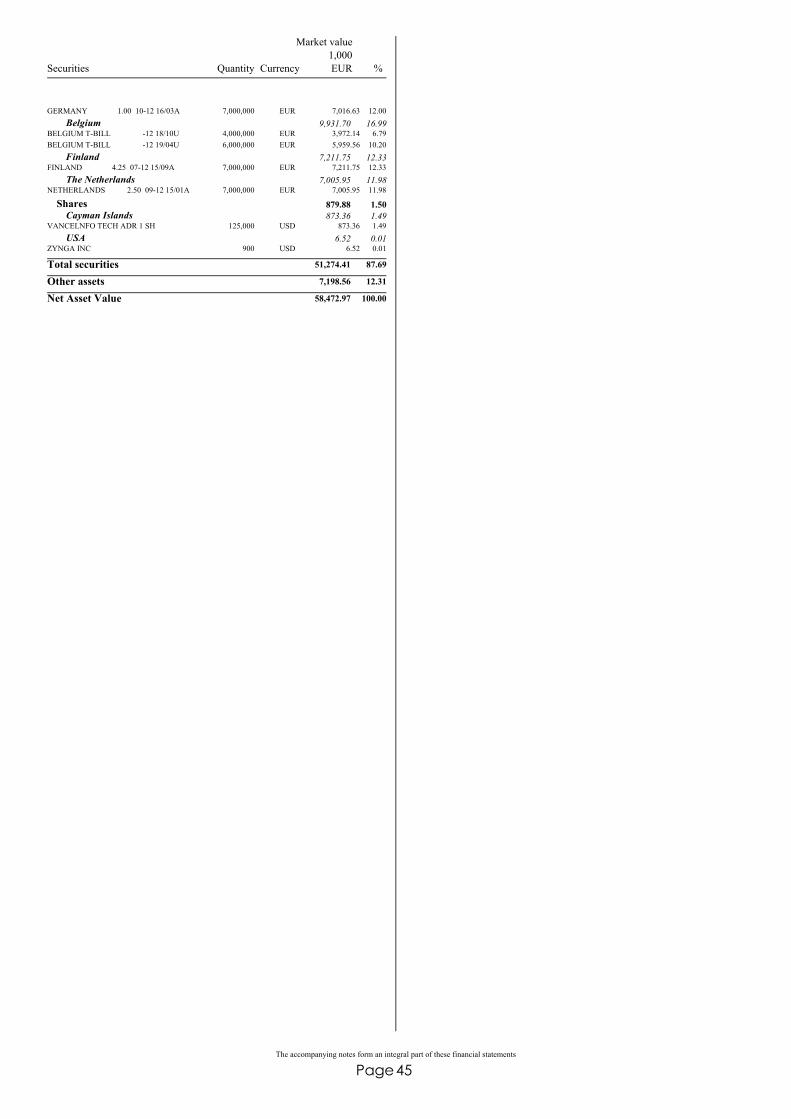
45The accompanying notes form an integral part of these financial statements
Page
Currency
Market value
QuantitySecurities %1,000
GERMANY 1.00 10-12 16/03A 7,000,000 EUR 7,016.63 12.00
BELGIUM T-BILL -12 18/10U 4,000,000 EUR 3,972.14 6.79Belgium 9,931.70 16.99
BELGIUM T-BILL -12 19/04U 6,000,000 EUR 5,959.56 10.20
FINLAND 4.25 07-12 15/09A 7,000,000 EUR 7,211.75 12.33Finland 7,211.75 12.33
NETHERLANDS 2.50 09-12 15/01A 7,000,000 EUR 7,005.95 11.98The Netherlands 7,005.95 11.98
VANCELNFO TECH ADR 1 SH 125,000 USD 873.36 1.49
Shares 879.88 1.50Cayman Islands 873.36 1.49
ZYNGA INC 900 USD 6.52 0.01USA 6.52 0.01
Total securities 51,274.41 87.69
Other assets 7,198.56 12.31
Net Asset Value 58,472.97 100.00
EUR

DNB Fund
Notes to the Financial Statements at December 31, 2011
Page 46
1. General DNB Fund is a Mutual Fund (Fonds Commun de Placement), created on August 31, 1990, and organized under the law of December 20, 2002 relating to undertakings for collective investment until June 30, 2011 and under the law of December 17, 2010 since July 1, 2011. DNB Fund is an unincorporated co-proprietorship of its securities and other assets, managed by DNB Asset Management S.A. (the Management Company, R.C.S. B34518). The assets of the Fund are segregated from those of the Management Company. The following sub-funds are open to subscriptions and redemptions as at December 31, 2011: Equity sub-funds: DNB Fund - Far East DNB Fund - Global SRI DNB Fund - Asian Small Cap DNB Fund - Scandinavia DNB Fund - Global Emerging Markets SRI (renamed on December 16, 2011, formerly Carlson Fund - Global Emerging Markets) DNB Fund - Navigator (renamed on November 11, 2011, formerly Carlson Fund - DnB NOR Navigator) DNB Fund - Technology (renamed on November 11, 2011, formerly Carlson Fund - DnB NOR Technology) DNB Fund - Renewable Energy (renamed on November 11, 2011, formerly Carlson Fund - DnB NOR Renewable Energy) DNB Fund - Private Equity (renamed on November 11, 2011, formerly Carlson Fund - DnB NOR Private Equity) DNB Fund - BRIC DNB Fund - China DNB Fund - China Century DNB Fund - India DNB Fund - Global Value & Momentum (renamed on November 11, 2011, formerly Carlson Fund - DnB NOR Global Value & Momentum) DNB Fund - Global Energy (launched on April 29, 2011 and renamed on November 11, 2011, formerly Carlson Fund - DnB NOR Global Energy) Bond sub-funds: DNB Fund SEK Long Bond DNB Fund SEK Short Bond Alternative investment sub-funds: DNB Fund - ECO Absolute Return (renamed on November 11, 2011, formerly Carlson Fund - DnB NOR ECO Absolute Return) DNB Fund - TMT Absolute Return (renamed on November 11, 2011, formerly Carlson Fund - DnB NOR TMT Absolute Return) The following sub-funds have been merged on December 16, 2011: Absorbed sub-fund Absorbing sub-fund Class Ratio DNB Fund - Europe DNB Fund - Global SRI C 0.415184DNB Fund - North America DNB Fund - Global SRI C 0.986682 The annual financial statements of the Fund include a consolidation of all the sub-funds. These combined figures are expressed in “Euro” (EUR), all figures expressed in another currency being converted into EUR on the basis of the average rate of the last known bid and offer rates. Differences in additions in this annual report, if any, are due to rounding.

DNB Fund
Notes to the Financial Statements at December 31, 2011
Page 47
1. General (cont'd) As at December 31, 2011 the exchange rates between the EUR and the following currencies of the Fund are:
7.7473 NOK 1 EUR 8.89925 SEK 1 EUR 1.29815 USD 1 EUR
For each sub-fund, the net asset value at the beginning of the year is converted into EUR on the basis of the exchange rates used at December 31, 2010. The exchange differences between the net asset value at the beginning of the year converted at the exchange rates used at December 31, 2010 and the exchange rates used at December 31, 2011 are included in the “Reevaluation of opening combined NAV” in the statement of changes in net assets on Page 7.
2. Summary of significant accounting policies Presentation of the financial statements The financial statements are prepared in accordance with Luxembourg regulations relating to undertaking for collective investments. Valuation of investments The value of assets which are listed or dealt in on any stock exchange is based on the last available price on the stock exchange which is normally the principal market for such assets. The value of assets dealt in on any other Regulated Market is based on the last available price. In the event that any assets are not listed or dealt in on any stock exchange or on any other Regulated Market, or if, with respect to assets listed or dealt in on any stock exchange, or other Regulated Market as aforesaid, the price as determined pursuant to the two paragraphs above is not representative of the fair market value of the relevant assets, the value of such assets will be based on the reasonably foreseeable sales price determined prudently and in good faith. Units or shares of open-ended UCI will be valued at their last determined and available net asset value or, if such price is not representative of the fair market value of such assets, then the price shall be determined by the Board of Directors on a fair and equitable basis. Units or shares of a closed-ended UCI will be valued at their last available stock market value. The liquidating value of futures, forward foreign exchange contracts or options contracts not traded on exchanges or on other Regulated Markets shall mean their net liquidating value determined, pursuant to the policies established by the Board of Directors, on a basis consistently applied for each different variety of contracts. The liquidating value of futures, forward foreign exchange contracts or options contracts traded on exchanges or on other Regulated Markets shall be based upon the last available settlement prices of these contracts on exchanges and Regulated Markets on which the particular futures, forward or options contracts are traded by the Fund; provided that if a futures, forward or options contract could not be liquidated on the day with respect to which net assets are being determined, the basis for determining the liquidating value of such contract shall be such value as the Board of Directors may deem fair and reasonable. Net unrealised gains and losses on forward foreign exchange contracts and futures are disclosed in the statements of net assets under the heading “Unrealised profit on forward foreign exchange contracts” and “Unrealised profit on financial futures”. The Management Company is authorised to adopt other realistic valuation principles for assets of the Fund where circumstances make the determination of values according to the criteria specified above non realistic, impossible or inadequate. Especially in case of major changes in market conditions, the valuation basis of the different investments may be adjusted to the new market yields.
DNB Fund
Notes to the Financial Statements at December 31, 2011
Page 48
2. Summary of significant accounting policies (cont'd) Realised profit and loss on investments The profits and losses on sales of investments have been determined on the basis of average cost. Foreign exchange The market value of the investments and other assets and liabilities expressed in currencies other than the reporting currency of the related sub-fund, have been converted at the rates of exchange prevailing at the end of the year. The cost of investments in currencies other than the reporting currency of the related sub-fund has been converted at the rates of exchange prevailing at the date of purchase. Exchange profits and losses resulting from the sale of investments are taken to the statement of operations in the account “net realised result on foreign exchange”. Swaps Swaps are valued according to the mark-to-market method and verified against the value from the counterparty. The Fund accrues for interim payments on swap contracts on a daily basis. End of each month, interim payments are settled in cash. The payment flows are netted against each other, with the difference being paid by one party to the other. The net amount is recorded as realised results on swaps and are included in the account "Net realised result on swaps" in the statement of operations. Securities lending Each sub-fund may only lend securities through a standardized lending system organized by a recognized clearing institution or through a first class financial institution specializing in this type of transaction. As part of lending transactions, each sub-fund must receive collateral as guarantee. Such collateral, received in the form of liquid assets and/or securities issued or guaranteed by a member state of the OECD, or by their local authorities, or by supranational institutions and undertakings of a community, regional or world-wide nature, must at the conclusion of the contract be at least equal to the total market value of the securities lent. Income from investments Dividends are recognised as income on the date securities are first quoted ex-dividend, to the extent information thereon is reasonably available to the Fund. Interest income is accrued on a daily basis i.e. on every valuation day. Dividends and interest income are recorded net of withholding tax.
3. Tax status The Fund is registered under Luxembourg law as a Mutual Investment Fund ("Fonds Commun de Placement"). Accordingly, the Fund is not subject to any tax on income or capital gains. However, the Fund is subject to an annual "taxe d'abonnement" calculated at the annual rate of 0.05% p.a. of the net asset value of the Fund at the end of each quarter. The sub-fund DNB Fund SEK Short Bond and the institutional share class of the sub-fund DNB Fund SEK Long Bond benefit from the reduced rate of "taxe d'abonnement" at the annual rate of 0.01% p.a. of their net asset value at the end of each quarter. This tax is payable quarterly.
DNB Fund
Notes to the Financial Statements at December 31, 2011
Page 49
4. Management fees The Management Company is entitled to a fee, payable at the end of each month and calculated on the average net asset value (“NAV”) during the month. The annual rate of the fee is/was:
- 1.25% p.a. for the sub-funds DNB Fund - Far East, DNB Fund - Global SRI, DNB Fund - North America (until December 16, 2011), DNB Fund - Scandinavia, DNB Fund – Europe (until December 16, 2011);
- 1.75% p.a. for the sub-funds DNB Fund - Asian Small Cap, DNB Fund - Global Emerging Markets SRI, DNB Fund - Private Equity, DNB Fund - Global Energy;
- 1.50% p.a. for the sub-funds DNB Fund - Navigator, DNB Fund - Technology, DNB Fund - Renewable Energy, DNB Fund - BRIC, DNB Fund - China, DNB Fund - China Century, DNB Fund - India, DNB Fund - Global Value & Momentum, DNB Fund - ECO Absolute Return, DNB Fund - TMT Absolute Return;
- 0.70% p.a. for the sub-fund DNB Fund SEK Long Bond; - 0.35% p.a. for the sub-fund DNB Fund SEK Short Bond.
This fee covers custodian and bookkeeping fees, payable on a monthly basis by the Management Company. For the sub-fund DNB Fund - Global Emerging Markets SRI, specific sub-custodian fees related to certain markets are paid directly to the relevant sub-custodian.
5. Performance fees Performance fees applicable to Equity sub-funds The performance fee is fixed by the Management Company and is a percentage of the excess yield in relation to the sub-fund’s benchmark index over the period. The performance fee is calculated and accrued daily and paid out of the sub-funds at the end of each year. The performance fee is payable only if the sub-fund’s performance exceeds that of the sub-fund’s benchmark index. A performance fee could therefore be paid even if the net asset value per unit has decreased. If during a given period, the sub-fund has a performance which is lower than the performance of the benchmark (i.e. a relative underperformance), such underperformance must be taken into consideration the following period as long as the performance of the sub-fund has not recovered the underperformance relative to the benchmark index. The concept of “crystallization” will be applied, meaning that the performance fee due to the Management Company is precisely determined (accrued or “crystallized”) at any time, in order to ensure that an investor applying for the redemption of his units within a certain period nevertheless pays an adequate portion of the performance fee due at the end of the relevant year. The sub-fund performance will be determined on the basis of the change in NAV per unit (before any performance fee accruals and before computation and subsequent subtraction of the management fees). Performance fees, if any, will be accrued daily based on the number of units in issue on that particular day. Performance fees applicable to Alternative investment sub-funds The performance fee is calculated and reserved on a daily basis and paid by the respective sub-fund to the Management Company at the end of each month. Any eventual performance fee is payable only if the respective sub-fund’s performance exceeds the previous highest NAV, adjusted for movements in the respective index (index-adjusted high watermark). Any eventual underperformance in relation to the index will be transferred from one day to the next until such underperformance has been recovered i.e. there will be no periodic reset of underperformance.
DNB Fund
Notes to the Financial Statements at December 31, 2011
Page 50
5. Performance fees (continued) When calculating the eventual performance fee, the respective sub-fund’s performance will be determined on the basis of the change in NAV per unit, after the deduction of the fixed management fee. The performance fee, if any, will be calculated and reserved based on the number of units in issue on that particular day. A performance fee could be paid to the Management Company at the end of any given month, even if the NAV per unit in the respective sub-fund has decreased during the month. For the following sub-funds, in addition of management fees, a performance fee as described above could be levied. It amounts to 20% of the excess yield in relation to the sub-fund’s benchmark index. The benchmarks for the sub-funds are:
Sub-funds Benchmark DNB Fund - Navigator 50% OSE101010 / 50% OSE203030 DNB Fund - Technology 66% MSCI Technology, 12% MSCI Media and 22% MSCI Telecom DNB Fund - Renewable Energy NEXUST - Wilderhill New Energy Global Innovation Index DNB Fund - BRIC MSCI Daily TR Net Emerging Markets BRIC DNB Fund - China MSCI Daily TR Net Emerging Markets China DNB Fund - China Century MSCI Daily TR Net Emerging Markets China DNB Fund - India MSCI Daily TR Net Emerging Markets India DNB Fund - ECO Absolute Return ST1X for the Unit Class in NOK OMRX TBILL for the Unit Class in SEK German 3 months Bubill for the Unit Class in EUR DNB Fund - TMT Absolute Return ST1X for the Unit Class in NOK OMRX TBILL for the Unit Class in SEK German 3 months Bubill for the Unit Class in EUR
6. Dividend distributed The Board of Directors of the Management Company decided to pay the following dividends for the year ended December 31, 2011: Amount of dividends: DNB Fund SEK Long Bond 0.3654 SEK per unit B DNB Fund SEK Short Bond 0.1500 SEK per unit B Ex-Dividend Date: 26/10/2011 Payment Date: 28/10/2011

DNB Fund
Notes to the Financial Statements at December 31, 2011
Page 51
7. Forward Foreign Exchange Contracts – Open positions as at 31/12/2011 As at December 31, 2011, outstanding forward foreign exchange contracts were as follows: DNB Fund - ECO Absolute Return:
Buy Sell Maturity Unrealised appreciation/depreciation (EUR)
NOK 286,589,200.00 EUR -36,800,000.00 25/01/12 159,507.85NOK 9,305,880.00 EUR -1,200,000.00 25/01/12 113.11NOK 6,619,545.00 EUR -850,000.00 25/01/12 3,678.80SEK 105,731,730.00 EUR -11,700,000.00 25/01/12 165,314.70SEK 9,002,600.00 EUR -1,000,000.00 25/01/12 10,275.21SEK 2,946,553.50 EUR -330,000.00 25/01/12 659.75
TOTAL 339,549.42 DNB Fund - TMT Absolute Return:
Buy Sell Maturity Unrealised appreciation/depreciation (EUR)
NOK 327,085,500.00 EUR -42,000,000.00 25/01/12 182,047.00SEK 75,909,960.00 EUR -8,400,000.00 25/01/12 118,687.47EUR 330,000.00 SEK -2,966,700.00 25/01/12 -2,923.59SEK 2,969,868.00 EUR -330,000.00 25/01/12 3,279.58
TOTAL 301,090.46
8. Futures Contracts – Open positions as at 31/12/2011 As at December 31, 2011, outstanding futures contracts were as follows: DNB Fund - Global Value & Momentum:
Description Maturity Quantity Currency Commitment Unrealised appreciation/(depreciation)
S&P 500 Index 03/2012 40 USD 2,505,200.00 47,660.00
DNB Fund
Notes to the Financial Statements at December 31, 2011
Page 52
9. Swaps – Open positions as at 31/12/2011 DNB Fund - ECO Absolute Return - Long positions
Underlying Quantity of underlying shares
Currency Notional in contract currency
NEO MATERIAL TECHNOLOGIES 50,300 CAD 370,273.39 ABENGOA S.A. 71,046 EUR 1,165,154.40 ACCIONA SA 19,029 EUR 1,269,805.17 ADVANCED METTALLURGICAL-W/1 125,269 EUR 952,044.40 CIE DE SAINT GOBAIN 37,441 EUR 1,110,687.27 EDP RENOVAVEIS SA 280,589 EUR 1,326,624.79 FORTUM CORPORATION 24,833 EUR 409,496.17 KINGSPAN GROUP PLC 91,520 EUR 582,067.20 LANDI RENZO SPA 678,137 EUR 828,005.28 NEXANS SA 60,107 EUR 2,410,290.70 NORMA GROUP 92,020 EUR 1,472,320.00 OEST ELEKTRIZITATSWIRTS-A 53,242 EUR 1,103,972.87 PRYSMIAN SPA 235,803 EUR 2,262,529.79 PSI AG 64,661 EUR 951,809.92 PVA TEPLA AG 64,609 EUR 198,349.63 PURSUIT DYNAMICS 144,249 GBP 96,646.83 SIG PLC 1,042,744 GBP 875,904.96 UMECO PLC 207,280 GBP 743,617.00 CHAOWEI POWER HOLDINGS LTD 1,167,000 HKD 3,746,070.00 CHINA METAL RECYCLING 2,082,600 HKD 17,493,840.00 CHINA SUNTIEN GREEN ENERGY-H 7,054,000 HKD 9,593,440.00 COSLIGHT TECHNOLOGY INTL GP 456,000 HKD 866,400.00 LEOCH INTERNATIONAL TECH 1,328,000 HKD 2,549,760.00 TIANNENG POWER INTL LTD 3,606,000 HKD 12,621,000.00 WASION GROUP HOLDINGS LTD 2,704,000 HKD 6,219,200.00 XINYI GLASS HOLDINGS CO LTD 2,018,000 HKD 9,000,280.00 AMARA RAJA BATTERIES LTD 23,397 INR 89,524.30 PRAJ INDUSTRIES LIMITED 655,363 INR 921,921.13 ASAHI DIAMOND INDUSTRIAL CO 131,500 JPY 122,295,000.00 FURUKAWA ELECTRIC CO LTD 437,000 JPY 77,349,000.00 HITACHI METALS LTD 118,000 JPY 98,766,000.00 HORIBA LTD 90,900 JPY 210,888,000.00 KANTO DENKA KOGYO CO LTD 247,000 JPY 69,901,000.00 NGK INSULATORS LTD 242,000 JPY 221,188,000.00 TANAKA CHEMICAL CORP 41,300 JPY 23,995,300.00 YAMATAKE CORP 11,500 JPY 19,251,000.00
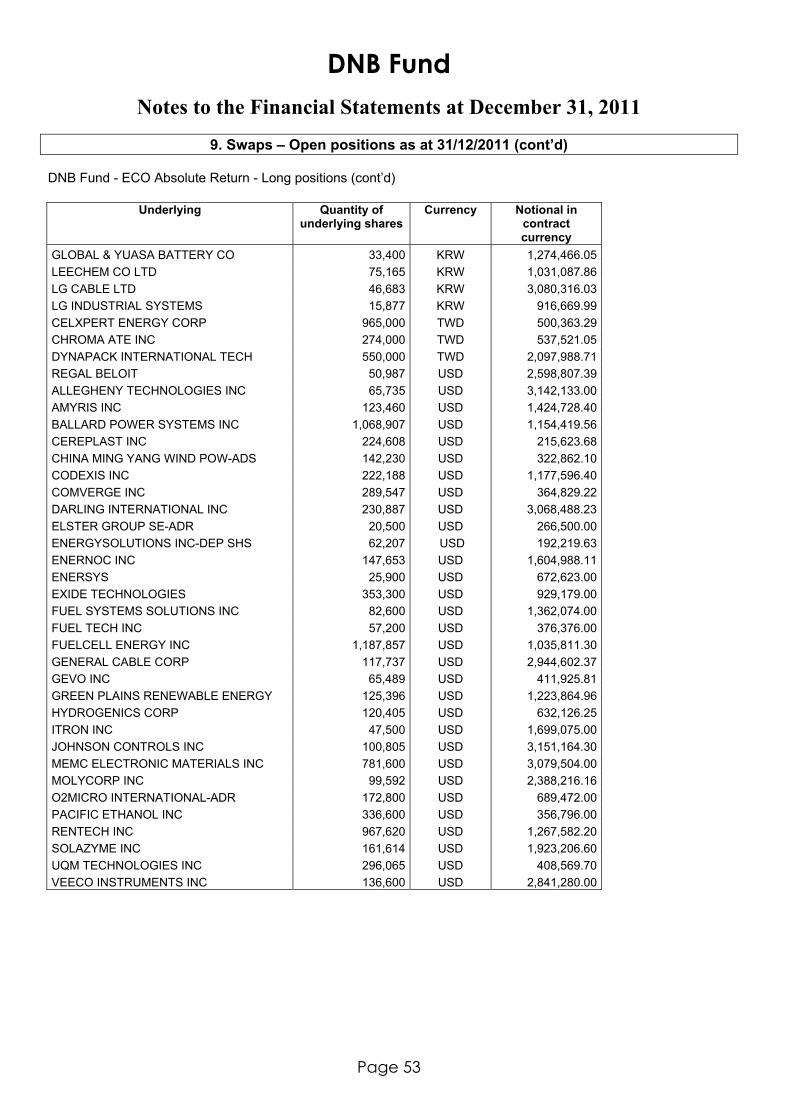
DNB Fund
Notes to the Financial Statements at December 31, 2011
Page 53
9. Swaps – Open positions as at 31/12/2011 (cont’d) DNB Fund - ECO Absolute Return - Long positions (cont’d)
Underlying Quantity of underlying shares
Currency Notional in contract currency
GLOBAL & YUASA BATTERY CO 33,400 KRW 1,274,466.05 LEECHEM CO LTD 75,165 KRW 1,031,087.86 LG CABLE LTD 46,683 KRW 3,080,316.03 LG INDUSTRIAL SYSTEMS 15,877 KRW 916,669.99 CELXPERT ENERGY CORP 965,000 TWD 500,363.29 CHROMA ATE INC 274,000 TWD 537,521.05 DYNAPACK INTERNATIONAL TECH 550,000 TWD 2,097,988.71 REGAL BELOIT 50,987 USD 2,598,807.39 ALLEGHENY TECHNOLOGIES INC 65,735 USD 3,142,133.00 AMYRIS INC 123,460 USD 1,424,728.40 BALLARD POWER SYSTEMS INC 1,068,907 USD 1,154,419.56 CEREPLAST INC 224,608 USD 215,623.68 CHINA MING YANG WIND POW-ADS 142,230 USD 322,862.10 CODEXIS INC 222,188 USD 1,177,596.40 COMVERGE INC 289,547 USD 364,829.22 DARLING INTERNATIONAL INC 230,887 USD 3,068,488.23 ELSTER GROUP SE-ADR 20,500 USD 266,500.00 ENERGYSOLUTIONS INC-DEP SHS 62,207 USD 192,219.63 ENERNOC INC 147,653 USD 1,604,988.11 ENERSYS 25,900 USD 672,623.00 EXIDE TECHNOLOGIES 353,300 USD 929,179.00 FUEL SYSTEMS SOLUTIONS INC 82,600 USD 1,362,074.00 FUEL TECH INC 57,200 USD 376,376.00 FUELCELL ENERGY INC 1,187,857 USD 1,035,811.30 GENERAL CABLE CORP 117,737 USD 2,944,602.37 GEVO INC 65,489 USD 411,925.81 GREEN PLAINS RENEWABLE ENERGY 125,396 USD 1,223,864.96 HYDROGENICS CORP 120,405 USD 632,126.25 ITRON INC 47,500 USD 1,699,075.00 JOHNSON CONTROLS INC 100,805 USD 3,151,164.30 MEMC ELECTRONIC MATERIALS INC 781,600 USD 3,079,504.00 MOLYCORP INC 99,592 USD 2,388,216.16 O2MICRO INTERNATIONAL-ADR 172,800 USD 689,472.00 PACIFIC ETHANOL INC 336,600 USD 356,796.00 RENTECH INC 967,620 USD 1,267,582.20 SOLAZYME INC 161,614 USD 1,923,206.60 UQM TECHNOLOGIES INC 296,065 USD 408,569.70 VEECO INSTRUMENTS INC 136,600 USD 2,841,280.00

DNB Fund
Notes to the Financial Statements at December 31, 2011
Page 54
9. Swaps – Open positions as at 31/12/2011 (cont’d) As at December 31, 2011, outstanding Total Return Equity Swaps contracts were as follows: DNB Fund - ECO Absolute Return - Short positions
Underlying Quantity of underlying shares
Currency Notional in contract currency
BROOKFIELD RENEWABLE ENERGY -62,417 CAD -1,695,245.72 INNERGEX RENEWABLE ENERGY -168,800 CAD -1,738,640.00 NOVOZYMES A/S-B SHARES -104,387 DKK -18,507,815.10 ROCKWOOL INTL A/S-B SHS -35,000 DKK -16,128,000.00 VESTAS WIND SYSTEMS -101,404 DKK -6,287,048.00 ANDRITZ AG -12,131 EUR -777,597.10 CENTROSOLAR GROUP AG -35,870 EUR -46,631.00 CENTROTHERM PHOTOVOLTAICS AG -44,649 EUR -441,801.86 ENEL GREEN POWER SPA -976,777 EUR -1,576,518.08 GAMESA CORP TECNOLOGICA SA -233,681 EUR -750,116.01 PHOENIX SOLAR AG -62,000 EUR -133,300.00 RATIONAL AG -12,034 EUR -2,024,118.80 SGL CARBON AG -32,000 EUR -1,218,880.00 SOLARIA ENERGIA Y MEDIO AMBI -200,000 EUR -193,000.00 SUESS MICROTEC AG -235,396 EUR -1,324,102.50 WACKER CHEMIE AG -11,068 EUR -687,876.20 JOHNSON MATTHEY ORD (1 POUND) -110,717 GBP -2,032,764.12 CHINA SOUTH LOCOMOTIVE - H -667,000 HKD -2,961,480.00 KYOCERA CORP -15,900 JPY -98,421,000.00 MEIDENSHA CORP -764,000 JPY -197,876,000.00 NICHICON CORP -269,800 JPY -209,095,000.00 SANKEN ELECTRIC CO LTD -843,000 JPY -204,006,000.00 SUMITOMO TITANIUM CORP -30,700 JPY -104,533,500.00 TOHO TITANIUM CO LTD -106,600 JPY -141,245,000.00 TORAY INDUSTRIES INC -253,000 JPY -139,403,000.00 TOYO TANSO CO LTD -35,600 JPY -112,852,000.00 OCI CO LTD -5,650 KRW -1,076,727.73 SAMSUNG SDI CO LTD -24,678 KRW -2,860,316.90 SINO-AMERICAN SILICON PRODUCTION -701,259 TWD -1,079,251.94 E-TON SOLAR TECH CO LTD -2,000,000 TWD -845,470.46 EVERLIGHT ELECTRONICS CO LTD -1,104,000 TWD -1,921,490.14 GREEN ENERGY TECHNOLOGY INC -300,000 TWD -337,857.92 NEO SOLAR POWER CORP -3,257,000 TWD -2,049,138.02 SOLARTECH ENERGY CORP -1,052,200 TWD -1,025,129.63 TEKCORE CO LTD -690,000 TWD -303,081.34 UNITY OPTO TECHNOLOGY CO LTD -3,387,000 TWD -2,807,678.59 WAFER WORKS CORP -3,304,000 TWD -2,024,148.75

DNB Fund
Notes to the Financial Statements at December 31, 2011
Page 55
9. Swaps – Open positions as at 31/12/2011 (cont’d) DNB Fund - ECO Absolute Return - Short positions (cont’d)
Underlying Quantity of underlying shares
Currency Notional in contract currency
BRIGHT LED ELECTRONICS CORP -600,000 TWD -458,733.78 DANEN TECHNOLOGY CORP -3,396,000 TWD -1,716,001.19 EPISTAR CORP -1,000,000 TWD -2,123,584.00 GINTECH ENERGY CORP -950,000 TWD -1,024,389.84 MOTECH INDUSTRIES INC -604,000 TWD -1,059,229.17 POWERCOM CO LTD -1,282,930 TWD -612,250.69 ORMAT TECHNOLOGIES INC -81,100 USD -1,462,233.00 BROADWIND ENERGY INC -520,199 USD -353,735.32 ECHELON CORP -14,312 USD -69,699.44 FMC CORPORATION -35,528 USD -3,056,829.12 HEXCEL CORP -128,580 USD -3,112,921.80 QUANTA SERVICES INC -16,700 USD -359,718.00 AEROVIRONMENT INC -97,595 USD -3,071,314.65 AMERESCO INC-CL A -88,700 USD -1,216,964.00 BADGER METER INC -52,945 USD -1,558,171.35 BORG-WARNER AUTOMOTIVE INC -26,709 USD -1,702,431.66 CAPSTONE TURBINE CORP COM -450,000 USD -522,000.00 CLARCOR INC -30,700 USD -1,534,693.00 COVANTA HOLDING CORP -32,800 USD -449,032.00 CREE INC -121,600 USD -2,680,064.00 EMCORE CORP -457,412 USD -394,426.37 FRONTIER COMMUNICATIONS CORP -34,200 USD -176,130.00 INTERNATIONAL RECTIFIER CORP -87,839 USD -1,705,833.38 IXYS CORPORATION -82,900 USD -897,807.00 JA SOLAR HOLDINGS CO LTD-ADR -365,300 USD -489,502.00 MAXWELL TECHNOLOGIES INC -71,500 USD -1,161,160.00 METABOLIX INC -229,800 USD -1,045,590.00 POLYPORE INTERNATIONAL INC -57,398 USD -2,524,938.02 POWER INTEGRATIONS INC -93,900 USD -3,113,724.00 RENESOLA LTD-ADR -49 USD -74.97 ROPER INDUSTRIES INC -35,519 USD -3,085,535.53 UNIVERSAL DISPLAY CORP -39,200 USD -1,438,248.00 YINGLI GREEN ENERGY HOLD-ADR -303,500 USD -1,153,300.00 ZOLTEK COMPANIES INC -323,882 USD -2,467,980.84 The counterparty to the above swap is Credit Suisse Securities (Europe) Limited and the other leg is libor 1 month of the corresponding currency of the underlying equity adjusted by a spread.

DNB Fund
Notes to the Financial Statements at December 31, 2011
Page 56
9. Swaps – Open positions as at 31/12/2011 (cont’d) DNB Fund - TMT Absolute Return - Long positions
Underlying Quantity of underlying shares
Currency Notional in contract currency
ASTRAL MEDIA INC 14,100 CAD 464,031.00 NEO MATERIAL TECHNOLOGIES 50,300 CAD 370,273.39 RESEARCH IN MOTION 78,400 CAD 1,370,501.41 ROGERS COMMUNICATIONS -CL B 25,400 CAD 960,374.00 LOGITECH INTERNATIONAL-REG 433,406 CHF 3,179,033.01 ADVA AG OPTICAL NETWORKING 202,108 EUR 732,641.50 ALCATEL ALSTHOM CIE 707,717 EUR 854,214.42 DRILLISCH AG 36,657 EUR 260,741.24 GAMELOFT 560,625 EUR 2,713,425.00 NOKIA OYJ 672,285 EUR 2,535,859.02 PARROT SA 11,684 EUR 202,600.56 TOMTOM 104,239 EUR 318,137.43 UBISOFT ENTERTAINMENT 148,130 EUR 765,980.23 WIRECARD AG 39,441 EUR 489,857.22 COLT GROUP SA 227,747 GBP 207,591.39 PEARSON PLC ORD (25P) 35,043 GBP 424,020.30 NINTENDO CO LTD 4,500 JPY 47,700,000.00 BOUVET ASA 90,986 NOK 6,369,020.00 OPERA SOFTWARE ASA 607,569 NOK 17,680,257.90 RENEWABLE ENERGY CORP ASA 2,994,658 NOK 9,942,264.56 BETSSON -B- 33,674 SEK 5,101,611.00 ACTIVISION BLIZZARD INC 116,500 USD 1,435,280.00 ADOBE SYS INC 1,596 USD 45,118.92 APPLE COMPUTER INC 2,600 USD 1,053,000.00 CAMELOT INFORMATION SYS-ADS 31,745 USD 90,473.25 CISCO SYSTEMS INC 38,663 USD 699,027.04 CORNING INC 136,300 USD 1,769,174.00 DELL INC 145,431 USD 2,127,655.53 E M C CORP MASS 65,600 USD 1,413,024.00 GOOGLE INC-CL A 10,366 USD 6,695,399.40 HEWLETT PACKARD CO 36,243 USD 933,619.68 HISOFT TECHNOLOGY INT-ADR 276,632 USD 2,553,313.36 ISOFTSTONE HOLDINGS LTD-ADS 82,400 USD 721,000.00 JUNIPER NETWORKS INC 38,000 USD 775,580.00 LEXMARK INTL GROUP CLASS A 50,078 USD 1,656,079.46 LIBERTY GLOBAL INC-SERIES C 6,802 USD 268,815.04 MEMC ELECTRONIC MATERIALS INC 83,800 USD 330,172.00 MICROSOFT CORP 162,832 USD 4,227,118.72 NETGEAR INC 16,079 USD 539,772.03 O2MICRO INTERNATIONAL-ADR 69,300 USD 276,507.00 OCLARO INC 393,178 USD 1,108,761.96 ORACLE SYSTEMS CORP 55,200 USD 1,415,880.00 SEAGATE TECHNOLOGY 62,000 USD 1,016,800.00 TIME WARNER CABLE-W/1 28,900 USD 1,837,173.00 WESTERN DIGITAL CORP 10,700 USD 331,165.00 YAHOO INC 195,680 USD 3,156,318.40

DNB Fund
Notes to the Financial Statements at December 31, 2011
Page 57
9. Swaps – Open positions as at 31/12/2011 (cont’d) DNB Fund - TMT Absolute Return - Short positions
Underlying Quantity of underlying shares
Currency Notional in contract currency
DASSAULT SYSTEMES SA -35,588 EUR -2,203,964.84 ELISA CORP -105,042 EUR -1,694,327.46 SANOMAWSOY OYJ -41,515 EUR -368,030.48 TELEFONICA SA -126,261 EUR -1,690,003.49 TIETOENATOR -44,989 EUR -494,879.00 ARM HOLDINGS PLC -166,000 GBP -982,720.00 SCHIBSTED ASA -48,354 NOK -7,199,910.60 MODERN TIMES GROUP -B SHS -7,085 SEK -2,329,548.00 TELE2 AB SER B -119,706 SEK -16,028,633.40 3D SYSTEMS CORP -181,100 USD -2,607,840.00 ACCENTURE PLC -59,411 USD -3,162,447.53 AMAZON.COM INC -13,600 USD -2,354,160.00 AT&T INC -20,300 USD -613,872.00 AUTOMATIC DATA PROCESSING INC -58,400 USD -3,154,184.00 AVAGO TECHNOLOGIES LTD -35,800 USD -1,033,188.00 BROADCOM CORPORATION CLASS A -11,900 USD -349,384.00 DISCOVERY COMMUNICATIONS -A -16,500 USD -676,005.00 EQUINIX INC -6,798 USD -689,317.20 F5 NETWORKS INC -12,400 USD -1,315,888.00 FRONTIER COMMUNICATIONS CORP -435,800 USD -2,244,370.00 GARMIN LTD -26,000 USD -1,035,060.00 INTEL CORP -72,700 USD -1,762,975.00 INTERNATIONAL BUSINESS MACHS -35,550 USD -6,536,934.00 NETAPP INC -2 USD -72.54 NXP SEMICONDUCTORS NV -106,600 USD -1,638,442.00 PAYCHEX INC -105,069 USD -3,163,627.59 RIVERBED TECHNOLOGY INC -37,200 USD -874,200.00 SANDISK CORP -36,300 USD -1,786,323.00 SPRINT CORPORATION -500,000 USD -1,170,000.00 TEXAS INSTRUMENTS INC -110,900 USD -3,228,299.00 VERIZON COMMUNICATIONS -80,963 USD -3,248,235.56 VMWARE INC-CLASS A -18,038 USD -1,500,581.22 The counterparty to the above swap is Credit Suisse Securities (Europe) Limited and the other leg is libor 1 month of the corresponding currency of the underlying equity adjusted by a spread.
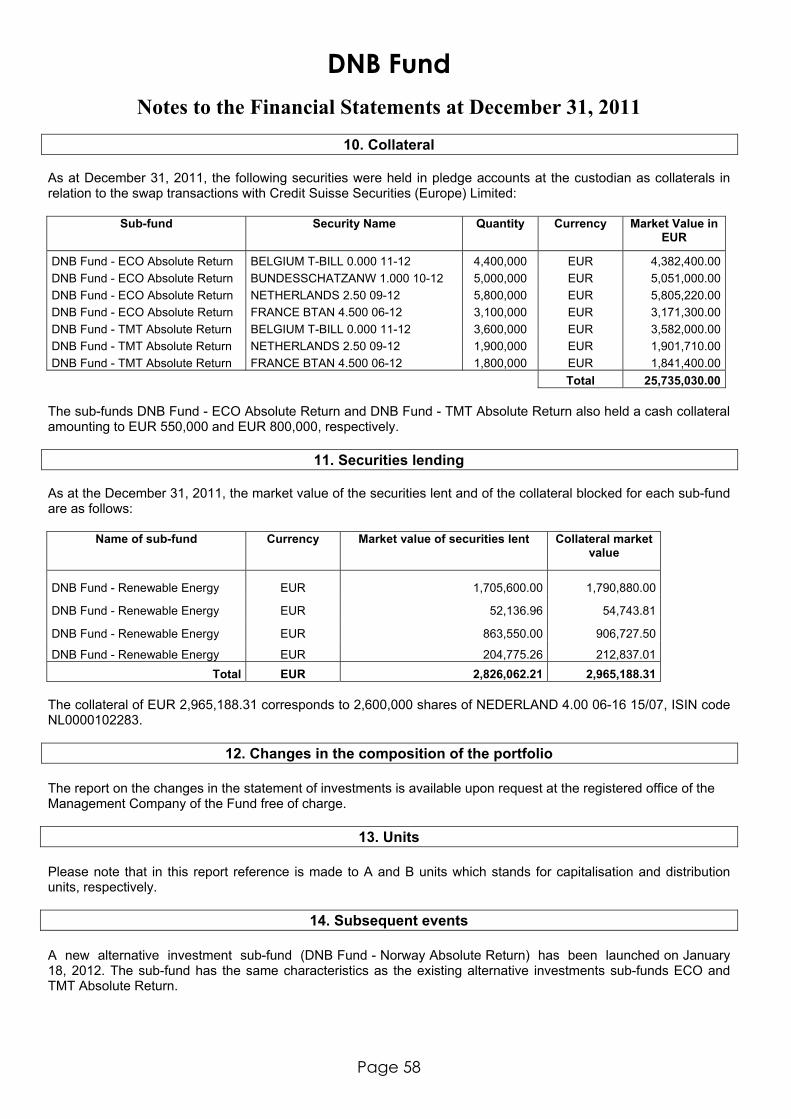
DNB Fund
Notes to the Financial Statements at December 31, 2011
Page 58
10. Collateral As at December 31, 2011, the following securities were held in pledge accounts at the custodian as collaterals in relation to the swap transactions with Credit Suisse Securities (Europe) Limited:
Sub-fund Security Name Quantity Currency Market Value in EUR
DNB Fund - ECO Absolute Return BELGIUM T-BILL 0.000 11-12 4,400,000 EUR 4,382,400.00DNB Fund - ECO Absolute Return BUNDESSCHATZANW 1.000 10-12 5,000,000 EUR 5,051,000.00DNB Fund - ECO Absolute Return NETHERLANDS 2.50 09-12 5,800,000 EUR 5,805,220.00DNB Fund - ECO Absolute Return FRANCE BTAN 4.500 06-12 3,100,000 EUR 3,171,300.00DNB Fund - TMT Absolute Return BELGIUM T-BILL 0.000 11-12 3,600,000 EUR 3,582,000.00DNB Fund - TMT Absolute Return NETHERLANDS 2.50 09-12 1,900,000 EUR 1,901,710.00DNB Fund - TMT Absolute Return FRANCE BTAN 4.500 06-12 1,800,000 EUR 1,841,400.00 Total 25,735,030.00 The sub-funds DNB Fund - ECO Absolute Return and DNB Fund - TMT Absolute Return also held a cash collateral amounting to EUR 550,000 and EUR 800,000, respectively.
11. Securities lending As at the December 31, 2011, the market value of the securities lent and of the collateral blocked for each sub-fund are as follows:
Name of sub-fund Currency Market value of securities lent Collateral market value
DNB Fund - Renewable Energy EUR 1,705,600.00 1,790,880.00
DNB Fund - Renewable Energy EUR 52,136.96 54,743.81
DNB Fund - Renewable Energy EUR 863,550.00 906,727.50
DNB Fund - Renewable Energy EUR 204,775.26 212,837.01Total EUR 2,826,062.21 2,965,188.31
The collateral of EUR 2,965,188.31 corresponds to 2,600,000 shares of NEDERLAND 4.00 06-16 15/07, ISIN code NL0000102283.
12. Changes in the composition of the portfolio The report on the changes in the statement of investments is available upon request at the registered office of the Management Company of the Fund free of charge.
13. Units Please note that in this report reference is made to A and B units which stands for capitalisation and distribution units, respectively.
14. Subsequent events A new alternative investment sub-fund (DNB Fund - Norway Absolute Return) has been launched on January 18, 2012. The sub-fund has the same characteristics as the existing alternative investments sub-funds ECO and TMT Absolute Return.

DNB Fund
Additional information (unaudited)
Page 59
1. Investors’ Rights against the Fund The Management Company draws the investors’ attention to the fact that any investor will only be able to fully exercise his investor rights directly against the Fund if the investor is registered himself and in his own name in the unitholder’s register of the Fund. In cases where an investor invests in the Fund through an intermediary investing into the Fund in his own name but on behalf of the investor, it may not always be possible for the investor to exercise certain unitholder rights directly against the Fund. Investors are advised to take advice on their rights.
2. Global exposure calculation method
The commitment approach The following sub-funds use the commitment approach in order to monitor and measure the global exposure: DNB Fund - Far East DNB Fund - Global SRI DNB Fund - North America DNB Fund - Asian Small Cap DNB Fund - Scandinavia DNB Fund - Europe DNB Fund - Global Emerging Markets SRI DNB Fund - Navigator DNB Fund - Technology DNB Fund - Renewable Energy DNB Fund - Private Equity DNB Fund - BRIC DNB Fund - China DNB Fund - China Century DNB Fund - India DNB Fund - Global Value & Momentum DNB Fund - Global Energy DNB Fund SEK Long Bond DNB Fund SEK Short Bond The absolute VaR approach The following sub-funds use the absolute Value at Risk (VaR) approach in order to monitor and measure the global exposure. The limit is set at 20%. The utilisation of the VaR limits during the financial year was as follows:
Lowest utilisation Highest
utilisation Average
utilisation DNB Fund - Eco Absolute Return 6.80% 14.90% 9.80% DNB Fund - TMT Absolute Return 3.90% 8.60% 5.60% The VaR figures have been calculated based on the following input data:
Model used Confidence level Holding period Length of
data history
DNB Fund - Eco Absolute Return Historical
Simulations 99.00% 20 days 1 year
DNB Fund - TMT Absolute Return Historical
Simulations 99.00% 20 days 1year
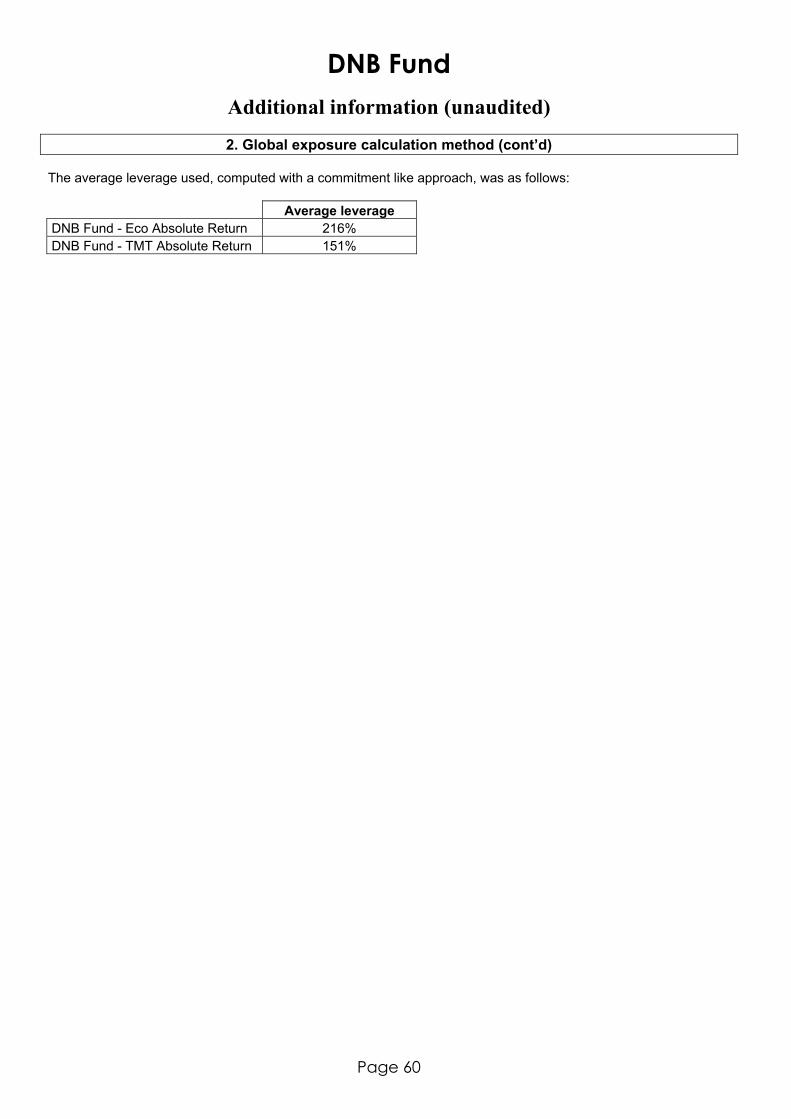
DNB Fund
Additional information (unaudited)
Page 60
2. Global exposure calculation method (cont’d) The average leverage used, computed with a commitment like approach, was as follows: Average leverage DNB Fund - Eco Absolute Return 216% DNB Fund - TMT Absolute Return 151%

DNB Asset Management S.A.5, Allée Schefferl-2520 luXeMBouRGluXeMBouRGtel: +352 45 49 45 1e-mail: [email protected]
DNB Asset Management ASn-0021 oslonoRWAYOffice: Øvre Slottsgate 3tel: +47 915 03 000Fax: +47 22 31 98 70
DNB Asset Management (Asia) Ltd.3305-6 The Center99 Queen´s Road CentralHonG KonGtel: +852 28 68 29 11Fax: +852 26 19 02 55
DNB Asset Management ABSE-105 88 StockholmKungsgatan 18SWeDentel: +46 8 473 4100e-mail: [email protected]
DNB Asset Management ASp.o. Box 7515, n-5020 BergennoRWAYtel: +47 55 21 10 00Fax: +47 55 26 06 99
DNB Investment Advisory Services (India) Private Ltd.GB-Reflections, New No. 2Leith Castle Center StreetSanthome High Road, Chennai - 600 028InDIAtel: +91 44 4210 0982Fax: +91 44 2461 0140