dnb fund fund - eco absolute return 37 dnb fund - tmt absolute return 39 ... in case of difference...
TRANSCRIPT
AnnuAl RepoRt 2014
DnB FunD
R.C.S LUXEMBOURG B 34.518
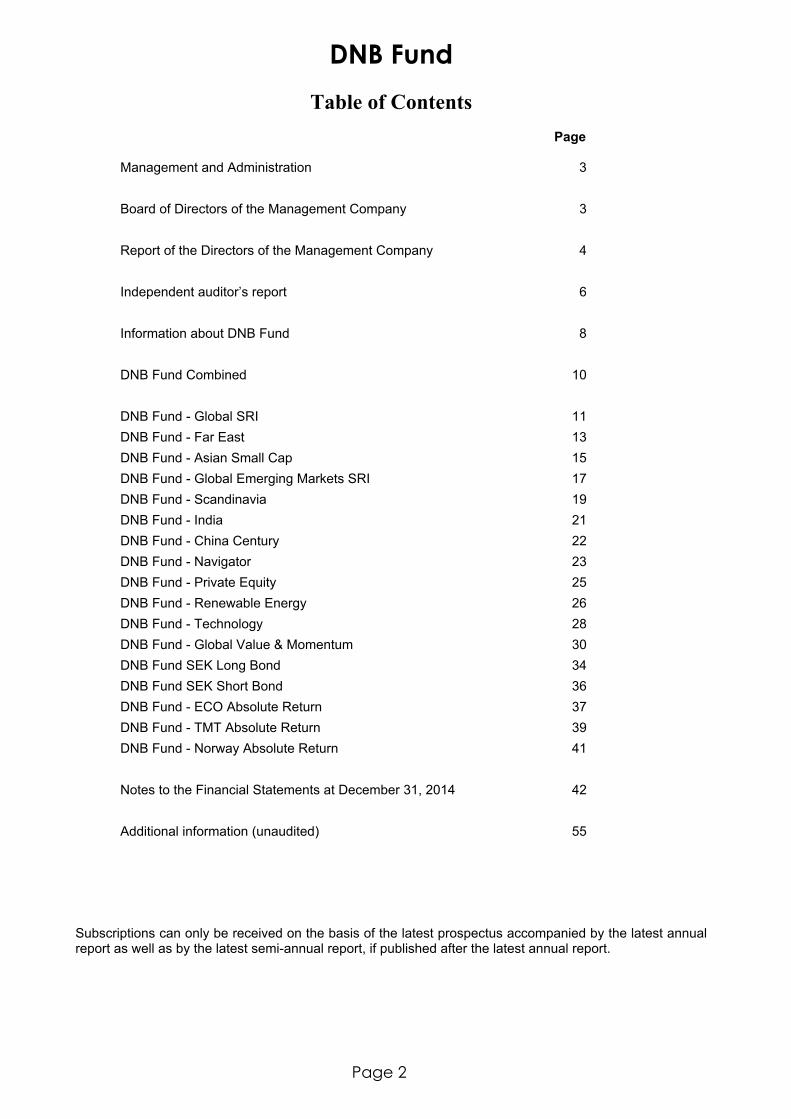
DNB Fund
Table of Contents
Page 2
Page
Management and Administration 3 Board of Directors of the Management Company 3 Report of the Directors of the Management Company 4 Independent auditor’s report 6 Information about DNB Fund 8 DNB Fund Combined 10 DNB Fund - Global SRI 11 DNB Fund - Far East 13 DNB Fund - Asian Small Cap 15 DNB Fund - Global Emerging Markets SRI 17 DNB Fund - Scandinavia 19 DNB Fund - India 21 DNB Fund - China Century 22 DNB Fund - Navigator 23 DNB Fund - Private Equity 25 DNB Fund - Renewable Energy 26 DNB Fund - Technology 28 DNB Fund - Global Value & Momentum 30 DNB Fund SEK Long Bond 34 DNB Fund SEK Short Bond 36 DNB Fund - ECO Absolute Return 37 DNB Fund - TMT Absolute Return 39 DNB Fund - Norway Absolute Return 41 Notes to the Financial Statements at December 31, 2014 42 Additional information (unaudited) 55
Subscriptions can only be received on the basis of the latest prospectus accompanied by the latest annual report as well as by the latest semi-annual report, if published after the latest annual report.

DNB Fund
Management and Administration
Page 3
MANAGEMENT COMPANY
SPONSOR
DNB Asset Management S.A. 5, Allée Scheffer L - 2520 Luxembourg Grand Duchy of Luxembourg
DNB Financial Holding AB Kungsgatan 18 SE - 105 88 Stockholm Sweden
INDEPENDENT AUDITOR
INVESTMENT MANAGER
Ernst & Young S.A. 7, rue Gabriel Lippmann Parc d’Activité Syrdall 2 L - 5365 Munsbach Grand Duchy of Luxembourg
DNB Asset Management AB (until April 9, 2014) Kungsgatan 18 SE - 105 88 Stockholm Sweden DNB Asset Management AS (since April 10, 2014)
REGISTRAR, TRANSFER AGENT, ADMINISTRATION AGENT, DEPOSITARY AND PAYING AGENT
Dronning Eufemias gate 30, Bygg M-12 N, 0191 Oslo Norway
CACEIS Bank Luxembourg S.A. 5, Allée Scheffer L - 2520 Luxembourg Grand Duchy of Luxembourg
Board of Directors of the Management Company
CHAIRMAN Mr Tom Rathke, Group Executive Vice President, DNB Bank ASA – Wealth Management, Dronning Eufemias gate 30, 0191 Oslo, Norway (until May 9, 2014) Mr Anders Petter Wik, Executive Vice President, DNB Bank ASA – Wealth Management, Dronning Eufemias gate 30, 0191 Oslo, Norway (since May 9, 2014) DIRECTORS Mrs Trine Loe, Chief Executive Officer, DNB Bank ASA London Branch, 8th Floor, The Walbrook Building, 25 Walbrook, London EC4N 8AF, United Kingdom (until May 9, 2014) Mr Håkon Hansen, Managing Director DNB Luxembourg SA, 13 rue Goethe, 1637 Luxembourg Mr Ola Melgård, Head of Clients and Investment Services, DNB Bank ASA – Wealth Management, Dronning Eufemias gate 30, 0191 Oslo, Norway (since May 9, 2014)

DNB Fund
Report of the Directors of the Management Company
Page 4
The Board of Directors of DNB Asset Management S.A. is pleased to present the Annual Report of DNB Fund for the year ended December 31, 2014.
2014 turned out to be another strong year in most financial markets. However, pessimism and high volatility dominated the opening month. The American Fed started tapering off its support bond buying program, and the American economy contracted under the strains of an unusually hard winter. Political turmoil, particularly the conflict between Russia and Ukraine, contributed as well to falling equity prices and bond yields.
Gradually, optimism took over. Monetary policy was the important contributor. The American Fed managed to follow its pre-announced tapering plan and ended quantitative easing (QE) in October without upsetting the financial markets. The other leading central banks followed the opposite route. The Eurozone’s ECB cut rates a number of times down to essentially zero and more or less promised to start QE in the beginning of 2015. Bank of Japan enlarged its already exceptionally large-scale QE. Several other central banks including the Swedish Riksbank also cut rates down to a zero policy rate or even negative as in the case of Switzerland. Important equity markets including New York and Stockholm made double-digit gains (in local currencies) although some included the group of emerging markets ended slightly down.
This monetary policy stance along with everywhere subdued inflation had two important consequences. Firstly, throughout the year long interest rates gradually fell in many places to the lowest levels ever recorded. Secondly, the dollar surged against all other currencies. The appreciation was for example around 10% versus the euro and 20% versus the Swedish krona.
The American expansion picked up strength after the weak start of the year. The labor market distinctly improved. Employment increased and unemployment decreased. Japan had the opposite profile with a strong start ahead of tax increases, which in their turn contributed to weaker performance over the rest of the year. The Eurozone eked out a weak expansion. Despite no decisive steps to turn the Eurozone away from its lackluster performance after the global financial crisis, rate spreads between the core and peripheral countries shrank. Hence, investors attached a rising probability to the survival of the currency area though worries remain particularly regarding Greece’s ability to muddle through its required tuff adjustments.
Inflation was everywhere subdued on the back of the modest global business cycle. Typically, capacity utilizations rates remained low and wage increases were limited in most countries. This was especially relevant for the Eurozone heightening the risk of outright deflation. The drastically lower oil price started to impact headline inflation rates towards the end of the year.
Sweden’s expansion held a middle position between strong America and weak Eurozone. Domestic demand was the engine of growth. Private consumption was supported by significant household real disposable income gains from rising real wage increases primarily due to essentially zero inflation, and rising employment. Exports struggled due to weak growth of major export markets.
The Riksbank long hesitated to cut rates despite missing the inflation target with a wide margin referring to the risk of high and rising home prices and household debt. Eventually, the central bank cut twice and ended in October at a zero policy rate. The Swedish krona weakened a lot during the year. Monetary policy is one explanation and the political development another. The new Swedish center-left minority government failed to win support for its new budget in the Parliament, but a compromise between the major political blocs makes it possible for minority governments’ to govern. However, for the time being, the government has to follow the opposition’s budget.
There were both winners and losers among emerging markets. The difference was partly due to the sharp drop of the oil price, which started during the summer. All consumers and oil importing countries are winners, whereas the limited number of oil companies and oil exporting countries are losers. Among the latter is foremost Russia. The central bank tried in vain to halt the sharp slide of the ruble. Among the former are China and India as well as almost all industrial countries with Norway as one notable exception.

DNB Fund
Report of the Directors of the Management Company (continued)
Page 5
Both the Chinese real growth and inflation rates gradually slowed during the course of the year partly due to a weakening housing market. People’s Bank of China took some steps to ease its monetary policy. India got a new government that promised market-friendly reforms. This together with, just like in China, high expectations of an easier monetary policy next year explains the strong performance of the Chinese and Indian equity markets.
The annual accounts of DNB Fund hereby presented include for each sub-fund the investment manager's report.
We sincerely appreciate your trust in DNB Fund.
On behalf of the Board of Directors of DNB Asset Management S.A.

Ernst & Young Société anonyme
7, rue Gabriel Lippmann Parc d’Activité Syrdall 2 L-5365 Munsbach
Tel : +352 42 124 1
www.ey.com/luxembourg
Page 6 A member firm of Ernst & Young Global Limited
B.P. 780 L-2017 Luxembourg
R.C.S. Luxembourg B 47 771 TVA LU 16063074
Independent auditor’s report
To the Unitholders of DNB Fund 5, Allée Scheffer, L-2520 Luxembourg
We have audited the accompanying financial statements of DNB Fund (the “Fund”) and of each of its sub-funds, which comprise the statement of net assets and the statement of investments as at December 31, 2014, and the statement of operations and the statement of changes in net assets for the year then ended, and a summary of significant accounting policies and other explanatory notes to the financial statements.
Responsibility of the Board of Directors of the Management Company of the Fund for the financial statements
The Board of Directors of the Management Company is responsible for the preparation and fair presentation of these financial statements in accordance with Luxembourg legal and regulatory requirements relating to the preparation and presentation of the financial statements and for such internal control as the Board of Directors of the Management Company determines is necessary to enable the preparation and presentation of financial statements that are free from material misstatement, whether due to fraud or error.
Responsibility of the “réviseur d’entreprises agréé”
Our responsibility is to express an opinion on these financial statements based on our audit. We conducted our audit in accordance with International Standards on Auditing as adopted for Luxembourg by the “Commission de Surveillance du Secteur Financier”. Those standards require that we comply with ethical requirements and plan and perform the audit to obtain reasonable assurance about whether the financial statements are free from material misstatement.
An audit involves performing procedures to obtain audit evidence about the amounts and disclosures in the financial statements. The procedures selected depend on the judgement of the “réviseur d’entreprises agréé”, including the assessment of the risks of material misstatement of the financial statements, whether due to fraud or error. In making those risk assessments, the “réviseur d’entreprises agréé” considers internal control relevant to the entity’s preparation and fair presentation of the financial statements in order to design audit procedures that are appropriate in the circumstances, but not for the purpose of expressing an opinion on the effectiveness of the entity’s internal control. An audit also includes evaluating the appropriateness of accounting policies used and the reasonableness of accounting estimates made by the Board of Directors of the Management Company of the Fund, as well as evaluating the overall presentation of the financial statements.
We believe that the audit evidence we have obtained is sufficient and appropriate to provide a basis for our audit opinion.

Page 7 A member firm of Ernst & Young Global Limited
Independent auditor’s report (continued)
Opinion
In our opinion, the financial statements give a true and fair view of the financial position of DNB Fund and of each of its sub-funds as of December 31, 2014, and of the results of their operations and changes in their net assets for the year then ended in accordance with Luxembourg legal and regulatory requirements relating to the preparation and presentation of the financial statements.
Other matter
Supplementary information included in the annual report has been reviewed in the context of our mandate but has not been subject to specific audit procedures carried out in accordance with the standards described above. Consequently, we express no opinion on such information. However, we have no observation to make concerning such information in the context of the financial statements taken as a whole.
ERNST & YOUNG Société Anonyme
Cabinet de révision agréé
Kerry Nichol
Luxembourg, April 23, 2015
Only the English version of the present Annual Report has been reviewed by the independent auditor. Consequently, the audit report only refers to the English version of the report; other versions result from a conscientious translation made under the responsibility of the Board of Directors of the Management Company of the Fund. In case of difference between the English version and the translation, the English version should be retained.

Information about DNB Fund
Page 8
Managers
DNB Fund (the “Fund”) is managed by DNB Asset Management S.A. (the “Management Company”) in Luxembourg. This Management Company has entered into an investment management agreement with DNB Asset Management AB (until April 9, 2014) and with DNB Asset Management AS (since April 10, 2014) regarding the management of all sub-funds. Managers for the respective sub-funds are specified in the Fund information for each sub-fund.
Depositary bank
CACEIS Bank Luxembourg S.A. acts as depositary bank for the Fund’s assets. The depositary bank is also responsible for calculating the value of units and for issuing and redeeming units in the sub-funds.
Tax regulations for the Fund
The Fund has no liability to tax in Luxembourg for capital gains, dividends or interest revenue. Instead, the Fund pays a subscription tax (“taxe d’abonnement”) of 0.05% p.a. on the value of the Fund except in the case of DNB Fund SEK Short Bond and the Institutional Shares Classes in DNB Fund - Global SRI, DNB Fund - Scandinavia, DNB Fund - Technology, DNB Fund - TMT Absolute Return and DNB Fund SEK Long Bond where the subscription tax is 0.01% p.a.. In certain instances depending on the country of origin, the Fund pays withholding tax on dividends received. However, Luxembourg does not impose a withholding tax on dividends paid from the Fund to unitholders.
Unit value
The value of units is calculated each working day as defined in the prospectus of the Fund and is calculated based on the methodology described in the caption “Supplementary information” in Note 2 in the Notes to the Financial Statements at the relevant sub-funds’s valuation point. The unit value can be found in selected newspapers as well as on DNB Asset Management S.A.’s web site.
Dividends
The Management Company will decide from time to time if and to what extent dividends should be paid to holders of “B”-Units (distribution unit) of a sub-fund out of the net results of the operations attributable to the “B”-Units of that specific sub-fund. Such dividends will be paid to holders of “B”-Units as soon as practicable after the decision. The “A” -Units are not entitled to the dividend payments.
Charges
Please refer to the Statement of Operations of the respective sub-fund and to the Notes 4 and 5 in the Notes to the Financial Statements.
Subscription and redemption of units
The issue and redemption of units takes place daily, or otherwise, as provided for in each sub-fund, and if this day is not a business day in Luxembourg or in a market which is the principal market for a significant part (defined as 50 per cent or more) of a sub-fund’s investments, on the immediately following business day which is not a bank holiday in Luxembourg or in a market affecting a sub-fund.
Purchase of units
Subscription orders can be placed through a number of financial institutions in the countries where the Fund is registered for public distribution. For any further information, please contact DNB Asset Management S.A. or any of the DNB Asset Management offices.
Exchange and redemption of units
Unitholders who have instructed DNB Asset Management S.A. to hold their units should apply in writing to DNB Asset Management S.A. with their instructions to exchange and redeem their units. Unitholders who have their units registered with an account other than DNB Asset Management S.A. are recommended to apply to their bank or stockbroker holding their units.
Information
DNB Fund issues an audited annual report and an unaudited semi-annual report which are freely available. In addition, the net asset values, performance figures and other useful information can be found on DNB Asset Management S.A. web site.
Information about DNB Fund
Page 9
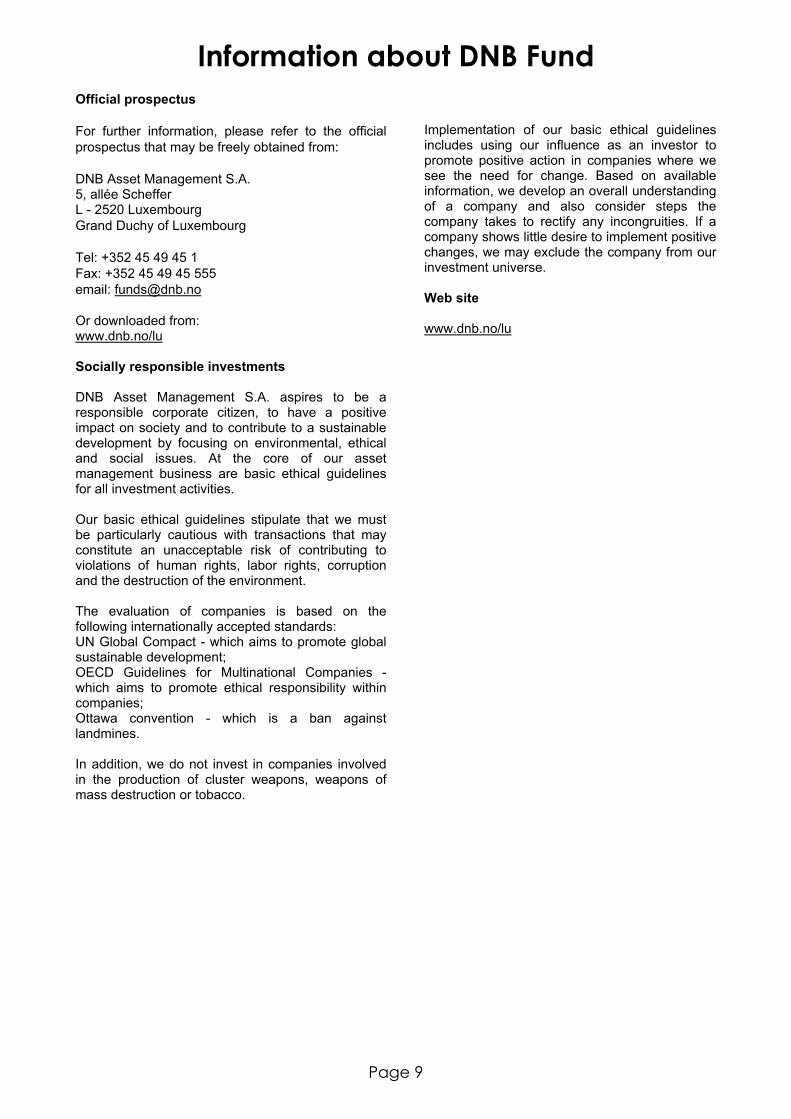
Official prospectus
For further information, please refer to the official prospectus that may be freely obtained from:
DNB Asset Management S.A. 5, allée Scheffer L - 2520 Luxembourg Grand Duchy of Luxembourg
Tel: +352 45 49 45 1 Fax: +352 45 49 45 555 email: [email protected]
Or downloaded from: www.dnb.no/lu
Socially responsible investments
DNB Asset Management S.A. aspires to be a responsible corporate citizen, to have a positive impact on society and to contribute to a sustainable development by focusing on environmental, ethical and social issues. At the core of our asset management business are basic ethical guidelines for all investment activities.
Our basic ethical guidelines stipulate that we must be particularly cautious with transactions that may constitute an unacceptable risk of contributing to violations of human rights, labor rights, corruption and the destruction of the environment.
The evaluation of companies is based on the following internationally accepted standards: UN Global Compact - which aims to promote global sustainable development; OECD Guidelines for Multinational Companies - which aims to promote ethical responsibility within companies; Ottawa convention - which is a ban against landmines.
In addition, we do not invest in companies involved in the production of cluster weapons, weapons of mass destruction or tobacco.
Implementation of our basic ethical guidelines includes using our influence as an investor to promote positive action in companies where we see the need for change. Based on available information, we develop an overall understanding of a company and also consider steps the company takes to rectify any incongruities. If a company shows little desire to implement positive changes, we may exclude the company from our investment universe.
Web site
www.dnb.no/lu

10The accompanying notes form an integral part of these financial statements
Page
DNB Fund Combined
Assets 1,795,851.55Securities at market value 1,712,218.822Bank accounts 42,156.67Receivable from units issued 1,225.71Receivable from securities sold 25,610.12Unrealised profit on financial futures 1.018Unrealised profit on swaps 2,411.429Other accounts receivable 12,227.80
Liabilities 42,625.13Bank overdraft 1,038.09Accrued expenditure 4,209.67Payable on units redeemed 2,086.65Payable on securities purchased 30,461.00Unrealised loss on forward foreign exchange contracts 2,076.287Unrealised loss on swaps 1,254.229Other accounts payable 1,499.22
Net Asset Value 1,753,226.42
Statement of Net Assets as at 31/12/14
Figures in thousands of EUR
Note
Income 42,692.12Dividends received 15,512.402Bank interest 44.112Interest on securities 26,312.612Securities lending income 823.0011
Expenditure 29,852.65Management fees 19,607.854Performance fees 2,802.715Sub-custodian fees 130.464Taxe d'abonnement 629.673Professional expenses 165.69Transaction fees 5,895.83Other expenses 620.432
Net income from investments 12,839.47Net realised result on sales of investment securities 106,421.352Net realised result on foreign exchange -7,319.802Net realised result on financial futures 179.382Net realised result on forward foreign exchangecontracts
1,339.882
Net realised result on swaps -2,482.82Variation in unrealised result 47,484.21
Securities portfolio 49,462.36Financial futures -73.61Swaps 1,305.83Forward foreign exchange contracts -3,210.36
Increase in net assets as a result of operations 158,461.66
Statement of Operations from 01/01/14 to 31/12/14
Figures in thousands of EUR
Note
Net asset value at beginning of the year 1,618,447.622Units issued during the year 764,578.43Units redeemed during the year -778,729.52Dividends distributed -1,731.276Increase in net assets during the year 158,461.66Reevaluation of opening combined NAV -7,800.502Net asset value at end of the year 1,753,226.42
Statement of Changes in Net Assets from 01/01/14 to 31/12/14
Figures in thousands of EUR
Note
11The accompanying notes form an integral part of these financial statements
Page
DNB Fund - Global SRIInvestment Management Report
Emphasis is placed on socially responsible investments (SRI) in equitieswithout being restricted to a specific geographical area or industrial sector. Theportfolio of this sub-fund comprises equities of any part of the world.
During 2014, the value of sub-fund units increased by 12,73 % in the sub-fund's quoted currency EUR.
The performance calculation is based on the last official net asset values datedDecember 31, 2013 and December 31, 2014.
Benchmark: MSCI AC World Index Net
Sub-fund Manager: Filip Boman
Key figures relating to the last 3 years (EUR)
Net assets
31/12/14 31/12/13 31/12/12
51,635,611.92 79,634,003.31 67,903,526.15
Number of unitsNet asset value per unit
Capitalisation units("A" units)
13,258,7613.21
27,946,8082.85
29,269,2612.32
DNB Fund - Global SRI, Unit Class Retail
Number of unitsNet asset value per unit
Capitalisation units("A" units)
82,484109.67
--
--
DNB Fund - Global SRI, Unit Class Institutional
Assets 51,734.00Securities at market value 51,124.452Bank accounts 501.64Receivable from units issued 5.61Receivable from securities sold 76.07Other accounts receivable 26.23
Liabilities 98.39Accrued expenditure 59.67Payable on units redeemed 12.42Payable on securities purchased 26.30
Net Asset Value 51,635.61
Statement of Net Assets as at 31/12/14
Figures in thousands of EUR
Note
Income 1,528.71Dividends received 1,528.712
Expenditure 950.18Management fees 816.874Taxe d'abonnement 29.573Professional expenses 6.52Transaction fees 86.58Other expenses 10.642
Net income from investments 578.53Net realised result on sales of investment securities 11,106.552Net realised result on foreign exchange -297.532Variation in unrealised result -3,321.17
Securities portfolio -3,321.17
Statement of Operations from 01/01/14 to 31/12/14
Figures in thousands of EUR
Note
Increase in net assets as a result of operations 8,066.38
Statement of Operations from 01/01/14 to 31/12/14
Figures in thousands of EUR
Note
Statement of Changes in Net Assets from 01/01/14 to 31/12/14
Figures in thousands of EUR
Net asset value at beginning of the year 79,634.002
3,527.35DNB Fund - Global SRI, Unit Class Retail9,431.76DNB Fund - Global SRI, Unit Class Institutional
Units issued during the year
-47,986.31DNB Fund - Global SRI, Unit Class Retail-1,037.56DNB Fund - Global SRI, Unit Class Institutional
Units redeemed during the year
Increase in net assets during the year 8,066.38Net asset value at end of the year 51,635.61
Note
Currency
Market value
QuantitySecurities %1,000
AGCO CORP 13,439 USD 505.43 0.98
Transferable securities admitted to an officialstock exchange listing
50,746.03 98.28
Shares 50,746.03 98.28USA 23,285.81 45.09
ANADARKO PETROLEUM CORP 6,471 USD 444.78 0.86APPLE INC 12,963 USD 1,200.11 2.32BED BATH AND BEYOND INC 6,581 USD 410.60 0.80CIGNA CORP 8,749 USD 751.16 1.45CISCO SYSTEMS INC 28,640 USD 668.28 1.29CITIGROUP 29,005 USD 1,308.74 2.53CITRIX SYSTEMS 11,445 USD 605.77 1.17COCA-COLA CO 25,308 USD 890.38 1.72CONOCOPHILLIPS CO 9,443 USD 543.32 1.05CTRIP.COM INTL - SHS ADR REPR.1/4THSHS
13,737 USD 509.97 0.99
EMERSON ELECTRIC CO 12,854 USD 659.62 1.28EOG RESOURCES INC 4,481 USD 341.77 0.66FIFTH THIRD BANCORP 19,404 USD 330.08 0.64FRANKLIN RESOURCES INC 8,371 USD 385.83 0.75GOOGLE INC 2,588 USD 1,139.79 2.21HESS CORP 8,055 USD 491.29 0.95INTERNATIONAL FLAVORS FRAGRANCES 4,831 USD 409.21 0.79JOHNSON & JOHNSON 8,137 USD 705.38 1.37JPMORGAN CHASE CO 11,318 USD 588.06 1.14MARVELL TECHNOLOGY GROUP LTD 29,755 USD 354.25 0.69MATTEL 14,373 USD 363.40 0.70MEDTRONIC INC 12,788 USD 768.82 1.49METLIFE INC 15,185 USD 685.91 1.33MOSAIC 6,285 USD 238.49 0.46NETGEAR INC 11,882 USD 354.58 0.69NEWFIELD EXPLORATION CO 4,878 USD 109.53 0.21NEXTERA ENERGY 5,871 USD 520.87 1.01NRG ENERGY 14,967 USD 341.11 0.66ORACLE CORP 27,876 USD 1,039.90 2.01PFIZER INC 33,164 USD 856.25 1.66PNC FINANCIAL SERVICES GROUP 9,219 USD 701.02 1.36QUANTA SERVICES INC 6,826 USD 160.29 0.31REGAL BELOIT 4,226 USD 264.81 0.51RENAISSANCERE HOLDINGS LTD 5,516 USD 446.76 0.87ROCKWELL AUTOMATION 3,400 USD 314.29 0.61SCHLUMBERGER LTD 3,613 USD 256.96 0.50STARBUCKS CORP 9,180 USD 617.77 1.20TIME WARNER 6,473 USD 457.81 0.89VALERO ENERGY CORP 8,739 USD 357.43 0.69VARIAN MEDICAL SYTEMS 7,300 USD 528.61 1.02WALT DISNEY CO 8,437 USD 657.38 1.27
BENESSE HOLDINGS INC 12,073 JPY 298.12 0.58Japan 3,699.86 7.17
CENTRAL JAPAN RAILWAY CO 2,896 JPY 361.85 0.70
Statement of Investments as at 31/12/14
EUR

12The accompanying notes form an integral part of these financial statements
Page
Currency
Market value
QuantitySecurities %1,000
HINO MOTORS LTD 26,577 JPY 293.45 0.57MITSUBISHI UFJ FINANCIAL GROUP INC 181,533 JPY 830.90 1.61SEVEN & I HOLDINGS CO LTD 16,966 JPY 509.34 0.99SUMITOMO CHEMICAL CO LTD 165,003 JPY 544.40 1.05TOYOTA MOTOR CORP 16,554 JPY 861.80 1.67
BG GROUP PLC 42,977 GBP 475.64 0.92United Kingdom 3,096.82 6.00
BHP BILLITON PLC 26,608 GBP 469.79 0.91HSBC HOLDINGS PLC 109,291 GBP 851.76 1.65INTERTEK GROUP PLC 13,030 GBP 394.37 0.76STANDARD CHARTERED PLC 24,136 GBP 297.37 0.58VODAFONE GROUP 213,343 GBP 607.89 1.18
AXA SA 34,772 EUR 668.14 1.30France 2,544.75 4.93
GAMELOFT 56,991 EUR 189.21 0.37GDF SUEZ SA 19,284 EUR 372.86 0.72SANOFI 6,097 EUR 460.02 0.89SCHNEIDER ELECTRIC SA 4,813 EUR 289.41 0.56SOCIETE GENERALE SA 16,153 EUR 565.11 1.09
ARYZTA 9,617 CHF 615.37 1.19Switzerland 2,279.45 4.41
CIE FINANCIERE RICHEMONT NAMEN AKT 3,959 CHF 292.34 0.57DUFRY GROUP 3,188 CHF 395.00 0.76NOVARTIS AG REG SHS 12,719 CHF 976.74 1.89
BMW AG 5,578 EUR 500.74 0.97Germany 1,930.21 3.74
MERCK KGAA 4,658 EUR 365.28 0.71METRO AG 15,992 EUR 404.76 0.78SIEMENS AG REG 7,034 EUR 659.43 1.28
CHINA CONSTRUCTION BANKCORPORATION -H-
875,491 HKD 591.53 1.15Hong Kong 1,816.61 3.52
CHINA MOBILE LTD 56,615 HKD 543.46 1.05HONG KONG LAND HOLDINGS LTD 75,088 USD 417.64 0.81SHANGRI - LA ASIA LTD 232,593 HKD 263.98 0.51
HYUNDAI MOBIS 3,301 KRW 589.10 1.14South Korea 1,672.85 3.24
SAMSUNG ELECTRONICS CO LTD 1,080 KRW 1,083.75 2.10
SKF AB -B- 18,270 SEK 320.87 0.62Sweden 1,015.60 1.97
SVENSKA CELLULOSA SCA AB-SHS-B- 38,620 SEK 694.73 1.35
AIRASIA BHD 1,334,018 MYR 853.69 1.65Malaysia 853.69 1.65
AMERICA MOVIL SHS -L- ADR REPR.20 SHS 25,867 USD 470.56 0.91Mexico 842.19 1.63
GRUPO FINANCIERO BANORTE -O- 82,500 MXN 371.63 0.72
ISS A/S 18,453 DKK 441.33 0.85Denmark 817.02 1.58
TDC 59,234 DKK 375.69 0.73
DBS GROUP HOLDINGS 60,408 SGD 774.17 1.50Singapore 774.17 1.50
ENEL SPA 88,586 EUR 327.41 0.64Italy 730.92 1.42
PRADA SPA 56,307 HKD 262.49 0.51SARAS RAFFINERIE SARDE SPA 169,086 EUR 141.02 0.27
KERRY GROUP PLC 5,583 EUR 324.09 0.63Ireland 659.11 1.28
KING DIGITAL 25,985 USD 335.02 0.65
WPP 2012 PLC 35,691 GBP 620.32 1.20Jersey Island 620.32 1.20
ICICI BANK ADR REPR.2 SHS 58,485 USD 558.67 1.08India 558.67 1.08
CARNIVAL CORP 14,233 USD 532.60 1.03Panama 532.60 1.03
MELLANOX TECHNOLOGIES LTD 14,844 USD 523.58 1.01Israel 523.58 1.01
DNB 22,160 NOK 272.21 0.53Norway 467.39 0.91
PETROLEUM GEO-SERVICES ASA 41,543 NOK 195.18 0.38
QUEBECOR -B- SUBORD.VOTING 20,026 CAD 451.61 0.87Canada 451.61 0.87
AKZO NOBEL NV 7,628 EUR 440.36 0.85The Netherlands 440.36 0.85
TURKIYE IS BANKASI AS 190,862 TRY 424.27 0.82Turkey 424.27 0.82
STANDARD BANK GROUP LIMITED 30,639 ZAR 312.54 0.61South Africa 312.54 0.61
APPLUS SERVICES S.A. 25,152 EUR 217.19 0.42Spain 217.19 0.42
PETROLEO BRASILEIRO PFD ADR.REP 2PFD 28,763 USD 178.44 0.35Brazil 178.44 0.35
EUR Currency
Market value
QuantitySecurities %1,000
BANK MANDIRI ADR REPR 10 SHS 52,866 USD 378.42 0.73
Other transferable securities 378.42 0.73
Shares 378.42 0.73Indonesia 378.42 0.73
EUR
Total securities 51,124.45 99.01
Other assets 511.16 0.99
Net Asset Value 51,635.61 100.00

13The accompanying notes form an integral part of these financial statements
Page
DNB Fund - Far EastInvestment Management Report
The sub-fund invests in equities in the Far East excluding Japan. Distributionby country and industry will vary and from time to time, certain countries willnot be represented.
During 2014, the value of the sub-fund's units increased by 14,80 % in the sub-fund's quoted currency EUR.
The performance calculation is based on the last official net asset values datedDecember 31, 2013 and December 31, 2014.
Benchmark: MSCI AC Asia Pacific ex Japan Index Net
Sub-fund Manager: Linus Kwan
Key figures relating to the last 3 years (EUR)
Net assets
31/12/14 31/12/13 31/12/12
17,559,989.30 18,577,911.26 22,759,823.65
Number of unitsNet asset value per unit
Capitalisation units("A" units)
4,110,8854.27
4,992,9103.72
6,129,1493.71
DNB Fund - Far East, Unit Class Retail
Assets 17,783.93Securities at market value 16,587.652Bank accounts 1,140.90Receivable from units issued 24.34Receivable from securities sold 24.41Other accounts receivable 6.63
Liabilities 223.94Accrued expenditure 21.28Payable on units redeemed 22.19Payable on securities purchased 180.46
Net Asset Value 17,559.99
Statement of Net Assets as at 31/12/14
Figures in thousands of EUR
Note
Income 430.08Dividends received 429.472Bank interest 0.612
Expenditure 330.57Management fees 215.184Taxe d'abonnement 8.553Professional expenses 9.40Transaction fees 90.65Other expenses 6.792
Net income from investments 99.51Net realised result on sales of investment securities 877.862Net realised result on foreign exchange 7.312Variation in unrealised result 1,361.13
Securities portfolio 1,361.13Increase in net assets as a result of operations 2,345.81
Statement of Operations from 01/01/14 to 31/12/14
Figures in thousands of EUR
Note
Statement of Changes in Net Assets from 01/01/14 to 31/12/14
Figures in thousands of EUR
Net asset value at beginning of the year 18,577.912
1,448.16DNB Fund - Far East, Unit Class RetailUnits issued during the year
-4,811.90DNB Fund - Far East, Unit Class RetailUnits redeemed during the year
Increase in net assets during the year 2,345.81Net asset value at end of the year 17,559.99
Note
Currency
Market value
QuantitySecurities %1,000
AIA GROUP LTD 81,000 HKD 370.73 2.11
Transferable securities admitted to an officialstock exchange listing
16,463.16 93.75
Shares 16,463.16 93.75Hong Kong 4,049.07 23.05
BANK OF CHINA LTD -H- 568,000 HKD 263.28 1.50BOC HONG KONG (HOLDINGS) LTD 76,500 HKD 210.57 1.20CHINA CONSTRUCTION BANKCORPORATION -H-
798,000 HKD 539.17 3.07
CHINA LIFE INSURANCE CO LTD 201,000 HKD 649.18 3.71CHINA MOBILE LTD 39,000 HKD 374.37 2.13CHINA OVERSEAS LAND INVESTMENT LTD-RC-
38,000 HKD 92.91 0.53
CHINA RAILWAY CONSTRUCTION -H- 72,000 HKD 75.45 0.43CHINA RESOURCES BEIJING LAND 36,000 HKD 78.09 0.44CN TAIPING INSURANCE HOLDINGS CO 131,600 HKD 309.88 1.76GALAXY ENTERTAINMENT GROUP LTD 43,000 HKD 199.09 1.13GEELY AUTOMOBILE 605,000 HKD 158.50 0.90HAIER ELECTRONICS GROUP CO LTD 32,000 HKD 62.66 0.36HONG KONG EXCHANGES AND CLEARINGLTD
13,900 HKD 253.15 1.44
HUANENG RENEWABLES CORPORATIONLTD-H-
280,000 HKD 74.55 0.42
PING AN INS (GRP) CO -H- 10,500 HKD 88.10 0.50SANDS CHINA LTD 28,400 HKD 114.92 0.65SHENZHOU INTERNATIONAL GROUP 22,000 HKD 59.74 0.34SJM HOLDINGS LTD 57,000 HKD 74.73 0.43
ANZ BANKING GROUP LTD 14,660 AUD 317.33 1.81Australia 3,158.97 17.99
BHP BILLITON LTD 17,150 AUD 339.76 1.93COMMONWEALTH BANK OF AUSTRALIA 8,660 AUD 500.32 2.86CROWN RESORTS 32,880 AUD 281.45 1.60G8 EDUCATION 23,400 AUD 65.82 0.37INSURANCE AUSTRALIA GROUP LIMITED 53,080 AUD 223.78 1.27LEND LEASE CORP LTD - STAPLEDSECURITIES
19,000 AUD 210.19 1.20
MACQUARIE GROUP 3,830 AUD 150.59 0.86MIRVAC GROUP STAPLED SECURITIES 228,090 AUD 273.86 1.56NAT. AUSTRALIA BANK 12,520 AUD 283.76 1.62WESTPAC BANKING CORP 16,270 AUD 363.92 2.07WOODSIDE PETROLEUM 5,780 AUD 148.19 0.84
HYUNDAI MOTOR CO LTD 400 KRW 51.12 0.29South Korea 2,572.11 14.65
KANGWON LAND 2,200 KRW 50.57 0.29KB FINANCIAL GROUP INC 5,670 KRW 155.00 0.88KOREA ELECTRIC POWER CORP 2,630 KRW 84.92 0.48LG HOUSEHOLD AND HEALTHCARE 430 KRW 202.58 1.15LG INNOTEK 1,550 KRW 131.86 0.75NAVER 260 KRW 139.99 0.80SAMSUNG CARD SHS 2,315 KRW 77.38 0.44SAMSUNG ELECTRONICS CO LTD 540 KRW 541.87 3.09SAMSUNG ELECTRONICS CO LTD PFD SHSN/VTG
230 KRW 180.71 1.03
SAMSUNG FIRE AND MARINE INSURANCE 1,420 KRW 303.35 1.73SAMSUNG LIFE INSURANCE CO LTD 6,180 KRW 544.44 3.10SK HYNIX INC 3,000 KRW 108.32 0.62
ACBEL POLYTECH 173,000 TWD 158.68 0.90Taiwan 1,938.24 11.04
ADVANCED SEMICONDUCTORENGINEERING INC
143,000 TWD 141.57 0.81
CHINA LIFE INSURANCE 61,032 TWD 41.71 0.24EPISTAR CORP 52,000 TWD 84.99 0.48FUBON FINANCIAL HOLDING COMPANY 91,000 TWD 119.88 0.68
Statement of Investments as at 31/12/14
EUR

14The accompanying notes form an integral part of these financial statements
Page
Currency
Market value
QuantitySecurities %1,000
LARGAN PRECISION CO LTD 2,000 TWD 124.46 0.71MAKALOT INDUSTRIAL CO LTD 17,000 TWD 74.65 0.43MEGA FINANCIAL HOLDING COMPANY 211,781 TWD 134.54 0.77PRIMAX ELECTRO 50,000 TWD 50.47 0.29TAIWAN MOBILE 46,000 TWD 124.90 0.71TAIWAN SEMICONDUCTORMANUFACTURING CO LT
202,000 TWD 740.07 4.21
YUANTA FINANCIAL 355,675 TWD 142.32 0.81
BANK OF BARODA DEMATERIALISED 14,800 INR 208.97 1.20India 1,339.04 7.63
BHARAT PETROLEUM CORP LTD 9,700 INR 81.63 0.46EMAMI 11,600 INR 118.49 0.67ICICI BANK 75,300 INR 346.35 1.98INFOSYS LTD 4,800 INR 123.34 0.70JK LAKSHMI CEMENT LTD 34,455 INR 182.16 1.04MARUTI SUZUKI 4,500 INR 195.19 1.11SOBHA DEVELOPERS LTD 13,200 INR 82.91 0.47
AGRICULTURAL BANK OF CHINA -H- 428,000 HKD 177.96 1.01China 1,188.39 6.77
CGN POWER CO 144A/REGS 25,000 HKD 8.94 0.05CHINA CNR -H- 140,000 HKD 165.13 0.94DATANG INTERNATIONAL POWERGENERATION-H-
610,000 HKD 269.81 1.54
NEW CHINA LIFE INSURANCE CO LTD -H- 46,900 HKD 194.76 1.11SINOTRANS -H- 678,000 HKD 371.79 2.12
BIZLINK HOLDING INC 19,348 TWD 54.29 0.31Cayman Islands 871.52 4.96
CHAILEASE HOLDING COMPANY LTD 48,000 TWD 98.28 0.56INTERNATIONAL HOUSEWARES RETAILCO LTD
284,000 HKD 59.95 0.34
NEXTEER AUTO 203,000 HKD 142.97 0.81TENCENT HLDG 40,600 HKD 484.48 2.76TENWOW INTERNATIONAL HOLDINGS LTD 139,000 HKD 31.55 0.18
AYALA CORP 11,240 PHP 143.17 0.82Philippines 483.28 2.75
AYALA LAND INC 248,600 PHP 153.77 0.87BELLE CORPORATION 220,000 PHP 19.75 0.11PETRON CORPORATION 244,200 PHP 47.51 0.27UNIVERSAL ROBINA CORP 33,100 PHP 119.08 0.68
DBS GROUP HOLDINGS 9,000 SGD 115.34 0.66Singapore 299.88 1.71
INNOVALUE PRECISION LTD 263,000 SGD 77.72 0.44UNITED OVERSEAS BANK 7,000 SGD 106.82 0.61
BANK MANDIRI 213,700 IDR 152.94 0.87Indonesia 264.46 1.51
ERAJAYA SWASEMBADA TBK 234,000 IDR 16.94 0.10INDOFOOD SUKSES MAKMUR TBK 57,400 IDR 25.74 0.15JASA MARGA -B- 147,000 IDR 68.84 0.39
MALAYAN BANKING BHD 24,300 MYR 52.43 0.29Malaysia 160.05 0.91
MUHIBBAH ENGINEERING BHD 48,400 MYR 21.29 0.12MY E.G. SERVICES BHD 35,000 MYR 34.75 0.20PERDANA PETROLEUM BHD 111,200 MYR 29.04 0.17SAPURAKENCANA BHD 41,300 MYR 22.54 0.13
BANGKOK AIRWAYS UNITS NVDR 97,000 THB 47.25 0.27Thailand 99.11 0.56
BANGKOK BANK PUBLIC CO UNITS-NVDR 10,700 THB 51.86 0.29
SILVERLAKE AXIS -SHS- 50,000 SGD 39.04 0.22Bermuda 39.04 0.22
PACIFIC HOSPITAL 15,151 TWD 27.56 0.16
Transferable securities dealt in on anotherregulated market
124.49 0.71
Shares 124.49 0.71Taiwan 92.78 0.53
VANGUARD INTERNATIONALSEMICONDUCTOR COR
48,000 TWD 65.22 0.37
BLUECOM CO LTD 1,860 KRW 19.76 0.11South Korea 31.71 0.18
DONGSUNG FINETEC CO 2,020 KRW 11.95 0.07
EUR
Total securities 16,587.65 94.46
Other assets 972.34 5.54
Net Asset Value 17,559.99 100.00

15The accompanying notes form an integral part of these financial statements
Page
DNB Fund - Asian Small CapInvestment Management Report
The sub-fund invests in small and medium sized companies in the Far East,excluding Japan. The sub-fund's investment strategy is a pronounced "bottom-up" strategy. This means that the sub-fund concentrates on identifyingcompanies that represent good acquisition value irrespective of where thecompany is based. Distribution by country and industry will vary and fromtime-to-time, certain countries will not be represented.
During 2014, the value of the sub-fund's units increased by 39,97 % in the sub-fund's quoted currency EUR.
The performance calculation is based on the last official net asset values datedDecember 31, 2013 and December 31, 2014.
Benchmark: MSCI AC Asia Pacific ex Japan Index Net
Sub-fund Manager: Abhishek Thepade, Shadow Lau and ParameswaraKrishnan
Key figures relating to the last 3 years (EUR)
Net assets
31/12/14 31/12/13 31/12/12
234,492,240.94 188,061,771.65 244,407,032.16
Number of unitsNet asset value per unit
Capitalisation units("A" units)
40,496,7295.79
45,460,1174.14
61,080,8444.00
DNB Fund - Asian Small Cap, Unit Class Retail
Assets 245,254.84Securities at market value 226,216.032Bank accounts 12,904.31Receivable from units issued 174.81Receivable from securities sold 5,958.21Other accounts receivable 1.48
Liabilities 10,762.60Accrued expenditure 380.96Payable on units redeemed 680.82Payable on securities purchased 9,699.55Unrealised loss on forward foreign exchange contracts 1.277
Net Asset Value 234,492.24
Statement of Net Assets as at 31/12/14
Figures in thousands of EUR
Note
Income 2,210.85Dividends received 2,209.202Interest on securities 1.652
Expenditure 6,348.85Management fees 3,503.894Taxe d'abonnement 104.493Professional expenses 17.38Transaction fees 2,552.01Other expenses 171.092
Net loss from investments -4,137.99Net realised result on sales of investment securities 36,532.872Net realised result on foreign exchange 450.252Variation in unrealised result 34,037.30
Securities portfolio 34,038.57Forward foreign exchange contracts -1.27
Statement of Operations from 01/01/14 to 31/12/14
Figures in thousands of EUR
Note
Increase in net assets as a result of operations 66,882.43
Statement of Operations from 01/01/14 to 31/12/14
Figures in thousands of EUR
Note
Statement of Changes in Net Assets from 01/01/14 to 31/12/14
Figures in thousands of EUR
Net asset value at beginning of the year 188,061.772
58,342.57DNB Fund - Asian Small Cap, Unit Class RetailUnits issued during the year
-78,794.53DNB Fund - Asian Small Cap, Unit Class RetailUnits redeemed during the year
Increase in net assets during the year 66,882.43Net asset value at end of the year 234,492.24
Note
Currency
Market value
QuantitySecurities %1,000
ALLSEC TECHNOLOGIES LTD 498,816 INR 152.70 0.07
Transferable securities admitted to an officialstock exchange listing
219,569.23 93.64
Shares 219,569.23 93.64India 108,483.50 46.27
BANK OF BARODA DEMATERIALISED 300,000 INR 4,235.86 1.81BATA INDIA LTD 275,000 INR 4,681.55 2.00BHARAT FORGE LTD DEMATERIALISED 375,000 INR 4,612.88 1.97BHARAT PETROLEUM CORP LTD 250,000 INR 2,103.80 0.90DEVELOPMENT CREDIT BANK - DEMAT 2,750,000 INR 4,332.81 1.85FEDERAL BANK LTD 4,100,000 INR 8,102.15 3.46GREAT EASTERN SHIPPING CODEMATERIALISED
500,000 INR 2,357.16 1.01
HINDUSTAN PETROLEUM(DEMATERIALISED)
1,050,000 INR 7,487.98 3.19
HT MEDIA LTD 2,650,000 INR 4,435.88 1.89INDUSIND BANK LTD 1,200,000 INR 12,543.84 5.34INFINITE COMPUTER SOLUTIONS 1,264,000 INR 2,438.56 1.04JK LAKSHMI CEMENT LTD 1,600,000 INR 8,458.96 3.61KARUR VYSYA BANK 500,000 INR 3,737.33 1.59MADRAS CEMENTS LTD DEMATERIALISED 1,225,000 INR 5,504.57 2.35NATCO PHARMA LTD DEMATERIALISED 25,000 INR 501.13 0.21PRESTIGE ESTATES PROJECTS LTD 550,000 INR 1,715.57 0.73REDINGTON INDIA 4,450,000 INR 7,959.06 3.39SKS MICROFINANCE 800,000 INR 4,305.03 1.84SOBHA DEVELOPERS LTD 700,000 INR 4,396.54 1.87SUPREME INDUSTRIES LTD 387,500 INR 3,008.75 1.28TATA GLOBAL BEVERAGES 1,800,000 INR 3,546.49 1.51TITAN INDUSTRIES LTD 1,050,000 INR 5,220.18 2.23TREE HOUSE EDUCATION ANDACCESSORIES
388,000 INR 2,248.67 0.96
V-GUARD INDUSTRIES LTD 10,600 INR 161.20 0.07ZEE ENTERTAINMENT 6 PREF SHS 14-22 21,210,000 INR 234.85 0.10
CHINA AIRCRAFT LEASING GROUP HLDGLTD
5,027,000 HKD 6,131.92 2.61Cayman Islands 46,824.47 19.97
CHINA CITY RAILWAY TRANSPORT TECHHLDG
29,532,000 HKD 8,081.70 3.46
CHINA FIBER OPTIC 31,157,900 HKD 6,940.28 2.96EVA PRECISION INDUSTRIAL HOLDINGSLTD
23,392,000 HKD 4,366.86 1.86
KANGDA INTL ENV 19,293,000 HKD 7,019.13 2.99MINTH GROUP LTD 3,216,000 HKD 5,492.01 2.34NEXTEER AUTO 5,711,000 HKD 4,022.26 1.72YESTAR INTL TEMPORARY TRADING 24,310,000 HKD 4,770.31 2.03
BJ URBAN CON -H- 4,706,000 HKD 1,821.94 0.78China 27,369.72 11.67
CHINA CITIC BANK CORPORATION -H- 10,537,000 HKD 6,951.80 2.96CHONG QING CHANGAN AUTOMOBILE COLTD
2,981,179 HKD 5,552.67 2.37
HUADIAN POWER INTERNATIONALCORPORATION
10,160,000 HKD 7,328.11 3.12
SINOTRANS -H- 10,422,000 HKD 5,715.20 2.44
CHINA RESOURCES BEIJING LAND 3,574,000 HKD 7,752.43 3.30Hong Kong 14,944.63 6.37
SUNAC CHINA 8,594,000 HKD 7,192.20 3.07
Statement of Investments as at 31/12/14
EUR
16The accompanying notes form an integral part of these financial statements
Page
Currency
Market value
QuantitySecurities %1,000
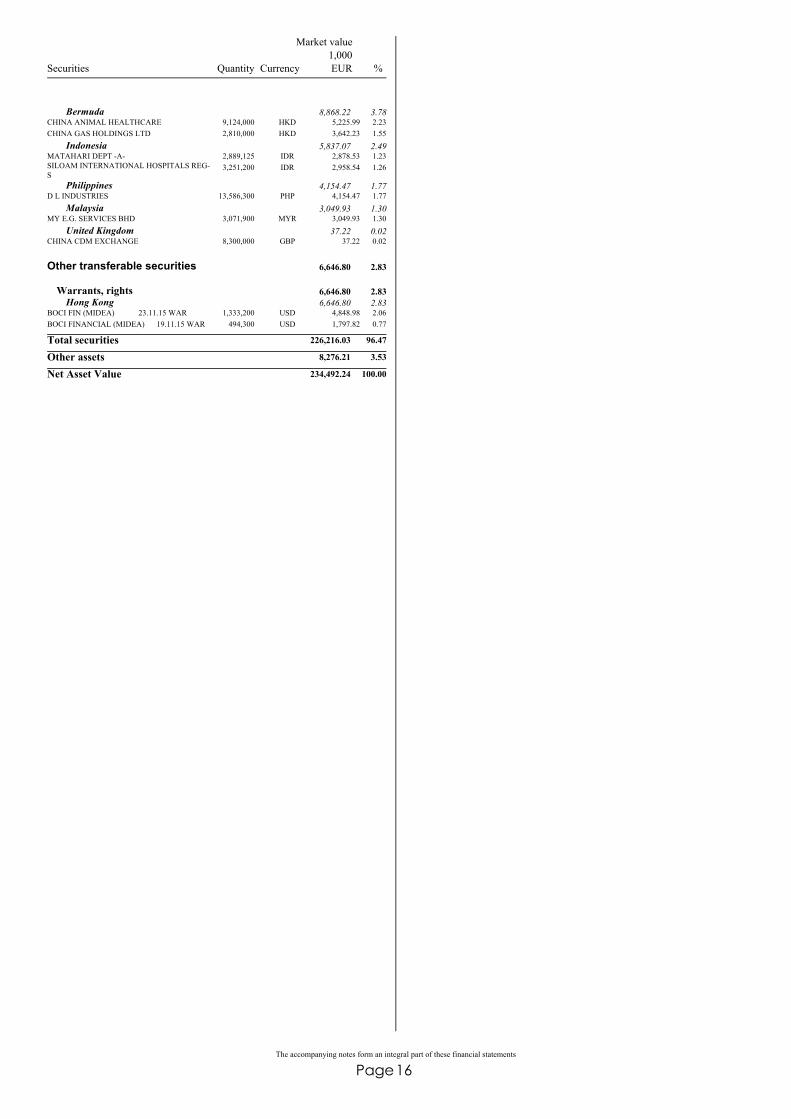
CHINA ANIMAL HEALTHCARE 9,124,000 HKD 5,225.99 2.23Bermuda 8,868.22 3.78
CHINA GAS HOLDINGS LTD 2,810,000 HKD 3,642.23 1.55
MATAHARI DEPT -A- 2,889,125 IDR 2,878.53 1.23Indonesia 5,837.07 2.49
SILOAM INTERNATIONAL HOSPITALS REG-S
3,251,200 IDR 2,958.54 1.26
D L INDUSTRIES 13,586,300 PHP 4,154.47 1.77Philippines 4,154.47 1.77
MY E.G. SERVICES BHD 3,071,900 MYR 3,049.93 1.30Malaysia 3,049.93 1.30
CHINA CDM EXCHANGE 8,300,000 GBP 37.22 0.02United Kingdom 37.22 0.02
BOCI FIN (MIDEA) 23.11.15 WAR 1,333,200 USD 4,848.98 2.06
Other transferable securities 6,646.80 2.83
Warrants, rights 6,646.80 2.83Hong Kong 6,646.80 2.83
BOCI FINANCIAL (MIDEA) 19.11.15 WAR 494,300 USD 1,797.82 0.77
EUR
Total securities 226,216.03 96.47
Other assets 8,276.21 3.53
Net Asset Value 234,492.24 100.00
17The accompanying notes form an integral part of these financial statements
Page
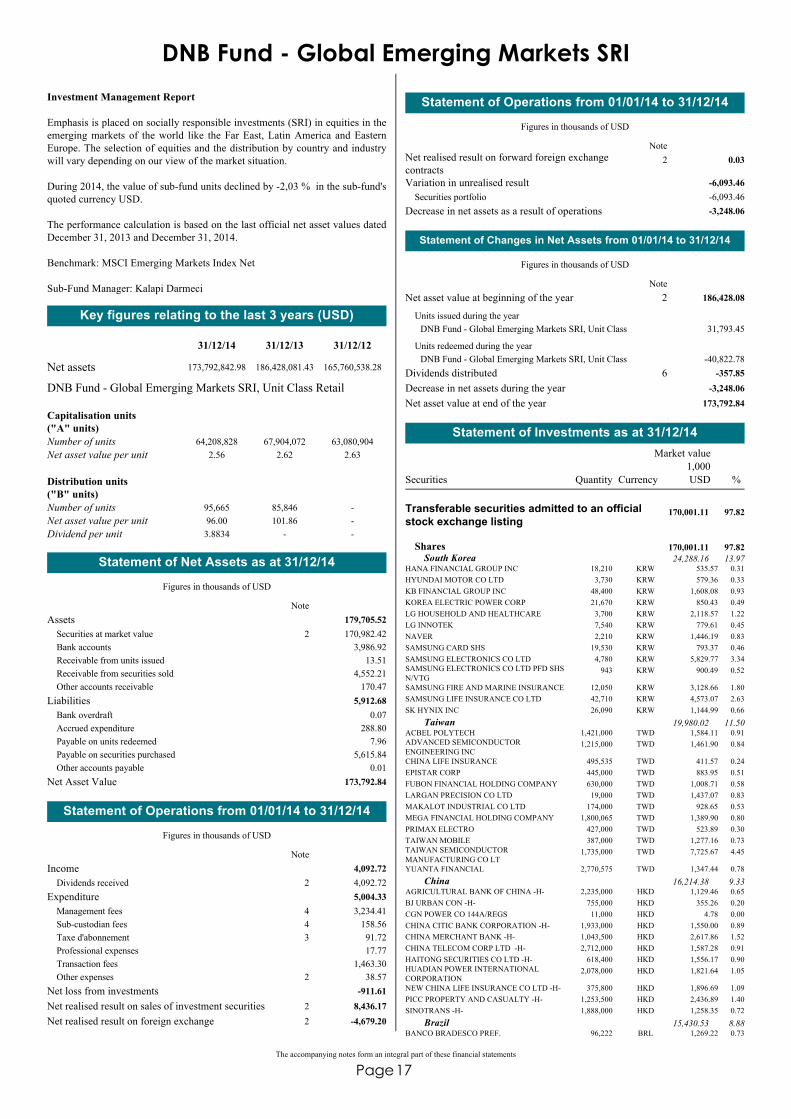
DNB Fund - Global Emerging Markets SRIInvestment Management Report
Emphasis is placed on socially responsible investments (SRI) in equities in theemerging markets of the world like the Far East, Latin America and EasternEurope. The selection of equities and the distribution by country and industrywill vary depending on our view of the market situation.
During 2014, the value of sub-fund units declined by -2,03 % in the sub-fund'squoted currency USD.
The performance calculation is based on the last official net asset values datedDecember 31, 2013 and December 31, 2014.
Benchmark: MSCI Emerging Markets Index Net
Sub-Fund Manager: Kalapi Darmeci
Key figures relating to the last 3 years (USD)
Net assets
31/12/14 31/12/13 31/12/12
173,792,842.98 186,428,081.43 165,760,538.28
Number of unitsNet asset value per unit
Capitalisation units("A" units)
64,208,8282.56
67,904,0722.62
63,080,9042.63
Number of unitsNet asset value per unitDividend per unit
Distribution units ("B" units)
95,66596.003.8834
85,846101.86
-
---
DNB Fund - Global Emerging Markets SRI, Unit Class Retail
Assets 179,705.52Securities at market value 170,982.422Bank accounts 3,986.92Receivable from units issued 13.51Receivable from securities sold 4,552.21Other accounts receivable 170.47
Liabilities 5,912.68Bank overdraft 0.07Accrued expenditure 288.80Payable on units redeemed 7.96Payable on securities purchased 5,615.84Other accounts payable 0.01
Net Asset Value 173,792.84
Statement of Net Assets as at 31/12/14
Figures in thousands of USD
Note
Income 4,092.72Dividends received 4,092.722
Expenditure 5,004.33Management fees 3,234.414Sub-custodian fees 158.564Taxe d'abonnement 91.723Professional expenses 17.77Transaction fees 1,463.30Other expenses 38.572
Net loss from investments -911.61Net realised result on sales of investment securities 8,436.172Net realised result on foreign exchange -4,679.202
Statement of Operations from 01/01/14 to 31/12/14
Figures in thousands of USD
Note
Net realised result on forward foreign exchangecontracts
0.032
Variation in unrealised result -6,093.46Securities portfolio -6,093.46
Decrease in net assets as a result of operations -3,248.06
Statement of Operations from 01/01/14 to 31/12/14
Figures in thousands of USD
Note
Statement of Changes in Net Assets from 01/01/14 to 31/12/14
Figures in thousands of USD
Net asset value at beginning of the year 186,428.082
31,793.45DNB Fund - Global Emerging Markets SRI, Unit ClassUnits issued during the year
-40,822.78DNB Fund - Global Emerging Markets SRI, Unit ClassUnits redeemed during the year
Dividends distributed -357.856Decrease in net assets during the year -3,248.06Net asset value at end of the year 173,792.84
Note
Currency
Market value
QuantitySecurities %1,000
HANA FINANCIAL GROUP INC 18,210 KRW 535.57 0.31
Transferable securities admitted to an officialstock exchange listing
170,001.11 97.82
Shares 170,001.11 97.82South Korea 24,288.16 13.97
HYUNDAI MOTOR CO LTD 3,730 KRW 579.36 0.33KB FINANCIAL GROUP INC 48,400 KRW 1,608.08 0.93KOREA ELECTRIC POWER CORP 21,670 KRW 850.43 0.49LG HOUSEHOLD AND HEALTHCARE 3,700 KRW 2,118.57 1.22LG INNOTEK 7,540 KRW 779.61 0.45NAVER 2,210 KRW 1,446.19 0.83SAMSUNG CARD SHS 19,530 KRW 793.37 0.46SAMSUNG ELECTRONICS CO LTD 4,780 KRW 5,829.77 3.34SAMSUNG ELECTRONICS CO LTD PFD SHSN/VTG
943 KRW 900.49 0.52
SAMSUNG FIRE AND MARINE INSURANCE 12,050 KRW 3,128.66 1.80SAMSUNG LIFE INSURANCE CO LTD 42,710 KRW 4,573.07 2.63SK HYNIX INC 26,090 KRW 1,144.99 0.66
ACBEL POLYTECH 1,421,000 TWD 1,584.11 0.91Taiwan 19,980.02 11.50
ADVANCED SEMICONDUCTORENGINEERING INC
1,215,000 TWD 1,461.90 0.84
CHINA LIFE INSURANCE 495,535 TWD 411.57 0.24EPISTAR CORP 445,000 TWD 883.95 0.51FUBON FINANCIAL HOLDING COMPANY 630,000 TWD 1,008.71 0.58LARGAN PRECISION CO LTD 19,000 TWD 1,437.07 0.83MAKALOT INDUSTRIAL CO LTD 174,000 TWD 928.65 0.53MEGA FINANCIAL HOLDING COMPANY 1,800,065 TWD 1,389.90 0.80PRIMAX ELECTRO 427,000 TWD 523.89 0.30TAIWAN MOBILE 387,000 TWD 1,277.16 0.73TAIWAN SEMICONDUCTORMANUFACTURING CO LT
1,735,000 TWD 7,725.67 4.45
YUANTA FINANCIAL 2,770,575 TWD 1,347.44 0.78
AGRICULTURAL BANK OF CHINA -H- 2,235,000 HKD 1,129.46 0.65China 16,214.38 9.33
BJ URBAN CON -H- 755,000 HKD 355.26 0.20CGN POWER CO 144A/REGS 11,000 HKD 4.78 0.00CHINA CITIC BANK CORPORATION -H- 1,933,000 HKD 1,550.00 0.89CHINA MERCHANT BANK -H- 1,043,500 HKD 2,617.86 1.52CHINA TELECOM CORP LTD -H- 2,712,000 HKD 1,587.28 0.91HAITONG SECURITIES CO LTD -H- 618,400 HKD 1,556.17 0.90HUADIAN POWER INTERNATIONALCORPORATION
2,078,000 HKD 1,821.64 1.05
NEW CHINA LIFE INSURANCE CO LTD -H- 375,800 HKD 1,896.69 1.09PICC PROPERTY AND CASUALTY -H- 1,253,500 HKD 2,436.89 1.40SINOTRANS -H- 1,888,000 HKD 1,258.35 0.72
BANCO BRADESCO PREF. 96,222 BRL 1,269.22 0.73Brazil 15,430.53 8.88
Statement of Investments as at 31/12/14
USD

18The accompanying notes form an integral part of these financial statements
Page
Currency
Market value
QuantitySecurities %1,000
BANCO DO BRASIL SA 87,705 BRL 784.34 0.45BB SEGURIDADE 110,350 BRL 1,335.17 0.77BRF FOODS 21,303 BRL 508.46 0.29CONCESSOES RODOVIARIAS 176,851 BRL 1,025.32 0.59ESTACIO PART 124,991 BRL 1,120.13 0.64ITAUUNIBANCO PFD SHS 255,251 BRL 3,322.71 1.92KROTON EDUCACIONAL SA 270,222 BRL 1,575.80 0.91LOJAS AMERICANAS PREF. 177,281 BRL 1,149.87 0.66PETROLEO BRASILEIRO -PETROBRAS-PREF.
181,736 BRL 685.11 0.39
SUZANO PAPEL PFD.SHS 232,098 BRL 982.37 0.57ULTRAPAR 61,443 BRL 1,189.34 0.68VALE DO RIO DOCE PREF -A- 66,717 BRL 482.69 0.28
BANK OF BARODA DEMATERIALISED 107,000 INR 1,836.21 1.06India 13,306.26 7.66
BHARAT PETROLEUM CORP LTD 79,600 INR 814.13 0.47EMAMI 96,500 INR 1,198.06 0.69ICICI BANK 619,500 INR 3,463.30 1.99INFOSYS LTD 42,100 INR 1,314.80 0.76JK LAKSHMI CEMENT LTD 286,126 INR 1,838.54 1.06MARUTI SUZUKI 38,400 INR 2,024.42 1.16SOBHA DEVELOPERS LTD 107,000 INR 816.80 0.47
BIZLINK HOLDING INC 171,992 TWD 586.61 0.34Cayman Islands 13,269.86 7.64
CHAILEASE HOLDING COMPANY LTD 397,000 TWD 987.95 0.57CHINA AIRCRAFT LEASING GROUP HLDGLTD
843,000 HKD 1,249.78 0.72
CHINA CITY RAILWAY TRANSPORT TECHHLDG
5,052,490 HKD 1,680.48 0.97
CHINA FIBER OPTIC 4,120,600 HKD 1,115.55 0.64EVA PRECISION INDUSTRIAL HOLDINGSLTD
6,918,000 HKD 1,569.65 0.90
GOLDEN EAGLE RETAIL GROUP LTD 776,000 HKD 870.34 0.50KANGDA INTL ENV 2,552,000 HKD 1,128.45 0.65MINTH GROUP LTD 664,000 HKD 1,378.17 0.79NEXTEER AUTO 1,099,000 HKD 940.75 0.54TENCENT HLDG 121,500 HKD 1,762.13 1.02
ANGLO AMERICAN PLATINUM LIMITED 9,622 ZAR 283.62 0.16South Africa 13,074.02 7.52
ASPEN PHARMACARE HOLDINGS PLC 39,227 ZAR 1,376.16 0.79BIDVEST GROUP 26,700 ZAR 701.09 0.40FIRSTRAND LTD 321,662 ZAR 1,405.56 0.81GOLD FIELDS 35,332 ZAR 159.70 0.09MTN GROUP LTD 108,593 ZAR 2,077.58 1.20NASPERS -N- 25,798 ZAR 3,377.46 1.94REMGRO LTD 21,884 ZAR 480.29 0.28SASOL LTD 30,011 ZAR 1,117.70 0.64STANDARD BANK GROUP LIMITED 41,403 ZAR 513.31 0.30STEINHOFF INTERNATIONAL HOLDINGSLTD
188,944 ZAR 969.79 0.56
VODACOM GROUP 55,126 ZAR 611.76 0.35
CHINA PACIFIC INSURANCE (GROUP) COLTD
240,600 HKD 1,222.08 0.70Hong Kong 8,697.71 5.00
CHINA RESOURCES BEIJING LAND 746,000 HKD 1,966.71 1.13CN TAIPING INSURANCE HOLDINGS CO 666,912 HKD 1,908.67 1.10PING AN INS (GRP) CO -H- 179,000 HKD 1,825.32 1.05SUNAC CHINA 1,745,000 HKD 1,774.93 1.02
ALFA SAB DE CV -A- 393,723 MXN 901.13 0.52Mexico 8,098.24 4.66
ALSEA SA DE CV 353,470 MXN 977.09 0.56AMERICA MOVIL SHS -L- ADR REPR.20 SHS 51,761 USD 1,144.44 0.66CEMEX ADR REPR 10 CPO 145,367 USD 1,500.19 0.86EL PUERTO LIVERPOOL C1 81,081 MXN 813.18 0.47FIBRO UNO 263,890 MXN 754.74 0.43GRUPO FINANCIERO BANORTE -O- 309,841 MXN 1,696.34 0.98MEXICHEM SHS 101,614 MXN 311.13 0.18
IJM CORP 770,600 MYR 1,447.72 0.83Malaysia 6,025.34 3.47
MALAYAN BANKING BHD 393,700 MYR 1,032.34 0.59MY E.G. SERVICES BHD 592,900 MYR 715.46 0.41SAPURAKENCANA BHD 1,045,300 MYR 693.46 0.40TENAGA NASIONAL BHD 375,600 MYR 1,482.15 0.86TUNE INS HOLDINGS BHD 1,345,800 MYR 654.21 0.38
GAZPROM OAO ADR 82,047 USD 391.77 0.23Russia 5,226.12 3.01
LUKOIL HOLDING ADR REPR.1SHS 16,425 USD 644.11 0.37LUKOIL HOLDINGS ADR REPR.1 SHS 32,767 USD 1,318.54 0.76MAGNIT GDR 32,607 USD 1,475.80 0.85NOVATEK GDR REPR 1/100 SHS REG-S 11,016 USD 858.15 0.49SBERBANK ADR 4 SHS 134,505 USD 537.75 0.31
BANK MANDIRI 1,151,100 IDR 1,001.30 0.58Indonesia 4,837.85 2.78
PP TBK 3,530,800 IDR 1,019.02 0.58SEMEN GRESIK (PERSERO) TBK 726,100 IDR 949.61 0.55
USD Currency
Market value
QuantitySecurities %1,000
SUMMARECON AGUNG TBK 6,743,400 IDR 827.47 0.48TELKOM INDONESIA -B- 4,498,500 IDR 1,040.45 0.59
CENTRAL PATTANA PUBLIC CO NVDR LTD 456,700 THB 630.93 0.36Thailand 4,726.83 2.72
CHAROEN POKPHAND FOODS PUBLICS CO-F-REG
622,700 THB 515.21 0.30
KASIKORNBANK UNITS NVDR 129,800 THB 902.49 0.52PRUKSA REAL ESTATE 716,600 THB 625.53 0.36PTT PUBLIC COMPANY LTD LIMITED 68,400 THB 672.88 0.39SIAM CEMENT PUBLIC CO LTD 65,200 THB 886.87 0.51SIAM COMMERC.BK PUBLIC CO LTD 89,200 THB 492.92 0.28
HACI OMER SABANCI HOLDING AS 199,728 TRY 859.61 0.49Turkey 3,107.63 1.79
KOC HOLDING AS -B- 97,902 TRY 510.93 0.29TURKCELL ILETISIM HIZMET 144,332 TRY 867.93 0.50TURKIYE IS BANKASI AS 321,704 TRY 869.16 0.51
GRUPA PEKAO SA 4,437 PLN 225.50 0.13Poland 2,807.97 1.62
PKO BANK POLSKI SA 120,476 PLN 1,225.28 0.71POWSZECHNY ZAKLAD UBEZPIECZEN 5,125 PLN 708.38 0.41TAURON POLSKA ENERGIA S.A 451,743 PLN 648.81 0.37
CHINA ANIMAL HEALTHCARE 1,680,000 HKD 1,169.53 0.67Bermuda 2,366.81 1.36
CHINA GAS HOLDINGS LTD 760,000 HKD 1,197.28 0.69
BANCO SANTANDER -CHILE 19,160,764 CLP 956.71 0.56Chile 2,269.59 1.31
EMPRESA NACIONAL DE ELECTRIC 448,051 CLP 679.71 0.39FALABELLA SOCIEDAD ANONIMA. 94,466 CLP 633.17 0.36
GT CAPITAL 45,600 PHP 1,049.79 0.60Philippines 2,251.40 1.30
UNIVERSAL ROBINA CORP 274,820 PHP 1,201.61 0.70
BANCOLOMBIA ADR REPR.4 PREF SHS 15,666 USD 748.05 0.43Colombia 748.05 0.43
NATIONAL BANK OF GREECE 254,876 EUR 436.78 0.25Greece 683.27 0.39
PUBLIC POWER CORP OF GREECE 37,907 EUR 246.49 0.14
CREDICORP 4,245 USD 682.60 0.39Peru 682.60 0.39
KOMERCNI BANKA AS 2,798 CZK 581.15 0.33Czech Republic 581.15 0.33
CEMEX LATAM HOLDINGS SA 78,673 COP 529.75 0.30Spain 529.75 0.30
OTP BANK LTD 20,560 HUF 301.79 0.17Hungary 301.79 0.17
ANGLO AMERICAN PLC 13,920 ZAR 259.00 0.15United Kingdom 259.00 0.15
SOUTHERN COPPER CORP 8,352 USD 236.78 0.14USA 236.78 0.14
GAZPROM ADR REPR. 2 SHS 15,664 USD 71.08 0.04
Transferable securities dealt in on anotherregulated market
981.31 0.56
Shares 981.31 0.56Russia 565.78 0.32
MEGAFON GDR REPR SHS REGS 35,719 USD 494.70 0.28
BLUECOM CO LTD 23,090 KRW 298.16 0.17South Korea 415.53 0.24
DONGSUNG FINETEC CO 16,330 KRW 117.37 0.07
USD
Total securities 170,982.42 98.38
Other assets 2,810.42 1.62
Net Asset Value 173,792.84 100.00

19The accompanying notes form an integral part of these financial statements
Page
DNB Fund - ScandinaviaInvestment Management Report
The sub-fund invests in equities in Sweden, Finland, Denmark and Norway.The selection of equities and the distribution by country and industry will varydepending on our view of the market situation.
During 2014, the value of the sub-fund's units increased by 9,89 % in the sub-fund's quoted currency EUR.
The performance calculation is based on the last official net asset values datedDecember 31, 2013 and December 31, 2014.
Benchmark: VINX Capped SEK Index Net
Sub-fund Managers: Karl G Høgtun and Kjell Morten Hjørnevik
Key figures relating to the last 3 years (EUR)
Net assets
31/12/14 31/12/13 31/12/12
71,851,208.19 66,975,449.19 67,306,249.22
Number of unitsNet asset value per unit
Capitalisation units("A" units)
20,443,9473.34
22,046,4143.04
26,967,4232.50
DNB Fund - Scandinavia, Unit Class Retail
Number of unitsNet asset value per unit
Capitalisation units("A" units)
35,259102.13
--
--
DNB Fund - Scandinavia, Unit Class Institutional
Assets 72,398.28Securities at market value 71,307.312Bank accounts 672.70Receivable from units issued 39.85Receivable from securities sold 378.37Other accounts receivable 0.06
Liabilities 547.07Accrued expenditure 85.52Payable on units redeemed 14.40Payable on securities purchased 447.11Other accounts payable 0.04
Net Asset Value 71,851.21
Statement of Net Assets as at 31/12/14
Figures in thousands of EUR
Note
Income 2,026.19Dividends received 2,024.942Bank interest 1.252
Expenditure 1,012.39Management fees 885.674Taxe d'abonnement 35.223Professional expenses 7.16Transaction fees 70.35Other expenses 13.992
Net income from investments 1,013.80Net realised result on sales of investment securities 6,696.642Net realised result on foreign exchange -928.262
Statement of Operations from 01/01/14 to 31/12/14
Figures in thousands of EUR
Note
Variation in unrealised result 115.80Securities portfolio 115.80
Increase in net assets as a result of operations 6,897.98
Statement of Operations from 01/01/14 to 31/12/14
Figures in thousands of EUR
Note
Statement of Changes in Net Assets from 01/01/14 to 31/12/14
Figures in thousands of EUR
Net asset value at beginning of the year 66,975.452
18,915.44DNB Fund - Scandinavia, Unit Class Retail3,527.52DNB Fund - Scandinavia, Unit Class Institutional
Units issued during the year
-24,465.18DNB Fund - Scandinavia, Unit Class RetailUnits redeemed during the year
Increase in net assets during the year 6,897.98Net asset value at end of the year 71,851.21
Note
Currency
Market value
QuantitySecurities %1,000
ABB REG.SHS 132,284 SEK 2,337.36 3.25
Transferable securities admitted to an officialstock exchange listing
71,307.31 99.24
Shares 71,307.31 99.24Sweden 33,410.80 46.50
ASSA ABLOY -B- 8,556 SEK 377.99 0.53ASTRAZENECA 11,876 SEK 693.14 0.96ATLAS COPCO AB -A- 131,466 SEK 3,058.00 4.26AUTOLIV SWEDISH DEPOSIT RECEIPTS 16,176 SEK 1,442.87 2.01BOLIDEN AB 23,785 SEK 317.92 0.44ENEA AB 143,833 SEK 1,087.65 1.51GETINGE -B- 37,552 SEK 711.11 0.99HENNES & MAURITZ AB -B- FREE 105,136 SEK 3,645.92 5.08HEXPOL AB -B- 2,186 SEK 171.47 0.24INVESTOR -B- FREE 104,729 SEK 3,175.60 4.42LUNDIN PETROL 81,870 SEK 980.08 1.36MILLICOM INTERNATIONAL CELLULARSA-SDR-
5,963 SEK 369.94 0.51
NORDEA BANK 410,072 SEK 3,970.05 5.54SANDVIK AB 98,670 SEK 802.88 1.12SKANDINAVISKA ENSKILDA BANKEN -A- 72,686 SEK 770.66 1.07SKF AB -B- 42,489 SEK 746.22 1.04SVENSKA CELLULOSA SCA AB-SHS-B- 54,060 SEK 972.47 1.35SWEDBANK -A- 92,232 SEK 1,920.44 2.67TELEFON AB L.M.ERICSSON 299,640 SEK 3,011.02 4.19TELIASONERA AB 218,616 SEK 1,173.50 1.63VOLVO -B- FREE 185,623 SEK 1,674.51 2.33
A.P. MOELLER-MAERSK -A- 1,404 DKK 2,253.05 3.14Denmark 17,602.96 24.50
CARLSBERG AS -B- 9,622 DKK 618.67 0.86DANSKE BANK 108,774 DKK 2,445.21 3.40DSV 58,623 DKK 1,481.58 2.06FLSMIDTH & CO. SHS 13,225 DKK 483.59 0.67GN GREAT NORDIC 36,477 DKK 660.31 0.92ISS A/S 42,612 DKK 1,019.14 1.42NOVO NORDISK 167,271 DKK 5,846.96 8.13NOVOZYMES -B- 23,206 DKK 809.61 1.13PANDORA 20,117 DKK 1,362.89 1.90VESTAS WIND SYSTEMS AS 20,448 DKK 621.95 0.87
AUSTEVOLL SEAFOOD 136,593 NOK 704.80 0.98Norway 13,610.97 18.94
BOUVET SHS 23,516 NOK 198.32 0.28DNB 213,741 NOK 2,625.53 3.65DNO INTERNATIONAL ASA -A- 219,482 NOK 389.19 0.54MARINE HARVEST 170,759 NOK 1,949.77 2.71NORSK HYDRO ASA 294,838 NOK 1,388.49 1.93REC SILICON 761,938 NOK 150.83 0.21SPAREBANK 1 SMN PRIMARY CAP.CERT. 95,906 NOK 622.57 0.87STATOIL ASA 62,691 NOK 912.69 1.27
Statement of Investments as at 31/12/14
EUR

20The accompanying notes form an integral part of these financial statements
Page
Currency
Market value
QuantitySecurities %1,000
STOREBRAND 90,945 NOK 294.68 0.41SUBSEA 7 SA 62,786 NOK 533.32 0.74TELENOR AS 119,672 NOK 2,011.82 2.80VI(Z)RT 164,161 NOK 644.85 0.90XXL 70,468 NOK 572.77 0.80YARA INTERNATIONAL ASA 16,505 NOK 611.34 0.85
AMER SPORTS OYJ 59,549 EUR 956.36 1.33Finland 6,682.58 9.30
KONE -B- 11,099 EUR 419.76 0.58NOKIA OYJ 174,082 EUR 1,141.98 1.59NOKIAN TYRES PLC 38,953 EUR 790.36 1.10OUTOKUMPU OYJ -A- 104,377 EUR 498.09 0.69SAMPO OYJ -A- 49,382 EUR 1,917.00 2.67STORA ENSO -R- 56,799 EUR 422.30 0.59WARTSILA CORPORATION -B- 14,471 EUR 536.73 0.75
EUR
Total securities 71,307.31 99.24
Other assets 543.90 0.76
Net Asset Value 71,851.21 100.00

21The accompanying notes form an integral part of these financial statements
Page
DNB Fund - IndiaInvestment Management Report
Emphasis is placed on investments in equities in India.
During 2014, the value of the sub-fund's units increased by 62,42 % in the sub-fund's quoted currency EUR.
The performance calculation is based on the last official net asset values datedDecember 31, 2013 and December 31, 2014.
Benchmark: MSCI Daily TR Net Emerging Markets India
Sub-fund Manager: Abhishek Thepade and Parameswara Krishnan
Key figures relating to the last 3 years (EUR)
Net assets
31/12/14 31/12/13 31/12/12
106,184,695.40 30,171,446.95 62,063,012.85
Number of unitsNet asset value per unit
Capitalisation units("A" units)
792,508133.99
365,75382.49
644,95696.23
DNB Fund - India, Unit Class Retail
Assets 109,171.31Securities at market value 103,844.412Bank accounts 4,202.39Receivable from units issued 320.48Receivable from securities sold 802.65Other accounts receivable 1.38
Liabilities 2,986.61Accrued expenditure 2,063.73Payable on units redeemed 326.81Payable on securities purchased 595.97Other accounts payable 0.10
Net Asset Value 106,184.70
Statement of Net Assets as at 31/12/14
Figures in thousands of EUR
Note
Income 838.66Dividends received 838.662
Expenditure 3,817.66Management fees 942.964Performance fees 1,908.025Taxe d'abonnement 36.633Professional expenses 5.03Transaction fees 840.29Other expenses 84.732
Net loss from investments -2,979.00Net realised result on sales of investment securities 9,636.572Net realised result on foreign exchange -812.282Variation in unrealised result 18,191.13
Securities portfolio 18,191.13Increase in net assets as a result of operations 24,036.42
Statement of Operations from 01/01/14 to 31/12/14
Figures in thousands of EUR
Note
Statement of Changes in Net Assets from 01/01/14 to 31/12/14
Figures in thousands of EUR
Net asset value at beginning of the year 30,171.452Note
Statement of Changes in Net Assets from 01/01/14 to 31/12/14
Figures in thousands of EUR
116,546.36DNB Fund - India, Unit Class RetailUnits issued during the year
-64,569.53DNB Fund - India, Unit Class RetailUnits redeemed during the year
Increase in net assets during the year 24,036.42Net asset value at end of the year 106,184.70
Note
Currency
Market value
QuantitySecurities %1,000
AXIS BANK 625,000 INR 4,090.35 3.85
Transferable securities admitted to an officialstock exchange listing
103,844.41 97.80
Shares 103,844.41 97.80India 103,844.41 97.80
BALKRISHNA INDUSTRIES LTD 8,000 INR 63.88 0.06BATA INDIA LTD 175,000 INR 2,979.17 2.81BHARAT FORGE LTD DEMATERIALISED 265,000 INR 3,259.77 3.07BHARTI AIRTEL LTD(DEMATERIALISED) 850,000 INR 3,905.31 3.68BRITANNIA INDUSTRIES LTD 67,500 INR 1,617.99 1.52CIPLA LTD 290,000 INR 2,366.36 2.23DEVELOPMENT CREDIT BANK - DEMAT 1,450,000 INR 2,284.57 2.15ENGINEERS INDIA 400,000 INR 1,200.27 1.13FEDERAL BANK LTD 2,600,000 INR 5,137.95 4.84HDFC BANK LTD 160,000 INR 1,983.38 1.87HINDALCO INDUSTRIES LTD 650,000 INR 1,334.02 1.26HINDUSTAN PETROLEUM(DEMATERIALISED)
375,000 INR 2,674.28 2.52
HINDUSTAN UNILEVER 250,000 INR 2,475.38 2.33HT MEDIA LTD 1,475,000 INR 2,483.44 2.34ICICI BANK 1,460,000 INR 6,715.55 6.32INDUSIND BANK LTD 475,000 INR 4,965.27 4.68INFOSYS LTD 365,000 INR 9,378.91 8.82JK LAKSHMI CEMENT LTD 350,000 INR 1,850.40 1.74LARSEN & TOUBRO LTD 164,500 INR 3,202.85 3.02MARUTI SUZUKI 110,000 INR 4,771.36 4.49OIL AND NATURAL GAS CORP 250,000 INR 1,111.66 1.05POWER GRID INDIA 2,100,000 INR 3,775.11 3.56PVR DEMATERIALISED 130,000 INR 1,186.86 1.12REDINGTON INDIA 1,550,000 INR 2,772.26 2.61RELIANCE INDS.GDR REPR.2 SHS -144A-REGS
33,500 USD 777.27 0.73
RELIANCE INDUSTRIES LTD 462,500 INR 5,369.00 5.06STATE BANK OF INDIA 475,000 INR 1,929.61 1.82SUPREME INDUSTRIES LTD 210,000 INR 1,630.55 1.54TATA CONSULTANCY SERVICES LTD 195,000 INR 6,498.43 6.12UPL LTD 500,000 INR 2,257.18 2.13V-GUARD INDUSTRIES LTD 130,900 INR 1,990.71 1.87WHIRLPOOL OF INDIA DEMATERIALISED 212,500 INR 1,804.97 1.70WIPRO LTD 275,000 INR 1,988.90 1.87YES BANK LTD 200,000 INR 2,011.44 1.89
Statement of Investments as at 31/12/14
EUR
Total securities 103,844.41 97.80
Other assets 2,340.29 2.20
Net Asset Value 106,184.70 100.00

22The accompanying notes form an integral part of these financial statements
Page
DNB Fund - China CenturyInvestment Management Report
Emphasis is placed on investments in small and mid capitalization companiesin China, and especially in listed equities or equity-related securities (such asconvertible bonds, global depositary receipts and participatory notes).
During 2014, the value of the sub-fund's units increased by 12,26 % in the sub-fund's quoted currency EUR.
The performance calculation is based on the last official net asset values datedDecember 31, 2013 and December 31, 2014.
Benchmark: MSCI Daily TR Net Emerging Markets China
Sub-fund Manager: Shadow Lau
Key figures relating to the last 3 years (EUR)
Net assets
31/12/14 31/12/13 31/12/12
8,589,195.13 12,203,499.66 9,400,401.46
Number of unitsNet asset value per unit
Capitalisation units("A" units)
101,71284.45
162,22775.22
144,69964.97
DNB Fund - China Century, Unit Class Retail
Assets 9,213.88Securities at market value 8,302.562Bank accounts 337.61Receivable from units issued 74.45Receivable from securities sold 499.26
Liabilities 624.68Accrued expenditure 12.08Payable on units redeemed 81.19Payable on securities purchased 531.40Other accounts payable 0.01
Net Asset Value 8,589.20
Statement of Net Assets as at 31/12/14
Figures in thousands of EUR
Note
Income 144.67Dividends received 144.672
Expenditure 248.64Management fees 126.004Taxe d'abonnement 3.983Professional expenses 0.59Transaction fees 114.38Other expenses 3.692
Net loss from investments -103.97Net realised result on sales of investment securities 974.592Net realised result on foreign exchange 228.072Variation in unrealised result -165.43
Securities portfolio -165.43Increase in net assets as a result of operations 933.27
Statement of Operations from 01/01/14 to 31/12/14
Figures in thousands of EUR
Note
Statement of Changes in Net Assets from 01/01/14 to 31/12/14
Figures in thousands of EUR
Net asset value at beginning of the year 12,203.502Note
Statement of Changes in Net Assets from 01/01/14 to 31/12/14
Figures in thousands of EUR
6,439.23DNB Fund - China Century, Unit Class RetailUnits issued during the year
-10,986.80DNB Fund - China Century, Unit Class RetailUnits redeemed during the year
Increase in net assets during the year 933.27Net asset value at end of the year 8,589.20
Note
Currency
Market value
QuantitySecurities %1,000
AGRICULTURAL BANK OF CHINA -H- 476,000 HKD 197.92 2.30
Transferable securities admitted to an officialstock exchange listing
7,872.15 91.65
Shares 7,872.15 91.65China 3,201.61 37.28
BJ URBAN CON -H- 152,000 HKD 58.85 0.69CHINA CITIC BANK CORPORATION -H- 478,000 HKD 315.36 3.67CHINA MERCHANT BANK -H- 213,500 HKD 440.68 5.13CHINA TELECOM CORP LTD -H- 732,000 HKD 352.50 4.10CHONG QING CHANGAN AUTOMOBILE COLTD
99,200 HKD 184.77 2.15
HAITONG SECURITIES CO LTD -H- 127,600 HKD 264.19 3.08HUADIAN POWER INTERNATIONALCORPORATION
352,000 HKD 253.89 2.96
NEW CHINA LIFE INSURANCE CO LTD -H- 73,800 HKD 306.46 3.57PICC PROPERTY AND CASUALTY -H- 322,640 HKD 516.06 6.01SINOTRANS -H- 567,000 HKD 310.93 3.62
CHINA AIRCRAFT LEASING GROUP HLDGLTD
145,000 HKD 176.87 2.06Cayman Islands 2,557.20 29.77
CHINA CITY RAILWAY TRANSPORT TECHHLDG
1,252,133 HKD 342.66 3.99
CHINA FIBER OPTIC 1,784,800 HKD 397.56 4.63EVA PRECISION INDUSTRIAL HOLDINGSLTD
1,250,000 HKD 233.35 2.72
GOLDEN EAGLE RETAIL GROUP LTD 223,000 HKD 205.79 2.40KANGDA INTL ENV 982,000 HKD 357.27 4.16MINTH GROUP LTD 134,000 HKD 228.83 2.66NEXTEER AUTO 292,000 HKD 205.66 2.39TENCENT HLDG 19,000 HKD 226.72 2.64YESTAR INTL TEMPORARY TRADING 930,000 HKD 182.49 2.12
CHINA PACIFIC INSURANCE (GROUP) COLTD
78,200 HKD 326.81 3.80Hong Kong 1,590.01 18.51
CHINA RESOURCES BEIJING LAND 190,000 HKD 412.13 4.80CN TAIPING INSURANCE HOLDINGS CO 129,448 HKD 304.82 3.55GUOTAI JUNAN INTL HDGS 186,400 HKD 116.65 1.36PING AN INS (GRP) CO -H- 13,000 HKD 109.07 1.27SUNAC CHINA 383,000 HKD 320.53 3.73
CHINA ANIMAL HEALTHCARE 369,000 HKD 211.35 2.46Bermuda 522.43 6.08
CHINA GAS HOLDINGS LTD 240,000 HKD 311.08 3.62
CHINA CDM EXCHANGE 200,000 GBP 0.90 0.01United Kingdom 0.90 0.01
DAQING DAIRY HOLDINGS LTD 2,551,000 HKD 94.70 1.10
Other transferable securities 430.41 5.01
Shares 94.70 1.10Hong Kong 94.70 1.10
BOCI FIN (MIDEA) 23.11.15 WAR 36,800 USD 133.85 1.56
Warrants, rights 335.71 3.91Hong Kong 335.71 3.91
BOCI FINANCIAL (MIDEA) 19.11.15 WAR 55,500 USD 201.86 2.35
Statement of Investments as at 31/12/14
EUR
Total securities 8,302.56 96.66
Other assets 286.64 3.34
Net Asset Value 8,589.20 100.00

23The accompanying notes form an integral part of these financial statements
Page
DNB Fund - NavigatorInvestment Management Report
The sub-fund will mainly invest in the equity of shipping companies andcompanies in the offshore oil-industry, but can also invest in cruise and oilcompanies. Geographically the sub-fund will have full flexibility to invest inall such markets that are deemed to have the greatest potential at various times.
During 2014, the value of the sub-fund's units declined by -27,25 % in the sub-fund's quoted currency NOK.
The performance calculation is based on the last official net asset values datedDecember 31, 2013 and December 31, 2014.
Benchmark: 50% oil service (OSE101010 energy equipment and service), 50%shipping (OSE203030 marine + OSE10102040 oil/gas storage/transportation).
The benchmark is rebalanced monthly.
Sub-Fund Manager: Rune Kaland and Dag Hammer. Dag Hammer joined theteam from July 1, 2014.
Key figures relating to the last 3 years (NOK)
Net assets
31/12/14 31/12/13 31/12/12
42,566,693.56 104,518,532.77 106,199,149.04
Number of unitsNet asset value per unit
Capitalisation units("A" units)
55,384768.58
98,9331,056.46
121,703872.61
DNB FUND - Navigator, Unit Class Retail
Assets 43,256.15Securities at market value 41,866.442Bank accounts 1,203.04Receivable from units issued 100.34Receivable from securities sold 78.28Other accounts receivable 8.05
Liabilities 689.46Accrued expenditure 377.52Payable on units redeemed 152.99Payable on securities purchased 158.75Other accounts payable 0.20
Net Asset Value 42,566.69
Statement of Net Assets as at 31/12/14
Figures in thousands of NOK
Note
Income 2,327.57Dividends received 2,327.542Bank interest 0.032
Expenditure 1,621.62Management fees 1,093.374Performance fees 316.065Taxe d'abonnement 34.763Professional expenses 5.13Transaction fees 155.90Other expenses 16.412
Net income from investments 705.95Net realised result on sales of investment securities -2,205.662Net realised result on foreign exchange 3,673.682Variation in unrealised result -20,854.19
Securities portfolio -20,854.19
Statement of Operations from 01/01/14 to 31/12/14
Figures in thousands of NOK
Note
Decrease in net assets as a result of operations -18,680.22
Statement of Operations from 01/01/14 to 31/12/14
Figures in thousands of NOK
Note
Statement of Changes in Net Assets from 01/01/14 to 31/12/14
Figures in thousands of NOK
Net asset value at beginning of the year 104,518.532
7,883.56DNB FUND - Navigator, Unit Class RetailUnits issued during the year
-51,155.18DNB FUND - Navigator, Unit Class RetailUnits redeemed during the year
Decrease in net assets during the year -18,680.22Net asset value at end of the year 42,566.69
Note
Currency
Market value
QuantitySecurities %1,000
BW LPG LTD 66,145 NOK 3,466.01 8.14
Transferable securities admitted to an officialstock exchange listing
39,308.06 92.34
Shares 39,308.06 92.34Petroleum 19,033.68 44.71
BW OFFSHORE LTD 169,388 NOK 1,272.10 2.99CAMERON INTERNATIONAL CORP 1,200 USD 444.26 1.04FRED OLSEN ENERGY 3,355 NOK 228.64 0.54HALLIBURTON 2,085 USD 611.12 1.44PETROLEUM GEO-SERVICES ASA 47,014 NOK 1,990.57 4.68SCHLUMBERGER LTD 2,715 USD 1,740.13 4.09SEADRILL LTD 27,202 NOK 2,351.62 5.52SIEM OFFSHORE 84,810 NOK 342.63 0.80SUBSEA 7 SA 50,516 NOK 3,867.01 9.08TECHNIP-COFLEXIP 1,100 EUR 491.14 1.15TGS NOPEC GEOPHYSICAL ASA 11,451 NOK 1,851.63 4.35WEATHERFORD INTERNATIONAL LTD 4,400 USD 376.82 0.89
HOEGH LNG HOLDING LTD 41,635 NOK 3,424.47 8.05Transportation 7,417.50 17.43
TANKER INV REGS NOK 23,064 NOK 2,023.87 4.76THE CONTAINERSHIP CO 68,198 NOK 0.68 0.00WILH WILHEMSE - SHS OPPSTARTSFASE 1 42,793 NOK 1,968.48 4.62
ELECTROMAGNETIC GEO 375,092 NOK 1,507.87 3.54Miscellaneous services 6,188.41 14.54
POLARCUS LTD 632,480 NOK 398.46 0.94STOLT NIELSEN LTD 16,068 NOK 2,008.50 4.72WILH. WILHELM HOLDINGS ASA -B- 5,554 NOK 910.86 2.14WILH WILHELMSEN -A- 8,016 NOK 1,362.72 3.20
AURORA LPG HOLDINGS AS 17,673 NOK 927.83 2.18Holding and finance companies 4,061.21 9.54
AVANCE GAS HOLDING LTD 18,311 NOK 1,886.04 4.43DHT HOLDINGS INC 23,076 USD 1,247.34 2.93
AKASTOR 20,139 NOK 435.00 1.02Utilities 1,400.58 3.29
AKER SOLUTIONS 23,239 NOK 965.58 2.27
BERGEN GROUP 110,888 NOK 212.90 0.50Miscellaneous sectors 1,108.04 2.60
DOLPHIN GROUP ASA 308,668 NOK 895.14 2.10
SEVAN DRILLING ASA 92,189 NOK 98.64 0.23Machine and apparatus construction 98.64 0.23
ALWILCO LNG ASA 99,719 NOK 997.19 2.34
Transferable securities dealt in on anotherregulated market
997.19 2.34
Shares 997.19 2.34Transportation 997.19 2.34
Statement of Investments as at 31/12/14
NOK

24The accompanying notes form an integral part of these financial statements
Page
Currency
Market value
QuantitySecurities %1,000
EDS GROUP AS 392,319 NOK 1,020.03 2.40
Other transferable securities 1,561.19 3.67
Shares 1,561.19 3.67Miscellaneous sectors 1,020.03 2.40
EPIC GAS LTD 18,873 NOK 528.44 1.24Transportation 528.44 1.24
SEABIRD EXPLORATION LTD 42,391 NOK 12.72 0.03Petroleum 12.72 0.03
NOK
Total securities 41,866.44 98.35
Other assets 700.25 1.65
Net Asset Value 42,566.69 100.00
25The accompanying notes form an integral part of these financial statements
Page
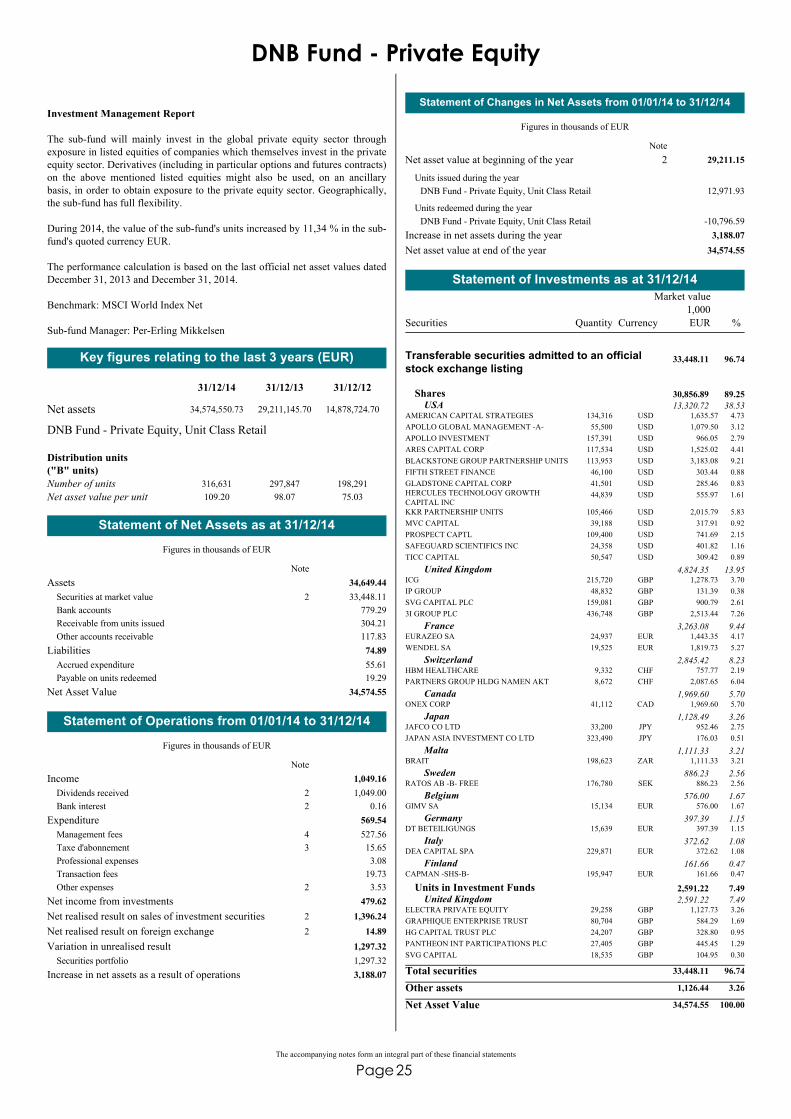
DNB Fund - Private Equity
Investment Management Report
The sub-fund will mainly invest in the global private equity sector throughexposure in listed equities of companies which themselves invest in the privateequity sector. Derivatives (including in particular options and futures contracts)on the above mentioned listed equities might also be used, on an ancillarybasis, in order to obtain exposure to the private equity sector. Geographically,the sub-fund has full flexibility.
During 2014, the value of the sub-fund's units increased by 11,34 % in the sub-fund's quoted currency EUR.
The performance calculation is based on the last official net asset values datedDecember 31, 2013 and December 31, 2014.
Benchmark: MSCI World Index Net
Sub-fund Manager: Per-Erling Mikkelsen
Key figures relating to the last 3 years (EUR)
Net assets
31/12/14 31/12/13 31/12/12
34,574,550.73 29,211,145.70 14,878,724.70
Number of unitsNet asset value per unit
Distribution units ("B" units)
316,631109.20
297,84798.07
198,29175.03
DNB Fund - Private Equity, Unit Class Retail
Assets 34,649.44Securities at market value 33,448.112Bank accounts 779.29Receivable from units issued 304.21Other accounts receivable 117.83
Liabilities 74.89Accrued expenditure 55.61Payable on units redeemed 19.29
Net Asset Value 34,574.55
Statement of Net Assets as at 31/12/14
Figures in thousands of EUR
Note
Income 1,049.16Dividends received 1,049.002Bank interest 0.162
Expenditure 569.54Management fees 527.564Taxe d'abonnement 15.653Professional expenses 3.08Transaction fees 19.73Other expenses 3.532
Net income from investments 479.62Net realised result on sales of investment securities 1,396.242Net realised result on foreign exchange 14.892Variation in unrealised result 1,297.32
Securities portfolio 1,297.32Increase in net assets as a result of operations 3,188.07
Statement of Operations from 01/01/14 to 31/12/14
Figures in thousands of EUR
Note
Statement of Changes in Net Assets from 01/01/14 to 31/12/14
Figures in thousands of EUR
Net asset value at beginning of the year 29,211.152
12,971.93DNB Fund - Private Equity, Unit Class RetailUnits issued during the year
-10,796.59DNB Fund - Private Equity, Unit Class RetailUnits redeemed during the year
Increase in net assets during the year 3,188.07Net asset value at end of the year 34,574.55
Note
Currency
Market value
QuantitySecurities %1,000
AMERICAN CAPITAL STRATEGIES 134,316 USD 1,635.57 4.73
Transferable securities admitted to an officialstock exchange listing
33,448.11 96.74
Shares 30,856.89 89.25USA 13,320.72 38.53
APOLLO GLOBAL MANAGEMENT -A- 55,500 USD 1,079.50 3.12APOLLO INVESTMENT 157,391 USD 966.05 2.79ARES CAPITAL CORP 117,534 USD 1,525.02 4.41BLACKSTONE GROUP PARTNERSHIP UNITS 113,953 USD 3,183.08 9.21FIFTH STREET FINANCE 46,100 USD 303.44 0.88GLADSTONE CAPITAL CORP 41,501 USD 285.46 0.83HERCULES TECHNOLOGY GROWTHCAPITAL INC
44,839 USD 555.97 1.61
KKR PARTNERSHIP UNITS 105,466 USD 2,015.79 5.83MVC CAPITAL 39,188 USD 317.91 0.92PROSPECT CAPTL 109,400 USD 741.69 2.15SAFEGUARD SCIENTIFICS INC 24,358 USD 401.82 1.16TICC CAPITAL 50,547 USD 309.42 0.89
ICG 215,720 GBP 1,278.73 3.70United Kingdom 4,824.35 13.95
IP GROUP 48,832 GBP 131.39 0.38SVG CAPITAL PLC 159,081 GBP 900.79 2.613I GROUP PLC 436,748 GBP 2,513.44 7.26
EURAZEO SA 24,937 EUR 1,443.35 4.17France 3,263.08 9.44
WENDEL SA 19,525 EUR 1,819.73 5.27
HBM HEALTHCARE 9,332 CHF 757.77 2.19Switzerland 2,845.42 8.23
PARTNERS GROUP HLDG NAMEN AKT 8,672 CHF 2,087.65 6.04
ONEX CORP 41,112 CAD 1,969.60 5.70Canada 1,969.60 5.70
JAFCO CO LTD 33,200 JPY 952.46 2.75Japan 1,128.49 3.26
JAPAN ASIA INVESTMENT CO LTD 323,490 JPY 176.03 0.51
BRAIT 198,623 ZAR 1,111.33 3.21Malta 1,111.33 3.21
RATOS AB -B- FREE 176,780 SEK 886.23 2.56Sweden 886.23 2.56
GIMV SA 15,134 EUR 576.00 1.67Belgium 576.00 1.67
DT BETEILIGUNGS 15,639 EUR 397.39 1.15Germany 397.39 1.15
DEA CAPITAL SPA 229,871 EUR 372.62 1.08Italy 372.62 1.08
CAPMAN -SHS-B- 195,947 EUR 161.66 0.47Finland 161.66 0.47
ELECTRA PRIVATE EQUITY 29,258 GBP 1,127.73 3.26
Units in Investment Funds 2,591.22 7.49United Kingdom 2,591.22 7.49
GRAPHIQUE ENTERPRISE TRUST 80,704 GBP 584.29 1.69HG CAPITAL TRUST PLC 24,207 GBP 328.80 0.95PANTHEON INT PARTICIPATIONS PLC 27,405 GBP 445.45 1.29SVG CAPITAL 18,535 GBP 104.95 0.30
Statement of Investments as at 31/12/14
EUR
Total securities 33,448.11 96.74
Other assets 1,126.44 3.26
Net Asset Value 34,574.55 100.00

26The accompanying notes form an integral part of these financial statements
Page
DNB Fund - Renewable EnergyInvestment Management Report
Emphasis is placed on investments in the equities of companies operating inthe renewable energy sector. Geographically, the sub-fund has full flexibility.
During 2014, the value of the sub-fund's units increased by 1,12 % in the sub-fund's quoted currency EUR.
The performance calculation is based on the last official net asset values datedDecember 31, 2013 and December 31, 2014.
Benchmark: WilderHill New Energy Global Innovation Index
Sub-fund Managers: Jon Sigurdsen and Christian Rom
Key figures relating to the last 3 years (EUR)
Net assets
31/12/14 31/12/13 31/12/12
21,172,243.65 25,094,740.49 18,636,424.17
Number of unitsNet asset value per unit
Capitalisation units("A" units)
248,08485.34
297,34584.40
298,56862.42
DNB Fund - Renewable Energy, Unit Class Retail
Assets 21,385.62Securities at market value 21,093.622Bank accounts 114.85Receivable from units issued 15.11Receivable from securities sold 144.19Other accounts receivable 17.85
Liabilities 213.38Accrued expenditure 32.77Payable on units redeemed 180.61
Net Asset Value 21,172.24
Statement of Net Assets as at 31/12/14
Figures in thousands of EUR
Note
Income 517.66Dividends received 349.392Bank interest 0.032Securities lending income 168.2411
Expenditure 596.48Management fees 471.354Taxe d'abonnement 16.573Professional expenses 3.43Transaction fees 97.53Other expenses 7.612
Net loss from investments -78.82Net realised result on sales of investment securities 2,263.712Net realised result on foreign exchange 824.762Variation in unrealised result -4,604.31
Securities portfolio -4,604.31Decrease in net assets as a result of operations -1,594.66
Statement of Operations from 01/01/14 to 31/12/14
Figures in thousands of EUR
Note
Statement of Changes in Net Assets from 01/01/14 to 31/12/14
Figures in thousands of EUR
Net asset value at beginning of the year 25,094.742Note
Statement of Changes in Net Assets from 01/01/14 to 31/12/14
Figures in thousands of EUR
37,867.03DNB Fund - Renewable Energy, Unit Class RetailUnits issued during the year
-40,194.86DNB Fund - Renewable Energy, Unit Class RetailUnits redeemed during the year
Decrease in net assets during the year -1,594.66Net asset value at end of the year 21,172.24
Note
Currency
Market value
QuantitySecurities %1,000
AMERESCO INC 57,175 USD 322.24 1.52
Transferable securities admitted to an officialstock exchange listing
21,092.72 99.63
Shares 21,092.72 99.63USA 7,670.43 36.24
CUMMINS INC 2,800 USD 336.72 1.59ENERNOC INC 41,590 USD 535.19 2.53FIRST SOLAR INC 12,000 USD 439.56 2.08GREEN PLAINS RENEW 29,009 USD 597.17 2.82ITRON INC 23,873 USD 840.29 3.97LSB INDUSTRIES INC -SHS- 15,200 USD 397.32 1.88OWENS CORNING SHS 16,350 USD 482.94 2.28POLYPORE INTL 8,779 USD 340.21 1.61RENEWABLE ENERGY GROUP INC 135,826 USD 1,097.43 5.18SILVER SPRING NETWORKS INC 39,009 USD 254.52 1.20SUNEDISON 27,200 USD 427.45 2.02SUNPOWER CORP 20,200 USD 427.63 2.02TENNECO 24,933 USD 1,171.76 5.54
CIE DE SAINT-GOBAIN SA 23,342 EUR 823.62 3.89France 2,874.35 13.58
SAFT GROUPE SA REG SHS 11,465 EUR 288.80 1.36VALEO SA 17,073 EUR 1,761.93 8.33
CHINA LONGYUAN POWER GROUP CORP -H-
1,368,000 HKD 1,170.99 5.53Hong Kong 2,229.91 10.53
CHINA SUNTIEN GREEN ENERGY CORPLTD-H-
5,002,000 HKD 859.50 4.06
TIANNENG POWER INTERNATIONAL LTD 912,678 HKD 199.42 0.94
ADVANCED METALLURGICAL GROUP NV 215,469 EUR 1,458.73 6.89The Netherlands 1,458.73 6.89
INTELLIGENT ENERGY HOLDIN-WI 231,580 GBP 497.05 2.35United Kingdom 1,258.31 5.94
IQE PLC 131,797 GBP 29.98 0.14TT GROUP PLC 552,739 GBP 731.28 3.45
ABENGOA -B- 393,647 EUR 716.83 3.38Spain 1,097.59 5.18
EDP RENOVAVEIS SA 70,302 EUR 380.76 1.80
SCATEC SOLAR ASA 258,144 NOK 873.67 4.13Norway 873.67 4.13
COSAN -A- 65,600 USD 420.46 1.99Bermuda 823.27 3.89
COSLIGHT TECH INTL 752,000 HKD 402.81 1.90
CANADIAN SOLAR INC 40,076 USD 779.82 3.68Canada 779.82 3.68
VERBUND AG 46,165 EUR 706.09 3.33Austria 706.09 3.33
TRACTEBEL ENERGIA SA 61,900 BRL 648.22 3.06Brazil 648.22 3.06
CHAOWEI POWER 394,000 HKD 136.66 0.65Cayman Islands 459.00 2.17
DAQO NEW ENERGY SPONS ADR REPR 25SHS
15,418 USD 322.34 1.52
NHPC LTD 868,785 INR 213.33 1.01India 213.33 1.01
CHINA METAL RECYCLING HOLDINGS 846,600 HKD 0.90 0.00
Other transferable securities 0.90 0.00
Shares 0.90 0.00Hong Kong 0.90 0.00
Statement of Investments as at 31/12/14
EUR

27The accompanying notes form an integral part of these financial statements
Page
Total securities 21,093.62 99.63
Other assets 78.62 0.37
Net Asset Value 21,172.24 100.00
Currency
Market value
QuantitySecurities %1,000EUR

28The accompanying notes form an integral part of these financial statements
Page
DNB Fund - TechnologyInvestment Management Report
Emphasis is placed on investments in the equities of companies operating in orassociated with the technology, media and telecom sectors. Geographically, thesub-fund has full flexibility.
During 2014, the value of the sub-fund's units increased by 21,04 % in the sub-fund's quoted currency EUR.
The performance calculation is based on the last official net asset values datedDecember 31, 2013 and December 31, 2014.
Benchmark: Custom TMT (indices: 66% MSCI Technology, 12% MSCIMedia, 22% MSCI Telecom)
Sub-fund Managers: Anders Tandberg-Johansen, Sverre Bergland and ErlingThune
Key figures relating to the last 3 years (EUR)
Net assets
31/12/14 31/12/13 31/12/12
134,318,636.58 95,424,435.06 40,485,620.44
Number of unitsNet asset value per unit
Capitalisation units("A" units)
439,824245.41
470,641202.75
277,890145.69
DNB Fund - Technology, Unit Class Retail (EUR)
Number of unitsNet asset value per unit
Capitalisation units("A" units)
121,462121.60
--
--
DNB Fund - Technology, Unit Class Institutional (EUR)
Number of unitsNet asset value per unit
Capitalisation units("A" units)
132,487106.50
--
--
DNB Fund - Technology, Unit Class Institutional (USD)
Assets 134,995.09Securities at market value 130,615.102Bank accounts 3,740.24Receivable from units issued 221.50Receivable from securities sold 395.26Other accounts receivable 22.99
Liabilities 676.45Accrued expenditure 238.94Payable on units redeemed 63.96Payable on securities purchased 373.56
Net Asset Value 134,318.64
Statement of Net Assets as at 31/12/14
Figures in thousands of EUR
Note
Income 1,253.11Dividends received 1,251.652Bank interest 1.462
Expenditure 1,982.45Management fees 1,612.124
Statement of Operations from 01/01/14 to 31/12/14
Figures in thousands of EUR
Note
Performance fees 67.545Taxe d'abonnement 53.373Professional expenses 12.91Transaction fees 190.68Other expenses 45.842
Net loss from investments -729.34Net realised result on sales of investment securities 14,362.302Net realised result on foreign exchange 1,438.332Variation in unrealised result 7,690.78
Securities portfolio 7,690.78Increase in net assets as a result of operations 22,762.06
Statement of Operations from 01/01/14 to 31/12/14
Figures in thousands of EUR
Note
Statement of Changes in Net Assets from 01/01/14 to 31/12/14
Figures in thousands of EUR
Net asset value at beginning of the year 95,424.442
51,471.56DNB Fund - Technology, Unit Class Retail (EUR)13,286.48DNB Fund - Technology, Unit Class Institutional (EUR)10,831.36DNB Fund - Technology, Unit Class Institutional (USD)
Units issued during the year
-57,605.38DNB Fund - Technology, Unit Class Retail (EUR)-769.95DNB Fund - Technology, Unit Class Institutional (EUR)
-1,081.93DNB Fund - Technology, Unit Class Institutional (USD)
Units redeemed during the year
Increase in net assets during the year 22,762.06Net asset value at end of the year 134,318.64
Note
Currency
Market value
QuantitySecurities %1,000
ACTIVISION BLIZZARD 107,700 USD 1,793.52 1.34
Transferable securities admitted to an officialstock exchange listing
130,615.10 97.24
Shares 130,615.10 97.24USA 81,660.82 60.81
ALTERA CORP 8,100 USD 249.02 0.19APPLE INC 91,219 USD 8,444.92 6.29ATMEL CORP 168,250 USD 1,162.83 0.87CISCO SYSTEMS INC 261,885 USD 6,110.79 4.55CITRIX SYSTEMS 45,100 USD 2,387.10 1.78CYAN 559,501 USD 1,118.63 0.83EBAY 113,100 USD 5,324.19 3.96EMC CORP 46,200 USD 1,146.07 0.85EMULEX CORP 172,820 USD 817.60 0.61EXPEDIA WI 67,300 USD 4,760.39 3.54FINISAR 57,712 USD 929.26 0.69GOOGLE -C- 7,367 USD 3,215.08 2.39GOOGLE INC 18,667 USD 8,221.22 6.12HEWLETT-PACKARD CO 46,600 USD 1,561.26 1.16IAC/INTERACTIVE CORP (WHEN ISSUED) 43,000 USD 2,176.53 1.62IBM CORP 5,200 USD 684.76 0.51JDS UNIPHASE CORP 92,200 USD 1,057.49 0.79JUNIPER NETWORKS INC 68,300 USD 1,273.95 0.95KULICKE SOFFA INDUSTRIES INC 93,200 USD 1,126.47 0.84MARVELL TECHNOLOGY GROUP LTD 365,400 USD 4,350.29 3.24MILLENNIAL MEDIA 745,700 USD 1,000.07 0.74NETGEAR INC 148,375 USD 4,427.81 3.30OCLARO 1,339,827 USD 2,050.42 1.53ORACLE CORP 240,000 USD 8,953.09 6.66O2MICRO INTERNATIONAL LTDADR 50REPR
393,000 USD 759.87 0.57
Q LOGIC 199,800 USD 2,156.80 1.61ROCKET FUEL INC 56,500 USD 739.14 0.55WESTERN DIGITAL CORP 8,100 USD 748.49 0.56XILINK INC 32,900 USD 1,178.87 0.88
Statement of Investments as at 31/12/14
EUR

29The accompanying notes form an integral part of these financial statements
Page
Currency
Market value
QuantitySecurities %1,000
YAHOO INC 24,000 USD 1,011.42 0.75YINGLI GREEN -ADR- REP 1 SHS 390,800 USD 723.47 0.54
ADVA OPTICAL NETWORKING 791,077 EUR 2,365.32 1.76Germany 8,876.51 6.61
SAP AG 111,761 EUR 6,511.19 4.85
SAMSUNG ELEC GDR REP.0.5 VGT HS -144A- 17,792 USD 8,856.48 6.59South Korea 8,856.48 6.59
PLAYTECH 670,009 GBP 5,941.14 4.42Isle of Man 5,941.14 4.42
MELLANOX TECHNOLOGIES LTD 136,096 USD 4,800.42 3.57Israel 4,800.42 3.57
KING DIGITAL 248,900 USD 3,209.04 2.39Ireland 3,209.04 2.39
CANADIAN SOLAR INC 124,000 USD 2,412.86 1.80Canada 3,152.39 2.35
QUEBECOR -B- SUBORD.VOTING 32,793 CAD 739.53 0.55
TOSHIBA CORP 768,000 JPY 2,710.59 2.02Japan 2,710.59 2.02
AVG TECHNOLOGIES 157,154 USD 2,611.91 1.94The Netherlands 2,611.91 1.94
ANITE 307,083 GBP 311.06 0.23United Kingdom 2,133.68 1.59
BLINKX -SHS- 1,468,657 GBP 508.12 0.38QUINDELL 840,419 GBP 430.17 0.32VODAFONE GROUP 310,360 GBP 884.33 0.66
BOUVET SHS 60,716 NOK 512.04 0.38Norway 2,109.91 1.57
REC SILICON 1,282,922 NOK 253.97 0.19TELENOR AS 231 NOK 3.88 0.00VI(Z)RT 341,134 NOK 1,340.02 1.00
ENEA AB 115,713 SEK 875.01 0.65Sweden 1,549.93 1.15
MODERN TIMES GROUP -B- 25,470 SEK 674.92 0.50
LENOVO GROUP LTD -RC- 1,254,000 HKD 1,356.71 1.01Hong Kong 1,356.71 1.01
GAMELOFT 295,805 EUR 982.08 0.73France 1,142.94 0.85
PARROT SA 7,503 EUR 160.86 0.12
TDC 79,249 DKK 502.63 0.37Denmark 502.63 0.37
EUR
Total securities 130,615.10 97.24
Other assets 3,703.54 2.76
Net Asset Value 134,318.64 100.00
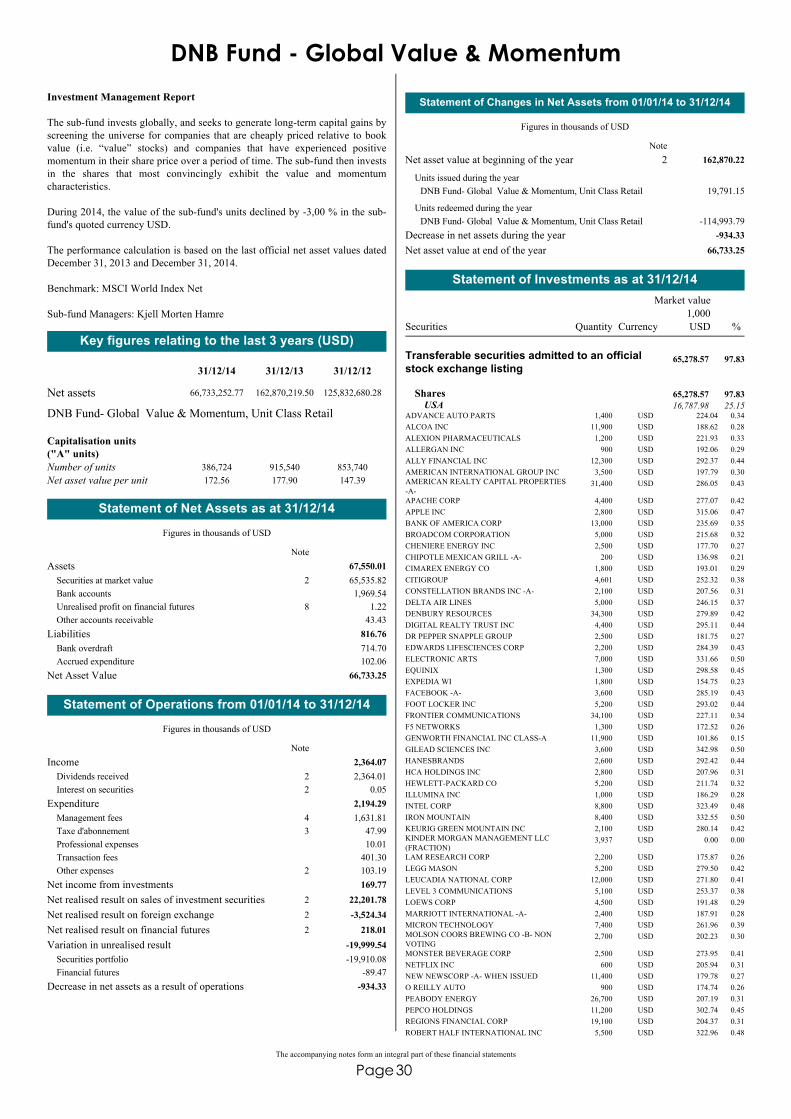
30The accompanying notes form an integral part of these financial statements
Page
DNB Fund - Global Value & MomentumInvestment Management Report
The sub-fund invests globally, and seeks to generate long-term capital gains byscreening the universe for companies that are cheaply priced relative to bookvalue (i.e. “value” stocks) and companies that have experienced positivemomentum in their share price over a period of time. The sub-fund then investsin the shares that most convincingly exhibit the value and momentumcharacteristics.
During 2014, the value of the sub-fund's units declined by -3,00 % in the sub-fund's quoted currency USD.
The performance calculation is based on the last official net asset values datedDecember 31, 2013 and December 31, 2014.
Benchmark: MSCI World Index Net
Sub-fund Managers: Kjell Morten Hamre
Key figures relating to the last 3 years (USD)
Net assets
31/12/14 31/12/13 31/12/12
66,733,252.77 162,870,219.50 125,832,680.28
Number of unitsNet asset value per unit
Capitalisation units("A" units)
386,724172.56
915,540177.90
853,740147.39
DNB Fund- Global Value & Momentum, Unit Class Retail
Assets 67,550.01Securities at market value 65,535.822Bank accounts 1,969.54Unrealised profit on financial futures 1.228Other accounts receivable 43.43
Liabilities 816.76Bank overdraft 714.70Accrued expenditure 102.06
Net Asset Value 66,733.25
Statement of Net Assets as at 31/12/14
Figures in thousands of USD
Note
Income 2,364.07Dividends received 2,364.012Interest on securities 0.052
Expenditure 2,194.29Management fees 1,631.814Taxe d'abonnement 47.993Professional expenses 10.01Transaction fees 401.30Other expenses 103.192
Net income from investments 169.77Net realised result on sales of investment securities 22,201.782Net realised result on foreign exchange -3,524.342Net realised result on financial futures 218.012Variation in unrealised result -19,999.54
Securities portfolio -19,910.08Financial futures -89.47
Decrease in net assets as a result of operations -934.33
Statement of Operations from 01/01/14 to 31/12/14
Figures in thousands of USD
Note
Statement of Changes in Net Assets from 01/01/14 to 31/12/14
Figures in thousands of USD
Net asset value at beginning of the year 162,870.222
19,791.15DNB Fund- Global Value & Momentum, Unit Class RetailUnits issued during the year
-114,993.79DNB Fund- Global Value & Momentum, Unit Class RetailUnits redeemed during the year
Decrease in net assets during the year -934.33Net asset value at end of the year 66,733.25
Note
Currency
Market value
QuantitySecurities %1,000
ADVANCE AUTO PARTS 1,400 USD 224.04 0.34
Transferable securities admitted to an officialstock exchange listing
65,278.57 97.83
Shares 65,278.57 97.83USA 16,787.98 25.15
ALCOA INC 11,900 USD 188.62 0.28ALEXION PHARMACEUTICALS 1,200 USD 221.93 0.33ALLERGAN INC 900 USD 192.06 0.29ALLY FINANCIAL INC 12,300 USD 292.37 0.44AMERICAN INTERNATIONAL GROUP INC 3,500 USD 197.79 0.30AMERICAN REALTY CAPITAL PROPERTIES-A-
31,400 USD 286.05 0.43
APACHE CORP 4,400 USD 277.07 0.42APPLE INC 2,800 USD 315.06 0.47BANK OF AMERICA CORP 13,000 USD 235.69 0.35BROADCOM CORPORATION 5,000 USD 215.68 0.32CHENIERE ENERGY INC 2,500 USD 177.70 0.27CHIPOTLE MEXICAN GRILL -A- 200 USD 136.98 0.21CIMAREX ENERGY CO 1,800 USD 193.01 0.29CITIGROUP 4,601 USD 252.32 0.38CONSTELLATION BRANDS INC -A- 2,100 USD 207.56 0.31DELTA AIR LINES 5,000 USD 246.15 0.37DENBURY RESOURCES 34,300 USD 279.89 0.42DIGITAL REALTY TRUST INC 4,400 USD 295.11 0.44DR PEPPER SNAPPLE GROUP 2,500 USD 181.75 0.27EDWARDS LIFESCIENCES CORP 2,200 USD 284.39 0.43ELECTRONIC ARTS 7,000 USD 331.66 0.50EQUINIX 1,300 USD 298.58 0.45EXPEDIA WI 1,800 USD 154.75 0.23FACEBOOK -A- 3,600 USD 285.19 0.43FOOT LOCKER INC 5,200 USD 293.02 0.44FRONTIER COMMUNICATIONS 34,100 USD 227.11 0.34F5 NETWORKS 1,300 USD 172.52 0.26GENWORTH FINANCIAL INC CLASS-A 11,900 USD 101.86 0.15GILEAD SCIENCES INC 3,600 USD 342.98 0.50HANESBRANDS 2,600 USD 292.42 0.44HCA HOLDINGS INC 2,800 USD 207.96 0.31HEWLETT-PACKARD CO 5,200 USD 211.74 0.32ILLUMINA INC 1,000 USD 186.29 0.28INTEL CORP 8,800 USD 323.49 0.48IRON MOUNTAIN 8,400 USD 332.55 0.50KEURIG GREEN MOUNTAIN INC 2,100 USD 280.14 0.42KINDER MORGAN MANAGEMENT LLC(FRACTION)
3,937 USD 0.00 0.00
LAM RESEARCH CORP 2,200 USD 175.87 0.26LEGG MASON 5,200 USD 279.50 0.42LEUCADIA NATIONAL CORP 12,000 USD 271.80 0.41LEVEL 3 COMMUNICATIONS 5,100 USD 253.37 0.38LOEWS CORP 4,500 USD 191.48 0.29MARRIOTT INTERNATIONAL -A- 2,400 USD 187.91 0.28MICRON TECHNOLOGY 7,400 USD 261.96 0.39MOLSON COORS BREWING CO -B- NONVOTING
2,700 USD 202.23 0.30
MONSTER BEVERAGE CORP 2,500 USD 273.95 0.41NETFLIX INC 600 USD 205.94 0.31NEW NEWSCORP -A- WHEN ISSUED 11,400 USD 179.78 0.27O REILLY AUTO 900 USD 174.74 0.26PEABODY ENERGY 26,700 USD 207.19 0.31PEPCO HOLDINGS 11,200 USD 302.74 0.45REGIONS FINANCIAL CORP 19,100 USD 204.37 0.31ROBERT HALF INTERNATIONAL INC 5,500 USD 322.96 0.48
Statement of Investments as at 31/12/14
USD

31The accompanying notes form an integral part of these financial statements
Page
Currency
Market value
QuantitySecurities %1,000
ROYAL CARIBBEAN CRUISES 3,100 USD 255.84 0.38SANDISK 2,700 USD 269.46 0.40SIGMA-ALDRICH CORP 2,200 USD 301.95 0.45SOUTHWEST AIRLINES CO 6,200 USD 261.45 0.39SPRINT SERIES -1- 34,700 USD 142.96 0.21SUPERIOR ENERGY SERVICES INC 14,700 USD 301.50 0.45TESLA MOTORS INC 900 USD 200.01 0.30TRANSDIGM GROUP 1,100 USD 217.31 0.33UNDER ARMOUR INC -A- 3,400 USD 232.32 0.35UNION PACIFIC CORP 2,500 USD 300.63 0.45UNITED CONTINENTAL HOLDINGS INC 4,200 USD 277.41 0.42UNITED RENTALS INC 1,700 USD 177.00 0.27VERTEX PHARMACEUTICALS INC 2,800 USD 333.61 0.50VOYA FINANCIAL INC 5,000 USD 214.30 0.32WESTERN DIGITAL CORP 2,500 USD 280.78 0.42WILLIAMS COS INC 3,300 USD 149.79 0.22WINDSTREAM HLDG INC 28,100 USD 232.39 0.35
ASAHI GLASS CO LTD 25,000 JPY 123.27 0.18Japan 10,047.83 15.06
BANK OF KYOTO 22,000 JPY 186.39 0.28BROTHER INDUSTRIES 8,600 JPY 158.68 0.24CASIO COMPUTER CO LTD 9,100 JPY 141.78 0.21CHIBA BANK 30,000 JPY 199.41 0.31CHUBU ELECTRIC POWER CO INC 12,000 JPY 142.50 0.21CHUGAI PHARMACEUTICAL 4,600 JPY 114.14 0.17CHUGOKU BANK LTD 14,100 JPY 194.77 0.29DAI NIPPON PRINTING CO LTD 17,000 JPY 155.13 0.23DAI-ICHI LIFE INSURANCE CO LT 12,700 JPY 195.74 0.29FUJITSU LTD 31,000 JPY 167.21 0.25FUKUOKA FINANCIAL GROUP 42,000 JPY 219.76 0.34GUNMA BANK LTD 33,000 JPY 216.87 0.33HACHIJUNI BANK 26,000 JPY 169.56 0.25HAKUHODO DY HOLDINGS INC 15,500 JPY 150.52 0.23HITACHI HIGH-TECHNOLOGIES 5,100 JPY 149.43 0.22HOKUGIN FINANCIAL GROUP 87,000 JPY 177.71 0.27HOYA CORP 6,900 JPY 237.13 0.37IBIDEN 9,500 JPY 142.20 0.21IDEMITSU KOSAN 10,000 JPY 167.27 0.25INPEX 15,600 JPY 175.72 0.26IYO BANK 17,000 JPY 186.58 0.28JAPAN DISPLAY INC 49,100 JPY 152.09 0.23JFE HOLDINGS INC 7,100 JPY 160.25 0.24JOYO BANK LTD 29,000 JPY 145.67 0.22JX HOLDINGS INC 39,200 JPY 154.17 0.23KANEKA CORP 30,000 JPY 162.75 0.24LIDA GROUP HOLDINGS CO LTD 10,300 JPY 127.45 0.19MARUBENI CORP 22,500 JPY 136.51 0.20MARUI GROUP CO LTD 19,900 JPY 182.26 0.27MEDIPAL HOLDINGS CORP 12,600 JPY 148.20 0.22MEIJI HLDGS 1,800 JPY 165.91 0.25MITSUBISHI CORP 7,400 JPY 137.34 0.21MITSUBISHI UFJ FINANCIAL GROUP INC 25,700 JPY 142.97 0.21MITSUI AND CO LTD 12,900 JPY 175.11 0.26MITSUI OSK LINES LTD 41,000 JPY 123.22 0.18MIZUHO FINANCIAL GROUP INC 78,000 JPY 132.23 0.20MS&AD INSURANCE GROUP HOLDING 7,000 JPY 168.80 0.25NAGOYA RAIL ROAD CO. LTD. 36,000 JPY 135.32 0.20NGK INSULATORS LTD 6,000 JPY 125.27 0.19NIDEC CORP 3,200 JPY 210.32 0.33NIPPON ELECTRIC GLASS CO LTD 19,000 JPY 86.69 0.13NIPPON PAINT HOLDINGS CO LTD 6,000 JPY 176.81 0.26NIPPON TELEGRAPH AND TELEPHONECORP
2,600 JPY 135.19 0.20
NIPPON YUSEN KK 67,000 JPY 191.83 0.29OJI HOLDINGS 54,000 JPY 195.75 0.29ORIENTAL LAND CO LTD 700 JPY 162.62 0.24SBI HOLDING 17,200 JPY 190.93 0.29SEIKO EPSON CORP 3,000 JPY 127.84 0.19SEVEN BANK 34,200 JPY 145.45 0.22SHIMIZU CORP 19,000 JPY 130.91 0.20SHINSEI BANK LTD 75,000 JPY 132.48 0.20SHIZUOKA BANK LTD 14,000 JPY 129.74 0.19SOMP JP NIPNKOA 5,800 JPY 148.14 0.22SUMITOMO CORP 12,000 JPY 124.77 0.19SUMITOMO MITSUI FINANCIAL GROUP INC 3,800 JPY 139.18 0.21SUZUKEN CO 5,500 JPY 153.79 0.23T AND D HOLDINGS INC 15,500 JPY 189.19 0.28TOKYO ELECTRIC POWER CO INC 38,800 JPY 159.81 0.24TOPPAN PRINTING 27,000 JPY 177.89 0.27TOYO SEIKAN KAISHA 9,700 JPY 122.78 0.18YAMADA DENKI CO LTD 53,200 JPY 180.82 0.27YAMAGUCHI FINANCIAL GROUP 18,000 JPY 187.61 0.28
USD Currency
Market value
QuantitySecurities %1,000
ADANI ENTERPRISE - DEMATERIALISED 26,102 INR 200.97 0.30India 5,481.45 8.21
ADANI PORTS 36,323 INR 183.48 0.27AUROBINDO PHARMA 13,314 INR 239.40 0.35BHARAT HEAVY ELECTRICALS LTD 46,411 INR 194.91 0.29CAIRN INDIA - SHS DEMARTERALISED 33,773 INR 128.62 0.19CIPLA LTD 13,915 INR 138.00 0.21DABUR INDIA LTD DEMATERIALISED 38,232 INR 141.49 0.21DIVI'S LABORATORIES LTD 6,144 INR 167.63 0.25GAIL (INDIA) SHS DEMATERIALISED 18,865 INR 132.85 0.20HCL TECHNOLOGIES LTD 6,678 INR 168.84 0.25HDFC BANK LTD 10,664 INR 160.67 0.24HERO HONDA MOTORS LTDDEMATERIALISED
3,626 INR 178.35 0.27
HINDALCO INDUSTRIES LTD 55,896 INR 139.43 0.21ICICI BANK 31,905 INR 178.36 0.27INDIA RAYON-SHS DEMATERIALISED 5,131 INR 137.29 0.21JINDAL STL & POWER 62,518 INR 150.30 0.23JSW STEEL -SHS- DEMATERIALISED 10,070 INR 167.05 0.25LARSEN & TOUBRO LTD 6,102 INR 144.40 0.22LIC HOUSING FINANCE LTD 28,905 INR 199.53 0.30MAHINDRA&MAHINDRA 6,661 INR 130.19 0.20MOTHERSON SUMI SYSTEMS LTD 21,513 INR 155.83 0.23POWER FINANCE 39,603 INR 188.98 0.28RANBAXY LABORATORIESDEMATERIALISED
16,638 INR 165.42 0.25
RELIANCE CAPITAL LTD 19,315 INR 151.31 0.23RELIANCE COMMUNICATIONDEMATERIALISED
71,375 INR 90.46 0.14
RELIANCE INFRASTRUCTUREDEMATERIALISED
27,245 INR 220.88 0.33
RURAL ELECTRIFICATI 35,829 INR 190.12 0.28SHIRAM TRANSPORT FINDEMATERIALISED
10,167 INR 178.40 0.27
SIEMENS DEMATERIALISED 10,926 INR 156.92 0.24STATE BANK OF INDIA 34,310 INR 169.40 0.25TATA MOTORS 18,299 INR 143.57 0.22TATA STEEL DEMATERIALISED 19,850 INR 125.52 0.19TECH MAHINDRA LTD - DEMATERIALISED 6,402 INR 262.88 0.38
AMOREG 237 KRW 217.39 0.33South Korea 5,124.50 7.68
AMOREPACIFIC CORP 67 KRW 136.70 0.20DAELIM INDUSTRIAL CO 2,344 KRW 141.75 0.21DGB FINANCIAL GROUP LTD 12,680 KRW 131.69 0.20DOOSAN HVY IND 5,920 KRW 128.68 0.19DOOSAN INFRACORE 13,780 KRW 123.10 0.18DOSSAN CO LTD 2,373 KRW 225.73 0.34GS ENGINEERING & CONSTRUCTION CORP 5,524 KRW 118.04 0.18GS HOLDINGS CO LTD 3,461 KRW 127.24 0.19HANA FINANCIAL GROUP INC 3,722 KRW 109.47 0.16HANVIT BANK 21,278 KRW 195.56 0.29HANWHA CHEMICAL CORPORATION 10,590 KRW 114.85 0.17HOTEL SHILLA LTD 1,313 KRW 110.30 0.17HYUNDAI HEAVY INDUSTRIES CO LTD 921 KRW 97.34 0.15HYUNDAI MIPO DOCK 1,960 KRW 125.56 0.19HYUNDAI MOTOR CO LTD 1,573 KRW 193.73 0.29HYUNDAI STEEL CO 2,137 KRW 124.72 0.19INDUSTRIAL BANK OF KOREA 16,940 KRW 219.53 0.33KB FINANCIAL GROUP INC 5,760 KRW 191.37 0.29KOREA ELECTRIC POWER CORP 6,040 KRW 237.04 0.36KOREA GAS CORP 3,148 KRW 143.36 0.21KOREA ZINC CO LTD 384 KRW 142.41 0.21KT CORPORATION 6,020 KRW 172.90 0.26LOTTE SHOPPING 516 KRW 129.47 0.19LS CABLE 2,288 KRW 114.18 0.17OCI COMPANY LTD 1,847 KRW 133.43 0.20POSCO 634 KRW 160.53 0.24SAMSUNG SDI CO LTD 1,180 KRW 125.80 0.19SHINHAN FINANCIAL GROUP 3,740 KRW 152.79 0.23SK C&C CO LTD 906 KRW 177.78 0.27SK HOLDINGS - SHS 1,120 KRW 168.30 0.25SK HYNIX INC 3,538 KRW 155.27 0.23SK INNOVATION 782 KRW 61.16 0.09WOORI INVESTMENT & SECURITIES COLTD
23,070 KRW 217.33 0.33
ALIMENTATION COUCHE - TARD INC 7,500 CAD 312.53 0.47Canada 3,256.28 4.88
BLACKBERRY LTD 28,800 CAD 317.24 0.48CANADIAN PACIFIC RAILWAY 1,000 CAD 193.63 0.29FAIRFAX FINANCIAL HOLDINGS SUB.VTG 600 CAD 315.96 0.47GOLDCORP 14,800 CAD 276.10 0.41KEYERA 2,200 CAD 153.68 0.23KINROSS GOLD CORP 39,500 CAD 110.82 0.17MEG ENERGY 17,400 CAD 301.62 0.45METRO -A- SUB VTG 3,800 CAD 303.01 0.45
USD

32The accompanying notes form an integral part of these financial statements
Page
Currency
Market value
QuantitySecurities %1,000
OPEN TEXT 4,000 CAD 236.54 0.35PENN WEST PETROLEUM 24,900 CAD 53.09 0.08RESTAURANT BRANDS INTERNATIONALINC
3,116 USD 121.12 0.18
TALISMAN ENERGY INC 43,700 CAD 343.30 0.52TECK RESOURCES LTD -B- 5,800 CAD 79.86 0.12TURQUOISE HILL 45,600 CAD 137.78 0.21
BANK OF COMMUNICATIONS -H- 222,000 HKD 207.21 0.31China 2,531.94 3.79
BBMG CORP 230,000 HKD 192.43 0.29CHINA CITIC BANK CORPORATION -H- 321,000 HKD 257.40 0.39CHINA COAL ENERGY CO LTD -H- 167,000 HKD 104.63 0.16CHINA COMM CONSTRUCTION -H- 234,000 HKD 281.45 0.41CHINA EVERBRIGHT BANK CO LTD 332,000 HKD 180.62 0.27CHINA NATIONAL BUILDING MATERIALCO -H-
156,000 HKD 151.64 0.23
CHINA SHIPPING CONTAINER LINES -H- 545,000 HKD 172.14 0.26CHONGQING RURAL -H- 341,000 HKD 212.33 0.32GUANGZHOU R&F PROPERTIES COMPANYLTD -H-
130,400 HKD 159.53 0.24
HUADIAN POWER INTERNATIONALCORPORATION
182,000 HKD 159.55 0.24
SHANGAI FOSUN PHARMACEUTICAL H 47,000 HKD 169.05 0.25SHANGHAI ELECTRIC GROUP CO LTD -H- 282,000 HKD 150.14 0.22YANZHOU COAL MINING CO -H- 158,000 HKD 133.82 0.20
CHINA AGRI-INDUSTRIES LTD -RC- 391,000 HKD 161.30 0.24Hong Kong 2,002.24 3.00
CHINA RAILWAY CONSTRUCTION -H- 162,500 HKD 206.98 0.31JIANGXI COPPER -H- 79,000 HKD 135.45 0.20KERRY PROPERTIES 42,000 HKD 152.42 0.23KINGBOARD CHEMICAL HOLDINGS LTD 84,000 HKD 141.86 0.21NEW WORLD DEVELOPMENT 136,000 HKD 156.39 0.23SHANGRI - LA ASIA LTD 108,000 HKD 148.98 0.22SINO-OCEAN LAND -RC- 297,500 HKD 169.14 0.25SUN HUNG KAI PROPERTIES LTD 14,000 HKD 213.51 0.33SWIRE PACIFIC LTD SIE A 16,500 HKD 214.83 0.33WHARF HOLDINGS 23,000 HKD 166.04 0.25WHEELOCK COMPANY LTD 29,000 HKD 135.34 0.20
AU OPTRONICS 492,000 TWD 251.71 0.38Taiwan 1,661.32 2.49
CHINA MOTOR CO LTD 162,000 TWD 142.99 0.21CLEVO 81,000 TWD 126.62 0.19INNOLUX DISPLAY 519,292 TWD 252.55 0.38LARGAN PRECISION CO LTD 2,000 TWD 151.27 0.23TAIWAN BUSINESS BANK 646,880 TWD 187.74 0.28UNIMICRON TECHNOLOGY CORP 246,000 TWD 187.62 0.28UNITED MICROELECTRONICS CORP 387,000 TWD 180.27 0.27WALSIN LIHWA CORPORATION 574,000 TWD 180.55 0.27
BNP PARIBAS SA 4,202 EUR 251.32 0.37France 1,627.14 2.44
CNP ASSURANCES 7,837 EUR 140.35 0.21CREDIT AGRICOLE SA 12,564 EUR 165.00 0.25GROUPE EUROTUNNEL 13,370 EUR 173.63 0.26NATIXIS SA 21,975 EUR 146.39 0.22NUMERICABLE SFR SA 3,542 EUR 176.29 0.26ORANGE 9,536 EUR 164.46 0.25PEUGEOT SA 37 EUR 0.46 0.00RENAULT SA 1,918 EUR 140.31 0.21SOCIETE GENERALE SA 3,874 EUR 164.73 0.25VALLOUREC SA 3,792 EUR 104.20 0.16
ASHTEAD GROUP 8,991 GBP 162.69 0.24United Kingdom 1,619.77 2.43
BARCLAYS PLC 47,360 GBP 179.49 0.27DIXONS CARPHONE PLC 25,393 GBP 181.60 0.27ENSCO -A- 6,200 USD 188.79 0.28J SAINSBURY PLC 37,143 GBP 142.48 0.21LSE GROUP 4,202 GBP 146.39 0.22NOBLE CORPORATION PLC 6,800 USD 115.87 0.17ROYAL BANK OF SCOTLAND 33,750 GBP 206.31 0.32STANDARD CHARTERED PLC 9,261 GBP 138.68 0.21VODAFONE GROUP 45,470 GBP 157.47 0.24
BANCO SANTANDER UNITS (50SHS+50PFDSHS)
33,400 BRL 169.14 0.25Brazil 1,394.83 2.09
BRADESPAR PFD SHS 10,190 BRL 54.82 0.08B2W CIA GLOBAL SHS 11,100 BRL 93.71 0.14CENTRAIS ELETRICAS BRASILEIRAS 24,000 BRL 52.37 0.08CESP PREFERD SHS -B- 14,100 BRL 142.22 0.21CIA PARANAENSE DE ENERGI-PFB 13,600 BRL 183.68 0.27ELETROBRAS (CENTR.ELET.BRASIL.)PREF.-B-
39,500 BRL 121.56 0.18
GERDAU METALUGICA PREF. 19,800 BRL 84.18 0.13GERDAU PREF. 25,200 BRL 90.83 0.14KROTON EDUCACIONAL SA 20,800 BRL 121.30 0.18OI PFD SHS 3,263 BRL 10.57 0.02
USD Currency
Market value
QuantitySecurities %1,000
PETROLEO BRASILEIRO 25,900 BRL 93.45 0.14PETROLEO BRASILEIRO -PETROBRAS-PREF.
27,700 BRL 104.42 0.16
USIMINAS PREF. -A- 38,200 BRL 72.58 0.11
BANCO POPOLARE AZ. POSTRAGGRUPPAMEN
10,162 EUR 124.25 0.19Italy 1,346.66 2.02
ENEL SPA 27,575 EUR 123.87 0.19INTESA SANPAOLO SPA 77,356 EUR 227.71 0.34MEDIOBANCA SPA 16,591 EUR 136.52 0.20MONTE PASCHI SIENA AZ POSTRAGGRUPPAMENT
102,948 EUR 58.81 0.09
TELECOM ITALIA SPA RISP 270,294 EUR 227.83 0.34UBI BANCA SCPA 43,965 EUR 318.46 0.48UNICREDIT SPA 19,927 EUR 129.21 0.19
GOLD FIELDS 43,276 ZAR 195.61 0.30South Africa 1,224.65 1.84
HARMONY GOLD MINING 65,309 ZAR 121.95 0.18INVESTEC LTD 15,919 ZAR 134.12 0.20MR.PRICE GROUP 8,087 ZAR 164.22 0.25NASPERS -N- 1,299 ZAR 170.06 0.25RESILIENT PROPERTY INCOME FUNDLIMITED
18,649 ZAR 135.34 0.20
STEINHOFF INTERNATIONAL HOLDINGSLTD
30,982 ZAR 159.02 0.24
TELKOM 23,861 ZAR 144.33 0.22
AVAGO TECHNOLOGIES 3,200 USD 322.72 0.47Singapore 1,204.36 1.80
FLEXTRONICS INTERNATIONAL LTD 26,800 USD 304.18 0.46HUTCHISON PORT HOLDINGS TRUST 342,000 USD 235.98 0.35KEPPEL LAND LTD 71,000 SGD 183.60 0.28UOL GROUP LTD 30,000 SGD 157.88 0.24
ACTAVIS PLC 1,300 USD 337.44 0.51Ireland 1,030.34 1.54
BANK OF IRELAND (GOV&CO) 463,218 EUR 177.26 0.27COVIDIEN PLC 3,300 USD 340.63 0.50MALLINCKRODT 1,800 USD 175.01 0.26
ALUMINA 106,734 AUD 157.07 0.24Australia 823.12 1.23
CALTEX AUSTRALIA LTD 5,946 AUD 166.76 0.25LEND LEASE CORP LTD - STAPLEDSECURITIES
12,318 AUD 165.62 0.25
QUANTAS AIRWAYS LTD 90,569 AUD 178.20 0.26TPG TELECOM LTD 28,094 AUD 155.47 0.23
ACTELION LTD NAMEN 1,412 CHF 164.54 0.25Switzerland 817.52 1.23
PARGESA HOLDING SA 1,823 CHF 141.96 0.21SWISS LIFE HOLDING N-NAMENREGISTERED
924 CHF 220.77 0.33
THE SWATCH GROUP REG 2,523 CHF 219.29 0.33TRANSOCEAN NAM.AKT 3,824 CHF 70.96 0.11
BANCO POPULAR ESPANOL 26,463 EUR 134.15 0.20Spain 765.52 1.15
BANKIA 80,919 EUR 121.66 0.18BANKINTER REG.SHS 16,519 EUR 134.92 0.20CAIXABANK 31,378 EUR 167.23 0.25RED ELECTRICA CORPORACION SA 2,342 EUR 207.56 0.32
ENEA 51,652 PLN 223.30 0.33Poland 718.25 1.08
GRUPA LOTOS SA 18,662 PLN 135.34 0.20JSW 7,759 PLN 36.96 0.06PGE POLSKA GRUPA ENERGETYCZNA S.A. 24,556 PLN 131.92 0.20TAURON POLSKA ENERGIA S.A 132,799 PLN 190.73 0.29
A.P. MOELLER-MAERSK -A- 80 DKK 156.03 0.23Denmark 634.88 0.95
COLOPLAST -B- 2,178 DKK 184.50 0.28PANDORA 1,889 DKK 155.54 0.23VESTAS WIND SYSTEMS AS 3,755 DKK 138.81 0.21
COMMERZBK 10,179 EUR 135.84 0.20Germany 610.13 0.91
DEUTSCHE BANK AG REG SHS 6,179 EUR 187.63 0.28MERCK KGAA 4 EUR 0.38 0.00PORSCHE AUTOMOBIL HLDG - VORZ.AKT-STIMMR
1,659 EUR 135.42 0.20
SYMRISE AG 2,476 EUR 150.86 0.23
AEGON NV 22,595 EUR 170.57 0.26The Netherlands 514.08 0.77
FIAT CHRYSLER AUTOMOBILES -A- 11,869 EUR 138.49 0.21FUGRO NV -CERT OF SHS 10,083 EUR 205.02 0.30
CHINA GAS HOLDINGS LTD 82,000 HKD 129.18 0.19Bermuda 502.83 0.75
PARTNERRE LTD 1,710 USD 197.01 0.30SIHUAN PHARMACEUTICAL HOLDINGSGROUP LTD
264,000 HKD 176.64 0.26
ERSTE GROUP BANK AG 6,048 EUR 141.40 0.21Austria 498.52 0.75
IMMOFINANZ 50,909 EUR 129.44 0.19
USD

33The accompanying notes form an integral part of these financial statements
Page
Currency
Market value
QuantitySecurities %1,000
OMV AG 3,896 EUR 104.22 0.16RAIFFEISEN BANK INTERNATIONAL-HOLDING AG
8,104 EUR 123.46 0.19
AGEAS NOM 4,614 EUR 165.82 0.25Belgium 459.13 0.69
BELGACOM SA 4,433 EUR 160.91 0.24GROUPE BRUXELLES LAMBERT GBL 1,541 EUR 132.40 0.20
GAZPROM OAO ADR 21,776 USD 103.98 0.16Russia 411.12 0.62
LUKOIL HOLDINGS ADR REPR.1 SHS 5,405 USD 217.50 0.33ROSNEFT OIL-GDR- 26,052 USD 89.64 0.13
MERIDIAN ENREGY 109,923 NZD 151.72 0.23New Zealand 299.00 0.45
MIGHTY RIVER POWER 63,022 NZD 147.28 0.22
EVERGRANDE REAL ESTATE GROUP LTD 368,000 HKD 148.96 0.22Cayman Islands 286.37 0.43
SOHO CHINA 194,500 HKD 137.41 0.21
NORSK HYDRO ASA 27,052 NOK 154.84 0.24Norway 251.52 0.38
SUBSEA 7 SA 9,365 NOK 96.68 0.14
BANK LEUMI LE-ISRAEL 66,162 ILS 225.48 0.34Israel 225.48 0.34
EREGLI DEMIR VE CELIK 107,130 TRY 202.47 0.30Turkey 202.47 0.30
ARCELORMITTAL SA REG SHS 14,073 EUR 155.72 0.23Luxembourg 155.72 0.23
GOLDEN AGRI-RESOURCES 428,000 SGD 148.87 0.22Mauritius 148.87 0.22
GRUMA SHS-B- 13,900 MXN 143.72 0.22Mexico 143.72 0.22
SHIRE 1,922 GBP 134.67 0.20Jersey Island 134.67 0.20
ORION CORPORATION (NEW) -B- 4,029 EUR 126.19 0.19Finland 126.19 0.19
MOL HUNGARIAN OIL AND GAS PLC -A- 2,782 HUF 123.71 0.19Hungary 123.71 0.19
PUBLIC POWER CORP OF GREECE 12,961 EUR 84.28 0.13Greece 84.28 0.13
BANCO ESPIRIT SANTO E COMMERCIALLISBOA
144,518 EUR 0.18 0.00Portugal 0.18 0.00
HERMES MICROVISION INC 3,000 TWD 151.58 0.22
Transferable securities dealt in on anotherregulated market
256.38 0.38
Shares 256.38 0.38Taiwan 151.58 0.22
RUSHYDRO ADR REPR 100 SHS 112,686 USD 104.80 0.16Russia 104.80 0.16
SNS REAAL NV 71,850 EUR 0.87 0.00
Other transferable securities 0.87 0.00
Shares 0.87 0.00The Netherlands 0.87 0.00
IMMOEAST RIGHT 45,964 EUR 0.00 0.00
Warrants, rights 0.00 0.00Austria 0.00 0.00
USD
Total securities 65,535.82 98.21
Other assets 1,197.43 1.79
Net Asset Value 66,733.25 100.00
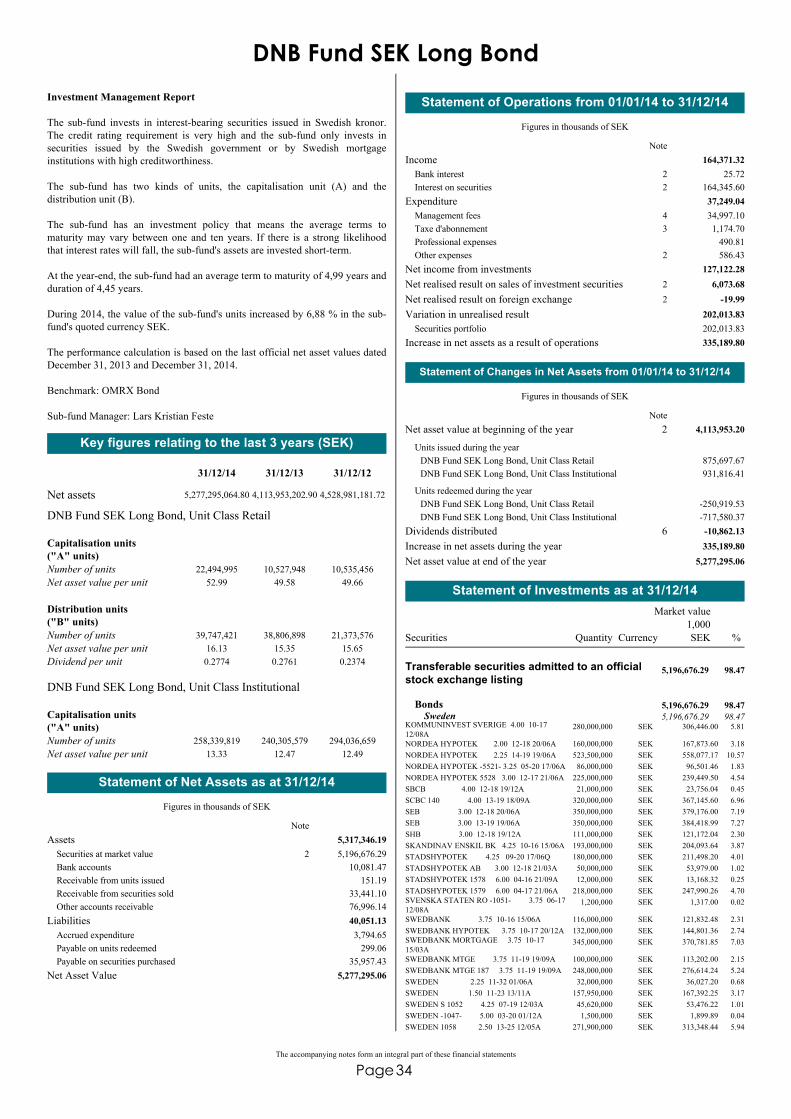
34The accompanying notes form an integral part of these financial statements
Page
DNB Fund SEK Long BondInvestment Management Report
The sub-fund invests in interest-bearing securities issued in Swedish kronor.The credit rating requirement is very high and the sub-fund only invests insecurities issued by the Swedish government or by Swedish mortgageinstitutions with high creditworthiness. The sub-fund has two kinds of units, the capitalisation unit (A) and thedistribution unit (B).
The sub-fund has an investment policy that means the average terms tomaturity may vary between one and ten years. If there is a strong likelihoodthat interest rates will fall, the sub-fund's assets are invested short-term.
At the year-end, the sub-fund had an average term to maturity of 4,99 years andduration of 4,45 years.
During 2014, the value of the sub-fund's units increased by 6,88 % in the sub-fund's quoted currency SEK.
The performance calculation is based on the last official net asset values datedDecember 31, 2013 and December 31, 2014.
Benchmark: OMRX Bond
Sub-fund Manager: Lars Kristian Feste
Key figures relating to the last 3 years (SEK)
Net assets
31/12/14 31/12/13 31/12/12
5,277,295,064.80 4,113,953,202.90 4,528,981,181.72
Number of unitsNet asset value per unit
Capitalisation units("A" units)
22,494,99552.99
10,527,94849.58
10,535,45649.66
Number of unitsNet asset value per unitDividend per unit
Distribution units ("B" units)
39,747,42116.130.2774
38,806,89815.350.2761
21,373,57615.650.2374
DNB Fund SEK Long Bond, Unit Class Retail
Number of unitsNet asset value per unit
Capitalisation units("A" units)
258,339,81913.33
240,305,57912.47
294,036,65912.49
DNB Fund SEK Long Bond, Unit Class Institutional
Assets 5,317,346.19Securities at market value 5,196,676.292Bank accounts 10,081.47Receivable from units issued 151.19Receivable from securities sold 33,441.10Other accounts receivable 76,996.14
Liabilities 40,051.13Accrued expenditure 3,794.65Payable on units redeemed 299.06Payable on securities purchased 35,957.43
Net Asset Value 5,277,295.06
Statement of Net Assets as at 31/12/14
Figures in thousands of SEK
Note
Income 164,371.32Bank interest 25.722Interest on securities 164,345.602
Expenditure 37,249.04Management fees 34,997.104Taxe d'abonnement 1,174.703Professional expenses 490.81Other expenses 586.432
Net income from investments 127,122.28Net realised result on sales of investment securities 6,073.682Net realised result on foreign exchange -19.992Variation in unrealised result 202,013.83
Securities portfolio 202,013.83Increase in net assets as a result of operations 335,189.80
Statement of Operations from 01/01/14 to 31/12/14
Figures in thousands of SEK
Note
Statement of Changes in Net Assets from 01/01/14 to 31/12/14
Figures in thousands of SEK
Net asset value at beginning of the year 4,113,953.202
875,697.67DNB Fund SEK Long Bond, Unit Class Retail931,816.41DNB Fund SEK Long Bond, Unit Class Institutional
Units issued during the year
-250,919.53DNB Fund SEK Long Bond, Unit Class Retail-717,580.37DNB Fund SEK Long Bond, Unit Class Institutional
Units redeemed during the year
Dividends distributed -10,862.136Increase in net assets during the year 335,189.80Net asset value at end of the year 5,277,295.06
Note
Currency
Market value
QuantitySecurities %1,000
KOMMUNINVEST SVERIGE 4.00 10-1712/08A
280,000,000 SEK 306,446.00 5.81
Transferable securities admitted to an officialstock exchange listing
5,196,676.29 98.47
Bonds 5,196,676.29 98.47Sweden 5,196,676.29 98.47
NORDEA HYPOTEK 2.00 12-18 20/06A 160,000,000 SEK 167,873.60 3.18NORDEA HYPOTEK 2.25 14-19 19/06A 523,500,000 SEK 558,077.17 10.57NORDEA HYPOTEK -5521- 3.25 05-20 17/06A 86,000,000 SEK 96,501.46 1.83NORDEA HYPOTEK 5528 3.00 12-17 21/06A 225,000,000 SEK 239,449.50 4.54SBCB 4.00 12-18 19/12A 21,000,000 SEK 23,756.04 0.45SCBC 140 4.00 13-19 18/09A 320,000,000 SEK 367,145.60 6.96SEB 3.00 12-18 20/06A 350,000,000 SEK 379,176.00 7.19SEB 3.00 13-19 19/06A 350,000,000 SEK 384,418.99 7.27SHB 3.00 12-18 19/12A 111,000,000 SEK 121,172.04 2.30SKANDINAV ENSKIL BK 4.25 10-16 15/06A 193,000,000 SEK 204,093.64 3.87STADSHYPOTEK 4.25 09-20 17/06Q 180,000,000 SEK 211,498.20 4.01STADSHYPOTEK AB 3.00 12-18 21/03A 50,000,000 SEK 53,979.00 1.02STADSHYPOTEK 1578 6.00 04-16 21/09A 12,000,000 SEK 13,168.32 0.25STADSHYPOTEK 1579 6.00 04-17 21/06A 218,000,000 SEK 247,990.26 4.70SVENSKA STATEN RO -1051- 3.75 06-1712/08A
1,200,000 SEK 1,317.00 0.02
SWEDBANK 3.75 10-16 15/06A 116,000,000 SEK 121,832.48 2.31SWEDBANK HYPOTEK 3.75 10-17 20/12A 132,000,000 SEK 144,801.36 2.74SWEDBANK MORTGAGE 3.75 10-1715/03A
345,000,000 SEK 370,781.85 7.03
SWEDBANK MTGE 3.75 11-19 19/09A 100,000,000 SEK 113,202.00 2.15SWEDBANK MTGE 187 3.75 11-19 19/09A 248,000,000 SEK 276,614.24 5.24SWEDEN 2.25 11-32 01/06A 32,000,000 SEK 36,027.20 0.68SWEDEN 1.50 11-23 13/11A 157,950,000 SEK 167,392.25 3.17SWEDEN S 1052 4.25 07-19 12/03A 45,620,000 SEK 53,476.22 1.01SWEDEN -1047- 5.00 03-20 01/12A 1,500,000 SEK 1,899.89 0.04SWEDEN 1058 2.50 13-25 12/05A 271,900,000 SEK 313,348.44 5.94
Statement of Investments as at 31/12/14
SEK
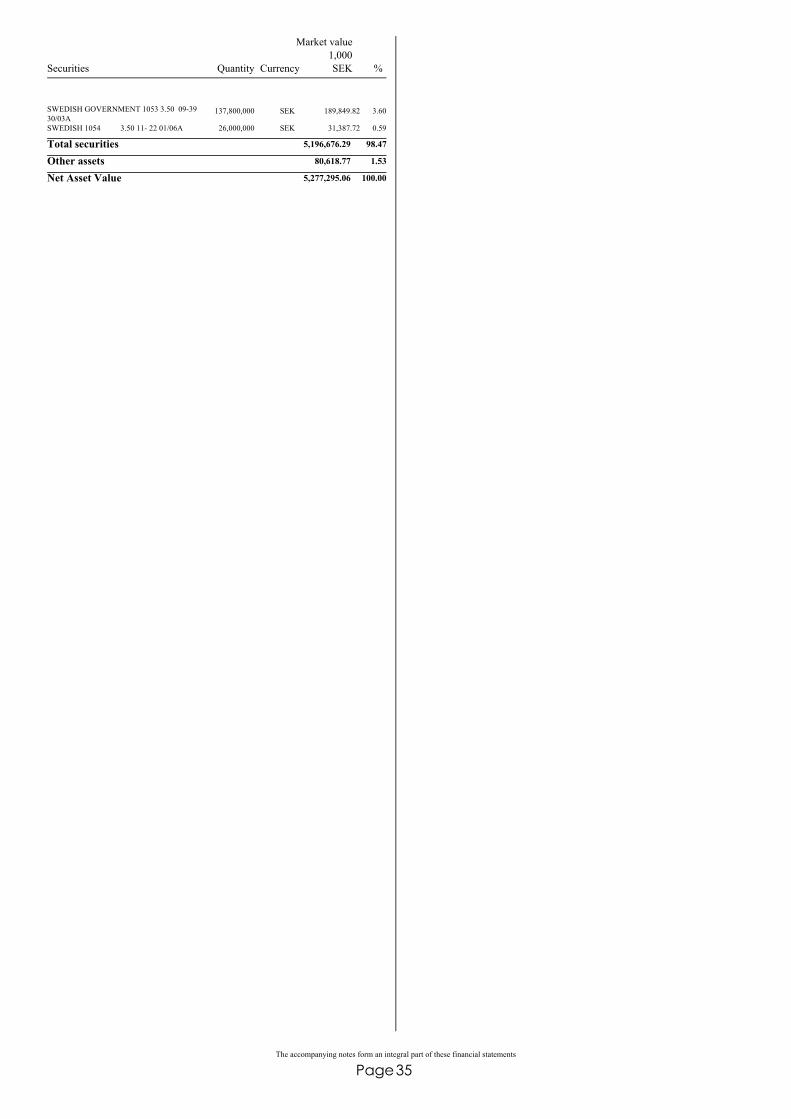
35The accompanying notes form an integral part of these financial statements
Page
Currency
Market value
QuantitySecurities %1,000
SWEDISH GOVERNMENT 1053 3.50 09-3930/03A
137,800,000 SEK 189,849.82 3.60
SWEDISH 1054 3.50 11- 22 01/06A 26,000,000 SEK 31,387.72 0.59
SEK
Total securities 5,196,676.29 98.47
Other assets 80,618.77 1.53
Net Asset Value 5,277,295.06 100.00

36The accompanying notes form an integral part of these financial statements
Page
DNB Fund SEK Short BondInvestment Management Report
The sub-fund invests in Swedish interest-bearing securities that are issued inSwedish kronor. The credit rating requirement is very high and the sub-fundonly invests in securities issued by the government or institutions with highcreditworthiness.
The sub-fund has two kinds of units, the capitalisation unit (A) and thedistribution unit (B).
The sub-fund has an investment policy that means that the average term tomaturity can vary between one and twelve months. The short-dated maturity ofsecurities in which the sub-fund invests means that the sub-fund is relativelyinsensitive to interest rate fluctuations.
At the year-end, the average term to maturity was 0,64 years and duration 0,62years.
During 2014, the value of the sub-fund's units increased by 0,76 % in the sub-fund's quoted currency SEK.
The performance calculation is based on the last official net asset values datedDecember 31, 2013 and December 31, 2014.
Benchmark: OMRX MM
Sub-fund Manager: Maud Ljungqvist
Key figures relating to the last 3 years (SEK)
Net assets
31/12/14 31/12/13 31/12/12
1,702,778,897.42 1,957,746,268.09 2,915,294,577.90
Number of unitsNet asset value per unit
Capitalisation units("A" units)
53,042,42227.33
57,131,85427.13
90,599,70126.90
Number of unitsNet asset value per unitDividend per unit
Distribution units ("B" units)
25,263,72710.020.1000
40,638,68410.040.1000
47,575,87410.050.1700
DNB Fund SEK Short Bond, Unit Class Retail
Assets 1,799,680.72Securities at market value 1,683,603.642Bank accounts 9,877.54Receivable from units issued 2.50Receivable from securities sold 92,822.78Other accounts receivable 13,374.26
Liabilities 96,901.82Accrued expenditure 677.32Payable on units redeemed 1,029.10Payable on securities purchased 95,195.40
Net Asset Value 1,702,778.90
Statement of Net Assets as at 31/12/14
Figures in thousands of SEK
Note
Income 56,106.89Bank interest 9.302Interest on securities 56,097.592
Statement of Operations from 01/01/14 to 31/12/14
Figures in thousands of SEK
Note
Expenditure 6,244.36Management fees 5,779.624Taxe d'abonnement 163.453Professional expenses 101.90Other expenses 199.392
Net income from investments 49,862.53Net realised result on sales of investment securities -38,237.052Net realised result on foreign exchange -10.802Variation in unrealised result 848.19
Securities portfolio 848.19Increase in net assets as a result of operations 12,462.86
Statement of Operations from 01/01/14 to 31/12/14
Figures in thousands of SEK
Note
Statement of Changes in Net Assets from 01/01/14 to 31/12/14
Figures in thousands of SEK
Net asset value at beginning of the year 1,957,746.272
942,980.13DNB Fund SEK Short Bond, Unit Class RetailUnits issued during the year
-1,207,781.70DNB Fund SEK Short Bond, Unit Class RetailUnits redeemed during the year
Dividends distributed -2,628.676Increase in net assets during the year 12,462.86Net asset value at end of the year 1,702,778.90
Note
Currency
Market value
QuantitySecurities %1,000
NORDEA HYPOTEK AB 3.25 05-17 17/06A 205,000,000 SEK 207,763.40 12.20
Transferable securities admitted to an officialstock exchange listing
1,683,603.64 98.87
Bonds 1,683,603.64 98.87Sweden 1,683,603.64 98.87
SKANDINAVISKA ENSKILDA 4.00 10-1517/06A
310,000,000 SEK 315,223.50 18.51
STADSHYPOTEK 1577 6.00 04-15 16/12A 400,000,000 SEK 421,824.01 24.78SUEDE (ROYAUME DE) ZCP 170615 173,300,000 SEK 173,229.48 10.17SUEDE (ROYAUME DE) ZCP 180315 102,000,000 SEK 101,935.29 5.99SUEDE (ROYAUME DE) ZCP 210115 68,000,000 SEK 67,969.66 3.99SWEDBANK MORTGAGE 183 3.75 10-1516/09A
60,000,000 SEK 61,470.60 3.61
SWEDEN TREASURY BILLS -15 18/02U 12,000,000 SEK 11,997.89 0.70SWEDEN -1049- 4.50 04-15 12/08A 1,000,000 SEK 1,026.40 0.06SWEDEN -1050- 3.00 05-16 07/12A 1,000,000 SEK 1,045.01 0.06SWEDISH COVERED BOND 4.00 09-1518/11A
310,000,000 SEK 320,118.40 18.80
Statement of Investments as at 31/12/14
SEK
Total securities 1,683,603.64 98.87
Other assets 19,175.26 1.13
Net Asset Value 1,702,778.90 100.00

37The accompanying notes form an integral part of these financial statements
Page
DNB Fund - ECO Absolute ReturnInvestment Management Report
The sub-fund aims to achieve a positive absolute return, by taking long andshort positions primarily in equities or equity related derivative contracts ofcompanies operating in or associated with renewable energy.
During 2014, the Unit Class Retail (EUR) declined in value by -1,58 % inEUR.
During 2014, the Unit Class Retail (SEK) declined in value by -1,14 % in SEK.
During 2014, the Unit Class Retail (NOK) declined in value by -0,74 % inNOK.
The performance calculation is based on the last official net asset values datedDecember 31, 2013 and December 31, 2014.
Benchmark: Unit Class Retail (EUR) - German 3 mth Bubill Unit Class Retail (SEK) - OMRX TBILLUnit Class Retail (NOK) - ST1XUnit Class Retail (USD) - USGG3M
Sub-fund Managers: Jon Sigurdsen and Christian Rom
Key figures relating to the last 3 years (EUR)
Net assets
31/12/14 31/12/13 31/12/12
26,458,399.06 29,501,798.88 64,671,232.58
Number of unitsNet asset value per unit
Capitalisation units("A" units)
21,691100.08
16,862101.68
65,540118.58
DNB Fund - ECO Absolute Return, Unit Class Retail (EUR)
Number of unitsNet asset value per unit
Capitalisation units("A" units)
116,1961,050.33
129,5911,062.44
137,5611,226.12
DNB Fund - ECO Absolute Return, Unit Class Retail (SEK)
Number of unitsNet asset value per unit
Capitalisation units("A" units)
96,7201,051.89
96,4321,059.73
226,1591,215.20
DNB Fund - ECO Absolute Return, Unit Class Retail (NOK)
Assets 30,175.03Securities at market value 25,980.732Bank accounts 3,797.59Receivable from units issued 6.47Receivable from securities sold 129.82Other accounts receivable 260.42
Liabilities 3,716.63Accrued expenditure 83.16Payable on units redeemed 121.65Unrealised loss on forward foreign exchange contracts 760.177Unrealised loss on swaps 1,254.229Other accounts payable 1,497.42
Net Asset Value 26,458.40
Statement of Net Assets as at 31/12/14
Figures in thousands of EUR
Note
Income 1,164.52Dividends received 102.432Bank interest 7.312Interest on securities 400.022Securities lending income 654.7611
Expenditure 962.01Management fees 550.654Performance fees 230.415Taxe d'abonnement 17.883Professional expenses 3.08Transaction fees 142.23Other expenses 17.772
Net income from investments 202.51Net realised result on sales of investment securities 2,911.112Net realised result on foreign exchange -266.312Net realised result on forward foreign exchangecontracts
-984.152
Net realised result on swaps 1,727.34Variation in unrealised result -5,587.59
Securities portfolio -3,117.85Swaps -1,254.22Forward foreign exchange contracts -1,215.52
Decrease in net assets as a result of operations -1,997.10
Statement of Operations from 01/01/14 to 31/12/14
Figures in thousands of EUR
Note
Statement of Changes in Net Assets from 01/01/14 to 31/12/14
Figures in thousands of EUR
Net asset value at beginning of the year 29,501.802
3,001.42DNB Fund - ECO Absolute Return, Unit Class Retail (EUR)5,809.69DNB Fund - ECO Absolute Return, Unit Class Retail (SEK)
10,643.81DNB Fund - ECO Absolute Return, Unit Class Retail (NOK)
Units issued during the year
-2,448.63DNB Fund - ECO Absolute Return, Unit Class Retail (EUR)-7,453.94DNB Fund - ECO Absolute Return, Unit Class Retail (SEK)
-10,598.65DNB Fund - ECO Absolute Return, Unit Class Retail (NOK)
Units redeemed during the year
Decrease in net assets during the year -1,997.10Net asset value at end of the year 26,458.40
Note
Currency
Market value
QuantitySecurities %1,000
BRD 0.25 13-15 13/03A 5,000,000 EUR 5,002.30 18.90
Transferable securities admitted to an officialstock exchange listing
25,977.54 98.18
Bonds 14,864.06 56.18Germany 7,310.86 27.63
GERMANY -156- 2.50 10-15 27/02A 2,300,000 EUR 2,308.56 8.73
FRANCE FTB 3.50 05-15 25/04A 4,000,000 EUR 4,042.28 15.28France 4,042.28 15.28
NEDERLAND 2.75 09-15 15/01A 3,000,000 EUR 3,002.10 11.35The Netherlands 3,510.92 13.27
NEDERLAND 3.25 05-15 15/07A 500,000 EUR 508.82 1.92
CERES POWER HOLGINGS 5,397,352 GBP 626.08 2.37
Shares 11,113.48 42.00United Kingdom 1,848.79 7.00
INTELLIGENT ENERGY HOLDIN-WI 569,669 GBP 1,222.71 4.63
CAPITAL STAGE AG 69,913 EUR 336.28 1.27Germany 1,609.45 6.08
PNE WIND AG REG SHS KAPIT. 582,421 EUR 1,273.17 4.81
INFIGEN ENERGY - TRIPLE STAPLEDSECURITY
7,701,886 AUD 1,246.85 4.71Australia 1,246.85 4.71
Statement of Investments as at 31/12/14
EUR

38The accompanying notes form an integral part of these financial statements
Page
Currency
Market value
QuantitySecurities %1,000
SCATEC SOLAR ASA 330,282 NOK 1,117.81 4.22Norway 1,117.81 4.22
CHINA SUNTIEN GREEN ENERGY CORPLTD-H-
6,470,000 HKD 1,111.75 4.20Hong Kong 1,111.75 4.20
VERBUND AG 71,498 EUR 1,093.56 4.13Austria 1,093.56 4.13
CHAOWEI POWER 643,000 HKD 223.02 0.84Cayman Islands 953.27 3.60
DAQO NEW ENERGY SPONS ADR REPR 25SHS
34,929 USD 730.25 2.76
AEMETIS INC 117,548 USD 542.58 2.05USA 789.33 2.98
PACIFIC ETHANOL 28,002 USD 246.75 0.93
ABENGOA -B- 399,652 EUR 727.77 2.75Spain 727.77 2.75
COSLIGHT TECH INTL 650,000 HKD 348.17 1.32Bermuda 348.17 1.32
HYDROGENICS CORP 24,175 USD 266.73 1.01Canada 266.73 1.01
CHINA METAL RECYCLING HOLDINGS 3,009,600 HKD 3.19 0.01
Other transferable securities 3.19 0.01
Shares 3.19 0.01Hong Kong 3.19 0.01
EUR
Total securities 25,980.73 98.19
Other assets 477.67 1.81
Net Asset Value 26,458.40 100.00
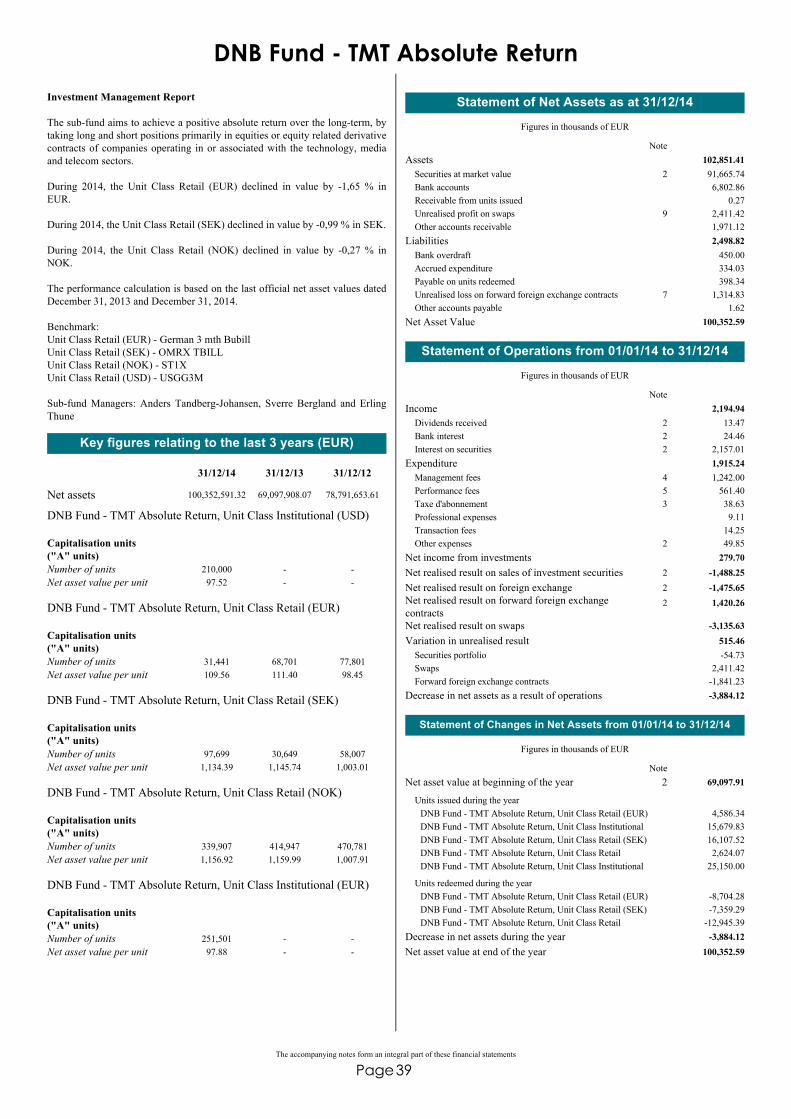
39The accompanying notes form an integral part of these financial statements
Page
DNB Fund - TMT Absolute ReturnInvestment Management Report
The sub-fund aims to achieve a positive absolute return over the long-term, bytaking long and short positions primarily in equities or equity related derivativecontracts of companies operating in or associated with the technology, mediaand telecom sectors.
During 2014, the Unit Class Retail (EUR) declined in value by -1,65 % inEUR.
During 2014, the Unit Class Retail (SEK) declined in value by -0,99 % in SEK.
During 2014, the Unit Class Retail (NOK) declined in value by -0,27 % inNOK.
The performance calculation is based on the last official net asset values datedDecember 31, 2013 and December 31, 2014.
Benchmark: Unit Class Retail (EUR) - German 3 mth Bubill Unit Class Retail (SEK) - OMRX TBILLUnit Class Retail (NOK) - ST1XUnit Class Retail (USD) - USGG3M
Sub-fund Managers: Anders Tandberg-Johansen, Sverre Bergland and ErlingThune
Key figures relating to the last 3 years (EUR)
Net assets
31/12/14 31/12/13 31/12/12
100,352,591.32 69,097,908.07 78,791,653.61
Number of unitsNet asset value per unit
Capitalisation units("A" units)
210,00097.52
--
--
DNB Fund - TMT Absolute Return, Unit Class Institutional (USD)
Number of unitsNet asset value per unit
Capitalisation units("A" units)
31,441109.56
68,701111.40
77,80198.45
DNB Fund - TMT Absolute Return, Unit Class Retail (EUR)
Number of unitsNet asset value per unit
Capitalisation units("A" units)
97,6991,134.39
30,6491,145.74
58,0071,003.01
DNB Fund - TMT Absolute Return, Unit Class Retail (SEK)
Number of unitsNet asset value per unit
Capitalisation units("A" units)
339,9071,156.92
414,9471,159.99
470,7811,007.91
DNB Fund - TMT Absolute Return, Unit Class Retail (NOK)
Number of unitsNet asset value per unit
Capitalisation units("A" units)
251,50197.88
--
--
DNB Fund - TMT Absolute Return, Unit Class Institutional (EUR)
Assets 102,851.41Securities at market value 91,665.742Bank accounts 6,802.86Receivable from units issued 0.27Unrealised profit on swaps 2,411.429Other accounts receivable 1,971.12
Liabilities 2,498.82Bank overdraft 450.00Accrued expenditure 334.03Payable on units redeemed 398.34Unrealised loss on forward foreign exchange contracts 1,314.837Other accounts payable 1.62
Net Asset Value 100,352.59
Statement of Net Assets as at 31/12/14
Figures in thousands of EUR
Note
Income 2,194.94Dividends received 13.472Bank interest 24.462Interest on securities 2,157.012
Expenditure 1,915.24Management fees 1,242.004Performance fees 561.405Taxe d'abonnement 38.633Professional expenses 9.11Transaction fees 14.25Other expenses 49.852
Net income from investments 279.70Net realised result on sales of investment securities -1,488.252Net realised result on foreign exchange -1,475.652Net realised result on forward foreign exchangecontracts
1,420.262
Net realised result on swaps -3,135.63Variation in unrealised result 515.46
Securities portfolio -54.73Swaps 2,411.42Forward foreign exchange contracts -1,841.23
Decrease in net assets as a result of operations -3,884.12
Statement of Operations from 01/01/14 to 31/12/14
Figures in thousands of EUR
Note
Statement of Changes in Net Assets from 01/01/14 to 31/12/14
Figures in thousands of EUR
Net asset value at beginning of the year 69,097.912
4,586.34DNB Fund - TMT Absolute Return, Unit Class Retail (EUR)15,679.83DNB Fund - TMT Absolute Return, Unit Class Institutional16,107.52DNB Fund - TMT Absolute Return, Unit Class Retail (SEK)2,624.07DNB Fund - TMT Absolute Return, Unit Class Retail
25,150.00DNB Fund - TMT Absolute Return, Unit Class Institutional
Units issued during the year
-8,704.28DNB Fund - TMT Absolute Return, Unit Class Retail (EUR)-7,359.29DNB Fund - TMT Absolute Return, Unit Class Retail (SEK)
-12,945.39DNB Fund - TMT Absolute Return, Unit Class Retail
Units redeemed during the year
Decrease in net assets during the year -3,884.12Net asset value at end of the year 100,352.59
Note

40The accompanying notes form an integral part of these financial statements
Page
Currency
Market value
QuantitySecurities %1,000
BRD 0.25 13-15 13/03A 13,000,000 EUR 13,005.98 12.97
Transferable securities admitted to an officialstock exchange listing
91,665.74 91.34
Bonds 89,854.82 89.54Germany 23,043.18 22.97
GERMANY -156- 2.50 10-15 27/02A 10,000,000 EUR 10,037.20 10.00
NEDERLAND 2.75 09-15 15/01A 20,000,000 EUR 20,014.00 19.94The Netherlands 22,049.28 21.97
NEDERLAND 3.25 05-15 15/07A 2,000,000 EUR 2,035.28 2.03
AUSTRIA EMTN 3.50 04-15 15/07A 20,000,000 EUR 20,375.00 20.30Austria 20,375.00 20.30
FINLAND 4.25 04-15 04/07A 12,000,000 EUR 12,260.52 12.22Finland 12,260.52 12.22
FRANCE FTB 3.50 05-15 25/04A 12,000,000 EUR 12,126.84 12.08France 12,126.84 12.08
CISCO SYSTEMS INC 36,900 USD 861.02 0.85
Shares 1,810.92 1.80USA 1,810.92 1.80
JUNIPER NETWORKS INC 24,100 USD 449.52 0.45KULICKE SOFFA INDUSTRIES INC 41,400 USD 500.38 0.50
Statement of Investments as at 31/12/14
EUR
Total securities 91,665.74 91.34
Other assets 8,686.85 8.66
Net Asset Value 100,352.59 100.00

41The accompanying notes form an integral part of these financial statements
Page
DNB Fund - Norway Absolute ReturnInvestment Management Report
The sub-fund aims to achieve a positive absolute return over the long-termregardless of market conditions, by taking long and short positions primarily inequities or equity related derivative contracts listed on the Norwegian StockExchange (Oslo Børs) or other Norwegian stock exchanges as the case mightbe.
During 2014, the Unit Class Retail (EUR) declined in value by -67.81 % inEUR.
The performance calculation is based on the last official net asset values datedDecember 31, 2013 and December 31, 2014.
Benchmark: Unit Class Retail (EUR) - German 3 mth BubillUnit Class Retail (SEK) - OMRX TBILLUnit Class Retail (NOK) - ST1XUnit Class Retail (USD) - USGG3M
Sub-fund Managers: Odd Einar Lillebostad and Eirik Hauge
Key figures relating to the last 3 years (EUR)
Net assets
31/12/14 31/12/13 31/12/12
82.63 21,033,299.21 31,849,688.03
Number of unitsNet asset value per unit
Capitalisation units("A" units)
327.12
9784.24
13485.84
DNB Fund - Norway Absolute Return, Unit Class Retail (EUR)
Number of unitsNet asset value per unit
Capitalisation units("A" units)
--
202,758868.50
269,120872.16
DNB Fund - Norway Absolute Return, Unit Class Retail (NOK)
Assets 2.24Bank accounts 2.24
Liabilities 2.15Accrued expenditure 2.15
Net Asset Value 0.08
Statement of Net Assets as at 31/12/14
Figures in thousands of EUR
Note
Income 280.72Dividends received 0.122Bank interest 5.082Interest on securities 275.522
Expenditure 383.58Management fees 245.554Performance fees 0.285Taxe d'abonnement 7.813Professional expenses 1.46Transaction fees 125.73Other expenses 2.762
Net loss from investments -102.86Net realised result on sales of investment securities -386.622Net realised result on foreign exchange -158.092
Statement of Operations from 01/01/14 to 31/12/14
Figures in thousands of EUR
Note
Net realised result on forward foreign exchangecontracts
903.742
Net realised result on swaps -1,074.52Variation in unrealised result 130.64
Securities portfolio 134.34Swaps 148.64Forward foreign exchange contracts -152.34
Decrease in net assets as a result of operations -687.71
Statement of Operations from 01/01/14 to 31/12/14
Figures in thousands of EUR
Note
Statement of Changes in Net Assets from 01/01/14 to 31/12/14
Figures in thousands of EUR
Net asset value at beginning of the year 21,033.302
109.50DNB Fund - Norway Absolute Return, Unit Class RetailUnits issued during the year
-8.75DNB Fund - Norway Absolute Return, Unit Class Retail-20,446.25DNB Fund - Norway Absolute Return, Unit Class Retail
Units redeemed during the year
Decrease in net assets during the year -687.71Net asset value at end of the year 0.08
Note
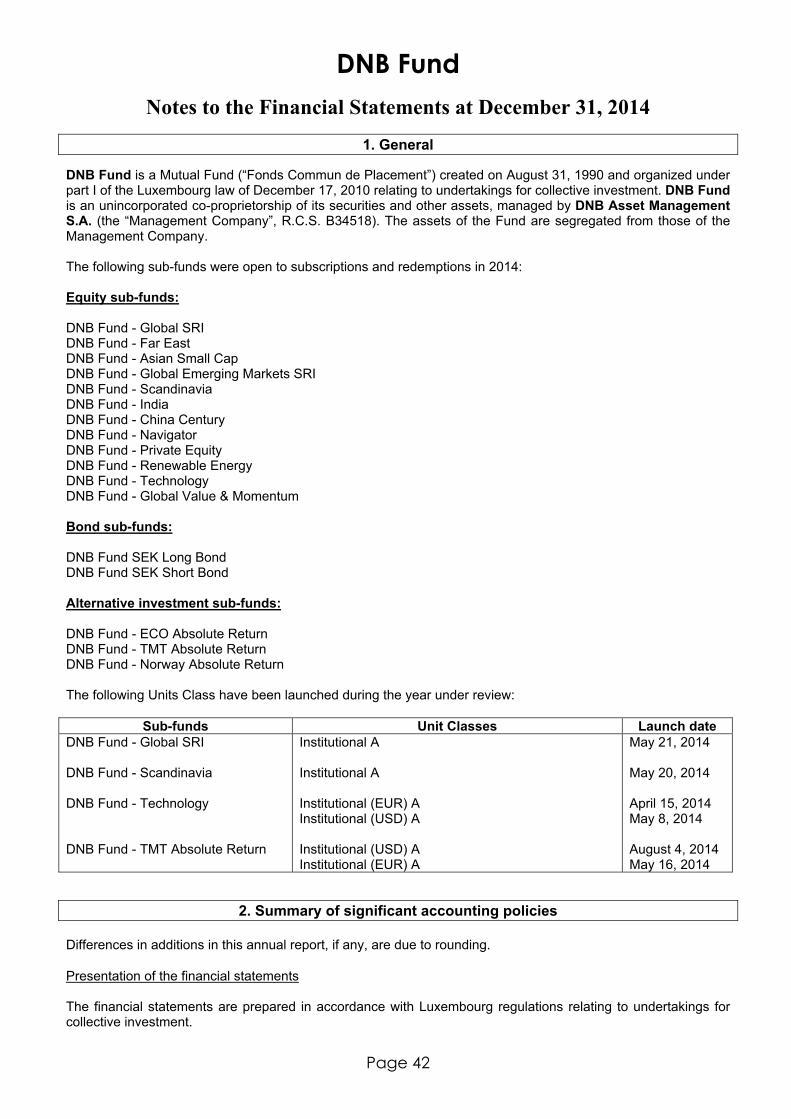
DNB Fund
Notes to the Financial Statements at December 31, 2014
Page 42
1. General DNB Fund is a Mutual Fund (“Fonds Commun de Placement”) created on August 31, 1990 and organized under part I of the Luxembourg law of December 17, 2010 relating to undertakings for collective investment. DNB Fund is an unincorporated co-proprietorship of its securities and other assets, managed by DNB Asset Management S.A. (the “Management Company”, R.C.S. B34518). The assets of the Fund are segregated from those of the Management Company. The following sub-funds were open to subscriptions and redemptions in 2014: Equity sub-funds: DNB Fund - Global SRI DNB Fund - Far East DNB Fund - Asian Small Cap DNB Fund - Global Emerging Markets SRI DNB Fund - Scandinavia DNB Fund - India DNB Fund - China Century DNB Fund - Navigator DNB Fund - Private Equity DNB Fund - Renewable Energy DNB Fund - Technology DNB Fund - Global Value & Momentum Bond sub-funds: DNB Fund SEK Long Bond DNB Fund SEK Short Bond Alternative investment sub-funds: DNB Fund - ECO Absolute Return DNB Fund - TMT Absolute Return DNB Fund - Norway Absolute Return The following Units Class have been launched during the year under review:
Sub-funds Unit Classes Launch date DNB Fund - Global SRI DNB Fund - Scandinavia DNB Fund - Technology DNB Fund - TMT Absolute Return
Institutional A Institutional A Institutional (EUR) A Institutional (USD) A Institutional (USD) A Institutional (EUR) A
May 21, 2014 May 20, 2014 April 15, 2014 May 8, 2014 August 4, 2014 May 16, 2014
2. Summary of significant accounting policies Differences in additions in this annual report, if any, are due to rounding. Presentation of the financial statements The financial statements are prepared in accordance with Luxembourg regulations relating to undertakings for collective investment.

DNB Fund
Notes to the Financial Statements at December 31, 2014
Page 43
2. Summary of significant accounting policies (cont’d) The annual financial statements of the Fund include a combined of all the sub-funds. These combined figures are expressed in “Euro” (EUR), all figures expressed in another currency being converted into EUR on the basis of the average rate of the last known bid and offer rates. As at December 31, 2014 the exchange rates between EUR and the following currencies of the Fund are:
9.0119 NOK 1 EUR 9.3892 SEK 1 EUR 1.2154 USD 1 EUR
For each sub-fund, the net asset value at the beginning of the year is converted into EUR on the basis of the exchange rates used at December 31, 2013. The exchange differences between the net asset value at the beginning of the year converted at the exchange rates used at December 31, 2013 and the exchange rates used at December 31, 2014 are included in the “Reevaluation of opening combined NAV” in the statement of changes in net assets on Page 10. Valuation of investments The value of assets which are listed or dealt in on any stock exchange is based on the last available price on the stock exchange which is normally the principal market for such assets. The value of assets dealt in on any other Regulated Market is based on the last available price. In the event that any assets are not listed or dealt in on any stock exchange or on any other Regulated Market, or if, with respect to assets listed or dealt in on any stock exchange, or other Regulated Market as aforesaid, the price as determined pursuant to the two paragraphs above is not representative of the fair market value of the relevant assets, the value of such assets will be based on the reasonably foreseeable sales price determined prudently and in good faith. Units or shares of open-ended UCI will be valued at their last determined and available net asset value or, if such price is not representative of the fair market value of such assets, then the price shall be determined by the Board of Directors of the Management Company of the Fund on a fair and equitable basis. Units or shares of a closed-ended UCI will be valued at their last available stock market value. The value of money market instruments not listed or dealt in on any Stock Exchange or any other Regulated Market and with remaining maturity of less than 12 months and of more than 90 days is deemed to be the nominal value thereof, increased by any interest accrued thereon. Money market instruments with a remaining maturity of 90 days or less will be valued by the amortised cost method, which approximates market value. The liquidating value of future contracts, forward foreign exchange contracts or options contracts not traded on exchanges or on other Regulated Markets shall mean their net liquidating value determined, pursuant to the policies established by the Board of Directors of the Management Company of the Fund, on a basis consistently applied for each different variety of contracts. The liquidating value of future contracts, forward foreign exchange contracts or options contracts traded on exchanges or on other Regulated Markets shall be based upon the last available settlement prices of these contracts on exchanges and Regulated Markets on which the particular futures, forward or options contracts are traded by the Fund; provided that if a future, forward or options contract could not be liquidated on the day with respect to which net assets are being determined, the basis for determining the liquidating value of such contract shall be such value as the Board of Directors of the Management Company of the Fund may deem fair and reasonable. Net unrealised gains and losses on forward foreign exchange contracts and future contracts are disclosed in the statements of net assets under the heading “Unrealised profit/loss on forward foreign exchange contracts” and “Unrealised profit/loss on financial futures”. The Management Company is authorised to adopt other realistic valuation principles for assets of the Fund where circumstances make the determination of values according to the criteria specified above non realistic, impossible or inadequate. Especially in case of major changes in market conditions, the valuation basis of the different investments may be adjusted to the new market yields.

DNB Fund
Notes to the Financial Statements at December 31, 2014
Page 44
2. Summary of significant accounting policies (cont’d) Realised profit and loss on investments, financial futures and forward foreign exchange contracts The profits and losses on sales of investments, financial futures and forward foreign exchange contracts have been determined on the basis of average cost. Transaction fees The transaction fees, i.e. fees charged by the brokers and the Custodian for securities transactions and similar transactions are presented separately in the caption “Transaction fees” in the Statement of Operations. Foreign exchange The market value of the investments and other assets and liabilities expressed in currencies other than the reporting currency of the related sub-fund, have been converted at the rates of exchange prevailing at the end of the period. The cost of investments in currencies other than the reporting currency of the related sub-fund has been converted at the rates of exchange prevailing at the date of purchase. Exchange profits and losses resulting from the sale of investments are taken to the statement of operations in the account “net realised result on foreign exchange”. Swaps Swaps are valued according to the mark-to-market method and verified against the value from the counterparty. The Fund accrues for interim payments on swap contracts on a daily basis. End of each month, interim payments are settled in cash. The payment flows are netted against each other, with the difference being paid by one party to the other. The net amount is recorded as realised results on swaps and are included in the account "Net realised result on swaps" in the statement of operations. Securities lending Each sub-fund may only lend securities through a standardized lending system organized by a recognized clearing institution or through a first class financial institution specializing in this type of transaction. As part of lending transactions, each sub-fund must receive collateral as guarantee. Such collateral, received in the form of liquid assets and/or securities issued or guaranteed by a member state of the OECD, or by their local authorities, or by supranational institutions and undertakings of a community, regional or world-wide nature, must at the conclusion of the contract be at least equal to the total market value of the securities lent. Income from investments Dividends are recognised as income on the date securities are first quoted ex-dividend, to the extent information thereon is reasonably available to the Fund. Interest income is accrued on a daily basis i.e. on every valuation day. Dividends and interest income are recorded net of withholding tax. Supplementary information The net asset value of the Fund as of December 31, 2014 presented in those financial statements has been calculated on December 31, 2014 (D-Day) at 14h (time expressed in GMT+1) using the usual following pricing methodology:
Securities expressed in Prices used EGP, EUR**, GBP, ILS, TRY, ZAR Snapshot prices - D at noon AUD, CNY, HKD, INR, MYR, SGD, Closing prices - D CAD, CHF*, CLP, CZK*, BRL, DKK*, EUR*, HUF*, IDR*, JPY*, KRW*, MXN, NOK*, PHP*, PLN*, SEK*, THB*, TWD*, USD Closing prices - D-1
* markets closed on December 31, 2014. ** markets opened on December 31, 2014.

DNB Fund
Notes to the Financial Statements at December 31, 2014
Page 45
3. Tax status The Fund is registered under Luxembourg law as a Mutual Investment Fund ("Fonds Commun de Placement"). The Fund has no liability to tax in Luxembourg for capital gains, dividends or interest revenue. However, the Fund is subject to an annual "taxe d'abonnement" calculated at the annual rate of 0.05% p.a. of the net asset value of the Fund at the end of each quarter. The sub-fund DNB Fund SEK Short Bond and the institutional unit classes of the sub-funds DNB Fund - Global SRI, DNB Fund - Scandinavia, DNB Fund - Technology DNB Fund - TMT Absolute Return and DNB Fund SEK Long Bond, benefit from the reduced rate of "taxe d'abonnement" at the annual rate of 0.01% p.a. of their net asset value at the end of each quarter. This tax is payable quarterly. In certain instances depending on the country of origin, the Fund pays withholding tax on dividends received. However, Luxembourg does not impose a withholding tax on dividends paid from the Fund to unitholders.
4. Management fees The Management Company is entitled to receive a management fee payable at the end of each month and calculated on the average net asset value (“NAV”) during the month. The annual rate of the fee is:
- 1.25% p.a. for the sub-fund DNB Fund - Global SRI, DNB Fund - Far East and DNB Fund - Scandinavia;
- 1.75% p.a. for the sub-funds DNB Fund - Asian Small Cap, DNB Fund - Global Emerging Markets SRI, DNB Fund - Private Equity;
- 1.50% p.a. for the sub-funds DNB Fund - India, DNB Fund - China Century, DNB Fund - Navigator, DNB Fund - Renewable Energy, DNB Fund - Technology, DNB Fund - Global Value & Momentum, DNB Fund - ECO Absolute Return, DNB Fund - TMT Absolute Return and DNB Fund - Norway Absolute Return (until December 8, 2014);
- 0.70% p.a. for the sub-fund DNB Fund SEK Long Bond;
- 0.35% p.a. for the sub-fund DNB Fund SEK Short Bond;
- 0.75% p.a. for institutional Unit Class of the sub-funds DNB Fund - Global SRI, DNB Fund - Scandinavia, DNB Fund - Technology, DNB Fund - TMT Absolute Return.
This fee covers custodian and bookkeeping fees, payable on a monthly basis by the Management Company, at an annual rate of:
- maximum 0.20% p.a. on the average net asset value for the Bond sub-funds;
- maximum 0.25% p.a. on the average net asset value for the Equity and Alternative investment sub-funds;
with an annual minimum fee of USD 30,000 per sub-fund. For the sub-fund DNB Fund - Global Emerging Markets SRI, specific sub-custodian fees related to certain markets are paid directly to the relevant sub-custodian.
5. Performance fees Performance fees applicable to Equity sub-funds The performance fee is fixed by the Management Company and is a percentage of the excess yield in relation to the sub-fund’s benchmark index over the period.

DNB Fund
Notes to the Financial Statements at December 31, 2014
Page 46
5. Performance fees (cont’d) The performance fee is calculated and accrued daily and paid out of the sub-funds at the end of each year. The performance fee is payable only if the sub-fund’s performance exceeds that of the sub-fund’s benchmark index. A performance fee could therefore be paid even if the net asset value per unit has decreased. If during a given period, the sub-fund has a performance which is lower than the performance of the benchmark (i.e. a relative underperformance), such underperformance must be taken into consideration the following period as long as the performance of the sub-fund has not recovered the underperformance relative to the benchmark index. The concept of “crystallization” will be applied, meaning that the performance fee due to the Management Company is precisely determined (accrued or “crystallized”) at any time, in order to ensure that an investor applying for the redemption of his units within a certain period nevertheless pays an adequate portion of the performance fee due at the end of the relevant year. The sub-fund performance will be determined on the basis of the change in NAV per unit (before any performance fee accruals and before computation and subsequent subtraction of the management fees). Performance fees, if any, will be accrued daily based on the number of units in issue on that particular day. Performance fees applicable to Alternative investment sub-funds The performance fee is calculated and reserved on a daily basis and paid by the respective sub-fund to the Management Company at the end of each month. Any eventual performance fee is payable only if the respective sub-fund’s performance exceeds the previous highest NAV, adjusted for movements in the respective index (index-adjusted high watermark). Any eventual underperformance in relation to the index will be transferred from one day to the next until such underperformance has been recovered i.e. there will be no periodic reset of underperformance. When calculating the eventual performance fee, the respective sub-fund’s performance will be determined on the basis of the change in NAV per unit, after the deduction of the fixed management fee. The performance fee, if any, will be calculated and reserved based on the number of units in issue on that particular day. A performance fee could be paid to the Management Company at the end of any given month, even if the NAV per unit in the respective sub-fund has decreased during the month. For the following sub-funds, in addition of management fees, a performance fee as described above could be levied. It amounts to 20% of the excess yield in relation to the sub-fund’s benchmark index. The benchmarks for the sub-funds are:
Sub-funds Benchmark DNB Fund - India MSCI Daily TR Net Emerging Markets India DNB Fund - China Century MSCI Daily TR Net Emerging Markets China
DNB Fund - Navigator 50% Oil services (OSE101010 Energy equipment and service), 50% Shipping (OSE203030 Marine + OSE10102040 Oil/gas storage/ transportation)1)
DNB Fund - Renewable Energy Wilderhill New Energy Global Innovation Index
DNB Fund - Technology 66% MSCI Technology, 12% MSCI Media and 22% MSCI Telecom

DNB Fund
Notes to the Financial Statements at December 31, 2014
Page 47
5. Performance fees (cont’d)
Sub-funds Benchmark
DNB Fund - ECO Absolute Return
ST1X for the Unit Class retail A (NOK) OMRX TBILL for the Unit Class retail A (SEK) German 3 months Bubill for the Unit Class retail A (EUR) USGGM3 for the Unit Class retail A (USD)
DNB Fund - TMT Absolute Return
ST1X for the Unit Class retail A (NOK) OMRX TBILL for the Unit Class retail A (SEK) German 3 months Bubill for the Unit Class retail A (EUR) USGGM3 for the Unit Class retail A (USD) German 3 months Bubill for the Unit Class institutional A (EUR) USGGM3 for the Unit Class institutional A (USD)
DNB Fund - Norway Absolute Return
ST1X for the Unit Class retail A (NOK) OMRX TBILL for the Unit Class retail A (SEK) German 3 months Bubill for the Unit Class retail A (EUR) USGGM3 for the Unit Class retail A (USD)
1) The Benchmark is rebalanced monthly.
6. Dividends distributed The Board of Directors of the Management Company decided to pay the following dividends for the year ended December 31, 2014: Amount of dividends: DNB Fund Global Emerging Markets SRI 3.8834 USD per unit B DNB Fund SEK Long Bond 0.2774 SEK per unit B DNB Fund SEK Short Bond 0.10 SEK per unit B Ex-Dividend Date: 28/10/2014 Payment Date: 30/10/2014
7. Forward Foreign Exchange Contracts As at December 31, 2014, outstanding forward foreign exchange contracts were as follows: DNB Fund - ECO Absolute Return:
Buy Sell Maturity Unrealised appreciation/depreciation (EUR)
SEK 138,867,000.00 EUR 15,000,000.00 07/01/2015 -210,452.84NOK 121,783,200.00 EUR 14,000,000.00 07/01/2015 -489,139.98EUR 550,000.00 NOK 4,801,830.00 07/01/2015 17,275.45EUR 1,550,000.00 AUD 2,279,275.00 07/01/2015 13,200.67EUR 2,100,000.00 GBP 1,665,825.00 07/01/2015 -34,387.45EUR 1,100,000.00 NOK 9,563,950.00 07/01/2015 38,957.29EUR 4,100,000.00 USD 5,118,850.00 07/01/2015 -111,446.51EUR 400,000.00 NOK 3,539,600.00 07/01/2015 7,308.69EUR 500,000.00 SEK 4,650,350.00 07/01/2015 4,730.55EUR 700,000.00 NOK 6,254,920.00 07/01/2015 6,063.54EUR 600,000.00 SEK 5,600,400.00 07/01/2015 3,548.69
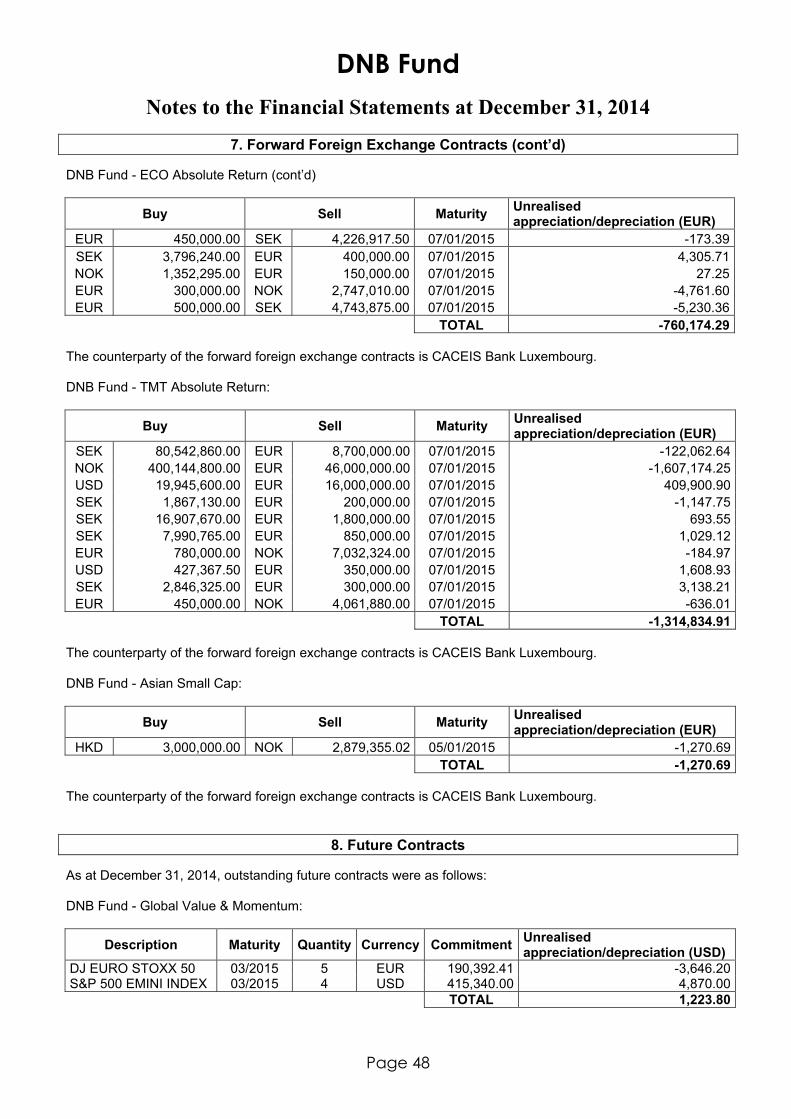
DNB Fund
Notes to the Financial Statements at December 31, 2014
Page 48
7. Forward Foreign Exchange Contracts (cont’d) DNB Fund - ECO Absolute Return (cont’d)
Buy Sell Maturity Unrealised appreciation/depreciation (EUR)
EUR 450,000.00 SEK 4,226,917.50 07/01/2015 -173.39SEK 3,796,240.00 EUR 400,000.00 07/01/2015 4,305.71NOK 1,352,295.00 EUR 150,000.00 07/01/2015 27.25EUR 300,000.00 NOK 2,747,010.00 07/01/2015 -4,761.60EUR 500,000.00 SEK 4,743,875.00 07/01/2015 -5,230.36
TOTAL -760,174.29 The counterparty of the forward foreign exchange contracts is CACEIS Bank Luxembourg. DNB Fund - TMT Absolute Return:
Buy Sell Maturity Unrealised appreciation/depreciation (EUR)
SEK 80,542,860.00 EUR 8,700,000.00 07/01/2015 -122,062.64NOK 400,144,800.00 EUR 46,000,000.00 07/01/2015 -1,607,174.25USD 19,945,600.00 EUR 16,000,000.00 07/01/2015 409,900.90SEK 1,867,130.00 EUR 200,000.00 07/01/2015 -1,147.75SEK 16,907,670.00 EUR 1,800,000.00 07/01/2015 693.55SEK 7,990,765.00 EUR 850,000.00 07/01/2015 1,029.12EUR 780,000.00 NOK 7,032,324.00 07/01/2015 -184.97USD 427,367.50 EUR 350,000.00 07/01/2015 1,608.93SEK 2,846,325.00 EUR 300,000.00 07/01/2015 3,138.21EUR 450,000.00 NOK 4,061,880.00 07/01/2015 -636.01
TOTAL -1,314,834.91 The counterparty of the forward foreign exchange contracts is CACEIS Bank Luxembourg. DNB Fund - Asian Small Cap:
Buy Sell Maturity Unrealised appreciation/depreciation (EUR)
HKD 3,000,000.00 NOK 2,879,355.02 05/01/2015 -1,270.69 TOTAL -1,270.69 The counterparty of the forward foreign exchange contracts is CACEIS Bank Luxembourg.
8. Future Contracts As at December 31, 2014, outstanding future contracts were as follows: DNB Fund - Global Value & Momentum:
Description Maturity Quantity Currency Commitment Unrealised appreciation/depreciation (USD)
DJ EURO STOXX 50 03/2015 5 EUR 190,392.41 -3,646.20S&P 500 EMINI INDEX 03/2015 4 USD 415,340.00 4,870.00 TOTAL 1,223.80

DNB Fund
Notes to the Financial Statements at December 31, 2014
Page 49
8. Future Contracts (cont’d) All futures are traded with the broker UBS LTD LONDON. As at December 31, 2014, the amount of margin deposits for future contracts is USD 32,680.95 and is included in the caption “Bank accounts” in the Statement of Net Assets.
9. Swaps As at December 31, 2014, the following sub-funds had entered into Total Return Equity Swap contracts composed of listed equities in the following industries: DNB Fund - ECO Absolute Return: Industry Currency Notional in contract currency AGRICULTURE & FISHERY USD -226,723.77 BIOTECHNOLOGY USD -722,779.98 BUILDINGS MATERIALS & TRADE EUR 2,070,166.77 USD 1,065,783.74 CHEMICALS CHF 1,583,626.86 DKK -4,493,561.00 USD 34,032.23 ELECTRONICS & SEMICONDUCTORS EUR -5,213,779.08 GBP 939,285.15 HKD 16,749,090.00 JPY -148,105,000.00 USD -14,715,182.20 ENERGY, FOODS & BEVERAGES AUD -999,070.68 DKK -9,018,327.20 EUR -4,572,459.08 GBP 1,861,963.14 HKD 37,278,266.00 NOK 326,923.12 NZD -790,861.95 USD -3,937,177.24 HOLDINGS & FINANCE COMPANIES USD -2,715,375.01 INSURANCE USD -1,732,296.05 INTERNET, SOFTWARE & IT SERVICES USD 236,832.44

DNB Fund
Notes to the Financial Statements at December 31, 2014
Page 50
9. Swaps (con’d) DNB Fund - ECO Absolute Return (Cont’d) Industry Currency Notional in contract currency MACHINE & APPARATUS CONSTRUCTION CAD -57,820.00 EUR 85,154.60 GBP 752,449.12 JPY -218,855,100.00 NOK 10,548,505.10 USD 377,001.72 MINING JPY -68,846,400.00 MISCELLANEOUS SERVICES GBP 314,168.14 USD 1,169,573.41 NON-FERROUS METALS EUR 222,752.40 JPY -233,545,400.00 OFFICE SUPPLIERS & COMPUTING CAD 1,593,891.00 PAPER & WOOD HKD -12,386,930.00 PETROLEUM USD 1,437,974.32 PRECIOUS METALS & MINERALS EUR 1,329,619.77 RETAIL TRADE, DEPARTMENT STORES USD 1,461,442.72 ROAD VEHICLES EUR 1,168,196.21 USD 1,803,086.11 UTILITIES EUR 256,849.23 The unrealized loss on swaps at year end is EUR 1,254,222.48. The total commitment for long positions is EUR 52,486,411.53. The total commitment for short positions is EUR 65,311,363.40. The counterparty to the above swap contracts is Credit Suisse Securities (Europe) Limited and the other leg is libor 1 month of the corresponding currency of the underlying equity adjusted by a spread.

DNB Fund
Notes to the Financial Statements at December 31, 2014
Page 51
9. Swaps (cont’d) DNB Fund - TMT Absolute Return: Industry Currency Notional in contract currency ENERGY, FOODS & BEVERAGES USD 3,178,344.22 GRAPHIC ART & PUBLISHING NOK -49,891,989.73 OFFICE SUPPLIERS & COMPUTING EUR 1,029,408.82 HKD 9,532,020.00 JPY 377,162,500.00 USD 9,936,605.80 RETAIL TRADE, DEPARTMENT STORE USD 2,613,614.07 MACHINE & APPARATUS CONSTRUCTION EUR -4,357,858.87 SEK -13,983,000.00 MISCELLANEOUS SERVICES USD -4,265,450.00 ELECTRONICS & SEMI CONDUCTORS EUR -573,273.12 JPY -148,608,000.00 USD -4,980,829.48 NOK 1,584,338.77 ENERGY, FOODS & BEVERAGES GBP 3,406,955.79 INTERNET, SOFTWARE & IT SERVICE EUR -3,079,318.95 GBP 743,448.31 NOK -10,077,485.20 USD 12,216,015.13 NON-FERROUS METALS EUR 100,815.93 MISCELLANEOUS SERVICES USD 1,774,731.67 TELECOMMUNICATIONS EQUIPMENT USD -4,198,880.00

DNB Fund Notes to the Financial Statements at December 31, 2014
Page 52
9. Swaps (cont’d)
DNB Fund - TMT Absolute Return (Cont’d)
Industry Currency Notional in contract currency TELECOMMUNICATIONS EQUIPMENT CAD 991,938.00
EUR -5,529,680.98GBP -1,785,851.80SEK -67,419,913.47USD -5,988,418.22
ROAD VEHICLES USD -2,265,824.22
The unrealized gain on swaps at year end is EUR 2,411,415.86.
The total commitment for long positions is EUR 104,253,814.91.
The total commitment for short positions is EUR 118,846,183.79.
The counterparty to the above swap contracts is Credit Suisse Securities (Europe) Limited and the other leg is libor 1 month of the corresponding currency of the underlying equity adjusted by a spread.
10. Collateral
As at December 31, 2014, the following securities were held in pledge accounts at the custodian as collateral in relation to the swap transactions with Credit Suisse Securities (Europe) Limited
Sub-funds Security Name Quantity Currency Market Value in EUR
DNB Fund - ECO Absolute Return BRD 0.25 13-15 13/03A 5,000,000.00 EUR 5,002,300.00
DNB Fund - ECO Absolute Return GERMANY -156- 2.50 10-15 27/02A 2,300,000.00 EUR 2,308,556.00
DNB Fund - ECO Absolute Return FRANCE FTB 3.50 05-15 25/04A 4,000,000.00 EUR 4,042,280.00
DNB Fund - ECO Absolute Return NEDERLAND 2.75 09-15 15/01A 2,350,000.00 EUR 3,002,100.00
DNB Fund - TMT Absolute Return BRD 0.25 13-15 13/03A 650,000.00 EUR 650,299.00
DNB Fund - TMT Absolute Return FRANCE FTB 3.50 05-15 25/04A 1,650,000.00 EUR 1,667,440.50
DNB Fund - TMT Absolute Return NEDERLAND 2.75 09-15 15/01A 14,000,000.00 EUR 14,009,800.00
TOTAL 30,682,775.50
The sub-fund DNB Fund - ECO Absolute Return received cash collateral amounting to EUR 2,550,990.00.
The sub-funds DNB Fund - TMT Absolute Return received cash collateral amounting to EUR 3,150,982.00.

DNB Fund
Notes to the Financial Statements at December 31, 2014
Page 53
11. Securities lending As at December 31, 2014, the market value of the securities lent and of the collateral outstanding for each sub-fund are as follows:
Sub-funds Currency Market value of securities lent
Collateral dirty value
DNB Fund - Renewable Energy EUR 3,728,280.11 4,799,794.35DNB Fund - ECO Absolute Return EUR 3,202,715.35 6,508,746.18 The collateral outstanding with respect to the sub-fund DNB Fund - Renewable Energy was EUR 4,799,794.35 corresponding to:
Security Name Quantity BELGIUM 291 5.5 3 28 123,895ALLEMAGNE 2.5 2044 1,190,813FRANCE 1 25 07 17 I 1,309,523DBJ 1 70 22 199,000,000
The collateral outstanding with respect to the sub-fund DNB Fund - ECO Absolute Return was EUR 6,508,746.18 corresponding to:
Security Name Quantity BELGIUM 291 5.5 3 28 1,096,105BELGIQUE 4.25 03 41 50,000BELGIQUE 1.25 06 18 271,946OAT 5.5 25 04 29 502,280OAT 5.5 25 04 29 805,562UK 2 26 01 35 I 497,344DBJ 1 70 22 111,000,000
The counterparty of the securities lending is CACEIS BANK Luxembourg. For the year ended December 31, 2014, the securities lending income generated by the Fund is included in the caption “Securities lending income” in the Statement of Operations and is as follows:
Sub-funds CurrencyTotal gross amount of
Securities Lending Income
Direct-indirect costs and Fees deducted
from gross Securities Lending
Income
Total net amount
of Securities Lending Income
DNB Fund - Renewable Energy EUR 210,302.21 42,060.44 168,241.77DNB Fund - ECO Absolute Return USD 818,447.25 163,689.45 654,757.80
12. Changes in the composition of the portfolio The report on the changes in the statement of investments is available upon request at the registered office of the Management Company of the Fund free of charge.

DNB Fund
Notes to the Financial Statements at December 31, 2014
Page 54
13. Units For each sub-fund, the Fund issues different classes of Units (“Unit Classes”): capitalization units (“A” units) that capitalize income or distribution units (“B” units) that either pay a dividend to their Unitholders. A further distinction is made regarding the potential investors in such Units. The Units may either be distributed to retail investors (Unit Classes “retail A” and “retail B”) or institutional investors (Unit Classes “institutional A” or “institutional B”).
14. DNB - Norway Absolute Return Liquidation The Board of Directors of the Management Company decided to proceed with the liquidation of the sub-fund DNB Fund - Norway Absolute Return as of February 13, 2015.

DNB Fund
Additional information (unaudited)
Page 55
1. Investors’ Rights against the Fund The Management Company draws the investors’ attention to the fact that any investor will only be able to fully exercise his investor rights directly against the Fund if the investor is registered himself and in his own name in the unitholder’s register of the Fund. In cases where an investor invests in the Fund through an intermediary investing into the Fund in his own name but on behalf of the investor, it may not always be possible for the investor to exercise certain unitholder rights directly against the Fund. Investors are advised to take advice on their rights.
2. Global exposure calculation method
The commitment approach The following sub-funds use the commitment approach in order to monitor and measure the global exposure: DNB Fund - Global SRI DNB Fund - Far East DNB Fund - Asian Small Cap DNB Fund - Global Emerging Markets SRI DNB Fund - Scandinavia DNB Fund - India DNB Fund - China Century DNB Fund - Navigator DNB Fund - Private Equity DNB Fund - Renewable Energy DNB Fund - Technology DNB Fund - Global Value & Momentum DNB Fund SEK Long Bond DNB Fund SEK Short Bond The absolute VaR approach The following sub-funds use the absolute Value at Risk (VaR) approach in order to monitor and measure the global exposure. The limit is set at 20%. The VaR during the financial year was as follows(from January 1, 2014 to December 31, 2014, except for DNB Fund - Norway Absolute Return: until October 13, 2014):
Lowest VaR Highest VaR Average
VaR DNB Fund - Eco Absolute Return 8.20% 14.98% 11.28% DNB Fund - TMT Absolute Return 3.59% 6.95% 4.93% DNB Fund - Norway Absolute Return 0.06% 4.19% 3.31% The VaR figures have been calculated based on the following input data:
Model used Confidence
level Holding period Length of
data historyDNB Fund - Eco Absolute Return Historical Simulations 99.00% 20 days 1 year DNB Fund - TMT Absolute Return Historical Simulations 99.00% 20 days 1 year DNB Fund - Norway Absolute Return Historical Simulations 99.00% 20 days 1 year

DNB Fund
Additional information (unaudited)
Page 56
2. Global exposure calculation method (cont’d) The average sum of notionals of financial derivative instruments used during the financial year was as follow: Average leverage DNB Fund - Eco Absolute Return 474.75% DNB Fund - TMT Absolute Return 269.05% DNB Fund - Norway Absolute Return 292.53%

DNB Asset Management S.A.5, Allée Schefferl-2520 luXeMBouRGluXeMBouRGtel: +352 45 49 45 1e-mail: [email protected]
DNB Asset Management ASDronning eufemias gate 30n-0191 oslonoRWAYtel: +47 915 03 000Fax: +47 22 31 98 70
DNB Asset Management (Asia) Ltd.3305-6 the Center99 Queen´s Road CentralHonG KonGtel: +852 28 68 29 11Fax: +852 26 19 02 55
DNB Asset Management ABSe-105 88 StockholmKungsgatan 18SWeDentel: +46 8 473 4100e-mail: [email protected]
DNB Asset Management ASp.o. Box 7515, n-5020 BergennoRWAYtel: +47 55 21 10 00Fax: +47 55 26 06 99
DNB Investment Advisory Services (India) Private Ltd.GB-Reflections, New No. 2leith Castle Center StreetSanthome High Road, Chennai - 600 028InDIAtel: +91 44 4210 0982Fax: +91 44 2461 0140