distribution, climatic relationships, and status of ... · states, where all surface waters drain...
TRANSCRIPT
Full Terms & Conditions of access and use can be found athttp://www.tandfonline.com/action/journalInformation?journalCode=uaar20
Arctic, Antarctic, and Alpine ResearchAn Interdisciplinary Journal
ISSN: 1523-0430 (Print) 1938-4246 (Online) Journal homepage: http://www.tandfonline.com/loi/uaar20
Distribution, climatic relationships, and status ofAmerican pikas (Ochotona princeps) in the GreatBasin, USA
Constance I. Millar, Diane L. Delany, Kimberly A. Hersey, Mackenzie R.Jeffress, Andrew T. Smith, K. Jane Van Gunst & Robert D. Westfall
To cite this article: Constance I. Millar, Diane L. Delany, Kimberly A. Hersey, Mackenzie R.Jeffress, Andrew T. Smith, K. Jane Van Gunst & Robert D. Westfall (2018) Distribution, climaticrelationships, and status of American pikas (Ochotona�princeps) in the Great Basin, USA, Arctic,Antarctic, and Alpine Research, 50:1, e1436296, DOI: 10.1080/15230430.2018.1436296
To link to this article: https://doi.org/10.1080/15230430.2018.1436296
This article not subject to U.S. copyright law.
View supplementary material
Published online: 30 Apr 2018.
Submit your article to this journal
Article views: 505
View Crossmark data

Distribution, climatic relationships, and status of American pikas (Ochotona princeps)in the Great Basin, USAConstance I. Millara, Diane L. Delanya, Kimberly A. Herseyb, Mackenzie R. Jeffressc, Andrew T. Smithd,K. Jane Van Gunste, and Robert D. Westfalla
aUSDA Forest Service, Pacific Southwest Research Station, Albany, California, USA; bUtah Division of Wildlife, Salt Lake City, Utah, USA;cNevada Department of Wildlife, Elko, Nevada, USA; dSchool of Life Sciences, Arizona State University, Tempe, AZ, USA; eNevada Departmentof Wildlife, Winnemucca, Nevada, USA
ABSTRACTTo advance understanding of the distribution, climatic relationships, and status of American pikas(Ochotona princeps) in the Great Basin, United States, we compiled 2,387 records of extant pika sitessurveyed since 2005, 89 records of documented extirpated sites (resurvey of historic sites), and 774records of sites with old sign only. Extant sites extended across five degrees latitude and ten degreeslongitude, encompassed six subregions, traversed forty mountain ranges, spanned 2,378 m in eleva-tion (1,631–4,009 m), and comprised three of five currently described pika subspecies. A climateenvelope for extant sites using the PRISM climate model expands the range of temperature andprecipitation values that have been previously described. Extirpated and old-sign sites were mostlyfoundwithin the geographic and climatic space of extant sites, but often inwarmer and drier portions.Considerable overlap of extirpated, old, and extant groups within the same climate space suggeststhat nonclimatic factors have also contributed to population losses. The broad distribution andenlarged climate envelope of extant pika sites indicate that despite some localized extirpations,pika populations are persisting across Great Basin mountains, and appear to be able to tolerate abroader set of habitat conditions than previously understood.
ARTICLE HISTORYReceived 13 June 2017Accepted 8 January 2018
KEYWORDSAmerican pika; climatechange; Great Basin;geographic distribution;Ochotona princeps;population extirpation;population occurrence
Introduction
American pikas (Ochotona princeps) have been widelyreported as vulnerable to contemporary climate change(Appendix 1). These small lagomorphs, distributed acrossmontane regions of western North America, thermoregu-late poorly, have high resting and low lethal body tempera-tures, do not hibernate, and show minimal physiologicalresilience to temperature extremes and chronic stress(Smith and Weston 1990). Pikas are behaviorally solitaryandpatchily distributed in disjunct talus fields, which undereven the best of conditions support low population num-bers. Dependence on talus patches, coupledwith the poten-tial for local metapopulation dynamics (Smith and Gilpin1997; Smith and Nagy 2015), have been considered addi-tional risk factors for pikas under accelerating climatechange.
Trends of extirpation during prehistoric times pro-vide temporal context for modern population vulner-abilities. Prehistoric records of pikas in the Great Basin
(GB) portion of the range document millennial scalepopulation losses correlated with Late Pleistocene andHolocene warming (Grayson 2005). Rising moderntemperatures prompt a similar concern for climaticimpacts, with an expectation that pika populationswill retreat to higher elevations for suitable habitat,eventually running out of space.
Scientific evidence in support of this scenario, how-ever, is inconsistent. In the GB, resurveys of historicsites document a steep extirpation curve in recent dec-ades at low elevations and other marginal sites wheretemperature is typically warmest (Beever et al. 2011,2016; Stewart et al. 2015). In addition, extirpation atsome northwestern GB sites has been assumed whenonly old sign was found during single-visit surveys(Jeffress, Van Gunst, and Millar 2017). In other time-series studies of this region, however, population statusdoes not correlate consistently with temperature orelevation (Millar et al. 2014a; Smith and Nagy 2015;
CONTACT Constance I. Millar [email protected] data for this article can be accessed here.
ARCTIC, ANTARCTIC, AND ALPINE RESEARCH2018, VOL. 50, NO. 1, e1436296 (19 pages)https://doi.org/10.1080/15230430.2018.1436296
This article not subject to U.S. copyright law.This is an Open Access article distributed under the terms of the Creative Commons Attribution License (http://creativecommons.org/licenses/by/4.0/), which permits unrestricteduse, distribution, and reproduction in any medium, provided the original work is properly cited.

Stewart and Wright 2012). Surveys in parts of thewestern GB (Massing 2012; Millar and Westfall 2010;Millar, Westfall, and Delany 2013; Stewart et al. 2015)documented the locally widespread presence of pikas,including sites at low and climatically marginal GBsites, which suggest thermal tolerance (Beever et al.2008; Collins and Bauman 2012; Jeffress, Van Gunst,and Millar 2017; Millar, Westfall, and Delany 2013;Smith, Nagy, and Millar 2016).
Differing methods used for data collection and analysesmay contribute to the inconsistency of the earlier findings.Because the primary objective of many pika studies in theGB was to resurvey twentieth-century historic sites, studylocations were limited by their availability and distribution,and documented historic sites do not necessarily representthe range of occupied sites. In addition, studies based onsurveys of modern (nonhistoric) sites have focused onlimited portions of the GB pika range. Finally, some mon-itoring efforts used rapid-assessment surveys, which havean increased likelihood for introducing error in populationstatus compared with traditional methods that are moretime consuming (Smith, Nagy, and Millar 2016). Takentogether, a widely held assumption in scientific and publicunderstanding is that pikas have become rare (especially inthe GB), pikas are limited to a few high and cool elevations,a significant portion of GB pika sites have become extir-pated, and that the species is at risk of extinction. In manyways, the American pika has become an icon of climate-change vulnerability (see Appendix 1).
Because these perceptions of American pika vulner-ability are based on a small number of sites and inlimited portions of the GB, we sought to systematicallydocument the range of known pika occurrence loca-tions across the GB. To provide temporal, geographic,and climatic context for evaluating the conditions andpotential vulnerability of GB pikas, we compiled knownpublished and unpublished surveys of modern occu-pied sites, documented extirpated sites, and old-sign-only sites across the hydrographic GB. We interrogatedthe resulting databases to answer the following ques-tions and to provide a more comprehensive under-standing of the status of pikas in the GB:
(1) What is the geographic distribution of extantpika populations in the GB?
(2) What are the prevailing climatic conditions atextant and relict pika locations?
(3) Do the geographic and climatic values for theextant sites differ from those of twentieth- andtwenty-first-century extirpation sites and siteswith only old sign?
(4) How do the new data on the geographic andclimatic limits of extant pika populations across
the GB affect and/or change our understandingof the status and vulnerability of pikas in theGB relative to climate?
Methods
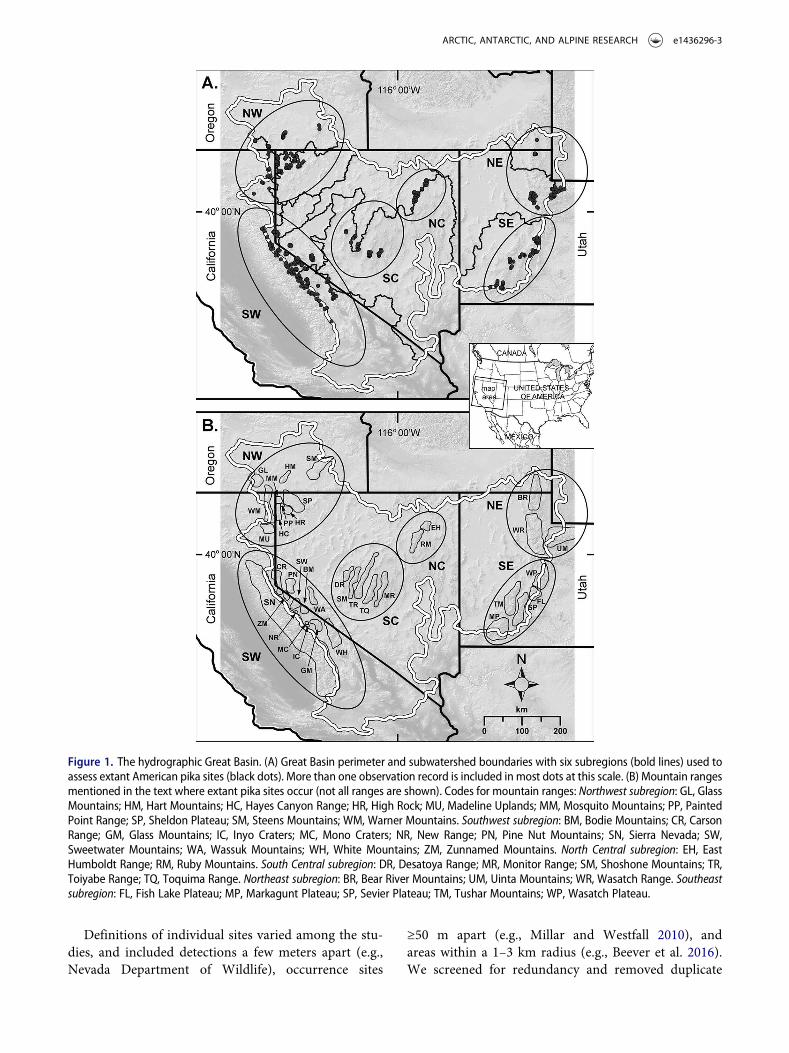
The study covered the hydrographic Great Basin, UnitedStates, where all surface waters drain to interior basins.We derived the perimeter and interior watershed bound-aries from the National Hydrography Dataset (Levels 2,3, and 4 HUC; USGS, The National Map, accessedMarch 11, 2016). This range includes parts ofCalifornia, Oregon, Nevada, and Utah (Figure 1).
Extant pika sites
From published literature and unpublished inventories, wecompiled records of extant (i.e., occupied) locations forAmerican pika populations within the GB. We included afew records that were outside the hydrographic GB but lessthan 5 km from the boundary; thesewere in areaswhere theGB boundary was topographically indistinct and recordswere otherwise sparse or absent. These records represent amix of survey methods based on the source of the data (seeAppendix 2 for protocols). For previously unpublishedrecords, we only included those where expert surveyorshad conducted the surveys. Given recently reported popu-lation declines, we accepted only sites that were documen-ted as extant in 2005 or later (most recent, spring 2017).Wefelt that this threshold was necessary to accept a record ascurrent. While recognizing that this was a qualitative deci-sion, we based it on published records (Beever et al. 2011),wherein repeat observations showed losses during timeperiods greater than about a decade. Our choice of 2005was further based on published analyses (Stewart et al.2015) that considered records older than 2000 (approxi-mately fifteen years prior to analysis) as “historic.” Wedefined a talus as “extant” when one or more of severalcommonly used criteria for the presence of pikaswas noted:sightings, vocalizations, fresh pellets (in combination withother signs), and current-year haypiles (winter caches ofvegetation). Unpublished inventories included records ofsites observed by one of the authors or provided by stateNatural Heritage or wildlife offices. We did not includerecords from a paper published late in our manuscriptrevision period (Stewart, Wright, and Heckman 2017).Extant locations reported in that paper are, however,already represented by records in our database. Given themethods of observation, and recognizing the populationecology and behavior of the species (Smith andNagy 2015),we assume that most if not all of the extant sites we com-piled to represent self-sustaining local populations.
e1436296-2 C. I. MILLAR ET AL.
Definitions of individual sites varied among the stu-dies, and included detections a few meters apart (e.g.,Nevada Department of Wildlife), occurrence sites
≥50 m apart (e.g., Millar and Westfall 2010), andareas within a 1–3 km radius (e.g., Beever et al. 2016).We screened for redundancy and removed duplicate
Figure 1. The hydrographic Great Basin. (A) Great Basin perimeter and subwatershed boundaries with six subregions (bold lines) used toassess extant American pika sites (black dots). More than one observation record is included in most dots at this scale. (B) Mountain rangesmentioned in the text where extant pika sites occur (not all ranges are shown). Codes for mountain ranges: Northwest subregion: GL, GlassMountains; HM, Hart Mountains; HC, Hayes Canyon Range; HR, High Rock; MU, Madeline Uplands; MM, Mosquito Mountains; PP, PaintedPoint Range; SP, Sheldon Plateau; SM, Steens Mountains; WM, Warner Mountains. Southwest subregion: BM, Bodie Mountains; CR, CarsonRange; GM, Glass Mountains; IC, Inyo Craters; MC, Mono Craters; NR, New Range; PN, Pine Nut Mountains; SN, Sierra Nevada; SW,Sweetwater Mountains; WA, Wassuk Mountains; WH, White Mountains; ZM, Zunnamed Mountains. North Central subregion: EH, EastHumboldt Range; RM, Ruby Mountains. South Central subregion: DR, Desatoya Range; MR, Monitor Range; SM, Shoshone Mountains; TR,Toiyabe Range; TQ, Toquima Range. Northeast subregion: BR, Bear River Mountains; UM, Uinta Mountains; WR, Wasatch Range. Southeastsubregion: FL, Fish Lake Plateau; MP, Markagunt Plateau; SP, Sevier Plateau; TM, Tushar Mountains; WP, Wasatch Plateau.
ARCTIC, ANTARCTIC, AND ALPINE RESEARCH e1436296-3
records. Remaining records were compiled into a singledatabase with associated geographic information(mountain range, location, latitude, longitude, eleva-tion, aspect). In a few cases, coordinates listed in origi-nal publications were in error by a degree or more;these we corrected and noted in Appendices 3–5.Aspects for extant records, if not documented in theoriginal database, were estimated by intersecting loca-tions with 30 m tiles in geographic information systems(GIS; ESRI 2015). Two methods for quantifying aspectwere used: aspect degrees transformed to cosine, andaspect degrees binned into one of eight 45° ordinalcategories (N, NE, E, SE, etc.). When elevation datawere not given in published or unpublished records,they were estimated from 30 m digital elevation models(DEM) in GIS. We included elevation and aspectbecause these have been used as proxies for climate inother pika studies. Other environmental factors—suchas geomorphic setting; talus substrate, size, and con-nectivity; or vegetation characteristics—while relevant,could not be included because of heterogeneity ofmethods used in previous studies and, thus, our inabil-ity to quantify these variables.
To avoid overrepresentation from closely adja-cent observations, we established in GIS a 50 mbuffer around the location of each record. Thisdistance was used as a conservative haypile near-est-neighbor distance, representing an individualanimal territory (Smith and Weston 1990).Records that overlapped 50 m buffers were com-bined into “50 m buffer clusters,” which in somecases resulted in larger polygons (as in Jeffress, VanGunst, and Millar 2017).
Extirpated and old pika sites
We also compiled records of sites that were docu-mented as extirpated or contained only old sign. Forthis we used published literature and unpublishedinventories where observations or publications datedfrom 2005 or later. For the extirpated dataset weincluded only records for which a resurvey had beenconducted, the repeat surveys were conducted at fiveor more years apart, and both the most recent andthe penultimate surveys indicated no sign of pikaoccurrence.
We compiled a third dataset from published andunpublished sources dated from 2005 or later. Thisincluded records in which surveyors reported onlyold pika sign at a site, based either on single-visitsurveys or on resurveys that did not meet the pre-vious criteria. “Old” pika sign (i.e., older than thecurrent year) was characterized by small,
decomposing pellets, decomposing haypiles, and/orold urine stains, coupled with no observation of liveanimals. We treated redundancies, calculated 50 mbuffer clusters, and estimated elevation and aspect forextirpated sites and old pika sites in the same way asfor sites in the extant group. We refer to extirpatedand old sites collectively as “relict sites.”
Geographic and climatic data analysis
To better understand the role of geography and cli-mate in pika occurrence across the GB, we comparedthese variables for extant and relict pika sites.Analyses were nested by geographic scale. The broad-est level was the hydrographic GB. Based on GBgeography and bioclimatic zonation, we partitionedpika sites into six subregions within the GB(Figure 1). These are described as: (1) Southwest(SW) = Sierra Nevada, White Mountains, and adja-cent minor ranges; (2) Northwest (NW) = northeastCalifornia, northwest Nevada, and south-centralOregon; (3) North Central (NC) = northeastNevada; (4) South Central (SC) = central Nevada;(5) Northeast (NE) = northern Utah (UintaMountains, Wasatch Range, Bear River Mountains);and (6) Southeast (SE) = southern Utah. For analyseswithin subregions, we assessed differences in pikapopulations among mountain ranges. Elevationspans within ranges are reported as indicators ofhabitat breadth used locally by pikas.
To assess differences among slope aspects withinand between the three groups (extant, extirpated, andold), we applied a nominal logistic two-level hier-archical analysis of variance (ANOVA), assessing dif-ferences among subregions and among mountainranges within subregions (JMP 12.2; SAS Institute2015). The units of analysis for elevation and aspectwere the 30 m DEM tiles. Differences in elevationamong subregions and mountain ranges were testedin a two-level nested ANOVA, with ranges in sub-regions as a random effect. We evaluated climaterelationships for the three datasets using the 800 m(30 arc-sec) PRISM climate model (Daly, Neilson,and Phillips 1994). Units of analyses for climatewere the 800 m PRISM tiles. Although surface-airtemperatures, as modeled by PRISM, do not repre-sent microclimatic conditions encountered amonghabitat components of American pikas, some ofwhich appear decoupled from surface air (Millar,Westfall, and Delany 2016), talus surface tempera-tures do correlate with surface-air temperatures asmeasured by PRISM. We used PRISM values to char-acterize the overall environmental contexts of pika
e1436296-4 C. I. MILLAR ET AL.
sites at local to subregional to GB scales, and tocompare with the local climatic conditions describedin other pika studies, without intending to imply thatthese represent the specific conditions encounteredby pikas. We selected climate variables that othershave used (Beever et al. 2010, 2011; Millar andWestfall 2010; Wilkening et al. 2011) to discriminatebetween extant and extirpated pika sites, and fromthose determined variables that best predicted pikapopulation status in our datasets (see the list of vari-ables in Table 4). We excluded winter precipitationas a variable, because in the GB it is highly correlatedwith annual precipitation.
Summary statistics were compiled for the GB andfor each subregion. We assessed correlations betweenelevation and climate by computing elevation meansfor digital elevation model tiles, then computed cli-mate and elevation means for PRISM tiles. Climatedifferences in extant locations among subregions andranges in individual subregions were assessed by dis-criminant (canonical) analysis. Differences in climatebetween extant and relict locations and among sub-regions were tested with a two-factor multivariateanalysis of variance (MANOVA), including two-wayinteractions. Correlations, discriminant analysis,nested ANOVA and MANOVA, and tests of signifi-cance (F statistics, t tests) were performed in JMP
(JMP 12.2; SAS Institute 2015). Distributions for theANOVA and MANOVA analyses showed valuesclose to normality; for the discriminant analysis,after excluding a few (~6) outliers, residuals for thefirst canonical vector were not significantly differentfrom normality.
Results
Distribution and climate relationships of extantsites
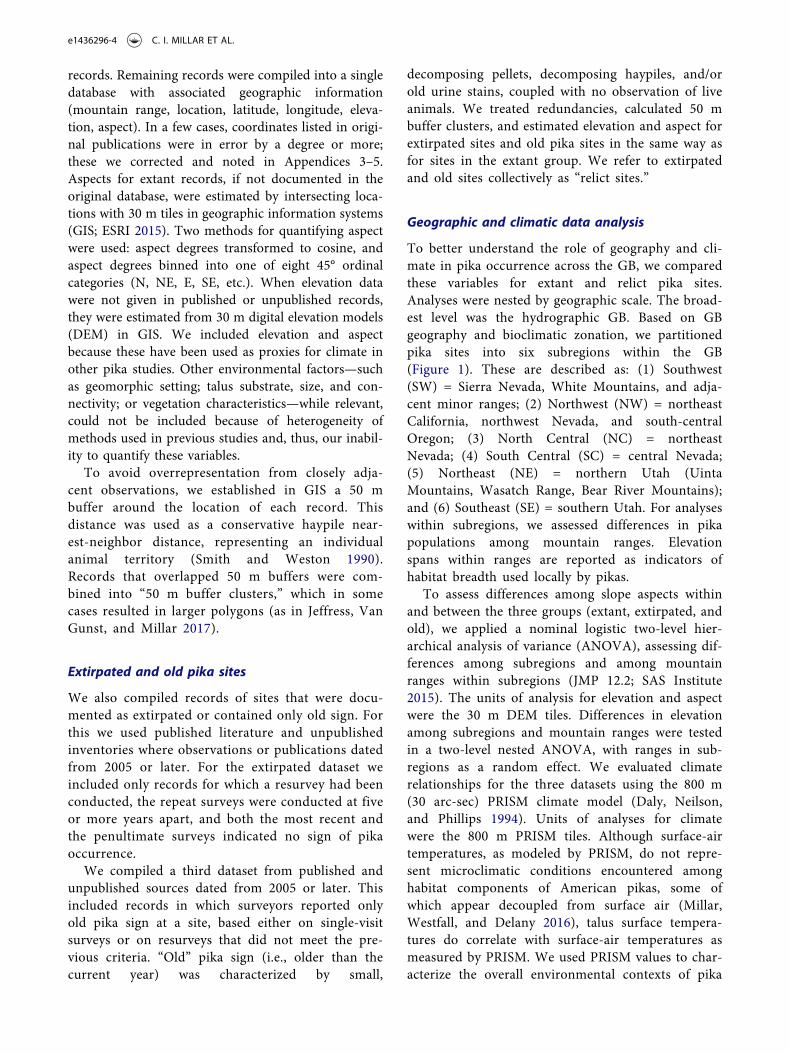
We compiled 2,387 individual pika records from pub-lished and unpublished sources (Tables 1 and 2;Appendix 3). Combining closely adjacent recordsyielded 1,320 50 m buffer clusters. Pika records weredistributed across forty mountain ranges, including thelarge Sheldon Plateau, Nevada, which contains manypoorly distinguished mountain groups (Table 2). All sixsubregions were represented, with the smallest numberof records in the SE (63) and the largest in the NW(958). Elevations of extant sites across the entire GBranged from 1,631 m to 4,009 m (a span of 2,378 m;�x = 2,569 m). Mean elevation in the NW subregion(2,039 m) was significantly lower (p < 0.001) than inthe remaining five subregions (�x = 2,990 m), which didnot differ significantly from one another. Elevation
Table 1. Distribution of American pika sites in the hydrographic Great Basin.Pika Record Elevations (m)
Subregions Number of RecordsNumber of Mountain
Ranges Mean Minimum Maximum Span
1. Extant SitesNorthwest 958 12 2,039 1,631 3,208 1,577Southwest 928 13 2,832 1,827 4,009 2,182North Central 111 2 2,999 2,323 3,436 1,113South Central 170 5 3,007 2,461 3,503 1,042Northeast 157 3 2,955 2,377 3,650 1,273Southeast 63 5 3,111 2,325 3,477 1,152
Total 2,387 40 2,577 1,631 4,009 2,3782. Extirpated SitesNorthwest 26 8 1,929 1,615 2,560 945Southwest 57 5 2,764 2,113 3,106 993North Central NoneSouth Central 6 5 2,507 2,160 2,886 726Northeast NoneSoutheast None
Total 89 18 2,420 1,615 3,106 1,4913. Historic Resurvey SubsetExtant 48 15 2,584 1,872 3,368 1,496Extirpated 23 15 2,196 1,615 2,753 1,138
Total 71 24 2,458 1,615 3,368 1,7534. Old SitesNorthwest 661 15 1,966 1,628 2,598 970Southwest 76 7 2,532 2,104 3,085 981North Central NoneSouth Central 16 2 2,737 2,483 3,267 784Northeast 11 3 2,781 2,463 3,169 706Southeast 10 4 3,099 2,656 3,435 779
Total 774 31 2,054 1,628 3,435 1,807
Notes. 1. Extant sites. 2. Extirpated sites, twentieth and twenty-first century. 3. Subset of records that derive from historic resurvey locations. 4. Old sites, fromsingle survey observations or limited range resurveys.
ARCTIC, ANTARCTIC, AND ALPINE RESEARCH e1436296-5

spans were greatest in the SW subregion and least inthe SC. The subset of extant records that derived frompublished historic resurveys had a mean elevation of2,584 m and range of 1,872–3,368 m (Table 1).
Although extant pika sites were found on all aspects,there was a slight excess of northerly aspects (Table 3).The ANOVA yielded significant (p < 0.0001) differ-ences in aspect among subregions and among rangeswithin subregions; differences among subregions andranges in subregions were significant (p > 0.001),although the chi-square for ranges was much largerthan that for subregions. North aspects had the largestpercentage of extant sites, particularly in the centralsubregions, followed by northeast and northwestaspects. Southerly and eastward aspects had the lowestrepresentation. These patterns were relatively consis-tent across subregions, with exceptions for the south-westerly aspects, where the NE and SE subregions hadmore than twice the percentage of extant sites thanother subregions.
Extant pika sites intersected with 782 PRISM cli-mate tiles. Discriminant analysis of the extant sitesidentified the six subregions as distinct groups(Figure 2). The first three canonical vectors described93 percent of the variation (v1, 66%; v2, 19%; v3,8%), with canonical correlations (goodness of fit) of0.99, 0.97, and 0.92 for v1, v2, and v3, respectively(Table 4). Canonical scores of vector 1 were highlycorrelated with summer precipitation (sum of July,August, and September values) and winter maximumtemperature (Tmax; sum of December, January, andFebruary values) among subregions, and moderatelyto weakly correlated with winter and summer mini-mum temperature (Tmin). Vector 2 was highly cor-related with summer Tmax and annual andSeptember Tmin among subregions, and moderatelycorrelated with annual Tmax and winter and summerTmin. Vector 3 was moderately correlated with Julydewpoint temperature, a measure of humidity,among subregions. Ranges in subregions had
Table 2. Mountain ranges within Great Basin subregions that contain extant pika sites.Pika Sites: Elevation (m)
SubregionsMountainRanges State Number of Pika Records Mean Minimum Maximum Span
Northwest Cascade Range CA 4 1,651 1,631 1,676 45Glass Mountains OR 9 2,271 2,228 2,413 185Hart Mountains OR 110 1,978 1,809 2,240 431Hays Canyon Range NV 104 2,046 1,924 2,211 287High Rock NV 301 1,930 1,768 2,100 332Madeline Uplands CA 6 2,221 1,848 2,411 563Massacre Rim NV 23 1,876 1,838 2,021 183Mosquito Mountains NV 108 1,905 1,807 1,973 166Painted Point Range NV 22 1,823 1,769 2,005 236Sheldon Plateau NV 248 1,963 1,813 2,204 391Steens Mountains OR 2 2,394 2,031 2,757 726Warner Mountains CA/OR 21 2,418 1,766 3,208 1,442
Southwest Bodie Mountains CA/NV 18 2,644 2,545 2,761 216Carson Range CA/NV 22 2,863 2,599 3,190 591Glass Mountains CA 1 3,395 NA NA NAInyo Craters CA 11 2,540 2,471 2,984 513Mono Craters CA 23 2,283 2,055 2,573 518New Range CA 9 2,644 2,469 2,865 396Pine Grove Hills NV 4 2,853 2,815 2,913 98Pine Nut Mountains CA/NV 22 2,731 2,567 2,873 306Sierra Nevada CA/NV 613 2,984 1,827 3,953 2,126Sweetwater Mountains CA/NV 65 2,977 2,310 3,348 1,038Wassuk Mountains NV 36 3,064 2,891 3,397 506White Mountains CA/NV 91 3,279 2,442 4,009 1,543Zunnamed Mountains CA 13 2,582 2,366 2,716 350
North Central East Humboldt Range NV 41 3,039 2,688 3,334 646Ruby Mountains NV 70 2,958 2,323 3,436 1,113
South Central Desatoya Range NV 2 2,655 2,461 2,849 388Monitor Range NV 33 3,152 2,652 3,285 633Shoshone Mountains NV 52 2,730 2,546 2,879 333Toiyabe Range NV 35 3,003 2,652 3,503 851Toquima Range NV 48 3,192 2,861 3,492 631
Northeast Bear River Mountains UT 10 2,701 2,554 2,955 401Uinta Mountains UT 43 3,056 2,377 3,650 1,273Wasatch Range UT 104 3,107 2,611 3,549 938
Southeast Fish Lake Plateau UT 9 3,218 2,894 3,452 558Markagunt Plateau UT 19 2,785 2,325 3,342 1,017Sevier Plateau UT 5 3,171 2,978 3,276 298Tushar Mountains UT 13 3,200 2,927 3,477 550Wasatch Plateau UT 17 3,183 3,209 3,333 124
40 Ranges 2,387 2,577 1,631 4,009 2,378
e1436296-6 C. I. MILLAR ET AL.

considerable heterogeneity in the strengths of corre-lations, especially in the importance of summer pre-cipitation, and in winter and summer Tmax.
Scatter plots of PRISM tile values from recordsacross the entire GB provide estimates of the outerlimits of climate values for locations where pika sitesoccurred, as well as the distribution of values withinthe climate envelope (Figures 2, 3). As canonicalvector correlations with climate (Table 4, Figure 2)indicate, the NW and SW subregions had the warm-est winters and the lowest summer precipitation,
while the NE and SE subregions had the coolestwinters, highest summer Tmin, and the highest sum-mer precipitation. Most of the high summer precipi-tation sites (extant and old) in Figure 3 derive fromthe eastern subregions, and these high values distin-guish Utah sites from the rest of the GB. The SCsubregion was most related to the SW subregion inclimate, differentiated by the SC subregion havingcooler winters, warmer summers, and greater sum-mer precipitation. The NC subregion was intermedi-ate among the subregions in many climate variables.
Table 3. Percent occurrence of slope aspects of pika sites by subregion.%N %NE %E %SE %S %SW %W %NW
1. Extant Sites SubregionNorthwest 17 6 9 13 9 7 23 17Southwest 17 15 9 14 16 9 8 12North Central 28 18 10 5 7 2 15 14South Central 26 23 14 15 12 2 4 4Northeast 13 14 6 10 12 16 11 18Southeast 12 13 3 15 12 18 12 15
Means 19 15 9 12 11 9 12 132. Extirpated Sites Subregion1
Northwest 32 23 5 9 5 9 18Southwest 39 8 12 2 8 14 8 8
Means 37 13 10 4 7 13 6 113. Old Sites Subregion2
Northwest 11 9 7 8 13 22 13 18Southwest 33 5 9 5 8 13 14 14South Central 7 67 0 13 7 0 7 0Northeast 33 25 0 17 17 0 8 0Southeast 0 43 14 29 0 0 0 14
Means 17 30 6 14 9 7 8 9
Notes. 1South Central subregion not included as there were only a few records.2No old sites in North Central subregions.
Table 4. Correlations among climate variables and vectors (CV 1–3) from discriminant analyses. Correlations overall (acrosssubregions) and for individual subregions (among ranges within subregions), with percent of total variation explained by thecanonical vectors and overall canonical correlations. CV3 values are not shown for the SC and SE subregions because theircontributions were minor.
Subregions Northwest SouthwestNorthCentral South Central Northeast Southeast
CV1 CV2 CV3 CV1 CV2 CV3 CV1 CV2 CV3 CV1 CV1 CV2 CV1 CV2 CV1 CV2
Annual precipitation −0.55 −0.54 −0.45 0.95 0.03 0.04 −0.70 −0.21 −0.56 −0.90 0.17 −0.95 1.00 −0.02 −0.40 −0.83July precipitation −0.89 −0.33 0.24 0.82 −0.06 0.35 0.68 −0.56 0.36 −0.36 0.77 −0.57 −0.80 0.60 −0.35 0.55August precipitation −0.93 −0.25 0.18 0.49 −0.60 0.45 0.92 −0.03 0.22 0.00 0.84 −0.46 −0.48 0.88 −0.93 −0.11Septemberprecipitation
−0.97 −0.13 −0.15 0.77 0.37 0.27 −0.49 −0.02 −0.74 −0.67 0.85 −0.50 0.66 0.75 0.31 −0.87
July dewpointtemperature
−0.23 0.16 −0.78 −0.73 −0.30 −0.32 −0.63 −0.13 −0.43 −0.68 −0.25 0.80 −0.37 −0.93 −0.06 0.99
Annual Tmax 0.49 0.63 0.14 −0.84 −0.17 −0.11 −0.45 0.47 0.33 0.40 −0.27 0.83 −0.92 −0.40 −0.03 0.93December Tmax 0.93 −0.09 0.06 −0.74 −0.08 0.09 −0.55 0.37 0.26 0.59 −0.08 0.89 −0.99 0.16 0.02 0.95January Tmax 0.93 −0.04 0.04 −0.75 −0.06 0.23 −0.51 0.35 0.21 0.47 0.06 0.90 −0.97 −0.23 0.08 0.95February Tmax 0.82 0.25 0.04 −0.71 −0.11 0.09 −0.60 0.36 0.19 0.55 −0.19 0.87 −0.98 −0.20 0.01 0.96July Tmax 0.01 0.84 0.30 −0.86 −0.21 −0.17 −0.26 0.60 0.39 0.21 −0.21 0.85 −0.79 −0.61 0.04 0.89August Tmax 0.09 0.88 0.26 −0.87 −0.21 −0.13 −0.33 0.59 0.39 0.34 −0.21 0.85 −0.65 −0.76 −0.18 0.84September Tmax 0.32 0.81 0.07 −0.84 −0.16 −0.02 −0.49 0.52 0.34 0.26 −0.42 0.76 −0.87 −0.49 −0.04 0.90Annual Tmin 0.15 0.88 0.10 −0.59 −0.02 0.09 −0.34 0.77 −0.09 0.00 −0.42 0.74 0.96 −0.29 0.01 0.90December Tmin 0.76 0.57 0.08 −0.21 0.34 0.37 −0.34 0.79 −0.29 0.06 −0.27 0.80 0.98 −0.21 −0.10 0.94January Tmin 0.69 0.64 0.10 −0.45 0.37 0.25 −0.20 0.86 −0.23 0.28 −0.29 0.81 0.98 −0.21 0.02 0.91February Tmin 0.49 0.77 0.12 −0.51 0.16 0.08 −0.27 0.82 −0.09 0.00 −0.35 0.77 0.97 −0.23 −0.01 0.93July Tmin −0.70 0.67 0.07 −0.54 −0.30 0.08 −0.19 0.79 −0.02 −0.12 −0.55 0.65 0.94 −0.35 0.09 0.77August Tmin −0.63 0.75 0.06 −0.56 −0.15 0.16 −0.37 0.79 −0.12 −0.21 −0.52 0.68 0.97 −0.25 0.00 0.83September Tmin −0.33 0.85 0.08 −0.06 0.26 0.28 −0.28 0.82 −0.20 −0.04 −0.48 0.70 0.95 −0.32 −0.10 0.85Percent explained 66 19 8 49 27 14 44 24 14 100 63 28 68 32 67 27Canonical correlations 0.99 0.97 0.92 0.99 0.99 0.97 0.9 0.84 0.76 0.96 0.99 0.99 0.98 0.96 0.99 0.98
ARCTIC, ANTARCTIC, AND ALPINE RESEARCH e1436296-7
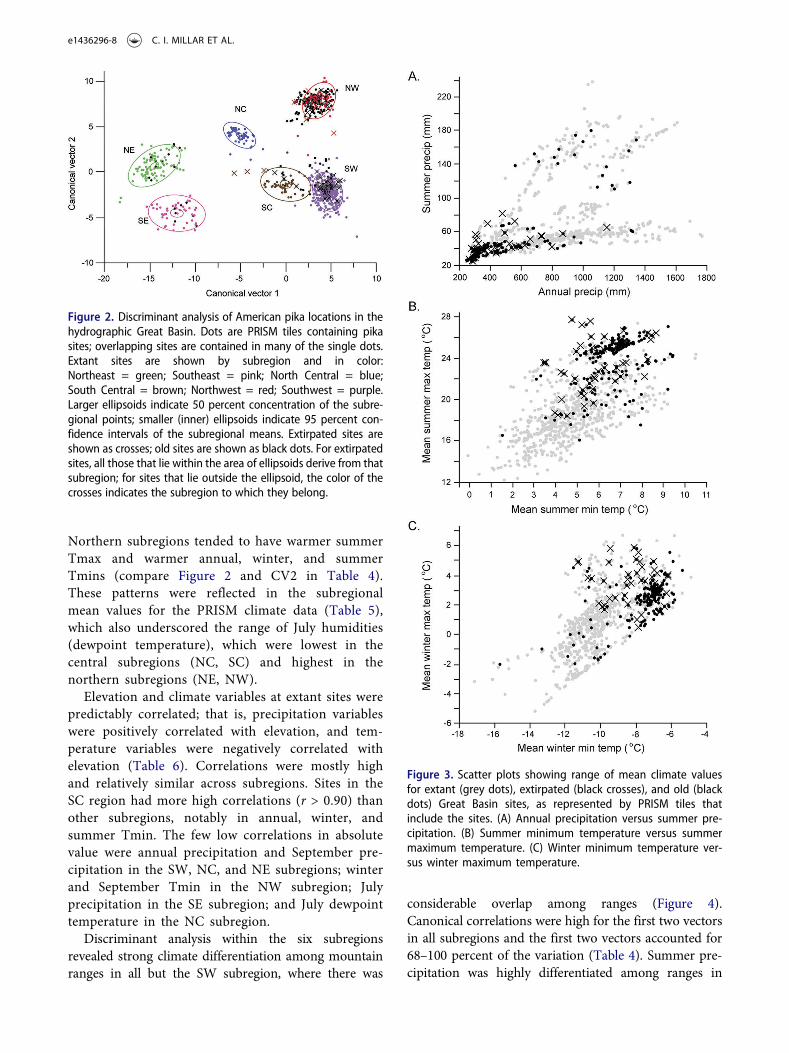
Northern subregions tended to have warmer summerTmax and warmer annual, winter, and summerTmins (compare Figure 2 and CV2 in Table 4).These patterns were reflected in the subregionalmean values for the PRISM climate data (Table 5),which also underscored the range of July humidities(dewpoint temperature), which were lowest in thecentral subregions (NC, SC) and highest in thenorthern subregions (NE, NW).
Elevation and climate variables at extant sites werepredictably correlated; that is, precipitation variableswere positively correlated with elevation, and tem-perature variables were negatively correlated withelevation (Table 6). Correlations were mostly highand relatively similar across subregions. Sites in theSC region had more high correlations (r > 0.90) thanother subregions, notably in annual, winter, andsummer Tmin. The few low correlations in absolutevalue were annual precipitation and September pre-cipitation in the SW, NC, and NE subregions; winterand September Tmin in the NW subregion; Julyprecipitation in the SE subregion; and July dewpointtemperature in the NC subregion.
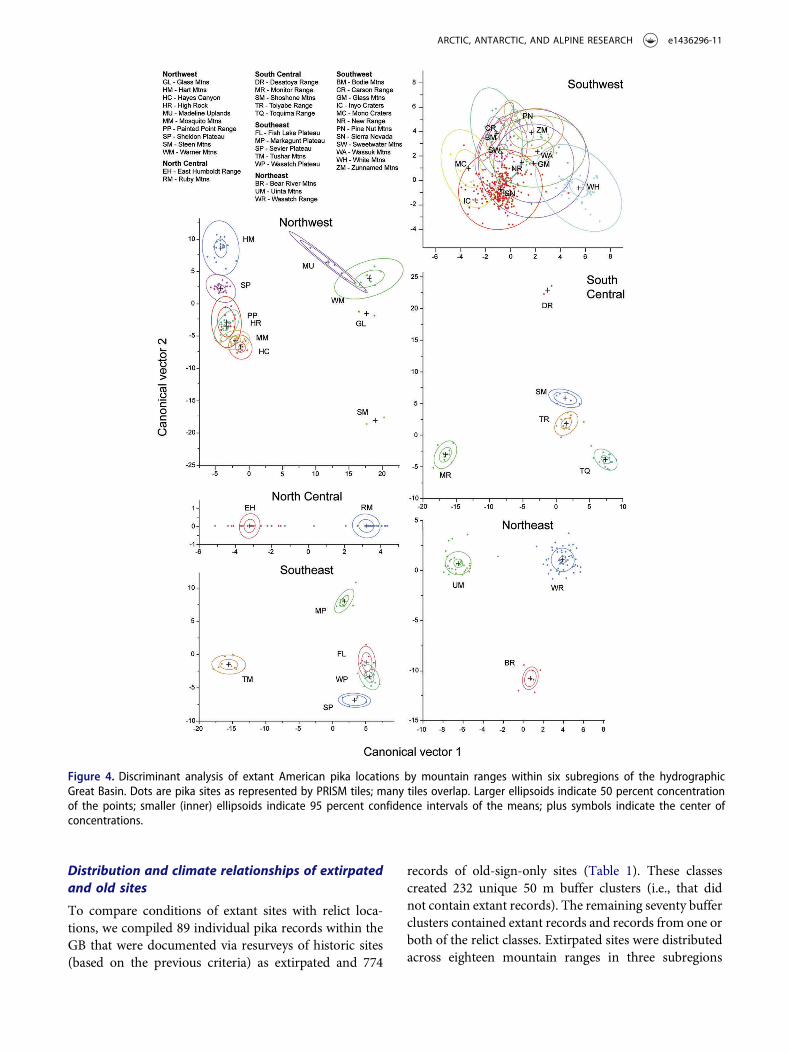
Discriminant analysis within the six subregionsrevealed strong climate differentiation among mountainranges in all but the SW subregion, where there was
considerable overlap among ranges (Figure 4).Canonical correlations were high for the first two vectorsin all subregions and the first two vectors accounted for68–100 percent of the variation (Table 4). Summer pre-cipitation was highly differentiated among ranges in
Figure 2. Discriminant analysis of American pika locations in thehydrographic Great Basin. Dots are PRISM tiles containing pikasites; overlapping sites are contained in many of the single dots.Extant sites are shown by subregion and in color:Northeast = green; Southeast = pink; North Central = blue;South Central = brown; Northwest = red; Southwest = purple.Larger ellipsoids indicate 50 percent concentration of the subre-gional points; smaller (inner) ellipsoids indicate 95 percent con-fidence intervals of the subregional means. Extirpated sites areshown as crosses; old sites are shown as black dots. For extirpatedsites, all those that lie within the area of ellipsoids derive from thatsubregion; for sites that lie outside the ellipsoid, the color of thecrosses indicates the subregion to which they belong.
Figure 3. Scatter plots showing range of mean climate valuesfor extant (grey dots), extirpated (black crosses), and old (blackdots) Great Basin sites, as represented by PRISM tiles thatinclude the sites. (A) Annual precipitation versus summer pre-cipitation. (B) Summer minimum temperature versus summermaximum temperature. (C) Winter minimum temperature ver-sus winter maximum temperature.
e1436296-8 C. I. MILLAR ET AL.

subregions except the NC. Summer Tmax was mosthighly correlated in the NC, SC, NE, and SE, but not inthe SW or NW; summer Tmin was most highly correlatedin the SW, NE, SC, and SE subregions, but not in the NW
or NC. July dewpoint temperature added relatively highdiscrimination among ranges for all subregions except forthe SW and NC.
Table 5. Summary of subregional mean climatic data from PRISM climate model (1981–2010 normals, Daly, Neilson, and Phillips1994). For overall means and range of values, boldface is annual, light shading is summer, and dark shading is winter.
Overall
Subregional Means Means Ranges
Northwest Southwest North Central South Central Northeast Southeast Min Max
A. Extant SitesAnnual precipitation (mm) 408 855 951 605 1,186 837 819 259 1,787July precipitation (mm) 11 16 20 32 38 44 21 5 66August precipitation (mm) 12 15 23 32 47 61 23 8 85September precipitation (mm) 16 23 41 28 73 54 31 9 99Annual temperature (°C) 5.6 2.9 2.3 3.0 2.2 2.9 3.1 −2.4 8.5July dewpoint temperature (°C) 0.5 −0.6 −3.3 −4.1 1.5 −0.3 −0.6 −6.3 4.2Annual maximum temperature (°C) 12.2 9.2 7.9 9.5 7.9 9.1 9.4 2.7 16.6December maximum temperature (°C) 1.6 1.5 −1.8 0.9 −2.2 −0.4 0.6 −5.2 6.2January maximum temperature (°C) 2.0 1.7 −1.6 1.1 −1.9 −0.4 0.9 −4.9 6.6February maximum temperature (°C) 3.1 1.7 −0.5 1.2 −0.7 0.7 1.4 −5.6 7.3July maximum temperature (°C) 25.7 19.5 20.4 22.3 20.5 21.0 20.9 13.3 28.4August maximum temperature (°C) 25.2 19.2 20.2 21.5 19.8 19.9 20.4 12.9 28.5September maximum temperature (°C) 20.8 15.6 15.4 15.5 14.7 15.6 16.3 8.0 24.4Annual minimum temperature (°C) −1.1 −3.4 −3.2 −3.4 −3.5 −3.2 −3.1 −9.1 1.1December minimum temperature (°C) −7.4 −9.6 −10.7 −9.7 −11.7 −11.3 −9.7 −16.9 −4.8January minimum temperature (°C) −7.2 −9.8 −10.7 −9.7 −11.7 −11.3 −9.8 −16.8 −4.8February minimum temperature (°C) −7.2 −10.5 −10.7 −10.3 −11.7 −11.1 −10.2 −17.5 −5.2July minimum temperature (°C) 7.6 5.6 7.3 6.2 7.7 7.5 6.5 1.6 12.5August minimum temperature (°C) 7.3 5.2 7.0 5.7 7.1 6.8 6.0 0.9 11.8September minimum temperature (°C) 3.8 1.9 2.7 2.1 2.8 2.9 2.4 −2.7 7.2
B. Extirpated SitesAnnual precipitation (mm) 575 429 423 457 265 1,157July precipitation (mm) 12 13 20 14 5 24August precipitation (mm) 13 13 24 14 6 29September precipitation (mm) 19 14 22 17 10 31Annual temperature (°C) 5.8 4.8 6.0 5.3 2.8 7.5July dewpoint temperature (°C) 1.1 −0.8 −1.5 −0.4 −4.2 3.0Annual maximum temperature (°C) 12.5 12.2 12.6 12.5 8.9 15.8December maximum temperature (°C) 2.2 3.6 2.4 3.0 −0.2 5.3January maximum temperature (°C) 2.6 3.7 2.6 3.2 0.3 5.9February maximum temperature (°C) 3.8 3.9 3.4 3.9 1.2 6.7July maximum temperature (°C) 25.4 23.3 26.1 24.7 19.7 29.1August maximum temperature (°C) 25.0 23.0 25.2 24.2 19.2 28.7September maximum temperature (°C) 20.7 19.2 19.8 20.0 15.6 24.4Annual minimum temperature (°C) −0.8 −2.6 −0.7 −1.7 −4.2 0.7December minimum temperature (°C) −7.1 −9.2 −8.2 −8.4 −11.5 −6.5January minimum temperature (°C) −6.9 −9.1 −7.9 −8.3 −11.5 −6.3February minimum temperature (°C) −6.7 −9.3 −7.8 −8.2 −10.9 −5.7July minimum temperature (°C) 7.8 7.0 9.6 7.6 5.1 10.9August minimum temperature (°C) 7.3 5.9 8.8 6.8 4.1 9.7September minimum temperature (°C) 4.3 2.5 4.9 3.3 0.2 5.6
C. Old SitesAnnual precipitation (mm) 351 607 559 1,141 797 451 248 1,345July precipitation (mm) 10 12 21 34 43 13 5 51August precipitation (mm) 11 13 23 40 60 15 6 66September precipitation (mm) 14 19 20 64 52 19 10 78Annual temperature (°C) 6.0 4.8 4.6 3.0 3.1 5.5 −0.4 8.1July dewpoint temperature (°C) 0.6 −0.3 −3.1 2.4 0.0 0.4 −5.8 4.1Annual maximum temperature (°C) 12.7 12.0 10.9 8.5 9.4 12.2 6.7 15.6December maximum temperature (°C) 1.9 3.4 1.4 −1.9 −0.2 1.9 −2.8 5.5January maximum temperature (°C) 2.3 3.5 1.6 −1.5 −0.1 2.2 −2.4 5.9February maximum temperature (°C) 3.5 3.8 2.1 −0.2 1.0 3.2 −1.3 6.4July maximum temperature (°C) 26.2 23.1 23.9 21.3 21.3 25.3 18.2 29.1August maximum temperature (°C) 25.8 22.8 23.1 20.6 20.2 24.8 16.8 28.7September maximum temperature (°C) 21.3 19.1 17.6 15.5 15.9 20.4 12.7 24.4Annual minimum temperature (°C) −0.7 −2.3 −1.7 −2.6 −3.2 −1.1 −7.5 1.3December minimum temperature (°C) −7.2 −8.7 −8.4 −10.9 −11.2 −7.8 −15.4 −5.6January minimum temperature (°C) −7.0 −8.8 −8.4 −10.9 −11.2 −7.7 −15.5 −5.7February minimum temperature (°C) −6.9 −9.0 −8.7 −10.8 −10.9 −7.6 −16.1 −5.0July minimum temperature (°C) 8.3 7.1 8.3 8.7 7.5 8.1 3.3 11.1August minimum temperature (°C) 7.9 6.2 7.6 7.9 6.8 7.6 2.6 10.6September minimum temperature (°C) 4.2 2.9 3.9 3.7 2.9 3.9 −1.3 7.0
ARCTIC, ANTARCTIC, AND ALPINE RESEARCH e1436296-9
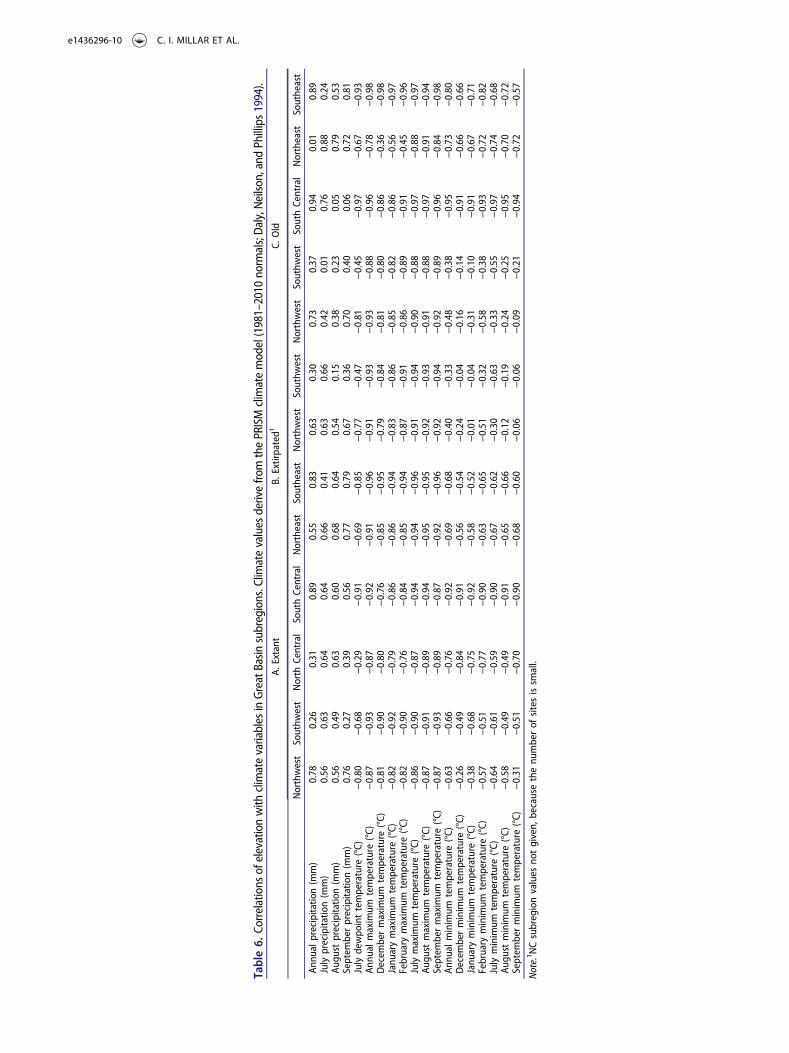
Table6.
Correlations
ofelevationwith
climatevariables
inGreatBasin
subregions.Clim
atevalues
derivefro
mthePRISMclimatemodel(1981–2010
norm
als;Daly,Neilso
n,andPhillips1994).
A.Extant
B.Extirpated1
C.Old
Northwest
Southw
est
North
Central
SouthCentral
Northeast
Southeast
Northwest
Southw
est
Northwest
Southw
est
SouthCentral
Northeast
Southeast
Annu
alprecipitatio
n(m
m)
0.78
0.26
0.31
0.89
0.55
0.83
0.63
0.30
0.73
0.37
0.94
0.01
0.89
Julyprecipitatio
n(m
m)
0.56
0.63
0.64
0.64
0.66
0.41
0.63
0.66
0.42
0.01
0.76
0.88
0.24
Augu
stprecipitatio
n(m
m)
0.56
0.49
0.63
0.60
0.68
0.64
0.54
0.15
0.38
0.23
0.05
0.79
0.53
Septem
berprecipitatio
n(m
m)
0.76
0.27
0.39
0.56
0.77
0.79
0.67
0.36
0.70
0.40
0.06
0.72
0.81
Julydewpo
inttemperature
(°C)
−0.80
−0.68
−0.29
−0.91
−0.69
−0.85
−0.77
−0.47
−0.81
−0.45
−0.97
−0.67
−0.93
Annu
almaximum
temperature
(°C)
−0.87
−0.93
−0.87
−0.92
−0.91
−0.96
−0.91
−0.93
−0.93
−0.88
−0.96
−0.78
−0.98
Decem
bermaximum
temperature
(°C)
−0.81
−0.90
−0.80
−0.76
−0.85
−0.95
−0.79
−0.84
−0.81
−0.80
−0.86
−0.36
−0.98
Janu
arymaximum
temperature
(°C)
−0.82
−0.92
−0.79
−0.86
−0.86
−0.94
−0.83
−0.86
−0.85
−0.82
−0.86
−0.56
−0.97
February
maximum
temperature
(°C)
−0.82
−0.90
−0.76
−0.84
−0.85
−0.94
−0.87
−0.91
−0.86
−0.89
−0.91
−0.45
−0.96
Julymaximum
temperature
(°C)
−0.86
−0.90
−0.87
−0.94
−0.94
−0.96
−0.91
−0.94
−0.90
−0.88
−0.97
−0.88
−0.97
Augu
stmaximum
temperature
(°C)
−0.87
−0.91
−0.89
−0.94
−0.95
−0.95
−0.92
−0.93
−0.91
−0.88
−0.97
−0.91
−0.94
Septem
bermaximum
temperature
(°C)
−0.87
−0.93
−0.89
−0.87
−0.92
−0.96
−0.92
−0.94
−0.92
−0.89
−0.96
−0.84
−0.98
Annu
alminimum
temperature
(°C)
−0.63
−0.66
−0.76
−0.92
−0.69
−0.68
−0.40
−0.33
−0.48
−0.38
−0.95
−0.73
−0.80
Decem
berminimum
temperature
(°C)
−0.26
−0.49
−0.84
−0.91
−0.56
−0.54
−0.24
−0.04
−0.16
−0.14
−0.91
−0.66
−0.66
Janu
aryminimum
temperature
(°C)
−0.38
−0.68
−0.75
−0.92
−0.58
−0.52
−0.01
−0.04
−0.31
−0.10
−0.91
−0.67
−0.71
February
minimum
temperature
(°C)
−0.57
−0.51
−0.77
−0.90
−0.63
−0.65
−0.51
−0.32
−0.58
−0.38
−0.93
−0.72
−0.82
July
minimum
temperature
(°C)
−0.64
−0.61
−0.59
−0.90
−0.67
−0.62
−0.30
−0.63
−0.33
−0.55
−0.97
−0.74
−0.68
Augu
stminimum
temperature
(°C)
−0.58
−0.49
−0.49
−0.91
−0.65
−0.66
−0.12
−0.19
−0.24
−0.25
−0.95
−0.70
−0.72
Septem
berminimum
temperature
(°C)
−0.31
−0.51
−0.70
−0.90
−0.68
−0.60
−0.06
−0.06
−0.09
−0.21
−0.94
−0.72
−0.57
Note.1 NCsubregionvalues
notgiven,
becausethenu
mberof
sitesissm
all.
e1436296-10 C. I. MILLAR ET AL.
Distribution and climate relationships of extirpatedand old sites
To compare conditions of extant sites with relict loca-tions, we compiled 89 individual pika records within theGB that were documented via resurveys of historic sites(based on the previous criteria) as extirpated and 774
records of old-sign-only sites (Table 1). These classescreated 232 unique 50 m buffer clusters (i.e., that didnot contain extant records). The remaining seventy bufferclusters contained extant records and records from one orboth of the relict classes. Extirpated sites were distributedacross eighteen mountain ranges in three subregions
Figure 4. Discriminant analysis of extant American pika locations by mountain ranges within six subregions of the hydrographicGreat Basin. Dots are pika sites as represented by PRISM tiles; many tiles overlap. Larger ellipsoids indicate 50 percent concentrationof the points; smaller (inner) ellipsoids indicate 95 percent confidence intervals of the means; plus symbols indicate the center ofconcentrations.
ARCTIC, ANTARCTIC, AND ALPINE RESEARCH e1436296-11
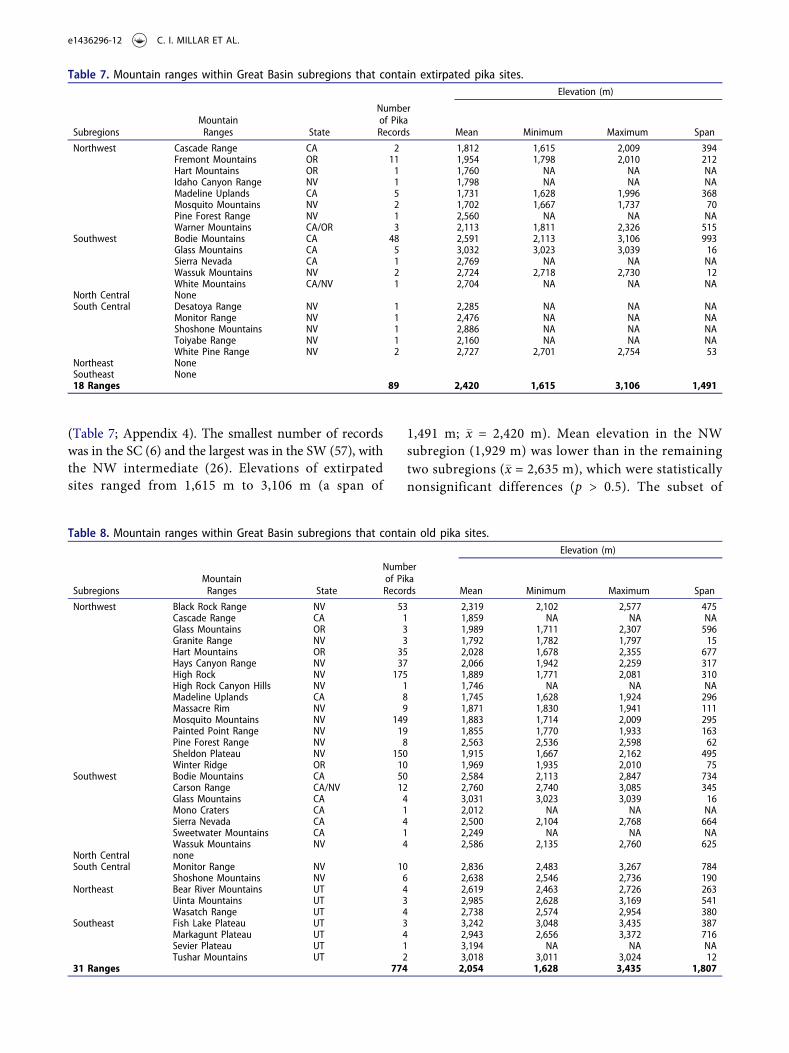
(Table 7; Appendix 4). The smallest number of recordswas in the SC (6) and the largest was in the SW (57), withthe NW intermediate (26). Elevations of extirpatedsites ranged from 1,615 m to 3,106 m (a span of
1,491 m; �x = 2,420 m). Mean elevation in the NWsubregion (1,929 m) was lower than in the remainingtwo subregions (�x = 2,635 m), which were statisticallynonsignificant differences (p > 0.5). The subset of
Table 7. Mountain ranges within Great Basin subregions that contain extirpated pika sites.Elevation (m)
SubregionsMountainRanges State
Numberof PikaRecords Mean Minimum Maximum Span
Northwest Cascade Range CA 2 1,812 1,615 2,009 394Fremont Mountains OR 11 1,954 1,798 2,010 212Hart Mountains OR 1 1,760 NA NA NAIdaho Canyon Range NV 1 1,798 NA NA NAMadeline Uplands CA 5 1,731 1,628 1,996 368Mosquito Mountains NV 2 1,702 1,667 1,737 70Pine Forest Range NV 1 2,560 NA NA NAWarner Mountains CA/OR 3 2,113 1,811 2,326 515
Southwest Bodie Mountains CA 48 2,591 2,113 3,106 993Glass Mountains CA 5 3,032 3,023 3,039 16Sierra Nevada CA 1 2,769 NA NA NAWassuk Mountains NV 2 2,724 2,718 2,730 12White Mountains CA/NV 1 2,704 NA NA NA
North Central NoneSouth Central Desatoya Range NV 1 2,285 NA NA NA
Monitor Range NV 1 2,476 NA NA NAShoshone Mountains NV 1 2,886 NA NA NAToiyabe Range NV 1 2,160 NA NA NAWhite Pine Range NV 2 2,727 2,701 2,754 53
Northeast NoneSoutheast None18 Ranges 89 2,420 1,615 3,106 1,491
Table 8. Mountain ranges within Great Basin subregions that contain old pika sites.Elevation (m)
SubregionsMountainRanges State
Numberof PikaRecords Mean Minimum Maximum Span
Northwest Black Rock Range NV 53 2,319 2,102 2,577 475Cascade Range CA 1 1,859 NA NA NAGlass Mountains OR 3 1,989 1,711 2,307 596Granite Range NV 3 1,792 1,782 1,797 15Hart Mountains OR 35 2,028 1,678 2,355 677Hays Canyon Range NV 37 2,066 1,942 2,259 317High Rock NV 175 1,889 1,771 2,081 310High Rock Canyon Hills NV 1 1,746 NA NA NAMadeline Uplands CA 8 1,745 1,628 1,924 296Massacre Rim NV 9 1,871 1,830 1,941 111Mosquito Mountains NV 149 1,883 1,714 2,009 295Painted Point Range NV 19 1,855 1,770 1,933 163Pine Forest Range NV 8 2,563 2,536 2,598 62Sheldon Plateau NV 150 1,915 1,667 2,162 495Winter Ridge OR 10 1,969 1,935 2,010 75
Southwest Bodie Mountains CA 50 2,584 2,113 2,847 734Carson Range CA/NV 12 2,760 2,740 3,085 345Glass Mountains CA 4 3,031 3,023 3,039 16Mono Craters CA 1 2,012 NA NA NASierra Nevada CA 4 2,500 2,104 2,768 664Sweetwater Mountains CA 1 2,249 NA NA NAWassuk Mountains NV 4 2,586 2,135 2,760 625
North Central noneSouth Central Monitor Range NV 10 2,836 2,483 3,267 784
Shoshone Mountains NV 6 2,638 2,546 2,736 190Northeast Bear River Mountains UT 4 2,619 2,463 2,726 263
Uinta Mountains UT 3 2,985 2,628 3,169 541Wasatch Range UT 4 2,738 2,574 2,954 380
Southeast Fish Lake Plateau UT 3 3,242 3,048 3,435 387Markagunt Plateau UT 4 2,943 2,656 3,372 716Sevier Plateau UT 1 3,194 NA NA NATushar Mountains UT 2 3,018 3,011 3,024 12
31 Ranges 774 2,054 1,628 3,435 1,807
e1436296-12 C. I. MILLAR ET AL.
extirpated records from published historic resurveyshad a mean elevation of 2,196 m and range of 1,615–2,753 m. Aspects of extirpated pika sites were morenortherly than extant sites (Table 3).
Old sites were distributed across thirty-one mountainranges in five subregions (Table 8; Appendix 5). Mostrecords were in the NW subregion (661), far fewer werein the SW (76), and only small numbers were located inthe SC, NE, and SE subregions (16, 11, and 10, respec-tively). Elevations for the old records ranged from 1,628to 3,435 m (a span of 1,807 m; �x = 2,054 m). Meanelevation in the NW subregion (1,966 m) was lower thanin the remaining four subregions. Of those, mean eleva-tions in the SW, SC, and NE subregions did not differsignificantly; mean elevation in the SE subregion (�x =3,099 m) was significantly higher than the other five(p < 0.001). Aspects of old pika sites were distributedin all octants with slight excess in the north, whereassouth- and westward aspects were least represented(Table 3). Subregions showed significant heterogeneity(p < 0.001) in aspect. All octants were well represented inthe NW and SW subregions, while the south and westoctants were either lacking or of minor importance inthe other three subregions.
By appendingPRISM-derived climate data for relict sitesto the extant-site dataset, we computed canonical scores forlocations of the extirpated and old-sign sets and used dis-criminant analysis to compare these scores to the climatespace for extant sites. The resulting analysis showed that therelict sites and extant sites lie largely within the sameclimate space, with some exceptions (Figures 2, 3). In theMANOVA, the order of differences was subregions(p < 0.001) > mountain range > pika status (extant, extir-pated, old). Mean values for the extirpated and old-signsites compared to the extant sites highlight the differencesbetween these groups (Table 5). Overall, mean annual pre-cipitation for the relict sites was lower than for the extantset. Comparing by subregions, however, the NW subregionhad higher mean annual precipitation in the extirpatedthan in the extant sites, while old-sign site means weresimilar to those of extant sites. Considering summer pre-cipitation, the extirpated and old sites had lower values thanextant sites in the SW, SC, and SE subregions, but not in theNW and NE subregions, despite those two subregionsbeing the driest and wettest of the six subregions.
Patterns of climate differences between relict andextant sites were complex, varied by subregion, andcould not distinguish among the categories of occurrence.Annual temperature, Tmin and Tmax, and summerTmax were higher for relict sites compared with extantsites in the SW and SC subregions, but not in the NW,NE, or SE subregions. Winter Tmins and Tmaxs were
comparable between extirpated, old, and extant sites. Inthe SC and NE subregions, higher summer Tminsoccurred at extirpated or old sites compared to extantsites, while in the NW and SW subregions, extant siteswere warmer than either extirpated or old-sign sites (butnever both), and there were no differences for the SEsubregion among the three datasets.
Correlations between elevation and climate variables atrelict sites in the NW and SW subregions were generallylower and had fewer significant values (r < |0.6|) than atextant sites, although they followed similar patterns to theextant group (Table 6). There were also differences incorrelations between the sets of extirpated versus old-sign sites, especially in summer and winter Tmin: forthe extirpated group, correlations were low and nonsigni-ficant, and some were even positive, suggesting that Tminmay increase with elevation; for example, as a result ofcold-air drainage effects. Annual, summer, and winterTmin correlations with elevation, by contrast, for the oldsites in the SC, NE, and SE subregions were all negative,and most were high and significant (p < 0.05). In sum-mary, no obvious pattern emerged to distinguish extir-pated and old-sign sites from extant sites; if anything, thelow correlations between climate variables and elevationsuggest great landscape complexity associated with thesecategories of occurrence.
Mountain ranges with no pika evidence
The island-like geography of mountain ranges in the GB,coupled with the large number of ranges, present bio-geographic challenges for species dispersal (Brown1971), resulting in both deterministic (climate, distance,source populations) and stochastically derived distribu-tions for many GB mammal species. We compiled a listof mountain ranges that appear to have characteristicpika habitat and suitable bioclimatic zones, but whereexperienced surveyors have found no evidence of pikahabitation, current or historic (Table 9). The list of 45mountain ranges includes only areas where pikas havenever been found in any part of the range. Surveys havenot been comprehensive, however, and we encouragecontinued exploration of these and other mountainranges with features capable of supporting pikas.
Discussion
Extant pika populations in the Great Basin andcomparison with relict locations
The primary focus of our study was to clarify thecurrent distribution of extant pika populations in the
ARCTIC, ANTARCTIC, AND ALPINE RESEARCH e1436296-13

hydrographic GB and to describe climatic conditionsfor this distribution of locations. Additionally, we com-pared conditions found at extant pika sites with thoseat relict sites to improve our understanding of environ-mental factors that may have been responsible forpopulation declines. To the extent that our sites repre-sent still-extant populations, we found that pikas are farmore widely distributed across the GB than previouslyreported or assumed, and confirm prior observations(e.g., Jeffress et al. 2013; Ray, Beever, and Rodhouse2016; Stewart and Wright 2012) that climate may repre-sent only one of many factors influencing their currentand recent distribution.
The broad GB distribution of extant pika populationsextends across five degrees of latitude and ten degrees of
longitude, represents three ecosystem provinces (Bailey1980), encompasses six subregions of the GB, traversesforty mountain ranges, spans 2,378 m elevation, and com-prises three of the five currently described subspecies (O. p.princeps, O. p. schisticeps, and O. p. uinta; Hafner andSmith 2010). The minimum elevation of extant popula-tions (1,631 m) is approximately 900 m below the lowrange given for the southern portion of the species’ dis-tribution (Smith and Weston 1990); approximately 200 mlower than theminimum elevations fromprior distributionstudies of extant central and western GB sites (Millar andWestfall 2010; Millar, Westfall, and Delany 2013); andslightly below the minimum elevation of extant sites in astudy of pikas of the northern GB (1,648 m; Collins andBauman 2012). Our samples also extend the reported
Table 9. Great Basin mountain ranges where evidence for pika presence has not been detected during twentieth- and twenty-first-century surveys. High point elevations from D.A. Charlet (unpublished, Atlas of Nevada Mountains).
Mountain Range County StateElevation
Highest Point (m)
MostRecent
Survey Date Source
Anchorite Hills Mineral NV 2,905 2017 Millar, unpublishedCherry Creek Range White Pine NV 3,215 1995 NDOW, Chris RayClan Alpine Churchill NV 3,046 2017 Millar, unpublishedCopper Mountains Elko NV 3,021 2014 Millar, unpublishedCortez Mountains Eureka, Lander NV 2,793 1993 NDOW, Chris RayCowtrack Hills Mono CA 2,704 2012 Millar, unpublishedDeep Creek Range Tooele, Juab UT 3,684 2011 Millar, unpublished, UT Div of Wildlife, unpublishedDeLamar Mountains Lincoln NV 2,449 2010 Millar, unpublishedDesert Mountains Lyon, Churchill NV 2,046 1993 NDOW, Chris RayDuck Creek Range White Pine NV 3,160 2011 Millar, unpublishedEgan Range White Pine, Lyon NV 3,333 2014 Millar, unpublishedExcelsior Mountains Mineral NV 2,384 2015 Millar, unpublishedFish Creek Mountains Lander NV 2,635 2017 Millar, unpublishedGarfield Hills Mineral NV 2,335 2017 Millar, unpublishedGillis Range Mineral NV 2,404 1993 NDOW, Chris RayHumboldt Range Pershing NV 2,997 2000 NDOW, Chris RayInyo Mountains Inyo CA 3,392 2012 Millar, unpublishedJarbidge Mountains Elko NV 3,304 2016 Millar, unpublishedLast Chance Range Nye NV 2,645 2016 Millar, unpublishedLone Mountain Esmeralda NV 2,776 1993 NDOW, Chris RayMarys River Range Elko NV 3,220 2014 Millar, unpublishedOquirrh Mountains Tooele, Utah UT 2,763 2016 UT Division of Wildlife, unpublishedPahroc Range, North and South Lincoln NV 2,423 2010 Millar, unpublishedPalmetto Mountains Esmeralda NV 2,830 2016 Millar, unpublishedParadise Range Nye NV 2,638 2008 Millar, unpublishedPeqoup Mountains Elko NV 3,128 2014 NDOW, Mackenzie JeffressPilot Range Box Elder, Elko UT, NV 3,267 2016 UT Division of Wildlife, unpublishedQuinn Canyon Range Nye, Lincoln NV 3,118 2014 Millar, unpublishedRaft River Range Box Elder UT 3,025 2016 UT Division of Wildlife, unpublishedRoberts Mountains Eureka NV 3,089 2017 NDOW, Mackenzie Jeffress; Millar, unpublishedSanta Rosa Range Humboldt NV 2,966 1993 NDOW, Chris RaySchell Creek Range Lincoln, White Pine NV 3,622 2014 NDOW, Mike PodbornySeaman Range Lincoln, Ney NV 2,818 2010 Millar, unpublishedSheep Range Clark, Lincoln NV 3,021 2010 Millar, unpublishedSilver Peak Range Esmeralda NV 2,880 2017 Millar, unpublishedSnake Mountains Elko NV 2,696 2017 Millar, unpublishedSnake Range, North and South White Pine NV 3,982 2016 Millar, unpublishedSonoma Range Humboldt NV 2,864 1993 NDOW, Chris RaySpring Mountains Clark, Nye NV 3,621 1995 NDOW, Chris RayStansbury Mountains Tooele UT 3,363 2016 UT Division of Wildlife, unpublishedTobin Range Pershing NV 2,979 2017 Millar, unpublishedTuscarora Mountains Elko, Eureka NV 2,678 1993 NDOW, Chris RayVolcanic Hills Esmeralda NV 2,255 1993 NDOW, Chris RayWellsville Mountains Cache UT 2,857 2016 UT Division of Wildlife, unpublishedWhite Pine Rangea White Pine, Nye NV 3,509 2015 Millar, unpublished; Jeffress, unpublished
Notes. aThe occurrence of pikas, historic or modern, in the White Pine Range has been questioned; we include the records in Appendix 4 until furtherverification, but also include the Range here to encourage exploration.
e1436296-14 C. I. MILLAR ET AL.
maximum elevation of extant GB sites by 122 m, from3,887 m (Millar and Westfall 2010) to 4,009 m.
Extant sites are distributed across all aspects, with aslight excess of north-facing slopes. This broad repre-sentation was surprising. Given the thermal sensitivityof pikas, we expected cooler, north-facing aspects to bemore strongly represented, especially in relatively warmenvironments. Apparently adequate physical environ-ments exist across the GB on many aspects and withsufficient local microclimatic conditions to supportpika populations. Perhaps equally unexpected is thelarge proportion of relict sites that occurred on cool,northern aspects.
How does the distribution of previously published his-toric resurvey sites (e.g., Beever, Brussard, and Berger 2003;Beever et al. 2011, 2016; Stewart et al. 2015;Wilkening et al.2011) compare to our newly compiled set? Resurvey siteswere neither chosen nor intended to represent the distribu-tion of pikas in theGB, and the set of historic sites is slightlybiased toward lower elevations and a narrower distributionof sites than in our study. Our data include fifteen moremountain ranges than are included in the historic resur-veys, and significantly extend the elevational range of occu-pied pika sites to 1.5 times greater than historic resurveysites (including extensions into highermontane elevations).Overall, the mean elevation of the resurvey sites was 119 mlower than the mean for our compiled extant set. Historicresurvey sitesmight represent lower elevations as a result oflimited access during historic periods, when travel into highand remote mountain areas was more restricted than atpresent. Whatever the reason, interpretations from resur-vey studies are best understood in the context of theirrelative environments, which do not necessarily representthose of pikas across the GB.
The broad geographic distribution of pika sitesacross the GB also demonstrates a larger range ofclimate values for locations of extant pika sites thanpreviously reported. Our basin-wide perspective high-lights wide subregional climate differences among pikalocations. Differences in mean annual precipitationamong subregions, for instance, were greater than760 mm, from a low in the NW subregion to a highin the NE subregion. Mean summer precipitation var-ied greatly across the GB. Pika sites in the NW and SWsubregions have arid summers (~7% of annual precipi-tation), while sites in the NE and SE subregions experi-ence proportionately more precipitation in summer(~20% of annual). Temperature ranges also exhibitedstrong variation among subregions, with more than 6°Cdifference in mean maximum summer temperatureamong the extremes (NW and SW subregions). Theseranges of values underscore the breadth of climaticenvironments that extant pika sites represent in the GB.
Multivariate climate analyses within subregionsfurther revealed that extant pika site locations are cli-matically more heterogeneous than previously thought.Climatic distinctions among mountain ranges werelarge, even among adjacent ranges, within all subre-gions except the SW. The complex climatic overlap ofmountain ranges in that subregion was unexpected,given the rain-shadow effect of the Sierra Nevada andcumulative effects eastward that would be assumed toaccentuate differentiation. Low sample numbers insome ranges, however, likely lowered our ability toaccurately discriminate distinctions.
A climate envelope for extant GB pika sites, if such canbe considered from the range of average and extremevalues of extant sites derived from PRISM (Figure 3,Table 5), could be described as follows: annual precipita-tion, 259–1,787 mm; summer precipitation, 7–83 mm;annual Tmin, −9.1–1.1°C; summer Tmin, −0.1–10.5°C;winter Tmin, −17.1–4.9°C; annual Tmax, 2.7–16.6°C; sum-mer Tmax, 11.4–29.9°C; winter Tmax, −5.2–6.7°C; andJuly dewpoint temperatures, −6.3–4.2°C. These values gen-erally conform with estimates from other studies that usedPRISM or similar climate models, with notable exceptions.Annual precipitation in the GB fell mostly within thespecies-wide requirement of more than 300 mm (Hafner1994). Several sites, however, had less precipitation, as wasalso found in the wide-ranging study of Jeffress et al. (2013;low range = 231 mm, Craters of the Moon NationalMonument, ID). The GB sites had slightly higher max-imum values of annual precipitation than previouslyreported—for example, 1,407 mm in the southern RockyMountains (Erb, Ray, and Guralnick 2011)—but consider-ably less than the 3,084 mm estimated in the survey byJeffress et al. (2013). This result is unsurprising given thesemiaridity of the GB region relative to other pika environ-ments of the West.
Temperatures for extant GB sites weremostly within therange of, or warmer than, temperatures reported for pikasites outside the GB. Our July maximum temperatures(13.3–30.6°C) closely match those of Jeffress et al. (2013;13.5–29.8°C), while ourDecemberminimum temperatures(−16.8°C to −4.8°C) were warmer (−19.3°C to –4.1°C).Summer mean temperatures in the GB were similar tothe means and ranges of Jeffress et al. (2013). They hadwider ranges and thus lower mean values than low-eleva-tion, high-latitude sites in British Columbia (Henry, Henry,and Russello 2012), and much lower temperatures andwider ranges of temperature (but with similar warmextremes), as reported at the well-studied, low-elevationBodie site in California (Smith and Nagy 2015). Notably,summer maximum temperatures in the GB were warmerthan reported elsewhere, with an uppermean value of 28.2°C; 5–6°C warmer than those reported by Smith and Nagy
ARCTIC, ANTARCTIC, AND ALPINE RESEARCH e1436296-15

(2015) for the Bodie site. Compared to mean annual tem-peratures for a subset of pika sites in the western GB (1.5–6.9°C;Millar andWestfall 2010), the current basin-wide sethad a broader range of values (−2.4–8.5°C).
The newly compiled list of relict sites reveals a largenumber of extirpated and putatively extirpated (old)sites. Several caveats need to be mentioned: first is theunverified status of many of the records scored bysurveyors as old. Often these sites were intermingledwith and within the dispersal distance of extant sites;potentially some of these sites are transiently vacantpatches that might be recolonized. In other situations,rapid surveys might have missed signs of occurrence(i.e., false absence), as has been noted before (Jeffress,Van Gunst, and Millar 2017; Millar, Westfall, andDelany 2013; Smith, Nagy, and Millar 2016). Further,we have found that detection was consistently muchlower at lower elevation and/or marginal habitat, evenwhere pikas were present and abundant, making therapid-survey issue even more problematic (Smith,Nagy, and Millar 2016). Finally, old sign has onlyrecently been recorded as a survey variable, andthere were differences in survey effort by subregions.Those factors likely contribute to variability in thenumbers of sites reported as old and bias our sum-mary analyses.
Importantly,most of the old-site records are the result ofsingle-survey visits without repeat surveys, such as havebeen conducted by Beever and colleagues (2011, 2016)and Stewart and colleagues (Stewart et al. 2015; Stewartand Wright 2012); thus, extirpation cannot be accuratelydocumented. For instance, on repeat visits to several puta-tively extirpated sites in the westernGB, we have documen-ted subsequent occurrence (Millar, Westfall, and Delany2013). We urge more widespread use of repeat surveys andlong-term monitoring for old sites as well as extant sites inthe future, as well as studies to assess site-specific survivaland reproduction. Additionally, radiocarbon dating meth-ods can be used to clarify the age of old sites (e.g., Millaret al. 2014a; Stewart, Wright, and Heckman 2017).
Our findings suggest that although local climateappears to have a role in defining extirpated locations, itdoes not adequately explain the current state. Relict sitestend to be in lower, warmer, and drier parts of the climateenvelope of extant GB pika location, as prior studies haveshown (Beever, Brussard, and Berger 2003; Beever et al.2010; Stewart et al. 2015; Wilkening et al. 2011). Ourclimate profiles for relict sites were mostly within theenvelope of the extant sites, and although there are setsof climate variables that distinguish them, there is con-siderable overlap between the extant and relict climatespaces. Similar results have been found in northwestNevada (Jeffress, Van Gunst, and Millar 2017). Further,
in some cases extant sites were warmer, drier, or occurredat lower elevations than extirpated sites, even in the samesubregion or mountain range. Local differences amongmicrosites; microclimatic processes; quality of forage; size,quality and connectivity of taluses; and dispersal, amongother factors, may emerge as important predictive factorsas well (Castillo et al. 2016; Stewart and Wright 2012).Untangling these influences from regional climatic con-straints is a key area for future research.
Climate analyses in the current study relied onPRISM data, which are modeled as standard surface-airtemperature (1.5 m above ground surface; Daly, Neilson,and Phillips 1994). Millar, Westfall, and Delany (2014b,2016) documented that although surface-air tempera-tures correlate with talus surface temperatures, they cor-relate poorly with the thermal conditions within talusand should not be used to represent the conditions thatpikas routinely encounter within talus. With our climateanalyses and discussion, we do not mean to imply thatthese values are those encountered by pikas in all habitatcomponents. Rather, our analyses of surface-air tem-peratures allow comparison with prior studies thatused similar modeled climate values, and afford clarifi-cation of the range of local-to-regional temperatures andenvironments associated with pika locations. Whereextreme high values would seem to be unfavorablegiven the thermal physiology of pikas (as in sites withwarm summers or cold, dry winters), we suspect thatthermal conditions are mitigated by microclimates asso-ciated with talus landforms. Rocky landforms have ther-mal regimes shown to be decoupled from surface air,which results in cooler temperatures with low varianceduring warm summer days and warmer temperaturesunder snow in cold winters (Hall et al. 2016; Millar,Westfall, and Delany 2014b, 2016; Otto, Wilson, andBeever 2015; Rodhouse, Hovland, and Jeffress 2017;Smith, Nagy, and Millar 2016; Wilkening, Ray, andVarner 2015). These landforms also support vegetationin their forefields on which pikas depend for summerforage and winter caching (Millar et al. 2015). In thisway, talus environments can provide refuge from unfa-vorable daily and seasonal weather (Rodhouse, Hovland,and Jeffress 2017), and, over longer times, internal tem-peratures lag changes in free air (Gentili et al. 2015;Millar, Westfall, and Delany 2014b), providing potentialclimate refugia into the future (Morelli et al. 2016).
Implications for the status of pikas in the GreatBasin
The addition of a large number of extant pika sites, span-ning the northern three-quarters of the GB, changes ourunderstanding both of the current status of pikas and their
e1436296-16 C. I. MILLAR ET AL.
susceptibility to risk from a changing climate. Prior effortsto assess the vulnerability of pikas to climate have relied onprojections from models (e.g., Calkins et al. 2012;Galbreath, Hafner, and Zamudio 2009; Stewart et al.2015), statistical analyses of extirpated versus extant condi-tions, or assessments of populations along bioclimatic gra-dients (e.g., Beever et al. 2010, 2011; Erb, Ray, andGuralnick 2011; Jeffress et al. 2013). Models suffer com-pound uncertainties (Stephenson, Millar, and Cole 2010)that are especially significant for a small mammal such asthe pika. These include general uncertainties, as in estimat-ing future greenhouse gas emissions, regional downscalingprocesses, and ecological interactions, as well as difficultiesin scaling because of the highly restricted and decoupledhabitat components used by pikas (Millar, Westfall, andDelany 2016). In some studies, only a small number of siteswas available from which broad implications were pro-jected. Combined, these can create cumulative errors withmisleading end results. For instance, MaxEnt models thatattempted to map current distributions of pikas generateddistributions far fromwhere pikas have been known to exist(e.g., Calkins et al. 2012). Statistical models increasinglyinclude factors that pertain to specific ecological require-ments of pikas, although much remains unknown, such asthe conditions and constraints of the dispersal environ-ment, the importance of talus area and quality, and inter-talus isolation distance. Conclusions from such studies,including those we make here, increasingly highlight therole of dependence on context, as has been described pre-viously for pikas (Jeffress et al. 2013; Jeffress, Van Gunst,and Millar 2017).
Our description of a wide geographic distribution,encompassing a broad climate envelope within and acrosssubregions, adds new dimensions to understanding thetolerances of pikas in the ecoregion. The results under-score that pikas are not rare in the GB, and, given thegeographic breadth of locations, are likely better able totolerate climate variability than previously understood. Inaddition, the diversity of environments suggests lowerexposure to the impacts of climate change than previouslyreported. Although pikas are commonly described as analpine (the zone above tree line) species, we now under-stand that this characterization is incomplete. Prior stu-dies of low-elevation and marginal pika sites, as well asour current survey, demonstrate that pikas are found inthe GB in environments not described as alpine (Beeveret al. 2008; Jeffress, Van Gunst, and Millar 2017; Millarand Westfall 2010; Millar, Westfall, and Delany 2013;Smith 1974; Smith, Nagy, and Millar 2016). Nonalpinesites outside the region also have been documented (e.g.,Henry, Henry, and Russello 2012; Jeffress et al. 2013;Manning and Hagar 2011; Ray, Beever, and Rodhouse2016; Shinderman 2015; Simpson 2009). Pikas in the GB
are better described as wide-ranging across montanezones, albeit highly dependent on specific landformsthat lie within the species’ climate envelope. Occupiedsites extend from sage-steppe shrublands and woodlandcommunities, through montane forests, wet and drymontane meadows and shrublands, and subalpine forestzones, to diverse alpine communities.
Recognizing the wide range of pikas in the GBneither denies extirpation rates that have been docu-mented nor ignores the possibility of continuingdeclines. In fact, our analyses document a large num-ber and widespread occurrences of apparently recentpopulation extirpations across the GB, which antici-pate further changes in the range of environmentssupportive of American pikas. There is a need forfurther exploration at intensive scales in many por-tions of currently little surveyed parts of the GB toprovide more consistent assessment of the regionaldistribution of the species. Even with the currentlevels of survey, however, the broad range of pikas,and the capacity of the species to persist acrossdiverse bioclimatic environments and through signif-icant Holocene climate variations (Hafner 1993;Hafner and Sullivan 1995), suggest that a core ofstable populations exists across the GB. At the mar-gins of these core areas, on interior as well as exterioredges (Ray, Beever, and Rodhouse 2016; Stewart,Wright, and Heckman 2017), population fluxes haveoccurred in the past, are occurring at present, andare expected to occur in the future. While thesefluctuations may not portend bioregional extirpationof the species or losses of populations from subre-gions or major mountain ranges, they do point to theneed for greater exploration of nonclimate factors, aswell as continuing research on the relationship ofclimate to pika persistence. Finally, it must bestressed that the Great Basin composes only a smallportion of the species-wide distribution of pikas, is aregion where pikas are least represented, and iswhere the species has faced prehistoric climate chal-lenges (Grayson 2005). Our findings of the widedistribution and persistence of pikas even in thismarginal ecoregion suggest that at the species level,pikas may have greater resilience to environmentalchange than has been assumed.
Acknowledgments
We thank Don Grayson (University of Washington) andChrissy Howell (U.S. Forest Service) for critical reviewsof the draft manuscript, Harriet Smith for editorialreview, and Rob Klinger (USGS) and one anonymousreviewer for constructive comments on the submitted
ARCTIC, ANTARCTIC, AND ALPINE RESEARCH e1436296-17
manuscript. We thank Jessica Castillo Vardaro (PrincetonUniversity) for sharing details on her pika records, andall surveyors and agencies who contributed pika observa-tions to our databases, particularly Brad Bauman, MarkEnders, Christy Klinger, and Rory Lamp (all NDOW);Brian Maxfield, Anthony Wright, Keith Day, AdamBrewerton, and Theresa Pope (all UDWR); and EricRickart (Natural History Museum of Utah).
References
Bailey, R. G. 1980. Ecoregions of the United States.Miscellaneous Publication No. 1391. Washington, DC:USDA Forest Service.
Beever, E. A., P. F. Brussard, and J. Berger. 2003. Patterns ofapparent extirpation among isolated populations of pikas(Ochotona princeps) in the Great Basin. Journal ofMammalogy 84:37–54.
Beever, E. A., J. D. Perrine, T. Rickman, M. Flores, J. P. Clark,C. Waters, S. S. Weber, B. Yardley, D. Thoma, T. Chesley-Preston, et al. 2016. Pika (Ochotona princeps) losses fromtwo isolated regions reflect temperature and water balance,but reflect habitat area in a mainland region. Journal ofMammalogy 97:1495–511.
Beever, E. A., C. Ray, P. W. Mote, and J. L. Wilkening. 2010.Testing alternative models of climate-mediated extirpa-tions. Ecological Applications 20:164–78.
Beever, E. A., C. Ray, J. L. Wilkening, P. F. Brussard, and P.W. Mote. 2011. Contemporary climate change alters thepace and drivers of extinction. Global Change Biology17:2054–70.
Beever, E. A., J. L.Wilkening, D. E. McIvor, S. S.Weber, and P. F.Brussard. 2008. American pikas (Ochotona princeps) in north-western Nevada: A newly discovered population at a low-elevation site.Western North American Naturalist 68:8–14.
Brown, J. H. 1971. Mammals on mountaintops:Nonequilibrium insular biogeography. The AmericanNaturalist 105:467–78.
Calkins, M. T., E. A. Beever, K. G. Boykin, J. K. Frey, and M.C. Anderson. 2012. Not-so-splendid isolation: Modelingclimate-mediated range collapse of a montane mammalOchotona princeps across numerous ecoregions.Ecography 35:780–91.
Castillo, J. A., C. W. Clinton, M. R. Jeffress, C. Ray, T. J.Rodhouse, and D. Schwalm. 2016. Replicated landscapegenetic and network analyses reveal wide variation infunctional connectivity for American pikas. EcologicalApplications 26:1660–76.
Collins, G. H., and B. T. Bauman. 2012. Distribution oflow-elevation American pika populations in the north-ern Great Basin. Journal of Fish and WildlifeManagement 3:311–18.
Daly, C. R., R. P. Neilson, and D. L. Phillips. 1994. A statis-tical-topographic model for mapping climatological preci-pitation over mountainous terrain. Journal of AppliedMeteorology 33:140–58.
Erb, L. P., C. Ray, and R. Guralnick. 2011. On the generalityof a climate-mediated shift in the distribution of theAmerican pika (Ochotona princeps). Ecology 92:1730–35.
ESRI. 2015. ArcGIS 10.3.1 for Desktop. Redlands, CA:Environmental Systems Research Institute.
Galbreath, K. E., D. J. Hafner, and K. R. Zamudio. 2009.When cold is better: Climate-driven elevation shifts yieldcomplex patterns of diversification and demography in analpine specialist (American pika, Ochotona princeps).Evolution 63:2848–63.
Gentili, R., C. Baroni, M. Caccianiga, S. Srmiraglio, A. Ghiani,and S. Citerios. 2015. Potential warm-stage microrefugia foralpine plants: Feedback between geomorphological and bio-logical processes. Ecological Complexity 21:87–99.
Grayson, D. 2005. A brief history of Great Basin pikas.Journal of Biogeography 32:2103–11.
Hafner, D. J. 1993. North American pika (Ochotona princeps)as a late Quaternary biogeographic indicator species.Quaternary Research 39:373–80.
Hafner, D. J. 1994. Pikas and permafrost: Post-Wisconsinhistorical zoogeography of Ochotona in the southernRocky Mountains, USA. Arctic and Alpine Research26:375–82.
Hafner, D. J., and A. T. Smith. 2010. Revision of the subspeciesof American pika, Ochotona princeps (Lagomorpha:Ochotonidae). Journal of Mammalogy 91:401–17.
Hafner, D. J., and R. M. Sullivan. 1995. Historical and ecolo-gical biogeography of Nearctic pikas (Lagomorpha:Ochotonidae). Journal of Mammalogy 76:302–21.
Hall, L. E., A. D. Chalfoun, E. A. Beever, and A. E. Loosen.2016. Microrefuges and the occurrence of thermal specia-lists: Implications for wildlife persistence amidst changingtemperatures. Climate Change Responses 3:8.
Henry, P., A. Henry, and M. A. Russello. 2012. Variationin habitat characteristics of American pikas along anelevation gradient at their northern margin. NorthwestScience 86:346–50.
Jeffress, M. R., T. J. Rodhouse, C. Ray, S. Wolff, and C. W.Epps. 2013. The idiosyncrasies of place: Geographic varia-tion in the climate-distribution relationships of theAmerican pika. Ecological Applications 23:864–78.
Jeffress, M. R., K. J. Van Gunst, and C. I. Millar. 2017. Asurprising discovery of American pika sites in the northwestGreat Basin. Western North American Naturalist 77:252–68.
Manning, T., and J. C. Hagar. 2011. Use of nonalpine anthro-pogenic habitats by American pikas (Ochotona princeps) inwestern Oregon. Western North American Naturalist71:106–12.
Massing, C. P., 2012: American pika (Ochotona princeps):Persistence and activity patterns in a changing climate. M.S.thesis, Department of Biological Sciences, CaliforniaPolytechnic University, San Luis Obispo, California.
Millar, C. I., K. Heckman, C. Swanston, K. Schmidt, R. D.Westfall, and D. L. Delany. 2014a. Radiocarbon dating ofAmerican pika fecal pellets provides insights into popula-tion extirpations and climate refugia. EcologicalApplications 24:1748–68.
Millar, C. I., and R. D. Westfall. 2010. Distribution andclimatic relationships of the American pika (Ochotonaprinceps) in the Sierra Nevada and western Great Basin,U.S.A.: Periglacial landforms as refugia in warming cli-mates. Arctic, Antarctic, and Alpine Research 42:76–88.
Millar, C. I., R. D. Westfall, and D. L. Delany. 2013. Newrecords of marginal locations for American pika (Ochotona
e1436296-18 C. I. MILLAR ET AL.

princeps) in the western Great Basin. Western NorthAmerican Naturalist 73:457–76.
Millar, C. I., R. D. Westfall, and D. L. Delany. 2014b. Thermalregimes and snowpack relations of periglacial talus slopes,Sierra Nevada, California, USA. Arctic, Antarctic, andAlpine Research 46:191–212.
Millar, C. I., R. D. Westfall, and D. L. Delany. 2016. Thermalcomponents of American pika habitat: How does a smalllagomorph encounter climate? Arctic, Antarctic, andAlpine Research 48:327–43.
Millar, C. I., R. D. Westfall, A. Evenden, J. G. Holmquist, J.Schmidt-Gengenbach, R. S. Franklin, J. Nachlinger, and D.L. Delany. 2015. Potential climatic refugia in semi-arid, tem-perate mountains: Plant and arthropod assemblages asso-ciated with rock glaciers, talus slopes, and their forefieldwetlands, Sierra Nevada, California, USA. QuaternaryInternational 387:106–21.
Morelli, T. L., C. Daly, S. A. Dobrowski, D. M. Dulen, J. L.Ebersole, S. T. Jackson, J. D. Lundquist, C. I. Millar, S. P.Maher, W. B. Monahan, et al. 2016. Managing climatechange refugia for climate adaptation. PLoS One 8:e0159909.
Otto, H. W., J. A. Wilson, and E. A. Beever. 2015. Facing achanging world: Thermal physiology of American pikas(Ochotona princeps). Western North American Naturalist75:429–45.
Ray, C., E. A. Beever, and T. J. Rodhouse. 2016. Distributionof a climate-sensitive species at an interior range margin.Ecosphere 7:e01379.
Rodhouse, T. J., M. Hovland, and M. R. Jeffress. 2017.Variation in subsurface thermal characteristics of micro-refuges used by range core and peripheral populations ofthe American pika (Ochotona princeps). Ecology andEvolution 7:1514–26.
SAS Institute. 2015. JMP® 12.2. Cary, NC: SAS Institute Inc.Shinderman, M. 2015. American pika in a low-elevation lava
landscape: Expanding the known distribution of a tempera-ture-sensitive species. Ecology and Evolution 5:3666–76.
Simpson, W. G. 2009. American pikas inhabit low-eleva-tion sites outside the species’ previously described bio-climatic envelope. Western North American Naturalist69:243–50.
Smith, A. T. 1974. The distribution and dispersal of pikas:Influences of behavior and climate. Ecology 55:1368–76.
Smith, A. T., and M. E. Gilpin. 1997. Spatially correlateddynamics in a pika metapopulation. In Metapopulationdynamics: Ecology, genetics and evolution, ed. I. A.Hanski and M. E. Gilpin, 407–28. San Diego, CA:Academic Press.
Smith, A. T., and J. D. Nagy. 2015. Population resilience in anAmerican pika (Ochotona princeps) metapopulation.Journal of Mammalogy 96:394–404.
Smith, A. T., J. D. Nagy, and C. I. Millar. 2016. Behavioralecology of American pikas (Ochotona princeps) at MonoCraters, California: Living on the edge. Western NorthAmerican Naturalist 76:459–84.
Smith, A. T., and M. L. Weston. 1990. Ochotona princeps.Mammalian Species 352:1–8.
Stephenson, N. L., C. I. Millar, and D. N. Cole. 2010. Shiftingenvironmental foundations: The unprecedented andunpredictable future. In Beyond naturalness: Rethinkingpark and wilderness stewardship in an era of rapid change,ed. D. N. Cole and L. Yung, 50–66. Washington, DC:Island Press.
Stewart, J. A. E., J. D. Perrine, L. B. Nichols, J. H. Thorne, C.I. Millar, K. E. Goehring, C. P. Massing, D. H. Wright,and B. Riddle. 2015. Revisiting the past to foretell thefuture: Summer temperature and habitat area predict pikaextirpations in California. Journal of Biogeography42:880–90.
Stewart, J. A. E., and D. H. Wright. 2012. Assessing persis-tence of the American pika at historic localities inCalifornia’s northern Sierra Nevada. Wildlife SocietyBulletin 36:759–64.
Stewart, J. A. E., D. H. Wright, and K. A. Heckman. 2017.Apparent climate-mediated loss and fragmentation of corehabitat of the American pika in the Northern SierraNevada, California, USA. PLoS ONE 12:e0181834.
Wilkening, J. L., C. Ray, E. A. Beever, and P. F. Brussard.2011. Modeling contemporary range retraction in GreatBasin pikas (Ochotona princeps) using data on microcli-mate and microhabitat. Quaternary International235:77–88.
Wilkening, J. L., C. Ray, and J. Varner. 2015. Relating sub-surface ice features to physiological stress in a climatesensitive mammal, the American pika (Ochotona princeps).PloS ONE 10:e0119327.
ARCTIC, ANTARCTIC, AND ALPINE RESEARCH e1436296-19