dissimilarity between living and dead benthic
TRANSCRIPT

RESEARCH ARTICLE
Dissimilarity between living and dead benthic
foraminiferal assemblages in the Aveiro
Continental Shelf (Portugal)
Maria Virgınia Alves MartinsID1,2☯*, Johann Hohenegger3☯, Fabrizio Frontalini4☯, João
Manuel Alveirinho Dias5‡, Mauro Cesar Geraldes1‡, Fernando RochaID2‡
1 Departamento de Estratigrafia e Paleontologia, Faculdade de Geologia, Universidade do Estado do Rio de
Janeiro, Rio de Janeiro, Brazil, 2 Departamento Geociências, GeoBioTec, Universidade de Aveiro, Aveiro,
Portugal, 3 Institut fur Palaontologie, Universitat Wien, Wien, Austria, 4 Dipartimento di Scienze Pure e
Applicate (DiSPeA), Università degli Studi di Urbino "Carlo Bo", Urbino, Italy, 5 CIMA, Centro de Investigacão
Marinha e Ambiental, Universidade do Algarve, Campus de Gambelas, Faro, Portugal
☯ These authors contributed equally to this work.
‡ These authors also contributed equally to this work.
Abstract
This study compares living (LA) and dead (DA) benthic foraminiferal assemblages and iden-
tifies different factors that possibly cause differences in the distribution of both assemblages
in the Aveiro Continental Shelf (Portugal). A total of 44 sediment samples was collected dur-
ing summers of 1994 and 1995 along transects (east-west direction) and between 10 and
200 m water depth. Complex statistical analyses allow us to compare the abundance and
composition of the LAs and DAs in function of depth, grain-size and total organic matter in
all studied stations even in those where the numbers of individuals were rare in one or both
assemblages. The highest densities and diversities of the LAs are found in the middle conti-
nental shelf on gravel deposits (coarse and very coarse sands) mostly due to the substrate
stability, reduced deposition of fine sedimentary particles, availability of organic matter with
high quality related to oceanic primary productivity likely induced by upwelling events, and
oxygenated porewaters conditions. The DAs have, in general, higher densities and diversi-
ties than the LAs. In the outer continental shelf, the dissimilarity between both assemblages
is higher due to the accumulation of tests, low dilution by sedimentary particles and scarcity
of living foraminifera. Based on the comparison of LAs and DAs and considering the charac-
teristics of the study area and the species ecology, it has been possible to understand the
cause of temporal deviation between the LAs and DAs of benthic foraminifera. This devia-
tion is much more pronounced in the inner shelf where the energy of the waves and the cur-
rents induce very dynamic sedimentary processes preventing the development of large LAs
and the preservation of DAs. Some deviation also occurs in the middle shelf due to the sea-
sonal loss of empty tests. The most well-preserved time-averaged DAs were found in the
outer continental shelf.
PLOS ONE | https://doi.org/10.1371/journal.pone.0209066 January 30, 2019 1 / 47
a1111111111
a1111111111
a1111111111
a1111111111
a1111111111
OPEN ACCESS
Citation: Alves Martins MV, Hohenegger J,
Frontalini F, Dias JMA, Geraldes MC, Rocha F
(2019) Dissimilarity between living and dead
benthic foraminiferal assemblages in the Aveiro
Continental Shelf (Portugal). PLoS ONE 14(1):
e0209066. https://doi.org/10.1371/journal.
pone.0209066
Editor: Tzen-Yuh Chiang, National Cheng Kung
University, TAIWAN
Received: January 11, 2018
Accepted: November 29, 2018
Published: January 30, 2019
Copyright: © 2019 Alves Martins et al. This is an
open access article distributed under the terms of
the Creative Commons Attribution License, which
permits unrestricted use, distribution, and
reproduction in any medium, provided the original
author and source are credited.
Data Availability Statement: All relevant data are
within the manuscript and its Supporting
Information files.
Funding: This study was funded by the
Universidade de Aveiro and by Fundacão para a
Ciência e a Tecnologia (FCT, Portugal) through the
strategic project UID/GEO/04035/2013. The first
author received a research grant (reference
number: 301588/2016-3) of Conselho Nacional de

Introduction
The evaluation of environmental quality represents a priority, particularly in coastal and tran-
sitional marine settings where most of the anthropogenic activities are placed. Since historical
time, human activities have modified and continuously affected these areas though their inten-
sity has grown over the last centuries. The definition of baseline environmental conditions or
the identification of pristine areas represent, therefore, a key to understand the effect of
human activities [1]. Since fully pristine-undisturbed areas with similar environmental fea-
tures to our target are difficult to find if existed [2], the investigation of the sedimentary record
for defining baseline conditions represents a good alternative. Unfortunately, the comparison
of dead assemblages (DAs) along the sedimentary records to the living counterpart (LAs) is
not so straightforward as taphonomic processes including, for instance, differential transporta-
tion, destruction, and other postmortem process, occur [3]. Moreover, the mismatches
between LAs and DAs assemblages are not only determined by natural process but also
induced by anthropogenic impacts that further hinder the definition of reliable baseline condi-
tions [1,3]. A lower level of fidelity between living-dead molluscan assemblages was, for
instance, documented in areas with enhanced anthropogenic eutrophication [1,3]. or in nar-
row shelves [3] as new compositional states present in LAs are not yet captured by DAs. Under
these circumstances, the development of new methodologies, the test of their applicability, the
estimation of the discordance of LAs vs. DAs and the bias drivers are important milestone in
both a paleontological and an actuopaleontological perspective. Specifically, the deviation of
LAs-DAs might also represent a useful tool by which identifying the source of biases such as
the environmental degradation and identifying areas suitable for paleoenvironmental and
paleoecological reconstructions in both deep and recent time. This actualistic approach has
been applied in transitional environments like estuaries and lagoons as well as more open shelf
setting and based on mollusk, ostracods, scallop and benthic foraminifera [1–6]. Although the
LAs are widely used to determine the small-scale variations, the DAs might also represent an
important source of biological information such as the inventory of rare species and the esti-
mation of anthropogenically shifted baselines [7].
Benthic foraminifera, single-celled organisms, are widely used as bioindicators in environ-
mental biomonitoring in both oceanic [8–10] and in coastal transitional environments [11–
18]. Unfortunately, only few investigations have been aimed to compare the living (LAs) and
dead (DAs) benthic foraminiferal assemblages [5,6,19–22]. As LAs are more directly related to
ecological and environmental conditions at the time of sampling [23], their use has been
included in the FOBIMO protocol as mandatory recommendation [24].
This work aims to compare both DAs and LAs in terms of abundance, diversity and com-
position and in relation to depth, grain-size and Total Organic Matter (TOM) on the western
Portuguese Continental Shelf (PCS), specifically in the Aveiro Continental Shelf (ACS) by
using a set of statistical methods even where the density of specimens was scarce in one or
both assemblages. It also seeks to understand the causes of the observed deviation between
LAs and DAs of benthic foraminifera.
Study area
The study area is located in the northern sector of the PCS between Espinho and Cabo Mon-
dego (Fig 1). It is included in the North Atlantic Province, characterized by annual average
temperatures of about 15˚C [25]. The meteorological conditions of the Portuguese coast are
influenced by the high-pressure system of the Azores and, to a lesser extent, by the low-pres-
sure center of Iceland [26]. The displacement of these two masses of air produces dry and sta-
ble weather in summer and rainy and unstable weather in winter [26]. In this region, the wind
Living and dead foraminiferal assemblages at the Aveiro Continental Shelf (Portugal)
PLOS ONE | https://doi.org/10.1371/journal.pone.0209066 January 30, 2019 2 / 47
Desenvolvimento Cientıfico e Tecnologico, CnPQ,
Brazil.
Competing interests: The authors have declared
that no competing interests exist.

regime is characterized by the predominance of the NW and N winds direction. The S and SW
winds are less frequent but have higher speeds. The most intense winds mainly occur from
October to May, with the strongest winds (>50 km/h) in December and February [27]. The
northern winds, of moderate intensity, occur mainly in summer and are generated by the
Fig 1. A. Study area (rectangle). B. Location of sample sites in transects with different colors offshore the Ria de Aveiro lagoon mouth. Legend: P. Cartola—Pontal
da Cartola; P. Galega–Pontal da Galega; Fur–Furadouro; VR—Vouga River (adapted from Martins et al. [58]).
https://doi.org/10.1371/journal.pone.0209066.g001
Living and dead foraminiferal assemblages at the Aveiro Continental Shelf (Portugal)
PLOS ONE | https://doi.org/10.1371/journal.pone.0209066 January 30, 2019 3 / 47

Azores anticyclone and thermal depression in the Iberian Peninsula during this season. In
winter, the wind regime presents greater variability in direction and intensity [26].
These meteorological conditions influence the oceanographic regime as well as the struc-
ture of the water masses on the continental shelf [28]. A superficial oceanic layer is distin-
guished. It comprises the layer of superficial mixture and the seasonal thermocline of variable
thickness throughout the year due to the seasonality of the atmosphere-ocean fluxes (heating /
cooling, mixture induced by the wind, precipitation /evaporation) and rivers’ flows [29]. Near
the study area, at 40˚N and 12˚W, this layer may reach about 200 m depth [29]. The Eastern
North Atlantic Central Water is placed below this thin superficial layer and is characterized by
temperature and salinity values decreasing with depth [28]. It is constituted by two layers of
different origins. A southern one, of subtropical origin, with higher temperature and salinity,
is formed during winter along the Azores Front at the latitude of about 34˚N-35˚N [29]. The
northern one of subpolar origin near 50˚N with lower temperature and salinity, is formed by
deep winter convection [29]. The surface circulation is predominantly northward off the Ibe-
rian Peninsula during autumn and winter [30–33]. As a result of the Azores Anticyclone
migrating to the north and the weakening of the Icelandic Low-Pressure Nucleus in spring
and summer, a prevailing regime of N and NW winds (northerly regime) is established that
are favorable to upwelling [26,34]. This phenomenon constitutes one of the main processes
that determine the oceanographic characteristics of the Portuguese coastal waters during sum-
mer [26]. Associated with the summer regime, the circulation pattern is characterized on the
continental shelf by a surface runoff to the south, with the counter current to the north persist-
ing on the continental break. During upwelling events, there is a flow in the first 30 m that is
compensated at the deepest levels by a movement towards the coast [35–37]. The waters
emerging on the continental shelf are from 120–150 m depth [35–37] and correspond to the
subtropical branch of the Eastern North Atlantic Central Water, being colder, less saline and
more nutrient enriched [26]. At an early stage, coastal upwelling develops as a thin band of
cold waters along the coast [36]. Structures joining in stranded filaments (30 to 40 km wide
and over 250 km long) and transported materials to the deep ocean begin to emerge with the
persistence of N winds [38].
The morphology of the Portuguese continental margin has been studied by several
researchers [39–43]. The ACS is formed by a flattened surface corresponding to a monoclinal
with gentle slope to the West constituted by Cretaceous and Cenozoic formations. The monot-
ony of the continental shelf is raised along the Furadouro by Cretaceous carbonate formations
(Pontal da Galega and Pontal da Cartola), and in front of Mira by the Morraceiros relief,
formed by Mesozoic and Cenozoic carbonate rocks (Fig 1) [40].
According to Dias et al. [44], the first reference to the sedimentary coverture of the conti-
nental shelf between Espinho and Cabo Mondego is found in the Lithological Submarine
Chart published in 1914 (“Carta Litologica Submarina da Costa de Portugal de Leixões ao
Cabo Mondego n˚ 2”). In the 1980s, several sedimentological studies [44–49] allowed to deter-
mine the unconsolidated sediments on the continental shelf between Nazare and Minho River.
Based on denser sampling, some works [50–53] enabled a more detailed identification and
characterization of the sedimentary deposits in the study area. The sediment distribution and
characteristics together with the knowledge on the processes that affect the depository of the
PCS [49] were used to interpret the sedimentary dynamics of the region. These studies showed
that sediments in the PCS between Espinho and Cabo Mondego are essentially sandy denoting
energy levels that hinder the accumulation of fine sediments [50–56]. Indeed, the silt-clay frac-
tion (<63 μm) generally increases from 80 m bathymetric to deeper areas that are hydrody-
namically quieter environments [53]. Terrigenous particles predominate in the sandy fraction
at the inner and mid continental shelf, where they reach percentages >90%, being quartz the
Living and dead foraminiferal assemblages at the Aveiro Continental Shelf (Portugal)
PLOS ONE | https://doi.org/10.1371/journal.pone.0209066 January 30, 2019 4 / 47

most abundant component [49]. The biogenic component, formed essentially by mollusks and
foraminiferal tests, becomes dominant below 100 m depth [49–53]. The authigenic compo-
nent, represented by glauconite, occurs mainly on the outer continental shelf, the shelf break
and on the upper continental slope [49–53]. Fine and medium sands occur along the Aveiro
Canyon, on the continental shelf break and on the upper continental slope, while very fine
sands predominate in the northern and southern sectors of the slope [49–51]. The coarse-
grained particles (>2 mm), correlated with the paleo-mouth of the Vouga River and with
paleo-coastlines, are arranged in two strips. The first one, roughly parallel to the present shore-
line, is wider and well defined, located on the mid continental shelf (80–90 m), where gravel is
sometimes the dominant textural class (> 50%). The second one is poorly defined, located on
the outer continental shelf, where the percentage of gravel rarely exceed 25% [49–53]. The
shallower gravelly strip is essentially composed by terrigenous particles consisting predomi-
nantly of quartz [49–53]. The gravel strip on the outer shelf is predominantly biogenic and
comprises a relatively high amount of mollusks’ shells (fragmented, corroded and greyish) and
foraminiferal tests (powered, greyish and sometimes glauconitized) [49–53].
Only a limited number of benthic foraminiferal studies has been carried out on the central
western PCS (e.g. [54–57] The ACS has been previously studied by [53,58]. In particular, Mar-
tins et al. [58] analyzed the LAS in the ACS (Portugal; Fig 1).
Material and methods
Sampling, preparation and investigation
This study was developed under the Oceanographic Cooperation Agreement between Portugal
and France (JNICT/ French Embassy, CNRS-INSU, CIRMAT), and the authorization of
Administracão do Porto de Aveiro (APA; Administration of the Aveiro Port) that gave the per-
mission to collect bottom sediment samples from the NW Portuguese Continental Shelf off
Aveiro (Portugal). No additional specific permissions were required for this work, which also
does not involve endangered or protected species or vertebrates.
This study analyses data acquired in 44 sediment samples from NW Portuguese Continen-
tal Shelf off Aveiro (Portugal) at latitudes 40˚30’ N to 40˚50’ N and longitudes 8˚46’ W to 9˚20’
W, between 10 and 200 m depth (Fig 1). Samples were collected with a Reineck box corer,
equipped with a stainless steel 172 x 85 mm box. Twenty-three sampling sites were located
along 3 parallel transects (A1 to A3) in front of the Ria de Aveiro lagoon mouth from 10 to 51
m water deep (Fig 1; S1 Table). The 5 sites of transect B1 extends the depth distributions of the
A-transects down to 95 m, while transects B2 (7 sites) and B3 (5 sites) range from 14 m to 190
m. The northernmost transect B4 (4 sites) cover a depth between 16 m and 68 m (Fig 1). A-
transects were sampled 21 July and 2 August 1994 and B-transects between 28 July and 3
August, 1995, on board the oceanographic vessel “NO Cote d’Aquitaine” (CNRS—CIRMAT)
of French nationality.
PVC tubes, 5 cm in diameter and 30 cm high, were pushed into the sediment collected at
each station to sub-sample the first centimeter of surface sediments for granulometry, total
organic matter content (TOM) and benthic foraminifera. For foraminiferal study, a volume of
10 cm3 of the first centimeter of surface sediment were immediately fixed with 4% formalde-
hyde in sea water (neutralized with sodium bicarbonate) and stained with rose Bengal (2 g/l)
for staining living foraminifera [58].
Sediments for grain size analysis were dried in the oven at 50˚C. The organic matter was
removed from the sediments with hydrogen peroxide (H2O2) and carbonate minerals were
dissolved using an ammonium acetate–acetic acid prior to grain-size analysis. For granulo-
metric separation, about 250 g of dry sandy sediment and about 150 g of dry muddy sediment
Living and dead foraminiferal assemblages at the Aveiro Continental Shelf (Portugal)
PLOS ONE | https://doi.org/10.1371/journal.pone.0209066 January 30, 2019 5 / 47

was weighted. The sediment fraction <63 μm was separated from the coarser one by wet siev-
ing through a 63 μm mesh sieve. Both separated sedimentary fractions (>63 μm and <63 μm)
were dried and weighted. Sedimentary fractions >63 μm were sieved using a column of sieves
(125 μm, 250 μm, 500 μm, 1000 μm, 2000 μm) placed on a shaker for 15 min. The percentage
of each fraction was determined based on the weight of each sediment fraction. Sediment
mean grain size (SMGS) was evaluated according to [59].
The sediment for TOM analysis, stored at -20˚C, was dehydrated in an oven at 100˚C for
about 24 hours [60]. The dry sediment was grinded in a mortar and homogenized. In cali-
brated crucibles (by exposure in a muffle at 450˚C for 5 hours and cooled in a desiccator for 30
minutes), 1 g of the sediment of each sample was added. After weighing, the crucible and the
sediment were placed in a muffle at 450˚C for 5 h [60]. The crucibles and the sediment, taken
from the muffle, cooled for 30 minutes in a desiccator, and weighed again. The weighing was
carried out quickly to avoid significant variations due to humidity absorption. The TOM con-
tent was estimated by weight loss after the incineration and was expressed as percentage of dry
weight of the sample.
For foraminiferal study, each sample was washed with water through sieves of 63 μm and
1000 μm to remove the formaldehyde, excess dye, fines and coarse sedimentary particles. Liv-
ing and dead foraminifera, in the sediment fraction 63–1000 μm, were fully picked with a Pas-
teur pipette under a Zeiss binocular microscope, model Stemi SVII with a maximum
magnification power of 264 times. The specimens were stored in foraminiferal microslides,
identified and counted.
Statistical methods
Species densities (standing crops) of LAs and DAs are based on 10 cm3 sediment. Similarities
in composition between LAs and DAs were measured for sample j using the Cosine [61]
between species i, because being an angular measure it becomes independent from differing
sample densities that are represented as vector lengths.
cosliving dead;j ¼Pk
i¼1ðni living=
Pki¼1n2
i livingÞ � ðni dead=Pk
i¼1n2
i deadÞ ð1Þ
Differences in ranking of species between both assemblages in sample j were determined by
Spearman’s rank distances d averaged by species number k and tested for significance using
Spearman’s Rank Correlation Coefficient [62].
d2
j ¼ 1=kj �Pkj
i¼1ðranki living � ranki deadÞ2
ð2Þ
Accepting the H0-hypothesis of non-correlation confirms the grade of disorder in rankings
between LAs and DAs. Moreover, all negative correlations corroborate the disorder in rank-
ings, particularly when negative correlations are significant [21].
While the Cosine measures similarities in accordance (cos2j ¼ % accordancej), the rank dis-
tance as a correlation measured with negative values shows the intensity of disorder in rank-
ings, thus representing a measure for differences between LAs and DAs.
Alpha diversities [63–64] of LAs and DAs at a sampling site were calculated using the
Chao1-Index [65]
SChao 1 ¼ Sobserved þ f1ðf1 � 1Þ=2ðf2 þ 1Þ ð3Þ
for measuring species richness (S), where f1 characterizes the number of species represented by
a single specimen and f2 the number of species with two specimens. For heterogeneities, the
Evenness measure developed by Buzas and Gibson [66] based on the Shannon Entropy (H)
Living and dead foraminiferal assemblages at the Aveiro Continental Shelf (Portugal)
PLOS ONE | https://doi.org/10.1371/journal.pone.0209066 January 30, 2019 6 / 47

was used
H0 ¼ eH=Sobserved ð4Þ
Combinations of indices for densities, similarities and diversities enlighten the relationships
between LAs and DAs [21]. Diversity diagrams show species richness for sample j standardized
over the complete data set (all LAs and DAs under investigation) on the x-axis
x�j living;dead ¼ ðxj living;dead � �xtotalÞ=sx total ð5Þ
and the corresponding standardized heterogeneities on the y-axis
y�j living;dead ¼ ðyj living;dead � �ytotalÞ=sy total ð6Þ
In the above-mentioned coordinate system starting from the LAs, the vector between both
standardized diversity measures (species richness and heterogeneity) demonstrates intensities
of relations between LAs and DAs. It is determined for sample j by
Lengthj living dead ¼ffiffiffiffiffiffiffiffiffiffiffiffiffiffiffiffiffiffiffiffiffiffiffiffiffiffiffiffiffiffiffiffiffiffiffiffiffiffiffiffiffiffiffiffiffiffiffiffiffiffiffiffiffiffiffiffiffiffiffiffiffiffiffiffiffiffiffiffiffiffi
ðx�j living � x�j deadÞ2þ ðy�j living � y�j deadÞ
2
q
ð7Þ
and
Anglej living dead ¼ arctan½ðy�j living � y�
j deadÞ=ðx�
j living � x�
kj deadÞ� ð8Þ
measured in radians [21].
The grade of integration of living individuals into the DAs is measured by the ‘Incorpo-
ration Value’, which weighs the proportion of living individuals and total assemblages by simi-
larities between both assemblages, characterizing the jth sample by
IncorpValj ¼ Similarityj living dead � densityj living=ðdensityj dead þ densityj livingÞ � 200 ð9Þ
where every similarity index varying between 0 (completely dissimilar) and 1 (completely simi-
lar or identical) can be used. This value normally ranges between 0 and 100, but can exceed the
upper limit when the density of living individuals is higher than of dead individuals.
Second, similarities in composition can be related to the lengths of the standardized vectors
by
SimDiversj living dead ¼ Similarityj living dead=ðLengthj living dead þ 0:01Þ � 100 ð10Þ
according to [21].
Comparing sites or groups of sites by diversities is named beta diversity [63]. Several
approaches have been developed, the one concentrating on presence/absence data (incidence
based), the other (abundance based) include frequencies [67]. Along transects, beta diversities
can be calculated between pairs of succeeding sample sites. We calculated one index using inci-
dence-based data. Species turnover between samples following Tuomisto [68] can be reduced
in pairwise comparisons to
bT ¼ ðS1 � cÞ þ ðS2 � cÞ ð11Þ
with S1 = number of species in sample 1, S2 = number of species in sample 2 and c = number
of common species.
Using abundance-based data, we calculated the Hill numbers 0D and 1D for diversities
derived from the general diversity measure
qD ¼ ðPS
i¼1p2
i Þ1=ð1� qÞ
ð12Þ
Living and dead foraminiferal assemblages at the Aveiro Continental Shelf (Portugal)
PLOS ONE | https://doi.org/10.1371/journal.pone.0209066 January 30, 2019 7 / 47

introduced by Hill [69]. The parameter D determines the number of dominant species
decreasing with increasing constant q. When q = 0, D represents the total number of species in
samples because of equal weighting. With increasing q, the number of dominant species
decreases leading to a similarity profile with q-values at the abscissa [67]. According to Jost
et al. [67] the limit of Eq 12 for q = 1 is the exponent of the Shannon entropy (H).
Beta diversity [70] comparing successive sample sites is defined by
qDb ¼qDg=
qDa ð13Þ
As the Hill number 0D represents the species number in alpha-diversities, 0D equals in pair-
wise comparison (beta-diversities) the species turnover of Eq 12. Because 1D equals the expo-
nent of the Shannon entropy [67]. Beta diversity reduces to exp Hγ −exp Hα.
As all sample sites are located along transects, frequency histograms based on unequal
depth intervals (0–20 m, 20–40 m, 40–60 m, 60–100 m, 100–150 m and 150–200 m) were
calculated for the most abundant species (>100 specimens). Disparity of intervals is
caused by the intense scatter of sites in shallower regions and rareness of sites in deeper
regions (Fig 1). Interval averages were used to estimate mean frequencies of species for
the whole transect. Based on mean densities in the above intervals, a set of k normal distri-
butions
f ðxÞi ¼Pk¼m
k¼1dik � exp �
�x2ik
2s2ik
� �
ð14Þ
where i indicates the species and x the depth, were used to fit the empirical distributions.
Distribution ranges of living and dead foraminifera within a species could be calculated
using the lower and upper 0.5 and 99.5 percentiles of the complete set of normal distribu-
tions. Mean density �d of the ith species weighted by the standard deviation was calculated
using:
�di ¼Pk¼m
k¼1½ðd2
iksikÞ=Pk¼m
k¼1diksik� ð15Þ
Percentages of living foraminifera on dead specimens were calculated based on the theo-
retical frequency distributions in the interval between 0 m and 200 m.
Results
Depth, grain size and total organic matter
The environmental factors (S1 Table), namely water depth (10–190 m), SMGS (108–1840 μm)
and TOM (0.20–4.21%) were inter-correlated to evidence their influence on LAs and DAs (S2
Table) in the dependence of each other (Fig 2; S3 Table). The SMGS correlates significantly [p(H0) = 7.82E-10] with water depth using the 4th order power function (Fig 2). Starting from 10
m to 30 m with ‘fine and medium sand’, SMGS tops with ‘very coarse sand’ between 40 m and
80 m, then decreases to ‘medium and fine sand’ from 140 m to the deepest sites of the area (Fig
2). Percentages of TOM also correlate significantly [p(H0) = 3.13E-13] with water depth using
a 3rd order power function (Fig 2). Starting with 1.5% in nearshore stations, minimum values
(~0.5%) of TOM are found between 30 m and 60 m. Percentages of TOM increase with depth
and reach maximum values of ~3% between 150 m and 200 m (Fig 2). Percentages of TOM do
not correlate with SMGS (Fig 2) neither in linear regression [p(H0) = 0.238] nor in 6th order
power regression [p(H0) = 0.054]. Due to the non-normal frequency distribution, relations to
grain size can be characterized by a median of 0.79% supported by the 1st quartile of 0.5% and
the 3rd quartile of 1.3% TOM.
Living and dead foraminiferal assemblages at the Aveiro Continental Shelf (Portugal)
PLOS ONE | https://doi.org/10.1371/journal.pone.0209066 January 30, 2019 8 / 47

Densities
A total of 3,984 living and 14,979 dead individuals are divided into 236 species (S2 Table).
Only 35 species exceed the representative numbers of 100 specimens, whereof 16 species are
represented by>200 individuals. Ninety-nine species are represented by<5 specimens and 45
ones by a single specimen. This explains the high gamma diversity [63], [71], in species rich-
ness (Chao1combined = 290.5 species) combined with low heterogeneity (Evenness combined =
0.195, Evenness living = 0.206, Evenness dead = 0.211). Densities of living individuals are
remarkably high for sites of transects B2 and B4 between 30 m and 50 m, which is supported
by high proportions at these depths in all A-transects (Fig 3A, S3 Table).
Depth dependence of densities are supported by non-linear regression, where 6th order
power functions significantly fit the trends in LAs [p(H0) = 3.46E-05] and DAs [p(H0) = 3.13E-
07]. Densities of living individuals are low at 10 m (~15 specimens) and get the averaged maxi-
mum of ~160 specimens at 45 m. The following decreasing trend to 100 m is gradual but then
drops to extremely low mean densities (~2 specimens) until 200 m (Fig 3B).
A different trend is identified on dead individuals, where after a rapid increase to 20 m
(~300 individuals), densities slowly decrease to mean densities of 280 specimens at 50 m, then
continuously increase to 540 specimens at 190 m water depth (Fig 3B).
Fig 2. Correlations between depth, sediment mean grain size (reported as grain size) and total organic matter (TOM). Full line: significant correlation; broken line:
non-significant correlation.
https://doi.org/10.1371/journal.pone.0209066.g002
Living and dead foraminiferal assemblages at the Aveiro Continental Shelf (Portugal)
PLOS ONE | https://doi.org/10.1371/journal.pone.0209066 January 30, 2019 9 / 47

Living and dead foraminiferal assemblages at the Aveiro Continental Shelf (Portugal)
PLOS ONE | https://doi.org/10.1371/journal.pone.0209066 January 30, 2019 10 / 47

Only in LAs, dependence of densities from SMGS are weakly significant [p(H0) = 1.69E-03]
as proven by 2nd order power regression (Fig 3C) getting a mean maximum with 129 individu-
als at 1651 μm grain size (2nd order power function). Densities of DAs varying around a
median of 341.5 specimens show no relation to SMGS and are bordered by the 1st quartile
(231.5 specimens) and 3rd quartile (419.25 specimens) along the gradient (Fig 3C). Percentages
of TOM significantly influence densities in both assemblages (Fig 3D) following 6th order (liv-
ing, p(H0) = 4.05E-08) and 3rd order (dead, p(H0) = 8.22E-06) power regressions. Dead indi-
vidual number tops with a mean of ~520 specimens at 2.5% of TOM, while in living
individuals the regression function increases reaching a mean maximum of ~170 individuals
at 0.4% of TOM, then it decreases rapidly (Fig 3D).
Similarity
Similarities between the density of LAs and DAs in the investigation area are presented in Fig
4A. Depth dependence of similarities between LAs and DAs can be significantly [p(H0) =
5.28E-06] fitted by a 3rd order power function (Fig 4B). A strong increase of similarity between
0 and 40 m peaks with a mean maximum of ~60 individuals between 50 and 70 m, then slowly
decreasing to zero similarity at the deepest site, because living individuals are absent (S3
Table).
The dependence of similarities from grain size is less significant [p(H0) = 1.37E-05] being
fitted by a 2nd order power function, getting its mean maximum (cosine = 0.58) at 1250 μm
(Fig 4C).
Similar to the dependence of TOM from depth, its dependence from grain size can also be
significantly [p(H0) = 9.28E-07] fitted by a 6th order power function (Fig 4D). A strong
increase of similarity between 0.0 and 0.4% of TOM is found with peaks at 0.6% TOM. A
decrease of similarity at 1.6% TOM is followed by no individuals at deeper sites, with the
exception of 15 specimens at a site characterized by 15% TOM and the exception of 44 individ-
uals at 4.2% TOM (Fig 4D).
Rank distance
Rank distances between assemblages in the investigation area are presented in Fig 5A, as well
as the dependence of rank distances from depth (Fig 5B), SMGS (Fig 5C) and TOM (Fig 5D).
The disorder in rankings in dependence of depth is significant [p(H0) = 1.25E-05] because
described by a 5th order power function (Fig 5B). After a strong increase, the first local maxi-
mum (rank distance ~250) is obtained at 50 m. Towards deeper sites, the rank distances slowly
increase reaching its maximum (350) at the deepest sites. The dependence of rank distances
from grain size is less significant [p(H0) = 8.21E- 04] using 2nd order power functions (Fig 5C).
Starting with a mean rank distance of 150 at 100 μm grain size, the function peaks with a mean
rank distance of 280 at ~1600 μm grain size. The dependence of rank distances from TOM is
significant [p(H0) = 0.016] when fitted by a 3rd order power function (Fig 5D). Starting with
rank distances of approximately 300 around 0.5% TOM, a local minimum with rank distance
of 180 is identified between 1.0% and 1.5% TOM. After an increase, a local maximum of rank
distance (345) occurs around 3.5% TOM.
Fig 3. Densities of assemblages in the investigated area. A. Densities of living and dead individuals represented as pie charts. B. Dependence
of densities from depth fitted by 6th order power functions. C. Dependence of densities from grain size fitted by 2nd order power functions
(living) and linear regression. D. Dependence of densities from TOM fitted by 6th order (living) and 3rd order (dead) power functions. Full line:
significant correlation; broken line: non-significant correlation.
https://doi.org/10.1371/journal.pone.0209066.g003
Living and dead foraminiferal assemblages at the Aveiro Continental Shelf (Portugal)
PLOS ONE | https://doi.org/10.1371/journal.pone.0209066 January 30, 2019 11 / 47

Living and dead foraminiferal assemblages at the Aveiro Continental Shelf (Portugal)
PLOS ONE | https://doi.org/10.1371/journal.pone.0209066 January 30, 2019 12 / 47

Incorporation values
The IncorpVals weighting the proportion of living on total specimens by similarities are
mapped in Fig 6A (S3 Table). Dependence of IncorpVals from depth can be significantly [p(H0) = 1.04E-05] fitted by 6th order power functions (Fig 6B) starting with zero values at 10 m
and reaching a mean maximum (55) at 50 m depth. Zero values are again observed at 100 m
and continue until 200 m, interrupted by an extremely weak second maximum (2) at 135 m.
IncorpVals significantly correlate with grain size [p(H0) = 2.60E-03] using a 2nd order power
regression (Fig 6C). Starting with low values at 100 μm grain size, the mean optimum (Incorp-
Val = 45) is attained at 1850 μm grain size. Moreover, sites with IncorpVal = 0 are spread over
the whole grain size scale in the investigation area (Fig 6C). The dependence of IncorpVals
from percentages of TOM is peculiar, which can be significantly [p(H0) = 4.95E-06] fitted by a
5th order power function (Fig 6D). This function starts at 0.2% TOM, reaches the maximum
(52) at 0.5% TOM and falls down to 0 at 1.5% or higher TOM. The small peak in the power
function at 2.5% TOM is artificial caused by function properties.
Similarity/Diversity index
Weighting of similarities by diversities (SimDivers), following Eq 9, are mapped in Fig 7A (S3
Table). The dependence of SimDivers’ from depth can be significantly [p(H0) = 2.29E-05] fit-
ted by a 5th order power function (Fig 7B). Starting at 10 m, the function maximum (SimDi-
vers = 75) is located at 65 m. The decrease of the function to 0 at 140 m is not documented in
the observed values, where 0 values start from 160 m downwards because living specimens
lack at these depths. A significant [p(H0) = 1.80E-04] power function of the 3rd order describes
the relation between the SimDivers Index and grain size. The function maximum (SimDi-
vers = 65) occurs at 1350 μm, then decreasing to 0 at 2000 μm (Fig 7C). The relation of SimDi-
vers to TOM can be significantly [p(H0) = 1.80E-04] fitted by a 6th order power function (Fig
7D). Starting at 0.2% TOM, the main function maximum (SimDivers = 65) is reached at 0.55%
TOM. This function decreases to 0 at 1.5% TOM. Two local maxima around 2.5% (SimDi-
vers = 4) and 4.2% TOM (SimDivers = 10) interrupt the 0 values of SimDivers.
Diversity diagrams
Species richness and heterogeneity of LAs and DAs standardized over the total number of LAs
and DAs are represented in diversity diagrams, where species richness is denoted on the x-axis
and heterogeneity on the y-axis (Fig 8, S3 Table).
General trends in the relations between LAs and DAs can be better described using Fig 9,
where the transect diagrams are separated by depth and transect. In the shallowest sites (~10
m) of A-transects, species richness is low combined with high heterogeneity in DAs, while LAs
are missing or having the same diversities as DAs. Diversity diagrams of sites in the B-transects
show similar configurations at 15 m comparable to sites in the A-transects at 10 m, while dia-
grams in the A-transects at 15 m are devoid of living individuals and high species richness
combined with low heterogeneity in DAs (Fig 9). From 25 m to 50 m species richness (high)
and heterogeneities (low) remain rather constant in DAs within the A-transects. The LAs
behave dissimilarly starting with low species richness and high heterogeneities from 25 to 35
m, becoming more similar to DAs from 40 to 50 m. The coincidence of diversity diagrams in
Fig 4. Similarities between assemblages’ density in the investigation area. A. Similarities represented as circle areas. B. Dependence of
similarities from depth fitted by 3rd order power function. C. Dependence of similarities from grain size fitted by 2nd order power function. D.
Dependence of similarities from TOM fitted by 6th order power function. Full line: significant correlation.
https://doi.org/10.1371/journal.pone.0209066.g004
Living and dead foraminiferal assemblages at the Aveiro Continental Shelf (Portugal)
PLOS ONE | https://doi.org/10.1371/journal.pone.0209066 January 30, 2019 13 / 47

Living and dead foraminiferal assemblages at the Aveiro Continental Shelf (Portugal)
PLOS ONE | https://doi.org/10.1371/journal.pone.0209066 January 30, 2019 14 / 47

LAs and DAs is remarkable for sites in all B-transects between 35 and 60 m. Sites A3-5 at 35 m
and A3-8 at 50 m belong to this group. This trend continues in sites B1-2, B2-3 and B4-4 from
60 m to 80 m (Fig 9). Diversity diagrams show an increase of species richness combined with
constant low heterogeneities in DAs toward deeper sites (70 m to 190 m), while species rich-
ness decreases in LAs to 0 combined with an increase in heterogeneities (Fig 9).
Relations between LAs and DAs expressed in diversity diagrams and their dependence on
environmental factors are represented in a coordinate system spanned by the two most impor-
tant coordinates obtained by nonmetric multidimensional scaling (nMDS). Scaling is based on
Euclidean Distances, because the variables species richness and heterogeneity are standardized
over all LAs and DAs.
The resulting diagram (Fig 10) perfectly represents the reduction of the original 4-dimen-
sional space (species richnessliving, species richnessdead, heterogeneityliving, heterogeneitydead) into
2 dimensions supported by a stress of 0.089.
The strongly correlated environmental factors water depth and percentages of TOM are
mainly represented along coordinate 1. Here, the trend in LAs and DAs from almost coinci-
dent diversities in LAs and DAs at high coordinate values to high species richness/low hetero-
geneities in DAs and low to missing species richness coupled with high heterogeneities in LAs
at low coordinate is characteristic. Following the grain size vector that is almost independent
from depth and TOM, the increase of species richness with more or less constant heterogene-
ities is characteristic for DAs. Along this gradient, LAs start with species numbers of 0 at low
gradient values becoming almost identical with the high species numbers of DAs at highest
gradient values. On the contrary, heterogeneities of LAs are high at low values of the grain size
vector and approximate heterogeneities of DAs at high grain size values (Fig 10).
Beta diversities
Beta diversities between assemblages define the spatial change along transects. The Hill num-
bers 0D and 1D were used for pairwise comparisons of succeeding sites (S4 Table). While 0Dexpresses the turnover rate in species number, 1D defines the turnover in number of dominant
species that is based on Shannon’s Entropy [67]. All increases and decreases in turnover values
could be modelled by logistic functions (Fig 11).
On the basis of the comparison of beta diversities between LAs and DAs of single sites (Fig
11A and 11B), species turnover is generally in favor of DAs (S4 Table). The turnover in species
number (0D) starts at the surface with a mean of 20.2 species coming up to a mean of 64.3 spe-
cies at 200 m (Fig 11A). Fitting by logistic functions is significant with p(H0) = 1.58E-06. The
turnover in dominant species (1D) can be significantly [p(H0) = 3.79E-06] fitted by a function
similar to the species turnover 0D, but characterized by a lower mean (2.2 species) near the sur-
face that increases to 14.3 species at 200 m (Fig 11B). The negative correlation between turn-
over in species number and the similarity between LAs and DAs is significant [p(H0) =
0.0040].
Regarding LAs, beta diversities of successive transect sites show higher species turnover in
shallow regions, followed by a decrease to a few species at the deepest transect sites (Fig 11C
and 11D). Species turnover 0D starts with a mean of 28.6 species in shallowest regions keeping
the turnover rate rather constant until 60 m. A rapid decrease between 60 from 26.8 species at
60 m to 4.8 species at 130 m is followed by slowly decreasing species numbers culminating
Fig 5. Rank distances between assemblages in the investigation area. A. Rank distances represented as circle areas. B. Dependence of rank
distances from depth fitted by 4th order power function. C. Dependence of rank distances from grain size fitted by 2nd order power function.
D. Dependence of rank distances from TOM fitted by 3rd order power function. Full line: significant correlation.
https://doi.org/10.1371/journal.pone.0209066.g005
Living and dead foraminiferal assemblages at the Aveiro Continental Shelf (Portugal)
PLOS ONE | https://doi.org/10.1371/journal.pone.0209066 January 30, 2019 15 / 47

Living and dead foraminiferal assemblages at the Aveiro Continental Shelf (Portugal)
PLOS ONE | https://doi.org/10.1371/journal.pone.0209066 January 30, 2019 16 / 47

with 1.2 species at 200 m (Fig 11C). Fitting this trend by logistic function is significant with p(H0) = 7.24E-05. The turnover 1D in dominant species can be fitted by a logistic function simi-
lar to the turnover 0D, but being not significant with p(H0) = 0.135. Species numbers start with
a mean of 10.6 in the shallowest region, strongly decrease between 50 and 140 m and ends
with 1.4 dominant species at 200 m (Fig 11D).
The turnover trend in DAs is opposite to LAs caused by the increasing number of dead
individuals towards deeper sites (Fig 11E and 11F). Species turnover 0D starts with a mean of
8.9 species in shallowest regions steadily increasing to 22.0 species at 140 m approximating
constancy in deeper parts (22.2 species at 200 m). Fitting this trend by logistic function is sig-
nificant with p(H0) = 5.93E-04 (Fig 11E). A similar trend can be found for the turnover rate 1Dfor dominant species. The rapid increase starting with a mean of 1.4 dominant species at the
surface to 5.5 species at 60 m is followed by a continuously weakening increase rate, ending
with 6.5 species at 200 m (Fig 11F). Again, the fit by a logistic function is significant with
p(H0) = 0.004.
Species abundance
The mean density of living and dead individuals was calculated for the 35 most abundant spe-
cies in the depth intervals 0–20 m, 20–40 m, 40–60 m, 60–100 m, 100–150 m and 150–200 m.
Frequency distributions of species were compared using Canonical Correspondence Analysis
including the environmental factors water depth, SMGS and TOM. The analysis obtained opti-
mal results, where 73.8% of total variance is explained by the first 2 axes (Fig 12). Based solely
on the frequency of species, the dominant first axis almost completely represents water depth
and the second axis shows the dependence on grain size as represented by vectors. The per-
centage of TOM is strongly correlated with water depth, simultaneously influenced in a weaker
mode by decreasing grain size (Fig 12).
Positioning frequencies of living individuals, represented in depth intervals, within CCA
ordination provides interesting results. They start with low values at the first axis (shallow
depths) and with medium values at the second axis (SMGS). The following two intervals (20–
40 m and 40–60 m) do not follow the depth trend, but lean towards increasing grain size. Back
to mean grain size, the interval 60–100 m shows a weak tendency to deeper sites followed by
the deeper intervals 100–150 m and 150–200 m. The short stretching over the depth ordinate
is caused by the low abundance of living individuals in the deep transect parts. Thus, distribu-
tion maps of the selected most abundant living species, related to the CCA groups 1 and 4–8
are presented in Fig 13. The CCA groups 2 and 3 contains species much more abundant in the
DAs and a reduced number of individuals in the LAs. Since the species of each group have
similar distribution patterns, the density of dead individuals of one species of each of these
groups was plotted as a function of depth (Fig 14): C. laevigata/C. carinata (group 3) and U.
peregrina (group 2). This plot evidences the abundance increasing of the of these species in the
outer shelf.
Due to the much higher numbers of dead individuals, the succeeding intervals based on
dead individuals follow the first axis representing water depth, when varying around medium
ordinate values along the second axis indicating medium grain size. Only the shallowest inter-
val (0–20 m) deviates from this trend being positioned in finer grain sizes (Fig 12).
Fig 6. ‘Incorporation Values’ of sites in the investigation area. A. ‘Incorporation Values’ represented as circle areas. B. Dependence of
‘Incorporation Values’ from depth fitted by 6th order power function. C. Dependence of ‘Incorporation Values’ from grain size fitted by 2nd
order power function. D. Dependence of ‘Incorporation Values’ from TOM fitted by 5th order power function. Full line: significant
correlation.
https://doi.org/10.1371/journal.pone.0209066.g006
Living and dead foraminiferal assemblages at the Aveiro Continental Shelf (Portugal)
PLOS ONE | https://doi.org/10.1371/journal.pone.0209066 January 30, 2019 17 / 47

Living and dead foraminiferal assemblages at the Aveiro Continental Shelf (Portugal)
PLOS ONE | https://doi.org/10.1371/journal.pone.0209066 January 30, 2019 18 / 47
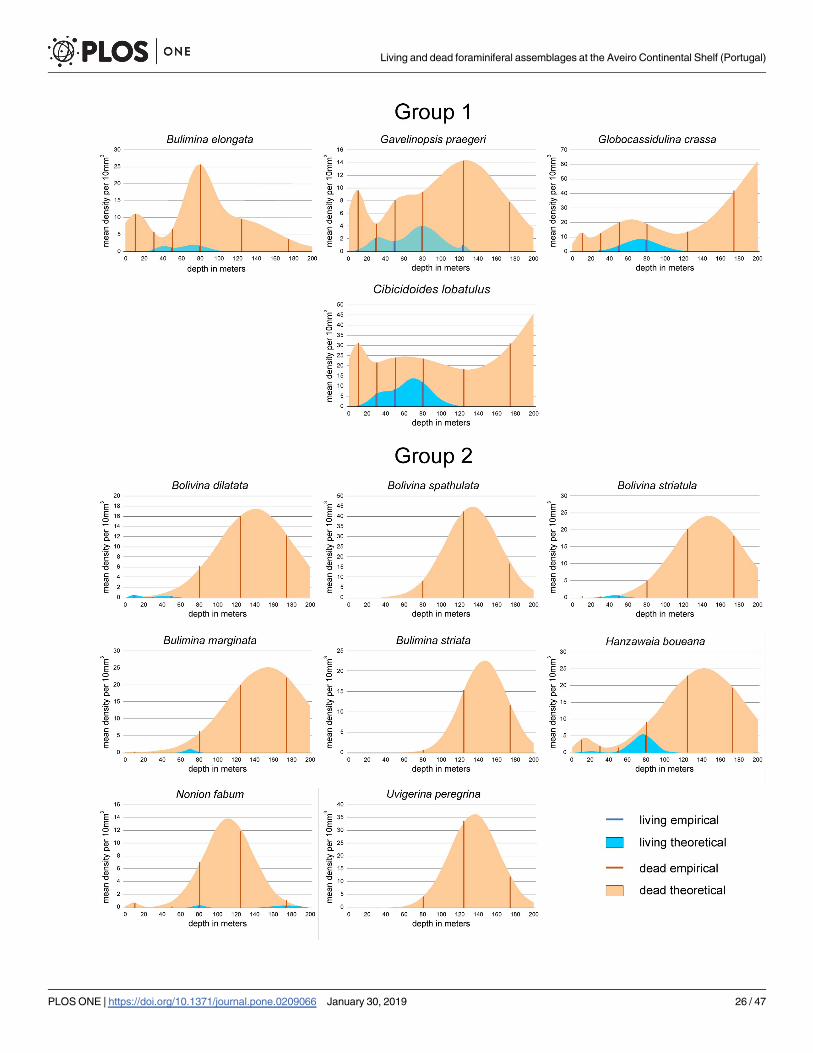
Positions of species within the coordinate system gained by CCA could be explained by the
frequency diagrams of species (Figs 15, 16 and 17). For an easier interpretation, diagrams are
arranged according to groups resulting from Unweighted Pair Group Method with Arithmetic
Mean (UPGMA) clustering based on Cosine measures that is independent from assemblage
size. The distribution parameters ‘mean density’, the depth position of means in multimodal
normal distributions and ranges expressed in the position of 0.5 and 99.5 percentiles are pre-
sented in Table 1.
Group 1: This group consisting of Bulimina elongata, Gavelinopsis praegeri, Globocassidu-lina crassa rossensis and Cibicidoides lobatulus is positioned in the center of the CCA coordi-
nate system (Fig 12) and represents the transition between the shallow-water groups 4 to 8 and
the deeper-water groups 2 and 3. Living individuals are abundant in C. lobatulus and G. crassa
Fig 7. Similarity/Diversity index (SimDivers) of sites in the investigation area. A. SimDivers represented as circle areas. B. Dependence of
SimDivers from depth fitted by 5th order power function. C. Dependence of SimDivers from grain size fitted by 3rd order power function. D.
Dependence of SimDivers from TOM fitted by 6th order power function; full line: significant correlation.
https://doi.org/10.1371/journal.pone.0209066.g007
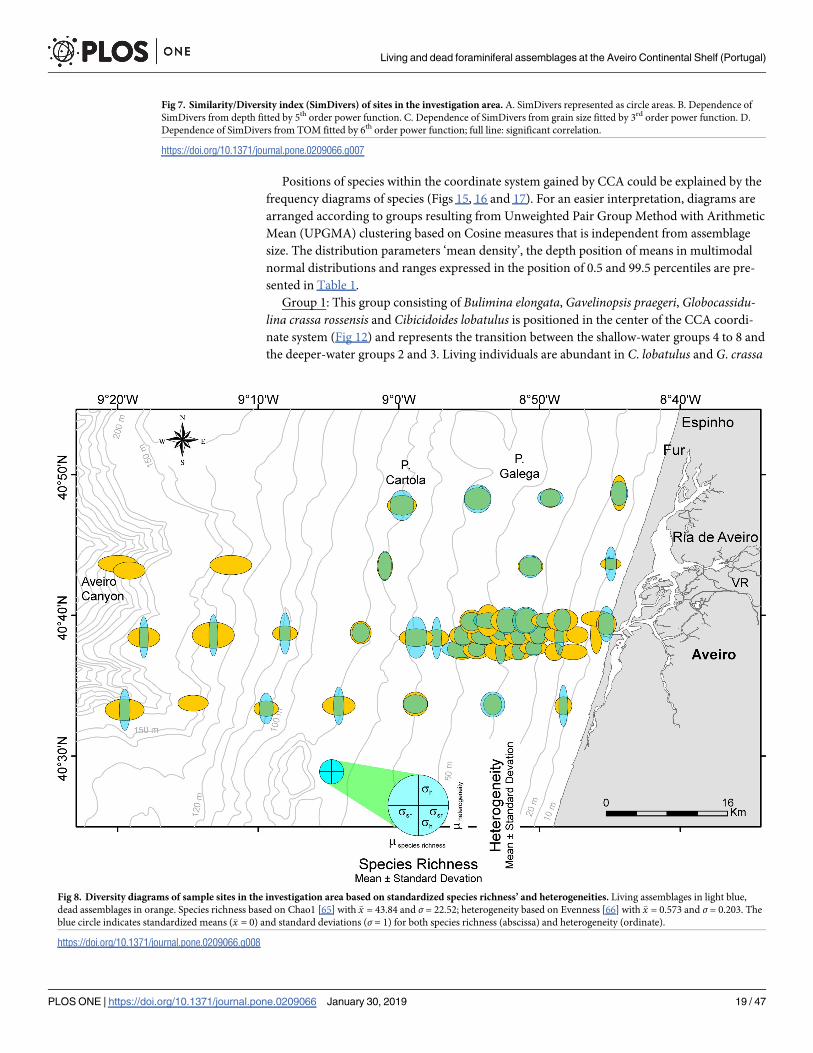
Fig 8. Diversity diagrams of sample sites in the investigation area based on standardized species richness’ and heterogeneities. Living assemblages in light blue,
dead assemblages in orange. Species richness based on Chao1 [65] with �x = 43.84 and σ = 22.52; heterogeneity based on Evenness [66] with �x = 0.573 and σ = 0.203. The
blue circle indicates standardized means (�x = 0) and standard deviations (σ = 1) for both species richness (abscissa) and heterogeneity (ordinate).
https://doi.org/10.1371/journal.pone.0209066.g008
Living and dead foraminiferal assemblages at the Aveiro Continental Shelf (Portugal)
PLOS ONE | https://doi.org/10.1371/journal.pone.0209066 January 30, 2019 19 / 47

Fig 9. Diversity diagrams of sample sites in Fig 8 arranged by transects and water depth. Living assemblages in
light blue and dead assemblages in orange.
https://doi.org/10.1371/journal.pone.0209066.g009
Living and dead foraminiferal assemblages at the Aveiro Continental Shelf (Portugal)
PLOS ONE | https://doi.org/10.1371/journal.pone.0209066 January 30, 2019 20 / 47

rossensis with mean density peaks (MDPs) around 10 individuals, and less abundant in G.
praegeri and B. elongata with MDPs around 2 individuals (Fig 15; Table 1). The prominent 1st
mode is located in all species around 75 m. Depth ranges start in G. praegeri and C. lobatuluswithin the first 10 m, while in G. crassa rossensis and B. elongata between 20 m to 25 m up to
110 m and 135 m. Similar to living individuals, dead specimens are abundant in G. crassa ros-sensis (MDP: 77.9) and C. lobatulus (MDP: 51.5), while less abundant in G. praegeri (MDP:
12.8) and B. elongata (MDP: 13.3). The trimodal frequency distributions differ in the succes-
sion of modes. The shallowest mode means are located in all species around 9 m, failing to
become the most prominent mode (Fig 15; Table 1). The second mode, deeper means are
located in all species between 50 m and 80 m, becoming the first mode in B. elongata. The
Fig 10. Diversity diagrams of sample sites positioned in a coordinate system obtained by nMDS. Influence of environmental factors water depth, SMGS
and TOM represented as vectors together with the variables standardized diversity vector’s length and angle. Living assemblages in light blue and dead
assemblages in orange.
https://doi.org/10.1371/journal.pone.0209066.g010
Living and dead foraminiferal assemblages at the Aveiro Continental Shelf (Portugal)
PLOS ONE | https://doi.org/10.1371/journal.pone.0209066 January 30, 2019 21 / 47

Living and dead foraminiferal assemblages at the Aveiro Continental Shelf (Portugal)
PLOS ONE | https://doi.org/10.1371/journal.pone.0209066 January 30, 2019 22 / 47

third one means show a differentiation between B. elongata, G. praegeri and G. crassa rossensis,C. lobatulus. Located around 120 m for the former species group, they are positioned around
250 m in the later species, becoming here the most prominent peaks. Depth ranges start in all
species at 0 m caused by the truncated normal distributions with the first mean. They finish
for B. elongata and G. praegeri between 220 m and 250 m, while for G. crassa rossensis and C.
lobatulus the 99.5 percentiles are located deeper than 300 m. This shape hints to an additional
normal-distributed component stretching the distribution of dead individuals into deeper
Fig 11. Beta diversities along transects determined by Hill numbers 0D (species number) and 1D (dominant species). A, B. Comparison between LAs and DAs of
transect sites. C, D. Comparison between LAs of succeeding sites along transects. E, F. comparison between DAs of succeeding sites along transects. Grey lines: fit by
logistic functions.
https://doi.org/10.1371/journal.pone.0209066.g011
Fig 12. Canonical correspondence analysis of the most abundant species based on depth distributions of living and dead individuals. Groups are obtained by
hierarchical cluster analysis Unweighted Pair Group Method with Arithmetic Mean using Cosine measures.
https://doi.org/10.1371/journal.pone.0209066.g012
Living and dead foraminiferal assemblages at the Aveiro Continental Shelf (Portugal)
PLOS ONE | https://doi.org/10.1371/journal.pone.0209066 January 30, 2019 23 / 47
regions. Percentages of living individuals on dead specimens range from 4.9% to 15.0%
(Table 1).
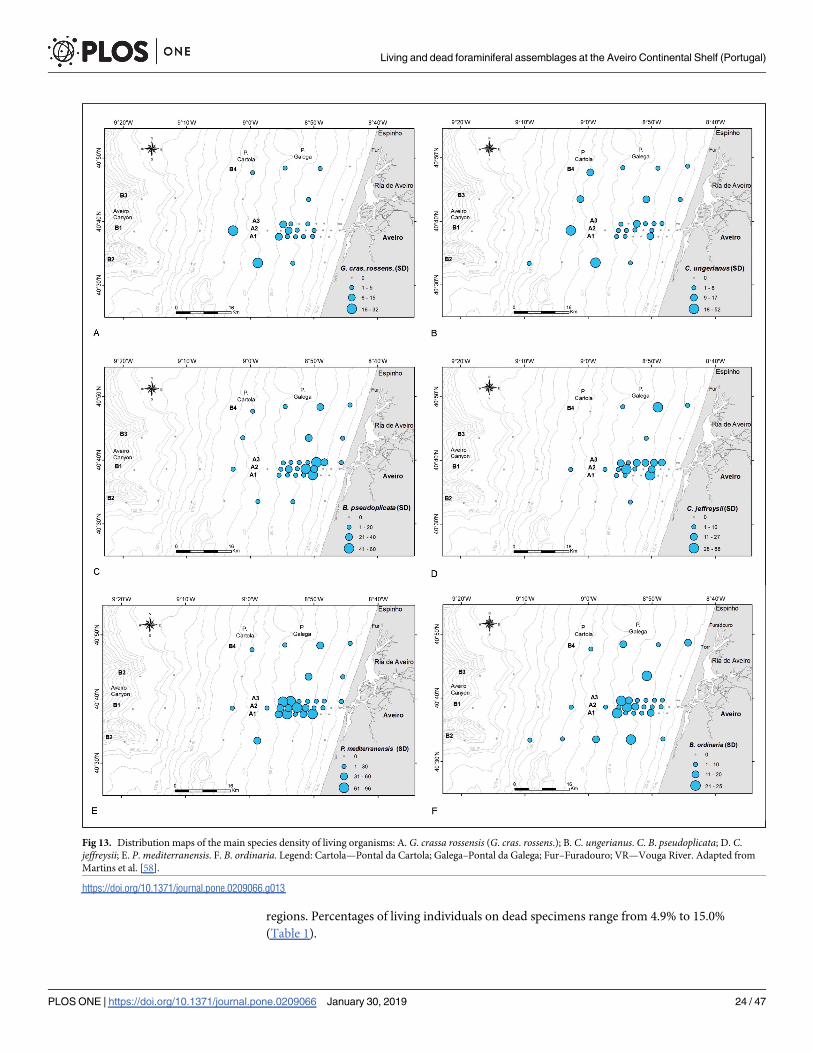
Fig 13. Distribution maps of the main species density of living organisms: A. G. crassa rossensis (G. cras. rossens.); B. C. ungerianus. C. B. pseudoplicata; D. C.
jeffreysii; E. P. mediterranensis. F. B. ordinaria. Legend: Cartola—Pontal da Cartola; Galega–Pontal da Galega; Fur–Furadouro; VR—Vouga River. Adapted from
Martins et al. [58].
https://doi.org/10.1371/journal.pone.0209066.g013
Living and dead foraminiferal assemblages at the Aveiro Continental Shelf (Portugal)
PLOS ONE | https://doi.org/10.1371/journal.pone.0209066 January 30, 2019 24 / 47

Group 2: Bolivina dilatata, Bolivina spathulata, Bolivina striatula, Bulimina marginata,
Bulimina striata, Hanzawaia boueana, Nonion fabum and Uvigerina peregrina are members of
this group (Fig 15, Table 1). Living individuals are rare in H. boueana (MDP 5.2), extremely
rare with MDPs < 1.0 in B. dilatata, B. striatula, B. marginata and N. fabum, and completely
lacking in B. spathulata, B. striata and U. peregrina. In B. marginata, H. boueana and N.
fabum, the main mode is located around 75 m, different to the shallower positions of B. stria-tula (46.6 m) and B. dilatata with 10 m (Table 1). Depth ranges of living individuals start near
the surface (B. dilatata, H. boueana), at 26 m (B. striatula) and around 62 m (B. marginata, N.
fabum). Depth ranges cover between 66.7 m (B. dilatata) and 212 m (N. fabum). Dead speci-
mens of all species are characterized by a main peak positioned between 111.9 m (N. fabum)
and 153.5 m (B. marginata) characterized by MDPs between 17.5 (B. dilatata) and 44.7 indi-
viduals (B. spathulata). Except B. marginata, H. boueana and N. fabum possessing additional
components, the first mode is the singe peak for the remaining species within this group
(Table 1). Depth ranges start near the surface in B. marginata, H. boueana and N. fabum, fol-
lowed with onsets from 36.7 m (B. dilatata) to 84.3 m (B. striata). Except N. fabum possessing
a 99.5 percentile of 180.5 m, depth ranges finish between 200 and 270m (Table 1). Percentages
of living individuals on dead specimens are between 0 and 1%, except N. fabum (1.4%) and H.
boueana (6.4%; Table 1).
Group 3: Bolivina difformis, Cassidulina laevigata, Fissurina orbignyana, Globocassidulinaminuta, Globocassidulina subglobosa and Textularia sagittula belong to this group. Living indi-
viduals are extremely rare with MDPs from 0.1 to 3.0 individuals or being absent (B. difformis).The single modes are located between 46.5 and 85.5 m (Fig 13, Table 1). Depth distributions
start either at 0 m (G. minuta, T. sagittula) or between 15 and 45 m in the remaining species,
except B. difformis. All distributions end between 60 and 140 m (Table 1). Distributions of
dead individuals are unimodal (B. difformis, F. orbignyana, G. minuta), bimodal (G. subglo-bosa) or trimodal (C. laevigata, T. sagittula), with MDPs between 13.7 in F. orbignyana and 23
individuals in G. minuta. High (43.3) and extreme (98.8) numbers of individuals characterize
the MDPs of G. subglobosa and C. laevigata. The first modes of all species are located below
200 m depth, thus outside the investigated transect. Depth distributions start at the surface (G.
subglobosa, T. sagittula) or between 15 m and 30 m in the remaining species, except B. diffor-mis that starts at 90.6 m. The deeper limits are located beyond 300 m depth; thus, a further
Fig 14. Density (SD; n.˚/50 ml) of dead individuals of C. laevigata/C. carinata and U. peregrina as a function of the depth.
Polynomial trend lines are presented.
https://doi.org/10.1371/journal.pone.0209066.g014
Living and dead foraminiferal assemblages at the Aveiro Continental Shelf (Portugal)
PLOS ONE | https://doi.org/10.1371/journal.pone.0209066 January 30, 2019 25 / 47
Living and dead foraminiferal assemblages at the Aveiro Continental Shelf (Portugal)
PLOS ONE | https://doi.org/10.1371/journal.pone.0209066 January 30, 2019 26 / 47

deeper normal-distributed component must be expected for all species in this group. The per-
centages of living individuals on dead specimens are low, similar to group 3, with slightly
higher values for G. minuta (4.4%) and G. subglobosa (7.0%).
Group 4: Ammonia beccarii, Cibicidoides ungerianus, Cibicidoides pseudoungeriana and
Cribroelphidium gerthi are taxa belonging to this group. Their positions in CCA indicate shal-
low depths and finer grain size (Fig 12). MDPs are low (1 to 2 individuals) in A. beccarii, C.
pseudungeriana and C. gerthi, becoming more abundant in C. ungerianus (21 individuals).
Depth distributions are unimodal (A. beccarii) or bimodal in the other species with the charac-
teristic first mode located between 69.4 m and 80.5 m (Fig 16, Table 1). Depth distributions
start at the surface (C. pseudoungeriana, C. gerthi) or at 10 m (C. ungerianus) or 50 m (A. bec-carii). All distributions end between 90 and 100 m. Dead individuals show low MDPs in C.
gerthi (3.2) and A. beccarii (9.2), becoming higher in C. pseudoungeriana (21.7) and C. ungeria-nus (29.5). Distributions are bimodal (A. beccarii, C. ungerianus) or trimodal (C. pseudoungeri-ana, C. gerthi) with changing positions of the most important mode 1. Shallow positions of the
first mode around 11.5 m are characteristic for A. beccarii and C. ungerianus, while deeper
positions can be found in C. gerthi (45.5m) and C. pseudoungeriana (176.9 m). All depth distri-
butions start at the surface and finish, except A. beccarii (137.7m), between 200 m and 260 m
(Fig 16, Table 1).
In contrast to the species of groups 2 and 3 indicating deeper environments, percentages of
living individuals on dead specimens are higher, still low in C. pseudoungeriana (4.0%) and A.
beccarii (5.0%), but higher in C. gerthi (11.6%) and C. ungerianus (17.9%). Altogether, this
explains the similarities in distributions of species belonging to group 1 and group 4, primarily
expressed in living individuals (Figs 14 and 15).
Group 5: The abundant Bolivina pseudoplicata and the rare Paratrochammina bartrami are
members of this group. They differ in living individuals by MDPs of 18.1 and 4.8 individuals
(Table 1). Furthermore, distributions are unimodal in P. bartrami and bimodal in B. pseudopli-cata (Fig 16). The prominent modes 1 are located around 25 m. Both species start at or near
the surface, but differ in their distribution’s end (P. bartrami: 48.3 m; B. pseudoplicata: 94.5
m). Dead specimens are also rare in P. bartrami (MDP 5.9) and more frequent in B. pseudopli-cata with a MDP of 22.7. Both MDPs are slightly higher than their counterparts in living indi-
viduals (Table 1). The main modes in the unimodal distribution of P. bartrami and the
bimodal distribution of B. pseudoplicata are located around 36 m. Depth distributions range
from 11.8 m to 62.2 m in P. bartrami and from 12.1 to 62.2 m in B. pseudoplicata. Although
their frequencies are different, the proportions of living individuals on dead specimens are the
same (79.7% and 80.2%; Table 1).
Group 6: Cribrostomoides jeffreysii is the most abundant member in this group, while Dis-corbis parkeri, Lepideuterammina ochracea, Remaneica anglica, Remaneica plicata and Tro-chammina ssp. are rather rare. In living individuals this is marked by MDP of 13.5 individuals
for C. jeffreysii, strongly different from MDPs of the other group members ranging from 0.2 to
2.1 (Table 1). Distributions of living individuals are bimodal with an almost shallower mode 1
approximately located between 30 and 50 m, and a second mode positioned between 50 and
80 m. Only the few living Trochammina ssp. is opposite with a deeper mode 1 compared to
mode 2 (Table 1). Depth distributions start near the surface in R. plicata and L. ochracea, or
are positioned between 12 m and 20 m in the other species. The distribution ends for C. jeffrey-sii at 80.7 m, while for the other species distributions end in a narrow interval between 113.6 m
Fig 15. Depth frequencies of living and dead individuals for species of groups 1 and 2 according to UPGMA cluster analysis. Groups are positioned in the
CCA of Fig 12.
https://doi.org/10.1371/journal.pone.0209066.g015
Living and dead foraminiferal assemblages at the Aveiro Continental Shelf (Portugal)
PLOS ONE | https://doi.org/10.1371/journal.pone.0209066 January 30, 2019 27 / 47

Living and dead foraminiferal assemblages at the Aveiro Continental Shelf (Portugal)
PLOS ONE | https://doi.org/10.1371/journal.pone.0209066 January 30, 2019 28 / 47
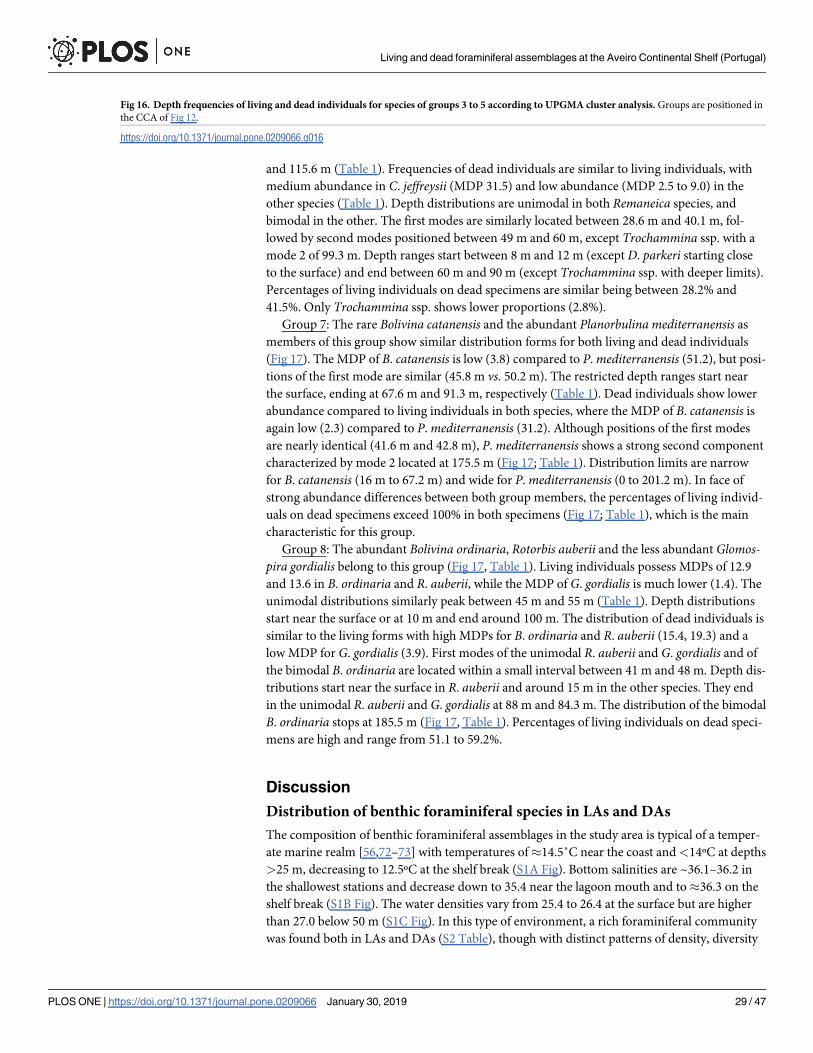
and 115.6 m (Table 1). Frequencies of dead individuals are similar to living individuals, with
medium abundance in C. jeffreysii (MDP 31.5) and low abundance (MDP 2.5 to 9.0) in the
other species (Table 1). Depth distributions are unimodal in both Remaneica species, and
bimodal in the other. The first modes are similarly located between 28.6 m and 40.1 m, fol-
lowed by second modes positioned between 49 m and 60 m, except Trochammina ssp. with a
mode 2 of 99.3 m. Depth ranges start between 8 m and 12 m (except D. parkeri starting close
to the surface) and end between 60 m and 90 m (except Trochammina ssp. with deeper limits).
Percentages of living individuals on dead specimens are similar being between 28.2% and
41.5%. Only Trochammina ssp. shows lower proportions (2.8%).
Group 7: The rare Bolivina catanensis and the abundant Planorbulina mediterranensis as
members of this group show similar distribution forms for both living and dead individuals
(Fig 17). The MDP of B. catanensis is low (3.8) compared to P.mediterranensis (51.2), but posi-
tions of the first mode are similar (45.8 m vs. 50.2 m). The restricted depth ranges start near
the surface, ending at 67.6 m and 91.3 m, respectively (Table 1). Dead individuals show lower
abundance compared to living individuals in both species, where the MDP of B. catanensis is
again low (2.3) compared to P. mediterranensis (31.2). Although positions of the first modes
are nearly identical (41.6 m and 42.8 m), P. mediterranensis shows a strong second component
characterized by mode 2 located at 175.5 m (Fig 17; Table 1). Distribution limits are narrow
for B. catanensis (16 m to 67.2 m) and wide for P. mediterranensis (0 to 201.2 m). In face of
strong abundance differences between both group members, the percentages of living individ-
uals on dead specimens exceed 100% in both specimens (Fig 17; Table 1), which is the main
characteristic for this group.
Group 8: The abundant Bolivina ordinaria, Rotorbis auberii and the less abundant Glomos-pira gordialis belong to this group (Fig 17, Table 1). Living individuals possess MDPs of 12.9
and 13.6 in B. ordinaria and R. auberii, while the MDP of G. gordialis is much lower (1.4). The
unimodal distributions similarly peak between 45 m and 55 m (Table 1). Depth distributions
start near the surface or at 10 m and end around 100 m. The distribution of dead individuals is
similar to the living forms with high MDPs for B. ordinaria and R. auberii (15.4, 19.3) and a
low MDP for G. gordialis (3.9). First modes of the unimodal R. auberii and G. gordialis and of
the bimodal B. ordinaria are located within a small interval between 41 m and 48 m. Depth dis-
tributions start near the surface in R. auberii and around 15 m in the other species. They end
in the unimodal R. auberii and G. gordialis at 88 m and 84.3 m. The distribution of the bimodal
B. ordinaria stops at 185.5 m (Fig 17, Table 1). Percentages of living individuals on dead speci-
mens are high and range from 51.1 to 59.2%.
Discussion
Distribution of benthic foraminiferal species in LAs and DAs
The composition of benthic foraminiferal assemblages in the study area is typical of a temper-
ate marine realm [56,72–73] with temperatures of�14.5˚C near the coast and<14ºC at depths
>25 m, decreasing to 12.5ºC at the shelf break (S1A Fig). Bottom salinities are ~36.1–36.2 in
the shallowest stations and decrease down to 35.4 near the lagoon mouth and to�36.3 on the
shelf break (S1B Fig). The water densities vary from 25.4 to 26.4 at the surface but are higher
than 27.0 below 50 m (S1C Fig). In this type of environment, a rich foraminiferal community
was found both in LAs and DAs (S2 Table), though with distinct patterns of density, diversity
Fig 16. Depth frequencies of living and dead individuals for species of groups 3 to 5 according to UPGMA cluster analysis. Groups are positioned in
the CCA of Fig 12.
https://doi.org/10.1371/journal.pone.0209066.g016
Living and dead foraminiferal assemblages at the Aveiro Continental Shelf (Portugal)
PLOS ONE | https://doi.org/10.1371/journal.pone.0209066 January 30, 2019 29 / 47

Fig 17. Depth frequencies of living and dead individuals for species of groups 6 to 8 according to UPGMA cluster analysis. Groups are positioned in the CCA of Fig
12.
https://doi.org/10.1371/journal.pone.0209066.g017
Living and dead foraminiferal assemblages at the Aveiro Continental Shelf (Portugal)
PLOS ONE | https://doi.org/10.1371/journal.pone.0209066 January 30, 2019 30 / 47

Table 1. Distribution parameters for LAs and DAs of the most important species. The means of normal-distributed components are arranged according to their
height, thus designated as modes. Groups indicated by colors given in Fig 12.
Living and Dead Species Mean density % Living individuals Meters Range in Meters
Mode 1 Mode 2 Mode 3 0.5 Percentile 95.5 Percentile
Bulimina elongata living 1.8 4.9 72.5 40.1 21.1 110.1
dead 13.3 77.5 118.3 10.9 0 224.6
Gavelinopsis praegeri living 3.5 13.2 80.5 31.7 125.8 3.9 129.4
dead 12.8 126.3 8.9 51.5 0 240.5
Globocassidulina crassa rossensis living 8.5 9.1 73.5 24.0 132.1
dead 77.9 249.5 61.1 8.5 0 409.7
Lobatula lobatula living 12.4 15.0 70.8 33.1 7.4 116.1
dead 51.5 246.5 8.5 60.7 0 390.0
Bolivina dilatata living 0.4 0.8 10.0 41.3 0 66.7
dead 17.5 140.7 36.7 244.8
Bolivina spathulata living 0 0.0
dead 44.7 133.9 57.8 210.0
Bolivina striatula living 0.7 0.6 46.6 25.9 67.3
dead 24.2 146.9 50.7 243.2
Bulimina marginata living 1.0 0.6 70.0 57.1 83.0
dead 25.2 153.5 9.5 1.3 263.3
Bulimina striata living 0 0.0
dead 22.6 146.8 83.4 210.2
Hanzawaia boueana living 5.2 6.4 76.7 21.6 1.8 106.1
dead 24.3 142.8 14.3 4.9 0 252.3
Nonion fabum living 0.3 1.4 80.5 174.5 67.1 212.0
dead 13.7 111.9 9.4 0 180.5
Uvigerina peregrina living 0 0.0
dead 36.6 135.8 66.6 204.9
Bolivina difformis living 0 0.0
dead 22.3 206.1 90.6 321.5
Cassidulina laevigata/Cassidulina carinata living 1.9 0.4 85.5 44.2 95.8
dead 98.8 207.8 84.5 21.5 20.2 367.6
Fissurina orbignyana living 0.1 0.1 50.0 37.1 62.9
dead 13.7 220.5 27.3 412.7
Globocassidulina minuta living 1.3 4.4 46.5 0 98.3
dead 23.0 249.8 15.5 484.5
Globocassidulina subglobosa living 3.0 7.0 50.8 15.7 86
dead 43.3 265.3 45.8 0 440.2
Spiroplectammina sagittula living 0.1 1.1 68.6 0 137.4
dead 18.8 228.0 79.3 5.1 0 372.8
Ammonia beccarii living 1.1 5.0 70.0 42.0 98.1
dead 9.2 11.1 90.4 0.0 137.7
Cibicides ungerianus living 21.0 17.9 70.8 22.4 9.9 96.9
dead 29.5 11.9 62.3 0 257.9
Cibicidoides pseudoungeriana living 1.9 4.0 69.4 11.1 0 93.2
dead 21.7 176.9 75.0 8.5 0 227.5
Elphidium gerthi living 1.2 11.6 80.5 29.3 0 96.1
dead 3.2 45.5 7.6 124.4 0 219.2
(Continued)
Living and dead foraminiferal assemblages at the Aveiro Continental Shelf (Portugal)
PLOS ONE | https://doi.org/10.1371/journal.pone.0209066 January 30, 2019 31 / 47

and species distribution. The CCA (Fig 12) allowed to recognize 8 groups of species in which
the divergence of LAs and DAs as a function of depth has been analyzed.
Group 1 is represented by B. elongata, G. praegeri, G. crassa rossensis (Fig 13A) and C. loba-tulus. These species are relatively abundant in DAs where G. crassa rossensis and C. lobatulustend to increase in abundance in deeper areas, whereas B. elongata and G. praegeri show an
opposite trend (Fig 15). A similar distribution pattern was described by Levy et al. [55] for B.
elongata and G. praegeri at the PCS, where these species are common from the coast up to 150
m, but rarer beyond this depth. However, a caveat is made; these authors analyzed the total
(living + dead) foraminiferal assemblage. In LAs of ACS, B. elongata, G. praegeri, G. crassa ros-sensis and C. lobatulus exhibit mean or low abundance and occupy biotopes located between
50 and 80 m. The LAs belonging to Group 1 following the pattern of distribution of G. crassarossensis (Fig 13A) is restricted in a mid-shelf biotope characterized by stable substrate, not
constantly mixed and stirred by the winds, waves and tides, and is located out of the direct dis-
turbance caused by the Ria de Aveiro outflow. The DAs instead cover a much broader depth
range than the LAs, suggesting that the DAs may be remobilized by waves and dispersed by
oceanic currents for a large area and/or living populations of these species may inhabit other
sectors of the PCA.
Table 1. (Continued)
Living and Dead Species Mean density % Living individuals Meters Range in Meters
Mode 1 Mode 2 Mode 3 0.5 Percentile 95.5 Percentile
Bolivina pseudoplicata living 18.1 79.7 31.7 60.7 4.7 94.5
dead 22.7 35.1 124.3 12.1 217.5
Paratrochammina bartrami living 4.8 80.2 23.4 0 48.3
dead 5.9 37.0 11.8 62.2
Cribrostomoides jeffreysii living 13.5 41.5 29.6 50.9 13.5 80.7
dead 31.5 30.0 50.4 12.0 78.8
Discorbis parkeri living 0.6 28.2 51.2 82.7 20.3 114.0
dead 2.5 31.5 59.2 3.3 86.8
Lepidodeuterammina ochracea living 2.1 49.6 30.1 69.9 6.3 115.1
dead 4.7 28.6 49.0 8.0 90.1
Remaneica anglica living 1.0 33.6 31.4 70.1 13.0 114.4
dead 5.8 37.1 11.8 62.4
Remaneica plicata living 0.7 32.8 30.1 67.8 0 113.6
dead 5.6 38.8 11.8 65.6
Trochammina spp. living 0.2 2.8 69.8 32.7 12.3 115.6
dead 9.0 40.1 99.3 11.9 167.3
Bolivina catanensis living 3.8 153.1 45.8 10.0 0.0 67.6
dead 2.3 41.6 16.0 67.2
Planorbulina mediterranensis living 51.2 116.3 50.2 9.1 91.3
dead 31.2 42.8 175.5 0 201.2
Bolivina ordinaria living 12.9 51.1 46.4 0 93
dead 15.4 41.8 96.5 17.2 185.5
Discorbis mira living 13.6 59.2 52.3 13.3 91.3
dead 19.3 41.0 0 88.0
Glomospira gordialis living 1.4 51.2 53.6 3.4 103.9
dead 3.9 47.8 11.4 84.3
https://doi.org/10.1371/journal.pone.0209066.t001
Living and dead foraminiferal assemblages at the Aveiro Continental Shelf (Portugal)
PLOS ONE | https://doi.org/10.1371/journal.pone.0209066 January 30, 2019 32 / 47

Group 2 is represented by U. peregrina, B. spathulata, B. marginata, H. boueana, B. stria-tula, B. striata, B. dilatata and N. fabum (Fig 12). These taxa are associated with finer grained
substrates and high TOM content (Fig 12) and are mostly represented in DAs from the deeper
sectors of the ACS, as shown in the plot of U. peregrina density in DAs as a function of depth
(the species selected to represent this group; Fig 14) and also in Fig 15. This sector (80–120 m
depth) is characterized by low degree of disturbance by hydrodynamic forces and variability of
physicochemical parameters. This group includes species common in neritic and bathyal
depths in productive coastal upwelling areas and in oxygen-poor environments [73–82].
Group 3 is characterized by B. difformis, C. laevigata, G. subglobosa, G. minuta, F.
orbignyana and T. sagittula. These taxa reach relatively high densities in DAs and are
extremely rare or absent (B. difformis) in LAs (Fig 16). The density of these species, mostly on
DAs, also tends to increase with depth and TOM (Fig 12). In DAs, these species are present
from the shallowest stations (except B. difformis) but show the highest densities at 200 m depth
(as can also be observed in the plot of C. laevigata/C. carinata density, as a function of depth,
the taxa selected to represent the pattern of this group in DAs; Fig 14). Most of these species
are related to pulses of food supplied by the oceanic productivity [56,79,83–86].
Group 4 includes C. ungerianus (Fig 13B, in LA) and species that follow similar pattern of
distribution such as A. beccarii, C. pseudungeriana and C. gerthi. In ACS, these taxa are associ-
ated with finer grained and common at shallow depths and at the mid shelf sediments both in
LAs and DAs, but end their distributions between 90/100 m in LAs and 140/200 m in DAs
(Figs 12 and 16). Cibicidoides ungerianus is an epifaunal species [72,73] that lives in oxic envi-
ronments [87–88] with no tolerance to oxygen deficiency [82]. Living populations of C. gerthimainly depend on the availability of food, particularly diatoms [89]. The highest density of the
species of this group should be related with availability of food of high quality and oxic
environments.
Group 5 encloses P. bartrami and B. pseudoplicata (Fig 13C, in LA). This group is associ-
ated with fine grained sediment and occurs in shallow waters of ACS (Fig 12). These taxa have
abundance peaks around 25 m in LAs and 36 m in DAs of ACS (Fig 16). While P. bartramiends its distribution at 62.2 m, B. pseudoplicata occurs at all depths at least in DAs (Fig 16) and
has been reported from the infralittoral to bathyal environments [76,90–91]. Bolivina pseudo-plicata is much more abundant than P. bartrami, both in LAs and DAs (Fig 16). Due to their
opportunistic behavior and tolerance to low salinity [92–93] both species are recorded in ACS
near the Ria de Aveiro mouth associated with a certain degree of disturbance caused by the
organic-enriched outflow from the lagoon and the variability of physicochemical parameters.
Group 6 comprises C. jeffreysii (the most abundant), D. parkeri, L. ochracea, R. anglica, R.
plicata and Trochammina ssp. (rare species) (Fig 17). In both assemblages, these species are
related to relatively coarse sediments (Fig 12). The LAs of D. parkeri, L. ochracea, R. anglica, R.
plicata and Trochammina ssp. have reduced density, whereas C. jeffreysii is quite well repre-
sented (Fig 13D, in LA). Their abundances in DAs is higher than the LAs but demonstrate sim-
ilar distribution patterns with the first shallow modes almost coincident in both assemblages
(Fig 17). Cribrostomoides jeffreysii can be found on all PCS down to 90/150 m [56] but in ACS
its highest density is mostly identified in front of the Aveiro lagoon outflow, associated with
coarse grain size both in LAs (Fig 13D) and DAs (Fig 17). Most of the species of this group are
epifaunal and oxyphilic and can tolerate low salinities [94] that agrees with their pattern of dis-
tribution in ACS (Fig 17).
Group 7 includes P. mediterranensis (the most abundant; Fig 13 E, in LA) and B. catanensis(present with reduced abundance). Both species occupy similar ranges of depth in both LAs
and DAs (Fig 17) and are associated to coarse grained sediments (Fig 12). They rarely occur at
shallower stations but display their abundances’ peak in the mid shelf (at 45.8 m and 50.2 m
Living and dead foraminiferal assemblages at the Aveiro Continental Shelf (Portugal)
PLOS ONE | https://doi.org/10.1371/journal.pone.0209066 January 30, 2019 33 / 47

depth, respectively) and disappear at 67.6 m and 91.3 m, respectively. Planorbulina mediterra-nensis is common (> 6%) in the PCS down to 75 m, becomes rare at depths greater than 150
m and disappears beyond the continental shelf break [56]. Sediment grain size is a limiting fac-
tor for P. mediterranensis that gets its maximum abundance on coherent rock or at coarse sedi-
ments containing gravel and sand [73]. It is an epiphytic species that can live attached by the
spiral side to plants and rocks [95–96]. Thus, it has been associated with coarse grained sedi-
ments of the mid ACS, in front of the Ria de Aveiro mouth, where it can also benefit of organic
matter supplied by that lagoon. The reduced density of B. catanensis and P. mediterranensis in
DAs in comparison with the living one might indicate tests removal by hydrodynamic forces
in the mid ACS.
Group 8 includes B. ordinaria, R. auberii (both abundant) and G. gordialis (less abundant)
(Fig 12). In ACS, the LAs of these species are present from the shallower stations until�100 m
depth and have similar unimodal distributions with peaks at the mid shelf between 45 m and 55
m, associated with the coarsest sediments (Figs 12 and 17). The ranges of depth of the DAs are
similar in the study area and exhibit abundances’ peaks from 30 to 50 m depth. Rotorbis auberiiis an epifaunal species quite common in the northern region of the Iberian Peninsula [97–98] as
well as G. gordialis [56]. The map of distribution of B. ordinaria is selected to represent this
group in LAs (Fig 13F) evidences higher densities mainly in the sector between 40–60 m deep.
Bolivina ordinaria is highly adaptable, has a wide tolerance to different environmental parame-
ters leading to a ubiquitous distribution [9] but its abundance increases in zones with high
input of fresh phytoplankton [9]. In ACS, the LAs of R. auberii and G. gordialis show a wider
depth range than the DAs. Both assemblages are mainly present at the mid shelf gravel deposits,
where the accumulation of fine particles is reduced. The contraction or lag of the dead faunas of
these species in ACS (Fig 17) may also indicate removal of tests by hydrodynamics.
The distribution of the main species and the groups identified by the CCA indicate the exis-
tence of several sub-environments in ACS depending probably on the greater or lesser variabil-
ity of the physicochemical parameters, the hydrodynamism, the stability of the substrate, the
type of availability of organic matter.
Differences in the structure of LAs and DAs of benthic foraminifera
Densities of DAs reach, in general, higher values than LAs, and tend to increase at deeper sta-
tions, where the number of living organisms are quite low during sampling events (Fig 3A and
3B). At the shallowest stations (�10–15 m) both living and dead foraminiferal densities are
low (Fig 3B).
LAs and DAs at the inner shelf. The low rank distances, at depths 15–25 m, are related to
low ‘Incorporation Values’ (Figs 5 and 6) and are associated to TOM contents of<0.5%,
which means that the living organisms are contributing with few empty tests for the sedimen-
tary record. Moreover, the Diversity/Heterogeneity diagrams show that in the shallowest sites
(~10 m) of A-transects, species richness is low combined with high heterogeneity in DAs,
while LAs are absent or have the same diversities as DAs (Figs 8 and 9). Diversity diagrams of
sites in the B-transects show similar configurations at 15 m comparable to sites in the A-tran-
sects at 10 m, while diagrams in the A-transects at 15 m are devoid of living individuals and
high species richness combined with low heterogeneity in DAs (Fig 9). These characteristics
associated to a low density of foraminifera (Fig 3), particularly close to the Ria de Aveiro
mouth and in some places of the transepts B, indicate the occurrence of high environmental
disturbance.
This inner shelf area is affected by the deposition of sediments supplied from the mainland
to the oceanic system [99]. In the shallower zones, detrital particles and empty tests of
Living and dead foraminiferal assemblages at the Aveiro Continental Shelf (Portugal)
PLOS ONE | https://doi.org/10.1371/journal.pone.0209066 January 30, 2019 34 / 47

foraminifera should be resuspended by waves and transported by coastal drift currents parallel
to the coastline. Moreover, the shallowest stations of A-transects located up to 30 m may be
affected by the deposition of sediments associated with the ebb tide delta of the Ria de Aveiro,
where sediments resulting from the lagoon and the coastal drift are deposited [100]. The influ-
ence of this sedimentary structure should be extended until 25/30 m deep in front of the Ria de
Aveiro mouth [100].
The dynamic of other morphological features common in the region, such as the longshore
bars that are elongated and sub-parallel to the coast-line and correspond to important accumu-
lation of sediments [101] also may affect the dimension and structure of the living benthic
communities and the preservation of dead ones. The magnitude and dynamics of these struc-
tures depend on meteorological and hydrodynamic conditions and the oceanographic regime
[101]. They may affect the stability of the sediment generating unfavorable environments for
the establishment of LAs and contributes to the burial and destruction of empty tests. As
observed by Dimiza et al. [22], the prevailing environmental conditions, such as hydrodynam-
ics, vegetation cover and fresh water influx, may have strong impact on the taphonomic
processes.
In the northern PCS, the theoretical evaluation of the remobilizer and transporter potential
of waves and currents was carried out for instance by [49,52,101–103]. According to these
authors, the wave actions are one of the main, if not unique, mechanisms with the ability to
remobilize particles, with currents acting as transport engines for particles suspended by the
waves. During periods of stormy weather, the silt and very fine to fine sand deposited at the
continental shelf bottom are remobilized with frequencies that decrease as the depth increases
[49,52,101–103]. Thus, in the shallower zone of ACS, the strong hydrodynamics, which cause
the frequent remobilization of sediments coupled with changes of physicochemical factors,
should prevent the development of large living benthic communities and the accumulation of
empty tests of dead foraminifera. The advective transport of materials from the Douro River
[104], the coastal erosion at north of the Aveiro parallel due to the longshore currents (coastal
drift) and the Ria de Aveiro contribution [49,100] may “dilute” and bury the empty tests of
foraminifera in the shallower zone of ACS. In the inner shelf, the sedimentary dynamic and
the hydrodynamics limit the accumulation of materials with low density (such as detritic and
biogenic particles as well as particulate organic matter), and both living and dead organisms
have therefore reduced abundance. According to Taborda [103] fine to very fine sands depos-
its of the inner continental shelf, up to 30 m depth, are commonly remobilized (40% of the
time over a year), with moderate to high agitation conditions that are the most conducive to
sediment transport. Therefore, sediment instability seems to be one of the most unfavorable
factors to the development of large living foraminiferal communities and the active sedimen-
tary processes seems to be unfavorable to the accumulation of tests after the organism’s death
in the inner shelf.
LAs and DAs at the mid/outer shelf. The comparison of the standing crops of LAs and
DAs (densities based on 10 cm3 sediment) through the Spearman rank distances show that the
values of this variable increase from shallower stations until 50 m where it reaches a maximum
(Fig 5) and where the IncorpVals are higher (Fig 6). Between�25–80 m depth (Fig 5), rank
distances increase as associated mostly to higher ‘Incorporation Values’ (Fig 6) and SimDivers’
between LAs and DAs. The coincidence of diversity diagrams in LAs and DAs (Figs 8 and 9) is
remarkable for sites located in all B-transects between 35 m and 60 m and in some sites of A-
transects (A3-5, A3-8) in the same depth range and some stations between 60 m to 80 m (B1-2,
B2-3 and B4-4). The SimDivers’ values reached maximum values (SimDivers = 65) at 1350 μm
and at 0.55% TOM. These results indicate that this zone is in general more favorable to the
establishment of large standing crops of LAs; living communities tend to be more diversified
Living and dead foraminiferal assemblages at the Aveiro Continental Shelf (Portugal)
PLOS ONE | https://doi.org/10.1371/journal.pone.0209066 January 30, 2019 35 / 47

contributing a larger number of empty tests to the sedimentary record, whose record seems to
be lost later.
Several sub-environments were identified in the mid to outer shelf region. For example, in
front of the lagoon mouth, in most of the stations of the transects A located between 20–60 m,
the “receiving>accordance” or “receiving�accordance” and the TOM contents reached values
>1.5%, indicating significant contribution of organic matter from the Ria de Aveiro to adja-
cent continental area. In this region between 20–40 m with relatively coarse sediments, an oxy-
philic LA tolerant to low salinities composed mostly by C. jeffreysii and several epifaunal
species such as D. parkeri, L. ochracea, R. anglica, R. plicata and Trochammina ssp. (Figs 12
and 17; Group 6) and between 40–60 m a LAs including mostly P. mediterranensis (the most
abundant, Fig 13E, in LA) and B. catanensis (Figs 12 and 17; Group 7) are found. The most
opportunistic species of the 20–40 m-LA seems to be C. jeffreysii and in the 40–60 m LAs
should be P. mediterranensis that may also be the ones that most contributes with tests to the
DAs. The IncorpVals in this region indicate that surface sediments have newly developed LAs
and constitute a very recent memory of the previous standing crop of LAs (DAs) still
unchanged (at least significantly) by the effects of sedimentary dynamics.
Another sub-environment identified in the mid to outer shelf region is characterized by the
rank distances between LAs and DAs with the highest degree of deviation for both assemblages
at SMGS of ~1600 μm (Fig 5). This region is essentially located between 40-60m, and both LAs
and DAs are characterized by the occurrence of species such as B. ordinaria, R. auberii (both
abundant) and G. gordialis (Figs 12 and 17; Group 8). Relatively high densities of living indi-
viduals are remarkable in transects A but also in transects B2 and B4 (Fig 3A; S3 Table), at the
region where the substrate is composed by gravel deposits (between 30 m and 50 m). Indeed,
in few stations (B4-2, B2-2, B2-3) of this sector, densities of living foraminifera reached higher
values than the dead ones. This zone is outside the influence of the strongest hydrodynamic
processes and active sediment dynamics of the inner shelf. The IncorpVals reach the highest
values indicative of a higher contribution of LAs standing crops to the DAs (Fig 6). The pro-
duction of tests seems to be highest mostly under the influence of the lagoon outflow (in sta-
tions of A-transects) where the “receiving” is higher than the “accordance” (Fig 6), but the
high production of tests by living organisms does not revert to a corresponding increase in
dead association in the mid shelf gravel deposits. In fact, the presence of gravely deposits at
mid ACS (30 m to 80 m depth) suggests that this region, out of the main influence of the along-
shore transport of sediments, probably receives a smaller contribution of fine-grained sedi-
ments from the coastal drift and is sufficiently hydrodynamic to prevent the accumulation of
silt and very fine to fine sand. On the other hand, the finer particles that are episodically depos-
ited at this depth, are easily resuspended by vortices generated by the bottom forms present in
these deposits or in the course of storms [49,52,101–103]. In this region, the DAs may be at
least partly removed by waves and transported to other areas by longshore, rip and tidal cur-
rents, though in quieter and more favorable periods, the area could be recolonized by living
organisms. Thus, the low densities of empty tests and relatively high densities of living organ-
isms found in some stations of the mid ACS (B4-2, B2-2, B2-3) indicate that these areas have
been recently affected by stronger hydrodynamic events, probably in the previous winter sea-
son, during which the oceanic hydrodynamism is in general more energetic at the Iberian
Margin. During winter, there are southwest storms that give rise to downwelling events favor-
ing the transport of material from shallower areas of the continental shelf to deeper zones
[99,105–109]. This process associated with tests dissolution/disintegration due to bioerosion
or other processes should explain the low density of DAs in the mid shelf gravel deposits. The
stronger hydrodynamic events that probably remove fine-grained sediments and foraminiferal
Living and dead foraminiferal assemblages at the Aveiro Continental Shelf (Portugal)
PLOS ONE | https://doi.org/10.1371/journal.pone.0209066 January 30, 2019 36 / 47

tests once succeeded by stable and suitable environmental conditions lead to the development
of large living foraminiferal communities.
The most abundant living species at the gravely deposits zone between 40–60 m, B. ordi-naria, R. auberii (both abundant) and G. gordialis, seems to have an opportunistic behavior.
After a period of disturbance caused by high hydrodynamism (in the winter time before the
sampling events), they were able to rapidly increase the standing crop taking advantage of the
occurrence of calmer conditions, high sediment stability and the presence of abundant food.
During the three months prior to the sampling and during the field works carried out in 1994
for sampling the stations of transects A, the upwelling index values for Vigo (42˚N, 9˚W; N
Spain) varied significantly (Fig 18). The sampling period was preceded by several strong
upwelling events and there was also an event during the field works.
Upwelling events at the Iberian margin trigger the increase of the oceanic productivity and
the development of the marine food chains [110–111]. Therefore, the relatively high abun-
dance of living foraminifera at stations between 20–80 m in A-transects should have been
favored by the flux of organic matter from oceanic productivity with high quality for benthic
organisms, following repeated and significant upwelling events, according to data presented
by Martins et al. [58] in addition to that supplied by the Aveiro Lagoon. In this sector, how-
ever, the values of TOM content are not the highest of the study area. The high densities of
benthic living foraminifera and probably of other organisms contribute for the declining of
TOM values due to an intense heterotrophic activity in addition to hydrodynamic conditions,
which avoid the accumulation of high amount of organic matter and fine-grained sediments at
these depths.
The “receiving” is higher than the “accordance” mostly in the area under the influence of
the lagoon outflow due to the opportunistic character of the foraminifera that inhabit the
region, which rapidly recovers when the environmental conditions are favorable, also taking
advantage of nutrients and organic matter provided by the lagoon to the oceanic system.
These results are quite interesting since they evidence that DAs at the time of the sampling are
quite different of the LAs, in this region. Bottom hydrodynamic conditions both in the present
and in the past, due to the Quaternary evolution of the western Iberian Margin [49,58], seem
to directly or indirectly influence the sediments grain-size and the similarity between LAs and
DAs densities of the gravel deposits of ACS. In fact, the mean density of living and dead indi-
viduals of the 35 most abundant species analyzed by CCA (Fig 12), evidences that the LAs at
0–20 m, 20–40 m and 40–60 m depths intervals are successively associated with coarser sedi-
ments while those that are found at depths of 60–100 m, 100–150 m and 150–200 m occur in
finer sediments. These results indicate that in ACS, the grain-size of the sediment itself is not a
conditioning factor for the development of large communities of living foraminifera, as was
also observed by Diz et al. [112] in the Ria de Vigo. Indeed, large and diversified LAs are found
at the region where the substrate is composed by gravel deposits in ACS.
LAs and DAs at the outer shelf and shelf break. The sedimentary coverture of the outer
continental shelf and shelf break consists mainly of medium to very fine sand [51]. However,
mostly in the southern sector, there is a well-defined zone of relic deposits possibly originated
during the last glaciation, under favorable paleoenvironmental conditions [113]. These relic
deposits are composed by coarse sand with significant amount of gravel particles essentially
with biogenic origin consisting of fragments of mollusk shells (fossils) and high abundance of
foraminiferal tests (a mixture of fossils and recent material [49,50,53]. The sand and gravel
fractions of this zone, have low occurrence of detrital grains and significant amount of glauco-
nite [53]. Thus, they have a quite different composition of the gravel deposits of the mid shelf
and also have in general smaller mean particle size.
Living and dead foraminiferal assemblages at the Aveiro Continental Shelf (Portugal)
PLOS ONE | https://doi.org/10.1371/journal.pone.0209066 January 30, 2019 37 / 47

The increase of dead foraminiferal density in deeper continental shelf zones as well as the
general increase of fine-grained sediment and TOM (Fig 3A–3C) should be related to the prev-
alence of relatively low hydrodynamic bottom activity. These relatively low hydrodynamic
conditions allow the deposition of fine materials with low density (detrital and particulate
OM) and the accumulation of empty tests of foraminifera. However, the sedimentation rate in
this region is low as indicate the presence of abundant authigenic glaucony grains in the
Fig 18. Daily upwelling index determined for Vigo (42˚N, 9˚W) for three months before and during the sampling events in: A. 1994
and; B. 1995. Legend: SE–sampling events of this work (reprinted from Martins et al. [58]).
https://doi.org/10.1371/journal.pone.0209066.g018
Living and dead foraminiferal assemblages at the Aveiro Continental Shelf (Portugal)
PLOS ONE | https://doi.org/10.1371/journal.pone.0209066 January 30, 2019 38 / 47

sediments of this area [53]. In fact, Martins et al. [114] based on 210Pb and 137Cs, estimated
sedimentation rates for the outer continental shelf at northern of this region in 0.28±0.02 cm
yr-1 and 0.29±0.02 cm yr-1, respectively. These values are similar to those obtained by Jouan-
neau et al. [115] at the NW Iberian continental shelf. Accordingly, the low supply of sediments
to the deeper continental shelf areas contributes to the “non-dilution” of empty foraminiferal
tests by terrigenous particles [49–52,56]. The pattern of reduction of sediment accumulation
rate with depth is however not constant. For instance, on the continental slope adjacent to the
Aveiro Canyon, Carvalho and Ramos [116] estimated at 2,800 m and 2,860 m depth, accumu-
lation rates of 0.48 g.cm-2.yr-1 and 0.1–0.2 g.cm-2.yr-1, respectively, which evidence the accu-
mulation of abundant material, most likely from the continental shelf break. Although data on
the sediment accumulation rate in the region are very scarce for a detailed analysis, the pres-
ence of glaucony in the sediments of the outer shelf and shelf break indicates that the bottom
of this region receives high supply of organic matter and low supply of terrigenous sediments
[49].
Rank distances reaches the highest values again in deeper stations of the outer continental
shelf where the IncorpVals decrease to zero (Fig 5). The SimDivers also drop to zero at deeper
stations, where living individuals are rare or absent (Fig 7A and 7B). Despite the relatively high
TOM contents (1.5–4.5%), in these stations, only a very small number of living organisms are
found (Fig 3B).
The plots of Beta diversity comparing LAs and DAs of transect sites evidence that the turn-
over rates in species number (0D) and the turnover in number of dominant species (1D) pres-
ent the same trend of increase with depth (Fig 11A and 11B). This turnover is not due to LAs
species or dominant species numbers, which decrease with depth (Fig 11C and 11D) but is
determined by DAs, as indicated by plots of Beta diversity (Fig 11E and 11F). The results of the
nMDS based on the Diversity/Heterogeneity diagrams (Fig 10), clearly show that such varia-
tions occur as depth and TOM contents increase. In the outer continental shelf and shelf break
region, the accumulation and preservation of DAs seem to be better than in other sectors of
ACS. Thus, considering the negative correlation between TOM and density as well as the
reduced diversity in LAs at deeper stations (80–200 m) of transects B1, B2 and B3 and the
opportunistic behavior of many foraminiferal species in DAs, such as U. peregrina, B. spathu-lata, B. marginata, H. boueana, B. striatula, B. striata, B. dilatata and N. fabum (Group 2 in the
CCA Fig 12) and B. difformis, C. laevigata, G. subglobosa, G. minuta, F. orbignyana and T.
sagittula (Group 3 in the CCA, Fig 12), can be deduced that a record of past standing crops of
benthic foraminifera was basically found in this region. Increase of DAs densities (Fig 3B) in
the outer shelf and shelf break was therefore related to a memory of past standing crops of liv-
ing benthic foraminifera. Most of these species are indicative of high oceanic productivity
related to the upwelling events in the Iberian margin [56].
The export flux of particulate organic carbon (POC) is seasonally and spatially quite vari-
able at the Iberian Basin [117]. Variations between 16–210 mmol C m-2 d-1 of POC were
observed, with the highest values recorded during significant bloom events of diatoms and
coccolithophores [118]. Temporal variations were also documented in the time-series of phy-
toplankton community composition [118]. Elevated fluxes of POC are, in general, observed in
summer and low and sporadic fluxes in winter [119–120]. Differences in particle export are
significant. Summer is the most dynamic period when compared to winter [117] due to the
occurrence of upwelling events [26,38,121]. As described by Martins et al. [58], the upwelling
pattern in 1995 did not favor the supply of fresh organic matter to the deeper stations of the
study area during the sampling time. It is also possible that the vortices generated by the pres-
ence of rocky outcrops on the mid shelf [104,121] blocked the export and deposition of fresh
organic matter produced in shallower areas of the continental shelf to the outer sector, as well
Living and dead foraminiferal assemblages at the Aveiro Continental Shelf (Portugal)
PLOS ONE | https://doi.org/10.1371/journal.pone.0209066 January 30, 2019 39 / 47

as fine grained sediments. Considering these results, it can be hypothesized that the relatively
high levels of TOM in the outer continental shelf were related to degraded organic matter with
poor quality that conditioned the development of large LAs of benthic foraminifera in the
outer shelf and shelf break. So, the DAs in this region are simply more time-averaged and thus
include a higher beta diversity than LAs that instead are quite reduced.
The fidelity with which time-averaged DAs capture variation in species composition and
diversity partitioning of living communities remains a quite interesting issue that has been
studied and discussed by Tomasovych and Kidwell [4,122] for mollusks. Because foraminifera
have a short life cycle and some species are r-strategists and can increase greatly in number in
a short period of time, the rate of integration of living foraminifera tests in the DAs is expected
to be rapid. So, we may deduce that relatively stable and suitable physicochemical conditions
associated to the substrate stability and availability of food of high quality are more important
factors than a substrate composed by stable fine-grained sediment enriched in organic matter
of poor quality to promote the development of large LAs of benthic foraminifera. However,
the memory of the LAs can be lost by erosion, by tests degradation or other effects [123].
These effects in the mid shelf cause a temporal deviation between the LAs and DAs of forami-
nifera. This deviation is much more pronounced in the inner shelf where the energy of the
waves and the currents induce very dynamic sedimentary processes. Thus, it can be considered
that in the studied area the best registry of time-averaged DAs can be found in the outer conti-
nental shelf.
Conclusion
The innovative statistical methods presented in this work allowed us to compare LAs and DAs.
Results evidence that in most of the stations, the density of DAs is higher than the LAs. Densities
of DAs increase, in general, towards the deeper continental shelf zones correlated with an
increase in fine-grained sediment and TOM due to reduced removal of foraminiferal tests by
hydrodynamic activity and low ‘dilution’ of tests by terrigenous inputs at these depths. The
intense processes of sedimentary dynamic and the instability of physicochemical parameters are
other unfavorable factors for the development of large living foraminiferal communities in the
shallower sector of ACS. In this study, the low density of living foraminifera is found in shal-
lower stations under the influence of the continental drift, due to sediments instability, and in
the stations of the outer continental shelf and shelf break probably because of the lack of food
quality, conditioned by the occurrence of weak upwelling events during months preceding the
sampling campaigns. Densities of LAs are higher between 30 and 50 m at the gravel deposits of
the mid shelf. The nMDS results suggest that the LAs and DAs diversity and heterogeneity are
similar and almost coincident in coarse grain size sediments of the mid shelf. The stability of the
substrate coupled with availability of organic matter from marine productivity and supplied by
the Aveiro Lagoon, allow the development of large LAs in this region. However, in some sta-
tions a significant loss of DAs in the sedimentary record is observed that might be ascribed to
remobilization, transport and dispersion of tests by hydrodynamic forces. With increase of
TOM and depth, DAs exhibit high species richness with small variation in heterogeneities,
whereas the LAs show reduced diversity and increased heterogeneity as the density of the speci-
mens drops to zero. The upwelling pattern does not favor the development of the LAs of forami-
nifera in the deeper areas of the PCA, despite the increase in the amount of TOM, probably
because of its poor quality. The DAs and LAs of benthic foraminifera are quite different in the
ACS induced by oceanographic processes including sedimentary dynamics and productivity
caused by upwelling and the Aveiro lagoon outflow; however, the region that seems to best pre-
serve the memory of past standing crops of LAs is the outer continental shelf.
Living and dead foraminiferal assemblages at the Aveiro Continental Shelf (Portugal)
PLOS ONE | https://doi.org/10.1371/journal.pone.0209066 January 30, 2019 40 / 47

Supporting information
S1 Table. Samples location. Total Organic Matter (%: TOM) and Sediments Granulometry
Description. Legend: SMGS—Sediment Mean Grain size. Data from Martins et al. [58].
(XLSX)
S2 Table. Density of living and dead foraminifera (n˚ / 10 cm3 of sediment) in the studied
samples (SM 1).
(XLSX)
S3 Table. Environmental variables and assemblage indices of the transect sites. Chao1 and
Evenness in standardized form.
(TIF)
S4 Table. Beta diversities expressed in Hill numbers between living and dead assemblages
and between succeeding transect sites regarding living and dead assemblages separately.
(TIF)
S1 Fig. Vertical profile of the water column at the stations of transept B 2. of water column: A.
temperature (˚C); B. salinity and; C. density. Reprinted from Martins et al. [58].
(DOCX)
Acknowledgments
The authors warmly thank Tzen-Yuh Chiang, the Academic Editor, and three anonymous
reviewers for their suggestions and comments that have greatly improved this paper. The
authors also express their gratitude to the crew of the RV ’Cote d’Aquitaine’ and to all the par-
ticipants in the cruises for their helpful assistance. The first author also would like to thank
Professor Cristina Carapito Krausshar for her remarkable support.
Author Contributions
Conceptualization: Maria Virgınia Alves Martins.
Data curation: Maria Virgınia Alves Martins.
Formal analysis: Maria Virgınia Alves Martins, Johann Hohenegger.
Funding acquisition: Fernando Rocha.
Investigation: Maria Virgınia Alves Martins, Johann Hohenegger.
Methodology: Maria Virgınia Alves Martins, Johann Hohenegger.
Supervision: João Manuel Alveirinho Dias.
Validation: João Manuel Alveirinho Dias, Fernando Rocha.
Writing – original draft: Maria Virgınia Alves Martins, Johann Hohenegger, Fabrizio
Frontalini.
Writing – review & editing: Maria Virgınia Alves Martins, Johann Hohenegger, Fabrizio
Frontalini, Mauro Cesar Geraldes.
References1. Kidwell SM. Discordance between living and death assemblages as evidence for anthropogenic eco-
logical change. PNAS. 2007; 104: 17701–17706. https://doi.org/10.1073/pnas.0707194104 PMID:
17965231
Living and dead foraminiferal assemblages at the Aveiro Continental Shelf (Portugal)
PLOS ONE | https://doi.org/10.1371/journal.pone.0209066 January 30, 2019 41 / 47
2. Kidwell SM. Biology in the Anthropocene: Challenges and insights from young fossil records. PNAS.
2013; 112: 4922–4929.
3. Kidwell SM. Ecological fidelity of open marine molluscan death assemblages: effects of post-mortem
transportation, shelf health, and taphonomic inertia. Lethaia. 2008; 41: 199–217.
4. Tomasovych A, Kidwell SM. Fidelity of variation in species composition and diversity partitioning by
death assemblages: time-averaging transfers diversity from beta to alpha levels. Paleobiology. 2009;
35(1): 94–118. https://doi.org/10.1666/08024.1
5. Martins MVA, Hohenegger J, Frontalini F, Miranda P, Rodrigues MAC, Dias JMA. Comparison
between the dead and living benthic foraminiferal assemblages in Aveiro Lagoon (Portugal). Palaeo-
geogr Palaeoclimatol Palaeoecol. 2016; 455: 16–32. https://doi.org/10.1016/j.palaeo.2016.05.003
6. Martins MVA, Soares-Gomes A., Yamashita C., Pinto A.F.S., Frontalini F., Sequeira C. et al. Similarity
between the dead and living foraminiferal assemblages of the NE sector of Guanabara Bay (Brazil). J.
Sedimentary Environments, 2016; 1(4): 411–431. https://doi.org/10.12957/jse.2016.26875
7. Kidwell SM, Tomasovych A. Implications of time-averaged death assemblages for ecology and con-
servation biology. Annu. Rev. Ecol. Evol. Syst. 2013; 44: 539–563.
8. Mendes I, Gonzalez R, Dias JMA, Lobo F, Martins V. Factors influencing recent benthic foraminifera
distribution on the Guadiana shelf (Southwestern Iberia). Mar. Micropaleonto. 2004; 51: 171–192.
9. Mendes I, Dias JA, Schonfeld J, Ferreira O. Distribution of living benthic foraminifera on the northern
Gulf of Cadiz continental shelf. J. Foramin. Res. 2012; 42:18–38.
10. Dijkstra N, Junttila J, Skirbekk K, Carroll J, Husum K, Hald M. Benthic foraminifera as bio-indicators of
chemical and physical stressors in Hammerfest harbor (Northern Norway). Mar Pollut Bull., 2017;
114: 384–396. https://doi.org/10.1016/j.marpolbul.2016.09.053 PMID: 27697319
11. Debenay J-P, Tsakiridis E, Soulard R, Grossel H. Factors determining the distribution of foraminiferal
assemblages in Port Joinville Harbor (Ile d’Yeu, France): the influence of pollution. Mar Micropaleonto.
2001; 43 (1–2): 75–118. https://doi.org/10.1016/S0377-8398(01)00023-8
12. Frontalini F, Coccioni R. Benthic foraminifera for heavy metal pollution monitoring: a case study from
the central Adriatic Sea coast of Italy. Estuar. Coast. Shelf S. 2008; 76: 404–417. https://doi.org/10.
1016/j.ecss.2007.07.024
13. Caruso A, Cosentino C, Tranchina L, Brai M. Response of benthic foraminifera to heavy metal contam-
ination in marine sediments (Sicilian coasts, Mediterranean Sea). Chem Biol 2011; 27: 9–30. https://
doi.org/10.1080/02757540.2010.529076
14. Schonfeld J, Alve E, Geslin E, Jorissen F, Korsun S, Spezzaferri S, et al. The FOBIMO (FOraminiferal
Bio-MOnitoring) initiative–towards a formalised protocol for benthic foraminiferal monitoring studies.
Mar. Micropaleonto. 2012; 94–95: 1–13. https://doi.org/10.1016/j.marmicro.2012.06.001 ISSN: 0377-
8398
15. Martins VA, Frontalini F, Tramonte KM, Figueira RCL, Miranda P, Sequeira C, et al. Assessment of
the health quality of Ria de Aveiro (Portugal): heavy metals and benthic foraminifera. Mar. Pollut. Bull.
2013; 70: 18–33. https://doi.org/10.1016/j.marpolbul.2013.02.003 PMID: 23582314
16. Martins MVA, Zaaboub N, Aleya L, Frontalini F, Pereira E, Miranda P et al. Environmental quality
assessment of Bizerte Lagoon (Tunisia) using living foraminifera assemblages and a multiproxy
approach. PLoS ONE. 2015. https://doi.org/10.1371/journal.pone.0137250 PMID: 26372655
17. Martins MVA, Hohenegger J, Frontalini F, Miranda P, Rodrigues MAC, Dias JMA. Comparison
between the dead and living benthic foraminiferal assemblages in Aveiro Lagoon (Portugal). Palaeo-
geogr Palaeoclimatol Palaeoecol. 2016; 455: 16–32. https://doi.org/10.1016/j.palaeo.2016.05.003
18. Martins MVA, Helali MA, Zaaboub N, BenOmrane IB, Frontalini F, Reis D et al. Organic matter quantity
and quality, metals availability and foraminifera assemblages as environmental proxy applied to the
Bizerte Lagoon (Tunisia). Mar. Pollut. Bull. 2016. 105: 161–179. https://doi.org/10.1016/j.marpolbul.
2016.02.032 PMID: 26922361
19. Li Z-Y, Liu D-S, Long H-Y. Living and dead benthic foraminifera assemblages in the Bohai and north-
ern Yellow Seas: Seasonal distributions and paleoenvironmental implications. Quat. Int. 2014; 349:
113–126.
20. Goineau A, Fontanier C, Mojtahid M, Fanget A-S, Bassetti AM-A, Berne S, et al. Live–dead compari-
son of benthic foraminiferal faunas from the Rhone prodelta (Gulf of Lions, NW Mediterranean): Devel-
opment of a proxy for palaeoenvironmental reconstructions. Mar. Micropaleonto. 2015; 119: 17–33.
21. Hohenegger J, Martins MVA, Frontalini F. Methods relieving comparison of living and dead assem-
blages. Micropaleontology. 2018; 64: 255–267.
22. Dimiza MD, Koukousioura O, Triantaphyllou MV, Dermitzakis MD. Live and dead benthic foraminiferal
assemblages from coastal environmentsof the Aegean Sea (Greece): Distribution and diversity. Rev.
Micropal. 2016; 59: 19–32. https://doi.org/10.1016/j.revmic.2015.10.002
Living and dead foraminiferal assemblages at the Aveiro Continental Shelf (Portugal)
PLOS ONE | https://doi.org/10.1371/journal.pone.0209066 January 30, 2019 42 / 47

23. Buzas MA, Hayek L-AC, Reed SA, Jett JA. Foraminiferal densities over five years in the Indian River
Lagoon, Florida: A Model of pulsating patches. J. Foramin. Res. 2002; 32(1): 68–92. https://doi.org/
10.2113/0320068
24. Schonfeld J, Alve E, Geslin E, Jorissen F, Korsun S, Spezzaferri S, et al. The FOBIMO (FOraminiferal
Bio-MOnitoring) initiative–towards a formalised protocol for benthic foraminiferal monitoring studies.
Mar. Micropaleonto. 2012; 94– 95: 1–13. https://doi.org/10.1016/j.marmicro.2012.06.001 ISSN: 0377-
8398
25. Ribeiro A, Cabral J, Silveira A, Moniz C, Silva L, Silva, R. Relatorio de execucão do projecto SMCOI.
1988. 44 pp. (not published).
26. Fiuza AF, Macedo ME, Guerreiro MR. Climatological space and time variation of the Portugal coastal
upwelling. Oceanol. Acta. 1982; 5 (1): 31–40.
27. Carvalho RAC, Prior VMS, Lamelas H. Vento forte nas regiões costeiras de Portugal: frequência, dur-
acão e suas causas. Comunicacão apresentada ao Seminario: A zona costeira e os problemas
ambientais. EUROCAST. Universidade de Aveiro. 1991. pp. 184–210.
28. Fiuza AF. Hidrologia e dinamica das aguas costeiras de Portugal. PhD Thesis, Universidade de Lis-
boa. 1984. 294 pp. (not published).
29. McCartney MS, Talley LD. The subpolar mode water of the North Atlantic Ocean. J. Phys. Oceanogr.
1982; 12: 1169–1188.
30. Frouin R, Fiuza AF, Ambar I, Boyd TJ. Observations of a poleward surface current off the coasts of
Portugal and Spain during winter. J. Geophys. Res. 1990; 5: 679–691.
31. Haynes R, Barton ED. A poleward flow along the Atlantic coast of the Iberian Peninsula. J. Geophys.
Res., 1990; 95: 11425–11441.
32. Maze JP, Arhan M, Mercier H. Volume budget of the eastern boundary layer off the Iberian Peninsula.
Deep-Sea Res. I. 1997; 44: 1543–1574.
33. Huthnance JM, van Aken HM, White M, Barton ED, Le Cann B, Ferreira Coelho E, et al. Ocean margin
exchange-water flux estimates. J. Marine Syst. 2002; 32: 107–137.
34. Wooster WS, Bakun A, McLain DR. The seasonal upwelling cycle along the eastern boundary of the
North Atlantic. J. Marine Res. 1976; 34: 131–141.
35. Fraga F. Upwelling off the Galician coast, northwest Spain. In: Richards FA (Ed), Coastal Upwelling.
American Geophysical Union, Washington D. C., USA. 1981. pp. 176–182.
36. Fiuza AF. Upwelling patterns of Portugal. In: Suess E. and Thiede J (Eds), Coastal upwelling, its sedi-
mentary record. Part A. Responses of the sedimentary regime to present coast upwelling. Plenum
Press, New York, 1983. pp. 85–98.
37. Vitorino JPN. Circulacão residual ao largo da costa NW de Portugal durante a estacão de afloramento
de 1987. Anais Inst. Hidrog. 1989; 10: 25–37.
38. Haynes R, Barton ED, Pilling I. Development, persistence and variability of upwelling filaments off the
Atlantic coast of Iberian Peninsula. J. Geophys. Res. 1993; 98, 22681–22692.
39. Mougenot D, Vanney JR. Geomorphologie et profils de reflexion sismique: interpretation des surfaces
remarquables d’une plate-forme continentale. Ann. Inst. Oceanogr., Masson, Paris. 1980; 56: 85–
100.
40. Vanney JR, Mougenot D. La plateforme continentale du Portugal et les provinces adjacentes: analyse
geomorphologique. Mem. Serv. Geol. Portugal, 1981; 28: 145 pp.
41. Vanney JR, Mougenot D. Un canyon sous-marin du type Gouf: le canhão da Nazare (Portugal). Ocea-
nologica Acta, 1990; 13(1): 1–14.
42. Pereira AR. A geomorfologia da margem continental portuguesa e a interdependência das platafor-
mas continental e litoral: evolucão do conhecimento e linhas de investigacão. Centro de Estudos Geo-
graficos, Linha de Accão de Geografia Fısica, Lisboa, Rel. 1992; 30: 85 pp.
43. Rodrigues ACC. Tectono-Estratigrafia da Plataforma Continental Setentrional Portuguesa. PhD The-
sis, Universidade de Lisboa. 2001. 244 pp. (not published).
44. Dias JMA, Gaspar LC, Monteiro JH. Sedimentos recentes da plataforma continental portuguesa a
norte do canhão submarino da Nazare. Bol. Soc. Geol. Port. 1980/81; 22: 181–185.
45. Monteiro JH, Dias JMA, Gaspar LC, Possolo AM. Recent marine sediments of the Portuguese conti-
nental shelf. Actual problems of oceanography in Portugal, JNICT. 1982. pp. 89–96.
46. Dias JMA. Erosão versus deposicão na plataforma continental portuguesa a norte do canhão da
Nazare. Bol. Soc. Geol. Port. 1983; XXIV: 31–36.
47. Dias JMA, Nittrouer CA. Continental shelf sediments of northern Portugal. Cont. Shelf Res. 1984; 3
(2): 147–165.
Living and dead foraminiferal assemblages at the Aveiro Continental Shelf (Portugal)
PLOS ONE | https://doi.org/10.1371/journal.pone.0209066 January 30, 2019 43 / 47

48. Dias JMA. Registos da migracão da linha de costa nos ultimos 18000 anos na plataforma continental
portuguesa setentrional. 1ª Reunião do Quaternario Iberico, I, 281–285. 1985.
49. Dias JMA. Dinamica sedimentar e evolucão recente da plataforma continental portuguesa setentrio-
nal. PhD Thesis, Universidade de. Lisboa. 1987. 500 pp. (not published).
50. Abrantes MIRR. A cobertura sedimentar da plataforma e da vertente continental superior entre
Espinho e Aveiro. MsD Thesis, Universidade de Aveiro (Portugal), 1994. 178 pp. (not published).
51. Abrantes I, Magalhães F, Dias JMA. Characterisation of the surface sediments of the continental shelf
and upper slope between Espinho and Aveiro. Gaia, 1994; 8:97–104.
52. Magalhães F. Os sedimentos da plataforma continental portuguesa: contrastes espaciais, perspectiva
temporal, potencialidades economicas. PhD Thesis, Universidade de Lisboa. 1999. 289 pp. (not
published).
53. Martins V, Abrantes I, Grangeia C, Paula M, Nagai R, Sousa SHM, et al. Records of sedimentar
dynamics in the continental shelf and upper slope between Aveiro-Espinho (N Portugal). J. Marine
Syst. 2012; 96: 48–60. https://doi.org/10.1016/j.jmarsys.2012.02.001
54. Martins MVA, Quintino V, Tentugal RM, Frontalini F, Miranda P, Laut LLM et al. Characterization of
bottom hydrodynamic conditions on the central western Portuguese continental shelf based on benthic
foraminifera and sedimentary parameters. Mar Environ Res. 2015; 109: 52–68. https://doi.org/10.
1016/j.marenvres.2015.06.006 PMID: 26102267
55. Levy A, Mathieu R, Poignant A, Rosset-Moulinier M, Ubaldo ML, Ambroise D. Recent foraminifera
from the continental margin of Portugal. Micropaleontology. 1993; 39: 75–87.
56. Levy A, Mathieu R, Poignant A, Rosset-Moulinier M, Ubaldo ML, Lebreiro S. Foraminiferes actuels de
la Marge Continentale Portuguaise-inventaire et distribution. Memorias do Instituto Geologico e Mine-
iro, Lisboa. 1995; 32: 116 pp.
57. Dessandier P-A, Bonnin J, Kim J-H, Racine C. Comparison of living and dead benthic foraminifera on
the Portuguese margin: Understanding the taphonomical processes. Marine Micropaleontology. 2018;
140: 1–16. https://doi.org/10.1016/j.marmicro.2018.01.001
58. Martins MVA, Moreno JC, Miller PI, Miranda P, Laut L, Pinheiro AEP, et al. Biocenoses of benthic fora-
minifera of the Aveiro Continental Shelf (Portugal): influence of the upwelling events and other shelf
processes. J. Sedimentary Environments. 2017; 2 (1): 9–34. https://doi.org/10.12957/jse.2017.28041
59. Folk RL, Ward WC. Brazos River bar: a study in the significance of grain size parameters. J Sediment
Petrol. 1957; 27: 3–26.
60. Rodrigues A, Quintino V. Horizontal biosedimentary gradients across the Sado estuary, W. Portugal.
Aquatic Ecology. 1993; 27(2), 449–464. https://doi.org/10.1007/BF02334806
61. Orloci L. Geometric models in ecology. I. The theory and application of some ordination methods. J.
Ecology. 1966; 54: 193–215.
62. Spearman C. The proof and measurement of association between two things. American J. Psychol-
ogy. 1904; 15: 72–101.
63. Whittaker RH. Vegetation of the Siskiyou Mountains, Oregon and California. Ecological Monographs,
1960; 30: 279–338.
64. Whittaker RH. Evolution and Measurement of Species Diversity. Taxon. 1972; 21:213–251.
65. Chao A. Nonparametric estimation of the number of classes in a population. Scandinavian J. Statistics.
1984; 11: 265–270.
66. Buzas MA, Gibson TG. Species diversity: benthonic foraminifera in western North Atlantic. Science.
1969; 163 (3862): 72–75. https://doi.org/10.1126/science.163.3862.72 PMID: 17780177
67. Jost L, Chao A, Chazdon RL. Compositional similarity and β (beta) diversity. In: Magurran AE, McGill
BJ, editors. Biological Diversity. Oxford: Oxford University Press. 2011; pp. 66–84.
68. Tuomisto H. A diversity of beta diversities: straightening up a concept gone awry. Part 1. Defining beta
diversity as a function of alpha and gamma diversity. Ecography 2010; 33: 2–22. https://doi.org/10.
1111/j.1600-0587.2009.05880.x
69. Hill MO. Diversity and evenness: a unifying notation and its consequences. Ecology, 1973; 54; 427–
432.
70. Jost L. Partitioning diversity into independent alpha and beta components. Ecology. 2007; 88: 2427–
2439. PMID: 18027744
71. Magurran AE, McGill BJ. Biological Diversity. Oxford: Oxford University Press. 2011.
72. Murray JW. Ecology and Palaeoecology of Benthic Foraminifera. London, Longman Scientific and
Technical, 1991. 397 pp.
Living and dead foraminiferal assemblages at the Aveiro Continental Shelf (Portugal)
PLOS ONE | https://doi.org/10.1371/journal.pone.0209066 January 30, 2019 44 / 47

73. Murray JW. Ecology and Applications of Benthic Foraminifera. Cambridge University Press, New
York, Melbourne. 2006. xi + 426 pp.
74. Altenbach AV, Pflaumann U, Schiebel R, Thies A, Timm S, Trauth M. Scaling percentages and distri-
butional patterns of benthic foraminifera with flux rates of organic carbon. J. Foramin. Res. 1999; 29
(3): 173–185.
75. Altenbach AV. Deep Sea benthic foraminifera and flux rate of organic carbon. Rev Paleobio. 1988;
spec. vol. 2: 719–720.
76. Debenay J-P, Konate S. Les Foraminifères actuels des iles de Los (Guinee). Premier inventaire, com-
paraison avec les microfaunes voisines. Rev. Paleobio. 1987; 6: 213–227.
77. Ernst SR. An experimental study on the proxy value of benthic foraminifera. The impact of physical dis-
turbance, oxygen depletion and organic flux. Geol. Ultraiectina. 2002; 220, 157 pp.
78. van der Zwaan GJ, Jorissen FJ. Biofacial patterns in river-induced shelf anoxia. In: Tyson R.V, Pear-
son T.H. (eds.), Modern and Ancient Continental Shelf Anoxia. Geol. Soc. London Spec. Publ., 1991;
58: 65–82.
79. Sen Gupta BK, Machain-Castillo ML. Benthic foraminifera in oxygen-poor habitats. Mar Micropa-
leonto. 1993; 20: 183–201.
80. Sgarrella F, Moncharmont Zei M. Benthic Foraminifera of the Gulf of Naples (Italy): systematics and
autoecology. Bollettino della Società Paleontologica Italiana, 1993; 32(2): 145–264.
81. Parker FL. Eastern Mediterranean foraminifera. Reports of the Swedish Deep-Sea Expedition. Vol.
VIII: Sediment cores from the Mediterranean and the Red Sea. 1958; 4: 219–283.
82. van der Zwaan GJ. Paleoecology of Late Miocene foraminifera. Utrecht Micropaleontology Bulletin.
1982; 25: 201 pp.
83. Stigter HC, Jorissen EJ, van der Zwaan VD. Bathymetric distribution and microhabitat partionating of
live (Rose Bengal Stained) benthic foraminifera along a shelf to bathial transect in the southern Adriatic
Sea. J Foramin Res. 1998; 28(1): 40–65.
84. Alavi SN. Late Holocene deep-sea benthic foraminifera from Sea of Marmara. Mar Micropaleonto.
1988; 13: 213–237.
85. Gooday AJ, Levin LA, Linke P, Heeger T. The role of benthic foraminifera in deep-sea food webs and
carbon cycling, in deep sea food chains and the global carbon cycle. In: Rowe GT, Pariente V (Eds.),
Deep-Sea Food Chains and the Global Carbon Cycle, Nato ASI series C, 360, Kluwer Academic Pub-
lishers, Dordrecht, 1992. pp. 63–91.
86. Gooday AJ. Deep-sea benthic foraminiferal species which exploit phytodetritus: characteristic features
and controls on distribution. Mar Micropaleonto., 1993; 22: 189–205.
87. Corliss BH. Microhabitats of benthic foraminifera within deep-sea sediments. Nature. 1985; 314: 435–
438.
88. Corliss BH, Chen C. Morphotype patterns of Norwegian Sea deep-sea benthic foraminifera and eco-
logical implications. Geology. 1988; 16: 716–719.
89. Samir AM. The response of benthic foraminifera and ostracods to various pollution sources: a study
from two lagoons in Egypt. J. Foramin. Res. 2000; 30:83–98.
90. Debenay J-P. Recent foraminiferal assemblages and their distribuition relative to environmental stress
in the paralic environments of West Africa (Cape Timiris to Ebrie Lagoon). J. Foramin. Res. 1990; 20
(3): 267–282.
91. Debenay J-P, Basov I. Distribution of recent benthic foraminifera on the West African shelf and slope.
A synthesis. Rev Paleobio. 1993; 12 (1): 265–300.
92. Hayward BW. Estuarine foraminifera, Helena Bay, Northland, New Zealand. Tane, 1993; 34: 79–88.
93. Hayward BW, Triggs CM. Computer analysis of benthic foraminiferal associations in a tidal New Zea-
land inlet. J. Micropalaeontol. 1994; 13: 103–117.
94. Boltovskoy E. Los Foraminiferos del Estuario de Rio de la Plata y su zona de influencia. Revista del
Instituto Nacional de Investigacion de las Ciencias Naturales y Museu Argentino de Ciencias Natur-
ales “Bernardino Rivadavia, Ciencias Geologicas. 1957; 6 (1): 1–77, 10 pls.
95. Murray JW. An atlas of British recent foraminiferids. Heinemann Educational Books, London, 244 p.,
96 pl. 1971.
96. Coppa MG, Di Tuoro A. Preliminary data on the Holocene Foraminifera of the Cilento continental shelf
(Tyrrhenian sea). Rev. Esp. Paleontol. 1995; 10 (2): 161–174.
97. Colom G. Foraminiferos Ibericos. Intruduccion al estudio de las especies bentonicas recientes. Inves-
tigacion Pesquera, Consejo Superior de Investigaciones Cientıficas. Patrono Juan de la Cierva, Bar-
celona. 1974; t. 38 (1): 245 pp., 3 tabls., 69 figs.
Living and dead foraminiferal assemblages at the Aveiro Continental Shelf (Portugal)
PLOS ONE | https://doi.org/10.1371/journal.pone.0209066 January 30, 2019 45 / 47

98. Fatela F. Les associations de foraminiferes benthiques de la plate-forme continentale nord Portugaise.
Memoire presentee a l’ Universite de Bordeaux I pour obtenir le Diplome d’Estudes Superieures de
Sciences en Oceanologie. 1989. 86 pp.
99. Dias JMA, Jouanneau JM, Gonzalez R, Araujo MF, Drago T, Garcia C, et al. Present day sedimentary
processes on the northern Iberian shelf. Prog. Oceanogr. 2002; 52 (2–4): 249–259.
100. Abrantes MIRR. Os sedimentos superficiais da margem continental, sector Espinho–Cabo Mondego:
a utilizacão das fraccões finas como tracadores de dinamica sedimentar actual. PhD Thesis, Universi-
dade de Aveiro (Portugal). 2005. 238 pp. + appendices (not published).
101. Ferreira O. Caracterizacão dos principais factores condicionantes da evolucão da linha de costa e do
balanco sedimentar entre Aveiro e o Cabo Mondego. MsD Thesis, Universidade de Lisboa, Lisboa,
1993. 168 p.
102. Taborda R, Dias JMA. Modelacão de processos da dinamica sedimentar na plataforma continental
portuguesa. Geonovas, 1992; 3: 117–139.
103. Taborda R. Modelacão da dinamica sedimentar na plataforma continental portuguesa. PhD Thesis,
Universidade de Lisboa, 366 pp. (not published). 1999.
104. Cascalho JP. Mineralogia dos sedimentos arenosos da Margem Continental Setentrional Portuguesa.
PhD Thesis, Faculdade de Ciências, Universidade de Lisboa. 2000. 400 pp.
105. Vitorino J, Oliveira A, Jouanneau JM, Drago T. Winter dynamics and the transport of fine sediments on
the northern Portuguese shelf. Third Symposium on the Iberian Atlantic Margin, Faro. 2000. pp. 279–
280.
106. Vitorino J, Oliveira A, Jouanneau JM, Drago T. Winter dynamics on the northern Portuguese shelf.
Part 2: bottom boundary layers and sediment dispersal. Prog. Oceanogr. 2002; 52 (2–4): 155–170.
107. Dias JMA, Gonzalez R, Garcia C, Diaz-del-Rio V. Sediment distribution patterns on the Galicia-Minho
continental shelf. Prog. Oceanogr. 2002; 52 (2–4): 215–231.
108. Oliveira A, Vitorino J, Rodrigues A, Jouanneau JM, Dias JA, Weber O. Nepheloid layer dynamics in
the northern Portuguese shelf. Prog. Oceanogr. 2002; 52 (2–4): 195–213.
109. Oliveira A, Rocha F, Rodrigues A, Jouanneau J, Dias A, Weber O et al. Clay minerals from the sedi-
mentary cover from the Northwest Iberian shelf. Prog. Oceanogr. 2002; 52 (2–4): 233–247.
110. Sanchez-Vidal A, Calafat A, Canals M, Fabres J. Particle fluxes in the Almeria-Oran front: control by
coastal upwelling and sea-surface circulation. J. Marine Syst. 2004; 52, 89–106. https://doi.org/10.
1016/j.jmarsys.2004.01.010
111. Lorenzo LM, Arbones B, Tilstone GH, Figueiras FG. Across-shelf variability of phytoplankton composi-
tion, photosynthetic parameters and primary production in the NW Iberian upwelling system. J. Marine
Syst. 2005; 54: 157–173. https://doi.org/10.1016/j.jmarsys.2004.07.010
112. Diz P, Frances G, Costas S, Souto C, Alejo I. Distribution of Benthic Foraminifera in Coarse Sedi-
ments, Rıa de Vigo, NW Iberian Margin. J. Foramin. Res. 2004; 34 (4): 258–275.
113. Dias JMA, Neal WJ. Sea cliff retreat in southern Portugal: profiles, processes and problems. J. Coastal
Res. 1992; 8 (3): 641–654.
114. Martins V, Figueira RCL, Franca EJ, Ferreira PAL, Martins P, Santos JF, et al. Sedimentary Processes
on the NW Iberian Continental Shelf since the Little Ice Age. Estuar. Coast. Shelf S. 2012; 102, 48–
59. https://doi.org/10.1016/j.ecss.2012.03.004, http://hdl.handle.net/10773/9013
115. Jouanneau JM, Weber O, Drago T, Rodrigues A, Oliveira A, Dias JMA, et al. Recent sedimentation
and sedimentary budgets on the western Iberian shelf. Prog. Oceanogr. 2002; 52 (2–4), 261–275.
116. Carvalho FP, Ramos LA. Lead 210 chronology in marine sediments fron the Northern continental mar-
gin of Portugal. 2˚ Congresso sobre a Qualidade do Ambiente. 1990; A143–A151.
117. Schmidt S, Chou L, Hall IR. Particle residence times in surface waters over the north-western Iberian
Margin: comparison of pre-upwelling and winter periods. J. Marine Syst. 2002; 32: 3–11.
118. Tang Y, Lemaitre N, Castrillejo M, Roca-Martı M, Pere Masque P, Stewart G. The export flux of partic-
ulate organic carbon derived from 210Po/210Pb disequilibria along the North Atlantic GEOTRACES
GA01 (GEOVIDE) transect. Biogeosciences Discuss. 2018. https://doi.org/10.5194/bg-2018-309
119. Antia A, Peinert R. Particle flux at the Iberian Margin. OMEXII-II Second Annual Science Report,
1999. 249–255.
120. Antia AN, Maaßen J, Herman P, Voß M, Scholten J, Groom S, et al. Spatial and temporal variability of
particle flux at the N.W. European continental margin. Deep-Sea Res. Pt. II. 2001; 48 (14–15): 3083–
3106.
121. Peliz A, Rosa TL, Miguel A, Santos P, Pissarra JL. Fronts, jets, and counter-flows in the Western Ibe-
rian upwelling system. J. Marine Syst. 2002; 35 (1–2): 61–77.
Living and dead foraminiferal assemblages at the Aveiro Continental Shelf (Portugal)
PLOS ONE | https://doi.org/10.1371/journal.pone.0209066 January 30, 2019 46 / 47

122. Tomasovych A, Kidwell SM. Effects of temporal scaling on species composition, diversity, and rank-
abundance distributions in benthic assemblages. Paleobiology. 2010; 36: 672–695.
123. Tomasovych A, Schlogl J, Kaufman DS, Hudačkova N. Temporal and bathymetric resolution of nauti-
loid death assemblages in stratigraphically condensed oozes (New Caledonia). Terra Nova. 2016.
https://doi.org/10.1111/ter.12218
Living and dead foraminiferal assemblages at the Aveiro Continental Shelf (Portugal)
PLOS ONE | https://doi.org/10.1371/journal.pone.0209066 January 30, 2019 47 / 47