the effects of cultural dissimilarity on employee job
TRANSCRIPT

Walden UniversityScholarWorks
Walden Dissertations and Doctoral Studies Walden Dissertations and Doctoral StudiesCollection
2018
The Effects of Cultural Dissimilarity on EmployeeJob Attitudes and ProductivitySherrice Olithia LyonsWalden University
Follow this and additional works at: https://scholarworks.waldenu.edu/dissertations
Part of the Organizational Behavior and Theory Commons, Quantitative Psychology Commons,and the Vocational Rehabilitation Counseling Commons
This Dissertation is brought to you for free and open access by the Walden Dissertations and Doctoral Studies Collection at ScholarWorks. It has beenaccepted for inclusion in Walden Dissertations and Doctoral Studies by an authorized administrator of ScholarWorks. For more information, pleasecontact [email protected].

Walden University
College of Social and Behavioral Sciences
This is to certify that the doctoral dissertation by
Sherrice Lyons
has been found to be complete and satisfactory in all respects,
and that any and all revisions required by
the review committee have been made.
Review Committee
Dr. James Herndon, Committee Chairperson, Psychology Faculty
Dr. Deborah Peck, Committee Member, Psychology Faculty
Dr. Kizzy Dominguez, University Reviewer, Psychology Faculty
Chief Academic Officer
Eric Riedel, Ph.D.
Walden University
2018

Abstract
The Effects of Cultural Dissimilarity on Employee Job Attitudes and Productivity
by
Sherrice Lyons
MBA, Northern Caribbean University, 2005
BSc, Northern Caribbean University, 2003
Dissertation Submitted in Partial Fulfillment
of the Requirements for the Degree of
Doctor of Philosophy
Industrial/Organizational Psychology
Walden University
May 2018

Abstract
Organizations in Jamaica have been impacted by globalization and the opportunities and
challenges of cultural incompatibilities. Most previous studies on cultural incompatibilities have
focused on the impact on expatriates leaving a gap in the literature with respect to the
implications for host country nationals, and specifically Jamaicans. This quantitative study
focused on employees of 2 companies in Jamaica, an energy company and a hospitality
company. It examined cultural dissimilarity with respect to host country nationals and
expatriates, and its effect on the productivity, job satisfaction, affective commitment, and
normative commitment of these employees (N = 110). In addition to the above variables, the
study also identified the role that gender, age, and tenure played in these relationships. Diversity
theory, social exchange theory, homophily, and repulsion hypothesis formed the theoretical
framework for this study, and multiple regression and correlation were utilized in the analysis of
the data collected. The results of the study indicated correlation and predictive relationships
between/among: culture and job satisfaction; age, gender, and experience in relation to job
satisfaction; age, gender, and experience in relation to affective commitment; and culture, age,
gender, and experience in relation to affective commitment. Social change implications for this
study include the development of country-specific culture awareness training programs for both
host country nationals and expatriates. It is further expected that the findings of this study will
increase knowledge on the subject and help in the development of human resource management
policies and procedures. These policies should aid in improved job attitudes and productivity for
host country nationals.
The Effects of Cultural Dissimilarity on Employee Job Attitudes and Productivity
by
Sherrice Lyons
MBA, Northern Caribbean University, 2005
BSc, Northern Caribbean University, 2003
Dissertation Submitted in Partial Fulfillment
of the Requirements for the Degree of
Doctor of Philosophy
Industrial/Organizational Psychology
Walden University
May 2018

Dedication
This study is dedicated to the Jamaican workforce as they continue the quest to remain
relevant and desirable within the current globalized working environment. No longer is the
workforce in any country, Jamaica included, restricted to the natives of the country, instead the
workplace has become a melting pot of cultures and ideas. Jamaican men and women have
historically been a force to reckon with, your dedication to worker’s rights has earned you the
enviable place of pioneers in the global labor market. I salute your commitment to quality and
dedicate this study to your strides - past, present, and future, in the labor market.

Acknowledgement
This study would not be possible without the cooperation, guidance, and forbearance of
several individuals and so I take the time to acknowledge their contribution to the process.
I must first acknowledge my immediate family, my husband Robert Lyons and my sons
Ravon and Rodney, for their tolerance during this process. I value your understanding and
recognize that your sacrifice during this journey has been tremendous as you accommodated my
altered attention to our usual family activities.
Dr. James Herndon has been a part of the journey from inception. His support has been
unwavering. He remained patient with me even at times when I felt exasperated. He shared his
knowledge willingly and provided well needed guidance and motivation. It was always
refreshing to know that he was genuinely committed to my success. Similarly, I would like to
thank Dr. Deborah Peck, my second committee member, and Dr. Kizzy Dominguez, my URR,
for their guidance, support and commitment during the process. I could not have made it without
your invaluable input.
To all my friends, cohort members, and above all, to the creator of all knowledge, the
supreme God, I am eternally grateful.

i
Table of Contents
List of Tables ...................................................................................................................................v
List of Figures ............................................................................................................................... vii
Chapter 1: Introduction to the Study ................................................................................................1
Introduction ......................................................................................................................................1
Background of the Study .................................................................................................................1
Problem Statement ...........................................................................................................................4
Purpose of the Study ........................................................................................................................6
Research Questions ..........................................................................................................................6
Theoretical Framework ....................................................................................................................9
Diversity Theory ......................................................................................................................10
Social Exchange Theory ..........................................................................................................10
Repulsion Hypothesis ....................................................................................................................10
Nature of the Study ........................................................................................................................11
Definitions......................................................................................................................................11
Assumptions ...................................................................................................................................12
Scope and Delimitations ................................................................................................................12
Limitations .....................................................................................................................................13
Significance of the Study ...............................................................................................................13
Chapter Summary ..........................................................................................................................14
Chapter 2: Literature Review .........................................................................................................16
Introduction ....................................................................................................................................16

ii
Literature Search Strategy..............................................................................................................16
Theoretical Framework ..................................................................................................................17
Diversity Theory ......................................................................................................................17
Social Exchange Theory ..........................................................................................................19
Repulsion Hypothesis and Homophily ....................................................................................20
Job Attitudes ..................................................................................................................................21
Age (Number of Years) .................................................................................................................24
Gender (Men and Women) ............................................................................................................26
Experience and Productivity ....................................................................................................27
Cultural Dissimilarity/Diversity.....................................................................................................28
Cultural Dissimilarity and Productivity .........................................................................................32
Summary and Conclusions ............................................................................................................34
Chapter 3: Research Method ..........................................................................................................35
Introduction ....................................................................................................................................35
Purpose of this Study .....................................................................................................................35
Research Design and Approach .....................................................................................................35
Settings and Sample .......................................................................................................................38
Participants ...............................................................................................................................38
Instrumentation ........................................................................................................................40
Analysis..........................................................................................................................................42
Ethical and Legal Considerations ..................................................................................................43
Summary and Conclusion ..............................................................................................................44

iii
Chapter 4: Data Analysis ...............................................................................................................45
Introduction ....................................................................................................................................45
Data Collection ..............................................................................................................................45
Sample Demographics .............................................................................................................45
Results ............................................................................................................................................47
Scale Demographics.................................................................................................................47
Research Question 1 ................................................................................................................56
Research Question 1, Hypothesis 1. ..................................................................................56
Research Question 1, Hypothesis 2. ..................................................................................59
Research Question 1, Hypothesis 3. ..................................................................................61
Research Question 2 ................................................................................................................63
Research Question 2, Hypothesis 1.. .................................................................................63
Research Question 2, Hypothesis 2. ..................................................................................68
Research Question 2, Hypothesis 3. ..................................................................................73
Research Question 3 ................................................................................................................74
Research Question 3, Hypothesis 1. ..................................................................................74
Research Question, 3 Hypothesis 2. ..................................................................................76
Research Question 3, Hypothesis 3. ..................................................................................81
Summary ........................................................................................................................................83
Chapter 5: Discussion of Findings .................................................................................................86
Introduction ....................................................................................................................................86
Interpretation of the Findings.........................................................................................................88

iv
Cultural Dissimilarity and Job Satisfaction .............................................................................88
Cultural Dissimilarity and Organizational Commitment .........................................................89
Gender, Age, Experience, and Job Satisfaction .......................................................................91
Gender, Age, Experience, and Organizational Commitment ..................................................91
Culture in Conjunction with Age, Gender and Experience, and Job Satisfaction ...................92
Culture in Conjunction with Age, Gender and Experience, and Normative and
Affective Commitment ................................................................................................93
Limitations of the Study.................................................................................................................95
Recommendations ..........................................................................................................................96
Implications....................................................................................................................................98
Conclusions ..................................................................................................................................100
References ....................................................................................................................................101
Appendix A: Survey Document ...................................................................................................116
Appendix B: Walden University IRB Approval ..........................................................................125

v
List of Tables
Table 1. Name of Organizations ....................................................................................................46
Table 2. Demographic Characteristics of Sampled Respondents, N = 110 ...................................47
Table 3. Recoded Scale Items ........................................................................................................48
Table 4. Scale Demographics ........................................................................................................48
Table 5. Descriptives: Job Satisfaction Scale ................................................................................49
Table 6. Descriptives: Normative and Affective Commitment .....................................................51
Table 7. Descriptives: Culture Novelty Scale ................................................................................54
Table 8. Descriptives: Productivity Scale ......................................................................................55
Table 9. Model Summaryb .............................................................................................................57
Table 10. ANOVA: Job Satisfaction .............................................................................................58
Table 11. Correlations: Job Satisfaction and Culture Novelty ......................................................59
Table 12. Model Summary: Affective Commitment .....................................................................60
Table 13. ANOVA: Affective Commitment ..................................................................................60
Table 14. Correlations: Culture Novelty and Affective Commitment ...........................................61
Table 15. Model Summaryb ...........................................................................................................62
Table 16. ANOVA: Culture and Normative Commitment ............................................................62
Table 17. Correlations: Culture and Normative Commitment.......................................................63
Table 18. Model Summary: Job Satisfaction .................................................................................64
Table 19. Anova: Job Satisfaction .................................................................................................64
Table 20. Coefficients: Job Satisfaction, Age, Number of Years Employed, Male ......................66
Table 21. Corre1ations: Job Satisfaction, Age, Number of Years Employed, Male .....................68

vi
Table 22. Model Summary: Affective Commitment, Male, Age, Number of Years Employed ...69
Table 23. ANOVA: Affective Commitment ..................................................................................69
Table 24. Coefficients: Affective Commitment.............................................................................71
Table 25. Correlations: Affective Commitment, Age, Number of Years Employed, Male ..........72
Table 26. Model Summary: Normative Commitment ...................................................................73
Table 27. ANOVA: Normative Commitment ................................................................................74
Table 28. Model Summary: Job Satisfaction .................................................................................75
Table 29. ANOVA: Job Satisfaction .............................................................................................75
Table 30. Model Summary: Affective Commitment .....................................................................76
Table 31. ANOVA: Affective Commitment ..................................................................................77
Table 32. Coefficients: Affective Commitment.............................................................................78
Table 33. Correlations: Affective Commitment, Age, Number of Years Employed, Male,
Culture Novelty .............................................................................................................80
Table 34. Model Summary: Normative Commitment ...................................................................82
Table 35. ANOVA: Normative Commitment ................................................................................83

vii
List of Figures
Figure 1. Histogram showing job satisfaction scale. .....................................................................50
Figure 2. Histogram showing affective commitment. ...................................................................52
Figure 3. Histogram showing normative commitment. .................................................................53
Figure 4. Histogram showing culture novelty scale.......................................................................54
Figure 5. Histogram showing productivity scale. ..........................................................................56
Figure 6. Normal P-P plot of regression standardized residual dependent variable:
Affective_Commityment. ......................................................................................................81

1
Chapter 1: Introduction to the Study
Introduction
The global movement of labor has become the norm as the labor market has
transcended national boundaries and morphed into a global market (Cerdin & Selmer, 2014;
Li, 2015). Today in Jamaica there are 5,451 expats working alongside 1,358,300 native
Jamaicans (Statistical Institute of Jamaica, 2017; Ministry of Labour and Social Security,
2017). The number of work permit requests and exemptions processed during the period
2016/2017, reflected an increase of 53.3% and 173.3% respectively. These figures are an
indication of the steady increases that have been taking place annually. The relevance of the
Jamaican motto, “Out of many one people,” is increasing daily as the effects of globalization
become more and more apparent.
Productivity is especially important to the survival of developing countries in their
quest to create a balance between their imports and exports, and their need to maintain a
favourable balance of payments and provide a reasonable standard of living for their
nationals. I designed this study with the expectation that organizations in Jamaica could use
its findings to develop cultural awareness training programs for both nationals and expatriates
workers. By identifying the challenges faced by host country nationals, findings from this
study can facilitate improved job attitudes and productivity.
Background of the Study
Guillaume, Van Knippenberg, and Broderick (2014) have defined cultural
dissimilarity as “an individual-level concept that captures the extent to which an individual is
different from other team members in terms of their cultural background” (p. 1286). Though
often deemed as desirable in light of its potential to increase innovation and its inevitability
due to globalization, cultural dissimilarity also has potential negative implications (Brunow

2
& Blien, 2014). These implications will vary based on the country under consideration and
its tolerance to cultural diversity (Bonache, Langinier, & Zárraga-Oberty, 2016).
Consequently, cultural dissimilarity/diversity in and of itself can best be described as
having an ambivalent nature (Guillaume, Van Knippenberg & Broderick, 2014). Chua
(2013) indicated that “cultural diversity is a seedbed for intercultural anxiety, tensions, and
conflicts because of differences in world-views, values, and norms” (p. 1547). Cultural
dissimilarities have been identified as the source of increased stress levels, reduced job
satisfaction, conflict, and increased industrial relations challenges (Cartwright & Cooper,
1993; Jung, 2017; Li, 2015; Nguyen, Kass, Mujtaba, & Tran, 2015). Additionally, there has
been evidence of a correlation between cultural dissimilarities and reduced staff morale
(Syed, Hazboun, & Murray, 2014, Toh & DeNisi, 2005). There is also empirical evidence to
support the notion that employee job attitudes, including job satisfaction and organizational
commitment, are inextricably linked to productivity, amicable interpersonal relationships,
and key performance indicators including productivity (Akintayo, 2012; Hitotsuyanagi-
Hansel, Froese, & Pak, 2016; Robertson, Birch, & Cooper, 2012). Cultural dissimilarity has
also been linked to increased staff turnover in organizations (Gonzalez 2016; Madera, King,
& Hebl, 2012; Ng & Tung, 1998; Pelled, 1996). While cultural diversity is not considered
negative, organizations must allocate adequate attention to its management to reduce its
potential negative effects.
The relationship between determinants of employee morale (including the various job
attitudes such as job satisfaction and organizational commitment) and productivity has been
the subject of several studies, including correlational ones (Akintayo, 2012; Fernandes,
Santos, Paulin, & Tibola, 2013; Robertson, Birch, & Cooper, 2012). Cartwright and Cooper
(1993) asserted that there is wide support for the notion that cultural incompatibility in

3
organizations results in increased levels of absenteeism, turnover, and stress among its
employees. Bergbom and Kinnunen (2014) provided empirical data to indicate that
psychological well-being and job satisfaction are negatively affected by cultural
incompatibility. Additionally, Toh and DeNisi (2005) showed a correlation between cultural
dissimilarities and reduced staff morale.
Researchers have also examined the challenges faced by expatriates during their
tenure, and have sought to identify solutions for these challenges to ensure success of the
expatriates and the companies (Howard, 2012; Singh, 2012; Yusuf & Zain, 2014). But very
few have examined the impact on host country nationals. Caligiuri, Joshi, and Lazarova
(1999) identified a statistically significant positive relationship between the dependent
variable adjustment of female expatriates and the independent variables company support and
family support. This study focused on the host country national; the nationals who work with
an organization that is based in their home country but that employs senior managers and
other executives from foreign countries.
Several researchers have found evidence indicating that age is related to both
organizational commitment and job satisfaction (Cook & Wall, 1980; De Meulenaere, Boone,
& Buyl, 2016; Meyer, Stanley, Herscovitch, & Topolnytsky, 2002; Yucel, & Bektas, 2012).
They have also identified gender as a predictor of both job satisfaction and organizational
commitment (Boles, Madupalli, Rutherford, & Wood, 2007; Boles, Wood, & Johnson, 2003;
Rutherford, Marshall, & Park, 2014). Boles et al. (2007) found that job satisfaction and
organizational commitment in men were more affected by pay-related issues in comparison
to women who were more affected by relationship issues. Experience or tenure has also been
found to relate to organizational commitment and productivity (Manchanda, 2014; Misra,
2014).

4
In a recent study on perceptions of justice in the expatriate and host country nationals
working relationship, Oltra, Bonache, and Brewster (2013) identified host country nationals’
perceptions of inequalities between the treatment of them and expatriates. They also
identified negative perceptions of the capabilities of host country nationals by expatriate
employees of the multinational company’s home country. Syed et al. (2014) contented
assessors of expatriates’ performance should note that “contextual understanding and actual
performance are crucial for expatriate assignments to be seen in positive light” (p. 226). Oltra
et al. (2013) likened perceived organizational injustices to poisons and further asserted that
they have the potential to threaten the survival of the respective organizations. They further
indicated that the threat to sustainability is evident from perceived injustices’ propensity to
increase intentions to quit and antagonism between host country nationals and expatiates,
reducing organizational commitment.
Despite all these studies on the subject, there is a gap in the literature in respect to the
effects of cultural dissimilarities on host country nationals’ productivity, normative
commitment, affective commitment, and job satisfaction (Hitotsuyanagi-Hansel, Froese, &
Pak 2016; Howard, 2012). I addressed the gap in this study, thereby providing information
and enhanced knowledge of the problem and identification of solutions to abate its effects.
Problem Statement
There is a problem in the Jamaican society. Despite the benefits of increased
perspectives and knowledge gained by the influx of expatriates within the society, cultural
dissimilarities are posing challenges including increased levels of absenteeism and stress,
which have the potential to negatively impact key organizational outcomes. This problem
has negatively impacted the host country nationals because of varying cultural norms. A
possible cause of this problem is a lack of convergence in respect to what is deemed

5
acceptable and normal and what is deemed unacceptable by both host country nationals and
expatriates. I conducted this quantitative study investigating the impact of the cultural
dissimilarities to hopefully remedy this situation.
Cartwright and Cooper (1993) asserted that cultural dissimilarity in organizations
results in increased levels of absenteeism, turnover, and stress among its employees. Further,
Bergbom and Kinnunen (2014) demonstrated that cultural dissimilarity negatively affects
psychological well-being and job satisfaction. Additionally, Toh and DeNisi (2005) showed
cultural incompatibilities were correlated with reduced staff morale. Hofhuis, Van der Zee,
and Otten (2014) reported cultural diversity was positively correlated with turnover
intentions, and further recommended that organizations should employ measures to foster
cultural inclusion. Pelled (1996) also provided empirical support for group diversity’s impact
on both turnover and productivity. Further, Ng and Tung (1998) presented similar findings,
with turnover rates being higher in culturally heterogeneous organizations than in
homogeneous ones.
Several researchers have studied the challenges faced by expatriates in organizations
and have worked to identify solutions to ensure their success (Oltra et al., 2013; Toh &
DeNisi, 2005; Yusuf & Zain, 2014). In a recent study on perceptions of justice in the
working relationship of host country nationals with expatriates, Oltra et al. identified
perceived inequality between the treatment of host country nationals and that of expatriates.
In addition, expatriates had negative perceptions of host country nationals’ capabilities in the
respective multinational corporations. Syed et al. (2014) purported that “contextual
understanding and actual performance are crucial for expatriate assignments to be seen in
positive light” (p. 226). Oltra et al. further asserted that perceived cultural incompatibility
and perceived injustice have the potential to threaten the survival of an organization.

6
Despite the many studies on globalization and the challenges experienced by
expatriates, few researchers have explored the challenges faced by host country nationals and
the implications of those challenges for their various job attitudes and key performance
outcomes (Khalil, Jabeen, Jadoon, & Salman, 2016; Oltra et al., 2013; Toh & DeNisi, 2005;
Yusuf & Zain, 2014). Extant literature on the cultural incompatibility experienced in the
working relationships between expatriates and host country nationals has focused primarily
on the experiences of expatriates (Howard, 2012; Singh, 2012). There is a gap in the
literature in respect to the effects of cultural dissimilarities on host country nationals’
productivity, normative commitment, affective commitment, and job satisfaction. These
effects include differences in expected capabilities, remuneration, and exclusion.
Purpose of the Study
The purpose of this quantitative study was to identify the effects of cultural
dissimilarities between expatriates and Jamaican (host country) nationals on key
organizational outcomes. In the study, I measured the productivity, normative commitment,
affective commitment, and job satisfaction of host country nationals. Further, I examined
whether age and gender were predictors of these relationships. The study includes
information regarding participant perceptions of the effects of cultural incompatibilities with
expatriates within their organization. My objective was to provide information that would
heighten the awareness of employees and employers of such situations and inform their
actions to address them.
Research Questions
I developed three main research questions and associated hypotheses to address the
research problem:

7
RQ1: Do cultural dissimilarities between host country nationals and expatriates predict
the job satisfaction, affective commitment, normative commitment, or productivity of host
country nationals?
H01: Cultural dissimilarities between host country nationals and expatriates does not
predict their job satisfaction.
Ha1: Cultural dissimilarities between host country nationals and expatriates does
predict their job satisfaction.
H02: Cultural dissimilarities between host country nationals and expatriates does not
predict their affective commitment.
Ha2: Cultural dissimilarities between host country nationals and expatriates does
predict their affective commitment.
H03: Cultural dissimilarities between host country nationals and expatriates does not
predict the normative commitment of host country nationals.
Ha3: Cultural dissimilarities between host country national and expatriates does predict
the normative commitment of host country nationals.
H04: Cultural dissimilarities between host country nationals and expatriates does not
predict the productivity of host country nationals.
Ha4: Cultural dissimilarities between host country nationals and expatriates does
predict the productivity of host country nationals.
RQ2: Do demographic factors of age, experience, and gender predict the job
satisfaction, affective commitment, normative commitment, or productivity of host country
nationals?
H01: Demographic factors of age, experience, and gender do not predict host country
national’s job satisfaction.

8
Ha1: Demographic factors of age, experience, and gender do predict host country
national’s job satisfaction.
H02: Demographic factors of age, experience, and gender do not predict host country
national’s affective commitment.
HA2: Demographic factors of age, experience, and gender do predict host country
national’s perception of affective commitment.
H03: Demographic factors of age, experience, and gender do not predict host country
national’s normative commitment.
HA3: Demographic factors of age, experience, and gender do predict host country
national’s normative commitment.
Ho4: Demographic factors of age, experience, and gender do not predict host country
national’s productivity.
HA4: Demographic factors of age, experience, and gender do predict host country
national’s productivity.
RQ3: Does cultural dissimilarity between host country nationals and expatriates, in
conjunction with demographic factors of age, experience, and gender predict the job
satisfaction, affective commitment, normative commitment or productivity of host country
nationals?
H01: Cultural dissimilarities between host country nationals and expatriates in
conjunction with demographic factors of age, experience, and gender does not predict host
country national’s job satisfaction.
Ha1: Cultural dissimilarities between host country nationals and expatriates in
conjunction with demographic factors of age, experience, and gender does predict host
country national’s job satisfaction.

9
H02: Cultural dissimilarities between host country nationals and expatriates in
conjunction with demographic factors of age, experience, and gender do not predict host
country national’s affective commitment.
HA2: Cultural dissimilarities between host country nationals and expatriates in
conjunction with demographic factors of age, experience, and gender do predict host country
national’s affective commitment.
H03: Cultural dissimilarities between host country nationals and expatriates in
conjunction with demographic factors of age, experience, and gender do not predict host
country national’s normative commitment.
HA3: Cultural dissimilarities between host country nationals and expatriates in
conjunction with demographic factors of age, experience, and gender do predict host country
national’s normative commitment.
Ho4: Cultural dissimilarities between host country nationals and expatriates in
conjunction with demographic factors of age, experience, and gender do not predict host
country national’s productivity.
HA4: Cultural dissimilarities between host country nationals and expatriates in
conjunction with demographic factors of age, experience, and gender do predict host country
national’s productivity.
Theoretical Framework
I used elements from diversity theory, social exchange theory, and the repulsion
hypothesis to develop the theoretical framework for this study. I deemed these theories
relevant because they target interpersonal relationships and thus are useful for understanding
the relationships between host country nationals and expatriates.

10
Diversity Theory
I used diversity theory because cultural diversity, which is the focus of this study, has
been the focus of diversity theory from its inception with latter focus on gender and other
diversity factors (Ferdman & Sagiv, 2012). The focus of diversity theory is on differences
among people and their effects on important outcomes, including productivity and working
relationships. Cultural incompatibilities that often result from cultural diversity have been
identified as a major consequence of globalization and the resultant multinational
organizations (Hailey, 1996; Pucik, 2012; Yusuf & Zain, 2014).
Social Exchange Theory
Social exchange theory addresses the impact that perceived equity has on
relationships (Kelley & Thibaut, 1978). This theory was relevant to this study because
perceptions of equity and fairness are impacted by cultural practices and norms. I thus
expected that such factors would have a bearing on participant perceptions regarding the
impact of cultural dissimilarities on the working relationships, morale, and productivity of
employees.
Repulsion Hypothesis
The repulsion hypothesis posits that individuals will gravitate towards others who are
similar to them and will find relationships with dissimilar individuals repulsive (Rosenbaum,
1986). This is further supported by the theory of homophily that holds that individuals tend
to be drawn to persons who have similar attributes to them and that they repel dissimilar
individuals. I deem this theory relevant to the current study since it focuses on dissimilarities
in culture and its effects.

11
Nature of the Study
In this quantitative study I focused on the impact of cultural incompatibilities between
host country nationals and expatriates, and on the impact of these incompatibilities on the
morale and productivity of the host country nationals. Further, I examined the impact of
gender, age, and work tenure on the relationship of the variables.
I collected data associated with these variables from employees of an energy company
and a hospitality company. I then analysed the collected data collected using statistical
methods including Pearson’s correlation and multiple regression analyses.
Definitions
Affective commitment: Affective commitment is an emotional attachment to the
organization. Bergman (2006) defined affective commitment as “the affective bond the
individual feels towards the organization, characterized by identification and involvement
with the organization as well as enjoyment in being a member of the organization” (p. 647).
Culture: For this study, I adopted Hofestede’s (as cited by Martinko, 1999) definition
of culture as “the distinctive collective mental programming of values and beliefs within each
society” (p. 270).
Cultural dissimilarity: For the purposes of this study, I operationally defined cultural
diversity, in keeping with Guillaume et al. (2014), as “an individual-level concept that
captures the extent to which an individual is different from other team members in terms of
their cultural background” (p. 1286).
Expatriate: I operationally defined expatriates, in keeping with McNulty and
Brewster (2017) as “legally working individuals who reside temporarily in a country of
which they are not a citizen in order to accomplish a career-related goal, being relocated

12
abroad either by an organization, by self-initiation or directly employed within the host-
country” (p. 46).
Host country nationals: I operationally defined host country nationals in line with
Long (2009) as an employee of a foreign subsidiary, who is native to the particular country in
which the subsidiary is.
Normative commitment: Normative commitment is defined by Bergman (2006) as
“the individual’s bond with the organization due to an obligation on the part of the
individual” (p. 646). This commitment is essentially due to some sense of the individual
owing it to the organization to remain an employee, typically due to something that the
organization did for that individual that is deemed significant.
Productivity: For the purpose of this study, I operationally defined productivity in
keeping with McNeese-Smith (as cited by Loke, 2012), as “the contribution made towards an
organizational end result in relation to the amount of resources consumed” (p. 193).
Assumptions
I assumed that participants in this study were truthful in their responses, especially in
light of the fact that this study was based on self-reports. I further assumed that their
responses were unbiased and reflective of their true feelings. Finally, I assumed that the
various surveys used in this study have demonstrated strong psychometric qualities including
validity and reliability, considering the research population consisted of non-Americans.
Scope and Delimitations
The scope of this study is somewhat narrow given the small number of organizations
involved. The sample was drawn from employees of two companies in Jamaica, which may
not be representative of all Jamaicans. Additionally, the study does not address differences in
perception due to participants’ educational levels or hierarchical levels in the organization.
13
Thus, the results of this study should not be generalized to all countries, cultures, or
companies because the perceptions and experiences of the employees in the sample may
differ from those of other employees within Jamaica as well as in other countries.
Limitations
The study was limited by the small sample size, the absence of a sample frame, and
the fact that I used a non-probability sampling approach. Readers should note that this is an
introductory study limited in respect to its sample, the level of analysis, and the sectors
represented. The results of this study should not be deemed generalizable in all countries,
cultures, or companies given that the study was specific to two companies in Jamaica. The
perceptions and experiences of these employees may differ from those of other employees
within Jamaica as well as in other countries. In light of the aforementioned, the results of the
study should not be generalized to other situations but will serve as a precursor to other
studies on the subject. Another limitation is the fact that the data is based on self-reports.
Significance of the Study
Jamaica’s unemployment rate for the first quarter of 2014 was 13.4%. When
compared to its Caribbean neighbours Cayman (6.3%), and Cuba (3.30%), it becomes
apparent that Jamaica can ill afford any increases in this rate. Individuals who read this study
will gain information which has the potential to assist them in reducing intent to quit, thereby
reducing the unemployment rate of the country. In the study, I have provided empirical data
to support cultural and diversity theories and have contributed to the literature on these
topics. In addition to the implications of the empirical data, the study may also be instructive
to organizations in their quest to improve efficiency and management practices as they seek
to remain viable in the current global context.

14
One potential impact for social change involves human resource practitioners
development of selection matrices that will be used for the selection of expatriates based on
their cultural suitability or their willingness to adapt to the cultural norms of the host country.
I hope that these matrices will be suitable for adaptation by multinational companies. I
expect that this research will facilitate the creation of country specific cultural awareness
training programs for both host country nationals and expatriates. Such training programs
may help to reduce the impact of cultural incompatibilities and potentially improve
performance and job attitudes. Finally, this study may aid human resource practitioners in
the development of performance appraisal instruments that will include measures for cultural
adaptation.
Chapter Summary
Several researchers have sought to assess the impact of various factors, including
cultural dissimilarity, on employees’ productivity. Scholars have also sought to examine the
impact of demographics, including gender, age, and length of tenure within specific
organizations, and the correlation between cultural dissimilarity and employee morale. It is
likely that the challenges employees experience may be heightened in the case of expatriates
and host country nationals due to the fact that the physical location of the organization is
home to one set (host country nationals) and not to the other. This may be the reason why
most studies on the subject have focused on the impact on the expatriates rather than on the
host country nationals. However, that the impact of cultural difference is not restricted to the
experiences of the expatriates. Herein lies the gap that I addressed in this study addresses,
namely the impact of such cultural incompatibility on the productivity and employee morale
of the host country nationals in Jamaica, a developing country.

15
The theoretical underpinnings of this study (diversity theory, social exchange theory,
and the repulsion hypothesis) all indicate the normalcy of individuals’ tendency to resist
differences and to embrace similarity. Despite the accuracy of these theories, human beings
are constantly faced with diversity. Consequently, the challenges are unlikely to dissipate
without deliberate forms of intervention.
This study is significant because it will aid employers and human resource
practitioners in identifying the challenges of host country nationals and hopefully serve as a
catalyst for further studies as well as identification of recommendations to lessen the erosion
of employee morale. In Chapter 2, I review previous studies and literature on the topic. In it,
I examine the theoretical underpinnings as well as literature regarding the variables and their
correlations. In addition, the chapter includes my rationale for embarking on this study in
light of the existing literature.

16
Chapter 2: Literature Review
Introduction
In this study, I examined the impact of perceived cultural dissimilarity on the
productivity and job attitudes of host country nationals. I examined job attitudes by focusing
on job satisfaction, normative commitment, and affective commitment. These key variables
were also examined in light of predictor variables of age, gender, and experience.
Additionally, I examined the aforementioned variables in the theoretical context of diversity
theory, social exchange theory, the repulsion hypothesis, and homophily.
In this chapter, I review both current and past literature. My aim included assembling
findings in respect to the theories identified, collecting information in respect to any
relationships that may have been observed in previous studies, and determining whether there
was a gap in the literature that justifies the need for my study.
Literature Search Strategy
When searching for literature to review, I used several academic databases in an
attempt to ensure that the information gleaned was representative of the body of information
available on this topic. Among these databases were Google Scholar, PsycINFO, Thoreau,
Academic Search Complete, PsycTESTS, Mental Measurements Yearbook, Health and
Psychosocial Instruments, and EBSCOhost. I made every effort to ensure that the literature
was reflective of several geographical regions. As a result, countries used in the study
include but are not limited to Germany, Austria, Taiwan, Australia, Canada, South Africa,
Jamaica, and the United States.
In the searches, I included peer-reviewed articles, books, tests, and periodicals. I
reviewed mainly peer reviewed and scholarly articles including current articles and others
published as far back as 1965 to ensure a historical perspective. I used the following

17
keywords in the database searches: gender, male, female, job attitudes, organizational
commitment, normative commitment, job satisfaction, productivity, tenure, transformational
leadership, age, culture, affective commitment, globalization, national, expatriate, employee,
morale, worker, performance, dissimilarity, and diversity. In addition to using the
aforementioned keywords, I used Boolean operators and, not, and or to associate or
disassociate the keywords.
The reference lists of some articles proved to be another valuable resource when
identifying suitable material. Additionally, I took care to ensure that I conducted an objective
review and did not merely focus on articles of a particular perspective.
Theoretical Framework
The theoretical framework within which this study was conducted is that of diversity
theory, social exchange theory, repulsion hypothesis, and homophily. These theories are
deemed relevant as they are all applicable to interpersonal relationships, which is the focus of
this study. Additionally, at the core, they address the natural responses to perceived
interpersonal differences; both demographic and otherwise.
Diversity Theory
The focus of diversity theory is on differences among people and the effects on
important organizational outcomes including productivity and working relationships.
Cultural diversity has been identified as a major consequence of globalization and the
resultant multinational organizations (Hailey, 1996; Pucik, 2012; Yusuf & Zain, 2014). It is
important to note that diversity theory is not restricted to one type of difference but rather
focuses on all differences, which include but are not restricted to gender, age, culture,
personality, religious views, race, and ethnicity, among others (Betz & Fitzgerald, 1993). In
fact, Parekh (2006) intimated that while individuals from varied ethnicities and cultures have

18
similar needs and capabilities, the expression and fulfillment of these needs and capabilities
are shaped by the cultures in which they exit. Maslow emphasized the universality of needs
is in his extensive work on the hierarchy of needs, ranging from physiological needs (food,
shelter, sex) to self-actualization (Robbins & Judge, 2007). Hofstede, Hofstede, and Minkov
(2010) likewise noted the commonality of human needs and issues, as well as the cultural
differences that shape the approaches individuals take to solutions. Their classification of
these differences includes masculinity versus femininity, power distance, and collectivism
versus individualism.
Diversity theory posits that perceived or experienced differences often result in
pressure to change as well as pressure for inclusion and acceptance of differences (Lumby &
Morrison, 2010). In highlighting the relevance of racial and cultural dissimilarity, Betz and
Fitzgerald (1993) indicated its vast impact for the field of psychology, likening it to “sea of
change” (p. 362). Diversity can best be described as having an ambivalent nature in the
workplace, as studies have highlighted both positive and negative relationships that accrue
from it (Mansour & Wegerif, 2013). In light of its ambivalent nature, diversity has to be
deliberately addressed in the workplace in an attempt to mitigate the potential negative
implications (Kumra & Manfredi, 2012). Patrick and Kumar (2012) indicated that diversity
does not only involve differences in the way people act, but also in the way they think. These
researchers further indicated that organizational diversity has both positive and negative
implications. Some of the areas that may be affected positively or negatively, based on the
diversity management techniques utilized by human resource practitioners, include
productivity, employee morale, and financial indicators.
19
Social Exchange Theory
Social exchange theory emphasizes the impact that perceived equity has on
relationships (Kelley & Thibaut, 1978). Homans (1961) defined social exchange as the
exchange of activity, tangible or intangible, and more or less rewarding or costly, between at
least two persons. Researchers have observed relationships between social exchanges and
status, power, and equity, to name but a few (Colquitt et al., 2013; Homans, 1961). Ko and
Hur (2014) also observed positive relationships between social exchange theory and job
satisfaction as well as a negative relationship with intentions to quit.
Social exchange theory has been studied to ascertain its impact on several
organizational outcomes including productivity and employee morale. King (2016) included
140 participants and sought to determine the effect of social exchange theory on training, and
by extension, its impact on a key organizational outcome, intent to quit. The results indicated
that social exchange theory does have a positive impact on several positive organizational
attributes including job satisfaction, perceived organizational support, and psychological
contract, which in turn reduce intentions to quit.
In this study, I focused on the social exchange between host country nationals and
expatriates, hence the relevance of this theory to the study. Additionally, this theory was
relevant to the study because perceptions of equity and fairness are impacted by cultural
practices and norms. I thus expected that such perceptions would have a bearing on
participant perceptions regarding cultural incompatibilities and would consequently impact
the working relationships, morale, and productivity of employees (see Cook, Cheshire, Rice,
& Nakagawa, 2013).

20
Repulsion Hypothesis and Homophily
The repulsion hypothesis posits that individuals will gravitate towards others who are
similar to them and will find relationships with dissimilar individuals repulsive (Rosenbaum,
1986). This is further supported by the theory of homophily that suggests that individuals
tend to be drawn to persons who have similar attributes to them and that they repel dissimilar
individuals. Homophily is relevant to my study given the fact that I have focused on
dissimilarities in culture and its effects. McPherson, Smith-Lovin, and Cook (2001)
identified a strong relationship between homophily and individuals’ attitudes, and intimated
further that racial and ethnic homophily are especially divisive.
Lee and Reade (2015) explored ethnic homophily among 550 managers of several
organizations, who were enrolled at a university in Colombo Sri Lanka, at a time in which
there was continued conflict in respect to ethnic differences. The aim of the study was to
determine the effect, if any, of societal context on ethnic homophily within the organizations
where these managers worked. The researchers further sought to understand the implications
on the organization where they worked. The results of the study indicated that employees’
awareness of ethnic conflict in the society was positively related to ethnic homophily in the
organizations. Their findings also supported the notion that increased ethnic diversity and
productivity in organizations had the effect of reducing ethnic homophily in the respective
organizations.
The effect of homoplily on cooperation within organizations has also been the subject
of several studies. Aksoy (2015) studied the impact of heterogeneity and homophily on
cooperation using an experiment that involved 186 participants. The results of the study
indicated that heterogeneity hampers cooperation. In their study on the effects of homophily

21
on cooperation, Di Stefano et al. (2015) concluded that homophily positively impacted both
the speed and size of formation of cooperative groups.
Job Attitudes
In this study, I focused on the job attitudes normative commitment, affective
commitment, and job satisfaction. While all three job attitudes bear some similarities, there
are also striking differences among them. Robbins and Judge (2007) indicated that the
similarities among job attitudes often result in some level of overlap. Knoop (1995)
distinguished job satisfaction from organizational commitment, noting that “job satisfaction
in the broadest sense refers to a person’s general attitude towards the job or toward specific
dimensions of the job,” while “organizational commitment refers to identification with and
loyalty to the organization and its goals” (p. 643).
• Organizational commitment: Robbins and Judge (2007) defined organizational
commitment as “A state in which an employee identifies with a particular
organization and its goals and wishes to maintain membership in the organization” (p.
80). Organizational commitment is often sub-categorized as normative, affective, and
continuance commitment.
• Normative commitment: Bergman (2006) has defined normative commitment as “the
individual’s bond with the organization due to an obligation on the part of the
individual” (p. 646). This commitment results some sense of the individual owing it
to the organization to remain an employee, typically due to something that the
organization did for that individual that is deemed significant.
• Affective Commitment: Affective commitment results from an emotional attachment
to the organization. Bergman (2006) defined affective commitment as “the affective
bond the individual feels towards the organization, characterized by identification and

22
involvement with the organization as well as enjoyment in being a member of the
organization” (p. 647).
• Continuance Commitment: Continuance commitment is based on the individual’s
desire to remain a member of the organization, typically due to the unsuitability of
the available options or due to norm or complacency. Robbins and Judge (2007)
defined it as “the perceived economic value of remaining with an organization
compared to leaving” (p. 80).
In this study I examined, among others, the relationship between age and the
aforementioned job attitudes, with the exception of continuance commitment. A review of
the literature provided some insight; in some cases, the results appeared to be contradictory,
which indicated the need for further study.
The relationship between determinants of employee morale (including the various job
attitudes such as job satisfaction and organizational commitment) and productivity has been
the subject of numerous studies, which have indicated correlation (Akintayo, 2012;
Fernandes et al., 2013; Robertson et al., 2012).
The literature regarding job satisfaction and age has provided conflicting results over
the years with some studies indicating a positive relationship, some indicating a negative
relationship, and others indicating a U-shaped relationship. This U-shaped relationship
between job satisfaction and age, indicated a decline in job satisfaction for younger
employees, then an increase with age to a certain point, and eventually a decline after a while
in response to increasing age (Dobrow Riza, Ganzach, & Liu, 2015).
Lee and Wilbur (1985) conducted a study involving 1707 public sector employees in
the United States. The aim of the study was to gain insight into the relationship among the
following variables: age, education, job tenure, salary, job characteristics, and job
23
satisfaction. The results of their study indicated a positive relationship between age and job
satisfaction with job satisfaction increasing as age increased. There were more conclusive
results with respect to job satisfaction based on intrinsic factors. They found that the younger
employees’ job satisfaction was more significantly impacted by intrinsic factors, while the
job satisfaction of the older employees was more significantly impacted by extrinsic factors.
Dobrow Riza et al. (2015) used datasets from the 1979 and 1997 cohorts of the
National Longitudinal Survey of Youth, a study conducted by the U.S. Department of
Labor’s Bureau of Labor Statistics. The researchers focused on the impact of age and tenure
on job satisfaction. The findings indicated that for the dataset under consideration, when
tenure was controlled, there was a positive relationship between age and job satisfaction.
When age was controlled there was a negative relationship between tenure and job
satisfaction. An interesting finding highlighted in this study is that job satisfaction decreased
with increased tenure within an organization, but increased with age once the employee
changes from one organization to another. This finding is interesting because it adds another
variable, tenure within the organization, thereby indicating that the relationship between age
and job satisfaction is not linear but rather that it is moderated by tenure.
Chaudhuri, Reilly, and Spencer (2015) found that the relationship between age and
job satisfaction was moderated by gender. Their findings suggested that for the women
studied, age had no significant impact on their job satisfaction. On the other hand, the
researchers observed that the men studied exhibited marginal increases in job satisfaction as
their ages increased.
Naderi Anari (2012) also examined the relationship between age, job satisfaction, and
organizational commitment. The study involved teachers and the findings supported the

24
notion that age and gender have no impact on job satisfaction nor organizational
commitment.
Teclaw, Osatuke, Fishman, Moore, and Dyrenforth (2014) utilized data from the
VHA All Employees Surveys for the years 2004, 2008, and 2012. It is noted that care was
taken in determining the sample to ensure representation from various ethnicities. The
surveys focused on VA employees’ perception of job satisfaction and the climate of the
various workgroups. The data was examined to ascertain among other relationships, the
impact of age and tenure on employee job satisfaction. The findings of the study revealed
that tenure is directly related to job attitudes including job satisfaction. It is noted also that
the results consistently supported a positive relationship between age and job satisfaction,
however these results were not statistically significant.
Age (Number of Years)
The correlation of age and productivity has been the subject of inquiry for several
researchers. Some have focused on organizational productivity while others focused on
individual productivity. It is noted further that the age productivity relationship has the
potential to vary based on different variables including but not limited to, the type of
productivity under consideration (physical, psychological), the sector (manufacturing,
service), and others.
Some studies have also addressed the matter of stereotypes in respect to older
employees and the effect of these stereotype threats on the job attitudes of aging employees
(De Meulenaere et al., 2016; von Hippel, Kalokerinos, & Henry, 2013). Stereotype threats in
aging employees have been analyzed to negatively impact job attitudes, including job
satisfaction and organizational commitment (von Hippel, Kalokerinos, & Henry, 2013).

25
Backes-Gellner and Veen (2013) utilized a data set provided by the German Institute
for Employment Research in Nuremberg in their quest to determine the effect of age diversity
on organizational productivity. They indicated that increasing age should not necessarily be
considered a threat to organizational productivity if measures are implemented to manage the
age diversity. In fact, it was observed that age diversity had positive implications for
organizational productivity in instances where measures were implemented to control or
address age diversity and where the tasks involved were creative in nature. Notwithstanding
the aforementioned, they further indicated that the results did not indicate a similar positive
relationship between individual productivity and age.
Studies have also examined the effect that differing sectors have on the relationship
between age and productivity with varying results. Some sectors revealed a negative
relationship, some revealed a positive relationship, and others revealed a neutral relationship
(Ruzik-Sierdzinska, Lis, Potoczna, Belloni, & Villosio, 2013; Veen, 2008). Studies have also
contradicted what may be deemed popular opinion, as it has been observed that there was no
consistent decline in employees’ productivity within some sectors as their employees aged
(Ekelund, Jackson, & Tollison, 2015; Göbel & Zwick, 2012).
Boehm, Kunze, and Bruch (2014) utilized data, in respect to small and medium size
firms within Germany, to examine the relationship between age diversity and organizational
outcomes. The findings of the study revealed that implementation of Human Resource
practices, specific to age diversity, was positively related to organizational performance. The
presence of these practices resulted in the reduction of intentions to leave for the dataset
under consideration.

26
Gender (Men and Women)
There are several perceptions regarding the relationship between gender and the
various job attitudes. In light of the various perceptions the subject has been deemed worthy
of study. Consequently, several studies have been studied in an attempt to examine the
relationship between these variables. The findings of Tait, Padgett, and Baldwin (1989), a
methodology in respect of job and life satisfaction and the impact of gender, indicated that
there was a consistent difference in studies conducted prior to 1974 and those conducted after
1974. In both sets the males reported higher job satisfaction but it was noted that the margin
reduced significantly in the studies conducted after 1974.
Rosenblatt, Talmud, and Ruvio (1999) highlighted an interesting finding when
assessing the impact of job insecurity on the job attitudes specific to the genders. It was
noted that in the case of the females, all of the job attitudes under consideration, including job
satisfaction, were negatively affected by perceptions of job insecurity. In comparison, for the
males, the only job attitudes that were negatively impacted by their perception of job
insecurity were resistance to change, organizational commitment, and intention to quit.
The debate regarding the effect of gender on productivity has continued over the
years. It has also been the subject of some studies over the years that have yielded mixed
results.
Harris, Williams, and Mishra (2015) explored the effect of gender on productivity on
United States Farms. The study utilized data from the 2013 Agricultural Resource
Management Survey (ARMS), which indicated that females were principal operators of
approximately 11% of United States farms. Further, that they served as second or third in
operators for in excess of 40% of the United States owned farms. Analysis of the data

27
revealed that the farms operated by females were more efficient and productive than those
operated by males, with efficiency ratios of 3.14 to 1.40 respectively.
Larson, Savastano, Murray, and Palacios-López (2015) also sought to examine the
impact of gender on productivity in agriculture, however their study was based in Uganda
Africa. The study utilized a 2009-2010 survey that focused on maize farmers in Uganda.
The findings of the study suggest that female farmers in Uganda were less productive but this
not merely due to their inability to produce but rather due to incompatibilities in access to
resources. This is so as male farmers were able to access resources, such as fertilizers, more
readily than female farmers.
Experience and Productivity
The studies with respect to organizational tenure/experience and productivity, as with
the other variables reviewed, have produced mixed findings. Schmidt et al. (1986) posited
that individual’s productivity increased as their tenure within an organization increased. This
notion is supported by Human and Social Capital theories that purport increased efficiency
and productivity due to the increased knowledge and experience that would be gained due to
longer tenure within an organization (Park & Shaw, 2013).
While there are studies that support the notion of increased productivity due to
increased tenure (McDaniel, Schmidt, & Hunter, 1988), there are also studies that suggest the
opposite, suggesting rather that there is a negative relationship (Medoff & Abraham, 1980),
and still others that suggest there is no statistical evidence of a direct relationship (Gordon &
Johnson, 1982).
Ng and Feldman (2013) in their meta-analysis of the relationship between
organizational tenure and productivity, found that the relationship was not statistically
28
significant. They opined further that it is likely that the gains received from increased tenure
may be offset by reductions in motivation over the years.
Park and Shaw (2013) examined the relationship between turnover rates and
organizational productivity. Their findings suggest that there is a negative relationship
between the two factors that would therefore lend to support the notion of a positive
relationship between longer tenure and the productivity of the organization. Of note is the
fact that they examined various levels in the organization and the results did not differ
significantly. All levels, whether primary, secondary, or tertiary reflected a negative
relationship between turnover and organizational productivity.
Cultural Dissimilarity/Diversity
Chua (2013) indicated that “cultural diversity is a seedbed for intercultural anxiety,
tensions, and conflicts because of differences in world-views, values, and norms” (p. 1547).
Cultural incompatibilities have been identified as the source of increased stress levels,
reduced job satisfaction, as well as increased industrial relations challenges (Cartwright &
Cooper, 1993). Additionally, there has been evidence of a correlation between cultural
incompatibilities and reduced staff morale (Soo Min & DeNisi, 2005; Syed et al., 2014). It is
further noted that cultural incompatibilities are rife within our current globalized context, and
in particular, in situations in which senior executives of a company are natives of another
company other than the host country. Bergbom and Kinnunen (2014) provided empirical
data to indicate that psychological well-being and job satisfaction are negatively affected by
cultural incompatibility. Additionally, Soo Min and DeNisi provided evidence of a
correlation between cultural incompatibilities and reduced staff morale. Chatman, Polzer,
Barsade, and Neale (1998) purported that based on their findings, organizations are likely to
incur additional costs due to lower staff morale in instances where there is cultural diversity.

29
Notwithstanding the purported negative effects of cultural diversity, it is widely
accepted by others that if the appropriate measures are implemented to address cultural
diversity in the workplace it can have positive implications for key organizational
performance indicators. Thomas and Ely (1996) asserted that the implementation of cultural
diversity measures within the workplace is more than just the correct thing to do, they
purported that it should be a pivotal part of the strategic plan for the organization.
Akintayo (2012) sought to examine the relationship between the working
environment, employees’ morale and perceptions of productivity within the Nigerian context.
The descriptive survey method was utilized and a total of 311 participants from both public
and private organizations participated. Three sets of surveys were utilized and the data was
statistically analyzed using regression analysis and descriptive statistics. The findings of the
study revealed that there is a significant relationship between working environment,
employee morale, and perceived productivity.
Hailey (1996) examined the working relationship between expatriates and local
managers. While several studies have examined expatriates’ adaptation to their new
environments, this study seeks to examine a gap in the literature in respect to the impact on
host country managers who often work alongside these expatriates, and the resultant effect on
performance. The sample population consisted of Singaporean employees of American,
British, and Japanese companies that had operations in Singapore. The 30 participants were
local senior executives who worked alongside foreign senior executives. The study took the
form of a questionnaire followed by semi-structured interviews that were administered to a
sample of the total participants. The results revealed that the local executives perceived
mistrust of locals as the primary reason why expatriates were engaged. They also identified

30
injustices in the remuneration of the expatriates in comparison to their own and highlighted
reluctance on the part of expatriates to adjust to the Singaporean culture.
Howard (2012) examined the challenges that face expatriates to Jamaica in the
tourism sector and how these challenges determined the success or failure of the
organizations they served. Specifically, it targeted general managers assigned to four and
five star hotels and sought to address what they identified as a gap in the literature. They
noted that several studies examined the effects of maladaptation of the expatriates to the host
countries culture. Others examined the job attitudes of the expatriates but few looked at the
challenges that threaten the success of their mission. A qualitative approach was taken with
face to face, semi structured interviews conducted in the office of the participants. The
interviews were comprised of three parts focusing on demographics, assessment of human
resource issues, and the challenges that faced the respective general manager. The
expatriates who participated in the study originated from the United States of America,
France, Belgium, Greece, Belgium, and Austria. The data was carefully coded and examined
in an attempt to identify themes. The findings revealed perceptions of human resources
challenges including high turnover rates, lack of punctuality, and unacceptable skill and
service levels among others. It also identified organizational and operational challenges
including high inflation rates, crime, unreliable suppliers and bureaucracy.
In a recent study on perceptions of justice in the expatriate and host country nationals
working relationship, Oltra et al. (2013) identified perceptions on the part of host country
nationals of inequalities between the treatment of host country nationals and expatriates, as
well as negative perceptions of the capabilities of host country nationals. Syed et al. (2014)
purported that “contextual understanding and actual performance are crucial for expatriate
assignments to be seen in positive light” (p. 226). Oltra et al. (2013) likened perceived

31
organizational injustices to poisons and asserted further that the attendant perceived injustices
have the potential to threaten the survival of the respective organizations.
Oltra et al. (2013) examined organizational justice in the context of multinational
companies. The focus was on the difference in the treatment of host country nationals and
that of expatriates. The authors identified deficiencies in the methodology of prior studies on
the topic based on the use of equity theory. Instead of using equity theory, the authors of the
2013 study utilized instead, Employment Discrimination theory, as well as, Rawls’s ‘Theory
of Justice’ in this exploration. Additionally, this study differs from prior studies on the
subject in that it takes a non-perceptual approach, thereby addressing a gap in the literature.
The research views host country nationals as a disadvantaged group and studies the effect of
their status and of justice in these organizations. Justice is examined in respect to
remuneration and working conditions of the host country national and expatriates, while
noting that in several instances the host country nationals are equally qualified and
experienced. The study entailed the review of the current perceptual approaches to justice
and challenges this approach. It recommends instead the use of a non-perceptual approach
grounded in the Rawls’s theory of justice.
Pucik (2012) sought to identify some of the challenges associated with globalization.
The study was undertaken in the context of Japanese multinationals and took the form of a
survey of top executives in American conglomerates. The perceptions of the American
executives were examined to provide insight into some of the challenges that they identified
based on their employment in Japanese owned companies. The study revealed challenges in
respect to decision making, specifically the Americans indicated that they were treated as
inferior and excluded from key decisions. Berggren and Nilsson (2015) posited the need to
instill tolerance for differences in children to better equip them for our globalized society.

32
Cultural Dissimilarity and Productivity
Cultural dissimilarity is said to have varied effects on diverse key performance
indicators. Mathews (2005) purported that deficiencies in cultural diversity programs has
implications for not just productivity but also organizational profit. Richard, Barnett, Dwyer,
and Chadwick (2004) purported that when there are inadequate measures in place to address
cultural diversity it is likely to result in missed business opportunities, which in turn result in
reduced profits.
In their study regarding cultural diversity and its effect on productivity within the
manufacturing sector in Germany, Trax, Brunow, and Suedekum (2015) had mixed results.
They introduced the matter of cultural fractionalization, positing that this would help to
determine the impact on productivity. They indicated that while some studies examined the
impact of cultural diversity on productivity, insufficient attention was placed on cultural
fractionalization, which is the number of various cultural groups.
Sparber (2008) purported that cultural diversity is often associated with several ills
including but not limited to societal unrest, violence, and mistreatment of individuals. The
divisive impact of cultural diversity is supported by Easterly and Levine (1997), who purport
that a move from absolute heterogeneity to absolute homogeneity can account for as much as
a 380% increase in corporate income.
Ottaviano and Peri (2006) sought to examine the effects of cultural diversity by
examining several United States cities that were popular for their recipients of migrants. The
study focused on the effects to the economy of these cities to determine whether productivity
increased or decreased due to the spate of migration within the cities. Specifically, the study
focused on rent and wages as indicators of the economic performance of the cities. The

33
results of the study indicated that United States residents were more productive based on the
cultural diversity within the cities that ensued from the migrant population.
There is also a train of thought that diversity increases the effectiveness of teams.
Diversity is said to increase the creativity and innovative thought process of teams based on
the introduction of new perspectives and hence new ideas (Robbins & Judge, 2007). Lazear
(1999) concurred with this view. He purported that while there were additional costs
associated with culturally and racially diverse teams, these costs were outweighed by the
benefits that were derived based on the increased efficiency and effectiveness of these teams,
that ensue from the variety of perspectives and recommendations.
Sparber (2009) conducted a study of various industries across the United States in an
attempt to better understand the impact of cultural diversity on productivity. The results of
the study supported the notion that there are positive implications of cultural diversity. In
particular, he indicated that decision making benefits directly from cultural diversity based on
the increased insights that accrue from the variety of perspectives gained from a culturally
diverse working environment.
Syed et al. (2014) sought to obtain information on the perceptions of local Jordanian
employees in respect to the performance of expatriates in multinational companies in Jordan.
They identified a lack of research on employees’ perceptions of expatriates’ performance as a
gap in the literature that their study would address. Additionally, they identified a lack of
research on human resource issues in Jordan as another gap that the study would address. Of
note, the perception of the host country employees was considered important as it had
implications for trust, productivity job attitudes, and expatriates success.
The methodology employed for Syed et al. (2014) took the form of a survey
administered to 98 Jordanian employees of three Jordanian based multinational banks. The

34
sample had employees from various hierarchical levels within the organization. A mixed
method approach was taken with both qualitative and quantitative questions. The results of
the study revealed great disparity in the perceptions of the participants. Overall, there
seemed to be consensus that competence was more important than nationality in predicting
management success. Notwithstanding the aforementioned, the results also revealed the need
for expatriates to receive cultural sensitivity training as there was consensus that the
expatriates were often insensitive to the culture of the nationals.
Summary and Conclusions
This literature review has provided insight into various studies and other information
in respect to the variables involved in the current study. It also provided information in
respect to the theories that form the framework for the study. The literature provides
information that supports the notion that employee morale is important both for employees
and for organizations. There is also evidence to suggest that the findings in respect to the
relationships between the various job attitudes and organizational outcomes has been
inconsistent. The various studies have also provided some information in respect to the
demographic factors under review, age, gender, and tenure within an organization.
What we have little information on is the interaction amongst the various factors
especially within the context of a Caribbean nation. This study therefore has sought to
provide information on the impact of the cultural incompatibilities on the productivity, job
satisfaction, normative commitment, and affective commitment of a sample of Jamaican
employees.
I will provide details of the research design that has been employed in my study, in
chapter 3. It outlines the sample selection and data collection procedure and rationale, as
well as the information in respect to the methodology that was employed.

35
Chapter 3: Research Method
Introduction
In this chapter, I focus on the methodology that I employed in my study. It includes
information with respect to the sample, including my reason for selecting these individuals,
and the sampling technique utilized to ensure that the sample was representative of the
population. I also identify the research questions and variables, as well as the instruments I
used for measurement. Additionally, I discuss the data analysis techniques I used.
Purpose of this Study
The purpose of this quantitative inquiry was to identify the effects of cultural
dissimilarity in expatriates and host country nationals, and to understand their impact on the
productivity, normative commitment, affective commitment, and job satisfaction of the host
country nationals. I examined whether demographic factors of age, tenure (years of
employment), and gender were predictors of these relationships. I conducted this study with
participants who were Jamaican nationals (host country nationals). In this dissertation, I
provide information regarding their perceptions of the effects of cultural incompatibilities
with expatriates within their organization on their job satisfaction, normative and affective
commitment, and productivity. My objective was to provide information that will heighten
the awareness of various stakeholders of organizations, of such situations and inform their
actions to address them.
Research Design and Approach
Three main research questions and associated hypotheses were utilized in addressing
the gap in the extant literature:

36
RQ1: Do cultural dissimilarities between host country nationals and expatriates
predict the job satisfaction, affective commitment, normative commitment, or productivity of
host country nationals?
H01: Cultural dissimilarities between host country nationals and expatriates does not
predict their job satisfaction.
Ha1: Cultural dissimilarities between host country nationals and expatriates does
predict their job satisfaction.
H02: Cultural dissimilarities between host country nationals and expatriates does not
predict their affective commitment.
HA2: Cultural dissimilarities between host country nationals and expatriates does
predict their affective commitment.
H03: Cultural dissimilarities between host country nationals and expatriates does not
predict the normative commitment of host country nationals.
HA3: Cultural dissimilarities between host country national and expatriates does
predict the normative commitment of host country nationals.
Ho4: Cultural dissimilarities between host country nationals and expatriates does not
predict the productivity of host country nationals.
HA4: Cultural dissimilarities between host country nationals and expatriates does
predict the productivity of host country nationals.
RQ2: Do demographic factors of age, experience, and gender predict the job
satisfaction, affective commitment, normative commitment or productivity of host country
nationals?
H01: Demographic factors of age, experience, and gender do not predict host country
national’s job satisfaction.

37
Ha1: Demographic factors of age, experience, and gender do predict host country
national’s job satisfaction.
H02: Demographic factors of age, experience, and gender do not predict host country
national’s affective commitment.
HA2: Demographic factors of age, experience, and gender do predict host country
national’s perception of affective commitment.
H03: Demographic factors of age, experience, and gender do not predict host country
national’s normative commitment.
HA3: Demographic factors of age, experience, and gender do predict host country
national’s normative commitment.
Ho4: Demographic factors of age, experience, and gender do not predict host country
national’s productivity.
HA4: Demographic factors of age, experience, and gender do predict host country
national’s productivity.
RQ3: Does cultural dissimilarity between host country nationals and expatriates, in
conjunction with demographic factors of age, experience, and gender predict the job
satisfaction, affective commitment, normative commitment or productivity of host country
nationals?
H01: Cultural dissimilarities between host country nationals and expatriates in
conjunction with demographic factors of age, experience, and gender does not predict host
country national’s job satisfaction.
Ha1: Cultural dissimilarities between host country nationals and expatriates in
conjunction with demographic factors of age, experience, and gender does predict host
country national’s job satisfaction.

38
H02: Cultural dissimilarities between host country nationals and expatriates in
conjunction with demographic factors of age, experience, and gender do not predict host
country national’s affective commitment.
HA2: Cultural dissimilarities between host country nationals and expatriates in
conjunction with demographic factors of age, experience, and gender does predict host
country national’s affective commitment.
H03: Cultural dissimilarities between host country nationals and expatriates in
conjunction with demographic factors of age, experience, and gender does not predict host
country national’s normative commitment.
HA3: Cultural dissimilarities between host country nationals and expatriates in
conjunction with demographic factors of age, experience, and gender does predict host
country national’s normative commitment.
Ho4: Cultural dissimilarities between host country nationals and expatriates in
conjunction with demographic factors of age, experience, and gender does not predict host
country national’s productivity.
HA4: Cultural dissimilarities between host country nationals and expatriates in
conjunction with demographic factors of age, experience, and gender does predict host
country national’s productivity.
Settings and Sample
Participants
The target population for my study consisted of nationals who were employed in a
firm that has senior executives from a foreign country. The sampling frame for my study
consisted of employees of an energy company and a hospitality company. Therefore, I used a
list of employees of these organizations to establish the sampling frame. My sampling

39
strategy was to distribute survey instruments to employees of the respective organizations. I
determined that this strategy was appropriate because I hoped that it would increase uptake,
thereby providing a wider base for this study.
Inclusions consisted of individuals on the employment listing of the energy company
and the hospitality company. Exclusions consisted of temporary employees, employees who
were on probation at the time of the study, and employees who had been employed by their
organizations for less than a year. The rationale for these exclusions was that these
employees may not have been sufficiently knowledgeable or may have been particularly
mindful of possible repercussions of participation on their tenure.
I met with the management of the targeted organizations to secure their support for
the research. During the meetings I highlighted the implications for social change and
requested that representatives encourage their members to participate in the process by
informing them of these implications. After this process was completed and the letter of
cooperation received from each organization, I provided the employees with the survey
instruments along with an informed consent form. Participants were also informed of their
option to withdraw from the study at any time without penalty and of the measures that I
would implement to respect confidentiality. The survey documents were given to
departmental heads for distribution along with envelopes for their return. Departmental
heads were required to return all surveys whether they were completed or not, thereby
ensuring the privacy of participants. At the end of the study, I sent organizational partners a
summary of the findings. Neither I nor the participants had any obligation to the other at the
end of the study because their participation was entirely voluntary.
I determined that the sample size for my study needed to be 120. I made this
determination based on a desired statistical power of 0.8, nine predictors, and a probability

40
level of 0.05. I noted that using a large effect of 0.35 yielded a sample of 54, while a medium
effect of 0.15 yielded a sample of 113. I set the targeted sample size at 120 to ensure that
even if circumstances prevented achievement of this exact number of participants, the sample
would still be within the acceptable range.
I administered a paper-based survey (see Appendix A) to obtain information in
relation to the dependent and independent variables. I used the scales discussed in the next
section to measure the variables.
Instrumentation
I measured job satisfaction using Resnick and Bond’s (2001) Indiana Job Satisfaction
Scale because of its versatility, excellent psychometric properties, and wide coverage. A
review of several of the job satisfaction scales revealed deficiencies in one or more of the
important areas, and several of them did not cover as many areas of job satisfaction as this
scale does. This scale consists of responses measured on a 4-point Likert scale ranging from
1(strongly agree) to 4 (strongly disagree). An example of a test item from the scale is “I am
happy with the amount this job pays” (Resnick & Bond, 2001). The psychometric properties
were evaluated by Resnick and Bond as excellent. The internal consistency coefficients in
relation to the subscales range between .83 and .41. Additionally, Resnick and Bond
indicated that the instrument was acceptable in regards to both face and construct validity.
I measured productivity using self-reports and the Work Effort Scale Pepermans,
Jegers, Van Acker, De Cooman, & De Gieter, 2009). This scale measures the three elements
of productivity: intensity, direction, and persistence. It is a self-report scale composed of 10
items measured on a 7-point scale. The reliability of the test items was assessed with the test
–retest technique and the total scale has a reliability of Cronbach’s alpha coefficient of .9 and
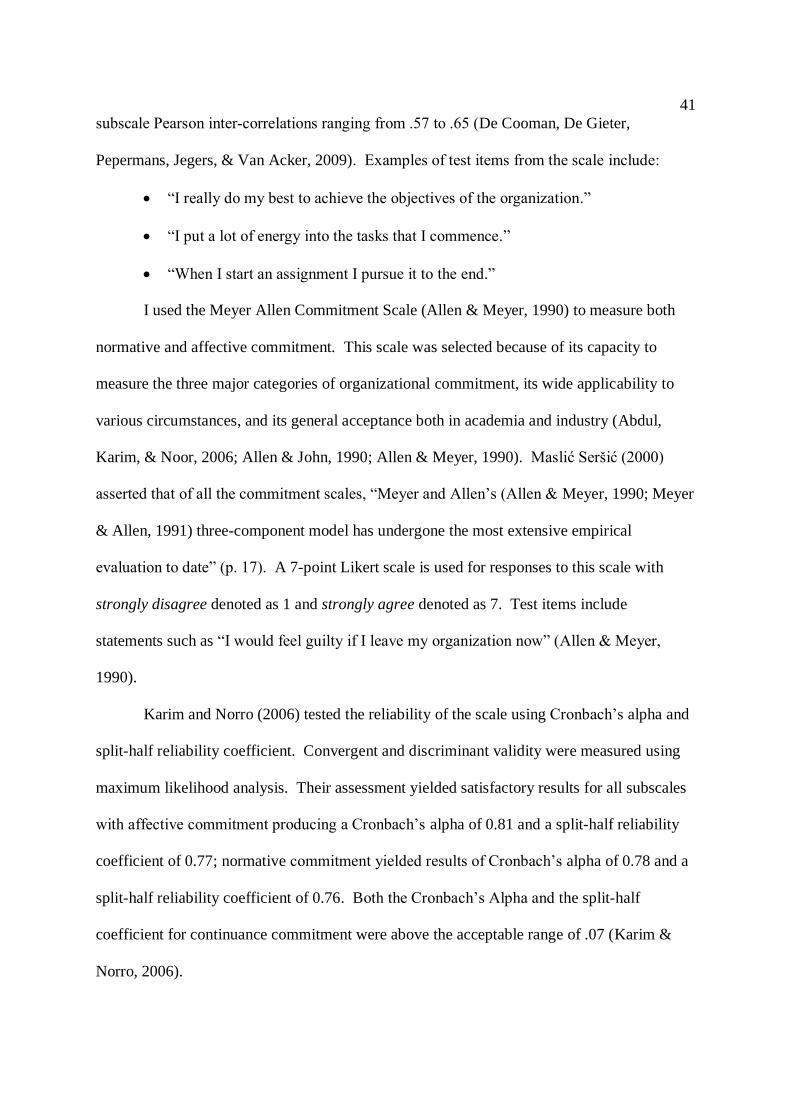
41
subscale Pearson inter-correlations ranging from .57 to .65 (De Cooman, De Gieter,
Pepermans, Jegers, & Van Acker, 2009). Examples of test items from the scale include:
• “I really do my best to achieve the objectives of the organization.”
• “I put a lot of energy into the tasks that I commence.”
• “When I start an assignment I pursue it to the end.”
I used the Meyer Allen Commitment Scale (Allen & Meyer, 1990) to measure both
normative and affective commitment. This scale was selected because of its capacity to
measure the three major categories of organizational commitment, its wide applicability to
various circumstances, and its general acceptance both in academia and industry (Abdul,
Karim, & Noor, 2006; Allen & John, 1990; Allen & Meyer, 1990). Maslić Seršić (2000)
asserted that of all the commitment scales, “Meyer and Allen’s (Allen & Meyer, 1990; Meyer
& Allen, 1991) three-component model has undergone the most extensive empirical
evaluation to date” (p. 17). A 7-point Likert scale is used for responses to this scale with
strongly disagree denoted as 1 and strongly agree denoted as 7. Test items include
statements such as “I would feel guilty if I leave my organization now” (Allen & Meyer,
1990).
Karim and Norro (2006) tested the reliability of the scale using Cronbach’s alpha and
split-half reliability coefficient. Convergent and discriminant validity were measured using
maximum likelihood analysis. Their assessment yielded satisfactory results for all subscales
with affective commitment producing a Cronbach’s alpha of 0.81 and a split-half reliability
coefficient of 0.77; normative commitment yielded results of Cronbach’s alpha of 0.78 and a
split-half reliability coefficient of 0.76. Both the Cronbach’s Alpha and the split-half
coefficient for continuance commitment were above the acceptable range of .07 (Karim &
Norro, 2006).

42
I measured perceptions of cultural diversity using Black and Stephens’ (1989) Culture
Novelty Scale. The scale consists of eight items measured on a 5- point Likert scale ranging
from 1 (very similar) to 5 (very dissimilar). Originally the scale was used to assess
expatriates’ views on the cultural differences between the host country and American
expatriates. The respondents were asked to indicate how similar or dissimilar the host-
country culture was from theirs by rating the cultural differences of the items. I used four of
the eight items for this study. Examples of the test items that participants were requested to
rate in terms of cultural similarity or dissimilarity were everyday customs that must be
followed and climate. I considered this scale appropriate even though I used it for the host
country nationals instead of expatriates. The internal reliability of the scale has been reported
as Cronbach’s alpha of .64 (Black & Stephens, 1989).
Analysis
After collecting the data for this study, data cleaning and analysis was done primarily
with the use of the Statistical Package for Social Sciences (SPSS). Data screening and
cleaning were conducted, in an attempt to remove data that was incorrect, incomplete or
outliers that could skew the dataset. This attempt was necessary to reduce/eliminate
erroneous results and validity issues. Manual data cleaning was also utilized by examining
the data to identity obvious errors or missing data. Additionally, SPSS functions were used
to identify less obvious errors including reverse coding and missing data. The SPSS tools
that were used include, but are not limited to, frequency analysis, replacement of missing data
with series mean, and reverse coding techniques.
Thereafter statistical analysis was embarked upon. The analysis of the data collected
in respect of all 12 sets of hypotheses included the generation of descriptive statistics,
calculation of Pearson’s correlation, as well as multiple regression analysis. Regression

43
analysis was conducted in respect of the various variables to identify any relationship, as well
as multiple regression to determine the combined impact of the variables. It is noted further
that age, experience, and gender were included in the multiple regression in light of the
possibility of them being confounders. Given the fact that there were several regression
analyses, the requisite checks were made for family errors and the appropriate adjustments
made.
Ethical and Legal Considerations
In administering the survey I took cognizance of the attending ethical and legal issues
as well as the issues relating to the context and bias. In relation to ethics, I ensured that I
obtained documented informed consent from participants and that it was based on full
disclosure of the scope of the study. I also advised the participants of the means by which the
information would be recorded, their option to withdraw from the study at any time, as well
as the measures that would be implemented to ensure their privacy. Anonymity was achieved
by not using names in reporting, instead participant IDs were utilized.
Due to the voluminous amount of data generated by this study, an appropriate data
management and analysis plan was required. The following data management procedures
were utilized to maintain the integrity of the data (Creswell & Creswell, 2014):
• Backup copies of files were created
• High quality equipment and material including recording devices were utilized
• A master list of information categories was created
• Codes were used in datasets.
These measures were utilized to ensure efficient and secure management of the data
collected.

44
The Institutional Review Board (IRB) approval was also obtained from Walden
University. This body has the responsibility to ensure the ethical correctness of all studies
within the university. By abiding by their dictates and obtaining the appropriate approvals,
the ethical correctness of the study was heightened.
Summary and Conclusion
This chapter has provided insight into the methodology that was utilized in the
examination of the selected variables. Specifically, it identified the instruments that were
used, rationale for their selection and the data analysis plan, as well as ethical considerations.
It provides a springboard for Chapter 4.
In chapter 4 I will provide specific information in respect to the data collection
activities. It will detail the procedures followed and the treatment of the data that was
collected.

45
Chapter 4: Data Analysis
Introduction
The purpose of this quantitative study was to identify the effects of cultural
dissimilarities between expatriates and host country nationals on key organizational
outcomes. I worked to answer three main research questions using four hypotheses each.
Several statistical methods were utilized to analyze the resultant data. This chapter provides
a summary of the results of the study and details of the sample population that was involved.
Data Collection
Sample Demographics
I collected data on the premises of two community partners: the energy company and
hospitality company. The energy company has several locations across the island of Jamaica.
Surveys were administered across the following parishes: St. Ann, St. Mary, Trelawny, St.
James, Kingston, St. Andrew. On average, the data collection period lasted for
approximately 5 days in each location.
Data was collected at the hospitality company over a 2-week period. The process
took longer than was originally expected, since it corresponded with one of the hotel’s busiest
periods (winter tourist season) and the fact that the parish was under a “state of emergency”
with enforced curfews.
My initial plan was to collect data from four community partners. However, because
I only received approval from the energy company, I had to seek different community
partners. After a period of prepositioning, the hospitality company’s management consented
to allow their employees to participate in the survey, and after obtaining the requisite
approval from the Walden University IRB, I commenced data collection (see Appendix B).

46
The two that consented to participate represented a good sample of the population.
The hospitality company is one of the larger hotels in Jamaica, and it falls within the tourism
sector, which is the fourth largest employment sector in Jamaica (Statistical Institute of
Jamaica, 2017). The other partner, the energy company, fuels all productive activities in the
island.
Descriptive statistics on a sample of 110 participants included age, gender,
organization, number of years employed, and employment category. Age data were
categorized based on three categories: 1 (18 -30 years), 2 (31-45 years), and 3 (above 45
years). Gender data were based on membership in one of two categories: 1 (man), and 2
(woman). I categorized the organization data into two categories: 1 (the energy company)
and 2 (the hospitality company). Finally, I organized employment data into four categories: 1
(clerical), 2 (supervisory), 3 (management), and 4 (other).
Participants (N = 110) were almost equally distributed between the energy company
(N = 58, 52.7%) and the hospitality company. (N = 52, 47.3%; see Table 1).
Table 1
Name of Organizations
Frequency Percent
Valid
Percent
Cumulative
Percent
Valid Energy Company 58 52.7 52.7 52.7
Hospitality Company 52 47.3 47.3 100.0
Total 110 100.0 100.0
Table 2 shows demographic characteristics of the sampled respondents (n =110).
Females accounted for more than 50% of the participants (n = 62, 56.40%), while the
remainder were males (n = 47, 42.70%), and missing data (n = 1, 0.90%). It must be noted
that a dummy variable was generated for gender to facilitate ordinary least square

47
calculations. More than 30% of participants (n = 42, 38.20%) reported their age to be in the
category 18-30, constituting the modal category. Of the remaining participants, nearly equal
proportion reported being in the category 31-45 (n = 35, 31.80%) and above 45 (n = 32,
29.10%) and there was one missing data. The employment category that accounted for the
largest proportion of participants was “clerical” (n = 32, 29.10%) and the one that accounted
for the least was “other” (n = 23, 20.90%), and missing data (n = 3, 2.70%). The smallest
number of years employed was 1 and the maximum was 31 (range = 30). The mean number
of years was 11 (SD = 8.73), and the mode was 2 years.
Table 2
Demographic Characteristics of Sampled Respondents, N = 110
Details n %
Age group
18 -30 years 42 38.5
31 – 45 years 35 32.1
Above 45 32 29.4
109 99.1
Gender
Man 47 43.1
Woman 62 56.9
Category of employment
Clerical 32 29.9
Supervisory 25 23.4
Management 27 25.2
Other 23 21.5
Results
Scale Demographics
All scales that I used in this study were established scales whose suitability and
reliability I discussed in Chapter 3. In preparation for the use of the scales, I consulted the
respective authors’ instructions determine any need for recoding. It must be noted that
though the authors of the Culture Novelty Scale did not include instructions for recoding, I
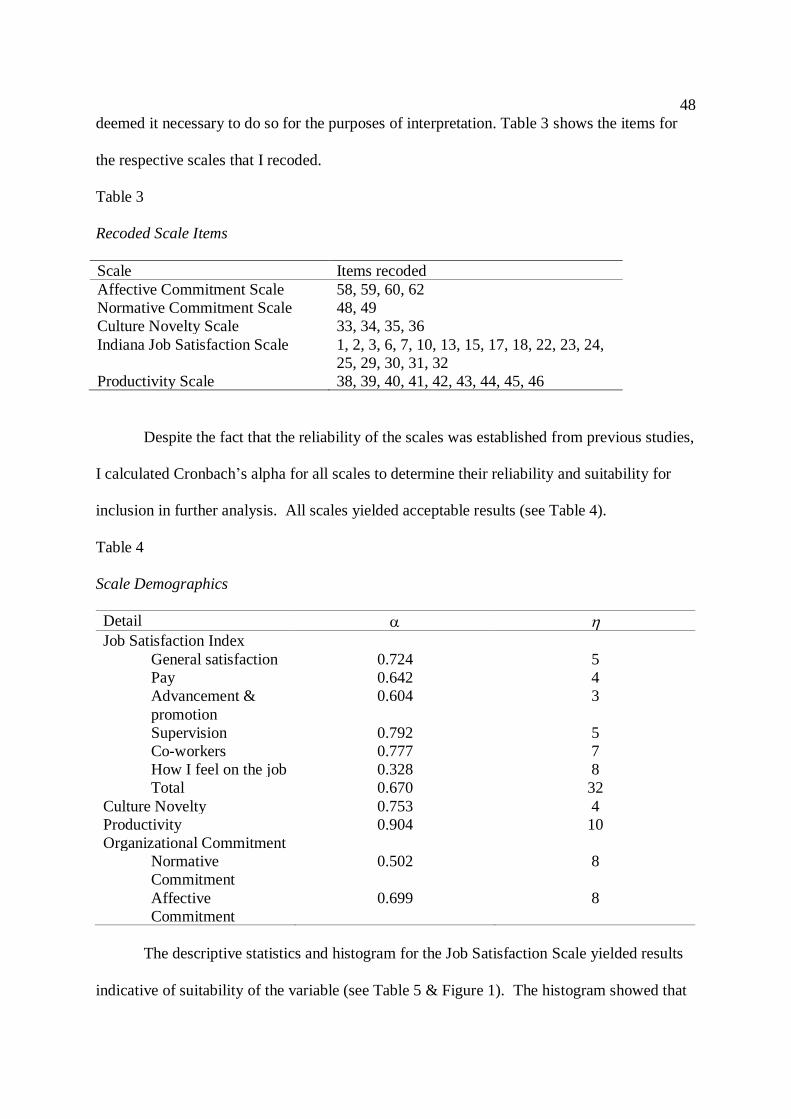
48
deemed it necessary to do so for the purposes of interpretation. Table 3 shows the items for
the respective scales that I recoded.
Table 3
Recoded Scale Items
Scale Items recoded
Affective Commitment Scale 58, 59, 60, 62
Normative Commitment Scale 48, 49
Culture Novelty Scale 33, 34, 35, 36
Indiana Job Satisfaction Scale 1, 2, 3, 6, 7, 10, 13, 15, 17, 18, 22, 23, 24,
25, 29, 30, 31, 32
Productivity Scale 38, 39, 40, 41, 42, 43, 44, 45, 46
Despite the fact that the reliability of the scales was established from previous studies,
I calculated Cronbach’s alpha for all scales to determine their reliability and suitability for
inclusion in further analysis. All scales yielded acceptable results (see Table 4).
Table 4
Scale Demographics
Detail
Job Satisfaction Index
General satisfaction 0.724 5
Pay 0.642 4
Advancement &
promotion
0.604 3
Supervision 0.792 5
Co-workers 0.777 7
How I feel on the job 0.328 8
Total 0.670 32
Culture Novelty 0.753 4
Productivity 0.904 10
Organizational Commitment
Normative
Commitment
0.502 8
Affective
Commitment
0.699 8
The descriptive statistics and histogram for the Job Satisfaction Scale yielded results
indicative of suitability of the variable (see Table 5 & Figure 1). The histogram showed that

49
the distribution was relatively normally distributed (see also, skewness = 0.024 in Table 5),
with a mean of 80.1±8.9 of a 95% confidence interval that lies between 81.75 and 78.38.
Table 5
Descriptives: Job Satisfaction Scale
Statistic Std. Error
Job Satisfaction
Scale
Mean 80.0636 .85117
95% confidence
interval for mean
Lower
Bound
78.3767
Upper
Bound
81.7506
5% trimmed mean 80.0455
Median 80.0000
Variance 79.693
Std. deviation 8.92710
Minimum 53.00
Maximum 108.00
Range 55.00
Interquartile range 10.00
Skewness .024 .230
Kurtosis 1.553 .457
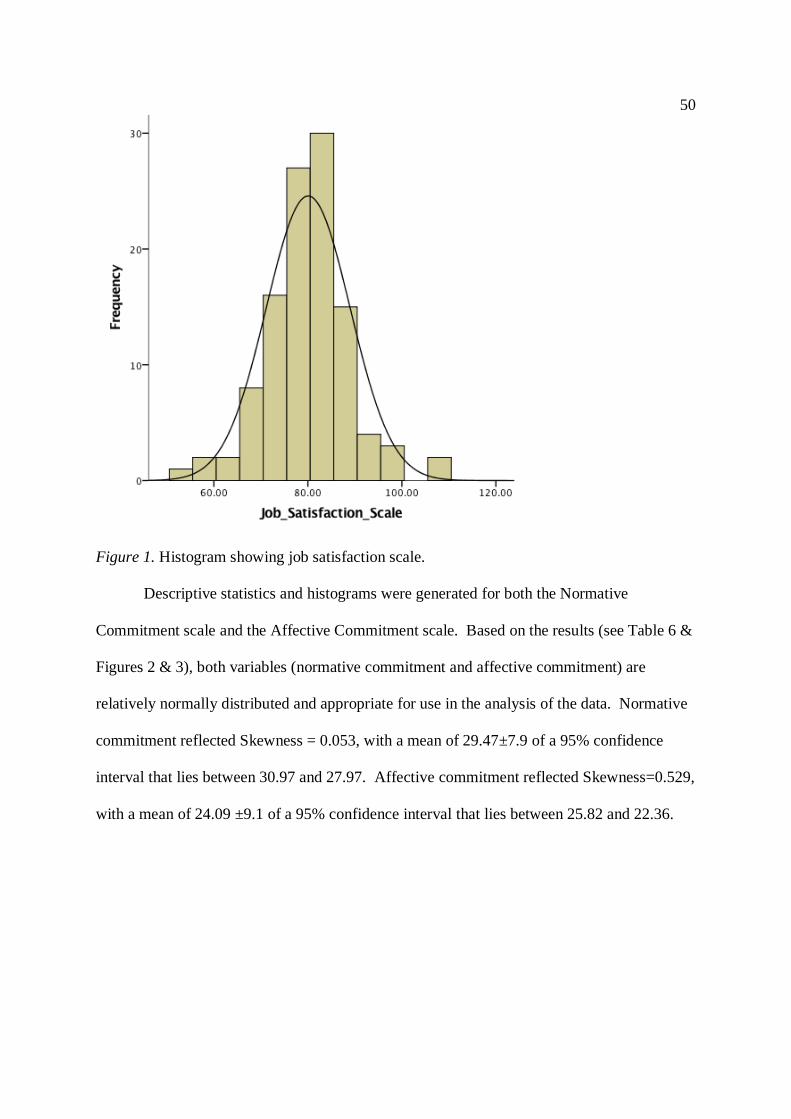
50
Figure 1. Histogram showing job satisfaction scale.
Descriptive statistics and histograms were generated for both the Normative
Commitment scale and the Affective Commitment scale. Based on the results (see Table 6 &
Figures 2 & 3), both variables (normative commitment and affective commitment) are
relatively normally distributed and appropriate for use in the analysis of the data. Normative
commitment reflected Skewness = 0.053, with a mean of 29.47±7.9 of a 95% confidence
interval that lies between 30.97 and 27.97. Affective commitment reflected Skewness=0.529,
with a mean of 24.09 ±9.1 of a 95% confidence interval that lies between 25.82 and 22.36.

51
Table 6
Descriptives: Normative and Affective Commitment
Statistic Std. Error
Normative_commitment Mean 29.4679 .75628
95% Confidence Interval
for Mean
Lower Bound 27.9688
Upper Bound 30.9670
5% Trimmed Mean 29.3930
Median 30.0000
Variance 62.344
Std. Deviation 7.89581
Minimum 8.00
Maximum 52.00
Range 44.00
Interquartile Range 9.50
Skewness .053 .231
Kurtosis .339 .459
Affective_Commitment Mean 24.0917 .87277
95% Confidence Interval
for Mean
Lower Bound 22.3618
Upper Bound 25.8217
5% Trimmed Mean 23.7416
Median 22.0000
Variance 83.029
Std. Deviation 9.11200
Minimum 7.00
Maximum 51.00
Range 44.00
Interquartile Range 11.50
Skewness .529 .231
Kurtosis .046 .459
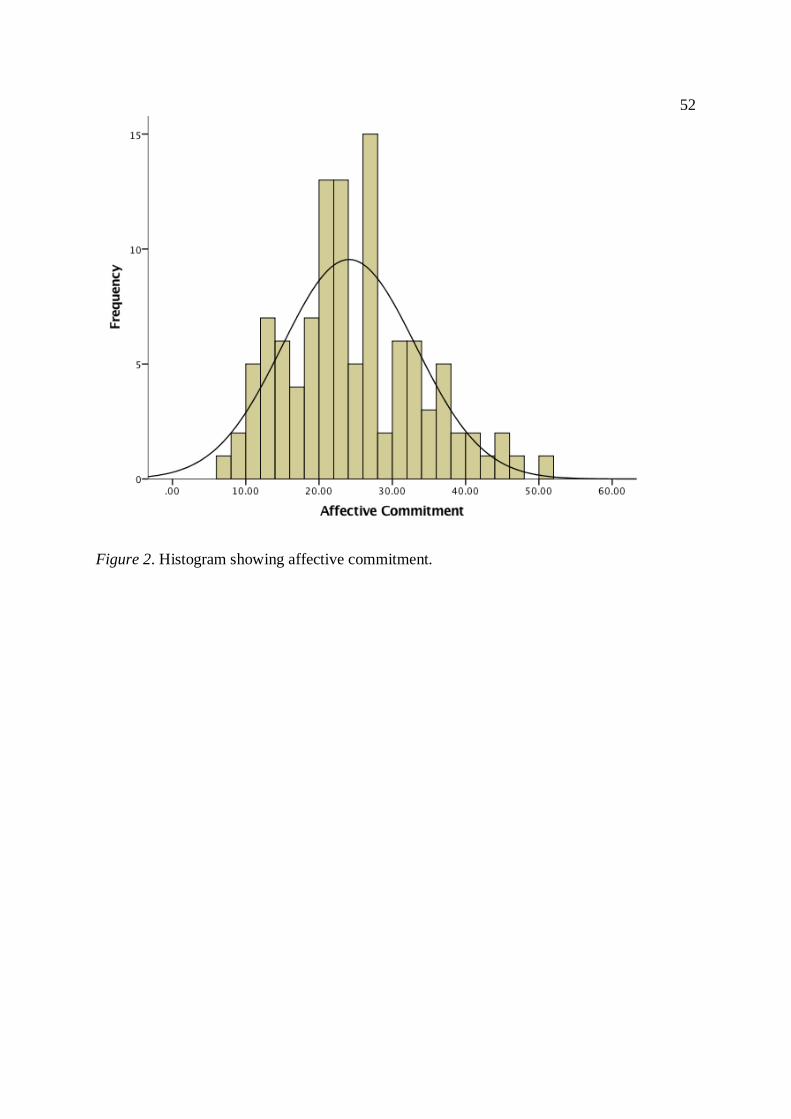
52
Figure 2. Histogram showing affective commitment.

53
Figure 3. Histogram showing normative commitment.
Based on the histogram and the descriptive statistics for the Culture Novelty Scale
seen in Table 7 and Figure 4 respectively, the variable is relatively normally distributed (see
also, skewness = -0.532 in Table 7), with a mean of 13.54±4.3 of a 95% confidence interval
that lies between 14.36 and 12.73.

54
Table 7
Descriptives: Culture Novelty Scale
Statistic Std. Error
Culture_Novelty_Scale Mean 13.5413 .41167
95% Confidence interval
for Mean
Lower Bound 12.7253
Upper Bound 14.3573
5% Trimmed mean 13.7238
Median 14.0000
Variance 18.473
Std. deviation 4.29800
Minimum 1.00
Maximum 20.00
Range 19.00
Interquartile range 6.00
Skewness -.532 .231
Kurtosis -.209 .459
Figure 4. Histogram showing culture novelty scale.

55
Figure 5 reveals that the Productivity scale is not normally distributed (see also,
Skewness = --3.366 in Table 8), with a mean of 61.7±4.6 of a 95% confidence interval that
lies between 62.60 and 60.83.
Notwithstanding the high Cronbach’s alpha obtained for the Work Effort Scale
(productivity), the fact that the data is heavily skewed renders it unsuitable for regression
statistical analysis (see Table 8 & Figure 5). This could be due to the fact that it was a self-
report scale but it could also be that the sectors and individuals in the sample were highly
productive. Consequently, the skewness would be accurate and reflective of actual high
levels of productivity, not just due to impression management or other factors.
Table 8
Descriptives: Productivity Scale
Statistic Std. Error
Productivity_Scale Mean 61.7130 .44556
95% Confidence interval
for Mean
Lower Bound 60.8297
Upper Bound 62.5962
5% Trimmed mean 62.2675
Median 64.0000
Variance 21.440
Std. deviation 4.63036
Minimum 33.00
Maximum 70.00
Range 37.00
Interquartile range 3.00
Skewness -3.366 .233
Kurtosis 16.229 .461

56
Figure 5. Histogram showing productivity scale.
Research Question 1
Do cultural dissimilarities between host country nationals and expatriates predict the
job satisfaction, affective commitment, normative commitment, or productivity of host
country nationals?
In light of the findings previously outlined regarding the unreliability of the
productivity scale, productivity was omitted from the calculations, consequently, regression
analysis were conducted to determine whether culture predicted any of the three remaining
dependent variables, job satisfaction, affective commitment, and normative commitment.
Research Question 1, Hypothesis 1. A linear regression analysis was applied in
order to decipher the predictive strength of culture on job satisfaction. Table 9 provides the

57
results of the linear regression. The adjusted R2 (R2 = 0.018), indicates that only 1.8% of the
variance in Job Satisfaction is explained by the model (Job Satisfaction = ƒ{Culture}). This
low adjusted R2 signals a weak relationship between culture and job satisfaction. The
Durbin-Watson (d = 1.633) does lie between the two critical values (1.5 < d < 2.5) which
means that the very critical assumption of the multiple regression analysis that requires
independence of observation, has been sufficiently met- inadvertently this means that there
are no auto-correlation in this model.
Table 9
Model Summaryb
Model R R
Square
Adjusted
R Square
Std. Error
of the
Estimate
Change Statistics Durbin-
Watson R Square
Change
F
Change
df1 df2 Sig. F
Change
1 .164a .027 .018 6.95448 .027 2.960 1 107 .088 1.633
a. Predictors: (Constant), Culture_Novelty
b. Dependent Variable: Job_Satisfaction
I determined, based on the results of the ANOVA shown in Table 10, to fail to reject
the null hypothesis (R2 = 0), therefore it was determined that the model (Job Satisfaction =
ƒ{Culture}) does not explain any variance in Job Satisfaction. Additionally, based on the sig
value (p = .088) it is clear that the F-ratio (f = 2.960) is not significant thereby revealing that
the model (culture) does not explain any variance in Job Satisfaction. This therefore shows
that the model does not statistically significantly predict Job Satisfaction, F(1, 107) = 2.960,
p = 0.088.

58
Table 10
ANOVA: Job Satisfaction
Model Sum of Squares df Mean Square F Sig.
1
Regressio
n
143.157 1 143.157 2.960 .088b
Residual 5175.027 107 48.365
Total 5318.183 108
a. Dependent Variable: Job_Satisfaction
b. Predictors: (Constant), Culture_Novelty
Despite the fact that Linear Regression finds that culture does not predict job
satisfaction, the Pearson Correlation finds that there is in fact some correlation between the
two variables (r = .164, n = 108, p = .044) (see Table 11). This is demonstrated by the p-
value (p = 0.044), which therefore indicates that there is a statistically significant correlation
between the two variables so even in the absence of predictive power of culture on job
satisfaction, Pearson’s correlation finds that there is correlation between the two variables
and that this correlation is a positive one (r = .164).

59
Table 11
Correlations: Job Satisfaction and Culture Novelty
Job_Satisfaction Culture_Novelty
Pearson Correlation Job_Satisfaction 1.000 .164
Culture_Novelty .164 1.000
Sig. (1-tailed) Job_Satisfaction . .044
Culture_Novelty .044 .
N Job_Satisfaction 109 109
Culture_Novelty 109 109
Research Question 1, Hypothesis 2. A linear regression analysis was applied in
order to decipher the predictive strength of culture on affective commitment. Table 12
reveals an adjusted R2 (R2 = .009), that indicates that only 0.9% of the variance in Affective
Commitment is explained by the model (culture). This low adjusted R2 signals a weak
relationship between culture and affective commitment. This is also further compounded by
the fact that the Durbin -Watson (d = 1.406) does not lie between the two critical values (1.5
< d < 2.5) which means that the very critical assumption of the multiple regression analysis
that requires independence of observation, has not been sufficiently met- inadvertently this
means that there may be auto-correlation in this model. The findings of the model (Affective
Commitment =ƒ{Culture}) must therefore be interpreted within the context of this unmet
assumption.

60
Table 12
Model Summary: Affective Commitment
Model R R
Square
Adjusted
R Square
Std.
Error of
the
Estimate
Change Statistics Durbin-
Watson R Square
Change
F
Change
df1 df2 Sig. F
Change
1 .021a .000 -.009 8.93456 .000 .045 1 106 .833 1.406
a. Predictors: (Constant), Culture_Novelty
b. Dependent Variable: Affective_Commitment
Based on Table 13, the decision was made to fail to reject the null hypothesis (R2 = 0)
that the model does not explain any variance in affective commitment. Based on the sig
value (p = .833) it was clear that the F-ratio (f = .045) is not significant thereby revealing that
the model (culture) does not explain any variance in Affective Commitment. This therefore
shows that the model does not statistically significantly predict Affective Commitment, F(1,
106) = .045, p = 0.833.
Table 13
ANOVA: Affective Commitment
Model Sum of Squares df Mean Square F Sig.
1
Regression 3.586 1 3.586 .045 .833b
Residual 8461.599 106 79.826
Total 8465.185 107
a. Dependent Variable: Affective_Commitment
b. Predictors: (Constant), Culture_Novelty

61
The Pearson Correlation (see Table 14) also aligns with the findings of the linear
regression by showing that there is no correlation between culture and affective commitment
(r = -.021, n = 108, p = .833).
Table 14
Correlations: Culture Novelty and Affective Commitment
Culture_Novelty Affective_Commitment
Culture_Novelty
Pearson
Correlation 1 -.021
Sig. (2-tailed) .833
N 109 108
Affective_Commitment
Pearson
Correlation -.021 1
Sig. (2-tailed) .833
N 108 109
Research Question 1, Hypothesis 3. A linear regression analysis was applied in
order to decipher the predictive strength of culture on normative commitment. From
examining Table 15, based on the adjusted R2 (R2 = .014), only 1.4% of the variance in
normative commitment is explained by the model (Normative Commitment = ƒ{Culture}).
This low adjusted R2 signals a weak relationship between culture and normative commitment.
The Durbin-Watson (d = 1.942) lies between the two critical values (1.5 < d < 2.5). This
means that the very critical assumption of the multiple regression analysis that requires
independence of observation, has been sufficiently met. Inadvertently this means that there is
no auto-correlation in this model. Consequently, the data is a good fit for the model
(Normative Commitment = ƒ{Culture}).

62
Table 15
Model Summaryb
Model R R
Square
Adjusted
R Square
Std.
Error of
the
Estimate
Change Statistics Durbin-
Watson R Square
Change
F
Change
df1 df2 Sig. F
Change
1 .118a .014 .005 8.16790 .014 1.509 1 106 .222 1.942
a. Predictors: (Constant), Culture_Novelty
b. Dependent Variable: Normative_Commitment
In analyzing Table 16, I failed to reject the null hypothesis (R2 = 0) that the model
does not explain any variance in normative commitment. Based on the sig value (p = .222) it
is clear that the F-ratio (f = 1.509) is not significant thereby revealing that the model does not
explain any variance in Normative Commitment. This therefore shows that the model does
not statistically significantly predict normative commitment, F(1, 106) = 1.509, p = 0.222.
Table 16
ANOVA: Culture and Normative Commitment
Model Sum of
Squares
df Mean
Square
F Sig.
1
Regression 100.660 1 100.660 1.509 .222b
Residual 7071.748 106 66.715
Total 7172.407 107
a. Dependent Variable: Normative_Commitment
b. Predictors: (Constant), Culture_Novelty

63
The Pearson Correlation also aligns with the findings of the linear regression by
showing that there is no correlation between culture and normative commitment (r = -.118, n
= 108, p = .111) (see Table 17).
Table 17
Correlations: Culture and Normative Commitment
Normative_Commitment Culture_Novelty
Pearson
Correlation
Normative_Commitment 1.000 -.118
Culture_Novelty -.118 1.000
Sig. (1-tailed) Normative_Commitment . .111
Culture_Novelty .111 .
N Normative_Commitment 108 108
Culture_Novelty 108 108
Research Question 2
Do demographic factors of age, experience, and gender predict the job satisfaction,
affective commitment, normative commitment or productivity of host country nationals?
Productivity was also omitted from this research question due to the unreliability of the scale,
consequently, research question 4 was not included.
Research Question 2, Hypothesis 1. From examining Table 18, adjusted R2 (R2 =
.019), 1.9% of the variance in Job Satisfaction is explained by the model (Job
Satisfaction=ƒ{Gender, Age, Experience}). The Durbin-Watson (d = .162) does not lie
between the two critical values (1.5 < d < 2.5). This means that the very critical assumption
of the multiple regression analysis that requires independence of observation, has not been
sufficiently met, inadvertently this means that there may be auto-correlation in this model.
The findings of the model must therefore be interpreted within the context of this unmet
assumption.

64
Table 18
Model Summary: Job Satisfaction
Model R R
Square
Adjusted
R Square
Std.
Error of
the
Estimate
Change Statistics Durbin-
Watson R
Square
Change
F
Chang
e
df1 df2 Sig. F
Change
1 .148a .022 .019 6.84491 .022 7.586 3 1016 .000 .162
a. Predictors: (Constant), Male, Age, Number of Years Employed
b. Dependent Variable: Job_Satisfaction
In analyzing Table 19, the decision was taken to reject the null hypothesis (R2 = 0)
that the model does not explain any variance in Job Satisfaction. Based on the sig value (p =
.001) it is clear that the F-ratio (f = 7.586) is highly significant thereby revealing that the
model does in fact explain some variance in Job Satisfaction. This therefore shows that the
model statistically significantly predicts Job Satisfaction, F(3, 1016) = 7.586, p < 0.001; the
regression model is therefore a good fit of the data.
Table 19
Anova: Job Satisfaction
Model Sum of
Squares
df Mean
Square
F Sig.
1
Regression 1066.246 3 355.415 7.586 .000b
Residual 47602.480 1016 46.853
Total 48668.725 1019
a. Dependent Variable: Job_Satisfaction
b. Predictors: (Constant), Male, Age, Number of Years Employed

65
Table 20 shows that number of years employed is the only statistically significant
predictor of Job Satisfaction (p = 0.001). The statistics further affirms this by showing that
number of years employed has the greatest effect on Job Satisfaction (t = -3.731). The data
shows that when all other variables remain constant, for every 1 year of increase in
employment, job satisfaction increases by 0.130; thereby showing a positive correlation
between the two variables. The data also shows that for every 1 standard deviation in the
number of years employed, there is .164 standard deviation in Job Satisfaction. Additionally,
Table 20 shows that the data further meets the assumptions by showing that there is
multicollinearity; [(Tolerance =.500) > 0.1] as well as [(VIF = 2.001) < 10] and all the other
independent variables meet the multicollinearity requirement for the test.
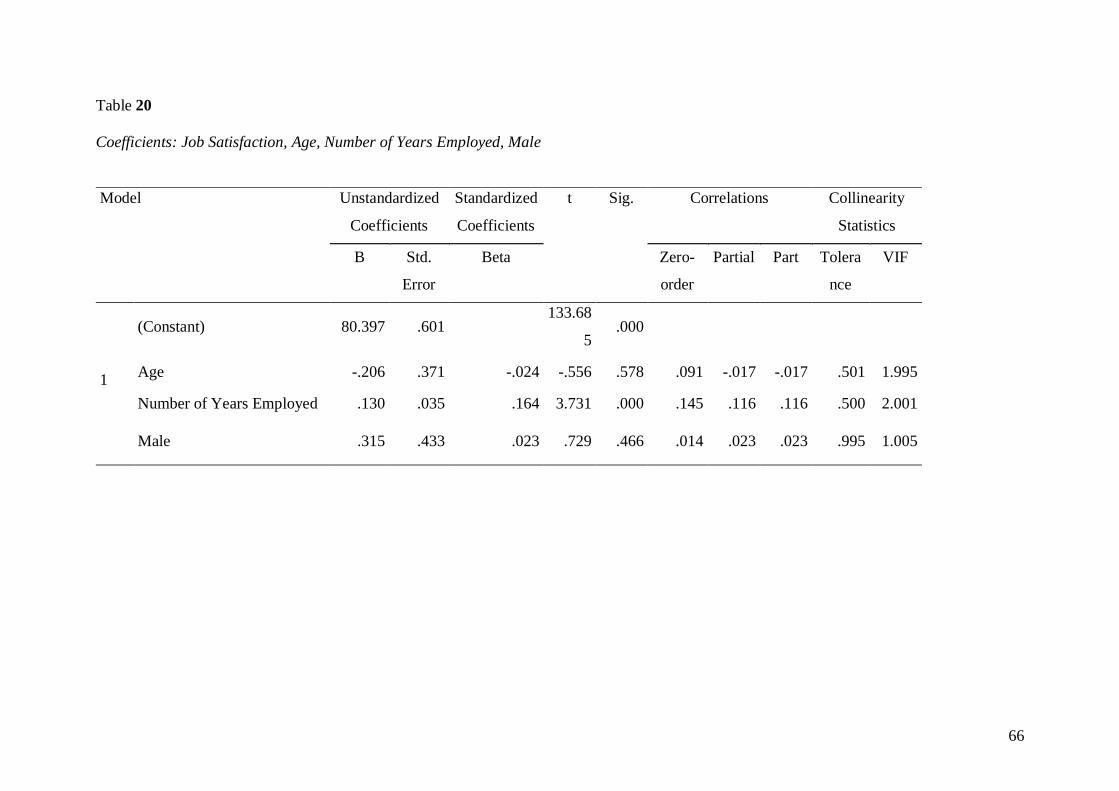
66
Table 20
Coefficients: Job Satisfaction, Age, Number of Years Employed, Male
Model Unstandardized
Coefficients
Standardized
Coefficients
t Sig. Correlations Collinearity
Statistics
B Std.
Error
Beta Zero-
order
Partial Part Tolera
nce
VIF
1
(Constant) 80.397 .601 133.68
5 .000
Age -.206 .371 -.024 -.556 .578 .091 -.017 -.017 .501 1.995
Number of Years Employed .130 .035 .164 3.731 .000 .145 .116 .116 .500 2.001
Male .315 .433 .023 .729 .466 .014 .023 .023 .995 1.005

67
Despite the fact that the multiple regression finds that only number of years employed
predicts Job Satisfaction, the Pearson Correlation finds that there is in fact some correlation
between the number of years employed (r = .145, n = 108, p = .001) and age (r = .091, n =
108, p = .002) (see Table 21). Owing to the fact that the p-values (p = 0.001, .002) there is a
statistically significant correlation between the two variables (experience and age) and the
dependent variable Job Satisfaction so even in the absence of predictive power of age on Job
Satisfaction, Pearson’s correlation finds that there is correlation between the two variables.
In both the cases of age and experience there are positive correlations (r = .145, r = .091)
which means that as age and experience increases, Job Satisfaction increases in this model. It
must be noted that these correlations though present are weak.

68
Table 21
Corre1ations: Job Satisfaction, Age, Number of Years Employed, Male
Research Question 2, Hypothesis 2. Based on the adjusted R2 (R2 = .218), 21.8% of
the variance in Affective commitment is explained by the model (see Table 22). The Durbin-
Watson (d = 1.874) does lie between the two critical values (1.5 < d < 2.5) which means that
the very critical assumption of the multiple regression analysis that requires independence of
observation, has been sufficiently met- inadvertently this means that there may be auto-
correlation in this model (Affective Commitment =ƒ{Gender, Age, Experience}). This
shows that the data is a good fit to the model.
Job_
Satisfaction
Age Number of
Years
Employed
Male
Pearson
Correlation
Job_Satisfaction 1.000 .091 .145 .014
Age .091 1.000 .706 -.006
Number of Years
Employed .145 .706 1.000 -.052
Male .014 -.006 -.052 1.000
Sig. (1-tailed)
Job_Satisfaction . .002 .000 .325
Age .002 . .000 .428
Number of Years
Employed .000 .000 . .047
Male .325 .428 .047 .
N
Job_Satisfaction 102 102 102 102
Age 102 102 102 102
Number of Years
Employed 102 102 102 102
Male 102 102 102 102
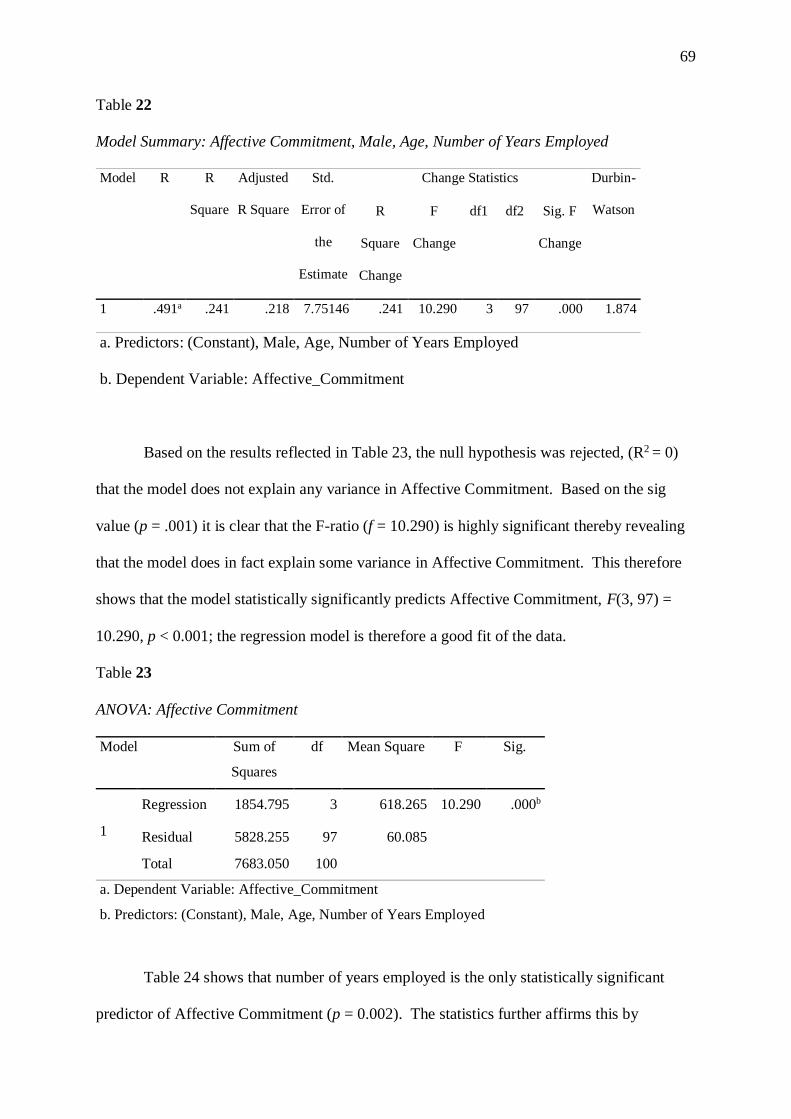
69
Table 22
Model Summary: Affective Commitment, Male, Age, Number of Years Employed
Model R R
Square
Adjusted
R Square
Std.
Error of
the
Estimate
Change Statistics Durbin-
Watson R
Square
Change
F
Change
df1 df2 Sig. F
Change
1 .491a .241 .218 7.75146 .241 10.290 3 97 .000 1.874
a. Predictors: (Constant), Male, Age, Number of Years Employed
b. Dependent Variable: Affective_Commitment
Based on the results reflected in Table 23, the null hypothesis was rejected, (R2 = 0)
that the model does not explain any variance in Affective Commitment. Based on the sig
value (p = .001) it is clear that the F-ratio (f = 10.290) is highly significant thereby revealing
that the model does in fact explain some variance in Affective Commitment. This therefore
shows that the model statistically significantly predicts Affective Commitment, F(3, 97) =
10.290, p < 0.001; the regression model is therefore a good fit of the data.
Table 23
ANOVA: Affective Commitment
Model Sum of
Squares
df Mean Square F Sig.
1
Regression 1854.795 3 618.265 10.290 .000b
Residual 5828.255 97 60.085
Total 7683.050 100
a. Dependent Variable: Affective_Commitment
b. Predictors: (Constant), Male, Age, Number of Years Employed
Table 24 shows that number of years employed is the only statistically significant
predictor of Affective Commitment (p = 0.002). The statistics further affirms this by
70
showing that number of years employed has the greatest effect on Job Satisfaction (t = -
3.192). The data shows that when all other variables remain constant- for every 1 year of
increase in employment, affective commitment decreases by -0.399; thereby showing a
negative correlation between the two variables. The data also shows that for every 1 standard
deviation in the number of years employed, there is -0.397 standard deviation in Affective
Commitment. Additionally, Table 24 shows that the data further meets the assumptions by
showing that there is multicollinearity; [(Tolerance =.506) > 0.1] as well as [(VIF = 1.982) <
10] and all the other independent variables meet the multicollinearity requirement for the test.

71
Table 24
Coefficients: Affective Commitment
Model Unstandardized
Coefficients
Standardized
Coefficients
t Sig. Correlations Collinearity
Statistics
B Std. Error Beta Zero-
order
Partial Part Tolerance VIF
1
(Constant) 32.167 2.181 14.750 .000
Age -1.290 1.332 -.120 -.968 .335 -.398 -.098 -.086 .506 1.975
Number of
Years Employed
-.399 .125 -.397 -3.192 .002 -.477 -.308 -.282 .505 1.982
Male -1.370 1.556 -.078 -.881 .381 -.051 -.089 -.078 .995 1.005

72
Despite the fact that the multiple regression finds that only number of years employed
predicts Affective Commitment, the Pearson Correlation finds that there is in fact some
correlation between the number of years employed (r = -.477, n = 108, p = .001) and age (r =
-.398, n = 108, p = 0.001) (see Table 25). Owing to the fact that the p-values (p = 0.001)
there is a statistically significant correlation between the two variables (experience and age)
and the dependent variable Affective Commitment so even in the absence of predictive power
of age on Affective commitment, Pearson’s correlation finds that there is correlation between
the two variables. In both the cases of age and experience there are negative correlations (r =
-.398, r = -.477) which means that as age and experience increases, affective commitment
decreases.
Table 25
Correlations: Affective Commitment, Age, Number of Years Employed, Male
Affective_
Commitment
Age Number of
Years
Employed
Male
Pearson
Correlation
Affective_Commitment 1.000 -.398 -.477 -.051
Age -.398 1.000 .702 -.016
Number of Years
Employed -.477 .702 1.000 -.062
Male -.051 -.016 -.062 1.000
Sig. (1-tailed)
Affective_Commitment . .000 .000 .305
Age .000 . .000 .436
Number of Years
Employed .000 .000 . .268
Male .305 .436 .268 .
N
Affective_Commitment .101 101 101 101
Age 101 101 101 101
Number of Years
Employed 101 101 101 101
Male 101 101 101 101

73
Research Question 2, Hypothesis 3. Table 26 shows that based on the adjusted R2
(R2 = .024), only 2.4% of the variance in Normative Commitment is explained by the model
(Normative Commitment =ƒ{Gender, Age, Experience}). The Durbin-Watson (d = 1.950)
lies between the two critical values (1.5 < d < 2.5). This means that the very critical
assumption of the multiple regression analysis that requires independence of observation, has
been sufficiently met- inadvertently this means that there was no auto-correlation in this
model.
Table 26
Model Summary: Normative Commitment
Model R R
Square
Adjusted
R Square
Std.
Error of
the
Estimate
Change Statistics Durbin-
Watson R
Square
Change
F
Change
df1 df2 Sig. F
Change
1 .083a .007 -.024 8.33817 .007 .224 3 97 .880 1.950
a. Predictors: (Constant), Male, Age, Number of Years Employed
b. Dependent Variable: Normative_Commitment
Based on the results reflected in Table 27, I failed to reject the null hypothesis (R2 =
0) that the model does not explain any variance in Normative Commitment. Based on the sig
value (p = .880) it is clear that the F-ratio (f = .224) which is less than 1, is not statistically
significant thereby revealing that the model does not explain nor predict variance in
Normative Commitment. This therefore shows that the model cannot statistically
significantly predict Normative Commitment, F(3, 97) = .224, p < 0.880; the regression
model is therefore not a good fit of the data. These findings therefore reveal that Age,
Gender, nor Years of Employment affect nor predict Normative Commitment.

74
Table 27
ANOVA: Normative Commitment
Model Sum of
Squares
df Mean
Square
F Sig.
1
Regression 46.695 3 15.565 .224 .880b
Residual 6743.939 97 69.525
Total 6790.634 100
a. Dependent Variable: Normative_Commitment
b. Predictors: (Constant), Male, Age, Number of Years Employed
Research Question 3
Does cultural dissimilarity between host country nationals and expatriates, in
conjunction with demographic factors of age, experience, and gender predict the job
satisfaction, affective commitment, normative commitment or productivity of host country
nationals?
Productivity was also omitted from these calculations rendering hypothesis 4
irrelevant.
Research Question 3, Hypothesis 1. From examining Table 28, the researcher found
that based on the adjusted R2 (R2 = .011), only 1.1% of the variance in Job Satisfaction was
explained by the model (Job Satisfaction=ƒ{Gender, Age, Experience, Culture}) . The
Durbin-Watson (d = 1.647) lies between the two critical values (1.5 < d < 2.5). This means
that the very critical assumption of the multiple regression analysis that requires
independence of observation, was sufficiently met, inadvertently this means that there was no
auto-correlation in this model.

75
Table 28
Model Summary: Job Satisfaction
Model R R
Square
Adjusted
R Square
Std.
Error of
the
Estimate
Change Statistics Durbin-
Watson R
Square
Change
F
Change
df1 df2 Sig. F
Change
1 .225a .051 .011 6.87077 .051 1.283 4 96 .282 1.647
a. Predictors: (Constant), Culture_Novelty, Age, Male, Number of Years Employed
b. Dependent Variable: Job_Satisfaction
In analyzing Table 29, I failed to reject the null hypothesis (R2 = 0) that the model
does not explain any variance in Job Satisfaction. Based on the sig value (p = .282) it is clear
that the F-test is not statistically significant thereby revealing that the model does not explain
nor predict variance in Job Satisfaction. This therefore shows that the model cannot
statistically significantly predict Job Satisfaction, F(4, 96) = 1.283, p < 0.282; the regression
model is therefore not a good fit of the data. These findings therefore reveal that Culture
Novelty, Age, Gender, nor Years of Employment affect or predict Job Satisfaction.
Table 29
ANOVA: Job Satisfaction
Model Sum of
Squares
df Mean
Square
F Sig.
1
Regression 242.306 4 60.577 1.283 .282b
Residual 4531.912 96 47.207
Total 4774.218 100
a. Dependent Variable: Job_Satisfaction
b. Predictors: (Constant), Culture_Novelty, Age, Male, Number of Years
Employed

76
Research Question, 3 Hypothesis 2. From examining Table 30, I found that based
on the adjusted R2 (R2 = .207), 20.7% of the variance in Affective Commitment is explained
by the model (Affective Commitment=ƒ{Gender, Age, Experience, Culture}). The Durbin-
Watson (d = 1.858) lies between the two critical values (1.5 < d < 2.5). This means that the
very critical assumption of the multiple regression analysis that requires independence of
observation, has been sufficiently met, signifying that there was no auto-correlation in this
model.
Table 30
Model Summary: Affective Commitment
Model R R
Square
Adjusted
R Square
Std.
Error of
the
Estimate
Change Statistics Durbin-
Watson R Square
Change
F
Change
df1 df2 Sig. F
Change
1 .489a .239 .207 7.82356 .239 7.454 4 95 .000 1.858
a. Predictors: (Constant), Culture_Novelty, Age, Male, Number of Years Employed
b. Dependent Variable: Affective_Commitment
In analyzing Table 31, I rejected the null hypothesis (R2 = 0) that the model does not
explain any variance in Affective Commitment. Based on the sig value (p = .001) it is clear
that the F-test is highly significant thereby revealing that the model does in fact explain some
variance in Affective Commitment. This therefore shows that the model statistically
significantly predicts Affective Commitment, F(4, 95) = 7.45, p = 0.001; the regression
model is therefore a good fit of the data (see Table 31).

77
Table 31
ANOVA: Affective Commitment
Model Sum of
Squares
df Mean
Square
F Sig.
1
Regression 1825.014 4 456.254 7.454 .000b
Residual 5814.776 95 61.208
Total 7639.790 99
a. Dependent Variable: Affective_Commitment
b. Predictors: (Constant), Culture_Novelty, Age, Male, Number of Years
Employed
Table 32 shows that number of years employed was the only statistically significant
predictor of affective commitment (p = 0.002). The statistics confirmed this by showing that
number of years employed had the greatest effect on affective commitment (t = -3.166). The
data showed that when all other variables remained constant for every 1 year of increase in
employment, affective commitment decreased by 0.407; thereby showing a negative
correlation between the two variables. The data also showed that for every 1 standard
deviation in the number of years employed, there was .396 standard deviation in affective
commitment. Finally, Table 32 showed that the data further met the assumptions by showing
that there was multicollinearity; [(Tolerance =.512) > 0.1] as well as [(VIF = 1.952) < 10].
This multicollinearity was not only with respect to the statistically significant variable but
with all the independent variables in the study. Overall, the data showed that when culture is
included in the model, there was no shift/change in the predictive power of the model on
Affective Commitment as opposed to when culture was excluded from the model.

78
Table 32
Coefficients: Affective Commitment
Model Unstandardized
Coefficients
Standardized
Coefficients
t Sig. Correlations Collinearity
Statistics
B Std.
Error
Beta Zero-
order
Partial Part Tolerance VIF
1
(Constant) 31.358 3.071 10.212 .000
Age -1.291 1.346 -.120 -.959 .340 -.393 -.098 -.086 .513 1.950
Number of Years
Employed -.407 .129 -.396 -3.166 .002 -.474 -.309 -.283 .512 1.952
Male -1.246 1.593 -.071 -.782 .436 -.059 -.080 -.070 .974 1.027
Culture_Novelty .069 .181 .035 .380 .704 .003 .039 .034 .970 1.031
a. Dependent Variable: Affective_Commitment

79
79
Despite the fact that the multiple regression found that only number of years
employed predicted Affective Commitment, the Pearson Correlation found that there was in
fact some correlation between the number of years employed (r = -.474, n = 108, p = .001)
and age (r = -.393, n = 108, p = .001). Owing to the p-values (p = 0.001, .001) there was a
statistically significant correlation between the two variables (experience and age) and the
dependent variable Affective Commitment. Therefore even in the absence of predictive
power of age on Affective Commitment, Pearson’s correlation found that there was
correlation between the two variables. In both the cases of age and experience there were
negative correlations (r = -.393, r = -.474), this means that as age and experience increased,
affective commitment decreased in this model (see Table 33).
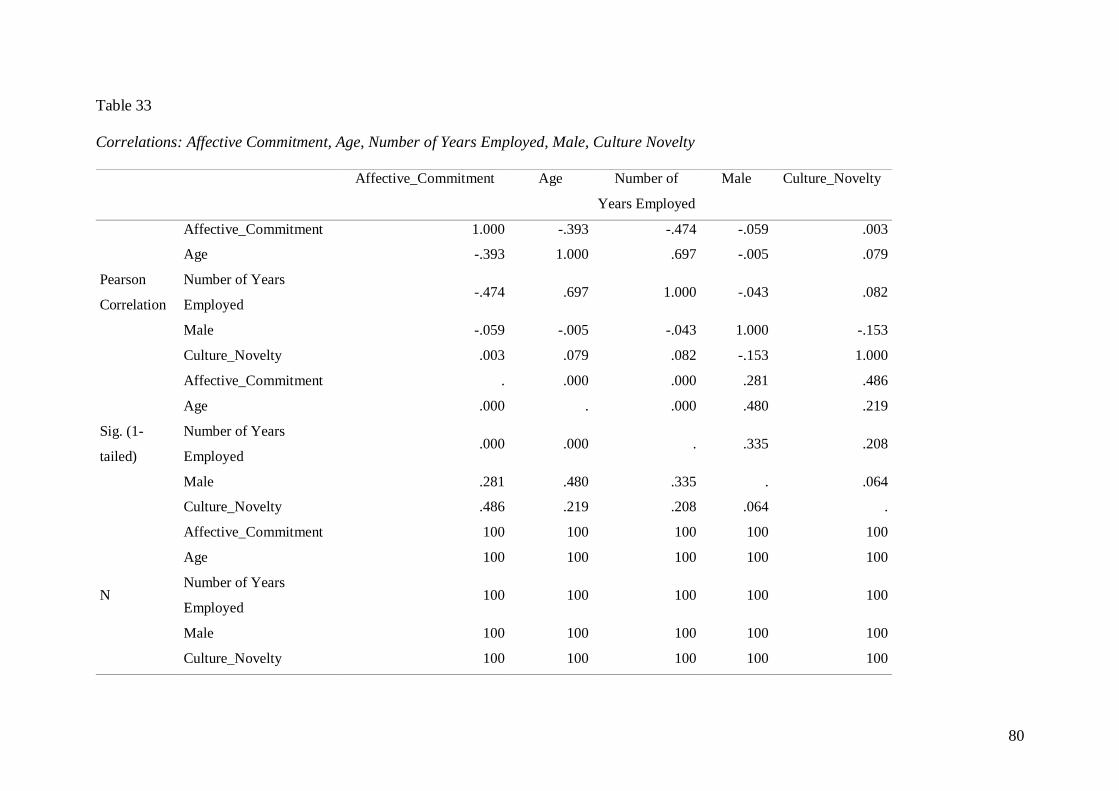
80
Table 33
Correlations: Affective Commitment, Age, Number of Years Employed, Male, Culture Novelty
Affective_Commitment Age Number of
Years Employed
Male Culture_Novelty
Pearson
Correlation
Affective_Commitment 1.000 -.393 -.474 -.059 .003
Age -.393 1.000 .697 -.005 .079
Number of Years
Employed -.474 .697 1.000 -.043 .082
Male -.059 -.005 -.043 1.000 -.153
Culture_Novelty .003 .079 .082 -.153 1.000
Sig. (1-
tailed)
Affective_Commitment . .000 .000 .281 .486
Age .000 . .000 .480 .219
Number of Years
Employed .000 .000 . .335 .208
Male .281 .480 .335 . .064
Culture_Novelty .486 .219 .208 .064 .
N
Affective_Commitment 100 100 100 100 100
Age 100 100 100 100 100
Number of Years
Employed 100 100 100 100 100
Male 100 100 100 100 100
Culture_Novelty 100 100 100 100 100
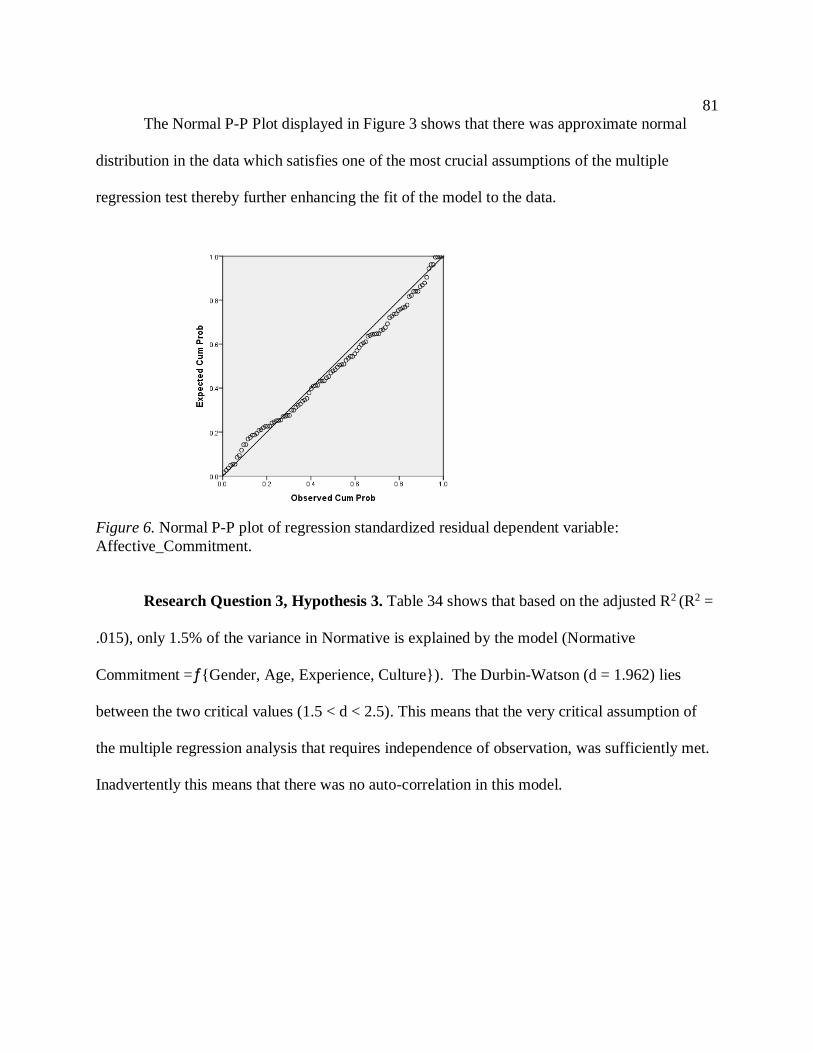
81
The Normal P-P Plot displayed in Figure 3 shows that there was approximate normal
distribution in the data which satisfies one of the most crucial assumptions of the multiple
regression test thereby further enhancing the fit of the model to the data.
Figure 6. Normal P-P plot of regression standardized residual dependent variable:
Affective_Commitment.
Research Question 3, Hypothesis 3. Table 34 shows that based on the adjusted R2 (R2 =
.015), only 1.5% of the variance in Normative is explained by the model (Normative
Commitment =ƒ{Gender, Age, Experience, Culture}). The Durbin-Watson (d = 1.962) lies
between the two critical values (1.5 < d < 2.5). This means that the very critical assumption of
the multiple regression analysis that requires independence of observation, was sufficiently met.
Inadvertently this means that there was no auto-correlation in this model.

82
Table 34
Model Summary: Normative Commitment
Model R R
Square
Adjusted
R Square
Std.
Error of
the
Estimate
Change Statistics Durbin-
Watson R Square
Change
F
Change
df1 df2 Sig. F
Change
1 .122a .015 -.027 8.39142 .015 .359 4 95 .837 1.962
a. Predictors: (Constant), Culture_Novelty, Age, Male, Number of Years Employed
b. Dependent Variable: Normative_Commitment
In analyzing Table 35, I failed to reject the null hypothesis (R2 = 0) that the model does
not explain any variance in Normative Commitment. Based on the sig value (p = .837) it is clear
that the F-test is not statistically significant thereby revealing that the model does not explain nor
predict variance in Normative Commitment. This therefore shows that the model cannot
statistically significantly predict Normative Commitment, F(4, 96) = .359, p < 0.837; the
regression model is therefore not a good fit of the data. These findings therefore reveal that
Culture Novelty, Age, Gender, nor Years of Employment affect or predict Normative
Commitment.

83
Table 35
ANOVA: Normative Commitment
Model Sum of
Squares
df Mean
Square
F Sig.
1
Regression 101.079 4 25.270 .359 .837b
Residual 6689.511 95 70.416
Total 6790.590 99
a. Dependent Variable: Normative_Commitment
b. Predictors: (Constant), Culture_Novelty, Age, Male, Number of Years
Employed
Summary
The results of the various statistical tests yielded the following results for the respective
research questions and hypotheses:
Research Question 1, Hypothesis 1: Pearson’s correlation revealed that there is a positive
correlation between culture and job satisfaction. However, while there is a correlation the
multiple regression did not indicate that culture is a statistically significant predictor of job
satisfaction.
Research Question 1, Hypothesis 2: Pearson’s correlation did not reveal a correlation
between culture and affective commitment neither did the multiple regression reveal a
statistically significant predictive relationship between the two.
Research Question 1, Hypothesis 3: Pearson’s correlation did not reveal a correlation
between culture and normative commitment neither did the multiple regression reveal a
statistically significant predictive relationship between the two.

84
Research Question 2, Hypothesis 1: The model does predict job satisfaction, even though
the number of years employed is the only variable which showed statistical significance. It must
be noted however that the independence of observation criteria was not sufficiently met therefore
indicating a possibility for auto correction.
Research Question 2, Hypothesis 2: Pearson’s correlation indicated a correlation between
the model and affective commitment. The multiple regression identified number of years
employed as the only statistically significant predictor of affective commitment.
Research Question 2, Hypothesis 3: The results of both Pearson’s correlation and the
multiple regression reveal that the model does not statistically significantly predict normative
commitment.
Research Question 3, Hypothesis 1: The model does not statistically, significantly predict
job satisfaction.
Research Question 3, Hypothesis 2: The results show that the model (age, experience,
culture, and gender) statistically significantly predicts affective commitment. The results reveal
however that from the model, only experience is statistically significant and that the relationship
is a negative one so as experience increases, affective commitment decreases. Despite the fact
that the multiple regression finds that only number of years employed predicts Affective
Commitment, the Pearson Correlation finds that there is in fact some correlation between the
number of years employed and age; there is a statistically significant correlation between the two
variables (experience and age) and the dependent variable Affective Commitment.
Research Question 3, Hypothesis 3: The results show that neither culture, age, gender,
nor experience are statistically significant predictors of normative commitment.

85
Chapter 5 will provide an examination of these results in light of the theoretical
framework and the existing literature, as well as recommendations and implications for social
change.

86
Chapter 5: Discussion of Findings
Introduction
This quantitative study examined the cultural dissimilarities between host country
nationals in Jamaica and expatriates and their effect on the productivity, job satisfaction,
normative commitment, and affective commitment of the host country nationals. I also
examined the impact of age, gender, and years of experience on these relationships. I believe
this study is very relevant in light of the multiplicity of cultures which are present in several
Jamaican organizations.
The results of the data analysis were varied. The findings with respect to culture in
conjunction with age, gender, and experience indicated that the model does not significantly
predict job satisfaction. However, the results with respect to affective commitment indicate that
the model has a statistically significant predictive relationship. Specifically, the results showed
that from the model, only experience is statistically significant and that the relationship is an
inverse one such that as experience increases, affective commitment decreases. Despite the fact
that the multiple regression showed that only number of years employed predicted affective
commitment, the Pearson correlation showed that there is in fact some correlation between the
number of years employed and age. That is, there is a statistically significant correlation
between the two variables (experience and age) and the dependent variable affective
commitment.
Based on the skewness of the productivity data and the resultant lack of variation, I
decided to omit it from further analysis and so conducted no linear regression with respect to
productivity; neither did I include productivity in the various models for the multiple regression.

87
Possible explanations for the skewness of the data could be the fact that the instrument used was
a self- report scale that could be predisposed to impression management on the part of the
sample, or it could be that the reports are in fact true and that the companies that were included
in the sample are highly productive.
Pearson’s correlation revealed that there is a positive correlation between culture and job
satisfaction. However, while there is a correlation, the multiple regression did not indicate that
culture is a statistically significant predictor of job satisfaction. Pearson’s correlation did not
reveal a correlation between either culture and affective commitment, or between culture and
normative commitment. Likewise, the multiple regression did not show a statistically significant
predictive relationship between either of them. Further the results indicated that age, gender, and
experience have a predictive relationship with job satisfaction despite the fact that number of
years employed is the only variable that showed statistical significance. It must be noted,
however, that the independence of observation criteria was not sufficiently met, therefore
indicating a possibility for auto correction.
Pearson’s correlation indicated a correlation between age, gender, and experience and
affective commitment. The multiple regression showed number of years employed as the only
statistically significant predictor of affective commitment. The results of both Pearson’s
correlation and the multiple regression showed that age, gender, and experience together do not
statistically significantly predict normative commitment. Finally, the results showed that neither
culture, age, gender, nor experience are statistically significant predictors of normative
commitment.

88
In what follows, I have used a triangulated approach for the discussion of the findings of
the study, with emphasis on existing literature and the theoretical framework.
Interpretation of the Findings
When compared with results in the existing peer reviewed literature, the results of the
study in respect to the various hypotheses yielded mixed outcomes. Below is an interpretation of
the results in the context of existing literature as well as the theoretical framework that I
discussed in the opening chapters.
Cultural Dissimilarity and Job Satisfaction
The results of multiple regression analysis indicated that culture dissimilarity did not
predict job satisfaction among the respondents; however, a positive correlation was identified
between the two, signifying that as cultural similarity increases there is a corresponding increase
in job satisfaction.
The indication of a correlation marks the need for further studies on this subject. There is
no shortage of literature highlighting the impact of job satisfaction on key performance
indicators. Among the proponents of a correlation between cultural dissimilarity and job
satisfaction are Toh and DeNisi (2005) and Bergbom and Kinnunen (2014) who provided
empirical data indicating that psychological well-being and job satisfaction are negatively
affected by cultural incompatibility. Chatman et al. (1998) further suggested that organizations
are likely to incur additional costs due to lower staff morale in instances where there is cultural
diversity.
This finding is also in keeping with the theoretical framework of the study. Proponents
of diversity propose that differences in individuals have implications for key organizational
89
outcomes. Betz and Fitzgerald (1993) indicated that racial and cultural diversity has such a vast
impact on the field of psychology that they likened it to “sea of change” (p. 362). This finding
aligns with that of Bergbom and Kinnunen (2014), who indicated that psychological well-being
and job satisfaction are negatively affected by cultural incompatibility. In light of its ambivalent
nature, diversity has to be deliberately addressed in the workplace in an attempt to mitigate the
potential negative implications (Kumra & Manfredi, 2012). Patrick and Kumar (2012) indicated
that diversity does not merely involve differences in the way people act but also in the way they
think. These researchers also found that organizational diversity has both positive and negative
implications. Such findings are in keeping with the tenets of social exchange theory which holds
that perceived equity in relationships positively impacts job satisfaction (Ko & Hur, 2014).
This finding is aligned with repulsive hypotheses and homophily. The finding supports
the notion that individuals will repel dissimilarity and gravitate to similarity, thereby increasing
job satisfaction (McPherson et al., 2001; Rosenbaum, 1986). I deemed this finding very
important because satisfied employees typically result in improved organizational outcomes as
well as reduced intentions to quit (Saeed, Waseem, Sikander, & Rizwan, 2014). This finding is
even more important for Jamaica, being a developing country that depends heavily on foreign
direct investment. Dissatisfied employees and increased intention to quit could likely result in
investors going to other geographical areas instead of coming to Jamaica. There is a likelihood
that this could be abated by introducing measures to deal with cultural dissimilarity.
Cultural Dissimilarity and Organizational Commitment
The findings of this study showed neither correlation nor a predictive relationship
between culture and affective commitment or normative commitment. It must be noted that the

90
literature on the subject is mixed, with some researchers identifying correlations and or
predictive relationships and others not identifying such relationships (Astakhova, 2016; Choi,
Oh, & Colbert, 2015; Holly Buttner, Lowe, & Billings-Harris, 2010). This discrepancy points to
the need for further study.
As I indicated in Chapter 2, the literature with respect to cultural dissimilarity and
organizational commitment, especially related to host country nationals, is very limited. My
study adds to this limited literature and will serve as a catalyst for future studies. While this is
true, there are researchers who have focused on the effect of national culture on organizational
commitment. Again, the results have varied, which is indicative of the need for further research
and, by extension, the need to add the component of cultural dissimilarity and its effect on
organizational commitment.
Choi et al. (2015) identified agreeableness as a personality trait that was highly predictive
of both affective and normative commitment. They intimated further that this trait was seen to
be more predictive in collectivist cultures than in individualistic cultures, thereby highlighting
the impact of national culture on organizational commitment. In light of this finding, I have
extrapolated that dissimilarities between the cultures of host country nationals and the cultures of
expatriates could influence organizational commitment. The findings of my study are not
generalizable due to the limitations which are mentioned further on pg. 101, consequently it
should be interpreted as an indication of the need for further research on the variables.
While I identified no significant relationship between cultural dissimilarity and
organizational commitment in my study, it is imperative that the findings of other studies on the
subject be taken into consideration by readers of this study. Top, Akdere, and Tarcan (2015)

91
found that job satisfaction is a direct predictor of organizational commitment. This, therefore,
indicates the potential benefit of implementing human resource management policies,
procedures, and initiatives targeting improved job satisfaction, which is likely to result in
increased organizational commitment.
Gender, Age, Experience, and Job Satisfaction
The results of my study indicate that as a model, gender, age, and experience are
predictive of job satisfaction. It is noted further that of the three variables only years of
experience showed statistical significance.
Dobrow Riza et al. (2015) found that in their longitudinal study, age and tenure had
opposite effects on job satisfaction; job satisfaction was found to increase with age of the
employees, but increased tenure within the same organization was found to result in decreased
job satisfaction. On the other hand, Venkatesh (2016) found that experience had little if any
effect on job satisfaction, but age was found to be predictive of it; specifically, job satisfaction
decreased as age increased among the sample.
While the model (Job Satisfaction=ƒ{Gender, Age, Experience}) was deemed to be
predictive of job satisfaction it is noted that gender was not found to be a statistically significant
predictor of job satisfaction. The finding is in keeping with Naderi Anari (2012), but is contrary
to that of Chaudhuri et al. (2015) who identified that the relationship between age and job
satisfaction was moderated by gender.
Gender, Age, Experience, and Organizational Commitment
The findings of my study did not reveal a predictive relationship for gender, age,
experience, and normative commitment. However, it did identify a correlation within the model

92
(Affective Commitment =ƒ{Gender, Age, Experience}), with years of experience being the only
statistically significant predictor. The finding is in keeping with Naderi Anari (2012), who found
no empirical evidence of a correlation between neither gender nor age and organizational
commitment.
There are conflicting results in the literature as it relates to the effects of gender, age, and
experience on organizational commitment. This should not, however be interpreted as a reason
to forfeit further studies. Instead, the disparity in the findings of the literature should serve as a
catalyst for future studies, especially given the implications of organizational commitment for
key organizational outcome, including productivity and overall viability.
A review of the theoretical framework lends itself to the notion that as the number of
years of experience increases, so does organizational commitment, as it is typical for individuals
to become more familiar as time passes in comparison to new hires (Abdul-Nasiru, Mensah,
Amponsah-Tawiah, Simpeh, & Kumasey, 2014). Therefore, familiarity with systems and
individuals should increase with the passage of time and so should the commitment to the
organization.
Culture in Conjunction with Age, Gender and Experience, and Job Satisfaction
The findings of my study do not support a correlation or predictive relationship between a
model of culture, age, gender, and experience when paired with job satisfaction. The impact of
the individual variables on job satisfaction has already been discussed. Of note is the fact that
there was a predictive relationship with the model (Job Satisfaction=ƒ{Gender, Age,
Experience})when culture was excluded, but that changes when culture is added. It should not

93
be assumed that cultural dissimilarity does not predict job satisfaction due to the fact that the
results did not show that job satisfaction was predicted by culture, age, experience, and gender.
The results should be interpreted in light of the limitations of the study and therefore it could
substantiate the need for further studies.
Culture in Conjunction with Age, Gender and Experience, and Normative and Affective
Commitment
The model did not yield a correlation nor a predictive relationship with normative
commitment; however, it yielded a negative predictive relationship with affective commitment,
in which years of experience was the only statistically significant predictor. This means that as
the model increases affective commitment deceases, and in particular, as age increases
organizational commitment deceases. A decline in affective commitment is deemed undesirable
as such a decrease could increase the likelihood of intention to quit, that in turn has potential
negative implications for the organization. The potential negative implications of decreases in
affective commitment could include the need for increased training and recruitment costs
attributable to new hires, as well as likely reduction in productivity. Efforts toward increasing
affective commitment will likely result in increases in key performance outcomes such as
productivity, sales, customer satisfaction, and financial returns, as well and organizational
citizenship (Zayas-Ortiz, Rosario, Marquez, & Colón Gruñeiro, 2015). The likelihood of these
outcomes can be understood by reflecting on the notion that employees who have affective
commitment to their organization will often go beyond what is required of them, thereby
contributing positively to these key performance outcomes.

94
Pearson’s correlation yielded a negative relationship between affective commitment and
age as well as affective commitment and experience. This finding means that for the sample as
age and experience increased affective commitment decreased. Chordiya, Sabharwal, and
Goodman (2017) indicated that there are differences in affective commitment across cultures.
Specifically, their findings indicated higher levels of commitment among collectivist cultures in
comparison to individualistic cultures. Again, the results are indicative of the need for further
study.
This finding should also be instructive in the crafting of human resource management
policies, procedures, and initiatives. Care should be taken to address the changing needs of the
aging employees in an attempt to mitigate against the likely reduction in affective commitment.
Additionally, these policies and procedures should take cognisance of the inherent reduction in
affective commitment as years of experience increase. This therefore would require strategies
aimed at increasing the engagement of all employees and specifically, those with longer years of
service. Long service awards and others should initiatives could be implemented to address this
need.

95
Limitations of the Study
My study has several limitations that includes the small sample size, the absence of a
sample frame, as well as the fact that a non-probability sampling approach was utilized. My
study is considered an introductory study, limited in respect of its sample, the level of analysis,
and the sectors represented.
The results of my study should not be deemed generalizable in all countries, cultures, or
companies, as the study was specific to two companies in Jamaica, rendering the sample
somewhat homogeneous. The perceptions and experiences of these employees may differ from
those of other employees within Jamaica as well as in other countries. Considering the
aforementioned, the results of my study should not be generalized to other situations, but will
serve as a precursor to other studies on the subject.
My study utilized quantitative data to explore the relationship among the variables. It is
likely that there are other mediators that could impact the relationships, which would not be
revealed by a qualitative inquiry. This is so as a qualitative enquiry would be more exploratory
and would identify themes. This, therefore, is a limitation of the study that could be addressed by
utilizing a qualitative approach or a mixed method approach.
Another limitation of the study is the fact that the data are based on self-reports,
especially evident in the skewness of the productivity scale. The skewness and lack of
variability of the productivity data rendered the scale unsuitable and therefore prevented the use
of 3 of the 12 hypotheses. Consequently, the study results do not reflect any information in
respect of productivity. Productivity is considered a key performance indicator, with

96
implications for both organizational sustainability and employee wellbeing. Therefore the
inability to obtain the variable is considered significant.
Recommendations
My study has added to the limited literature that examines the implications on host
country nationals, of cultural dissimilarities between themselves and expatriates. An ensuing
recommendation is for additional studies to be conducted to further add to the literature,
especially considering the limitations of my study that were highlighted in the previous section.
Another recommendation is that future studies should utilize larger sample sizes. Large
sample sizes have the added advantage of reducing the margin of error, as well as reducing the
impact of outliers on the analysis. Therefore, I recommend that future studies utilize larger
sample sizes and further that additional companies and nationalities be included thereby
increasing the heterogeneity of the sample and by extension allowing for generalization of the
findings.
As indicated in prior chapters, there is a limitation of literature on the models included in
my study, and in particular, with respect to the Caribbean region. I recommend that future studies
include the wider Caribbean area as cultures vary across the region and there is a likelihood that
the relationships among the variables could also vary.
My study utilized a non-probability sample, this was deemed appropriate due to its
explorative nature. I recommend that future studies utilize probability sampling techniques to
increase the representativeness of the population, thereby increasing the possibility of
generalization.

97
As outlined in previous sections, the use of the Work Efforts scale to measure
productivity, produced data that was not normally distributed, highly skewed, and lacking in
variability. The first recommendation, therefore, regarding this variable, is that another
instrument and method be utilized to access productivity. It is generally accepted that self-report
scales are predisposed to respondent’s exaggeration of their comments or utilizing impression
management to ensure that socially desirable responses are reflected. To reduce potential biases
that are somewhat inherent to the use of self-report variable, I recommend that future researchers
examine productivity and or performance reports or utilize other means to obtain verifiable data
in respect of productivity.
Another recommendation for future studies is to engage in longitudinal studies.
Longitudinal studies reduce the impact of specific transitory events on the results of the study
and allow for examination of trends over the period (Caruana, Roman, Hernández-Sánchez, &
Solli, 2015).
It is expected that the limitations that ensue from the use of a purely quantitative
approach to the study could be alleviated by using a mixed method or a qualitative approach.
The use of a mixed method or a qualitative approach could allow the researcher to identify other
possible mediators to the relationship and the implications for other key organizational
outcomes.
In light of the implications for Jamaica, a third world country, whose economy is
significantly hinged on foreign direct investment, I recommend that human resource policies,
procedures, and initiatives be developed. Such initiatives should include ones aimed at

98
addressing cultural dissimilarity and measures that will mitigate any attendant negative
implications for productivity, organizational commitment, and job satisfaction.
Previous studies on cultural dissimilarity have sought to identify measures to aid
expatriates in coping with the cultural dissimilarities that are likely to occur; however, very few
have sought to do the same for the host country nationals. A recommendation is to develop
culture sensitization programs for both expatriates and host country nationals. It is likely to be
more effective if the training is specific to the cultural norms of the individuals involved rather
that a general culture sensitization program. I recommend further that culture sensitization goals
should be included in performance management systems to increase compliance.
Implications
The implications of my study are great. Firstly, my study highlights the need for
additional study, serving as a catalyst for social change. At a national level the findings of my
study will promote greater understanding of the variables involved and how they relate to each
other. This is especially important as Jamaica, as a third world country, can ill afford the
potential negative implications for the economy that could result from ignoring these
relationships. Two potential negative implications that have economic implications is increased
unemployment and potential reduction in productivity. Information gained from my study has
the potential to assist in reducing intent to quit, thereby reducing the unemployment rate of the
country. My research has added to the literature of the variables as well as that of the various
theories that undergirded it. The implications for organizations cannot be ignored. The findings
will help to increase the awareness of the implications of cultural dissimilarity and the potential

99
impact on key organizational outcomes, thereby, allowing the organizations and the various
stakeholders to craft policies that will adequately address and support diversity.
As indicated in prior chapters, one potential impact for social change involves the
development of matrices that will be used for the selection of expatriates based on their cultural
suitability or their willingness to adapt to the cultural norms of the host country. The expectation
is that the resultant matrices should be suitable for adaptation by multinational companies.
Additionally, it is expected that this research will facilitate the creation of country specific
cultural awareness training programs for both the host country nationals and the expatriates.
Another desired deliverable is that the creation of such training programs may help to reduce the
impact of the cultural incompatibilities and potentially improve performance and job attitudes.
Finally, an expected deliverable from my findings is that they may aid in the development of
performance appraisal instruments that will include measures for cultural adaptation.
There are also anticipated benefits for individuals that will likely be derived from my
study including increased emphasis on employee job satisfaction and organizational
commitment. As indicated by prior studies these factors have implications for employees’ stress
levels on overall happiness and wellbeing (Schultz, Ryan, Niemiec, Legate, & Williams, 2015;
Sparber, 2008).

100
Conclusions
My study has fulfilled the intended purposes that were previously outlined. The main
purposes were to add to the limited literature on cultural dissimilarities between host country
nationals and expatriates, and to examine the relationship between this difference and the
productivity, job satisfaction, and organizational commitments of the host country nationals,
along with the mediating factors of gender, age, and number of years. In particular, my study
was expected to add to the limited literature on the implications for host country nationals. This
is due to the fact that the majority of the literature focused on implications for the expatriates
rather than the host country nationals.
The results have identified predictive relationships for some of the models and or
correlations, and for still others neither correlation nor predictive relationships were identified.
In addition to adding to the existing literature, my study has highlighted the need to do further
study on the relationship of the variables due to their potential implications for social change,
employee well-being, as well as for the economy of the countries involved. Finally, my study
has also provided specific recommendations that can impact social change.

101
References
Abdul-Nasiru, I., Mensah, R., Amponsah-Tawiah, K., Simpeh, K. N., & Kumasey, A. S. (2014).
Organisational commitment in the public service of Ghana: An empirical study. Journal
of Developing Country Studies, 4(1), 49-55.
Akintayo, D. (2012). Working environment, workers’ morale and perceived productivity in
industrial organizations in Nigeria. Education Research Journal, 2(3), 87-93.
Aksoy, O. (2015). Effects of heterogeneity and homophily on cooperation. Social Psychology
Quarterly, 78(4), 324-344. doi:10.1177/0190272515612403
Allen, N. J., & Meyer, J. P. (1990). The measurement and antecedents of affective, continuance
and normative commitment to the organization. Journal of Occupational Psychology,
63(1), 1-18.
Astakhova, M. N. (2016). Explaining the effects of perceived person-supervisor fit and person-
organization fit on organizational commitment in the US and Japan. Journal of Business
Research, 69(2), 956-963.
Backes-Gellner, U., & Veen, S. (2013). Positive effects of ageing and age diversity in innovative
companies - large-scale empirical evidence on company productivity. Human Resource
Management Journal, 23(3), 279-295. doi:10.1111/1748-8583.12011
Bergbom, B., & Kinnunen, U. (2014). Immigrants and host nationals at work: Associations of
co-worker relations with employee well-being. International Journal of Intercultural
Relations, 43, 165-176.
Berggren, N., & Nilsson, T. (2015). Globalization and the transmission of social values: The case
of tolerance. Journal of Comparative Economics, 43(2), 371-389.

102
Bergman, M. E. (2006). The relationship between affective and normative commitment: review
and research agenda. Journal of Organizational Behavior, 27(5), 645-663.
Betz, N. E., & Fitzgerald, L. F. (1993). Individuality and diversity: Theory and research in
counseling psychology. Annual Review of Psychology, 44, 343-381
Black, S. J., & Stephens, G. K. (1989). Culture novelty scale. doi:10.1037/t09030-000
Boehm, S. A., Kunze, F., & Bruch, H. (2014). Spotlight on age-diversity climate: The impact of
age-inclusive HR practices on firm-level outcomes. Personnel Psychology, 67(3), 667-
704.
Boles, J., Madupalli, R., Rutherford, B., & Andy Wood, J. (2007). The relationship of facets of
salesperson job satisfaction with affective organizational commitment. Journal of
Business & Industrial Marketing, 22(5), 311-321.
Boles, J. S., Wood, J. A., & Johnson, J. (2003). Interrelationships of role conflict, role ambiguity,
and work–family conflict with different facets of job satisfaction and the moderating
effects of gender. Journal of Personal Selling & Sales Management, 23(2), 99-113.
Bonache, J., Langinier, H., & Zárraga-Oberty, C. (2016). Antecedents and effects of host country
nationals negative stereotyping of corporate expatriates. A social identity
analysis. Human Resource Management Review, 26(1), 59-68.
Brunow, S., & Blien, U. (2014). Effects of cultural diversity on individual establishments.
International Journal of Manpower, 35(1), 166-186. doi:10.1108/IJM-08-2013-0199
Caligiuri, P. M., Joshi, A., & Lazarova, M. (1999). Factors influencing the adjustment of women
on global assignments. International Journal of Human Resource Management, 10(2),
163-179.
103
Cartwright, S., & Cooper, C. L. (1993). The role of culture compatibility in successful
organizational marriage. The Academy of Management Executive, 7(2), 57-70.
Caruana, E. J., Roman, M., Hernández-Sánchez, J., & Solli, P. (2015). Longitudinal
studies. Journal of Thoracic Disease, 7(11), E537.
Cerdin, J., & Selmer, J. (2014). Who is a self-initiated expatriate? Towards conceptual clarity of
a common notion. International Journal of Human Resource Management, 25(9), 1281-
1301. doi:10.1080/09585192.2013.863793
Chatman, J. A., Polzer, J. T., Barsade, S. G., & Neale, M. A. (1998). Being different yet feeling
similar: The influence of demographic composition and organizational culture on work
processes and outcomes. Administrative Science Quarterly, 43(40 749-780.
http://www.jstor.org/stable/2393615
Chaudhuri, K., Reilly, K. T., & Spencer, D. A. (2015). Job satisfaction, age and tenure: A
generalized dynamic random effects model. Economics Letters, 130, 13-16.
Choi, D., Oh, I. S., & Colbert, A. E. (2015). Understanding organizational commitment: A meta-
analytic examination of the roles of the five-factor model of personality and
culture. Journal of Applied Psychology, 100(5), 1542.
Chordiya, R., Sabharwal, M., & Goodman, D. (2017). Affective organizational commitment and
job satisfaction: a cross‐national comparative study. Public Administration, 95(1), 178-
195.
Chua, R. J. (2013). The costs of ambient cultural disharmony: indirect intercultural conflicts in
social environment undermine creativity. Academy of Management Journal, 56(6), 1545-
1577. doi:10.5465/amj.2011.0971

104
Colquitt, J. A., Scott, B. A., Rodell, J. B., Long, D. M., Zapata, C. P., Conlon, D. E., & Wesson,
M. J. (2013). Justice at the millennium, a decade later: A meta-analytic test of social
exchange and affect-based perspectives. Journal of Applied Psychology, 98(2), 199-236.
Cook, J., & Wall, T. (1980). New work attitude measures of trust, organizational commitment
and personal need non-fulfillment. Journal of Occupational Psychology, 53(1), 39-52.
Cook, K. S., Cheshire, C., Rice, E. R., & Nakagawa, S. (2013). Social exchange theory. In
Handbook of Social Psychology (pp. 61-88). Springer Netherlands.
Creswell, J. W., & Creswell, J. D. (2014). Research design: Qualitative, quantitative, and mixed
methods approaches. Thousand Oaks, CA: Sage publications.
De Cooman, R., De Gieter, S., Pepermans, R., Jegers, M., & Van Acker, F. (2009). Development
and validation of the work effort scale. European Journal of Psychological
Assessment, 25(4), 266-273.
De Meulenaere, K., Boone, C., & Buyl, T. (2016). Unraveling the impact of workforce
age diversity on labor productivity: The moderating role of firm size and job
security. Journal of Organizational Behavior, 37(2), 193-212. doi:10.1002/job.2036
Di Stefano, A., Scatà, M., La Corte, A., Liò, P., Catania, E., Guardo, E., & Pagano, S. (2015).
Quantifying the Role of Homophily in Human Cooperation Using Multiplex
Evolutionary Game Theory. Plos ONE, 10(10), 1-21. doi:10.1371/journal.pone.0140646
Dobrow Riza, S., Ganzach, Y., & Liu, Y. (2015). Time and job satisfaction: a longitudinal study
of the differential roles of age and tenure. Journal of Management, 0149206315624962.
Easterly, W., & Levine, E. (1997). Africa's growth tragedy: Policies and ethnic divisions. The
Quarterly Journal of Economics, 112(4).1203–1250

105
Ekelund, J. B., Jackson, J. D., & Tollison, R. D. (2015). Age and productivity: An empirical
study of early American artists. Southern Economic Journal, 81(4), 1096-1116.
doi:10.1002/soej.12050
Ferdman, B. M., & Sagiv, L. (2012). Diversity in organizations and cross-cultural work
psychology: What if they were more connected? Industrial & Organizational
Psychology, 5(3), 323-345. doi:10.1111/j.1754-9434.2012.01455.x
Fernandes, B. H. R., Santos, L. G. A., Paulin, R. R., & Tibola, J. A. (2013). The impact of
employees’ perceptions and attitudes on productivity and quality in manufacturing firms.
BASE-Revista de Administração e Contabilidade da Unisinos, 10(3), 254-272.
Göbel, C., & Zwick, T. (2012). Age and productivity: Sector differences. De Economist
(001063X), 160(1), 35-57. doi:10.1007/s10645-011-9173-6
Gonzalez, J. A. (2016). Demographic dissimilarity, value congruence, and workplace
attachment: asymmetrical group effects. Journal of Managerial Psychology, 31(1), 169-
185.
Gordon, M. E., & Johnson, W. E. (1982). Seniority: A review of its legal and scientific standing.
Personnel Psychology, 35, 255-280.
Guillaume, Y. F., Van Knippenberg, D., & Broderick, F. C. (2014). Nothing succeeds like
moderation: A Social self-regulation perspective on cultural dissimilarity and
performance. Academy of Management Journal, 57(5), 1284-1308.
Doi:10.5465/amj.2013.0046
Hailey, J. (1996). The expatriate myth: Cross-cultural perceptions of expatriate managers. The
International Executive, 38(2), 255-271.

106
Harris, J. M., Williams, R. P., & Mishra, A. K. (2015). The effect of gender on productivity
status in US agriculture. In 2015 AAEA & WAEA Joint Annual Meeting, July 26-28,
San Francisco, California (No. 205780). Agricultural and Applied Economics
Association & Western Agricultural Economics Association. World Development, 70,
416-463.
Hitotsuyanagi-Hansel, A., Froese, F. J., & Pak, Y. S. (2016). Lessening the divide in foreign
subsidiaries: The influence of localization on the organizational commitment and
turnover intention of host country nationals. International Business Review, 25(2), 569-
578.
Hofhuis, J., Van der Zee, K. I., & Otten, S. (2014). Comparing antecedents of voluntary job
turnover among majority and minority employees. Equality, Diversity & Inclusion, 33(8),
735-749. doi:10.1108/EDI-09-2013-0071
Hofstede, G., Hofstede, G. J., & Minkov, M. (2010). Cultures and organizations: Software of the
mind (Revised and expanded). New York, NY: McGraw-Hill.
Holly Buttner, E., Lowe, K. B., & Billings-Harris, L. (2010). Diversity climate impact on
employee of color outcomes: does justice matter?. Career Development
International, 15(3), 239-258.
Homans, G. C. (1961). Social behavior and its elementary forms. New York: Harcourt, Brace
and World.
Howard, A. (2012). Expatriate hotel general managers in Jamaica: Perceptions of human
resource, organizational, and operational challenges. Journal of Hotel & Business
Management.

107
Jung, C. S. (2017). Current-ideal culture incongruence, hierarchical position, and job satisfaction
in government agencies. International Public Management Journal, 1-29.
Karim, N. A., & Noor, N. M. (2006). Evaluating the psychometric properties of Allen and
Meyer’s organizational commitment scale: A cross cultural application among Malaysian
academic librarians. Malaysian Journal of Library & Information Science, 11(1), 89-101.
Kelley, H. H., & Thibaut, J. W. (1978). Interpersonal relations: A theory of inter-dependence.
New York, NY: Wiley.
Khalil, M., Jabeen, N., Jadoon, Z. I., & Salman, Y. (2016). Female expatriates and cross cultural
adjustment: A study of Saudi Arabia. Pakistan Journal of Women's Studies= Alam-e-
Niswan= Alam-i Nisvan, 23(2), 45.
King, T. L. (2016). A tale of two theories: Human capital theory vs. social exchange theory and
the impact of employee development on organizational outcomes (Doctoral dissertation,
The Chicago School of Professional Psychology).
Knoop, R. (1995). Relationships among job involvement, job satisfaction, and organizational
commitment for nurses. Journal of Psychology, 129(6), 643-649.
Ko, J., & Hur, S. (2014). The impacts of employee benefits, procedural justice, and managerial
trustworthiness on work attitudes: Integrated understanding based on social exchange
theory. Public Administration Review, 74(2), 176-187.
Kumra, S., & Manfredi, S. (2012). Managing equality and diversity: Theory and practice.
Oxford University Press. ISBN: 9780199591404
Larson, D. F., Savastano, S., Murray, S., & Palacios-López, A. (2015). Are women less
productive farmers? How markets and risk affect fertilizer use, productivity, and
108
measured gender effects in Uganda. How Markets and Risk Affect Fertilizer Use,
Productivity, and Measured Gender Effects in Uganda (April 20, 2015). World Bank
Policy Research Working Paper, (7241).
Lazear, E. (1999). Globalization and the market for team-mates. Economic Journal, 109, C15-
C40.
Lee, H., & Reade, C. (2015). Ethnic homophily perceptions as an emergent IHRM challenge:
Evidence from firms operating in Sri Lanka during the ethnic conflict. International
Journal of Human Resource Management, 26(13), 1645-1664.
doi:10.1080/09585192.2014.958514
Lee, R., & Wilbur, E. R. (1985). Age, education, job tenure, salary, job characteristics, and job
satisfaction: A multivariate analysis. Human Relations, 38(8), 781-791.
Li, B. (2015). Inter-cultural Working Relationships between Expatriates and Local Employees in
MNCs Cases from the Automotive Industry in China. Retrieved from
http://hdl.handle.net/2077/37869
Loke, J. (2001). Leadership behaviours: Effects on job satisfaction, productivity and
organizational commitment. Journal of Nursing Management, 9(4), 191-204.
doi:10.1046/j.1365-2834.2001.00231.x
Long, Z. (2009). The choice between host country nationals and expatriates to manage a foreign
subsidiary of multinational corporation. International Business Masters Thesis. Retrieved
from http://urn.fi/URN:NBN:fi:aalto-201111181205
Lumby, J., & Morrison, M. (2010). Leadership and diversity: Theory and research. School
Leadership and Management, 30(1), 3-17.

109
Madera, J. M., King, E. B., & Hebl, M. R. (2012). Bringing social identity to work: The
influence of manifestation and suppression on perceived discrimination, job satisfaction,
and turnover intentions. Cultural Diversity and Ethnic Minority Psychology, 18(2), 165-
170. doi:10.1037/a0027724
Manchanda, P. (2014). Impact of organizational justice on employee commitment in select
private sector banks. International Journal of Organizational Behaviour & Management
Perspectives, 3(3), 1145.
Mansour, N., & Wegerif, R. (Eds.). (2013). Science education for diversity: Theory and
practices. Part of the Cultural Studies of Science Education book series (CSSE,
volume 8).
Martinko, M. J. (1999). Culture and Expatriate Failure: An attributional explication.
International Journal of Organizational Analysis (1993 - 2002), 7(3), 265.
Maslić Seršić, D. (2000). An empirical test of Meyer and Allen's three-component model
of organzational commitment in a Croatian context. Review of psychology, 6(1-2), 17-24.
Mathews, A. (2005). Cultural diversity and productivity. Armonk, NY: ME Sharpe.
McDaniel, M. A., Schmidt, F. L., & Hunter, J. E. (1988). Job experience correlates of job
performance. Journal of Applied Psychology, 73(2), 327–330.
McNulty, Y., & Brewster, C. (2017). Theorizing the meaning (s) of ‘expatriate’: establishing
boundary conditions for business expatriates. The International Journal of Human
Resource Management, 28(1), 27-61.
McPherson, M., Smith-Lovin, L., & Cook, J. M. (2001). Birds of a feather: Homophily in social
networks. Annual Review of Sociology, 27, 415-444.

110
Medoff, J. L., & Abraham, K. G. (1980). Experience, performance, and earnings. Quarterly
Journal of Economics, 95(4) 703-736.
Meyer, J. P., & Allen, N. J. (1991). A three-component conceptualization of organizational
commitment. Human Resource Management Review, 1(1), 61-89.
Meyer, J. P., Stanley, D. J., Herscovitch, L., & Topolnytsky, L. (2002). Affective, continuance,
and normative commitment to the organization: A meta-analysis of antecedents,
correlates, and consequences. Journal of Vocational Behavior, 61(1), 20-52.
Ministry of Labour and Social Security. (2017). Annual Performance Report, 2016-21017.
Kingston, Jamaica.
Misra, S. (2014). Impact of demographic variables on organizational commitment and job
satisfaction. Gurukul, 36.
Naderi Anari, N. (2012). Teachers: emotional intelligence, job satisfaction, and organizational
commitment. Journal of Workplace Learning, 24(4), 256-269.
Nehring, K., & Puppe, C. (2002). A theory of diversity. Econometrica, 70(3), 1155-1198.
Retrieved from http://search.proquest.com/docview/203883412?accountid=14872
Ng, E. W., & Tung, R. L. (1998). Ethno-cultural diversity and organizational effectiveness: A
field study. International Journal of Human Resource Management, 9(6), 980-995.
doi:10.1080/095851998340702
Ng, T. W., & Feldman, D. C. (2013). Does longer job tenure help or hinder job performance?.
Journal of Vocational Behavior, 83(3), 305-314.
111
Nguyen, L. D., Kass, D., Mujtaba, B. G., & Tran, Q. H. (2015). Cross culture management: An
examination on task, relationship and work overload stress orientations of German and
Japanese working adults. American International Journal of Social Science, 4(1), 51-63
Oltra, V., Bonache, J., & Brewster, C. (2013). A New Framework for Understanding Inequalities
between Expatriates and Host Country Nationals. Journal of Business Ethics, 115(2),
291-310.
Ottaviano, G. I., & Peri, G. (2006). The economic value of cultural diversity: evidence from US
cities. Journal of Economic Geography, 6(1), 9-44.
Parekh, B. C. (2006). Rethinking multiculturalism: Cultural diversity and political theory.
Basingstoke, England: Palgrave Macmillan.
Park, T., & Shaw, J. D. (2013). Turnover rates and organizational performance: a meta-analysis.
Journal of Applied Psychology, 98(2), 268.
Patrick, H. A., & Kumar, V. R. (2012). Managing workplace diversity: Issues and challenges.
Sage Open, 2(2), 2158244012444615.
Pelled, L. H. (1996). Demographic diversity, conflict, and work group outcomes: An intervening
process theory. Organization Science, 7(6), 615-631.
Pepermans, R., Jegers, M., Van Acker, F., De Cooman, R. R., & De Gieter, S. (2009). Work
Effort Scale. doi:10.1037/t00473-000
Pucik, V. (2012). The challenges of globalization. Japanese Multinationals (RLE International
Business): Strategies and Management in the Global Kaisha, 7, 218.
Resnick, S., & Bond, G. R. (2001). Indiana Job Satisfaction Scale. doi:10.1037/t25260-000
112
Richard, O. C., Barnett, T., Dwyer, S., & Chadwick, K. (2004). Cultural diversity in
management, firm performance, and the moderating role of entrepreneurial orientation
dimensions. Academy of Management Journal, 47(2), 255-266.
Robbins, S. P., & Judge, T. A. (2007). Organizational Behavior. UK. Pearson. ISBN-10:
0133029905
Robertson, I. T., Birch, A. J., & Cooper, C. L. (2012). Job and work attitudes, engagement and
employee performance: Where does psychological well-being fit in?. Leadership &
Organization Development Journal, 33(3), 224-232.
Rosenbaum, M. E. (1986). Comment on a proposed two-stage theory of relationship formation:
First, repulsion; then, attraction. Journal of Personality and Social Psychology, 51(6),
1171-1172.
Rosenblatt, Z., Talmud, I., & Ruvio, A. (1999). A gender-based framework of the experience of
job insecurity and its effects on work attitudes. European Journal of Work and
Organizational Psychology, 8(2), 197-217.
Rutherford, B. N., Marshall, G. W., & Park, J. (2014). The moderating effects of gender and
inside versus outside sales role in multifaceted job satisfaction. Journal of Business
Research, 67(9), 1850-1856.
Ruzik-Sierdzinska, A., Lis, M., Potoczna, M., Belloni, M., & Villosio, C. (2013). Age and
productivity: Human capital accumulation and depreciation (No. 114). CASE Network
Reports.

113
Saeed, I., Waseem, M., Sikander, S., & Rizwan, M. (2014). The relationship of turnover
intention with job satisfaction, job performance, leader member exchange, emotional
intelligence and organizational commitment. International Journal of Learning and
Development, 4(2), 242-256.
Schmidt, F.L., Hunter, J.E., Outerbridge, A.N. (1986). The impact of job experience and ability
on job knowledge, work sample performance, and supervisory ratings of job
performance. Journal of Applied Psychology, 71(3), 432-439.
Schultz, P. P., Ryan, R. M., Niemiec, C. P., Legate, N., & Williams, G. C. (2015). Mindfulness,
work climate, and psychological need satisfaction in employee well-
being. Mindfulness, 6(5), 971-985.
Selmer, J., Torbiorn, I., & de Leon, C. T. (1998). Sequential cross-cultural training for expatriate
business managers: predeparture and post-arrival. International Journal of Human
Resource Management, 9(5), 831-840.
Singh, A. (2012). Job satisfaction among the expatriates in the UAE. International Journal of
Business and Social Research, 2(5), 234-249.
Sparber, C. (2008). A theory of racial diversity, segregation, and productivity. Journal of
Development Economics, 87(2), 210-226,
Sparber, C. (2009). Racial diversity and aggregate productivity in US industries: 1980-2000.
Southern Economic Journal, 829-856.
Statistical Institute of Jamaica. (2017). Major labour force indicators. Retrieved from
statinja.gov.jm/labourforce/news/fs.aspx

114
Syed, J., Hazboun, N. G., & Murray, P. A. (2014). What locals want: Jordanian employees'
views on expatriate managers. The International Journal of Human Resource
Management, 25(2), 212-233.
Tait, M., Padgett, M. Y., & Baldwin, T. T. (1989). Job and life satisfaction: A reevaluation of the
strength of the relationship and gender effects as a function of the date of the study.
Journal of Applied Psychology, 74(3), 502-507. doi:10.1037/0021-9010.74.3.502
Teclaw, R., Osatuke, K., Fishman, J., Moore, S. C., & Dyrenforth, S. (2014). Employee age and
tenure within organizations: relationship to workplace satisfaction and workplace climate
perceptions. The Health Care Manager, 33(1), 4-19.
Thomas, D. A., & Ely, R. J. (1996). Making differences matter. Harvard Business Review, 74(5),
79-90.
Toh, S. M., & DeNisi, A. S. (2005). A local perspective to expatriate success. Academy of
Management Executive, 19(1), 132-146. doi:10.5465/AME.2005.15841966
Top, M., Akdere, M., & Tarcan, M. (2015). Examining transformational leadership, job
satisfaction, organizational commitment and organizational trust in Turkish hospitals:
public servants versus private sector employees. The International Journal of Human
Resource Management, 26(9), 1259-1282.
Trax, M., Brunow, S., & Suedekum, J. (2015). Cultural diversity and plant-level productivity.
Regional Science and Urban Economics, 53, 85-96.
Veen, S. (2008). Demographischer Wandel, alternde Belegschaften und Betriebsproduktivitat.
Munich: Rainer Hampp Verlag.

115
Venkatesh, K. (2016). Job satisfaction among primary school teachers with respect to age,
gender and experience. The International Journal of Indian Psychology, 3(2), 102349-
3429.
von Hippel, C., Kalokerinos, E. K., & Henry, J. D. (2013). Stereotype threat among older
employees: Relationship with job attitudes and turnover intentions. Psychology and
Aging, 28(1), 17.
Yucel, I., & Bektas, C. (2012). Job satisfaction, organizational commitment and demographic
characteristics among teachers in Turkey: Younger is better? Procedia-Social and
Behavioral Sciences, 46, 1598-1608.
Yusuf, B. N. B. M., & Zain, A. B. M. (2014). The effect of cultural diversification on working
performance of expatriates in the higher learning institutions. Advances in Environmental
Biology, 8(11), 978-986.
Zayas-Ortiz, M., Rosario, E., Marquez, E., & Colón Gruñeiro, P. (2015). Relationship between
organizational commitments and organizational citizenship behaviour in a sample of
private banking employees. International Journal of Sociology and Social
Policy, 35(1/2), 91-106.

116
Appendix A: Survey Document
THE EFFECTS OF CULTURAL DISSIMILARITY ON EMPLOYEE JOB ATTITUDES
AND PRODUCTIVITY
SURVEY DOCUMENT
________________________________________________________________________
Thank you for participating in the “Effects of Cultural Dissimilarity on Employees Job Attitudes
and Productivity” study. Your input will help us to develop programs to address the effects of
cultural dissimilarity between expatriates and host country nationals. This survey includes
questions about your experiences as an employee in an organization which employs expatriates. It
should take approximately 30 minutes to complete. Please read each question carefully and
respond as honestly as you can to each item. Your responses will not be shared with your co-
workers or the management of the organization and you will not be identified individually when
the results of this project are shared. Your participation is voluntary, so you don’t have to answer
any questions you don’t want to and you can stop at any time.
This is a confidential survey please do not enter or write your name. Please use your assigned
participant ID.
Consent
I have read the informed consent document and
❑ Agree to participate in this study
❑ I do not wish to participate in this study
If you would like to receive summary results of this study please indicate an email address
to which it may be sent: ______________________
Date: ____________________________________
Participant ID: _____________________________________

117
SECTION I: DEMOGRAPHICS
We would like to know a little about you so we can see how different individuals experience
the issues you have been examining. For each question below check the box(es) that
correspond with your answer.
1. Age
❑ 18 – 30
❑ 31 – 45
❑ Above 45
2. Gender
❑ Male
❑ Female
3. Name of Organization
__________________________________________________________________
4. Number of years employed to this organization
____________________________
5. Category of employment
❑ Clerical
❑ Supervisory
❑ Management
❑ Other

118
SECTION II: JOB SATISFACTION
Please think about your experience as an employee and answer the following questions on the
way you feel about your job. Please mark the answer with an X that best describes your attitudes.
GENERAL SATISFACTION
Questions 1
Strongly
Agree
2
Agree
3
Disagree
4
Strongly
Disagree
1. I feel good about this job. 1 2 3 4
2. This job is worthwhile. 1 2 3 4
3. The working conditions are
good.
1 2 3 4
4. I want to quit this job. 1 2 3 4
5. This job is boring. 1 2 3 4
PAY
6. I am happy with the amount
this job pays.
1 2 3 4
7. The vacation time and other
benefits on this job are okay.
1 2 3 4
8. I need more money than this
job pays.
1 2 3 4
9. This job does not provide the
medical coverage I need.
1 2 3 4
ADVANCEMENT AND PROMOTION
10. I have a fairly good chance
for promotion in this job.
1 2 3 4
11. This is a dead-end job. 1 2 3 4
12. I feel that there is a good
chance of my losing this job
in the future.
1 2 3 4

119
SUPERVISION
13. My supervisor is fair. 1 2 3 4
14. My supervisor is hard to
please.
1 2 3 4
15. My supervisor praises me
when I do my job well.
1 2 3 4
16. My supervisor is difficult to
get along with.
1 2 3 4
17. My supervisor recognizes my
efforts.
1 2 3 4
Co-WORKERS
Questions 1
Not True
At All
2
Mostly
Not True
3
Somewhat
True
4
Mostly
True
18. My coworkers are easy to get
along with.
1 2 3 4
19. My coworkers are lazy. 1 2 3 4
20. My coworkers are unpleasant. 1 2 3 4
21. My coworkers don’t like me 1 2 3 4
22. My coworkers help me to like
this job more.
1 2 3 4
23. I have a coworker I can rely
on.
1 2 3 4
24. I have a coworker I consider a
friend.
1 2 3 4
HOW I FEEL ON THIS JOB

120
25. I look forward to coming to
work.
1 2 3 4
26. I am satisfied with my
schedule.
1 2 3 4
27. I often feel tense on the job. 1 2 3 4
28. I don’t know what’s expected
of me on this job.
1 2 3 4
29. I feel physically worn out at
the end of the day.
1 2 3 4
30. Working makes me feel like
I’m needed.
1 2 3 4
31. My job keeps me busy. 1 2 3 4
32. I get to do a lot of different
things on my job.
1 2 3 4
CULTURE NOVELTY SCALE
Questions
1
Very
Similar
2 3 4 5
Very
Dissimilar
33. Everyday Customs
that must be followed
1 2 3 4 5
34. General Living
Conditions
1 2 3 4 5
35. General Living Costs 1 2 3 4 5
36. Climate 1 2 3 4 5

121
PRODUCTIVITY
Instruction - The questions below ask you about your output as a host country national. Please
circle the number that best reflects how you feel about your output.
Question/Item 1
Fully
Agree
2
3 4 5 6 7
Fully
Disagree
37. I do not give up
quickly when
something does
not work well.
1
2 3 4 5
6 7
38. I really do my
best to get my
work done
regardless of
potential
difficulties.
1 2 3 4 5 6 7
39. I do my best to
do what is
expected of me.
1 2 3 4 5 6 7
40. When I start an
assignment, I
pursue it to the
end.
1 2 3 4 5 6 7
41. I am trustworthy
in executing the
tasks that are
assigned to me.
1 2 3 4 5 6 7
42. I really do my
best to achieve
the objectives of
the organization.
1 2 3 4 5 6 7
43. I think of myself
as a hard worker.
1 2 3 4 5 6 7
44. I really do my
best in my job.
1 2 3 4 5 6 7
45. I put a lot of
energy into the
tasks that I
commence
1 2 3 4 5 6 7
46. I always exert
equally hard in
1 2 3 4 5 6 7

122
the execution of
my work.
ORGANIZATIONAL COMMITMENT
Instructions – Please reflect on your experiences and respond to the following questions by
selecting the response which best reflects your views, on a scale of 1 – 7 where 1 is strongly
agree and 7 is strongly disagree.
Question/Item
1
Strongly
Agree
2 3 4 5
6 7
Strongly
Disagree
Normative Commitment
47. I think that
people these
days move from
company to
company too
often.
1 2 3 4 5 6 7
48. I do not believe
that a person
must always be
loyal to his or
her organization.
1 2 3 4 5 6 7
49. Jumping from
one organization
to organization
does not seem at
all unethical to
me.
1 2 3 4 5 6 7
50. One of the major
reasons I
continue to work
for this
organization is
that I believe
that loyalty is
important and
therefore feel a
sense of moral
obligation to
remain
1 2 3 4 5 6 7
51. If l got another
offer for a better
job elsewhere I
would not feel it
1 2 3 4 5 6 7

123
was right to
leave my
organization
52. I was taught to
believe in the
value of
remaining loyal
to one
organization
1 2 3 4 5 6 7
53. Things were
better in the days
when people
stayed with one
organization for
most of their
careers
1 2 3 4 5 6 7
54. I do not think
that wanting to
be a 'company
man' or
'company
woman' is
sensible
anymore
1 2 3 4 5 6 7
Affective Commitment
Question/Item 1
Fully
Agree
2
3 4 5 6 7
Fully
Disag
ree
55. I would be very
happy to spend
the rest of my
career with this
organization
1
2 3 4 5
6 7
56. I enjoy
discussing my
organization
with people
outside it
1 2 3 4 5 6 7

124
57. I really feel as if
this
organization's
problems are my
own
1 2 3 4 5 6 7
58. I think that I
could easily
become as
attached to
another
organization as I
am to this one.
1 2 3 4 5 6 7
59. I do not feel like
'part of the
family' at my
organization.
1 2 3 4 5 6 7
60. I do not feel
'emotionally
attached' to this
organization.
1 2 3 4 5 6 7
61. This
organization has
a great deal of
personal
meaning for me.
1 2 3 4 5 6 7
62. I do not feel a
strong sense of
belonging to my
organization.
1 2 3 4 5 6 7
THANK YOU FOR COMPLETING THIS SURVEY

125
Appendix B: Walden University IRB Approval
Name of Study: The Effects of Cultural Dissimilarity on Employee Job Attitudes and
Productivity
Name of Researcher: Sherrice Lyons
Approval #: 08-30-17-0434329
Expiration date: August 29th, 2018