dissertation jouni march26th2013
TRANSCRIPT
Publication VI
Jouni Mäenpää. Performance evaluation of Recursive Distributed Rendezvous
based service discovery for Peer-to-Peer Session Initiation Protocol. Else-
vier Journal on Computer Networks, Volume 56, Issue 5, pp. 1612-1626,
March 2012.
c© 2012 Elsevier B.V..
Reprinted with permission.
185


Performance evaluation of Recursive Distributed Rendezvous basedservice discovery for Peer-to-Peer Session Initiation Protocol
Jouni Mäenpää ⇑Ericsson Research, Oy L M Ericsson Ab, Hirsalantie 11, 02420 Jorvas, Finland
a r t i c l e i n f o
Article history:Received 8 January 2011Received in revised form 18 June 2011Accepted 19 January 2012Available online 31 January 2012
Keywords:Recursive Distributed RendezvousPeer-to-Peer Session Initiation ProtocolService discovery
a b s t r a c t
Recursive Distributed Rendezvous (ReDiR) is a service discovery mechanism for Distrib-uted Hash Table (DHT) based Peer-to-Peer (P2P) overlay networks. One of the major P2Psystems that has adopted ReDiR is Peer-to-Peer Session Initiation Protocol (P2PSIP), whichis a distributed communication system being standardized in the P2PSIP working group ofthe Internet Engineering Task Force (IETF). In a P2PSIP overlay, ReDiR can be used forinstance to discover Traversal Using Relays around NAT (TURN) relay servers needed byP2PSIP nodes located behind a Network Address Translator (NAT). In this paper, we studythe performance of ReDiR in a P2PSIP overlay network. We focus on metrics such as servicelookup and registration delays, failure rate, traffic load, and ReDiR’s ability to balance loadbetween service providers and between nodes storing information about service providers.
� 2012 Elsevier B.V. All rights reserved.
1. Introduction
Recursive Distributed Rendezvous (ReDiR) [1] is a ser-vice discovery mechanism for Distributed Hash Table(DHT) based Peer-to-Peer (P2P) overlay networks. ReDiRcan be used by nodes in an overlay network to discoverservice providers and also to register themselves as serviceproviders. ReDiR has been adopted as a service discoverymechanism for the Peer-to-Peer Session Initiation Protocol(P2PSIP) by the P2PSIP working group of the Internet Engi-neering Task Force (IETF) [2].
P2PSIP is a new distributed communication system thatcan be used for instance for telephony and instant messag-ing. P2PSIP uses the REsource LOcation And Discovery (RE-LOAD) protocol [2], Chord DHT algorithm [3], and SessionInitiation Protocol (SIP) [4] as the core building blocks. RE-LOAD is used as the signaling protocol between nodes in aP2PSIP overlay network. It is used for storing and retrievingdata, and for maintaining the network. RELOAD is beingstandardized by the P2PSIP working group of the IETF.
The topology of the P2PSIP overlay is organized using theChord algorithm, which RELOAD specifies as mandatoryto implement. Nodes in the P2PSIP overlay use SIP to setup real-time communication sessions. The overlay net-work acts as a distributed database for SIP, mapping SIP ad-dress-of-record (AoR) values to node identifiers, which canbe used to reach users participating in the system. Theoverlay network replaces the centralized proxy-registrarservers of traditional client/server SIP.
Nodes in a P2PSIP overlay both use and provide ser-vices. As an example, some of the publically reachablenodes in the overlay can act as Traversal Using Relaysaround NAT (TURN) [5] relay servers for other nodes lo-cated behind Network Address Translators (NATs). To dis-cover and register service providers, P2PSIP relies on aservice discovery mechanism. We have specified how Re-DiR can be applied as a service discovery mechanism forP2PSIP in [6]. The work in this paper is highly relevantfor ReDiR and P2PSIP standardization efforts in the IETF.
The goal of this paper is to study the performance ofReDiR in a P2PSIP overlay network. We focus on servicelookup and registration delays, failed operations, trafficload, the distribution of lookup load, and the load of serviceproviders. We also study the impact of various ReDiR
1389-1286/$ - see front matter � 2012 Elsevier B.V. All rights reserved.doi:10.1016/j.comnet.2012.01.015
⇑ Tel.: +358 9 299 3283.E-mail address: [email protected]
Computer Networks 56 (2012) 1612–1626
Contents lists available at SciVerse ScienceDirect
Computer Networks
journal homepage: www.elsevier .com/locate /comnet
parameters and the density of service providers on ReDiRperformance. Further, we develop a model for configuringReDiR in such a way that short delays and good load bal-ance can be achieved. The remainder of the paper is struc-tured as follows: Section 2 gives an introduction to ReDiR.Section 3 presents related work. Section 4 describes theP2PSIP simulator used in the experiments. Section 5 de-scribes the experiments and the traffic model used. Thesimulator we used in the paper is validated in Section 6.Sections 7–10 present the results of the expriments. Sec-tion 11 presents a model to assist in configuring ReDiR.Section 12 concludes the paper. The terms used in the pa-per are defined in Table 1.
2. Recursive Distributed Rendezvous (ReDiR)
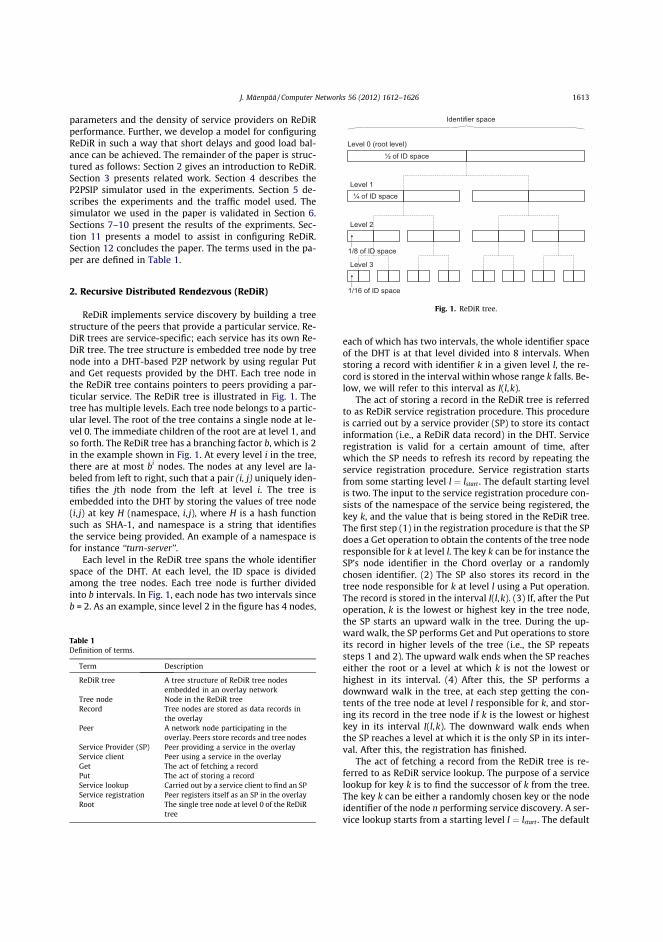
ReDiR implements service discovery by building a treestructure of the peers that provide a particular service. Re-DiR trees are service-specific; each service has its own Re-DiR tree. The tree structure is embedded tree node by treenode into a DHT-based P2P network by using regular Putand Get requests provided by the DHT. Each tree node inthe ReDiR tree contains pointers to peers providing a par-ticular service. The ReDiR tree is illustrated in Fig. 1. Thetree has multiple levels. Each tree node belongs to a partic-ular level. The root of the tree contains a single node at le-vel 0. The immediate children of the root are at level 1, andso forth. The ReDiR tree has a branching factor b, which is 2in the example shown in Fig. 1. At every level i in the tree,there are at most bi nodes. The nodes at any level are la-beled from left to right, such that a pair (i, j) uniquely iden-tifies the jth node from the left at level i. The tree isembedded into the DHT by storing the values of tree node(i, j) at key H (namespace, i, j), where H is a hash functionsuch as SHA-1, and namespace is a string that identifiesthe service being provided. An example of a namespace isfor instance ‘‘turn-server’’.
Each level in the ReDiR tree spans the whole identifierspace of the DHT. At each level, the ID space is dividedamong the tree nodes. Each tree node is further dividedinto b intervals. In Fig. 1, each node has two intervals sinceb = 2. As an example, since level 2 in the figure has 4 nodes,
each of which has two intervals, the whole identifier spaceof the DHT is at that level divided into 8 intervals. Whenstoring a record with identifier k in a given level l, the re-cord is stored in the interval within whose range k falls. Be-low, we will refer to this interval as I(l,k).
The act of storing a record in the ReDiR tree is referredto as ReDiR service registration procedure. This procedureis carried out by a service provider (SP) to store its contactinformation (i.e., a ReDiR data record) in the DHT. Serviceregistration is valid for a certain amount of time, afterwhich the SP needs to refresh its record by repeating theservice registration procedure. Service registration startsfrom some starting level l ¼ lstart . The default starting levelis two. The input to the service registration procedure con-sists of the namespace of the service being registered, thekey k, and the value that is being stored in the ReDiR tree.The first step (1) in the registration procedure is that the SPdoes a Get operation to obtain the contents of the tree noderesponsible for k at level l. The key k can be for instance theSP’s node identifier in the Chord overlay or a randomlychosen identifier. (2) The SP also stores its record in thetree node responsible for k at level l using a Put operation.The record is stored in the interval I(l,k). (3) If, after the Putoperation, k is the lowest or highest key in the tree node,the SP starts an upward walk in the tree. During the up-ward walk, the SP performs Get and Put operations to storeits record in higher levels of the tree (i.e., the SP repeatssteps 1 and 2). The upward walk ends when the SP reacheseither the root or a level at which k is not the lowest orhighest in its interval. (4) After this, the SP performs adownward walk in the tree, at each step getting the con-tents of the tree node at level l responsible for k, and stor-ing its record in the tree node if k is the lowest or highestkey in its interval I(l,k). The downward walk ends whenthe SP reaches a level at which it is the only SP in its inter-val. After this, the registration has finished.
The act of fetching a record from the ReDiR tree is re-ferred to as ReDiR service lookup. The purpose of a servicelookup for key k is to find the successor of k from the tree.The key k can be either a randomly chosen key or the nodeidentifier of the node n performing service discovery. A ser-vice lookup starts from a starting level l ¼ lstart . The default
Table 1Definition of terms.
Term Description
ReDiR tree A tree structure of ReDiR tree nodesembedded in an overlay network
Tree node Node in the ReDiR treeRecord Tree nodes are stored as data records in
the overlayPeer A network node participating in the
overlay. Peers store records and tree nodesService Provider (SP) Peer providing a service in the overlayService client Peer using a service in the overlayGet The act of fetching a recordPut The act of storing a recordService lookup Carried out by a service client to find an SPService registration Peer registers itself as an SP in the overlayRoot The single tree node at level 0 of the ReDiR
tree
Fig. 1. ReDiR tree.
J. Mäenpää / Computer Networks 56 (2012) 1612–1626 1613

starting level is two. A service lookup consists of one ormore steps. The first action (1) at each step is that n fetchesthe tree node associated with the current interval I(l,k)using a Get request. After having fetched the tree node, nproceeds with one of the following actions: (2) if the suc-cessor of k is not present in the tree node, n sets l = l � 1(i.e., proceeds with an upward walk) and performs a newGet operation (that is, n goes back to action 1). (3) If k issandwiched between two keys (i.e., k is neither the highestnor lowest key) in I(l,k), n sets l = l + 1 (i.e., proceeds with adownward walk) and performs a new Get (that is, n goesback to action 1). (4) If a successor is present and k is notsandwiched in its interval, the successor must be the clos-est successor of k and thus the service lookup is finished.
3. Related work
To the best of our knowledge, the only previous studyon ReDiR performance is [1], which briefly evaluates ReDiRperformance through experiments in PlanetLab. There areseveral differences between the work in [1] and ours. First,our work focuses on studying the suitability of ReDiR as aservice discovery mechanism for P2PSIP. In contrast, thework in [1] focuses solely on OpenDHT. The P2PSIP usecase (i.e., TURN server registration and discovery) is differ-ent from the OpenDHT one. Second, our ReDiR implemen-tation follows the ReDiR specification produced by theP2PSIP working group of the IETF [6]. Third, [1] investi-gates only ReDiR service lookup delay and lookup consis-tency. We focus on a wider set of performance metricsincluding registration delay, failure rate, traffic load, loadof service providers, and load of peers storing ReDiR treenodes. Fourth, we also study how to configure ReDiRappropriately for different operating conditions by varyingparameters such as branching factor and starting level. Wealso develop a model for determining appropriate valuesfor ReDiR parameters. Fifth, the experiments in [1] arerather small-scale; five PlanetLab nodes were used andthe number of clients was 256 at the maximum. In ourwork, the maximum number of clients is 10,000.
4. P2PSIP simulator
The results in this paper were obtained using our P2PSIPsimulator, which is an event-driven, message-level simula-tor. It uses the same code base as our P2PSIP prototype thatwe have used to run experiments in PlanetLab in previouswork [7–9]. We have previously used the simulator in [10].We chose to use the simulator also in this paper becausewe wanted to experiment with larger network sizes thanis possible to achieve in PlanetLab. The simulator is imple-mented in the Java programming language. It uses Peer-to-Peer Protocol (P2PP) [11] as the protocol between peers inthe overlay. The RELOAD protocol [2], which is currentlybeing standardized in the IETF, is based on P2PP (theP2PP proposal was merged with RELOAD). P2PP connec-tions are assumed to run over an unreliable transport.The Chord DHT [3] is used to organize the overlay. Chordwas chosen since the P2PSIP working group specifies it asmandatory to implement [2].
The topology generator of our simulator assigns peersrandomly to 206 different locations around the world thatwe modeled according to PlanetLab sites. The pairwise de-lays between peers were set based on real pairwise delaysthat we measured between nodes at these sites. For therandom number generators that assign peers to differentsites, we used the same seeds, meaning that the sametopology was used for all the simulations for a given net-work size. Keeping the topology constant allowed us tocompare the performance of different values for ReDiRparameters. However, we also ran a series of simulationsusing different seeds to confirm the general validity ofthe results. These simulations, whose results are not in-cluded in the paper for brevity, confirm that our results re-main valid even when different seeds are used. Althoughthe topology was constant, different seeds were used forthe random number generator selecting the pairwise de-lays from among the set of sample delays collected be-tween each pair of PlanetLab sites.
5. Experiments
This section describes the traffic model and parametersused in our simulations. We used three different maximumnetwork sizes (N): 100, 1000, and 10,000 peers. N = 10,000was used as the largest network size since this was themaximum size our simulator could handle (with even lar-ger network sizes, memory consumption became the limit-ing factor). N = 100 and N = 1000 were chosen since wewanted to study ReDiR performance in networks whosesize is very different from N = 10,000. In each simulationrun, the network was created from scratch. The networkreached its maximum size at the end of the simulation.The simulated time was four hours for N = 10,000 andone hour for the other network sizes. The peer interarrivaltimes we used in the simulations are listed in Tables 2–4,for N = 10,000, N = 1000, and N = 100, respectively. In thesimulations studying the impact of branching factor, start-ing level, and service provider density, the network wasconstantly growing. No peer departures were used. Thisis because in these simulations, we wanted to eliminate
Table 2User interarrival times, N = 10,000.
Start ofperiod [s]
End ofperiod [s]
Interarrivaltime [s]
N at endof period
0 1000 10 1001000 2000 5 3002000 4000 2.5 11004000 6000 2 21006000 13900 1 10,000
Table 3User interarrival times, N = 1000.
Start ofperiod [s]
End ofperiod [s]
Interarrivaltime [s]
N at endof period
0 1000 10 1001000 2000 5 3002000 3750 2.5 1000
1614 J. Mäenpää / Computer Networks 56 (2012) 1612–1626

the impact of service provider and peer departures on theresults. Departures would have made it more difficult tocompare performance metrics such as the distribution ofclients among the service providers. Although we did notuse peer departures in these particular simulations, in Sec-tion 10 we will report the results of simulations whose fo-cus was solely on studying the impact of peer departureson ReDiR performance. We have further studied the impactof peer departures and arrivals (i.e., churn) on the perfor-mance of Chord in P2PSIP overlays in previous work [7,8].
There is also another reason why we wanted the net-work to be constantly growing when studying the perfor-mance of different b, lstart , and SP density values. InP2PSIP, the most common use case for ReDiR is TURN ser-ver discovery. TURN server discovery is performed when apeer joins the overlay. Since the network was constantlygrowing, this ensured that there was a constant loadcaused by service lookups on the ReDiR tree.
The reason for choosing the specific interarrival timesspecified in Tables 2–4 is explained below. As already ex-plained, we wanted the overlay to be constantly growing.The size of the overlay was increased in steps. Each stephad a specific interarrival time; the smaller the network,the longer was the interarrival time. The specific interarri-val time for each step was set to the maximum that aChord ring of the given size was able to handle withoutthe risk of becoming disconnected based on the recom-mendations in [12,13].
In the simulations, peers used ReDiR for TURN serverregistration and discovery. In the simulations studyingthe impact of braching factor and starting level on ReDiRperformance (Sections 7 and 8,) the proportion (i.e., den-sity) of peers capable of acting as TURN servers (i.e., publi-cally reachable peers), was constant. In these simulations,the density of TURN servers was set to 11% based on the re-sult in [14] according to which this was observed to be theaverage percentage of publically reachable Internet hostsover the countries studied. However, we also studied theimpact of using different Service Provider (SP) densities(Section 9).
Following the recommendations in [3], the size ofChord’s successor list and finger table were set to logNusing the maximum network size, N = 10,000. In Chord,roughly Xðlog2NÞ rounds of stabilization should occur inthe time it takes for N new peers to join or N/2 peers toleave the overlay [13]. Chord stabilization refers to theoperations that peers carry out to ensure that their routingtables stay up to date. Using the above-mentioned rule, weset the Chord stabilization interval to 15s based on thehighest join rate that the overlay experienced during thesimulations. The highest join rate occurred at the momentwhen a 300-node network faced a peer interarrival time of2.5 s (see Table 2).
SPs, that is TURN servers, carried out the ReDiR serviceregistration procedure upon joining the overlay. As all stateis soft in the ReDiR tree, SPs refreshed their records at tenminute intervals. The ten minute refresh interval was cho-sen since in our simulations, we found it to be a goodtradeoff between not overloading the network with ReDiRrefreshes and ensuring that stale information is removedquickly enough from the overlay. A considerably more fre-quent refresh interval would result in there being more Re-DiR traffic in the overlay than Chord stabilization traffic.This would be inefficient. Making the refresh interval con-siderably longer would increase the number of stale re-cords in the overlay, resulting in an inrease in servicelookup failures. Upon graceful exit, SPs removed their Re-DiR records from the overlay. Users of the TURN relay ser-vice performed the ReDiR service lookup procedure uponjoining the overlay.
Background (i.e., non-ReDiR) P2PSIP lookup traffic dur-ing the simulations consisted of lookups related to SIP callsand presence. Calls were modeled according to busy hourtraffic volumes. Each user was assumed to initiate 13 callsper day, as suggested in [15]. 17% of these calls were usedto represent busy hour traffic based on [16]. Thus, thenumber of busy hour call attempts per user was 2.21. Thisvalue was used as a mean rate for the arrival of calls, whichwas modeled as a Poisson process. Since users typically calltheir friends instead of strangers [17], it was assumed that23 of the calls are placed to users on the buddy list. Themean size of the buddy list was set to 22 based on the find-ings in [18]. It is worth noting that, as shown in [7], the vol-ume of call and presence related lookup traffic is very lowcompared to stabilization traffic in a P2PSIP overlay. Fur-ther, this lookup traffic is completely independent fromReDiR traffic; there is no ReDiR-related signaling requiredwhen initiating calls or presence sessions. Therefore, inpractice, the impact of P2PSIP background traffic on theperformance of ReDiR is negligible. However, we still in-cluded background traffic in the simulations to make themmore realistic. The traffic model and Chord parameters aresummarized in Table 5.
The metrics we study in the experiments are delays andfailure rates of service lookup and registration operations,ReDiR traffic load, Get request load, and load of SPs. Servicelookup delay was measured as the time between a clientsending the first Get request of a service lookup and receiv-ing the final Get response. Registration delay was mea-sured as the time between an SP sending the first Get
Table 4User interarrival times, N = 100.
Start ofperiod [s]
End ofperiod [s]
Interarrivaltime [s]
N at endof period
0 1000 100 101000 2000 50 302000 3750 25 100
Table 5Traffic model and Chord parameters.
Parameter Value
Max network sizes (N) 10,000, 1000, and 100Duration 13,900 s, 3750 s, and 3750 sBusy hour call attempts 2.21 calls per user% of calls to buddies 66.6Mean size of buddy list 22Finger pointers 14Successors 14Predecessors 7Stabilization interval 30 sReDiR refresh interval 10 min
J. Mäenpää / Computer Networks 56 (2012) 1612–1626 1615

request of a registration operation and receiving a responseto the final Put request. Service lookup failure rate wasmeasured as the percentage of failed out of all service look-ups initiated in the overlay during the measurement peri-od. Service registration failure rate is the percentage offailed out of all registrations. ReDiR traffic load refers toall ReDiR related signaling (measured as number of bytes)exchanged in the overlay during the measurement period.Get request load refers to the number of ReDiR-related Getrequests that peers storing ReDiR tree nodes receive duringthe measurement period. The load of an SP is the numberof clients the SP is serving. We also studied how these met-rics change as the ReDiR branching factor, starting level,and SP density are modified. We also studied the impactof peer and SP departures on the metrics.
6. Validating the simulator
In this section, we will validate our simulator by com-paring the results obtained from it to results obtained byrunning our P2PSIP prototype that uses the same code baseas the simulator in PlanetLab. The parameters listed in Ta-ble 5 were used both in the simulations and PlanetLabexperiments with the exceptions listed below. The size ofthe overlay was 100 peers. The traffic model was such thatduring the first 1500 s of the simulations and experiments,the 100-node overlay was created from scratch. During thisphase, the mean interarrival time of users was 15 s. Thereason for using a rather high interarrival time was to limitthe total time it takes to create a 100-node overlay. Westarted collecting measurement data after the overlayhad reached the size of 100 peers. During the next3600 s, both the mean interarrival time and the mean in-ter-departure time of peers was set to 36 s. These valueswere chosen since they cause the entire population ofnodes in the overlay to change during the 3600 s measure-ment period. The topology generator of the simulator wasinitialized using the same set of nodes that were used inthe PlanetLab experiments. Further, the delay generatorof the simulator was initialized using the pair-wise delaysmeasured between these PlanetLab nodes. The pair-wisedelays were measured using six different message sizes(25, 75, 125, 250, 500, 750, and 950 bytes). The ReDiRbranching factor was set to 10 and the starting level to 2since these are the default values in ReDiR [6].
The results of the PlanetLab experiments and simula-tions are shown in Table 6. The values in the table are aver-ages calculated over 20 PlanetLab experiments and 20simulations. The values in parentheses represent 95% con-fidence intervals. From the table, we can observe that theresults of the simulations are in general very well in linewith those of the PlanetLab experiments; in the majorityof cases, the differences are not statistically significant.However, in the case of the percentage of failed Get andPut requests, the differences are statistically significant;in PlanetLab, the values are significantly higher. Based onour results, the majority of Get and Put failures occurbecause of request timeouts. The higher failure rate ofPlanetLab experiments is caused by the very dynamic loadsituation of PlanetLab nodes: since PlanetLab nodes are
running multiple experiments of different users in parallel,the load situation of the nodes can vary dramatically dur-ing the 5100 s duration of our experiments. A node experi-encing a high load may become slow in replying to P2PPmessages, which results in timeouts at other nodes. Wechose not to model such overload situations in our simula-tor since they are a characteristic of PlanetLab rather thanof P2PSIP or ReDiR. Based on the results in Table 6, we canconclude that the results produced by the simulator appearto be valid compared to results obtained from a real globalP2PSIP overlay.
Finally, to show that the performance relationships be-tween different ReDiR parameter values are similar in oursimulations and in real test cases, we ran a further set ofPlanetLab experiments and simulations using different val-ues for the branching factor but otherwise using the samesetup that was described above. The branching factors weused were 2, 6, 10, and 14. The results of these PlanetLabexperiments and simulations (not shown here for brevity)indicate that the performance relationships between dif-ferent branching factor values produced by the simulationshold also in real test cases (as one could expect based onthe results in Table 6 and the fact that our P2PSIP proto-type uses the same code base as our simulator).
In the sections below, we will describe the results of thesimulations studying the impact of different parametervalues on ReDiR performance. Section 7 studies the impactof modifying the branching factor. Section 8 studies theimpact of the starting level. Section 9 studies the impactof SP density. Finally, Section 10 studies the impact of peerand SP departures. The error bars shown in the figures ofthese sections represent 95% confidence intervals.
7. Impact of branching factor
This section presents the impact of the branching factoron ReDiR performance, including delays, failure rates, traf-fic load, Get request load, and the load of SPs. In these sim-ulations, we kept the starting level at 2, which is thedefault value specified by ReDiR [1].
7.1. Service lookup delay
ReDiR service lookup delay is shown in Fig. 2 forbranching factors (b) ranging from 2 to 38. The figure con-tains results for all three network sizes. For b = 2–14, we
Table 6Validating the simulator.
Parameter PlanetLab Simulator
Discovery delay 1908 ms (53 ms) 1792 ms (67 ms)Registration delay 3717 ms (97 ms) 3701 ms (91 ms)Discovery failed 3.7% (1.7%) 2.6% (0.91%)Registration failed 3.5% (1.5%) 2.5% (0.87%)Gets per discovery 2.58 (0.03) 2.59 (0.02)Gets per registration 4.03 (0.03) 4.00 (0.01)Puts per registration 4.02 (0.02) 4.00 (0.01)Get failed 1.7 (0.5) 0.6 (0.2)Put failed 2.5 (0.9) 0.2 (0.1)Get hop count 4.0 (0.2) 3.8 (0.1)Put hop count 3.3 (0.1) 3.2 (0.1)
1616 J. Mäenpää / Computer Networks 56 (2012) 1612–1626

ran simulations for every second value of b to get a betteridea of the minimum delay. From b = 14 onwards, we ransimulations for every fourth value. Some of the error barsare so small that they are not visible in the figure. Fromthe figure, we can observe that the delay behaves differ-ently for different network sizes as b is increased. This isespecially visible when looking at the smallest values forb (i.e., 2–14).
To understand what causes the behavior visible inFig. 2, we studied various factors impacting the servicelookup delay, including the number of Gets per servicelookup, and the average finishing level of service lookups.The results of these studies are not included here for brev-ity. What we found is that the main factor affecting the de-lay is the number of Get requests per service lookup. Wealso found that there is in fact a linear correlation betweenthe number of Gets and the service lookup delay. Thus, wefurther studied the factors affecting the number of Gets perservice lookup and found the main factor to be the densityof ReDiR records in the tree at levels close to the startinglevel.
The reason why record density affects the number ofGets per service lookup is discussed below. Our resultssuggest that the larger b is, the closer to the root of the treeservice lookups will finish. This is because the branchingfactor impacts how densely populated the ReDiR tree is.If the tree is sparsely populated at the starting level andother levels close to the root, service lookups will have along upward walk and no downward walk at all. The up-ward walk is long since no successors are found from high-er levels in the tree due to its sparsity. There is nodownward walk because the search key is typically neversandwiched in its interval also due to the sparsity of thetree. Having no downward walk is beneficial since it de-creases the service lookup delay. Therefore, when configur-ing ReDiR, one should aim at density of records thateliminates the downward walk and minimizes the lengthof the upward walk if aiming at low service lookup delays.The minimum delay is naturally achieved when there is nodownward walk and the upward walk finishes already atthe starting level.
To understand the conditions that cause service lookupsto finish at the starting level lstart , it is necessary to have a
look at the rules described in Section 2. Per these rules, aservice lookup may finish already at lstart if a successor isfound from the tree node fetched from lstart and k is notsandwiched in its interval. In such a case, the service look-up delay is optimal since the lookup finishes after only asingle Get request. To reach this optimal performance,two conditions need to be satisfied. First, the average num-ber of records per interval at lstart must be as close to one aspossible (this ensures that k is not sandwiched in its inter-val). Second, at the same time, the number of records pertree node must be as high as possible (since this maximizesthe probability that there is a successor present in the treenode at lstart). We show in Section 11 how to configure Re-DiR in such a way that both of these conditions arefulfilled.
In general, our results so far suggest that configuringReDiR can be somewhat challenging; the branching factorthat results in the best performance with a given networksize may become the worst possible choice if the networksize changes, as can be seen from Fig. 2 for b = 2.
7.2. Registration delay
The delay of ReDiR registration operations is shown inFig. 3 for different values of b and network size N. As withservice lookups, the delay behaves again differently for dif-ferent network sizes. As an example, the minimum regis-tration delay is reached with different branching factorsdepending on the network size. We also found a linear cor-relation between the number of Gets (and in addition,Puts) per registration operation and the registration delay.Thus, the minimum registration delay occurs with abranching factor that results in the minimum number ofGets and Puts per registration.
For all of the network sizes, the impact of b on the up-ward walk of the registration procedure is as follows. If bis large, the upward walk will nearly always reach the root(because the tree nodes at levels close to the root are ratherempty and k is typically the highest or lowest ID stored inthe tree node). In contrast, if b is small, the starting level israther densely populated and there is typically no upwardwalk at all. The impact of b on the downward walk of theregistration process is as follows. If b is small, thedownward walk is typically long because the tree is
Fig. 2. Delay of ReDiR service lookups.
Fig. 3. Registration delay.
J. Mäenpää / Computer Networks 56 (2012) 1612–1626 1617

densely populated. However, if b is high, the downwardwalk will be short or there may be no downward walk atall. The smallest number of Gets and Puts is achieved whena b that minimizes the lengths of the upward and down-ward walks is used.
7.3. Service lookup and registration failures
The percentage of failed service lookups is shown inFig. 4. From the figure, we can see that there are two casesin which there is a statistically significant impact on failurerate. The first case is b = 2 for N = 10,000. The second case isvisible for the majority of branching factors when N in-creases from 1000 to 10,000. The explanation for both ofthese cases is that our results (not included here for brev-ity) show that there is a linear correlation between the fail-ure rate and the number of Get requests per service lookup.The number of Gets per service lookup is higher for b = 2than any other b when N = 10,000 due to the high densityof records in the tree (as was discussed in Section 7.1).Also, the number of Gets per service lookup grows signifi-cantly as network size is increased. The higher is the num-ber of Gets per service lookup, the higher is the probabilitythat the service lookup fails. This is due to the fact that Re-DiR does not by default retry failed Gets; if even one Getfails, the entire service lookup will fail.
The graphs for failed service registrations are very sim-ilar to those of failed service lookups and are thus notshown separately for brevity. Based on our results, the fail-ure rates of service lookups and registrations are accept-able as long as the Get and Put request failure rate of theunderlying DHT is acceptable. By Get and Put request fail-ure rate of the DHT, we refer to the percentage of requeststhat fail due to maximum request hop count being ex-ceeded, transaction timeouts, or routing errors caused byfor instance routing loops. All of these errors were presentin our simulations since they are a consequence of changesin the overlay (e.g., new peers joining) and varying delays,and did not need to be modeled separately.
7.4. ReDiR traffic load
Fig. 5 shows how large a percentage of the total trafficin the overlay is generated by ReDiR. From the figure, we
can observe that the differences between traffic volumesgenerated by different branching factors can be ratherlarge. As an example, in the largest network, the amountof ReDiR traffic grows by a factor of 12 when increasing bfrom 6 to 38. An interesting observation for this particularcase is that despite the 12-fold increase in ReDiR traffic(measured in number of bytes), the amount of ReDiR re-lated requests increases only by 7.2% (from 157,200 to168,500; a graph for the number of ReDiR requests is notincluded here for brevity). Therefore, the increase in trafficvolume must be due to the increase in the average size ofReDiR messages. Further, the increase must be due to theGet response since it is the only message having a variablesize. To verify this, we measured the average size of Get re-sponses in the simulations. The results indicate that a min-imum Get response size, 1153 bytes, is reached when b = 6.The maximum Get response size, 15,735 bytes, is reachedwhen b = 38. This growth is explained by the fact thatwhen b = 38, 93% of registrations and 6% of service lookupsreach the root level due to the fact that the tree is verysparsely populated. For registrations, this means thatnearly all registrations store a record in the root node (con-sequently, the root has a total of 923 records) and alsofetch the contents of the root node (which explains thelarge average Get response size).
In contrast to b = 38, when b = 6, only 9% of registrationsreach the root. The maximum number of records stored bythe root node is only 71. Further, only 0.7% of service look-ups reach the root. This ensures that the average Get re-sponse is much smaller for b = 6. The maximum, median,and 95th percentile of number of records stored per treenode is depicted in Fig. 6. In the figure, the maximum isshown in the primary y-axis, whereas the median and95th percentile are in the secondary y-axis. From the fig-ure, we can observe that ReDiR does not do a very goodjob at balancing the load of storing pointers to SPs equallyamong the tree nodes. Even in the best case the root nodeis holding over 70 times more records compared to themedian.
7.5. Get request load
The percentage of Get requests received by the top 5% ofthe most loaded peers storing ReDiR tree nodes is shown inFig. 4. Failed service lookups.
Fig. 5. Percentage of ReDiR traffic out of all traffic.
1618 J. Mäenpää / Computer Networks 56 (2012) 1612–1626

Fig. 7. The high load experienced by the top 5% indicatesthat ReDiR does not distribute the load of answering Getrequests equally among the peers.
We also investigated the median, average and maxi-mum number of Gets received by peers storing ReDiR treenodes. What we found out is that for instance forN = 10,000, the most loaded peer receives 951–7039 Getsdepending on the branching factor. From b = 6 onwards,the most loaded peer is always one of the peers responsiblefor storing the root node (note that the responsibility forstoring the root and other nodes may be transferred be-tween peers in the overlay due to new peers joining thesystem). The most loaded peer handles alone 1.1–5.8% ofall Gets depending on the branching factor. The medianof received Gets is 9–11 for branching factors other thanb = 2, for which it is 18. The standard deviation of receivedGets is very large (around 100 for all branching factors; theaverage varies between 25–72) for all branching factors,which shows that ReDiR does indeed a poor job at balanc-ing the load equally among tree nodes and thus also amongthe peers storing the tree nodes regardless of the branchingfactor.
It should be noted that the the results look slightly dif-ferent when the overlay is static (i.e., when there is no peerarrivals and N stays constant at 10,000) since in that casethe root of the tree is always stored by the same peer. In
a static setup, the percentage of Gets handled by the mostloaded peer was 20% in the case of the b with the worstperformance (b = 38).
7.6. Load of service providers
To analyze how well ReDiR balances load between SPs,we studied the median and 95th percentile of number ofclients per SP, and the number of SPs having no clients atall. For all of the network sizes, the average number ofTURN clients per server would be 8.1 in case of optimalload balancing. However, based on our results, the mediannumber of clients per server is 5, 5, and 6 for N = 100,N = 1000, and N = 10,000, respectively. The 95th percen-tiles are shown in Fig. 8.
Fig. 8 shows also the number of SPs having no clients atall. From the figure, we can observe that depending on thenetwork size, there can be a large number of unused TURNservers. The large number of unused TURN servers explainswhy the median load is lower than the ideal load. FromFig. 8, we can conclude that by modifying b, one canachieve some improvement in load balancing especiallyin the largest network. However, even with these improve-ments, ReDiR still does a rather poor job at balancing theload equally among service providers.
The histogram in Fig. 9 shows a typical distribution ofclients among TURN servers. The figure is from a simula-tion run with N = 10,000 and b = 10. In the ideal case, thedistribution in the figure would be Gaussian with a meanaround 8.1. Unfortunately, the distribution in Fig. 9 israther far from the ideal case: there are roughly 100 serv-ers with no clients at all and also a high number of servershaving only a few clients. Also, 38% of the servers have aload higher and 45% a load lower than the ideal load (i.e.,8.1 clients). 15% of the servers have a load that is at leasttwo times higher than the fair load (the fair load is 8.1 cli-ents) and 40% of them have a load that is less than half ofthe fair load.
As a summary, branching factor has a significant impacton delays, traffic load, and the load of answering ReDiR-related Get and Put requests. However, it has a smallerimpact on the load of service providers and only a minorimpact on the failure rate. Also network size has a clear
Fig. 6. Pointers per tree node.
Fig. 7. Gets received by top 5% most loaded peers in ReDiR tree.Fig. 8. TURN servers with no clients and 95th percentile of clients perserver.
J. Mäenpää / Computer Networks 56 (2012) 1612–1626 1619

impact on ReDiR performance. ReDiR seems to fail to dis-tribute the load evenly among the service providers; manyservers have an exceptionally high load. At the same time,many other servers remain rather lightly loaded or do nothave any clients at all.
8. Impact of starting level
In the previous section, we studied the impact of thebranching factor on ReDiR performance. In this section,we will first study the impact of choosing the starting leveladaptively. Next, we will study the impact of using differ-ent fixed starting levels. The measurements were carriedout using one network size, N = 10,000. The branching fac-tor was set to 10, as this value was observed to minimizedelays for N = 10,000 in the previous section.
8.1. Adaptive starting level selection
ReDiR specifies a mechanism to determine the startinglevel (lstart) adaptively [1]. In this approach, service clientstake, for registrations, lstart to be the lowest level at whichregistration last completed. For service lookups, clients re-cord the levels at which the last 16 service lookups com-pleted and take lstart to be the mode of those depths. Table7 compares the cases when the mechanism has beenswitched on and off. In the table, the 95% confidence inter-vals are shown in parentheses after each value. Surprisingly,using the mechanism results in significant degradation inperformance for many of the metrics studied.
The reason why adaptive starting level selection resultsin degraded performance is as follows. First, the mecha-nism can result in a performance improvement for servicelookups only if a typical client performs them rather fre-quently. However, this is not the case in our P2PSIP usecase, since each client typically performs only one servicelookup (to discover a TURN server upon joining the net-work). Therefore, the mechanism is not very useful in ouruse case. Second, we observed the mechanism to causethe starting level of registrations to be rather high in thetree. Since the starting level is high, the upward walk ofregistrations becomes very long, which results in increaseddelays and failures.
Based on these results, we can conclude that the specificadaptive starting level selection mechanism proposed in[1] should be switched off in the TURN server discoveryuse case and other similar use cases. We will propose analternative mechanism for adapting the starting level inSection 11.
8.2. Service lookup and registration delays
The impact of modifying the default starting level onReDiR service lookup and registration delays is shown inFig. 10. From the figure, we can conclude that at least forN = 10,000 and service provider density of 11%, b = 10 andlstart ¼ 2 result in the lowest ReDiR delays.
8.3. Service lookup and registration failures
Fig. 11 shows the impact of different starting levels onthe percentage of failed service lookups and registrations.From the figure, we can observe that the lowest numberof failures is achieved when lstart =2. The difference be-tween this starting level and starting levels 0, 1, and 3are not statistically significant.
In the case of the branching factor, we conluded that thedelays and failure rates depend on the density of records inthe ReDiR tree. The same explanation holds also in the caseof the starting level; in fact, to reach the lowest delays andfailure rates, one must find the optimal combination of band lstart values for a given number of SPs. We will studyhow to determine the optimal combination in Section 11.
1
10
100
1000
0 10 20 30 40 50 60 70
Freq
uenc
y
Number of TURN clients per TURN server
Fig. 9. TURN clients per server, b = 10 and N = 10,000.
Table 7Effect of using adaptive starting level selection.
Adaptiveness off Adaptiveness on
Discovery delay 4373 ms (10 ms) 4372 ms (13 ms)Registr. delay 20162 ms (22 ms) 82577 ms (375 ms)Discovery failed 0.33% (0.13%) 0.29% (0.10%)Registr. failed 0.89% (0.19%) 4.55% (1.03%)ReDiR traffic 947 MB (3 MB) 2300 MB (19 MB)Lookups, top 5% 41.8% 39.14%Clients, 95th 26.85 (0.17) 26.44 (0.28)
Fig. 10. Impact of starting level on delays.
1620 J. Mäenpää / Computer Networks 56 (2012) 1612–1626

8.4. ReDiR traffic
We also studied the impact of different starting levelson the traffic ReDiR generates. Our results (not shown herefor brevity) indicate that lstart ¼ 0 creates roughly seventimes more traffic than any other starting level. The expla-nation is the same as in Section 7.4; when lstart ¼ 0, everySP ends up storing its record in the root node, which resultsin that node becoming extremely large. Since also servicelookups start from the root level, every client has to fetchthe root node. This results in a high amount of ReDiR trafficwhen lstart ¼ 0. The starting level generating the leastamount of traffic (0.9 GB during the duration of the simu-lations) is lstart ¼ 2. The rest of the starting levels generateroughly twice as much traffic as lstart ¼ 2.
8.5. Lookup load and load of service providers
Fig. 12 shows the impact of the starting level on thenumber of Get requests that peers storing ReDiR tree nodesreceive. The figure shows the maximum, 95th percentile,median, and average number of Gets received. The maxi-mum is shown in the primary y-axis and the other valuesin the secondary y-axis. From the figure, we can observethat increasing lstart has the effect of bringing the 95th per-centile of received Gets down. It also results in the median
number of received Gets going up. We also studied the per-centage of Get requests received by the top 5% most loadedpeers storing ReDiR records. Our results (not shown herefor brevity) indicate that as lstart increases, the top 5% be-come less loaded. However, even in the best case(lstart ¼ 6), the top 5% of the peers still handle 41% of allGet requests, which cannot be considered satisfactory.Based on these results, we can conclude that increasinglstart seems to result in the load of answering Gets becomingslightly better distributed among the peers storing ReDiRtree nodes. The reason for this is that a larger lstart increasesthe probability that service lookups will finish higher inthe tree; our results show that as lstart is increased, theaverage service lookup finish level goes up. A higher finish-ing level means that more Gets are handled by the largenumber of nodes at the higher levels of the tree, which re-duces the load of the few nodes close to the root level.
We also studied the impact of starting level on thenumber of clients per TURN server. Our results (not shownhere for brevity), indicate that changing the starting levelhas in practice no impact on the load of the TURN servers;the maximum, average, median, and 95th percentile num-ber of clients per server stays flat regardless of the startinglevel.
As a summary, the adaptive starting level selectionmechanism specified by ReDiR should be disabled if clientsperform service lookups infrequently. Starting level canhave a considerable impact on ReDiR delays and failurerates. It also effects the amount of ReDiR traffic and the dis-tribution of Get load among peers storing tree nodes. How-ever, lstart does not seem to have an impact of thedistribution of load among SPs.
9. Impact of service provider density
We also wanted to understand the impact of SP densityon ReDiR performance. For this, we carried out an extra setof simulations in which we varied the percentage of TURNservers from 0.1% to 90%. Nwas set to 10000, meaning thatthe number of TURN servers varied between 10 and 9000.In these simulations, we focused on comparing the delays,failures, lookup load, and load of SPs. We will not discussthe traffic load, since it simply increases in a linear fashionas the density of SPs grows. In these simulations, b was setto 10, and lstart to 2. These specific values were chosen for band lstart since they produced good results in the previoussimulations.
The impact of different SP densities on service lookupand registration delays is shown in Fig. 13 for N = 10,000.From the figure, we can conclude that in addition to alow SP density, also a high SP density increases the servicelookup and registration delays considerably.
Fig. 14 shows the impact of different service providerdensities on ReDiR service lookup and registration failures.Although the differences between the densities are not inall cases statistically significant, we can still see that verylow and high densities result in a higher percentage of fail-ures than the medium level densities.
When the density is 0.1%, there are only 26 nodes in theReDiR tree and one node receives on the average 10,459
Fig. 11. Impact of starting level on failures.
Fig. 12. Impact of starting level on Gets received.
J. Mäenpää / Computer Networks 56 (2012) 1612–1626 1621

Get requests during a simulation run. When the density isincreased to 90%, the number of tree nodes grows to 12143and the number of Gets an average tree node receivesdrops to 363. This means that when density is 0.1%, a peerstoring tree nodes receives on the average 0.75 Gets persecond, and only 0.03 Gets per second when the densityis 90%. Thus, we can conclude that when the density is verylow, ReDiR places a considerable load on peers storing treenodes.
The impact of TURN server density on the number of cli-ents per TURN server is shown in Fig. 15. The figure showsthe median, 95th percentile, and ideal number of clientsper server. The ideal number of clients is the number of cli-ents each TURN server would have if the load was perfectlybalanced among the servers. Based on the figure, we canconclude that the higher is the density of SPs, the worsejob ReDiR does at balancing the load among them. This isbecause the percentage of unused TURN servers increasesas the density increases.
It is interesting to investigate why a very high and lowSP density results in decreased performance (in terms ofdelays and failures). A high SP density results in increaseddelays since the ReDiR tree becomes so densely populatedat the starting level and levels close to it that the averagelength of upward and downward walks increases. The
increased length of upward and downward walks also ex-plains why the percentage of failed registrations and ser-vice lookups goes up (the relationship between failuresand the number of requests per registrations and servicelookups was discussed in Section 7.3). Further, a very lowSP density results in increased delays and failure ratessince the tree becomes so sparsely populated that upwardand downward walks become longer.
Based on these results, we can conclude that also SPdensity has an impact on ReDiR performance. One of ourfindings was that increasing the density does not alwaysresult in better performance; especially very high densitiesresult in degraded performance. The reasons for this werediscussed above. Regardless of the density, the load is notequally distributed among the SPs. Finally, when the den-sity of SPs is rather low and a high number of service look-ups are being carried out, the peers storing ReDiR treenodes can experience a very high load.
10. Impact of peer departures
In this section, we will focus on studying the impact ofpeer and SP departures on ReDiR performance.
10.1. Growing overlay
We will first study the impact of departures in a grow-ing overlay whose maximum size is N = 1000. We used thesetup described in Table 5. The traffic model, which is de-scribed in Table 8, is identical to that used in earlier simu-lations for N = 1000 (see Table 3) with the exception that apeer inter-departure time was used. An inter-departuretime of 28.8 s was chosen since based on Little’s law, it
Fig. 13. Impact of service provider density on ReDiR delays.
Fig. 14. Impact of service provider density on failures.
Fig. 15. Impact of service provider density on TURN clients per server.
Table 8User interarrival and departure times, N = 1000.
Start ofperiod [s]
End ofperiod [s]
Interarrivaltime [s]
Inter-departuretime [s]
N at endof period
0 1000 10 0 1001000 2000 5 28.8 2652000 3750 2.5 28.8 904
1622 J. Mäenpää / Computer Networks 56 (2012) 1612–1626

corresponds to the mean inter-departure time of userswhose average online time is 8 h (i.e., a full working day)in a 1000-peer system. For instance a company internalP2PSIP telephony network could have a user online timeof 8 h. In the simulations, bwas set to 10 and lstart to 2 sincethese are the default values in ReDiR. Density of SPs was11% (i.e., the same as in earlier simulations). The purposeof the simulations was to study how peer and SP depar-tures impact the results described in the earlier sections.The arrival and departure of peers was modeled as a Pois-son process. 10% of departures were crashes, meaning thatthe peer or SP left the overlay ungracefully without inform-ing other peers. A 10% crash percentage was chosen basedon the assumption that the clear majority of users leavegracefully from a P2PSIP telephony system. The peers andSPs to leave and crash were selected randomly from amongall the peers participating in the overlay.
The results of the simulations are described in Table 9.The table compares two scenarios: in the first one, peerdepartures were used, whereas in the second, there wereno peer departures. The values in the table are averagescalculated over 25 simulations. The numbers shown inthe parentheses represent the 95% confidence intervals.From the table, we can see that the introduction of depar-tures does not have a statistically significant impact on de-lays. However, the amount of failed service lookup andregistration operations and the amount of failed Get andPut requests grows significantly. The most common reasonfor registration and service lookup failures was observed tobe Get and Put request timeouts resulting from the tempo-rary instability caused by departing and crashing peers.
10.2. Churn in an overlay having constant size
So far, we have been studying the performance of ReDiRin constantly growing overlays. In this subsection, we willstudy ReDiR performance in an overlay whose size remainsconstant over time. We studied two different scenarios. Inthe first scenario, the overlay was churning at such a ratethat its size remained constant. The average mean onlinetime of users was again 8 h. The size of the overlay (N)was 1000 peers. Using Little’s law, this results in mean userinterarrival and departure times of 28.8s. We started col-lecting measurement data at the moment when N reached1000 peers and continued collecting data for 3600 s. The
second scenario was otherwise identical except that therewas no churn at all. We repeated the simulations 25 times.The results of these simulations are presented in Table 10.The results indicate that the presence of churn does nothave a statistically significant impact on delays. In con-trast, churn does have a statistically significant impact onthe percentage of failed service lookup and registrationoperations. This is caused by a high percentage of Get re-quests failing due to the instability caused by peer depar-tures. Nearly all Get requests fail due to timeouts. Thepercentage of failed Put requests is much lower than thepercentage of failed Get requests due to the fact that theaverage hop count of Put requests is almost three timeslower than that of Get requests.
Note that most of the values in Tables 9 and 10 are notcomparable between the tables since the duration of thesimulations was different and since results from the periodbefore N reached 1000 are not included in Table 10. How-ever, we can still see that there are no statistically signifi-cant differences for instance in the number of Put and Getrequests per registration between the different scenarios.This is because the structure of the ReDiR tree is not af-fected by churn (tree nodes are simply transferred be-tween peers as peers come and go) and also because it isnot affected by whether N is constant or growing.
Based on the results in this section, we can concludethat the main impact peer departures have on ReDiR per-formance is the increased failure rate of service lookupand registration operations. Peer departures also impactthe distribution of Get load and load of SPs. This is becauserecords stored by leaving peers and clients served by leav-ing SPs are transferred to some other node in the overlay,which on the average doubles the load of that node.
11. Selecting branching factor and starting level
Our results suggest that knowing the number of SPs, itis possible to determine the optimal values for b and lstart .We have seen that the lowest service lookup and registra-tion delays are reached when the density of records in theReDiR tree is neither too high nor too low, that is, when themajority of service lookups finish already at lstart . Thus, wecan determine the parameters resulting in the lowest
Table 9Impact of departures on ReDiR performance.
Departures No departures
Service lookup delay [ms] 5005 (176) 4961 (182)Registration delay [ms] 17454 (305) 17951 (358)Service lookup failed [%] 1.4 (0.3) 0.8 (0.3)Registration failed [%] 3.8 (1.0) 1.4 (0.4)ReDiR traffic [MB] 27.0 (1.0) 28.9 (1.2)All departures 72.8 (2.5) 0 (0)SP departures 17.5 (1.2) 0 (0)Failed Get requests [%] 0.65 (0.12) 0.19 (0.05)Failed Put requests [%] 0.24 (0.06) 0.06 (0.02)Gets per registration 3.89 (0.02) 3.87 (0.02)Puts per registration 3.89 (0.02) 3.87 (0.02)% of Gets handled by top 5% 43.0 44.4Median of clients per SP 6 7
Table 10ReDiR performance in an overlay with constant size.
Churn No churn
Service lookup delay [ms] 5004 (126) 4882 (159)Registration delay [ms] 21724 (550) 22619 (1077)Service lookup failed [%] 0.9 (0.4) 0 (0)Registration failed [%] 2.5 (1.2) 0.6 (0.3)ReDiR traffic [MB] 31.5 (1.1) 36.2 (2.9)All departures 124.9 (3.5) 0 (0)SP departures 12.4 (1.4) 0 (0)All joins 124.8 (4.0) 0 (0)All SP joins 13.7 (1.0) 0 (0)Failed Get requests [%] 0.7 (0.5) 0.15 (0.1)Failed Put requests [%] 0.07 (0.05) 0 (0)Gets per registration 3.89 (0.02) 3.91 (0.02)Puts per registration 3.89 (0.02) 3.91 (0.02)% of Gets handled by top 5% 44.7 39.4Median of clients per SP 4 6
J. Mäenpää / Computer Networks 56 (2012) 1612–1626 1623

delays by calculating the probability that service lookupswill finish at lstart . This probability can be calculated asfollows:
Pðfinish at lstartÞ ¼ Pðsuccessor foundÞ� Pðk not sandwichedÞ; ð1Þ
where k is the key being searched for, P (successor found)refers to the probability that the successor of k is foundat lstart , and P (k not sandwiched) refers to the probabilitythat k is either the highest or lowest identifier in its inter-val at lstart . P (successor found) can be calculated as follows:
Pðsuccessor foundÞ ¼NSP
blstartNSP
blstartþ 1
; ð2Þ
where NSP is the number of service providers. Eq. (2) andalso other equations presented in this section assume uni-form distribution of peer identifiers in the identifier spaceof the overlay. The numerator of Eq. (2) gives the averagenumber of records Nrec ¼ NSP
blstartper tree node at lstart . The
denominator gives the average number of positions that arandomly chosen key can occupy within its tree node atlstart relative to keys already stored in the tree node. Morespecifically, an average tree node at lstart has Nrec records.The keys of these records divide the part of the identifierspace that the tree node owns into Nrec þ 1 parts. There isa successor of a key k present in the tree node if k fallswithinthe range of any other of these parts except for the last one.Further, the probability P (k not sandwiched) is given by:
Pðk not sandwichedÞ ¼ min2
NSP
blstartþ1 þ 1; 1
!ð3Þ
The numerator in Eq. (3) is two since a given key is notsandwiched within an interval if it is either the first or lastkey within the interval. In the denominator, NSP
blstartþ1 gives theaverage number of records per interval at lstart . This value isincremented by one in the denominator to get the numberof subintervals into which the keys of the records dividethe interval.
Eq. (1) makes it possible to determine which values oflstart and b result in the highest probability that servicelookups will finish at the starting level. This is enough toguarantee that delays stay as low as possible. However, itis not enough to guarantee a good distribution of the loadof answering Get requests. To achieve a good distributionof Get load, we need to, in addition to having as many ser-vice lookups as possible finish at lstart , to also have as manyregistrations as possible to not have an upward walk. Thereason to not have an upward walk is to minimize the loadof the few tree nodes located at the root level and levelsclose to it. Although most of the service lookups finish atlstart if Eq. (1) has been used to select optimal parameters,typically most of service registrations will proceed all theway to the root especially if a large b is used. This causesa high load at the lowest levels of the tree. To reduce theload, one should minimize the number of registrationshaving an upward walk. The probability that a registrationdoes not have an upward walk can be calculated asfollows:
Pðno upward walkÞ ¼ 1� Pðk not sandwichedÞ ð4Þ
Eq. (4) follows from the fact that a registration does nothave an upward walk if k is sandwiched in its interval atlstart . Now, using Eqs. (1) and (4), the probability that botha short delay and good distribution of Get load is achievedcan be calculated as follows:
Pðshort delay and good load distributionÞ¼ Pðfinish at lstartÞ � Pðno upward walkÞ ð5Þ
As a summary, knowing NSP , one can use different values ofb and lstart as input to Eq. (5) to determine which combina-tion of the parameters results in the highest probability va-lue. These parameters can then be used to configure ReDiRin such a way that short delays and good distribution ofGet load is achieved.
Naturally, P2P overlays are typically dynamic and thusthe number of peers and SPs changes over time. Therefore,we will next explain how the model can be used to dynam-ically adapt ReDiR parameters as a response to changes inthe number of SPs (NSP). The number of SPs present in theoverlay can be estimated as follows. As discussed above,every SP needs to store its record at lstart . Thus, an estimateof the number of SPs NSPest can be calculated by fetchingM P 1 tree nodes from lstart and observing the averagenumber of records Nrec that the tree nodes contain. Basedon this information, NSPest can be calculated as follows:
NSPest ¼PM
i¼0Nreci
M� blstart ; ð6Þ
where blstart gives the number of tree nodes at lstart . In oursimulations, we found Eq. (6) to provide decent estimatesfor NSP , especially whenM is sufficiently large. As an exam-ple, when M = 3, b = 4, and lstart ¼ 2, the estimate is on theaverage accurate within 15% of the real value of NSP in anetwork with 1000 peers, 100 of which are SPs. In the samesetup, M = 10, improves the estimate to be accurate within9% of the real value. The estimate produced by Eq. (6) canbe used as input to Eq. (5) to calculate the best b and lstart inan adaptive fashion during the runtime of a P2P overlay.
Adapting lstart during the runtime of a P2P overlay israther straighforward as it does not require changes tothe structure of the ReDiR tree. However, adapting b is amore complex procedure since it requires re-building thetree. The way a system can migrate to a new tree is de-scribed below. The first SP detecting the need to switchto a different b creates a new tree by storing its recordusing the new b. Further SPs detecting the need to migratewill add more records and tree nodes to the new tree. Toensure that other SPs can detect the need to migrate, theold tree needs to be maintained in parallel with the newtree for the duration of one ReDiR record refresh period.This is because the SPs detect the need to migrate byobserving record density in the old tree. Thus, all SPsmigrating to the new tree still need to refresh their recordin the old tree. At the end of the refresh period, all SPs arealready part of the new tree and thus the old tree can beabandoned. As a summary, the cost of the tree migrationprocedure is to maintain two ReDiR trees in parallel forthe duration of a single refresh period. From the viewpointof a single SP, this means performing two registration pro-cedures instead of a single one during that period.
1624 J. Mäenpää / Computer Networks 56 (2012) 1612–1626
11.1. Validating the model
We validated the model presented in the previous sub-section using simulations. We ran simulations for N = 100,N = 1000, and N = 10,000 using a large number of combina-tions of starting levels between 1–9 and the branching fac-tor values used in the previous simulations (i.e., from b = 2to b = 38). In the simulations, we observed for each b andlstart combination how many service lookups finish at thestarting level (i.e., Pðfinish at lstartÞ) and how many registra-tions have no upward walk (i.e., Pðno upward walkÞ) andcompared these results against the model (i.e., Eq. (5)).Our results (not shown here for brevity) indicate that themodel can accurately predict the best b and lstart combina-tion for each network size. Thus, we can conclude that themodel provides good guidance for selecting appropriatevalues for ReDiR parameters.
12. Conclusions and future work
In this paper, we studied the performance of ReDiRwhen applied as a mechanism for TURN server discoveryin a P2PSIP overlay. Although we focused on the TURNserver use case, our results are applicable to any popularservice in a DHT-based network. Wemade several observa-tions. First, ReDiR is rather difficult to configure. Configur-ing it inappropriately can have non-negligible impact onboth ReDiR performance (i.e., on delays, traffic, and loadbalance) and the performance of the entire P2P overlay(e.g., due to the traffic load ReDiR generates). On one hand,configuring ReDiR so that delays are minimized can resultin sub-optimal load balance. On the other hand, if the goalis optimal load balance, delays can grow dramatically.Parameters that are optimal for one network size and ser-vice provider density may perform very badly in a differentsetting.
If configured inappropriately, ReDiR can cause a highGet, Put, and storage load on tree nodes at the lowest levelsof the tree. Especially the root node can become over-loaded. If the number of service providers is low, the costof being responsible for a tree node can be high for a peer.In such a case the traffic load caused by ReDiR on thesepeers is considerably higher than that caused by the DHT.To assist in problems with configuring ReDiR, we devel-oped a model that can be used to determine parametersresulting in both short delays and good load balance. Themodel was validated through simulations.
If ReDiR has been configured appropriately for the num-ber of service providers in the overlay, the average servicelookup delay is only slightly higher than the delay of a sin-gle DHT Get operation. However, even in the best case, theaverage registration delay is multiple (typically, at leastfive) times longer than the delay of a DHT Put operation.The most important factor impacting ReDiR delays is thedensity of records at the starting level.
ReDiR does not add any additional uncertainty on top ofthe underlying DHT; the failure rate of service lookups andregistrations is proportional to the Get and Put failure rateof the DHT. We also saw that ReDiR does not do a verygood job at balancing the number of clients among serviceproviders.
Some conclusions can also be drawn for the P2PSIP usecase. First, due to the large delays associated with ReDiRservice lookups, it is not practical to use ReDiR for TURNserver discovery during P2PSIP call setup. Instead, TURNserver discovery should either be performed in advancebefore the call or an existing TURN server should be used.Also, since service lookup delays can be large, it makessense for a peer to maintain a backup TURN server to speedup the process of re-establishing connections if the pri-mary server fails.
Based on our results, ReDiR could be improved in multi-ple ways. One simple way to reduce the traffic load is notto return the entire tree node (i.e., all records) in a Get re-sponse but instead return records selectively (e.g., only therecord of the successor or enough information to indicatethat the search key is sandwiched). This comes at the costof extra logic required in every peer. Using the model fordetermining suitable branching factor and starting levelproposed in this paper, one can also make ReDiR adaptiveto address the difficulties associated with configuring theparameters. As an example, using the model, it would bepossible for peers to adjust the starting level as a responseto changes in the number of service providers. When thenumber of requests per operation is high, ReDiR failurerate could be reduced by retransmitting failed Gets andPuts. ReDiR would also benefit greatly from better load bal-ancing between service providers. ReDiR also does not takeservice provider heterogeneity into account. We plan tostudy ReDiR improvements in future work.
References
[1] S. Rhea, B. Godfrey, B. Karp, J. Kubiatowicz, S. Ratnasamy, S. Shenker,I. Stoica, H. Yu, Opendht: a public dht service and its uses, in:SIGCOMM’05: Proceedings of the 2005 conference on Applications,technologies, architectures, and protocols for computercommunications, ACM, New York, NY, USA, 2005, pp. 73–84.<http://dx.doi.org/http://doi.acm.org/10.1145/1080091.1080102>.
[2] C. Jennings, B. Lowekamp, E. Rescorla, S. Baset, H. Schulzrinne,REsource LOcation And Discovery (RELOAD) Base Protocol, Internetdraft – work in progress, IETF, November 2010.
[3] I. Stoica, R. Morris, D. Liben-Nowell, D.R. Karger, M.F. Kaashoek, F.Dabek, H. Balakrishnan, Chord: a scalable peer-to-peer lookupprotocol for internet applications, IEEE/ACM Trans. Netw. 11 (1)(2003) 17–32. <http://dx.doi.org/http://dx.doi.org/10.1109/TNET.2002.808407>.
[4] J. Rosenberg, H. Schulzrinne, G. Camarillo, A. Johnston, J. Peterson, R.Sparks, M. Handley, E. Schooler, SIP: Session Initiation Protocol, RFC3261, 2002.
[5] R. Mahy, P. Matthews, J. Rosenberg, Traversal using relays aroundNAT (TURN): relay extensions to session traversal utilities for NAT(STUN), RFC 5766, April 2010.
[6] J. Mäenpää, G. Camarillo, Service discovery usage for REsourceLOcation And Discovery (RELOAD), Internet draft – work in progress,IETF, July 2010.
[7] J. Mäenpää, G. Camarillo, Study on maintenance operations in a peer-to-peer session initiation protocol overlay network, in: Proceedingsof IEEE IPDPS, 2009.
[8] J. Mäenpää, G. Camarillo, Analysis of delays in a Peer-to-Peer sessioninitiation protocol overlay network, in: Proceedings of IEEE CCNC,Las Vegas, USA, 2010.
[9] J. Mäenpää, V. Andersson, A. Keränen, G. Camarillo, Impact ofnetwork address translator traversal on delays in peer-to-peersession initiation traversal, in: Proceedings of IEEE GLOBECOM,Miami, USA, 2010.
[10] J. Mäenpää, G. Camarillo, Estimating operating conditions in asession initiation protocol overlay network, in: Proceedings of IEEEIPDPS, Atlanta, USA, 2010.
[11] S. Baset, H. Schulzrinne, M. Matuszewski, Peer-to-peer protocol(P2PP), Internet draft – work in progress, IETF, November 2007.
J. Mäenpää / Computer Networks 56 (2012) 1612–1626 1625

[12] J. Mäenpää, G. Camarillo, J. Hautakorpi, A Self-tuning DistributedHash Table (DHT) for REsource LOcation And Discovery (RELOAD),Internet draft – work in progress, IETF, January 2011.
[13] D. Liben-Nowell, H. Balakrishnan, D. Karger, Observations on thedynamic evolution of peer-to-peer networks, in: Proceedings of theFirst International Workshop on Peer-to-Peer Systems (IPTPS’01),Springer-Verlag, London, UK, 2002, pp. 22–33.
[14] L. D’Acunto, J. Pouwelse, H. Sips, A measurement of NAT & firewallcharacteristics in peer-to-peer systems, in: L.W. Theo Gevers,Herbert Bos (Ed.), Proc. 15-th ASCI Conference, Advanced Schoolfor Computing and Imaging (ASCI), P.O. Box 5031, 2600 GA Delft, TheNetherlands, 2009, pp. 1–5.
[15] B. Athwal, F.C. Harmatzis, V.P. Tanguturi, Replacing centric voiceservices with hosted voip services: an application of real optionsapproach, in: Proc. of the 16th International TelecommunicationsSociety (ITS) European Regional Conference, 2006.
[16] Traffic analysis for voice over ip, 2001. <http://www.cisco.com>.[17] C. Cheng, S. Tsao, J. Chou, Unstructured peer-to-peer session
initiation protocol for mobile environment, in: Proceedings of the18th Annual IEEE International Symposium on Personal, Indoor andMobile Radio Communications (PIMRC’07), 2007, pp. 1–5.
[18] B.A. Nardi, S. Whittaker, E. Bradner, Interaction and outeraction:instant messaging in action, in: Proceedings of the 2000 ACM
conference on Computer supported cooperative work (CSCW’00),ACM, New York, NY, USA, 2000, pp. 79–88. <http://dx.doi.org/http://doi.acm.org/10.1145/358916.358975>.
Jouni Mäenpää received his M.Sc. degree inTelecommunications Engineering from Hel-sinki University of Technology in 2005. He iscurrently the manager of CommunicationServices research at the NomadicLab researchlaboratory of Ericsson Research. He is workingtowards a Ph.D. degree. His research interestsare in the areas of communication technolo-gies, peer-to-peer networking, and Internet ofthings.
1626 J. Mäenpää / Computer Networks 56 (2012) 1612–1626