discussion document on south africa’s motor … · discussion document on south africa’s motor...
TRANSCRIPT
THE SOUTH AFRICA I KNOW, THE HOME I UNDERSTAND
DISCUSSION DOCUMENT ON SOUTH AFRICA’S MOTOR TRADE INDUSTRY
Discussion document: D6301.1
February 2018

STATISTICS SOUTH AFRICA 2
TABLE OF CONTENTS
1. INTRODUCTION ........................................................................................................................................... 4
2. OVERVIEW OF THE MOTOR TRADE INDUSTRY ...................................................................................... 4
3. THE STRUCTURE OF THE MOTOR TRADE INDUSTRY ........................................................................... 5
3.1 Market structure ........................................................................................................................................... 5
3.2 Income contribution ..................................................................................................................................... 7
3.3 The profit margin .......................................................................................................................................... 8
3.4 Expenditure structure ................................................................................................................................... 8
4. RETAIL SALES OF MOTOR VEHICLES .................................................................................................... 11
4.1 Economic performance .............................................................................................................................. 13
4.2 Prices ......................................................................................................................................................... 14
4.3 Production volumes and exchange rates .................................................................................................. 15
5. RETAIL SALES OF AUTOMOTIVE FUEL .................................................................................................. 17
5.1 Price and consumption of fuel ................................................................................................................... 19
5.2 Convenience stores ................................................................................................................................... 20
6. EMPLOYMENT IN THE MOTOR TRADE INDUSTRY ............................................................................... 20
6.1 Employment by type of motor trade ........................................................................................................... 20
6.2 Employment by gender .............................................................................................................................. 21
6.3 Employment by enterprise size.................................................................................................................. 22
6.4 Employment by type of contract ................................................................................................................ 22
6.5 Income share, employment share and average earnings ......................................................................... 23
7. CONCLUSION ............................................................................................................................................. 24
APPENDIX ....................................................................................................................................................... 25

STATISTICS SOUTH AFRICA 3
LIST OF TABLES
Table 1 – Concentration ratios (five largest) in the motor trade industry, 2006–2015 ...................................... 6
Table 2 – Income contribution by motor trade type (percentage), 2006–2015 ................................................. 7
Table 3 – Employment by enterprise size (percentage contribution), 2015 .................................................... 22
Table 4 – Income share, employment share and average earnings by motor trade type, 2015 ..................... 23
LIST OF FIGURES
Figure 1 – Real GDP and motor trade value added growth rates, 2005–2015 ................................................. 5
Figure 2 – Income contribution by enterprise size (percentage), 2006–2015 ................................................... 7
Figure 3 – Profit margins by motor trade type (percentage), 2006–2015 ......................................................... 8
Figure 4 – Expenditure in the motor trade industry, 2006–2015 ....................................................................... 9
Figure 5 – Capital expenditure on new assets by type of service, 2006–2015 ............................................... 10
Figure 6 – Capital expenditure by type of asset, 2006–2015 .......................................................................... 11
Figure 7 – Income contribution of retail sales of motor vehicles, 2006–2015 ................................................. 12
Figure 8 – Income from sales by type of motor vehicle, 2006–2015 ............................................................... 12
Figure 9 – Sales of motor vehicles; parts and accessories, 2006–2016 ......................................................... 13
Figure 10 – Real GDP growth for South Africa, 2004–2016 ........................................................................... 14
Figure 11 – Household consumption expenditure, 2004–2016 ....................................................................... 14
Figure 12 – Headline inflation and new vehicle price, 2005–2016 .................................................................. 15
Figure 13 – Headline inflation and price of petrol, 2005–2016 ........................................................................ 15
Figure 14 – Motor vehicle volume of production and foreign trade, 2005–2016 ............................................. 16
Figure 15 – Rand/US dollar exchange rate, 2005–2016 ................................................................................. 16
Figure 16 – Income contribution for retail sales of automotive fuel, 2006 – 2015 ........................................... 17
Figure 17 – Income from retail sales of petrol and diesel, 2006–2015............................................................ 18
Figure 18 – Income from total sales of trucks and lorries, 2006–2015............................................................ 18
Figure 19 – Headline CPI, petrol and diesel price index, 2005–2016 ............................................................. 19
Figure 20 – Volume of petrol and diesel consumed (litres), 2005–2016 ......................................................... 19
Figure 21 – Income from convenience store sales, 2006–2016 ...................................................................... 20
Figure 22 – Employment by type of motor trade (percentage of total), 2015 .................................................. 21
Figure 23 – Employment by gender (percentage of total), 2015 ..................................................................... 21
Figure 24 – Employment by type of contract (percentage of total), 2015 ....................................................... 23

STATISTICS SOUTH AFRICA 4
1. INTRODUCTION
Motor trade is a dynamic industry which can experience rapid change in a short space of time. Growth in this
industry is largely explained by the nature of competition and changing consumer demands. Thus, today’s
motor trade industry is concerned with consumers’ preferences for features such as styling, safety, fuel
efficiency and comfort. In turn, these preferences are influenced by a range of factors such as the state of
the economy, inflation, interest rates and household disposable income. These factors can change rapidly,
and even long-term trends can be reversed relatively quickly, resulting in structural changes in the motor
trade industry.
The motor trade industry in South Africa has seen a transition over the past few years, driven by various
factors that have contributed to changes in the South African economy. This discussion document examines
structural changes in the South African motor trade industry between 2006 and 2015. In addition,
employment dynamics in the motor trade industry in 2015 are also discussed.
2. OVERVIEW OF THE MOTOR TRADE INDUSTRY
The motor trade industry is one of the important sectors in the South African economy. The industry is
diverse covering a wide range of activities, comprising wholesale sales of motor vehicles; retail sales of
motor vehicles; maintenance and repair of motor vehicles; sales of new motor vehicle parts and accessories;
sales of used motor vehicle parts and accessories; sales, maintenance and repair of motor cycles and
related accessories; and retail sales of automotive fuel. In simple terms, motor trade activities include
authorised car dealers, filling stations, car brokers and independent dealers, authorised and independent
service and repair operators and equipment and parts suppliers, among others.
In 2015, the motor trade industry’s contribution to gross domestic product (GDP) stood at 2,2%, up from
1,9% in 2006. The motor trade industry is also an employer of note, accounting for about 3,4% of total formal
employment in 2015, which is equivalent to 345 716 jobs1.
Profit margins in the motor trade industry are generally low when compared with other industries within the
trade sector. For instance, in 2015 the profit margin was 2%, compared with 10% in tourist accommodation
and 3% in retail trade.
1 Quarterly Employment Statistics, P0277.

STATISTICS SOUTH AFRICA 5
Figure 1 – Real GDP and motor trade value added growth rates, 2005–2015
Source: Gross Domestic Product, P0441
Although the motor trade industry showed impressive recovery signs following the recession of 2009,
particularly in 2010 and 2011, recent data show that the sector was still struggling. Figure 1 shows that in
2014 and 2015, value added in motor trade declined by 1,7% and 3,5% respectively. This is in contrast to
high growth rates recorded in 2005 and 2006, when value added increased by 10% and 12,9% respectively.
The slowdown in motor trade follows that of the economy as a whole, real GDP having increased by just
1,7% in 2014 and 1,3% in 2015.
In summary, motor trade is a very important industry in the South African economy, contributing immensely
to economic growth and employment. However, the industry has not grown as fast as it did before the
recession of 2009, which is characteristic of an industry in distress. Moreover, profit margins have remained
relatively low when compared with other industries within the trade sector, reflecting the generally high levels
of competition in the industry.
3. THE STRUCTURE OF THE MOTOR TRADE INDUSTRY
This section examines structural changes in the motor trade industry using recently-published data from
Stats SA’s Structural Industry Statistics (SIS)2. What is striking about the recent past is how profoundly the
market structure, income contribution, expenditure and profit landscape has shifted between 2006 and 2015.
These shifts are discussed next.
3.1 Market structure
As mentioned earlier, the motor trade industry is very diverse and so is the market structure. The market
structure, measured in terms of concentration ratios, shows that overall the motor trade industry is not
concentrated, with concentration ratios for the largest five enterprises of 27% in 2006 and 16% in 2015.
Based on the concentration levels observed for the whole industry, one can easily conclude that the motor
trade industry is not a concentrated market. However, since motor trade activities are not uniform,
concentration ratios for the industry as a whole may be misleading. Given this constraint, specific sub-sector
concentration ratios will be examined.
2 Structural Industry Statistics conducts a survey every three years to measure economic activity in the motor trade sector of the South
African economy. This survey is based on a sample of private and public enterprises operating in motor trade.
5.3 5.6 5.4
3.2
-1.5
3.0 3.3 2.2 2.5 1.7 1.3
10.0
12.9
9.5
-1.8 -3.6
10.5 9.9
6.8
1.2
-1.7 -3.5
-8.0
-4.0
0.0
4.0
8.0
12.0
16.0
2005 2006 2007 2008 2009 2010 2011 2012 2013 2014 2015
Gro
wth
rat
e, %
GDP at market prices Motor trade; repair of motor vehicles

STATISTICS SOUTH AFRICA 6
Concentration ratios using the largest five enterprises show that wholesale sales of motor vehicles was
concentrated. In 2006 the concentration ratio was 47%, but this declined to 44% in 2015. This entails that the
five largest enterprises account for between 44% and 47% of total income in wholesale sales of motor
vehicles. This is characteristic of an oligopolistic market structure, where a few large firms control the market.
This market has barriers to entry for new entrants.
Similarly, retail sales of motor vehicles show some degree of concentration, with concentration levels of 36%
in 2006 and 34% in 2015 (five largest). This is characteristic of monopolistic competition, where a large
number of firms are selling differentiated products (similar but not identical) and entry to the market is
unrestricted. For instance, there are many car dealers in South Africa selling cars of different makes, but
each car dealer enjoys a certain degree of monopolistic power over its competitors as a result of the
uniqueness of the product or because of the better location or a better service it provides.
In contrast, concentration ratios in retail sales of automotive fuel and maintenance and repair of motor
vehicles show that these sub-sectors are not concentrated. The concentration ratio (five largest) ranged
between 2% and 8%, suggesting a market that is not concentrated. This market structure is characterised by
a large number of sellers and none could influence prices. Moreover, entry to this market is not restricted.
Table 1 – Concentration ratios (five largest) in the motor trade industry, 2006–2015
Type of motor trade 2006 2009 2012 2015
Wholesale sales of motor vehicles 47,0 46,4 43,3 44,5
Retail sales of motor vehicles 36,2 37,1 39,9 34,1
Maintenance and repair of motor vehicles 6,0 8,0 6,1 5,2
Sales of new motor vehicle parts and accessories 25,0 20,7 18,2 17,9
Sales of used motor vehicle parts and accessories 27,0 14,3 22,5 25,7
Sales, maintenance and repair of motor cycles and related accessories 27,0 24,1 17,9 21,9
Retail sales of automotive fuel 3,0 2,1 2,1 2,1
Total 27,5 18,9 17,6 15,9
Source: Motor trade industry, Report No. 63-01-02
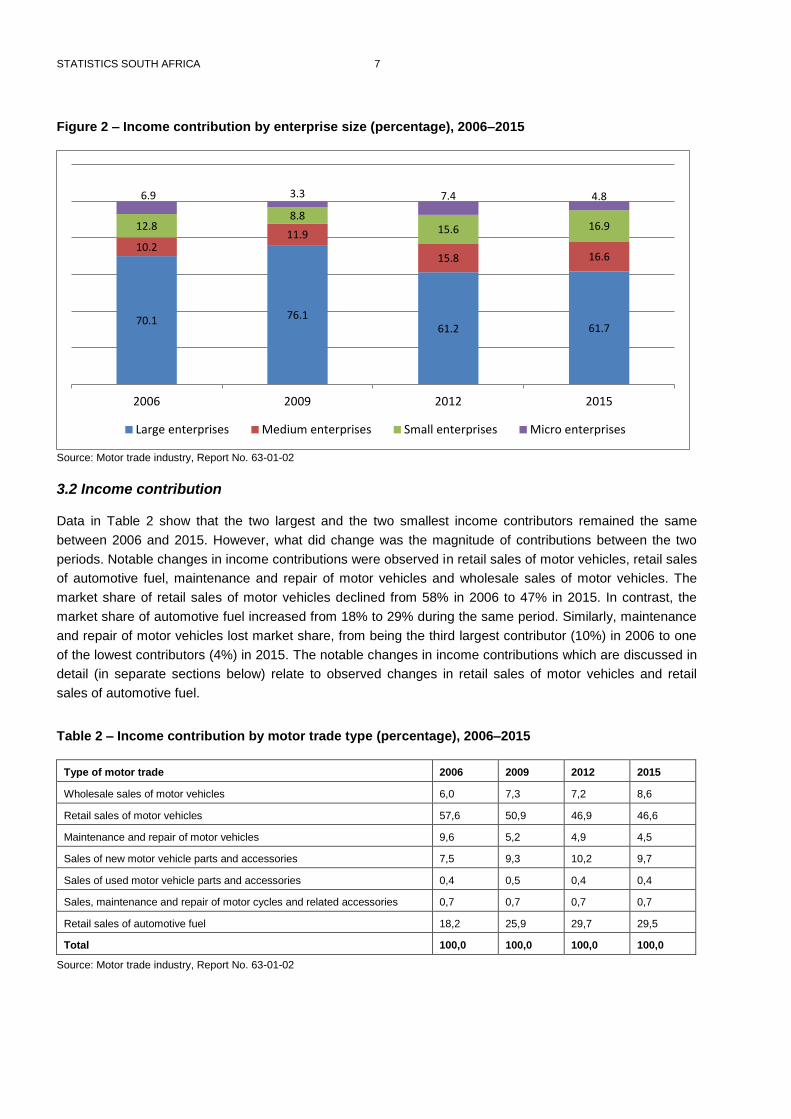
Data in Table 1 also show that concentration ratios have declined across all motor trade sub-sectors. This
decline could suggest that the motor trade industry was opening up for new entrants, particularly for small
firms. Data by enterprise size in Figure 2 show that there was a notable change in income contribution by
enterprise size. The proportion of income generated by large enterprises has declined over time. In 2006,
large enterprises accounted for 70% of total income, which declined to 62% in 2015. In contrast, the
contribution of both medium and small enterprises to total income has increased. The declining income
contribution by large enterprises and the increasing contribution by medium and small enterprises suggest
two possibilities – large enterprises downsizing their operations and/or the motor trade industry opening up
to more medium and small firms.
STATISTICS SOUTH AFRICA 7
Figure 2 – Income contribution by enterprise size (percentage), 2006–2015
Source: Motor trade industry, Report No. 63-01-02
3.2 Income contribution
Data in Table 2 show that the two largest and the two smallest income contributors remained the same
between 2006 and 2015. However, what did change was the magnitude of contributions between the two
periods. Notable changes in income contributions were observed in retail sales of motor vehicles, retail sales
of automotive fuel, maintenance and repair of motor vehicles and wholesale sales of motor vehicles. The
market share of retail sales of motor vehicles declined from 58% in 2006 to 47% in 2015. In contrast, the
market share of automotive fuel increased from 18% to 29% during the same period. Similarly, maintenance
and repair of motor vehicles lost market share, from being the third largest contributor (10%) in 2006 to one
of the lowest contributors (4%) in 2015. The notable changes in income contributions which are discussed in
detail (in separate sections below) relate to observed changes in retail sales of motor vehicles and retail
sales of automotive fuel.
Table 2 – Income contribution by motor trade type (percentage), 2006–2015
Type of motor trade 2006 2009 2012 2015
Wholesale sales of motor vehicles 6,0 7,3 7,2 8,6
Retail sales of motor vehicles 57,6 50,9 46,9 46,6
Maintenance and repair of motor vehicles 9,6 5,2 4,9 4,5
Sales of new motor vehicle parts and accessories 7,5 9,3 10,2 9,7
Sales of used motor vehicle parts and accessories 0,4 0,5 0,4 0,4
Sales, maintenance and repair of motor cycles and related accessories 0,7 0,7 0,7 0,7
Retail sales of automotive fuel 18,2 25,9 29,7 29,5
Total 100,0 100,0 100,0 100,0
Source: Motor trade industry, Report No. 63-01-02
70.1 76.1 61.2 61.7
10.2 11.9
15.8 16.6
12.8 8.8
15.6 16.9
6.9 3.3 7.4 4.8
2006 2009 2012 2015
Large enterprises Medium enterprises Small enterprises Micro enterprises

STATISTICS SOUTH AFRICA 8
3.3 The profit margin
In addition to changes observed in the market structure and income contribution, SIS data show that the
profit landscape shifted between 2006 and 2015. Thus, the motor trade types which recorded relatively high
profit margins in 2006 were not the same as those with the highest profits in 2015, except for sales of used
vehicle parts and accessories. In 2006, profit margins were the highest in sales of used vehicle parts and
accessories (6,7%), followed by sales, maintenance and repair of motor cycles and related accessories
(5,1%). However, in 2015 the profit structure was such that profit margins were highest in sales of used
motor vehicle parts and accessories (5%), followed by sales of new motor vehicle parts and accessories
(3,4%).
Figure 3 – Profit margins by motor trade type (percentage), 2006–2015
Source: Motor trade industry, Report No. 63-01-02
3.4 Expenditure structure
In monetary terms, total expenditure in the motor trade industry doubled between 2006 and 2015. However,
the cost structure remained fairly the same, with the bulk of the expenditure accounted for by purchases and
salaries and wages. As shown in Figure 4, these two expenditure items combined accounted for over 90% of
total expenditure. Given the nature of activities in the motor trade industry, the three largest purchases were
cars (excluding vans, minibuses, trucks and lorries), new parts and accessories, and petrol/ fuel. As can be
expected, a large expense of any motor car dealer will be car purchases, which are in turn sold to
consumers. Similarly, for a petrol station, a large portion of its expenses will be the purchase of petrol/ diesel
for resale.
3.8 2.3 2.1 2.0
6.7 5.1 1.0 2.0
1.5 3.3 2.7 2.2
4.9
0.4
0.3 2.2
1.8 2.1 2.6 3.4
4.9
0.7
1.3
2.0
3.1 2.0 3.0 3.4
5.0
1.9
1.0
2.0
Wholesalesales ofmotor
vehicles
Retail salesof motorvehicles
Maintenanceand repair of
motorvehicles
Sales of newmotor
vehicle partsand
accessories
Sales of usedmotor
vehicle partsand
accessories
Sales,maintenanceand repair ofmotor cyclesand relatedaccessories
Retail salesof
automotivefuel
Motor tradeindustry
(aggregate)
2006 2009 2012 2015

STATISTICS SOUTH AFRICA 9
Figure 4 – Expenditure in the motor trade industry, 2006–2015
Source: Motor trade industry, Report No. 63-01-02
Data in Figure 5 show that expenditure on new capital assets varied across motor trade types. The amount
spent on new capital assets in the motor trade industry increased from R2,5 billion in 2006 to R7,3 billion in
2015, with the bulk of capital expenditure occurring in retail sales of motor vehicles. However, as a
proportion of total capital expenditure, the data showed a decline between 2006 (70%) and 2015 (67%).
Another notable decline was observed in wholesale sales of motor vehicles, from 9% in 2006 to 5% in 2015.
In contrast, capital expenditure on new assets increased (as a proportion) in maintenance and repairs of
motor vehicles and retail sales of automotive fuel.
0.0 10.0 20.0 30.0 40.0 50.0 60.0 70.0 80.0 90.0
Purchases
Salaries and wages
Rental of land, buildings and other structures
Interest
Advertising
Other expenditure
Contribution,%
2015
2012
2009
2006

STATISTICS SOUTH AFRICA 10
Figure 5 – Capital expenditure on new assets by type of service, 2006–2015
Source: Motor trade industry, Report No. 63-01-02
In 2015 the largest proportion of capital expenditure on new assets was the acquisition of motor vehicles,
followed by land, buildings and construction, and plant, machinery and equipment (Figure 6). Moreover, the
expenditure share of motor vehicles as new assets increased from 45% in 2006 to 62% in 2015, which could
be attributed to cars used for internal purposes, such as transporting clients and the collection and delivery
of parts. Some of these could be sold as demo-models.
The expenditure share of land, buildings and construction has declined slightly over time. This could be
related to the increase in rental of land, buildings and other structures shown in Figure 4. Instead of buying
land and buildings, the motor trade industry may have opted to rent for operation purposes, hence the
decline in expenditure on land, buildings and construction as a proportion of the total. The expenditure share
of plant, machinery and equipment also declined.
0.0
15.0
30.0
45.0
60.0
75.0
90.0
Wholesalesales of motor
vehicles
Retail sales ofmotor
vehicles
Maintenanceand repair of
motorvehicles
Sales of newmotor vehicle
parts andaccessories
Sales of usedmotor vehicle
parts andaccessories
Sales,maintenanceand repair ofmotor cyclesand relatedaccessories
Retail sales ofautomotive
fuel
%
2006 2009 2012 2015

STATISTICS SOUTH AFRICA 11
Figure 6 – Capital expenditure by type of asset, 2006–2015
Source: Motor trade industry, Report No. 63-01-02
In summary, the data show that there have been changes in the motor trade industry between 2006 and
2015 relating to market structure, income contribution, profit margins and expenditure structure. Notable
changes were observed in income contribution in retail sales of motor vehicles and retail sales of automotive
fuel, which is discussed in detail in the next two sections.
4. RETAIL SALES OF MOTOR VEHICLES
This section examines in detail the changes observed in retail sales of motor vehicles and other trends that
relate to the retail sales of motor vehicles.
Figure 7 shows that the contribution of retail sales of motor vehicles to total income has declined over time.
In 2015, income from retail sales of motor vehicles accounted for 47% of total income, down from 58% in
2006. This is a decline of 11 percentage points.
0.0
10.0
20.0
30.0
40.0
50.0
60.0
70.0
Land, buildings andconstruction
Plant, machineryand equipment
Motor vehicles Computer Other
%
2006 2009 2012 2015

STATISTICS SOUTH AFRICA 12
Figure 7 – Income contribution of retail sales of motor vehicles, 2006–2015
Source: Motor trade industry, Report No. 63-01-02
Data in Figure 8 show a breakdown of sales by type of motor vehicle. Although the sale of cars accounts for
the largest contribution in total income, its contribution has declined over time. In 2006, income from car
sales accounted for 81% of total income, but declined to 70% in 2015. In contrast, income contributions from
the sales of vans and trucks and lorries have increased. The income contribution from sales of vans
increased from 6,5% in 2006 to 13,5% in 2015. During the same period, income from sales of trucks and
lorries increased from 3,8% to 9,7%.
Figure 8 – Income from sales by type of motor vehicle, 2006–2015
Source: Motor trade industry, Report No. 63-01-02
Data in Figure 9 also show a shift in sales patterns. Sales of used motor vehicles have increased faster than
those of new motor vehicles. On average between 2007 and 2016, sales of used vehicles increased by 5,8%
per year compared with 3,5% recorded for new motor vehicle sales. Over the same time, sales of motor
vehicle parts and accessories increased faster than sales of both new and used motor vehicles. The faster
growth in sales of parts and accessories could be linked to the relative increase in sales of used motor
57.6
50.9 46.9 46.6
0.0
10.0
20.0
30.0
40.0
50.0
60.0
70.0
2006 2009 2012 2015
Co
ntr
ibu
tio
n,%
0.0
10.0
20.0
30.0
40.0
50.0
60.0
70.0
80.0
90.0
Cars Minibuses Vans Trucks and lorries Other
Co
ntr
ibu
tio
n, %
2006 2009 2012 2015

STATISTICS SOUTH AFRICA 13
vehicles. Thus, instead of buying new vehicles, consumers could have opted to purchase used motor
vehicles, resulting in the increase in sales of parts and accessories.
Figure 9 – Sales of motor vehicles; parts and accessories, 2006–2016
Source: Motor trade sales, P6343.2
4.1 Economic performance
Following the recession of 2009, the South African economy has not performed well when compared with the
period before the recession. Data in Figure 10 show that although real GDP growth was positive, it has
slowed down since 2011. For instance, in 2015 and 2016, annual real GDP growth was 1,3% and 0,3%
respectively. However, in the period before the recession, growth in real GDP was relatively high, with a
peak of 5,6% in 2006.
0.0
50.0
100.0
150.0
200.0
250.0
300.0
2006 2007 2008 2009 2010 2011 2012 2013 2014 2015 2016
Ind
ex
Parts and accessories sales New vehicle sales Used vehicle sales

STATISTICS SOUTH AFRICA 14
Figure 10 – Real GDP growth for South Africa, 2004–2016
Source: Gross Domestic Product, P0441
Household consumption expenditure on personal transport equipment, of which the largest proportion (about
86%) is expenditure on motor vehicles, recorded negative growth in 2014, 2015 and 2016 (Figure 11),
signifying a decline in demand for motor vehicles. Moreover, consumers could have opted for used motor
vehicles instead of new vehicles in an attempt to minimise the effect of the poor macro-economic
environment. As a consequence of this shift, the income contribution of retail sales of motor vehicles was
adversely affected.
Figure 11 – Household consumption expenditure, 2004–2016
Source: Gross Domestic Product, P0441
4.2 Prices
The price of a motor vehicle is one of the main factors considered by consumers when making a decision to
purchase. Figure 12 shows that the price of new motor vehicles has not increased as fast as the headline
inflation (CPI). Although the price increase for new motor vehicles has not surpassed that of the overall CPI,
the general price trend is upward.
4.6
5.3 5.6 5.4
3.2
-1.5
3.0 3.3
2.2 2.5
1.7 1.3
0.3
-2.0
-1.0
0.0
1.0
2.0
3.0
4.0
5.0
6.0
2004 2005 2006 2007 2008 2009 2010 2011 2012 2013 2014 2015 2016
Gro
wth
rat
es, %
GDP at market prices
13.2
23.9
13.2 11.1
-15.6 -20.4
20.5 17.9
14.7
8.6
-6.5 -7.7
-15.5
-30.0
-20.0
-10.0
0.0
10.0
20.0
30.0
2004 2005 2006 2007 2008 2009 2010 2011 2012 2013 2014 2015 2016
Gro
wth
rat
es, %
Household Consumption Expenditure_Personal transport equipment

STATISTICS SOUTH AFRICA 15
Figure 12 – Headline inflation and new vehicle price, 2005–2016
Source: Consumer Price Index, P0141
As shown in Figure 13, the price of petrol has increased over time. In fact, for the entire study period, the
petrol price increased faster than the headline inflation (CPI). This increase in the petrol price, together with
escalating prices of new motor vehicles, could cause a shift in demand patterns of motor vehicles, which in
turn adversely affect income from retail sales of motor vehicles.
Figure 13 – Headline inflation and price of petrol, 2005–2016
Source: Consumer Price Index, P0141
4.3 Production volumes and exchange rates
From the supply side, data in Figure 14 show that domestic production of motor vehicles has shown signs of
recovery following the recession of 2009, with the volume of production gradually returning to pre-recession
levels. However, the number of motor vehicles imported has declined from 2013, affecting domestic supply.
At the same time, motor vehicle exports have increased faster than both total domestic production and
imports.
0.0
50.0
100.0
150.0
200.0
250.0
2005 2006 2007 2008 2009 2010 2011 2012 2013 2014 2015 2016
Ind
ex
New vehicle price Headline inflation (CPI)
0.0
50.0
100.0
150.0
200.0
250.0
300.0
350.0
2005 2006 2007 2008 2009 2010 2011 2012 2013 2014 2015 2016
Ind
ex
Petrol price Headline inflation (CPI)

STATISTICS SOUTH AFRICA 16
Figure 14 – Motor vehicle volume of production and foreign trade, 2005–2016
Source: NAAMSA, www.naamsa.co.za
The slowdown in imports of motor vehicles, which affected the stock available for local demand, could be
linked to exchange rate fluctuations shown in Figure 15. Thus, a weaker rand relative to the US dollar
observed from 2013 stimulated exports of motor cars but made imports expensive. Consequently, the stock
available for local demand declined.
Figure 15 – Rand/US dollar exchange rate, 2005–2016
Source: South African Reserve Bank, Online statistical query
0.0
50.0
100.0
150.0
200.0
250.0
300.0
2005 2006 2007 2008 2009 2010 2011 2012 2013 2014 2015 2016
Ind
ex
Total Domestic Production Total imports Total exports
0
2
4
6
8
10
12
14
16
18
20
05
-01
-03
20
05
-11
-23
20
06
-10
-20
20
07
-09
-12
20
08
-08
-07
20
09
-07
-03
20
10
-05
-27
20
11
-04
-15
20
12
-03
-12
20
13
-02
-05
20
13
-12
-31
20
14
-11
-24
20
15
-10
-20
20
16
-09
-14
Ran
d

STATISTICS SOUTH AFRICA 17
5. RETAIL SALES OF AUTOMOTIVE FUEL
This section examines in detail the changes observed in retail sales of automotive fuel and other trends
related to retail sales of automotive fuel.
Data in Figure 16 show that the income contribution of retail sales of automotive fuel increased from 18% in
2006 to 29% in 2015. Retail sales of automotive fuel include petrol; diesel; gas; oil, lubricant, greases and
additives; convenience store; automotive paints, paint removers, paint strippers and related chemical
products; and tyre/tube puncture repair-kits, sealants and related material.
Figure 16 – Income contribution for retail sales of automotive fuel, 2006–2015
Source: Motor trade industry, Report No. 63-01-02
According to SIS data, the largest contributor to retail sales of automotive fuel is petrol, followed by diesel.
Income from diesel and petrol sales has increased over time. Thus, in 2006, the income contribution from
petrol was 13,8%, which increased to 17,8% in 2015. At the same time, the income contribution of diesel
almost tripled, increasing from 3,7% in 2006 to 9,7% in 2015.
18.2
25.9
29.7 29.5
0.0
5.0
10.0
15.0
20.0
25.0
30.0
35.0
2006 2009 2012 2015
Co
ntr
ibu
tio
n,%

STATISTICS SOUTH AFRICA 18
Figure 17 – Income from retail sales of petrol and diesel, 2006–2015
Source: Motor trade industry, Report No. 63-01-02
At the same time, SIS data show that the proportion of income from sales of trucks and lorries, which
typically use diesel, almost doubled between 2006 and 2015 (Figure 18). Thus, income from sales of trucks
and lorries was R6 billion (2,5% contribution) in 2006, which increased to R24 billion (4,5% contribution) in
2015.
Figure 18 – Income from total sales of trucks and lorries, 2006–2015
Source: Motor trade industry, Report No. 63-01-02
13.8
18.5 19.4
17.8
3.7
6.7
8.7 9.7
0.0
5.0
10.0
15.0
20.0
25.0
2006 2009 2012 2015
Co
ntr
ibu
tio
n, %
Petrol Diesel
2.5
4.1 3.7
4.5
0.0
1.0
2.0
3.0
4.0
5.0
2006 2009 2012 2015
Co
ntr
ibu
tio
n, %

STATISTICS SOUTH AFRICA 19
5.1 Price and consumption of fuel
The data in Figure 19 show that the prices of petrol and diesel3 have increased faster than the headline CPI.
Thus, for the entire study period, the rates at which petrol and diesel prices increased surpassed that of the
overall CPI suggesting that the increase in income contribution in diesel and petrol was inflation-linked.
Figure 19 – Headline CPI, petrol and diesel price index, 2005–2016
Source: IRESS and Consumer Price Index, P0141
However, data on volumes of fuel consumed shows that there has been an increase in consumption of both
petrol and diesel. In particular, the volumes of diesel consumed have increased faster than that of petrol. The
substantial increase in the volume of diesel consumed is linked with an increase in diesel sales.
Figure 20 – Volume of petrol and diesel consumed (litres), 2005–2016
Source: Department of Energy – Energy statistics, www.energy.gov.za
3 Diesel prices are wholesale prices rather than pump (retail) prices.
0.0
50.0
100.0
150.0
200.0
250.0
300.0
350.0
2005 2006 2007 2008 2009 2010 2011 2012 2013 2014 2015 2016
Ind
ex
Petrol price Headline inflation (CPI) Diesel (wholesale price)
60.0
80.0
100.0
120.0
140.0
160.0
2005 2006 2007 2008 2009 2010 2011 2012 2013 2014 2015 2016
Ind
ex
Petrol (All grades) Diesel (All Grades)

STATISTICS SOUTH AFRICA 20
5.2 Convenience stores
One of the emerging trends in the motor trade industry has been the diversification of the auto fuel retail
sector. This has seen petrol stations become access points for a whole range of other products such as food
and beverages, tobacco, firewood and charcoal, sweets and bakery products, airtime, and prepaid electricity,
among others. These are recorded as income from convenience store sales. Although income from
convenience stores accounts for a relatively small proportion of total income, the rate at which sales from
convenience stores have increased over time cannot be ignored. Moreover, in recent times, there has been
a prominence of convenience stores in almost every filling station, thus allowing many marginal outlets to
survive while generating new income streams for established filling stations.
Figure 21 – Income from convenience store sales, 2006–2016
Source: Motor trade sales, P6343.2 and Consumer Price Index, P0141
Data in Figure 21 show that income from convenience store sales has increased over time.
6. EMPLOYMENT IN THE MOTOR TRADE INDUSTRY
This section discusses employment dynamics in the motor trade industry using the recently published SIS
data for 2015. In particular, the diversity in employment is highlighted by type of motor trade, gender, type of
employment and enterprise size. In addition, average earnings per employee are also discussed.
6.1 Employment by type of motor trade
In 2015, the motor trade industry employed 270 440 people, the majority of whom were employed in retail
sales of automotive fuel (32,4%) and in retail sales of motor vehicles (29,9%). Employment in maintenance
and repair of motor vehicles and sales of new motor vehicle parts and accessories was also substantial. The
motor trade types that employed the least number of people were sales, maintenance and repair of motor
cycles and related accessories and sales of used motor vehicle parts and accessories, each accounting for
0,8% of total employment.
60.0
70.0
80.0
90.0
100.0
110.0
120.0
130.0
140.0
150.0
2006 2007 2008 2009 2010 2011 2012 2013 2014 2015 2016
Ind
ex
Convenience store sales

STATISTICS SOUTH AFRICA 21
Figure 22 – Employment by type of motor trade (percentage of total), 2015
Source: Motor trade industry, Report No. 63-01-02
6.2 Employment by gender
The data show that the motor trade industry was male dominated. Figure 23 shows that 72% of the
employees in the motor trade industry in 2015 were males. The dominance of male employees was also
observed across different motor trade types.
Figure 23 – Employment by gender (percentage of total), 2015
Source: Motor trade industry, Report No. 63-01-02
2.3
29.9
17.9 15.9
0.8 0.8
32.4
Wholesale sales of motor vehicles
Retail sales of motor vehicles
Maintenance and repair of motorvehicles
Sales of new motor vehicle partsand accessories
Sales of used motor vehicle partsand accessories
Sales, maintenance and repair ofmotor cycles and relatedaccessories
Retail sales of automotive fuel
Female, 28
Male, 72

STATISTICS SOUTH AFRICA 22
6.3 Employment by enterprise size
Large enterprises accounted for a large proportion of total motor trade employment. Thus, in 2015, large
enterprises accounted for 40%, followed by small enterprises which accounted for 25%. However, the
dynamics were varied when employment was analysed by type of motor trade type. For instance, in retail
sales of motor vehicles, large enterprises accounted for 84%. In maintenance and repair of motor vehicles,
the largest proportion of employment (almost 57%) was accounted for by micro enterprises, while large
enterprises employed only 3%.
Table 3 – Employment by enterprise size (percentage contribution), 2015
Type of service Large enterprises
Medium enterprises
Small enterprises
Micro enterprises
Wholesale sales of motor vehicles 51,1 7,8 22,8 18,4
Retail sales of motor vehicles 84,0 5,9 6,0 4,1
Maintenance and repair of motor vehicles 3,1 5,5 34,8 56,6
Sales of new motor vehicle parts and accessories 36,6 9,0 32,4 22,0
Sales of used motor vehicle parts and accessories 7,4 12,3 53,5 26,8
Sales, maintenance and repair of motor cycles and related accessories 5,3 19,7 42,2 32,9
Retail sales of automotive fuel 22,7 36,6 32,1 8,6
All 40,1 16,5 24,9 18,6
Source: Motor trade industry, Report No. 63-01-02
6.4 Employment by type of contract
The motor trade industry provides a variety of employment opportunities in terms of forms of employment –
permanent, temporary and/or casual employment. The vast majority of motor trade employees were
permanently employed. That is, at an aggregate level, 94% of employment in the motor trade industry was
permanent in 2015. The number of people working as casual and temporary employees was relatively small,
suggesting that the motor trade industry offered a stable employment environment.

STATISTICS SOUTH AFRICA 23
Figure 24 – Employment by type of contract (percentage of total), 2015
Source: Motor trade industry, Report No. 63-01-02
6.5 Income share, employment share and average earnings
At an aggregate level, average earnings per person per month stood at R12 242 in 2015. However, average
earnings per person varied across motor trade types. Average earnings per person per month were highest
in wholesale sales of motor vehicles (R22 550), followed by retail sales of motor vehicles at R18 634 per
person per month. The lowest average earners were in retail sales of automotive fuel with average earnings
of R6 675 per person per month.
Table 4 – Income share, employment share and average earnings by motor trade type, 2015
Type of motor trade Income share, %
Employment share, %
Average salaries and wages
Wholesale sales of motor vehicles 8,6 2,3 22 550
Retail sales of motor vehicles 46,6 29,9 18 634
Maintenance and repair of motor vehicles 4,5 17,9 10 091
Sales of new motor vehicle parts and accessories 9,7 15,9 12 396
Sales of used motor vehicle parts and accessories 0,4 0,8 12 490
Sales, maintenance and repair of motor cycles and related accessories 0,7 0,8 14 368
Retail sales of automotive fuel 29,5 32,4 6 675
Total 100,0 100,0 12 242
Source: Motor trade industry, Report No. 63-01-02
Despite paying the highest average salaries and wages, wholesale sales of motor vehicles accounted for
lower proportions in terms of income and employment. Thus, wholesale sales of motor vehicles accounted
for 8,6% and 2,3% of total income and employment respectively, which was lower than what was observed
in retail sales of motor vehicles and retail sales of automotive fuel. In contrast, average salaries and wages in
retail sales of motor vehicles was the second highest, yet they account for large proportions in both income
3.4
93.9
2.2 0.6
Working proprietors
Permanent employees
Temporary employees
Casual employees

STATISTICS SOUTH AFRICA 24
and employment. Retail sales of automotive fuel paid the lowest average salaries and wages but accounted
for large proportions in terms of income and employment.
7. CONCLUSION
The discussion document identifies and analyses structural changes in the motor trade industry using SIS
data. The results show that in the past decade, the motor trade industry has changed. Thus, changes were
observed with regard to market structure, income contributions, profit margins and expenditure structure.
The analysis of employment shows that the motor trade industry was an employer of note. The industry was
male dominated and the majority of people were employed in retail sales of automotive fuel and retail sales
of motor vehicles.
Stats SA values your feedback on this discussion document. If you have any comments and/or suggestions,
please contact Robert Mabunda at [email protected]
STATISTICS SOUTH AFRICA 25
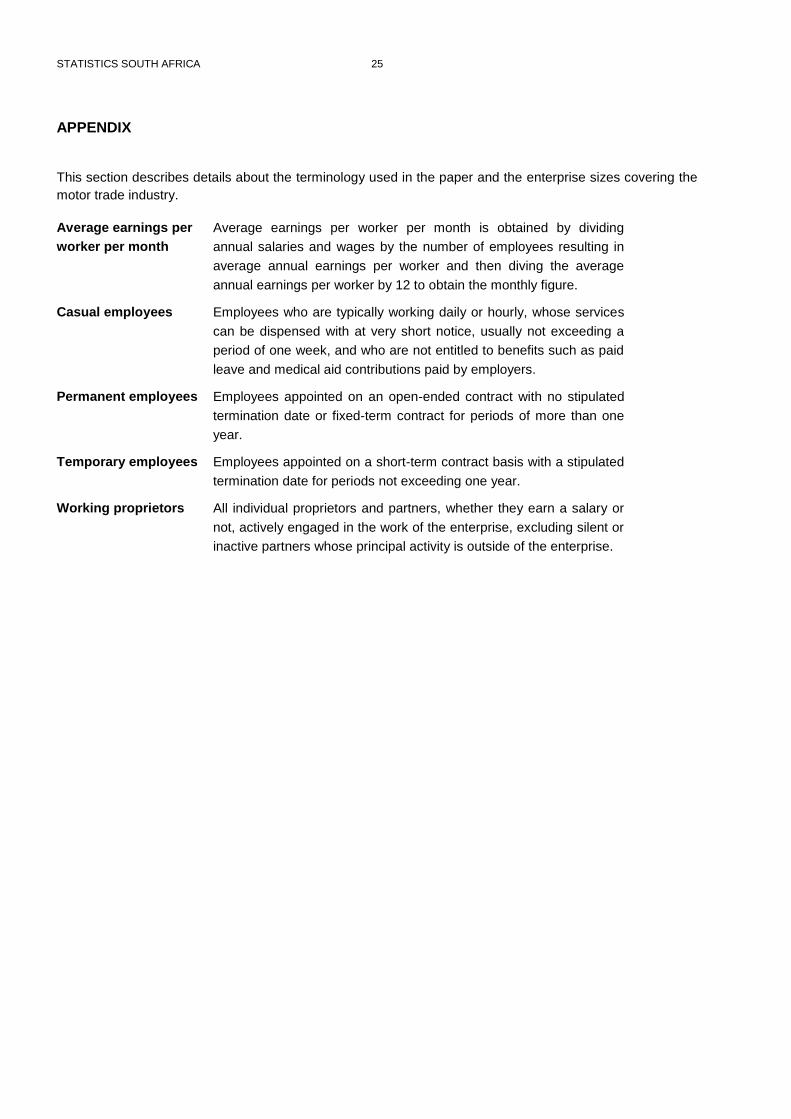
APPENDIX
This section describes details about the terminology used in the paper and the enterprise sizes covering the
motor trade industry.
Average earnings per
worker per month
Average earnings per worker per month is obtained by dividing
annual salaries and wages by the number of employees resulting in
average annual earnings per worker and then diving the average
annual earnings per worker by 12 to obtain the monthly figure.
Casual employees Employees who are typically working daily or hourly, whose services
can be dispensed with at very short notice, usually not exceeding a
period of one week, and who are not entitled to benefits such as paid
leave and medical aid contributions paid by employers.
Permanent employees Employees appointed on an open-ended contract with no stipulated
termination date or fixed-term contract for periods of more than one
year.
Temporary employees Employees appointed on a short-term contract basis with a stipulated
termination date for periods not exceeding one year.
Working proprietors All individual proprietors and partners, whether they earn a salary or
not, actively engaged in the work of the enterprise, excluding silent or
inactive partners whose principal activity is outside of the enterprise.

STATISTICS SOUTH AFRICA 26
SIZE GROUPS
The enterprises are divided into four size groups according to the value of turnover defined using the
Department of Trade and Industry (DTI) cut-off points.
Size groups (2006) Turnover
Large Turnover > R 39 000 000
Medium R 19 000 000 < Turnover ≤ R 39 000 000
Small R4 000 000 < Turnover ≤ R 19 000 000
Micro Turnover ≤ R 4 000 000
Size groups (2009) Turnover
Large Turnover > R 39 000 000
Medium R 19 000 000 < Turnover ≤ R 39 000 000
Small R4 000 000 < Turnover ≤ R 19 000 000
Micro Turnover ≤ R 4 000 000
Size groups (2012) Turnover
Large Turnover > R78 000 000
Medium R38 000 000 < Turnover ≤ R78 000 00
Small R8 000 000 < Turnover ≤ R38 000 000
Micro Turnover ≤ R8 000 000
Size groups (2015) Turnover
Large Turnover ≥ R117 000 000
Medium R57 000 000 ≤ Turnover < R117 000 000
Small R12 000 000 ≤ Turnover < R57 000 000
Micro Turnover < R12 000 000