diploma thesis haller final version without...
TRANSCRIPT

DIPLOMARBEIT
HPLC Analysis of plasmid isoforms with chemoaffinity based media:
Method validation and
Application to in-process control (IPC) samples
angestrebter akademischer Grad
Magistra der Naturwissenschaften (Mag. rer.nat.)
Verfasserin / Verfasser: Elisabeth Haller
Matrikel-Nummer: 0504862
Studienrichtung (lt. Studienblatt): Chemie
Betreuerin / Betreuer: Ao. Univ.-Prof. Mag. Dr. Michael Lämmerhofer
Wien, am 21.01.2011

Table of contents Abstract (English) ....................................................................................................... 1
Abstract (German) ...................................................................................................... 2
Objective and aims of this work .................................................................................. 3
1 Introduction......................................................................................................... 5
1.1 Historic background .............................................................................. 5
1.2 Basic knowledge about plasmid DNA (Schleef, 2001) .......................... 5
1.3 Topological structures of plasmids ........................................................ 6
2 Plasmid manufacturing ..................................................................................... 14
2.1 Biotechnological production of pDNA.................................................. 14
2.2 Purification .......................................................................................... 16
3 Analysis of plasmid structures (AGE, HPLC, CGE) .......................................... 18
3.1 Capillary gel electrophoresis (CGE) .................................................... 18
3.2 Agarose gel electrophoreses (AGE).................................................... 19
3.3 High performance liquid chromatography (HPLC)............................... 21
4 Method development and Validation ................................................................ 24
5 Method validation for pMCP1 with propylcarbamoyl quinine modified silica..... 28
5.1 Manufacturing of oc standards ............................................................ 28
5.2 Preparation and verification of the oc standard................................... 28
6 Method validation for pMCP1 with Propylcarbamoyl quinine modified silica .... 32
6.1 Equipment and Instruments ................................................................ 32
6.2 Method Information ............................................................................. 32
6.3 Results and evaluation........................................................................ 33
7 Method validation for pMCP1 with TSK-Gel® DNA-NPR ................................. 44
7.1 Equipment and Instruments ................................................................ 44
7.2 Method Information ............................................................................. 44
7.3 Results and evaluation........................................................................ 44
8 Comparison of method performance of propylcarbamoyl quinine modified
silica and TSK-Gel® DNA-NPR material .......................................................... 53
8.1 Results: Summary and Comparison.................................................... 53
8.2 Conclusion .......................................................................................... 55
9 Method validation for pGNA3 with propylcarbamoyl quinine modified silica ..... 56
9.1 Preparation and verification of the oc standard................................... 56
9.2 Equipment and Instruments ................................................................ 60

9.3 Method Information ............................................................................. 60
9.4 Results and evaluation........................................................................ 60
10 Method validation for pGNA3 with TSK-Gel® DNA-NPR.................................. 71
10.1 Preparation of the oc standard............................................................ 71
10.2 Equipment and Instruments ................................................................ 72
10.3 Method Information ............................................................................. 72
10.4 Results and evaluation........................................................................ 72
10.5 Linearity range .................................................................................... 72
11 Method validation for pMCP1 with propylcarbamoyl quinine modified non
porous MICRA.................................................................................................. 78
11.1 Method development........................................................................... 79
11.2 Validation protocol............................................................................... 91
11.3 Equipment and Instruments ................................................................ 93
11.4 Method Information ............................................................................. 93
11.5 Results and evaluation........................................................................ 93
11.6 Conclusions......................................................................................... 97
12 Development of 2D HPLC method for analysis of topoisomer distribution in
fermentation samples and application to In-Process-Control (IPC) samples.... 99
12.1 2D-HPLC system: ............................................................................... 99
12.2 Analysis of IPC samples ................................................................... 104
12.3 Results .............................................................................................. 107
13 Summary ........................................................................................................ 114
14 Acknowledgments .......................................................................................... 117
15 Table of Figures.............................................................................................. 118
16 References ..................................................................................................... 122

Abstract (English)
1
Abstract (English)
This diploma thesis is dealing with the analysis of plasmid DNA isoforms
(covalently closed circular, ccc; open circular, oc; linear, lin) and topoisomers. For
this purpose suitable oc standard of two different plasmids (4.9 kbp and 15 kbp) had
to be prepared initially. For preparation, optimized protocols (heat treatment for the
4.9 kbp plasmid or enzyme treatment for the 15 kbp plasmid) were developed for
transforming supercoiled form into the open circular one. Subsequently, comparison
of method validation for both plasmid samples of a novel support material, namely
propylcarbamoyl quinine modified silica (5 µm, 100 Å, 150 x 4 mm ID), with the state-
of-the-art method employing the DNA-NPR column (2.5 µm, 750 x 4.6 mm ID). The
novel stationary phase offers several benefits compared to the commercial available
DNA-NPR material, like better recovery for the oc form, separation of oc and ccc
form, better peak performances and precisions. Moreover, the method validation for
the 15 kbp plasmid was only successful using the new developed material but not
with the DNA-NPR stationary phase. Further improvement of the PCQ modified
material could be achieved when using 1.5 µm NPS silica particles as support. The
NPS chromatographic material enabled successful validation except for the oc
standard
Supplementary, two different in-process control samples were analyzed using an
online 2D HPLC system to study the influence of fermentation duration on relative
topoisomer abundances. In the first dimension a SRT-SEC column (5 µm, 1000 Å,
150 x 4 mm ID) was employed for purification of the sample from impurities.
Subsequently, the analyte of the transferred sample fraction was injected online into
the O-9-allylcarbamoyl-10,11-dihydroquinine modified stationary phase which
provides selectivity for topoisomers. The change of linking number in the first few
hours during fermentation process could be demonstrated.
Overall, new methods for pDNA analysis have been developed in the course of
this diploma work which are supposed to be of great value in future plasmid research
and quality control.

Abstract (German)
2
Abstract (German)
Diese Diplomarbeit beschäftigt sich mit der Analyse von Plasmid DNA Isoformen
(superspiralisiert, ccc; offen zirkular, oc; linear, lin) und Topoisomeren. Dazu mussten
zunächst oc Standards zweier Plasmide (4.9 kbp und 15 kbp) hergestellt werden. Die
Transformation der superspiralisierten (ccc) Isoform in die Offen-zirkulare (oc) kann
durch Temperaturbehandlung (4.9 kbp pDNA) oder durch Behandlung mit einem
Enzym (15 kbp pDNA) erzielt werden, wobei jeweils ein optimiertes Protokoll
entwickelt wurde. Anschließend wurden Methodenvalidierungen beider Plasmide mit
zwei unterschiedlichen Säulenmaterialien durchgeführt. Die Validierungsergebnisse
der Propylcarbamoyl Chinin Säule (5 µm, 100 Å, 150 x 4 mm ID), welche innerhalb
der Arbeitsgruppe entwickelt und hergestellt wurde, wurde mit den Ergebnissen der
laut aktuellen Stand der Wissenschaft für die Plasmidanalyse verwendeten DNA-
NPR Chromatographiesäule (2.5 µm, 750 x 4.6 mm ID) verglichen. Die neu
entwickelte stationäre Phase besitzt einige Vorteile im Vergleich zum kommerziell
erhältlichen Material wie z.B. eine bessere Wiederfindung der oc Isoform,
Auftrennung des oc und ccc Plasmids, bessere Peakperformance und Präzision.
Darüber hinaus konnte eine erfolgreiche Methodenvalidierung des 15 kbp Plasmids
mit dem neu entwickelten Material nicht aber mit der DNA-NPR Säule durchgeführt
werden. Durch die Verringerung der Partikelgröße von 5 µm auf 1.5 µm (NPS Silika)
konnte eine weitere Optimierung des PCQ modifizierten Materials erreicht werden.
Mit den modifizierten NPS Micra Partikel konnte eine erfolgreiche Validierung der
superspiralisierten und der linearen Isoform (4.9 kbp) durchgeführt werden.
Der Einfluss der Fermentationsdauer zweier verschiedener Realproben auf die
relative Topoisomerenverteilung wurde mittels eines zweidimensionalen HPLC
Systems untersucht. In der ersten Dimension befand sich eine Größenausschluss-
Chromatographiesäule (5 µm, 1000 Å, 150 x 7.8 mm ID), welche zur Abtrennung der
Verunreinigungen von der Probe diente. Anschließend wurde der Analyt (pDNA) in
die O-9-Allylcarbamoyl-10,11-Dihydrochinin modifizierte stationäre Phase
transferiert. Diese Säule ermöglichte eine Auftrennung der Topoisomere. Es konnte
gezeigt werden, dass die größte Änderung der Linking Nr. beider Proben innerhalb
der ersten Stunden des Fermentationsprozess erfolgt.
Summa summarum konnten neue Methoden für die pDNA Analyse entwickelt
werden, welche auch für die weitere Forschung und Qualitätskontrolle auf diesem
Gebiet von großer Bedeutung sein werden.
Objective and aims of this work
3
Objective and aims of this work This diploma thesis deals with the separation and analysis of plasmids, which
exist mainly in three basic isoforms: linear, open-circular and covalently-closed
circular. Besides multimeric forms may exist. For there plasmid isoforms, methods for
their chromatographic separation as well as analytical quantitation have been
developed in this diploma work.
Structure and course of action of this thesis The thesis can be structured in two main topics.
The first part of this paper focuses on the method development and the validation
of the isoform separation of two different plasmids (pMCP1 4.9 kb and pGNA3 15 kb)
employing two different chromatographic selectors and stationary phases,
respectively. In both cases, a standard of the open circular isoform had to be
prepared, whereby either thermal or enzymatic treatment of the supercoiled sample
has delivered the desired open circular (oc) form. However, optimized standard
protocols for both plasmids (4.9 kb and 15 kb) preparing their oc isoforms had to be
developed. Furthermore two different weak anion exchangers have been compared
as separation media: the commercially available Tosoh DNA-NPR column and the in-
house produced and packed propylcarbamoyl quinine material. After method
development and optimization, the standard validation parameters according to the
ICH guidelines (precision, recovery, detection and quantitation limits) have been
determined and calculated in order to characterize the analytical method and to
enable an accurate comparison of both anion exchangers. The main problem making
accurate and reliable analysis challenging is the selectivity between oc and the linear
form. The key for their adequate resolution is expected to be the reduction of the
particle size. Therefore, improvement in the separation performance of the quinine-
modified silica seemed to be possible by decreasing the particle size of the support
material (from 5 µm to 1.5 µm). Subsequently a validation of the smaller plasmid
(pMCP1) was carried out with such smaller-sized particles in order to investigate the
influence of the 1.5 µm non-porous (MICRA) material and for method
characterization. Moreover, the buffers and the gradient method needed to be re-
optimized to achieve an analysis time below 15 minutes including the washing and
re-equilibration steps.

Objective and aims of this work
4
The second topic of this thesis deals with the distribution of the topoisomers of the
ccc form. It had to be investigated how the fermentation duration influences the
supercoiling of two different plasmids. Performed analysis used a two dimensional
chromatographic setup to combine two different separation modes: size exclusion in
the first dimension and anion exchange chromatography in the second dimension.
Additionally, the concentration as well as the topoisomer distribution should be
determinable within one single run in an automated manner without excessive
sample preparation or handling steps between two subsequent chromatographic
steps. The results are expected to explain whether the day time has an influence on
topoisomer distribution and how long the fermentation should take place to obtain a
maximum of supercoiling with the highest concentration.

Introduction
5
1 Introduction
1.1 Historic background
In 1952, J. Lederberg discovered that bacteria contain ring-shaped, extra
chromosomal DNA which he termed “plasmids”. In the early 1990s, the usage of
DNA vaccine against pathogens and tumor antigens in vivo were discovered. About
15 years ago, the first DNA vaccine studies in humans were carried out with an HIV
candidate in the earliest phase of the clinical trial. Afterwards tests against cancer,
influenza, malaria and hepatitis B were carried out (M. Kutzler, 2008). At present,
about 18 percent of all vectors used in gene therapy trials are plasmidic DNA (The
Journal of Gene Medicine, 2010). These facts confirm that treatment of diseases
(e.g. cancer, acquired immunodeficiency syndrome AIDS, human immunodeficiency
virus HIV, Malaria) based on gene therapy and vaccination with nucleic acids is a
promising option to cure such genetic defects. Consequently, it is necessary to
investigate the stability and to characterize those nucleic acid-based drug substances
(Middaugh, 1998).
1.2 Basic knowledge about plasmid DNA (Schleef, 2001)
Plasmids are extrachromosomal, double-stranded deoxyribonucleic acid (DNA)
molecules, which naturally exist in both, eukaryotic and prokaryotic cells (Schleef,
2001). Their size can vary from less than 1 to over 200 thousand base pairs (kilobase
pairs, kbp). To afford a stable coexistence with their host cell, they are able to strictly
control their replication. This process is autonomously and independent from their
host chromosome, that is why they are also called replicons.
Plasmids can provide several advantages, for instance fixing nitrogen, encoding
for antibiotics or degrading pollutants in bacteria. However they are not essential for
bacterial growth. They are often compatible, which means that different plasmid
types can coexist in the same bacteria cell. One of the most important feature of
plasmids is their origin of replication (the so-called “oriV site”), where replication
starts and which is responsible for the regulation of the copy number. There are two
possibilities how plasmid host-to-host transfer can be realized: either by
transformation or conjugation. Transformation means that the plasmids released from
lysed cells are absorbed by surrounding cells through their cell wall, whereas
Introduction
6
conjugation involves a transfer by direct cell-to-cell contact. To transform a species
matching oriV sites (because of enzyme specificity) and a high enough copy number
are necessary.
Application in molecular biology and genetic engineering The most important function of plasmids is that they can be used as vectors and
therefore transfer DNA into an organism. Also viruses, cosmids or phages can be
used for such applications, but their utilization becomes less important. Plasmid
vectors for therapy or vaccination, the size of which can be from less than 1 kb to
more than 20 kb, contain two units: the bacterial backbone (origin of replication,
selection markers) and the transcription unit (encoding the antigen under appropriate
promoter control) (Schleef, 2001).
1.3 Topological structures of plasmids
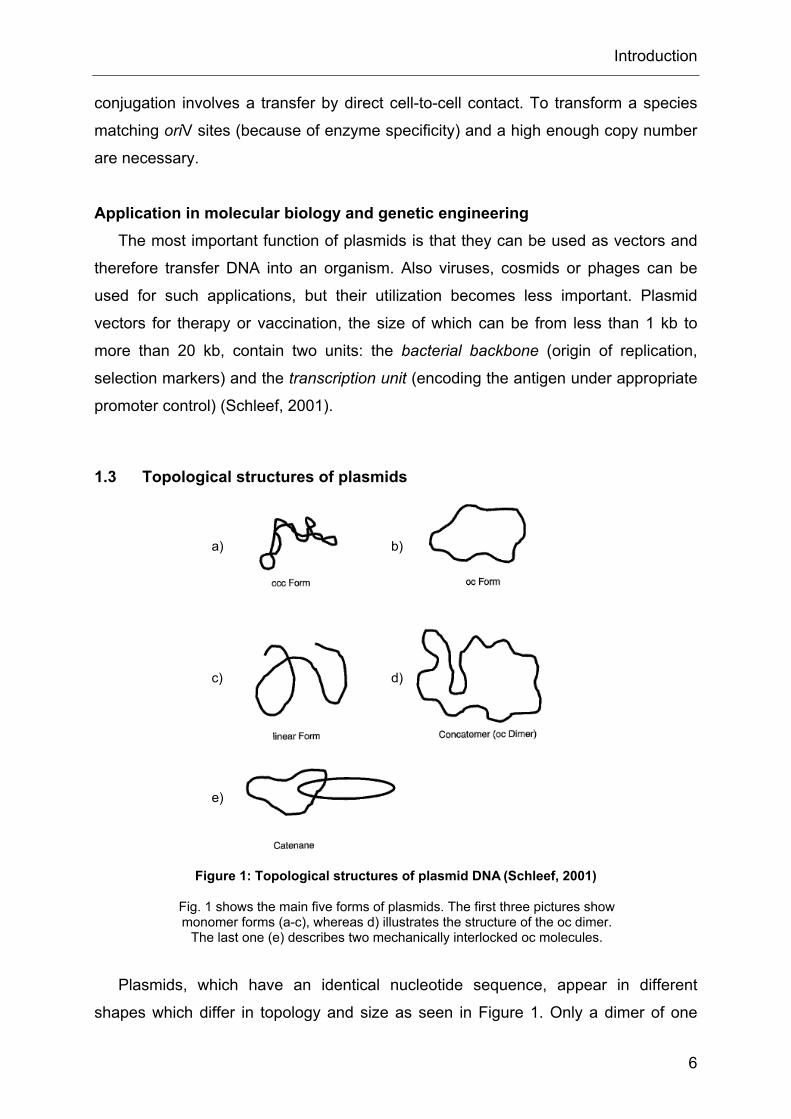
Figure 1: Topological structures of plasmid DNA (Schleef, 2001)
Plasmids, which have an identical nucleotide sequence, appear in different
shapes which differ in topology and size as seen in Figure 1. Only a dimer of one
Fig. 1 shows the main five forms of plasmids. The first three pictures show monomer forms (a-c), whereas d) illustrates the structure of the oc dimer.
The last one (e) describes two mechanically interlocked oc molecules.
a) b)
c) d)
e)

Introduction
7
isoform (d) is presented in this figure, but also the ccc and linear dimers have to be
considered as well. In a bacterial cell, the most common form is the so-called ccc
(covalently closed circular) form, which is usually negatively supercoiled. This form
has a compact structure in which the DNA double-strand helix is wound around itself.
One DNA strand can be nicked (breakage of one phosphodiester bond) as a result of
mechanical stress, nucleases or UV irradiation. Consequently, the molecule relaxes
and is less compact. This form is labelled as open circular (oc) or nicked plasmid. In
the absence of agents altering the superhelicity, totally relaxed ccc form (without any
supercoiling) can not be distinguished from the oc form. If both DNA strands are
broken at the same position, linear DNA molecules are formed. All three isoforms can
exist as equivalent oligomeric forms (concatemers) as well as dimeric plasmid
molecules (Kutzler, 2008; Schleef, 2001).
For therapeutic applications, the most important isoform is the supercoiled
plasmid molecule (ccc form), because it is believed to be most active and stable
topological isoform.
Supercoiling of plasmids In principle, ccc DNA is negatively supercoiled, which is the opposite rotation to
the right-handed double helix structure. Therefore this type of DNA is underwound,
which means that there are less helical turns than in relaxed or linear DNA and a
torsional tension is created in the molecule (Schleef, 2001).
Figure 2: Illustration of positive and negative supercoiling (Travers, 2005)
The upper strand needs to be aligned with the lower DNA strand by rotation < 180°, resulting in a positively supercoiling (+1) for counter-clockwise rotation
(a) and negatively supercoiling (-1) in the case of clockwise rotation (b)
b)
a)
Relaxed state

Introduction
8
Linking number Lk (Bates, 2005) By the formation of 5’-3’ phosphodiester bonds, linear double-stranded DNA can
be closed and the linking number corresponds to the number of double-helical turns.
For example, if the dsDNA is cut and rejoined after making a full 360° twist in one
end, the linking number is one. Thus the Lk value is determined using the number
and handedness of the crossovers of the two curves when projected onto a plane.
Figure 3: Visual Evaluation of the linking number (Bates, 2005)
Each crossing of one strand over the other a value of +1 or -1 can be assigned
and the sum of the values is halved to give the linking number of the two DNA
strands. Consequently, the Lk value has to be an integer.
510.N
hNLkm ==
Equation 1: Definition of the Linking number (Bates, 2005)
Different conditions, such as ionic strength, temperature and pH, influence the
linking number hence the h0 value is often used. Under standard conditions (0.2 M
NaCl, pH 7.0, 37°C) it corresponds to 10.5 bp/turn (Bates, 2005). In general
acceptance, the standard linking number of plasmids is positive based on their
negative supercoiling.
In addition, the actual supercoiling of ccc plasmids has to be related to their
hypothetically completely relaxed state (closure of a linear molecule into a planar
circle without any torsional strain) Lk0, resulting in the linking difference. 0LkLkLk m −=Δ
Equation 2: Calculation of the linking difference (Bates, 2005)
To compare different molecules, the specific linking number can be used,
because the standard linking number Lk0 is proportional to the number of bp. Instead
of specific linking number, σ is also termed as superhelix density because it
The number of double-helical turns is determined by the length of the DNA inbase pairs (N) divided by the number of base pairs per turn of helix (h).

Introduction
9
describes the degree of supercoiling. Negative supercoiling (σ < 0) delivers values of
Lk < Lk0.
00
0
LkLk
LkLkLk Δ
=−
=σ
Equation 3: Specific linking difference (Bates, 2005)
The change of the conformation without breaking one or both strands does not
influence the linking number. Hence, supercoiled plasmids which can only be
distinguished because of their different linking numbers are called topoisomers.
Twist (Tw) and Writhe (Wr) The twist (Tw) describes the coiling of individual strands around each one another
and therefore the number of bp per helical turn h is altered. The second important
term is the writhe (Wr) which is defined by the superhelical turns in space. The sum
of both geometric values results in the linking number.
WrTwLk Δ+Δ=Δ
Equation 4: Definition of the linking number
Figure 4: Visualization of the twist and writhe (Cozzarelli, 2006)
The specific linking difference is related to the number of base pairs. Therefore, also plasmids
with different sizes are comparable.
The linking number is invariant, therefore any change in the twist must causean equal and opposite change in the writhe of the molecule.
a) Wr~-3, Tw~0 b) writhe decreases, twist increases c) Wr~0, Tw~-3
a) b)
c)

Introduction
10
As it is obvious from the picture above, those two parameters (twist and writhe)
have a huge influence on the overall size of the molecule. Therefore analyses, in
which the size of the analyte is important for the separation, are very useful for
determination of the DNA topology.
Influence of environmental conditions on the topology The availability of positively charged ions to neutralize the negatively charged
backbone of the DNA and a change in the temperature can affect the helical repeat
and hence the twist. (Bates, 2005) The higher the concentration of counter ions is the
more tightly wound the helix becomes. This results in an increase of twist. In addition,
increasing the temperature occurs an unwinding of the DNA helix and the linking
number is decreasing. For instance in E.coli bacteria, the degree of negative
supercoiling increases as the temperature increases (Schleef, 2001).
Statistic distribution of topoisomers (Bates, 2005) Depew and Wang and Pullyblank et al. investigated 1975 the Gaussian
distribution of relative concentrations of topoisomers (intensity evaluation on agarose
gel) of DNAs. The most intense band corresponds to the most stable topoisomer with
Lk0. Considering the Hooke’s Law (G(Lkm)=Kω2) and the standard thermodynamic
equation (ΔG=-RTlnK), following equation results.
RT2KωΔLk
RTK
]m[Lk
]x[LKln
ΔLk1
−−=
Equation 5: Correlation of the elastic constant and the angular (Bates, 2005)
By plotting ΔLk against the left term of the equation, a linear relation can be observed. Thus K and ω can be determined, because the slope of the line is
–K/RT and the y-intercept -2Kω/RT
y x

Introduction
11
9,00 9,50 10,00 10,50 11,00 11,50 12,00 12,50 13,00 13,50 14,000
125
250
375
500
625
750
875
1.000
Retention Time [min]
λ = 258 nmLKm
9,00 9,50 10,00 10,50 11,00 11,50 12,00 12,50 13,00 13,50 14,000
125
250
375
500
625
750
875
1.000
Retention Time [min]
LKmmAUAbsorbance
9,00 9,50 10,00 10,50 11,00 11,50 12,00 12,50 13,00 13,50 14,000
125
250
375
500
625
750
875
1.000
Retention Time [min]
λ = 258 nmLKm
9,00 9,50 10,00 10,50 11,00 11,50 12,00 12,50 13,00 13,50 14,000
125
250
375
500
625
750
875
1.000
Retention Time [min]
LKmmAUAbsorbance
Figure 5: Example for the Gaussian distribution of topoisomers
Topoisomers can be visualized either with an appropriate HPLC method or with
agarose gel electrophoresis.
DNA intercalators and their impact on the DNA structure In the structure of DNA, the aromatic bases are stacked over each other in the
interior of the molecule and stacked over each other in the helix axes causing gaps
between adjacent bases. Within these gaps the bases can form hydrophobic or
electrostatic interactions with staining agents. Intercalating substances are aromatic
planar molecules, such as ethidium bromide. EtdBr is very toxic and may be
carcinogen, thus alternatives like minor-groove binding Sybr dyes are advertised.
However, details of mutagenic and toxicity are still lacking.
2D chromatographic setup (SEC-AIEX) of 4.9 kbp plasmid: Method description: 1st dimension: SRT SEC-1000 (150 x 7.8 mm ID) 5 µm, 1000 Å at room temperature, isocratic elution with 0.1 M NaCl, 1 mM EDTA, pH 7.5, flow rate: 2 mL/min, collection time: 1.35 – 2 minutes 2nd dimension:O-9-allylcarbamoyl-10,11-dihydroquinine (150 x 4 mm ID) on Daiso 5 µm, 120 Å, at 60°C, gradient elution 0-73% buffer B in 11 minutes (buffer A: 50 mM phosphate, pH 7.2, buffer B: 50 mM phosphate-, 0.6 M NaCl, 10% IPA, pH 7.2) flow rate: 1 mL/min

Introduction
12
c)b)a)
major groove
minor groove
c)b)a) c)b)a)
major groove
minor groove
Figure 6: Ethidium bromide as intercalating dye (http://sandwalk.blogspot.com)
When the intercalator is added to the DNA sample, it stretches and unwinds the
DNA helix (26° per molecule EtdBr). The binding of intercalating agents is
proportional to the specific linking number σ. Upon addition of EtdBr, the initially
negatively supercoiled DNA reduces the twist and hence increases the writhe (Bates,
2005). Thereby, it is possible to determine σ by dye titration and analysis by agarose
gel electrophoresis. By increasing the EtdBr concentration the DNA molecule
becomes fully relaxed and at last positively supercoiled (Schleef, 2001). Intercalation
does not only increase the adjacent base pair distance but also induces local
conformation changes in the backbone (M. Mahut, PhD thesis (2010) University of
Vienna).
Influence of enzymes In the 1970s, the application of restriction enzymes (so-called topoisomerases) to
produce certain DNA topologies was discovered. Those topoisomerases are able to
cut one or both DNA strands, consequently they cause a relaxation of the molecule.
Additionally, they can control the equilibrium between topoisomers, resulting in a
distribution centered at Lk0 (Bates, 2005).
The two most important enzymes, which can alter the linking number, are the
topoisomerase I (Topo I; Wang, 1971), and topoisomerase II or gyrase (Topo II;
Dean et al. 1983). Topo I can introduce single-strand breaks hence the supercoiling
is decreased consecutively until removed. Topo II is able to introduce double-strand
Molecular structure of ethidium bromide (a), untreated DNA (b) and the impact of intercalation on the twist of the DNA helix (c)

Introduction
13
breaks and usually introduces higher supercoiling. It also can create as well as
resolve DNA knots, depending on its type. Both enzymes regulate the degree of
supercoiling because of their contrasting properties.

Plasmid manufacturing
14
2 Plasmid manufacturing The interest in gene therapy and DNA vaccines is constantly increasing which
requires efficient manufacturing processes from the host bacteria, often Escherichia
coli. Biopharmaceutical plasmid production has to be done considering the regulatory
guidelines set by the European Medicines Agency (EMEA), which stipulate that
animal-derived materials have to be omitted throughout the process and fully defined
media has to be favoured.
2.1 Biotechnological production of pDNA
The production process of plasmids can be classified in three different parts.
1. Up-stream processing (construction and selection of appropriate expression
vectors and production organisms)
2. Fermentation process (optimisation of the conditions)
3. Down-stream processing (isolation and purification steps)
The first two steps have the most impact in the process stream regarding the
impurities and the contaminants (Kelley and Hatton 1991). To obtain highly purified
ccc plasmid several impurities and host cell constituents (gDNA, RNA, proteins, small
molecular weight nucleic acids, …) have to be removed in the course of the
manufacturing process i. e. during downstream processing.
Figure 7: Illustration of the three stages of pDNA process development
(Ferreira, 2000)

Plasmid manufacturing
15
1 Upstream process The choice of bacterial strain and therefore its genetic sequence affects the
plasmid quality as well as its yield. Cultivation of Escherichia coli are most commonly
used for the production of plasmid DNA whereby the quality of the DNA is mainly
influenced by the host strain (Werner, 2002). To improve the reproducibility and the
yield, appropriate nutrient and oxygen levels (yeast extracts or peptones) as well as
the temperature has to be optimized.
2 Plasmid fermentation
Initially, a process delivering a high amount of predominately supercoiled plasmid
from bacterial cell has to be developed. The fermentation process which starts with
inoculation takes place in bioreactors in industrial scale under optimum conditions
(temperature, pH, nutrients)
3 Downstream processing Alkaline cell lysis At the end of fermentation the plasmid DNA is present in the intracellular space.
Downstream processing starts with the alkaline disintegration of bacterial cell which
is necessary to release plasmids and was firstly described by Birnboim and Doly in
1979. Different modes like chemical, physical or mechanical methods for the
homogenisation of bacterial cells are feasible. The method of choice is the chemical
one due to the sensitivity of plasmids to hydrodynamic shear forces (mechanical
stress would reduce the yield) (Werner, 2002). To prevent the plasmid of damages
caused by DNase (desoxyribonucleases) and shear forces, EDTA is added to protect
the cell wall by chelating divalent cations. As chemical reagent, sodium
dodecylsulfate (SDS) is used affecting a breakage of the bilayer membrane and the
denaturation of proteins at an alkaline pH. Thus, by adding SDS plasmid DNA is
released and remains in solution whereas host proteins and genomic DNA
precipitate. Afterwards the solution has to be neutralized (usually with 3M potassium
acetate) whereby nucleic acids, cDNA and proteins precipitate because the refolding
is inhibited due to their size. The sc plasmid can simply be separated using
centrifugation.
During the fermentation process also oc and linear plasmids are generated thus
the best harvesting time has to be defined (ratio between the plasmid forms are
Plasmid manufacturing
16
dependent from the fermentation time). In addition, the optimum ratio of lysis buffer
per g biomass has to be investigated to enhance the amount of sc plasmid (Werner,
2002). After the fermentation, the resulting biomass has to be cooled down to prevent
further degradation of the sc pDNA (Werner 2000, Schleef 2001). Only about 3% of
bacterial cell lysate consists of plasmidic DNA thus plasmids with low copy number
have to be concentrated at first (Stadler, 2004).
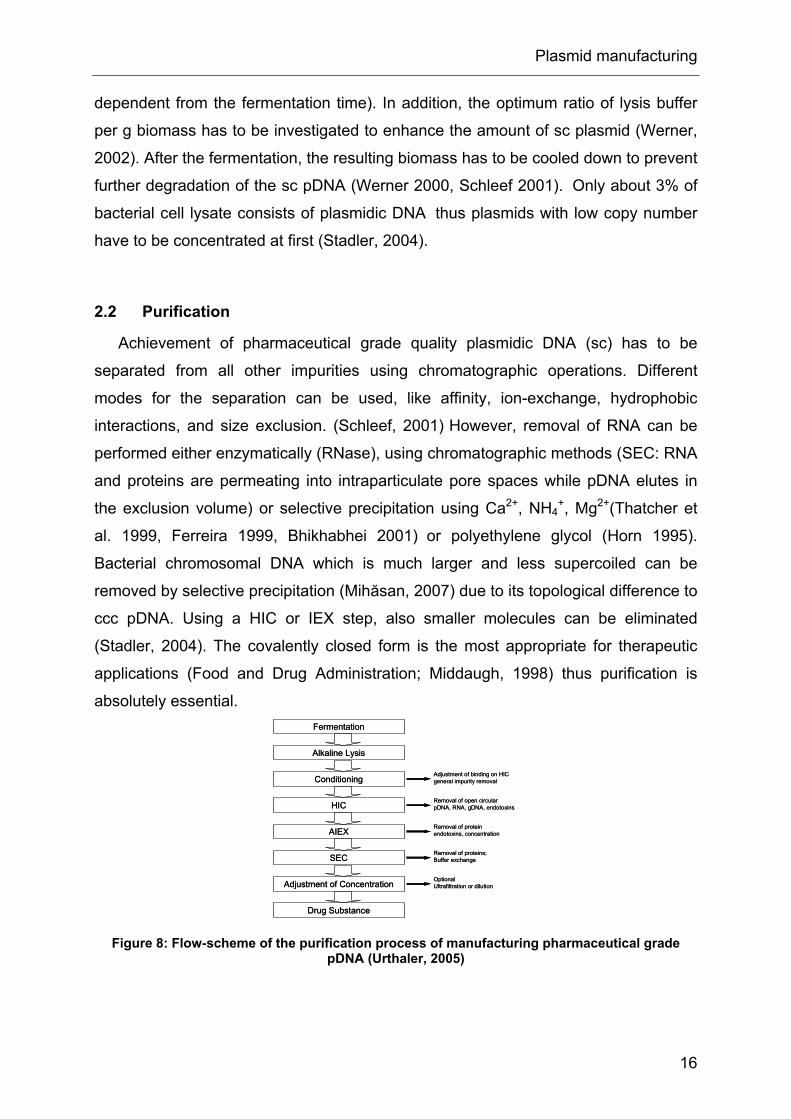
2.2 Purification
Achievement of pharmaceutical grade quality plasmidic DNA (sc) has to be
separated from all other impurities using chromatographic operations. Different
modes for the separation can be used, like affinity, ion-exchange, hydrophobic
interactions, and size exclusion. (Schleef, 2001) However, removal of RNA can be
performed either enzymatically (RNase), using chromatographic methods (SEC: RNA
and proteins are permeating into intraparticulate pore spaces while pDNA elutes in
the exclusion volume) or selective precipitation using Ca2+, NH4+, Mg2+(Thatcher et
al. 1999, Ferreira 1999, Bhikhabhei 2001) or polyethylene glycol (Horn 1995).
Bacterial chromosomal DNA which is much larger and less supercoiled can be
removed by selective precipitation (Mihăsan, 2007) due to its topological difference to
ccc pDNA. Using a HIC or IEX step, also smaller molecules can be eliminated
(Stadler, 2004). The covalently closed form is the most appropriate for therapeutic
applications (Food and Drug Administration; Middaugh, 1998) thus purification is
absolutely essential. Fermentation
Alkaline Lysis
Conditioning
HIC
AIEX
SEC
Adjustment of Concentration
Drug Substance
Adjustment of binding on HICgeneral impurity removal
Removal of open circularpDNA, RNA, gDNA, endotoxins
Removal of proteinendotoxins, concentration
Removal of proteins;Buffer exchange
Optional Ultrafiltration or dilution
Fermentation
Alkaline Lysis
Conditioning
HIC
AIEX
SEC
Adjustment of Concentration
Drug Substance
Adjustment of binding on HICgeneral impurity removal
Removal of open circularpDNA, RNA, gDNA, endotoxins
Removal of proteinendotoxins, concentration
Removal of proteins;Buffer exchange
Optional Ultrafiltration or dilution
Figure 8: Flow-scheme of the purification process of manufacturing pharmaceutical grade pDNA (Urthaler, 2005)

Plasmid manufacturing
17
For purification of plasmid DNA a chromatographic combination using
hydrophobic interaction (HIC) (Diogo et al., 2000) as a capture step followed by anion
exchange chromatography (AIEX) (Eon-Duval & Burke, 2004) as intermediate step
and finally size exclusion (SEC) (Horn et al., 1995) for polishing was established.
Carrying out this procedure the resulting product consists of more than 95% of
supercoiled plasmid DNA (drug substance) (Werner, 2002). Furthermore, this three
step column system provides fast and automatable, reliable and low cost purification
process.

Analysis of plasmid structures (AGE, HPLC, CGE)
18
3 Analysis of plasmid structures (AGE, HPLC, CGE)
(Bates, 2005)
Plasmids are produced in bacterial cells, mainly in Escherichia coli bacteria.
Consequently, impurities such as proteins, RNA, genomic DNA and endotoxins have
to be removed using anion exchange (Colpan et al. 1999; Bussey et al. 1998),
reversed phase (Green et al., 1997) or size exclusion chromatography (Horn et al.,
1995). After discovering their application for gene therapy or DNA vaccination,
additional requirements concerning purity and topological distribution have to be
fulfilled. According to the guidelines set by the regulatory authorities like Food and
Drug Administration (FDA) in the United States or European Medicines Agency
(EMEA), plasmid therapeutics must have a characterized content of at least 90% ccc
form. Therefore several techniques were developed for purification as well as a
reliable and accurate determination of the purity. The analysis method guarantees a
separation of different plasmids, of different topologies of the same plasmid as well
as the determination of impurities.
3.1 Capillary gel electrophoresis (CGE)
For analyzing different plasmids and their structures, capillary gel electrophoresis
is another powerful tool (Schmidt et. al, 1999). In principle, the separation
mechanism is the same as for agarose gel electrophoresis differing only in the
dimensions of the separation compartment in which the separation takes place. CGE
describes separation within filled thin capillaries (50-100 µm ID) with a liquid polymer
solution, usually polyacrylamide or derivatized cellulose. To analyze a DNA sample, it
has to be injected into the capillary after which a certain voltage is applied to the
capillary ends. As a result of the charged analytes, they migrate towards the
electrode, whereby the shape and the topology of the analyte mainly affect the
separation. Thus the migration order is ccc > lin > oc and monomers elute earlier
than dimers of the same isoform (ccc monomer > ccc dimer > lin monomer > lin
dimer > oc monomer > oc dimer). This order is independent from the plasmid size
and simplifies identification. This effect indicates that the migration order is mainly
influenced by the compactness and by the molecular size of the analyte.

Analysis of plasmid structures (AGE, HPLC, CGE)
19
Figure 9: CGE electropherogram of pUC19 plasmid DNA (2.9 kb) (Schleef, 2001)
Liquid gel matrix: hydroxypropylmethylcellulose (HPMC)
CGE quantifies different isoforms fast and reliable in an automatable system.
Hence CGE can be used for routine analysis to establish the plasmid DNA form
distribution. Furthermore, CGE provides a higher resolution, sensitivity and selectivity
than AGE. However, this type of electrophoresis does have a number of
disadvantages like lack of robustness, poor reproducibility and low sample loading.
3.2 Agarose gel electrophoreses (AGE)
Agarose gel electrophoresis is the most common method to determine the
distribution of isoforms and topoisomers of one plasmid. The separation is mainly
based on size, geometric form and the charge of analyte.
Practically, an electric field has to be applied to a uniform gel, which is
characterized by a certain sized mesh network of agarose. The negatively charged
DNA, which stems from the sugar phosphate groups in the backbone, migrates from
the cathode to the positively charged anode. The mesh size of the gel and the
applied voltage are the reason for the faster migration of compact and highly charged
supercoiled monomer than open circular pDNA. Hence the size, the compactness
and the charge of the analytes are important criteria, which enable the separation.
The resulting bands in the agarose gel may be assigned to different plasmid sizes
and topologies, like supercoiled, linear or the open-circular form. However,
visualisation of the DNA can not be done directly but either before or after the
electrophoretic run by usage of an intercalating dye. It has to be considered that
when added prior to the separation to both the gel and the buffer this additive
influences the separation, the migration velocity and therefore the migration order of
the different geometric-shaped DNA.

Analysis of plasmid structures (AGE, HPLC, CGE)
20
AGE is sensitive to changes in ionic strength (buffer composition), gel
concentration, temperature, dye concentration and changes in the electric field, thus
the single bands have to be identified correctly with an internal standard such as a
DNA ladder or a certain topological standard. Therefore it is very important that the
operating conditions are not changed if the results should be comparable.
Consequently, it is very important to use the same buffer (usually TAE Tris-Acetate-
EDTA or TBE Tris-Borate-EDTA) for preparing the gel and for the electrophoretic run
to prevent a change of the migration because of the difference in the ion strength.
As general assumption, the linear form has the greatest migration velocity,
followed by the negatively supercoiled form and the open circular form. If the ccc is
highly supercoiled its migration can be eventually faster than the linear form.
Furthermore, monomers migrate faster than dimers due to their size. These
conclusions are only true, if the intercalating dye is added after the electrophoresis
only for visualisation purposes or if the added amount is under a critical concentration
at which the migration order is changed. In general, the resolution of the different
plasmid structures in agarose gel electrophoresis and the separation of oc monomer
and ccc dimer suffer with increasing plasmid size and increasing temperature.
The concentration of pDNA can be evaluated by densitometric quantification of
the fluorescence intensity at 366 nm (maximum fluorescence of the DNA-EtdBr
complex). This is a very sensitive method, but it is limited to a maximum of 2 µg
plasmid guaranteeing sufficient resolution between the isoforms and sharp bands.
Additionally low concentrations of impurities can not be observed anymore and a
resolution problem appears with respect to oc monomer and ccc dimer structures
(Schleef, 2001).
In conclusion AGE has a lot of advantages and disadvantages (like long analysis
time), but nevertheless it is still one of the most important methods for determination
of the purity and homogeneity of plasmid samples.

Analysis of plasmid structures (AGE, HPLC, CGE)
21
dimer
ccc
oc
lincccmonomer
oc
lin
cccdimerdimer
ccc
oc
lincccmonomer
oc
lin
cccdimer
Figure 10: Separation of the different isoforms of pMCP1 (banding pattern)
3.3 High performance liquid chromatography (HPLC)
For industrial applications it is important to have short analysis times with good
and robust separation. That is why high performance liquid chromatography is the
method of choice. Depending on the interactions between the analyte and the
stationary phase different working modes in HPLC are possible: Reversed Phase
(RP), Ion Pair (IPC), Anion Exchange (AIEX) and Size Exclusion Chromatography
(SEC). Nowadays nearly all chromatographic methods for detection of plasmid DNA
are based on the anion exchange principle which is obvious for negatively charged
biomolecules. To improve the method for the individual application, different
parameters concerning the stationary phase can be optimized such as particle size
(Huber, 1998), porous or nonporous particles and the nature of the support material
(based on silica, methacrylate or organic monoliths). Using macroporous silica based
supports the limiting factor is the slow mass transport within the stationary phase
resulting in broad peaks, low sample recovery and long analysis times. This can be
solved with micropellicular packing material, which decreases the surface due to its
non-porosity and therefore gain the enhancement of separation efficiency as a result
of acceleration of mass transport due to elimination of intraparticulate pore diffusion.
Additionally, lower amounts of selector are immobilized on the stationary phase.
Thus the best compromise between the available surface and the particle size has to
The gel contains 0.8% of agarose and the running buffer consists of 1x TBE buffer. For the run 200 Volt for 2 hours are applied. Afterwards, staining with
Sybr gold® (provided from Invitrogen) was performed

Analysis of plasmid structures (AGE, HPLC, CGE)
22
be found. Furthermore, the separation can be influenced by additional interactions
such as hydrophobic forces (HIC) or intercalation if appropriate functionalities are
bound to the support. Silica based supports are very polar because of their terminal
OH groups and even after modification of the surface they are still present in a lower
content. Thus also hydrogen bonds are possible. If they have to be suppressed, the
silica support has to be end capped resulting in steric hindering of Si-OH groups (for
example derivitization of accessible silanol groups with hexamethyldisilazane).
Concerning the mobile phase, parameters such as pH value, ionic strength and
buffer type have to be optimized. Also organic additives (e.g. isopropanol as
hydrophobic suppressor), cationic additives (Zhdanov, 2002) (for example
spermidine or spermine, which are highly charged and thus they compact pDNA),
chaotropic agents (like urea) or chelating agents (Ca2+, Mg2+,.EDTA) (Burda, 1997)
can improve the resolution of the plasmid-containing sample. Considering compacted
DNA it may stick to some anion exchange materials like Tosoh DNA-NPR or even
hardware (glass frits, metal frits) and clog the column. Thus additives have to be
used carefully.
By working with DNA samples it also has to be considered that at a pH above 4
the net charge of the molecule is negative and therefore anion exchange
chromatography (AIEX) can be used. Silica based supports are only stable below a
pH of 8 hence only a limited pH range is suitable for this application.

Analysis of plasmid structures (AGE, HPLC, CGE)
23
Time [min]1.5 2 2.5 3 3.5 4 4.5 5 5.5
Absorbance [mAU]
0
200
400
600
800
Time [min]1.5 2 2.5 3 3.5 4 4.5 5 5.5
Absorbance [mAU]
0
200
400
600
800
Figure 11: Chromatogram of 4.9 kbp plasmid with AIEX
As it can be seen in Figure 11, only the ccc and oc isoform can be separated but
the ccc and linear form are co-eluting. The selectivity of the ligand of the stationary
phase is not sufficient for this separation and an appropriate selector has to be
developed in order for the chromatographic system to be more powerful and robust.
Several ligands have already been developed to separate all isoforms but more
selective commercially available stationary phases for this application are still in
development. The commonly most often used stationary phase is the Tosoh DNA-
NPR employing a diethylaminoethyl (DEAE) ligand. However, some drawbacks have
been observed with this column including besides insufficient selectivities between
isoforms a poor recovery in particular the oc form.
Using high performance liquid chromatography, advantages like short analysis
times, robustness, simple handling and automation (no need for qualified personnel)
can be provided. Furthermore, an upscaling of the method for industrial purposes is
possible.
To sum up, high performance liquid chromatography is the most promising
method for characterization of plasmid DNA.
Column: Tosoh DNA-NPR, ligand: DEAE (750 x 4.6 mm ID, 2.5 µm) Elution: buffer A: 20 mM TrisHCl, pH 9.0, buffer B: A + 1M NaCl, 50-75% buffer B in 5 min Column temperature: 25°C Flow rate: 1 mL/min
oc lin
cccSample loading: 1 µg oc, 1 µg lin, 7 µg ccc Buffer: 20 mM Tris-HCl, pH 9.0

Method development and Validation
24
4 Method development and Validation To enable separation of plasmid isoforms and thus validation, a novel material
(propylcarbamoyl quinine) have been developed in house.
Validation of an analytical procedure means to demonstrate that the procedure is
suitable for its intended purpose. Before starting the validation, the physical
properties of the analyte have to be investigated and preliminary tests have to be
performed in order to find the best conditions of the analytical method.
By performing such a validation, important parameters like precision or repeatability
(experimental variance of determinations), accuracy (recovery experiments),
specificity, detection limit (LOD), lower and upper quantitation limit (LLOQ, ULOQ)
and the linearity range have to be determined. Based on these parameters, a good
prediction about the suitability of this method for the quantitation determination of a
predefined analyte can be given. To get values for these parameters as good as
possible, each single method (stationary phase, mobile phase, elution conditions)
has to be optimized.
This thesis focuses on improving an HPLC method for the separation of different
plasmid isoforms, thus the following text is focused on chromatographic techniques.
At first, the choice of selector and stationary phase, respectively, is the most
important part by improving an HPLC method, because it decides which interactions
enable separation, resolution and elution of the analyte. As plasmidic DNA has a
negatively charged phosphate backbone the usage of an AIEX system is obvious.
Furthermore non porous silica based support is used because the plasmids have a
high molecular weight (5-15 kDa). That is why they are not able to diffuse into pores
and interactions between the analyte and the stationary phase are only possible at
the surface of the particles.
Characterization of the Propylcarbamoyl quinine material Propylcarbamoyl quinine (PCQ) covalently linked to silica (see Figure 12) was
used as stationary phase based on the studies of M. Mahut (PhD thesis (2010)
University of Vienna). The main function of this ligand immobilized onto porous silica
(100 Å, 5 µm) is to enable a hydrogen bond-mediated electrostatic interaction
mechanism by protonation of basic tertiary amine of the quinuclidine and

Method development and Validation
25
simultaneously H-bonding at the quinine carbamate with the plasmid DNA. Thus, the
molecular recognition principle can be classified as chemoaffinity principle and is not
merely an ion-exchange process. Experimental evidence for this assumption is
provided by a series of structural variations of the ligand and structure-selectivity
relationships based on these experiments (M. Mahut, PhD thesis (2010) University of
Vienna).
The residual silanol groups are negatively charged, resulting in an amphoteric
character of the material. To reduce the impact of repulsive Coulomb forces, those
silanol residues are partly derivatized with hexamethyldisilazane giving
trimethylsilyl(TMS)-endcapping. At this point it should be added that the mesopores
(100 Å) are not accessible for the plasmid and thus the support behaves like a
nonporous material for the plasmid separation.
In earlier studies, our working group with M. Mahut found out that a certain
distance (four atom spacer) between the two H-donor groups of the quinuclidine and
the carbamate is necessary for a successful separation of the isoforms. This result
can be explained by considering the topology and size of the ligand. In addition, the
negative charges of each isoform are different considering their accessibility to the
stationary phase which results in different binding strengths enabling a separation.
Si
Si
SiSi
O
OO
OO
O
Si
O
NH
Si
O
O
N
TMS Endcapping
N
O
Figure 12: Molecular structure of Propylcarbamoyl-Quinine (“PCQ”)
Elution of adsorbed DNA can be achieved either by increasing the pH or the salt
concentration. An increase of the pH affects the stability range of the silica support
and the analyte. Thus a suitable pH range from 6.5 to 8 is chosen.
Moreover, the Coulomb force, one of the strongest and long-ranged interaction,
as well as hydrophobic interactions can influence the separation. The resolution and
the peak capacity of the isoforms can be improved by exploiting the influence of

Method development and Validation
26
intercalators on DNA or by suppressing hydrophobic interactions through the addition
of organic modifiers like 2-propanol (IPA) (Huber, 1998).
For exploiting the present forces in the best way, the ligand as well as the analyte
has to be studied very well. This enables an optimum of separation with pre-defined
parameters such as separation material and analyte.
The PCQ column, which was used for the validation measurements, is prepared
and packed in-house (column dimension: 150 x 4 mm ID).
Characterization of the Tosoh Bioscience DNA-NPR material TSKgel DNA-NPR columns from Tosoh Bioscience are packed with non-porous
particles (2.5 µm) hydrophilic polymer beads (hydroxylated methacrylic polymer)
modified with a weak anion exchanger (ligand: DEAE - diethylaminoethylgroups).
O
OH
NH
Figure 13: Molecular structure of the weak anion exchanger (DEAE)
This support material can be used in the pH range between 2 and 12 (pKa=11.2).
Compared to columns packed with porous particles and the same ligand
functionality, TSKgel DNA-NPR columns have a low binding capacity (5 mg
BSA/mL). To gain a high efficiency separation of plasmids, the column dimensions
are optimized (750 x 4.6 mm ID). For the protection of the column a small guard
column can be used. The housing material consists of stainless steel in both the
separation and the guard column.
Concerning the elution of the analyte the composition of the mobile phases as
well as the gradient follows standard protocols employing NaCl-gradient elution (see
Figure 14).

Method development and Validation
27
Figure 14: Plasmid analysis with TSK gel DNA-NPR column
As seen above, only the open circular and the supercoiled pDNA are detected but
no linear form. The column is not able to separate the linear isoform at certain mobile
phase and gradient conditions which is a disadvantage of this system. Nevertheless
it is the most important material in plasmid separation because the open circular
isoform is the most common impurity by the production of plasmids.
(http://www.separations.us.tosohbioscience.com) Column: TSKgel DNA-NPR (750 x 4.6 mm ID) Sample: pUC19 plasmid
Elution: buffer A: 20 mM Tris-HCl, pH 9.0, buffer B: A + 1M NaCl, 50-65% buffer B in 10 column volumes
Flow rate: 1 mL/min Detection: UV at 260 nm
Method validation for pMCP1 with propylcarbamoyl quinine modified silica
28
5 Method validation for pMCP1 with propylcarbamoyl quinine modified silica Performing method validation, standards of each isoform have to be analyzed,
whereby a representative oc standard has to be prepared.
5.1 Manufacturing of oc standards
There are two possibilities to gain the oc form out of the ccc form: either to
expose the DNA to temperature or to use an enzyme. The enzyme (Nt.BstNBI)
catalyzes a single-strand nick from 3’ end of its nucleotide recognition (5‘-GAGTC-3‘
respectively 3’-CTCAG-5’, with single strand break four bases beyond the 3’ side of
the recognition sequence) (New England Biolabs). As a result each molecule has a
different number of nicks. The natural open circular form is relaxed due to only one
cut. In contrast, the oc form prepared with an enzyme can have several cuts
depending on its base sequence.
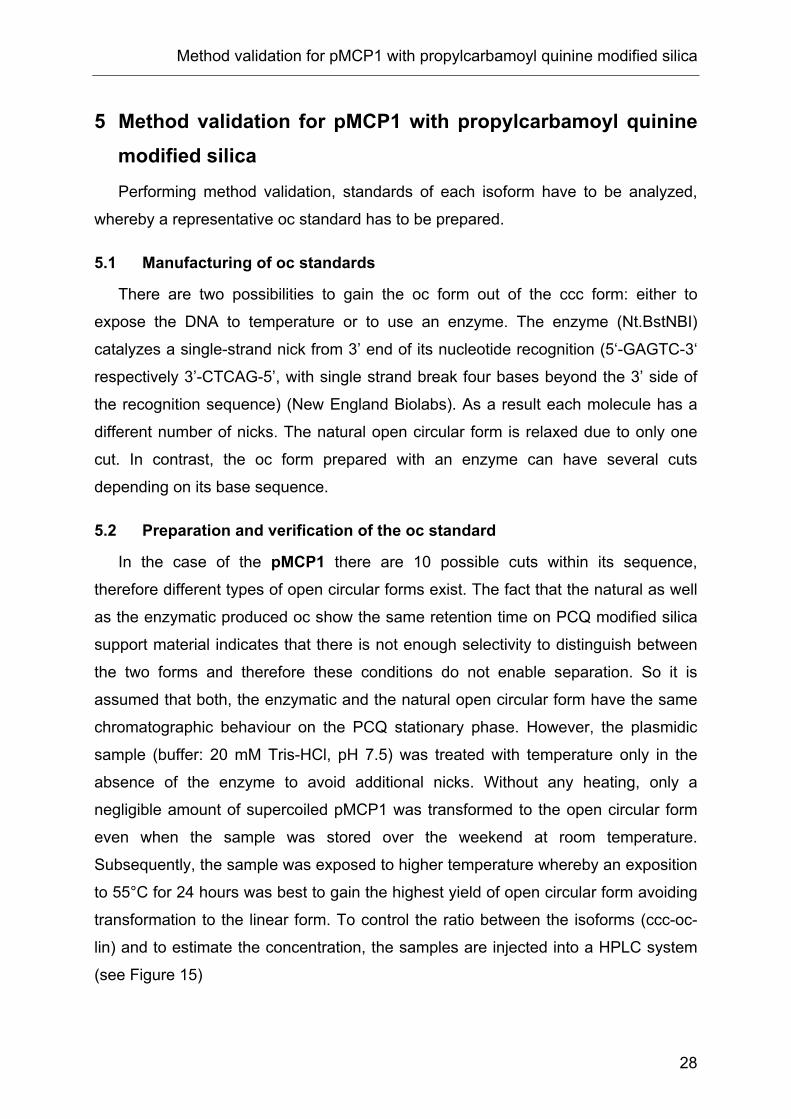
5.2 Preparation and verification of the oc standard
In the case of the pMCP1 there are 10 possible cuts within its sequence,
therefore different types of open circular forms exist. The fact that the natural as well
as the enzymatic produced oc show the same retention time on PCQ modified silica
support material indicates that there is not enough selectivity to distinguish between
the two forms and therefore these conditions do not enable separation. So it is
assumed that both, the enzymatic and the natural open circular form have the same
chromatographic behaviour on the PCQ stationary phase. However, the plasmidic
sample (buffer: 20 mM Tris-HCl, pH 7.5) was treated with temperature only in the
absence of the enzyme to avoid additional nicks. Without any heating, only a
negligible amount of supercoiled pMCP1 was transformed to the open circular form
even when the sample was stored over the weekend at room temperature.
Subsequently, the sample was exposed to higher temperature whereby an exposition
to 55°C for 24 hours was best to gain the highest yield of open circular form avoiding
transformation to the linear form. To control the ratio between the isoforms (ccc-oc-
lin) and to estimate the concentration, the samples are injected into a HPLC system
(see Figure 15)

Method validation for pMCP1 with propylcarbamoyl quinine modified silica
29
Table 1: Optimized experimental protocol
Temperature [°C] Incubation time [h]
55 24
Figure 15: Preparation of the open circular isoform (pMCP1)
To gain the generated open circular isoform in pure form, the oc peak was
isolated chromatographically on an analytical 150 x 4 mm ID PCQ column by
injecting six times a sample volume of 100 µL (corigin,pMCP1 = 2.84 µg/µL). Afterwards
the volume is reduced in a stream of nitrogen. The concentration of the oc sample
was determined by comparing the absorbance with those of a calibration set with
known concentration. Therefore an empty union was used instead of a
chromatographic column and the samples were eluted with an isocratic elution with a
flow rate of 0.7 mL/min.
Column: Propylcarbamoyl quinine PCQ (5 µm, 100 Å, 150 x 4 mm ID)
Elution: buffer A: 50 mM phosphate, pH 7.2, buffer B: A + 20%IPA pH 7.9, 0-100% buffer B in 15 min
Column temperature: 60°C Flow rate: 0.7 mL/min
oc
Time [min]2 4 6 8 10
Absorbance [mAU]
0
500
1000
1500
2000
2500
3000 142µg ccc at r.t. over the weekend71µg ccc at 55°C, 24h
Time [min]2 4 6 8 10
Absorbance [mAU]
0
500
1000
1500
2000
2500
3000 142µg ccc at r.t. over the weekend71µg ccc at 55°C, 24h
ccc

Method validation for pMCP1 with propylcarbamoyl quinine modified silica
30
Time [min]0.02 0.04 0.06 0.08 0.1 0.12 0.14 0.16 0.18
Absorbance [mAU]
0
200
400
600
800
1000
1200
Time [min]0.02 0.04 0.06 0.08 0.1 0.12 0.14 0.16 0.18
Absorbance [mAU]
0
200
400
600
800
1000
1200
Figure 16: Absorbance of different amounts of ccc form monitored without column
pMCP1 (ccc)
y = 7,3295x - 11,874R2 = 0,9967
0
500
1000
1500
2000
0 50 100 150 200 250 300
c [ng/µL]
Peak
are
a [m
AU
·s]
pMCP1 (ccc)pMCP1 (oc)Linear (pMCP1 (ccc))
Figure 17: Calibration curve of ccc form
Table 2: Calibration curve and the calculation of the oc-concentration
concentration [ng/µL] injected amount [ng] peak area [mAU·s]284.0 852.0 2079.056.8 170.4 391.128.4 85.2 124.611.4 34.1 55.15.7 17.0 55.7
oc sample72.1 216.4 503.2
The concentration of the prepared oc standard was determined to be 72.1 ng/µL
Injected amount: 17–852 ng
c(oc) = 72.1 ng/µL

Method validation for pMCP1 with propylcarbamoyl quinine modified silica
31
In addition the identity of the isolated oc sample was verified with AGE.
Marker
Final bulk
Open circular
Linear
IsolatedO
cpeak
Marker
Marker
Final bulk
Open circular
Linear
IsolatedO
cpeak
Marker
Figure 18: Agarose gel for the verification of the oc standard
The agarose gel reveals one prominent band which can be identified as the open
circular form by comparing with standards. The additional band with lower intensity
can be assigned to a negligible impurity of the linear form. Furthermore, the linear
and the ccc form can not be distinguished, although by adding EtdBr to the gel a
separation between the linear and the ccc can be obtained.
Method validation for two different plasmids (pMCP1, pGNA3) with two different stationary phases (propylcarbamoyl quinine modified silica, TSKgel DNA-NPR material) concerning the International Conference on Harmonisation guideline for analytical procedures (ICH guideline) was performed.
0.8% agarose, 1x TBE buffer, applied voltage: 200 V for 2 hours, Staining: 2 µL EtdBr (10 mg/mL)
oc
ccc+lin
Method validation for pMCP1 with Propylcarbamoyl quinine modified silica
32
6 Method validation for pMCP1 with Propylcarbamoyl quinine modified silica For confirming the application of the PCQ modified stationary phase for a 4.9 kb
plasmid, method validation was performed.
6.1 Equipment and Instruments
The validation measurements are performed using an Agilent 1200 rapid
resolution system equipped with a binary pump, a thermostated autosampler (cooled
to 4°C) and a diode array UV detector (DAD). All buffer solutions are filtered by a
glass filtration unit (Millipore) through a 0.22 µm nylon filter before using.
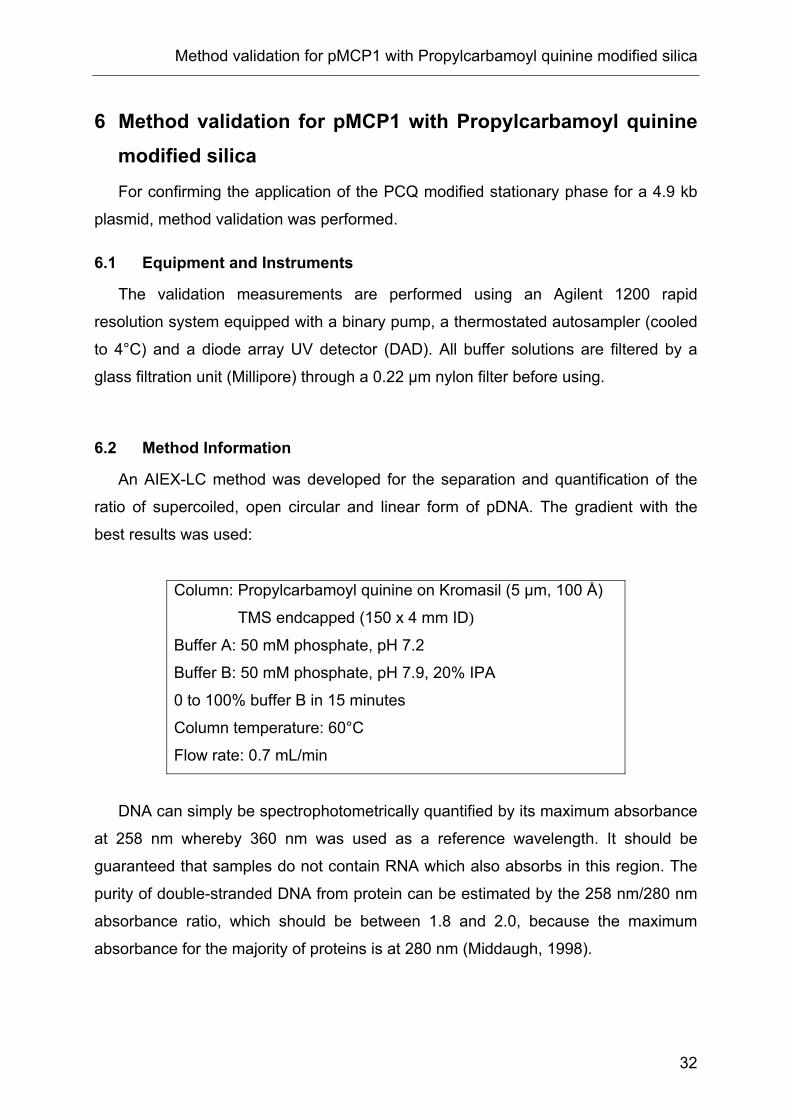
6.2 Method Information
An AIEX-LC method was developed for the separation and quantification of the
ratio of supercoiled, open circular and linear form of pDNA. The gradient with the
best results was used:
Column: Propylcarbamoyl quinine on Kromasil (5 µm, 100 Å)
TMS endcapped (150 x 4 mm ID)
Buffer A: 50 mM phosphate, pH 7.2
Buffer B: 50 mM phosphate, pH 7.9, 20% IPA
0 to 100% buffer B in 15 minutes
Column temperature: 60°C
Flow rate: 0.7 mL/min
DNA can simply be spectrophotometrically quantified by its maximum absorbance
at 258 nm whereby 360 nm was used as a reference wavelength. It should be
guaranteed that samples do not contain RNA which also absorbs in this region. The
purity of double-stranded DNA from protein can be estimated by the 258 nm/280 nm
absorbance ratio, which should be between 1.8 and 2.0, because the maximum
absorbance for the majority of proteins is at 280 nm (Middaugh, 1998).

Method validation for pMCP1 with Propylcarbamoyl quinine modified silica
33
6.3 Results and evaluation
Each concentration was measured at least two times in series and the
measurements were done starting from the lowest to the highest injected amount to
avoid a carry over.
Linearity Range The linearity range is the concentration range of the calibration function where the
signal linearly increases with the concentration. For analytical purposes it is desirable
to have a wide linear range.
a. Chromatograms
Supercoiled pDNA
Time [min]2.5 5 7.5 10 12.5 15 17.5 20
Absorbance [mAU]
0
50
100
150
200
250
300
350
Time [min]2.5 5 7.5 10 12.5 15 17.5 20
Absorbance [mAU]
0
50
100
150
200
250
300
350
0.04 µg ccc
0.04 µg0.1 µg
1 µg
3 µg7 µg
10 µg
0.1 µg ccc
ccc
oc
8 107
0
1
2
3
4
98 107
0
1
2
3
4
9
Time [min]6 8 10 12
-0.50
0.51
1.52
Time [min]6 8 10 12
Absorbance [mAU]
Absorbance [mAU]
Time [min]
Time [min]2.5 5 7.5 10 12.5 15 17.5 20
Absorbance [mAU]
0
50
100
150
200
250
300
350
Time [min]2.5 5 7.5 10 12.5 15 17.5 20
Absorbance [mAU]
0
50
100
150
200
250
300
350
0.04 µg ccc
0.04 µg0.1 µg
1 µg
3 µg7 µg
10 µg
0.1 µg ccc
ccc
oc
8 107
0
1
2
3
4
98 107
0
1
2
3
4
9
Time [min]6 8 10 12
-0.50
0.51
1.52
-0.50
0.51
1.52
Time [min]6 8 10 12
Absorbance [mAU]
Absorbance [mAU]
Time [min]
Figure 19: Stacked chromatograms of the supercoiled isoform (0.04-10 µg pDNA)

Method validation for pMCP1 with Propylcarbamoyl quinine modified silica
34
Open circular pDNA
0.04 µg oc
0.1 µg oc
0.04 µg
oc
0.1 µg
1 µg
3 µg
7 µg
Time [min]0 2.5 5 7.5 10 12.5 15 17.5 20
Absorbance [mAU]
0
50
100
150
200
Time [min]0 2.5 5 7.5 10 12.5 15 17.5 20
Absorbance [mAU]
0
50
100
150
200
Absorbance [mAU]
Time [min]4 6 80
0.5
1
1.5
5 73 6 87
Time [min]4 6 8
Absorbance [mAU]
57.510
12.515
17.5
2.5
0.04 µg oc
0.1 µg oc
0.04 µg
oc
0.1 µg
1 µg
3 µg
7 µg
Time [min]0 2.5 5 7.5 10 12.5 15 17.5 20
Absorbance [mAU]
0
50
100
150
200
Time [min]0 2.5 5 7.5 10 12.5 15 17.5 20
Absorbance [mAU]
0
50
100
150
200
Time [min]0 2.5 5 7.5 10 12.5 15 17.5 20
Absorbance [mAU]
0
50
100
150
200
Time [min]0 2.5 5 7.5 10 12.5 15 17.5 20
Absorbance [mAU]
0
50
100
150
200
Absorbance [mAU]
Time [min]4 6 80
0.5
1
1.5
5 73 6 87
Time [min]4 6 8
Absorbance [mAU]
57.510
12.515
17.5
2.5
Figure 20: Stacked chromatograms of the open circular isoform (0.04-7 µg)
Linear pDNA
Time [min]0 2.5 5 7.5 10 12.5 15 17.5 20
Absorbance [mAU]
0
50
100
150
200
250
300
350
Time [min]0 2.5 5 7.5 10 12.5 15 17.5 20
Absorbance [mAU]
0
50
100
150
200
250
300
350
Time [min]4 6 8
Absorbance [mAU]
0
0.5
1
1.5
2
2.5
3
3.5
Time [min]5 6 7
Absorbance [mAU]
00.250.5
0.751
1.251.5
1.75 0.04 µg lin
0.1 µg lin
0.04 µg
0.1 µg
1 µg
3 µg
7 µg
lin
Time [min]0 2.5 5 7.5 10 12.5 15 17.5 20
Absorbance [mAU]
0
50
100
150
200
250
300
350
Time [min]0 2.5 5 7.5 10 12.5 15 17.5 20
Absorbance [mAU]
0
50
100
150
200
250
300
350
Time [min]4 6 8
Absorbance [mAU]
0
0.5
1
1.5
2
2.5
3
3.5
Time [min]4 6 8
Absorbance [mAU]
0
0.5
1
1.5
2
2.5
3
3.5
Time [min]5 6 7
Absorbance [mAU]
00.250.5
0.751
1.251.5
1.75 0.04 µg lin
0.1 µg lin
0.04 µg
0.1 µg
1 µg
3 µg
7 µg
lin
Figure 21: Stacked chromatograms of the linear isoform (0.04-7 µg)
In Figure 19-21, chromatograms with increasing injected amounts within the
linearity range for each isoform can be seen.

Method validation for pMCP1 with Propylcarbamoyl quinine modified silica
35
b. Calculated calibration curves: If a carry-over phenomenon occurred because of insufficient cleaning steps in-
between or irreversible adsorption, the noise was assumed to be the peak area of the
blank at the same retention time as the isoform and was subtracted from the peak
area signal of the plasmid.
Based on the calibration curve which is illustrated in Figure 22 it is obvious that a
dilution error occurred during the preparation of 0.02 µg plasmid which has therefore
to be eliminated in the calibration. According to the results given in Table 3 and in
Figure 22, the response is linear in the concentration range from 0.04 to 10 µg
plasmid DNA.
1st measurement
y = 1149.4x + 20.805R2 = 0.999
02000400060008000
1000012000
0 1 2 3 4 5 6 7 8 9 10
amount [µg]
peak
are
a [m
AU
*s]
2nd measurement
y = 1157.9x + 63.088R2 = 0.9985
02000400060008000
1000012000
0 1 2 3 4 5 6 7 8 9 10
amount [µg]
peak
are
a [m
AU
*s]
Figure 22: Calibration curve of the ccc isoform (0.04-10 µg plasmid)
Table 3: Results of the supercoiled plasmid
1st measurement 2nd measurement Sample Inj. amount [µg] tR [min] A [mAU⋅s] tR [min] A [mAU⋅s]
0.001 8.644 11.3 8.884 14.6 0.01 9.188 8.2 9.189 7.8 0.02 9.29 321.4
outlier 9.288 285.
outlier 0.04 9.288 42.3 9.262 40.1
0.1 8.796 70.2 8.793 83.9 1 8.792 1046.1 8.831 1130.5 3 8.639 3773 8.638 3802.4 7 8.821 8027.8 8.812 8363.5
ccc
10 8.821 11464.5 8.84 11436

Method validation for pMCP1 with Propylcarbamoyl quinine modified silica
36
Table 4: Results of the open circular plasmid
1st measurement 2nd measurement Sample Inj. amount [µg] tR [min] A [mAU⋅s] tR [min] A [mAU⋅s] 0.001 5.0 2.1 5.0 2.3 0.01 5.224 6.8 5.228 6.5 0.04 5.197 44.3 5.178 54.8 0.1 5.406 104.9 5.401 127 1 5.429 1406.5 5.337 1436.3 3 5.327 5174.6 5.328 5246 7 5.27 10732.1 5.264 10794.8
oc
10 5.227 18819.7 5.238 18891.9
Comparing peak areas of 7 and 10 µg plasmid, the higher concentrated sample
can be estimated as an outlier. The linearity range of the oc form extends from 0.04
to 7 µg oc plasmid.
1st measurement
y = 1554.8x + 28.398R2 = 0.9963
02000400060008000
1000012000
0 1 2 3 4 5 6 7
amount [µg]
peak
are
a [m
AU
*s]
2nd measurement
y = 1562x + 51.555R2 = 0.996
02000400060008000
1000012000
0 1 2 3 4 5 6 7
amount [µg]
peak
are
a [m
AU
*s]
Figure 23: Calibration curve of the oc isoform (0.04 – 7 µg plasmid)
Table 5: Results of the linear plasmid
1st measurement 2nd measurement Sample Inj. amount [µg] tR [min] A [mAU⋅s] tR [min] A [mAU⋅s]
0.001 5.039 1.8 5.012 3.2 0.01 5.062 11 5.042 10.2 0.02 5.719 67.4 5.631 57.4 0.04 5.608 44.5 5.608 37.3 0.1 5.055 99.6 5.063 102.1 1 5.085 1421.9 5.083 1421.2 3 5.058 4324.8 5.044 4260.7 7 5.193 9839.8 5.179 9858
lin
10 5.163 15455.2 5.161 15459.3
The linear relation between concentration and peak area exists from 0.04 to 7 µg.
The 0.02 µg plasmid sample delivered higher peak areas compared to 0.04 µg which

Method validation for pMCP1 with Propylcarbamoyl quinine modified silica
37
has therefore to be eliminated in the calibration curve to obtain the lowest coefficient
of determination.
1st measurement
y = 1410.8x + 2.7767R2 = 0.9998
020004000
60008000
10000
0 1 2 3 4 5 6 7
amount [µg]
peak
are
a [m
AU
*s]
2nd measurement
y = 1412.3x - 10.654R2 = 1
020004000
60008000
10000
0 1 2 3 4 5 6 7
amount [µg]
peak
are
a [m
AU
*s]
Figure 24: Calibration curve of the lin isoform (0.04-7 µg plasmid)
The similarity of both calibration curves (first and second measurement) for all
measurements indicates the high repeatability of those chromatographic results.
Moreover, the high degree of linearity is represented through R2 values greater than
0.99 for all three isoforms in the specified range. These results show that the main
issue is the recovery of the open circular form (lowest correlation coefficient). It can
be adsorbed at the steel frits, at the fibreglass in the column filter sandwich or
irreversibly at the stationary phase. To remove the DNA from the support material a
sanitizing step with sodium hydroxide would be advantageous but impossible due to
limited pH stability. Thus cleaning was carried out with 3 M sodium chloride.
Determination of the precision (repeatability) The precision of an analytical procedure expresses the closeness of agreement
between a series of measurements obtained from multiple sampling of the same
sample under the same operating conditions over a short interval of time. (ICH-
Q2(R1), 1994) For the mathematical calculation, the relative standard deviation is
used (standard deviation related to the average value in percent.
3 µg of each isoform of pMCP1 were injected 6 times in series with the PCQ-
column and the precision (peak area and retention time) was calculated. The values
ranged from 0.6 to 1.5% evaluating the peak areas and from 0.06 to 0.32%
evaluating the retention time whereby the oc form delivered the lowest precision.

Method validation for pMCP1 with Propylcarbamoyl quinine modified silica
38
Table 6: Calculated precision (peak area) (n=6; 3 µg injected)
Peak area [mAU⋅s]
Average value [mAU⋅s] 3808.5
Standard deviation [mAU⋅s] 21.6 Supercoiled
Relative standard deviation 0.6%
Average value [mAU⋅s] 5199.9
Standard deviation [mAU⋅s] 43.6 Open circular
Relative standard deviation 0.8%
Average value [mAU⋅s] 4352.7
Standard deviation [mAU⋅s] 66.7 Linear
Relative standard deviation 1.5%
Table 7: Calculated precision (retention time) (n=6; 3 µg injected)
Retention time [min]
Average value [min] 8.78
Standard deviation [min] 0.01 Supercoiled
Relative standard deviation 0.07%
Average value [min] 5.27
Standard deviation [min] 0.07 Open circular
Relative standard deviation 1.25%
Average value [min] 5.20
Standard deviation [min] 0.00 Linear
Relative standard deviation 0.06%
Figure 25: Chromatograms of precision measurements (3 µg) of ccc plasmid
Time [min] 2 4 6 8 10 12 14
Absorbance [ mAU ]
0 10 20 30 40 50 60 70 80 90
Time [min] 2 4 6 8 10 12 14
Absorbance [ mAU ]
0 10 20 30 40 50 60 70 80 90
ccc
oc

Method validation for pMCP1 with Propylcarbamoyl quinine modified silica
39
Time [min]2 4 6 8 10 12
Absorbance [mAU]
0
10
20
30
40
50
60
Time [min]2 4 6 8 10 12
Absorbance [mAU]
0
10
20
30
40
50
60
Figure 26: Chromatograms of precision measurements (3 µg) of oc plasmid
Time [min]2 4 6 8 10 12 14
Absorbance [mAU]
0
10
20
30
40
50
Time [min]2 4 6 8 10 12 14
Absorbance [mAU]
0
10
20
30
40
50
Figure 27: Chromatograms of precision measurements (3 µg) of lin plasmid
As can be seen in Figure 25-27 the propylcarbamoyl quinine modified silica
material showed good peak performances and repeatabilities for ccc, oc and linear
isoform.
Time [min]2 4 6 8 10 12 14
Absorbance [mAU]
0
20
40
60
80
100
120
140
ccc
lin
oc
Time [min]2 4 6 8 10 12 14
Absorbance [mAU]
0
20
40
60
80
100
120
140
ccc
lin
oc
Figure 28: Comparison of ccc, oc and lin isoform (each 3µg)
The comparison of chromatograms of all three isoforms illustrates that there is a
good selectivity between the oc and the ccc form, but the open circular and the linear
oc
lin

Method validation for pMCP1 with Propylcarbamoyl quinine modified silica
40
isoform could only be partial separated due to their similar retention. However,
isoforms can influence each other when coexisting resulting in a slight shift of
retention time enabling determination.
Determination of the Recovery of the open circular isoform
Insufficient recovery of the oc form is one of the startcomings of state-of-the-art
plasmid analysis in AIEX chromatography. Hence it is an important method
characteristics for assessment of its performance. Thus, for one purpose recovery
was determined as the percentage of the peak areas of the open circular isoform was
related to the peak areas of the linear isoform with the same concentration (0.1 µg, 1
µg, 3 µg, 7 µg pDNA). The use of the linear plasmid as reference is based on the fact
that it is not irreversibly adsorbed at any part in the HPLC system contrary to the oc
isoform and therefore the entire amount of DNA can be recovered in the
chromatogram.
The average recovery of the oc pDNA related to the linear isoform in a
concentration range from 0.1 µg to 7 µg DNA was 112 ± 9% (1st measurement: 108 ±
9%, 2nd measurement: 115 ± 9%), whereas the precision measurements delivered a
recovery of 119 ± 2%. Compared to currently employed HPLC methods the recovery
of this new method was greatly improved
Table 8: Summary of calculated recoveries
Recovery Concentration rage: 1st measurement 2nd measurement Average value
0.1 to 7 µg 108 ± 9% 115 ± 9% 112 ± 9%
3µg
(precision measurements) 119 ± 2%
Determination of the Limit of Detection / Limit of Quantification The Limit of detection and quantification are important values to describe the
concentration limits of a method.
Limit of Detection (LOD)
The detection limit of an individual analytical procedure is the lowest amount of
analyte in a sample which can be detected but not necessarily quantified as an exact
value. The LOD can be determined either by visual evaluation or by the usage of an

Method validation for pMCP1 with Propylcarbamoyl quinine modified silica
41
acceptable signal to noise ratio of 3 to1. Determination of the signal-to-noise ratio is
performed by comparing measured signals (peak area at the same retention time)
from samples with known low concentrations of analyte with those of blank samples
and establishing the minimum concentration at which the analyte can be reliably
detected. (ICH-Q2(R1), 1994)
Lower Limit of Quantification (LLOQ)
The quantification limit of an individual analytical procedure is the lowest amount
of analyte in a sample which can be quantitatively determined with suitable precision
and accuracy. (ICH-Q2(R1), 1994) The LLOQ is determined as the signal which is 10
times higher than the noise.
Comparing peak areas, values for LOD and LLOQ of the isoforms were located
between two measurements, thus the concentrations had to be calculated using the
calibration curve.
Table 9: Summary of LOD (S:N = 3:1) and LLOQ (S:N = 10:1)
As can be seen in Table 9 the LOD is about 0.02 to 0.15 µg and the LLOQ
between 0.04 and 0.1 µg pDNA.
Upper Limit of Quantification (ULOQ)
The ULOQ is the highest amount of analyte that can be quantified with adequate
precision and accuracy. The highest injected amount which is still in the linearity
range of the open circular and linear isoform is 7 µg. The highest injected amount for
the covalently closed circular isoform was 10 µg which was still in the linear range of
the calibration curve. Thus the ULOQ of ccc pDNA is assumed to be 10 µg.
Determination of Impurities The impurities present in the supercoiled sample are detected determining the
content of open circular and linear DNA using spiked samples.
LOD [µg injected on column]
based on S:N=3:1 LLOQ [µg injected on column]
based on S:N=10:1
Supercoiled isoform 0.15 0.65
Open circular isoform 0.02 0.06
Linear isoform 0.04 0.05

Method validation for pMCP1 with Propylcarbamoyl quinine modified silica
42
Time [min]0 2 4 6 8 10 12 14 16
Absorbance [mAU]
0
5
10
15
20
25
30
Time [min]0 2 4 6 8 10 12 14 16
Absorbance [mAU]
0
5
10
15
20
25
30
ccc
oc
lin
(a)
(b)
(c)
Time [min]0 2 4 6 8 10 12 14 16
Absorbance [mAU]
0
5
10
15
20
25
30
Time [min]0 2 4 6 8 10 12 14 16
Absorbance [mAU]
0
5
10
15
20
25
30
ccc
oc
lin
(a)
(b)
(c)
Figure 29: Chromatograms of different spiked samples
As it can be seen above, impurities of 0.06 µg (11%) of oc and lin form can be still
detected in the presence of 0.5 µg supercoiled plasmid. Additionally, the calculated
peak area ratio was compared with the recovered ratio.
Table 10: Comparison of injected and recovered peak ratio
Sample no. Injected amount on column Recovered ratio of peak areas
1 47.6% (ccc)
52.4% (oc+lin)
47.8% (ccc)
52.2%(oc+lin)
2 49.5% (ccc)
50.5%(oc+lin)
50% (ccc)
50% (oc+lin)
3 87.7% (ccc)
12.3% (oc+lin)
89.3%(ccc)
10.7%(oc+lin)
As it can be seen in Table 10, the recovered peak area ratios match perfectly with
the injected amounts.
a) sample no 1: 0.5 µg ccc, 0.5 µg oc, 0.05 µg lin
b) sample no 2: 0.5 µg ccc, 0.5 µg oc, 0.01 µg lin
c) sample no 3: 0.5 µg ccc, 0.05 µg oc, 0.01 µg lin

Method validation for pMCP1 with Propylcarbamoyl quinine modified silica
43
Table 11: Calculation of impurities using calibration curves
Sample no Spiked impurities Calculated impurities Recovery
1 0.5 µg ccc
0.55 µg oc+lin
0.44 µg ± 9.2% (ccc)
0.47 µg ± 9.5% (oc+lin)
88% (ccc)
85.5% (oc+lin)
2 0.5 µg ccc
0.51 µg oc+lin
0.40 µg ± 9.9% (ccc)
0.39 µg ± 10% (oc+lin)
80% (ccc)
76.5% (oc+lin)
3 0.5 µg ccc
0.06 µg oc+lin
0.38 µg ± 10%(ccc)
0.05 µg ± 45% (oc, lin)
76% (ccc)
93.3% (oc+lin)
The concentration of impurity was recalculated using the peak area and the
related calibration curve (Figure 22-Figure 24) to demonstrate the suitability of the
validation.
Furthermore, the recovery of supercoiled form existing in the spiked sample
related to the calibration curve of the validation was 81 ± 6%. Furthermore the
calculation of the recovery of the other two isoforms was quite difficult because they
were not separated respectively differentiation between them was not possible
because of the relative low amount of linear besides the oc form. Therefore the both
isoforms were calculated together resulting in a recovery of 85 ± 8%.

Method validation for pMCP1 with TSK-Gel® DNA-NPR
44
7 Method validation for pMCP1 with TSK-Gel® DNA-NPR The 4.9 kb plasmid had to be validated with the commercial available DNA-NPR
stationary phase.
7.1 Equipment and Instruments
The same system as for validation with the PCQ column was used (see chapter 6
Method validation for pMCP1 with Propylcarbamoyl quinine modified silica page 32)
7.2 Method Information
The following method was used was.
Column: TSK-Gel® DNA-NPR (750 x 4.6 mm ID, 2.5 µm)
Buffer A: 20 mM Tris-HCl, pH 9.0
Buffer B: 20 mM Tris-HCl, 1M NaCl, pH 9.0
50 to 75% buffer B in 5 minutes
50% buffer B for 0.5 minutes for re-equilibration
Column temperature: 25°C
Flow rate: 0.7 mL/min
The plasmidic DNA was quantified with a UV diode array detector at 258 nm
whereby 360 nm was used as reference wave length.
7.3 Results and evaluation
Each sample (0.001–7 µg pDNA) was measured at least two times in series and
the measurements were done from the lowest to the highest injected amount to avoid
a carry over.
Linearity Range
In Figure 30-32 chromatograms of ccc, oc and lin isoform are represented with
increasing sample injections. While the ccc form provides reasonable peak shape
over the entire studied concentration range, oc and lin forms reveal poor peak
shapes with splitted peak. Also the linear range is narrower for oc and lin form (see
Table 12-14). Overall the performance in terms of linearity appears to be worse than
for the measurements with PCQ.

Method validation for pMCP1 with TSK-Gel® DNA-NPR
45
a. Chromatograms: All chromatograms were measured with increasing injected amounts to minimize
carry over phenomena. The isoforms were analyzed in following order: ccc, oc, lin.
Supercoiled pDNA
Time [min]
1 2 3 4 5 6
Absorbance [mAU]
0
200
400
600
800
1000
1200
1400
7µg
3µg1µg
0.1µg
0.01µgTime [min]
1 2 3 4 5 6
Absorbance [mAU]
0
200
400
600
800
1000
1200
1400
7µg
3µg1µg
0.1µg
0.01µg
Time [min]2.75 3 3.25 3.5 3.75 4 4.25
Absorbance [mAU]
-10
-8-6
-4
-2
Time [min]2 2.5 3 3.5 4
Absorbance [mAU]
-10-7.5-5-2.502.557.5
0.1 µg ccc
0.01 µg ccc
ccc
Time [min]
1 2 3 4 5 6
Absorbance [mAU]
0
200
400
600
800
1000
1200
1400
7µg
3µg1µg
0.1µg
0.01µgTime [min]
1 2 3 4 5 6
Absorbance [mAU]
0
200
400
600
800
1000
1200
1400
7µg
3µg1µg
0.1µg
0.01µg
Time [min]2.75 3 3.25 3.5 3.75 4 4.25
Absorbance [mAU]
-10
-8-6
-4
-2
Time [min]2 2.5 3 3.5 4
Absorbance [mAU]
-10-7.5-5-2.502.557.5
0.1 µg ccc
0.01 µg ccc
ccc
Figure 30: Stacked chromatograms of the supercoiled isoform (0.01-7 µg)
Time [min]1 2 3 4 5 6
Absorbance [mAU]
0
100
200
300
400
0.01 µg
0.04 µg
0.1 µg
1 µg
Time [min]1 2 3 4 5 6
0
100
200
300
400
Time [min]1 2 3 4 5 6
Absorbance [mAU]
0
100
200
300
400
0.01 µg
0.04 µg
0.1 µg
1 µg
Time [min]1 2 3 4 5 6
0
100
200
300
400
oc
Time [min]2 2.5 3 3.5 4
Absorbance [mAU]
-0.6
-0.4
-0.2
0
0.2
0.4
0.6
0.8
Time [min]
1.5 2 2.5 3 3.5 4 4.5
0
1
2
3
4
Absorbance [mAU]
0.01 µg oc
0.04 µg oc
Time [min]2 2.5 3 3.5 4 4.5 50
2
4
6
8
10
Absorbance [mAU]0.1 µg oc
Time [min]1 2 3 4 5 6
Absorbance [mAU]
0
100
200
300
400
0.01 µg
0.04 µg
0.1 µg
1 µg
Time [min]1 2 3 4 5 6
0
100
200
300
400
Time [min]1 2 3 4 5 6
Absorbance [mAU]
0
100
200
300
400
0.01 µg
0.04 µg
0.1 µg
1 µg
Time [min]1 2 3 4 5 6
0
100
200
300
400
oc
Time [min]2 2.5 3 3.5 4
Absorbance [mAU]
-0.6
-0.4
-0.2
0
0.2
0.4
0.6
0.8
Time [min]
1.5 2 2.5 3 3.5 4 4.5
0
1
2
3
4
Absorbance [mAU]
0.01 µg oc
0.04 µg oc
Time [min]2 2.5 3 3.5 4 4.5 50
2
4
6
8
10
Absorbance [mAU]0.1 µg oc
Figure 31: Stacked chromatograms of the open circular supercoiled isoform (0.01-1 µg)

Method validation for pMCP1 with TSK-Gel® DNA-NPR
46
Time [min]1 2 3 4 5 6
Absorbance [mAU]
0
200
400
600
800
0.01µg
0.1µg
1µg
3µg
Time [min]1 2 3 4 5 6
Absorbance [mAU]
0
200
400
600
800
0.01µg
0.1µg
1µg
3µgTime [min]2 2.5 3 3.5 4 4.5
0
1
2
3
4
5
6
Time [min]2 2.5 3 3.5 4 4.5
Absorbance [mAU]
0
2
4
6
8
10
12
linAbsorbance [mAU]
0.01 µg lin
0.1 µg lin
Time [min]1 2 3 4 5 6
Absorbance [mAU]
0
200
400
600
800
0.01µg
0.1µg
1µg
3µg
Time [min]1 2 3 4 5 6
Absorbance [mAU]
0
200
400
600
800
0.01µg
0.1µg
1µg
3µgTime [min]2 2.5 3 3.5 4 4.5
0
1
2
3
4
5
6
Time [min]2 2.5 3 3.5 4 4.5
Absorbance [mAU]
0
2
4
6
8
10
12
linAbsorbance [mAU]
0.01 µg lin
0.1 µg lin
Figure 32: Stacked chromatograms of the linear isoform (0.01-3 µg)
Figure 30-32 illustrate the linear relation between the peak area and injected
amount for ccc, oc and lin isoform.
b. Calculated calibration curves:
For determination of the linearity range for each isoform the linear relation
between the peak area and injected amount was evaluated.
Table 12: Results of the supercoiled plasmid
The injected amounts 0.001 and 10 µg supercoiled plasmid had to be excluded
because they are beyond the linear dependence of the signal on the concentration.
Thus, the linearity range extends from 0.01 to 7 µg plasmid.
1st measurement 2nd measurement Sample
Inj. amount [µg] tR [min] A [mAU⋅s] tR [min] A [mAU⋅s]
0.001 3.201 2.1 3.20 2.9 0.01 2.94 15.9 2.94 14.7
0.1 2.932 119.5 2.93 124.0 1 2.927 1040.4 2.93 1033.6 3 2.952 3633.4 2.95 3636.4 7 3.007 8574.6 2.99 8824.3
ccc
10 2.983 13544.8 - -

Method validation for pMCP1 with TSK-Gel® DNA-NPR
47
1st measurement
y = 1230.5x - 57.464R2 = 0.9995
02000400060008000
10000
0 1 2 3 4 5 6 7
amount [µg]
peak
are
a [m
AU
*s]
2nd measurement
y = 1265.4x - 85.102R2 = 0.9992
02000400060008000
10000
0 1 2 3 4 5 6 7
amount [µg]
peak
are
a [m
AU
*s]
Figure 33: Calibration curve of the ccc-isoform (0.01-7 µg plasmid)
Table 13: Results of the open circular plasmid
As it can be seen in Table 13 and Figure 34, the response (peak area) of the
injected amounts from 0.01 to 1 µg behave in a linear way thus this concentration
range it can be assumed to be the linearity range.
Figure 34: Calibration curve of the oc-isoform (0.01-1 µg plasmid)
1st measurement 2nd measurement Sample
Inj. amount [µg] tR [min] A [mAU⋅s] tR [min] A [mAU⋅s]
0.001 2.71 1.24 2.72 1.01 0.01 2.72 3.18 2.72 3.41 0.04 2.714 24.32 2.73 26.63 0.1 2.72 58.82 2.73 80.02 1 2.73 838.50 2.73 852.85 3 2.79 1870.48 2.80 1903.01 7 2.84 2112.7 2.82 2681.1
Oc
10 2.80 4933.5 - -
1st measurement
y = 850.86x - 13.418R2 = 0.9995
0200400600800
1000
0 0.2 0.4 0.6 0.8 1
amount [µg]
peak
are
a [m
AU
*s]
2nd measurement
y = 859.1x - 6.2651R2 = 1
0200400600800
1000
0 0.2 0.4 0.6 0.8 1
amount [µg]
peak
are
a [m
AU
*s]

Method validation for pMCP1 with TSK-Gel® DNA-NPR
48
Table 14: Results of the linear plasmid
1st measurement 2nd measurement Sample Inj. amount [µg] tR [min] A [mAU⋅s] tR [min] A [mAU⋅s]
0.001 2.93 9.31 2.92 8.74 0.01 2.92 9.38 2.92 12.39 0.1 2.90 37.84 2.90 38.33 1 2.91 944.10 2.90 928.97 3 2.90 3088.87 2.90 3207.21 7 2.98 6300.03 2.97 6295.18
lin
10 2.96 10623.3 2.96 10508.3
In the range from 0.01 to 3 µg injected plasmid, the resulted peak area
corresponds linearly to the amount.
1st measurement
y = 1040.6x - 49.198R2 = 0.9992
0
1000
2000
3000
0 0.5 1 1.5 2 2.5 3
amount [µg]
peak
are
a [m
AU
*s]
2nd measurement
y = 1080.4x - 63.415R2 = 0.9981
0
1000
2000
3000
0 0.5 1 1.5 2 2.5 3
amount [µg]
peak
are
a [m
AU
*s]
Figure 35: Calibration curve of the lin isoform (0.01-3 µg plasmid)
Determination of the precision (repeatability)
For the definition of precision see page 34.
3 µg of each isoform of pMCP1 were injected 6 times with the DNA-NPR-column
and the precision concerning both peak area and retention time was calculated.
Precision was between 0.8 and 6.4% concerning the peak area with the highest
imprecision for the oc form and 0.2 to 1% concerning the retention time.

Method validation for pMCP1 with TSK-Gel® DNA-NPR
49
Table 15: Calculated precision (peak area) (n=6; 3 µg injected)
Peak area [mAU⋅s]
Average value [mAU⋅s] 3591.2
Standard deviation [mAU⋅s] 28.2 Supercoiled
Relative standard deviation 0.8%
Average value [mAU⋅s] 1847.7
Standard deviation [mAU⋅s] 119 Open circular
Relative standard deviation 6.4%
Average value [mAU⋅s] 3113.5
Standard deviation [mAU⋅s] 64.2 Linear
Relative standard deviation 2.1%
Table 16: Calculated precision (retention time) (n=6; 3 µg injected)
Retention time [min]
Average value [min] 2.95
Standard deviation [min] 0.03 Supercoiled
Relative standard deviation 0.98%
Average value [min] 2.72
Standard deviation [min] 0.01 Open circular
Relative standard deviation 0.20%
Average value [min] 2.90
Standard deviation [min] 0.01 Linear
Relative standard deviation 0.30%
Time [min]2.5 3 3.5 4 4.5
Absorbance [mAU]
0
50
100
150
200
250
300
350
400
Time [min]2.5 3 3.5 4 4.5
Absorbance [mAU]
0
50
100
150
200
250
300
350
400
Figure 36: Chromatograms of precision measurements (3 µg) of ccc plasmid

Method validation for pMCP1 with TSK-Gel® DNA-NPR
50
Time [min]2 2.5 3 3.5 4 4.5
Absorbance [mAU]
0
50
100
150
200
250
300
350
400
450
Time [min]2 2.5 3 3.5 4 4.5
Absorbance [mAU]
0
50
100
150
200
250
300
350
400
450
Figure 37: Chromatograms of precision measurements (3 µg) of oc plasmid
Time [min]2.25 2.5 2.75 3 3.25 3.5 3.75 4
Absorbance [mAU]
0
50
100
150
200
250
300
350
400
Time [min]2.25 2.5 2.75 3 3.25 3.5 3.75 4
Absorbance [mAU]
0
50
100
150
200
250
300
350
400
Figure 38: Chromatograms of precision measurements (3 µg) of lin plasmid
Figure 36-38 show the repeatability of the used method as well as the poor peak
shape (splitted peaks). Furthermore, by comparing the retention times of linear and
ccc form, it is obvious that they coelute as a result of insufficient selectivity.
Determination of the Recovery of the open circular isoform To determine the recovery, the peak areas over the concentration range of 0.01
µg to 3 µg pDNA are compared to those of the linear isoform. The average recovery
of the oc pDNA related to the linear isoform in a concentration range from 0.01 µg to
3 µg DNA is 60 ± 28% (1st measurement: 61 ± 29%, 2nd measurement: 60 ± 28%),
whereas the precision measurements (at 3 µg) deliver 51 ± 6% recovery.

Method validation for pMCP1 with TSK-Gel® DNA-NPR
51
Table 17: Summary of calculated recoveries
Recovery Concentration rage: 1st measurement 2nd measurement Average value
0.01 to 3 µg 61 ± 29% 60 ± 28% 60 ± 28%
3 µg
(precision measurements) 51 ± 6%
Determination of the Limit of Detection / Limit of Quantification Irreversibly adsorbed analyte can cause an absorption signal which has to be
subtracted from the measured signal. This additional peak area was set as blank
value or so-called noise.
Limit of Detection (LOD)
For the definition of Limit of Detection (LOD) see page 37.
Lower Limit of Quantification (LLOQ)
For the definition of Lower Limit of Quantification see page 38.
As can be seen from Table 18, the LOD is about 0.3 to 0.4 µg and the LLOQ
between 0.04 and 0.1 µg on column for all isoforms.
Table 18: Summary of LOD (S:N = 3:1) and LOQ (S:N = 10:1)
LOD [µg on column] Based on S:N=3:1
LLOQ [µg on column] Based on S:N=10:1
Supercoiled pDNA 0.3 0.7
Open circular pDNA 0.3 0.7
Linear pDNA 0.4 1.5
The values for both limits had to be calculated using the calibration curves for
each isoform, because the limits were located between two injected amounts: 0.1 - 1
µg for ccc and oc and 1 - 3 µg linear form.
Upper Limit of Quantification (ULOQ)
For the definition of Upper Limit of Quantification (ULOQ) see page 38.

Method validation for pMCP1 with TSK-Gel® DNA-NPR
52
The ULOQ is determined by the highest injected amount which is still in the linear
range. Hence the ULOQ of the supercoiled isoform corresponds to 7 µg, of the open
circular isoform to 1 µg and of the linear isoform to 3 µg.

Comparison of method performance of propylcarbamoyl quinine modified silica and
TSK-Gel® DNA-NPR material
53
8 Comparison of method performance of propylcarbamoyl quinine modified silica and TSK-Gel® DNA-NPR material
8.1 Results: Summary and Comparison
The novel method for pDNA analysis based on the PCQ column is supposed to
replace the state-of-the-art method employing the DNA-NPR column if the method
characteristics outperforms the one of the better. Hence, the results of the method
validations are summarized and compared again.
Linearity Range
In Table 19 above, an overview of the linearity ranges of PCQ respectively DNA-
NPR for each isoform is given.
Table 19: Comparison of linearity ranges and coefficient of determination
PCQ DNA-NPR
ccc 0.1 – 7 µg
R² 0.9985
0.01 – 7 µg R² 0.9994
oc 0.04 – 7 µg
R² 0.9962
0.01 – 1 µg
R² 0.9998
lin 0.04 – 7 µg
R² 0.9999
0.01 – 3 µg
R² 0.9987
The data show that the linearity range is equal or slightly wider for DNA-NPR.
However, the possible sample loading of plasmid DNA of the new propylcarbamoyl
quinine modified silica is higher compared to the commercial available column. Thus
the chromatographic material is more suitable for semi-preparative applications.
Peak area and retention time precision Six measurements of 3 µg plasmid (ccc, oc, lin) were performed with both
columns and compared in Table 20.

Comparison of method performance of propylcarbamoyl quinine modified silica and
TSK-Gel® DNA-NPR material
54
Table 20: Comparison of peak area precision (n=6; 3µg injected)
PCQ DNA-NPR
ccc 0.6% 0.78%
oc 0.8% 6.4%
lin 1.5% 2.1%
Table 21: Comparison of retention time precision (n=6; 3µg injected)
PCQ DNA-NPR
ccc 0.07% 0.98%
oc 1.25% 0.20%
lin 0.06% 0.30%
The precision represents the variation of the signal (peak area or retention time)
at a certain amount of pDNA. As can be seen from Table 20 and Table 21 the PCQ
material yielded better precisions than the DNA-NPR material. This conclusion
applies for all three isoforms, especially for the oc isoform being the most prominent
and critical impurity.
Recovery of oc isoform (related to the linear isoform) In following table, the recoveries of the PCQ and DNA-NPR column are
illustrated.
Table 22: Comparison of oc recovery
PCQ DNA-NPR
112 ± 9% (0.1-10 µg) 60 ± 28% (0.01-3 µg)
119 ± 2% (3 µg) 51 ± 6% (3 µg)
The recovery of the oc isoform is better in the case of the PCQ material compared
to the DNA-NPR. A part of the oc form, when injected onto the Tosoh material, does
not elute from the column under the chosen conditions. With DNA-NPR the recovery
was only ~ 60% in the concentration range from 0.01 – 3 µg and ~ 50% at 3µg
injections, while the recovery was quantitative with the PCQ column was between
112 and 119%.

Comparison of method performance of propylcarbamoyl quinine modified silica and
TSK-Gel® DNA-NPR material
55
Sensitivity The detection limit (LOD) and the quantification limit (LOQ) were determined
according to the signal to noise ratio 3:1 and 10:1.
Table 23: Comparison of LOD, LLOQ and ULOQ (µg pDNA injected on column)
PCQ DNA-NPR
LOD 0.15 µg 0.3 µg
LLOQ 0.65 µg 0.7 µg
ccc
ULOQ 10 µg 7 µg
LOD 0.02 µg 0.3 µg
LLOQ 0.06 µg 0.7 µg
oc
ULOQ 7 µg 1 µg
LOD 0.04 µg 0.4 µg
LLOQ 0.05 µg 1.5 µg
lin
ULOQ 7 µg 3 µg
As it can be seen from Table 23, the detection and quantification limits were
better using the PCQ than the DNA-NPR column. Thus using the modified quinine
silica material, lower amounts and therefore lower contents of impurities can be
detected and quantified. Based on these results it may be concluded that the quinine
material shows better performance in impurity determinations of plasmidic DNA.
8.2 Conclusion
The in-house produced and packed quinine modified column should be favoured
for analytical purposes based on the results above. It is evident that the quantification
performance as well as the selectivity is slightly better compared to the TSK® gel
DNA-NPR column. With the better, only a slight separation of oc and ccc form can be
seen in the chromatogram of spiked samples. Nevertheless, the Tosoh DNA-NPR
can not separate the lin and ccc isoform which is the biggest disadvantage.
In sharp contrast, the PCQ phase shows large separation factors both between oc
and ccc as well as between linear and ccc forms. However, the linear and oc form
coelute in case of the 4.5 kbp plasmid of pMCP1. Hence, the determined impurity
represents the summ of oc and lin form. All those parameters confirm that for
validation of smaller plasmids (molecular size around 5 kb) the new, self-prepared
material has a greater benefit.

Method validation for pGNA3 with propylcarbamoyl quinine modified silica
56
9 Method validation for pGNA3 with propylcarbamoyl quinine modified silica
9.1 Preparation and verification of the oc standard
In the case of the pGNA3 (14.9 kbp), a treatment of different temperatures (35 to
55°C) for different time periods (up to 65 hours) was carried out but without satisfying
results. In a first set of experiments there was almost no transformation of ccc to the
oc isoforms, whereas in a second set of experiments a mixture of different forms or
fragments of DNA arose from the supercoiled isoform resulting in a broad peak. To
avoid degradation of the DNA, 55°C was found to be the highest temperature which
should be used for the oc preparation.
Figure 39: Chromatogram of different temperature treated ccc pGNA3
Due to the lack of success with temperature induced nicking, an enzymatic
reaction for producing the open circular isoform was used. Because of the base
sequence there are 21 possible cuts when using the Nt.BstNBI enzyme (see page
28), which results in a diversity of open circular isoforms. When using this enzyme it
is necessary to find the optimum of incubation time and enzyme units per µg ccc
pDNA to be sure that the transformation to the oc isoform is completed. To produce
an open circular isoform similar to the natural one with one single strand break the
Column: propylcarbamoyl-quinine PCQ (based on Kromasil, 100 Å, 5 µm) Column dimension: 150 x 4 mm ID
Buffer A: 50 mM phosphate, pH 7.2, Buffer B: A + 20% IPA, pH 7.9, 0-100% buffer B in 15 min, column temperature: 60°C, flow rate: 0.7 mL/min
time [min]4 5 6 7 8 9 10
Absorbance [mAU*min].
0
100
200
300
400
500
600
700
pGNA3 45h at 35°CpGNA3 65h at 35°CpGNA3 24h at 55°C
time [min]4 5 6 7 8 9 10
Absorbance [mAU*min].
0
100
200
300
400
500
600
700
pGNA3 45h at 35°CpGNA3 65h at 35°CpGNA3 24h at 55°C
ccc
oc lin

Method validation for pGNA3 with propylcarbamoyl quinine modified silica
57
digestion has to be incomplete; otherwise several nicks in the DNA strain would
occur.
Definition of one unit: “One unit is defined as the amount of enzyme required to
digest 1 µg T7 DNA (substrate for assaying the activity because of the proximity of
GAGTC sequences) in 1 hour at 55°C in a total reaction volume of 50 µL”
(http://www.neb.com).
To stop this reaction the enzyme has to be inactivated. Therefore either the
solution has to be heated to 80°C for 20 minutes or by adding EDTA. The higher the
incubation temperature, the more fragments are produced hence the prepared
sample has to be purified. All parameters concerning this enzymatic reaction have to
be optimized for each molecule because it depends on the molecule size and its
sequence. The NE buffer 3 (100 mM NaCl, 50 mM Tris-HCl, 10 mM MgCl2, 1 mM
Dithiothreitol, pH 7.9) provided from New England Biolabs ensures optimal activity
(100%) of the enzyme.
Test series with 0.01, 0.1 and 1 Unit enzyme per µg pDNA and with different
incubation times (1-10 min) at 40°C were carried out. The enzymatic reactions were
stopped with 10 mM EDTA and afterwards checked with AGE. It was observed that 1
Unit enzyme per µg DNA and 1 minute incubation time are the best choice, because
the entire supercoiled plasmid is changed to the open circular isoform and only a little
amount of linear plasmid is generated. Subsequently, the mixture (1 U/µg pDNA, ccc
pDNA, NE buffer 3) was incubated for 1 minute at 40°C by using a thermo mixer
(Eppendorf) and then the enzymatic reaction was stopped by adding 10 mM EDTA.
The successful generation of open circular plasmid was verified with AGE and then
isolated with HPLC (PCQ, 150 x 4 mm ID column).

Method validation for pGNA3 with propylcarbamoyl quinine modified silica
58
Table 24: Summary of test series
Unit enzyme/ µg pDNA Incubation time [min] Temperature [°C] EDTA (c=10 mM)
0.01 1 40 75 µL
0.01 5 40 75 µL
0.01 10 40 75 µL
0.1 1 40 75 µL
0.1 5 40 75 µL
0.1 10 40 75 µL
1 1 40 75 µL
1 5 40 75 µL
1 10 40 75 µL
oc
ccc
enzyme
EDTA
time [min]2 4 6 8 10 12
Absorbance [mAU]
0
20
40
60
80
100
120
140
160
oc
ccc
enzyme
EDTA
time [min]2 4 6 8 10 12
Absorbance [mAU]
0
20
40
60
80
100
120
140
160
oc
ccc
enzyme
EDTA
time [min]2 4 6 8 10 12
Absorbance [mAU]
0
20
40
60
80
100
120
140
160
oc
ccc
enzyme
EDTA
time [min]2 4 6 8 10 12
Absorbance [mAU]
0
20
40
60
80
100
120
140
160
Figure 40: Chromatogram after the enzymatic reaction
Peak areas used for the calibration curve were monitored without column
because of irrelevant retention times. The signals from the calibration standards (ccc)
were compared with the signal of the oc form concluding its concentration. However,
ccc form was used as standards because of its good recovery.
Column: Propylcarbamoyl quinine PCQ (based on Kromasil, 100 Å, 5 µm) Column dimension: 150 x 4 mm ID
Buffer A: 50 mM phosphate, pH 7.2, Buffer B: A + 20% IPA, pH 7.9, 0-100% buffer B in 15 min, column temperature: 60°C, flow rate: 0.7 mL/min

Method validation for pGNA3 with propylcarbamoyl quinine modified silica
59
y = 1.7626x + 22.851R2 = 0.9882
0
200
400
600
800
1000
1200
0 100 200 300 400 500 600 700Concentration [ng/µL]
Peak
area
[mA
U*s
]
y = 1.7626x + 22.851R2 = 0.9882
0
200
400
600
800
1000
1200
0 100 200 300 400 500 600 700Concentration [ng/µL]
Peak
area
[mA
U*s
]
Figure 41: Calibration curve of ccc form (pGNA3)
Table 25: Calibration curve and the calculation of the oc concentration
Concentration [ng/µL] Injected amount [ng] Peakarea [mAU*min]214 642 1210.5157 471 692.228.5 85.6 106.44.3 12.8 51.12.1 6.4 13.9
oc sample51.9 156.0 297.2
As can be seen in Figure 41 and Table 25 a concentration of 51.9 ng/µL oc
plasmid based on the ccc isoform calibration curve was determined.
Figure 42: Agarose gel for the verification of the oc standard
0.75% agarose, 1x TBE buffer, applied voltage: 120V for 3 hours, Staining: 20µL Sybr gold® (provided from Invitrogen) in gel
ccc oc lin
oc (isoliert)
c(oc) = 51.9 ng/µL

Method validation for pGNA3 with propylcarbamoyl quinine modified silica
60
Figure 42 depicts the AGE gel of the isolated oc standard. It can be seen that the
prepared oc standard contains no supercoiled pDNA and only a small amount of the
linear isoform. As a result, the conditions used for the enzymatic reaction (1U/µg
pDNA, 1 min at 40°C) were confirmed to be practicable.
9.2 Equipment and Instruments
The same system as for the previous validation was used (see chapter 6 Method
validation for pMCP1 with Propylcarbamoyl quinine modified silica page 32).
9.3 Method Information
For the separation of the isoforms the standard gradient for propylcarbamoyl
quinine modified silica material was used:
Column: Propylcarbamoyl quinine on Kromasil 5 µm
100 Å, TMS endcapped
Buffer A: 50 mM phosphate, pH 7.2
Buffer B: 50 mM phosphate, pH 7.9, 20% IPA
0 to 100% buffer B in 15 minutes
Column temperature: 60°C
Flow rate: 0.7 mL/min
The plasmidic DNA was quantified with a UV diode array detector at 258nm. As
reference wave length, 360 nm was used.
9.4 Results and evaluation
Amounts from 0.001 to 10 µg pDNA were measured whereby each measurement
was repeated at least once.
Linearity Range Increasing quantities of each plasmid isoform were injected (see Figure 43-45) and
the resultant peak areas plotted against the injected amount to obtain calibration
functions as shown in Figure 46-48). The range where this calibration function is
linear was determined and the results are given in Table 26-28). As can be seen from
Figure 44, the oc form splits into two peaks and for the calibration function the peak

Method validation for pGNA3 with propylcarbamoyl quinine modified silica
61
area of the sum of these two peaks was utilized. Linear ranges were found between
0.04 – 10 µg (ccc, lin) and 0.01 – 3 µg (oc). It is also seen that the repeatability of the
calibration function is satisfactory.
a. Chromatograms Supercoiled pDNA
Time [min]2.5 5 7.5 10 12.5 15
Absorbance [mAU]
0
100
200
300
400
0.04µg0. 1µg
1µg3µg
7µg10µg
Time [min]2.5 5 7.5 10 12.5 15
Absorbance [mAU]
0
100
200
300
400
0.04µg0. 1µg
1µg3µg
7µg10µg
Absorbance [mAU]
Time [min]8 10 12
0.5
0
0.5
1
Time [min]
8 10 12 14-1
0
1
2
3
Absorbance [mAU]
ccc
oc
0.04 µg ccc
0.1 µg ccc
Time [min]2.5 5 7.5 10 12.5 15
Absorbance [mAU]
0
100
200
300
400
0.04µg0. 1µg
1µg3µg
7µg10µg
Time [min]2.5 5 7.5 10 12.5 15
Absorbance [mAU]
0
100
200
300
400
0.04µg0. 1µg
1µg3µg
7µg10µg
Absorbance [mAU]
Time [min]8 10 12
0.5
0
0.5
1
Time [min]
8 10 12 14-1
0
1
2
3
Absorbance [mAU]
ccc
oc
0.04 µg ccc
0.1 µg ccc
Figure 43: Stacked chromatograms of the supercoiled isoform (0.04-10 µg pDNA)
Open circular pDNA
Time [min]2.5 5 7.5 10 12.5 15 17.5 20
Absorbance [mAU]
0
20
40
60
80
0.01 µg0.02 µg
0.04 µg0.1 µg
1 µg
3 µg
100
Time [min]2.5 5 7.5 10 12.5 15 17.5 20
Absorbance [mAU]
0
20
40
60
80
0.01 µg0.02 µg
0.04 µg0.1 µg
1 µg
3 µg
100
Time [min]2 4 6
0
1
Time [min]2 4 6 8
0
0.2
0.4
0.6
0.8
Time [min]2 4 6 8
Absorbance [mAU]
0
0.5
1
1.5
Absorbance [mAU]
0.5
Absorbance [mAU]
0.01 µg oc
0.02 µg oc
0.04 µg oc
oc
Time [min]2.5 5 7.5 10 12.5 15 17.5 20
Absorbance [mAU]
0
20
40
60
80
0.01 µg0.02 µg
0.04 µg0.1 µg
1 µg
3 µg
100
Time [min]2.5 5 7.5 10 12.5 15 17.5 20
Absorbance [mAU]
0
20
40
60
80
0.01 µg0.02 µg
0.04 µg0.1 µg
1 µg
3 µg
100
Time [min]2 4 6
0
1
Time [min]2 4 6 8
0
0.2
0.4
0.6
0.8
Time [min]2 4 6 8
Absorbance [mAU]
0
0.5
1
1.5
Absorbance [mAU]
0.5
Absorbance [mAU]
0.01 µg oc
0.02 µg oc
0.04 µg oc
oc
Figure 44: Stacked chromatograms of the open circular isoform (0.01-3 µg pDNA)

Method validation for pGNA3 with propylcarbamoyl quinine modified silica
62
Linear pDNA
Time [min]5 10 15
Absorbance [mAU]
0
50
100
150
200
250
300
350
10µg
7µg3µg
1µg
0.1µg
0.04µg
2.5 7.5 12.5Time [min]
5 10 15
Absorbance [mAU]
0
50
100
150
200
250
300
350
10µg
7µg3µg
1µg
0.1µg
0.04µg
10µg
7µg3µg
1µg
0.1µg
0.04µg
2.5 7.5 12.5
Time [min]4 6 8 10 12
Absorbance [mAU]
0
0.5
1
1.5
2
0.04 µg linTime [min]6 8 10
Absorbance [mAU]
0
1
2
3
4
0
1
2
3
40.1 µg lin
lin
Time [min]5 10 15
Absorbance [mAU]
0
50
100
150
200
250
300
350
10µg
7µg3µg
1µg
0.1µg
0.04µg
2.5 7.5 12.5Time [min]
5 10 15
Absorbance [mAU]
0
50
100
150
200
250
300
350
10µg
7µg3µg
1µg
0.1µg
0.04µg
10µg
7µg3µg
1µg
0.1µg
0.04µg
2.5 7.5 12.5
Time [min]4 6 8 10 12
Absorbance [mAU]
0
0.5
1
1.5
2
0.04 µg linTime [min]6 8 10
Absorbance [mAU]
0
1
2
3
4
0
1
2
3
40.1 µg lin
Time [min]6 8 10
Absorbance [mAU]
0
1
2
3
4
0
1
2
3
40.1 µg lin
lin
Figure 45: Stacked chromatograms of the linear isoform (0.04-10 µg pDNA)
In Figure 43-45 the linear correlation between the injected amount and resulting
peak area can be seen for each isoform, whereby low concentrations are enlarged.
b. Calculated calibration curves
The linearity ranges were calculated by plotting peak areas against injected
amounts. The concentration range with minimal coefficient of determination was
determined.
Table 26: Results of the ccc plasmid
1st measurement 2nd measurement Sample Inj. amount [µg] tR [min] A [mAU⋅s] tR [min] A [mAU⋅s]
0.001 - - - - 0.01 9.72 25.1 9.69 23.8 0.02 9.56 35.2 9.53 333 0.04 9.49 51.1 9.56 40.6 0.1 9.55 134.6 9.50 121.4 1 9.4 1366.1 9.40 1373.6 3 9.46 4302.2 9.45 4361.1 7 9.33 10615.6
outlier 9.33 11080.9
outlier
ccc
10 9.28 13395.9 9.26 13555.6

Method validation for pGNA3 with propylcarbamoyl quinine modified silica
63
1st measurement
y = 1339.7x + 61.399R2 = 0.9995
02000400060008000
100001200014000
0 1 2 3 4 5 6 7 8 9 10
amount [µg]
peak
are
a [m
AU
*s]
2nd measurement
y = 1356.9x + 53.13R2 = 0.9994
02000400060008000
100001200014000
0 1 2 3 4 5 6 7 8 9 10
amount [µg]
peak
are
a [m
AU
*s]
Figure 46: Calibration curve of the ccc-isoform (0.04-10 µg plasmid)
Table 27: Results of the oc plasmid
1st measurement 2nd measurement Sample Inj. amount [µg] tR [min] A [mAU⋅s] tR [min] A [mAU⋅s]
0.001 - - - - 0.01 4.41 14.9 4.34 10.8 0.02 4.29 13.5 4.36 14.7 0.04 4.23 42.4 4.22 51.9 0.1 4.08 103.2 4.04 103.3 0.3 2.69 206.9 2.59 209.5 1 3.72 1535.3 3.65 1533.57
oc
3 3.35 5188.6 3.15 5452.5
1st measurement
y = 1743.8x - 98.584R2 = 0.9962
010002000300040005000
0 0.5 1 1.5 2 2.5 3
amount [µg]
peak
are
a [m
AU
*s]
2nd measurement
y = 1829.1x - 114.23R2 = 0.9951
010002000300040005000
0 0.5 1 1.5 2 2.5 3
amount [µg]
peak
are
a [m
AU
*s]
Figure 47: Calibration curve of the oc-isoform (0.01-3 µg plasmid)

Method validation for pGNA3 with propylcarbamoyl quinine modified silica
64
Table 28: Results of the lin plasmid
1st measurement 2nd measurement Sample Inj. amount [µg] tR [min] A [mAU⋅s] tR [min] A [mAU⋅s]
0.001 - - - - 0.01 7.13 141.2 7.11 81.5 0.02 7.13 125.9 7.13 96.1 0.04 7.03 97.2
outlier 7.03 66.4
0.1 7.05 105.4 7.04 105.3 1 7.09 1311.2 7.13 1345.1 3 7.31 4147.1 7.37 3980 7 7.33 8492.5 7.32 8282.5
lin
10 7.34 12750.3 7.37 12788.1
1st measurement
y = 1251.9x + 78.453R2 = 0.9977
0250050007500
1000012500
0 1 2 3 4 5 6 7 8 9 10
amount [µg]
peak
are
a [m
AU
*s]
2nd measurement
y = 1248.7x + 28.295R2 = 0.9973
0250050007500
1000012500
0 1 2 3 4 5 6 7 8 9 10
amount [µg]
peak
are
a [m
AU
*s]
Figure 48: Calibration curve of the lin-isoform (0.04-10 µg plasmid)
In Figure 46-48 the resulting calibration curves are represented.
Determination of the precision (repeatability) For the definition of precision see page 34.
0.1 µg of the lin and oc isoform and 3 µg of the ccc isoform were injected 6 times
into the quinine modified silica column and the precision of the peak area and the
retention time was calculated. Determined precisions between 0.7 and 6.9% using
peak areas and 0.20 and 0.41% using retention times indicate an adequate
repeatability, especially for ccc and linear isoform. The largest imprecision was found
for the oc form which in any way is the most critical isoform.

Method validation for pGNA3 with propylcarbamoyl quinine modified silica
65
Table 29: Calculated precision (peak area) (n=6; 0.1 resp. 3 µg injected)
Peak area [mAU⋅s]
Average value [mAU⋅s] 4312.4
Standard deviation [mAU⋅s] 29.3 Supercoiled pDNA
Relative standard deviation 0.7%
Average value [mAU⋅s] 97.0
Standard deviation [mAU⋅s] 6.7 Open circular pDNA
Relative standard deviation 6.9%
Average value [mAU⋅s] 103.6
Standard deviation [mAU⋅s] 2.6 Linear pDNA
Relative standard deviation 2.5%
Table 30: Calculated precision (retention time) (n=6; 0.1 resp. 3 µg injected)
Retention time [min]
Average value [min] 9.43
Standard deviation [min] 0.02 Supercoiled pDNA
Relative standard deviation 0.20%
Average value [min] 3.99
Standard deviation [min] 0.07 Open circular pDNA
Relative standard deviation 1.86%
Average value [min] 7.05
Standard deviation [min] 0.03 Linear pDNA
Relative standard deviation 0.41%
Time [min]2 4 6 8 10 12 14
Absorbance [mAU]
0
20
40
60
80
Time [min]2 4 6 8 10 12 14
Absorbance [mAU]
0
20
40
60
80
Figure 49: Chromatograms of precision measurements (3 µg) of ccc plasmid

Method validation for pGNA3 with propylcarbamoyl quinine modified silica
66
Time [min]2 4 6 8 10
Absorbance [mAU]
0
0.5
1
1.5
2
2.5
3
Time [min]2 4 6 8 10
Absorbance [mAU]
0
0.5
1
1.5
2
2.5
3
Figure 50: Chromatograms of precision measurements (0.1 µg) of oc plasmid
Time [min]2 4 6 8 10 12 14
Absorbance [mAU]
-1
0
1
2
3
4
Time [min]2 4 6 8 10 12 14
Absorbance [mAU]
-1
0
1
2
3
4
Figure 51: Chromatograms of precision measurements (0.1 µg) of lin plasmid
These chromatograms (Figure 49-51) show that all three isoforms are separated
from each other. However, it is very difficult to assign the open circular plasmid which
shows two main peaks to a certain peak. There is no proof if both peaks belong to
the open circular plasmid, but the agarose electrophoresis showed that there is just
one isoform in this sample. One explanation for this phenomenon could be that they
both have the open circular shape but different nicking in their DNA strands as a
result of the enzymatic treatment. Another possibility would be that sample is not
pure and it still contains fragments or other impurities eluting approximately at the
same time, being not detectable by the used AGE method.
By comparing peak areas of the oc form with the other isoforms it can be seen
that they are too low. Thus either a dilution error or an error during the concentration
determination of the oc standard occurred. One explanation would be, that the
standards (ccc) for determination of concentration of the oc standard were too
concentrated causing an imprecisely result for the oc-sample.
Furthermore the propylcarbamoyl quinine column broke down during the
validation hence the test series of linear and supercoiled pDNA were measured with

Method validation for pGNA3 with propylcarbamoyl quinine modified silica
67
a new column (same batch stationary phase). For comparing the columns, all three
isoforms were injected and they all showed the same retention time in both columns.
As a consequence, only the open circular isoform was measured with the “old”
column whereas the “new” column was used for the other two isoforms.
Determination of the Recovery of the open circular Isoform The average recovery of the oc pDNA related to the linear isoform in a
concentration range from 0.04 µg to 3 µg DNA is 102 ± 31% (1st measurement: 96 ±
38%, 2nd measurement: 107 ± 23%), whereas the precision measurements (at 0.1
µg) deliver a recovery of 91 ± 10%.
Table 31: Summary of calculated recoveries
Recovery Concentration rage: 1st measurement 2nd measurement Average value
0.04 to 3 µg 96 ± 38% 107 ± 23% 102 ± 31%
0.1 µg
(precision measurements) 91 ± 10%
Determination of the Limit of Detection / Limit of Quantification Both parameters, Limit of detection and quantification are important values to
describe the suitability of a method for a certain concentration range.
Limit of Detection (LOD)
For the definition of Limit of Detection (LOD), see page 37. Lower Limit of Quantification (LLOQ)
For the definition of Lower Limit of Quantification (LLOQ), see page 38.
Table 32: Summary of LOD (S:N = 3:1) and LOQ (S:N = 10:1)
LOD [µg injected on column] Based on S:N=3:1
LLOQ [µg injected on column] Based on S:N=10:1
Supercoiled pDNA 0.02 0.04
Open circular pDNA 0.01 0.02
Linear pDNA 0.01 0.04

Method validation for pGNA3 with propylcarbamoyl quinine modified silica
68
As can be seen in Table 32 the LOD is between 0.01 (oc, lin) and 0.02 µg (ccc)
and the LLOQ between 0.02 (oc) and 0.04 µg (ccc, lin).
Upper Limit of Quantification (ULOQ)
For the definition of Upper Limit of Quantification (ULOQ), see page 38.
The ULOQ of the supercoiled and the linear isoform corresponds to 10 µg whereas
the upper limit of the open circular isoform is 1 µg.
Determination of Impurities For measuring impurities, the amount of open circular and linear DNA in the
presence of the supercoiled isoform is detected.
time [min]2 4 6 8 10 12 14 15
Absorbance [mAU]
0
10
20
30
40
50
60
70
80
a)b)
c)
d)
time [min]2 4 6 8 10 12 14 15
Absorbance [mAU]
0
10
20
30
40
50
60
70
80
a)b)
c)
d)oc
ccc
lin
time [min]2 4 6 8 10 12 14 15
Absorbance [mAU]
0
10
20
30
40
50
60
70
80
a)b)
c)
d)
time [min]2 4 6 8 10 12 14 15
Absorbance [mAU]
0
10
20
30
40
50
60
70
80
a)b)
c)
d)oc
ccc
lin
Figure 52: Chromatograms of different spiked samples
As it can be seen in Figure 52 even 5% oc impurity can be detected next to
supercoiled pDNA. However, in Table 33 the recovered impurities calculated from
peak ratio of isoforms is compared with the spiked impurities. It can be seen that the
linear isoform is prominent in each sample and that the oc could be recovered
satisfactory in all spiked samples.
a) sample no 1: 0.1 µg oc, 2 µg ccc
b) sample no 2: 0.2 µg oc, 2 µg ccc
c) sample no 3: 0.27 µg oc, 1.33 µg ccc
d) sample no 4: 0.27 µg oc, 1.33 µg ccc, 0.2 µg lin

Method validation for pGNA3 with propylcarbamoyl quinine modified silica
69
Table 33: Comparison of spiked and recovered impurities (peak ratio)
Sample no Spiked impurities Recovered impurities
1 5% oc 7% oc
8% lin
2 10% oc 5.1% oc
8.5% lin
3 17% oc 12% oc
8% lin
4 15% oc
11% lin
13% oc
14% lin
Furthermore, enlargement of chromatogram d (Figure 53) shows that there are
always two overlapping peaks at tR ≈ 6 min. Both peaks have an UV DNA spectrum.
One explanation for this phenomenon could be that a small amount of natural oc
form was formed which had a similar retention time to the linear form.
time [min]4 6 8 10
Absorbance [mAU]
0
10
20
30
40
time [min]4 6 8 10
Absorbance [mAU]
0
10
20
30
40
natural oc ? lin
ccc
time [min]4 6 8 10
Absorbance [mAU]
0
10
20
30
40
time [min]4 6 8 10
Absorbance [mAU]
0
10
20
30
40
natural oc ? lin
ccc
Figure 53: Enlargement of chromatogram d
Figure 53 shows that there are two overlapping peaks whereby the second one
represents the spiked linear isoform. It is obvious that the first peak is the natural oc
because this peak is present in nearly every supercoiled plasmid (pGNA3) sample
and shows similar retention behaviour as the linear isoform. On the contrary the
isolated, enzymatically produced oc isoform has significantly less retention on the
PCQ modified silica support.

Method validation for pGNA3 with propylcarbamoyl quinine modified silica
70
Furthermore, the recovery was calculated using the calibration curves for each
isoform.
Table 34: Calculation of impurities using calibration curves
Sample no Spiked impurities Calculated impurities Recovery
1
2 µg ccc
0.1 µg oc
1.1 µg ± 0.6% ccc
0.2 µg ± 4.3% oc
0.07 µg ± 43% lin
55% ccc
200% oc
-
2
2 µg ccc
0.2 µg oc
1.3 µg ± 0.6% ccc
0.2 µg ± 3.6% oc
0.1 µg ± 28.6% lin
65% ccc
100% oc
-
3
1.33 µg ccc
0.27 µg oc
0.9 µg ± 0.5% ccc
0.24 µg ± 2.4% oc
0.05 µg ± 60% lin
68% ccc
89% oc
-
4
1.33 µg ccc
0.27 µg oc
0.2 µg lin
0.85 µg ± 0.5% ccc
0.25 µg ± 2.2% oc
0.12 µg ± 25% lin
64% ccc
93% oc
60% lin
As it can be seen above, the recovery was ~63% for the supercoiled isoform and
about 121% for the open circular isoform. Moreover, linear isoform was present in
each spiked sample.

Method validation for pGNA3 with TSK-Gel® DNA-NPR
71
10 Method validation for pGNA3 with TSK-Gel® DNA-NPR
The measurements are performed using the same conditions as for the validation
of the pMCP1 but there was no elution of the open circular isoform. This isoform is
the most important impurity when working with supercoiled pDNA hence this column
can not be employed for this study. Nevertheless, method validation of ccc and linear
form was performed using DNA-NPR material provided from Tosoh Bioscience.
1 2 3 4 5
Absorbance [mAU]
0
20
40
60
80
100
1 2 3 4 50
20
40
6080
100
120
140
160
Supercoiled pDNA
Open circular pDNA
Time [min]1 2 3 4 5
0
10
20
30
linear pDNA
1 2 3 4 5
Absorbance [mAU]
0
20
40
60
80
100
1 2 3 4 50
20
40
6080
100
120
140
160
Supercoiled pDNA
Open circular pDNA
Time [min]1 2 3 4 5
0
10
20
30
linear pDNA
Figure 54: Comparison of the chromatograms of all different isoforms
(each 1 µg pDNA)
10.1 Preparation of the oc standard
For this method validation, the same self-prepared oc standards as for the method
validation with PCQ material (see Method validation for pGNA3 with propylcarbamoyl
quinine modified silica , page 56) was used.
No QN or DNA spectrum

Method validation for pGNA3 with TSK-Gel® DNA-NPR
72
10.2 Equipment and Instruments
The same system as for the previous validation was used (see chapter 6 Method
validation for pMCP1 with Propylcarbamoyl quinine modified silica page 32).
10.3 Method Information
Plasmid samples were analyzed using following method:
Column: TSK-Gel® DNA-NPR (750 x 4.6 mm ID, 2.5 µm)
Buffer A: 20 mM Tris-HCl, pH 9.0
Buffer B: 20 mM Tris-HCl, 1M NaCl, pH 9.0
50 to 75% buffer B in 5 minutes
50% buffer B for 0.5 minutes for re-equilibration
Column temperature: 25°C
Flow rate: 0.7 mL/min
The plasmidic DNA was quantified with a UV diode array detector at 258nm. As
reference wave length 360 nm was used.
10.4 Results and evaluation
Amounts from 0.1 to 3 µg plasmidic DNA were measured and evaluated.
10.5 Linearity range
Chromatograms of linear and supercoiled plasmid were measured using
increasing quantities from 0.1 to 3 µg pDNA and the linear relation of injected
amounts and resulting peak areas was determined. Both isoforms (ccc, lin) showed a
linear correlation over the entire concentration range (0.1 – 3 µg).

Method validation for pGNA3 with TSK-Gel® DNA-NPR
73
a. Chromatograms
Supercoiled pDNA
Time [min]1 2 3 4 5 6 7
Absorbance [mAU]
0
100
200
300
400
500
0.1 µg
0.5 µg1 µg
3 µg
Time [min]1 2 3 4 5 6 7
Absorbance [mAU]
0
100
200
300
400
500
0.1 µg
0.5 µg1 µg
3 µg
Figure 55: Stacked chromatograms of the supercoiled isoform (0.1-3 µg)
Linear pDNA
Time [min]0 1 2 3 4 5 6 7
Absorbance [mAU]
0
25
50
75
100
125
150
175
200
0.1 µg
0.5 µg1 µg
3 µg
Time [min]0 1 2 3 4 5 6 7
Absorbance [mAU]
0
25
50
75
100
125
150
175
200
0.1 µg
0.5 µg1 µg
3 µg
Figure 56: Stacked chromatograms of the linear isoform (0.1-3 µg)
Figure 55 and Figure 56 illustrate the change of the absorption signal with
increasing injected amount. Both figures illustrate the poor peak performance
(splitted peaks) in particular lin isoform.

Method validation for pGNA3 with TSK-Gel® DNA-NPR
74
b. Calculated calibration curves
Table 35: Results of the ccc plasmid
1st measurement 2nd measurement Sample
Inj. amount [µg] tR [min] A [mAU⋅s] tR [min] A [mAU⋅s] 0.1 4.0 72 4.0 74.5 0.5 4.0 444 4.0 456 1 4.1 969 4.1 698
outlier
ccc
3 4.0 4053 4.0 4188
1st measurement
y = 1406.1x - 232.56R2 = 0.9925
01000200030004000
0 0.5 1 1.5 2 2.5 3
amount [µg]
peak
are
a [m
AU
*s]
2nd measurement
y = 1461.4x - 205.65R2 = 0.9992
0
1000
2000
3000
4000
0 0.5 1 1.5 2 2.5 3
amount [µg]
peak
are
a [m
AU
*s]
Figure 57: Calibration curve of the ccc isoform (0.1-3 µg plasmid)
Table 36: Results of the lin plasmid
1st measurement 2nd measurement Sample Inj. amount [µg] tR [min] A [mAU⋅s] tR [min] A [mAU⋅s] 0.1 3.25 4.40 62 3.25 4.41 80 0.5 3.34 4.44 770 3.34 4.44 775 1 3.30 4.37 1420 3.29 4.36 1438 lin
3 3.45 4.45 4688 3.44 4.45 4624
1st measurement
y = 1588.4x - 91.626R2 = 0.9991
01000200030004000
0 0.5 1 1.5 2 2.5 3
amount [µg]
peak
are
a [m
AU
*s]
2nd measurement
y = 1559.5x - 64.229R2 = 0.9994
01000200030004000
0 0.5 1 1.5 2 2.5 3
amount [µg]
peak
are
a [m
AU
*s]
Figure 58: Calibration curve of the lin isoform (0.1-3 µg plasmid)

Method validation for pGNA3 with TSK-Gel® DNA-NPR
75
As it can be seen in Figure 57 and 59 the peak areas increase linearly by
increasing injected amounts, thus the measured concentration range from 0.1 to 3 µg
can be assumed to be the linearity range for both isoforms (ccc, lin).
Determination of the precision (repeatability) For the definition of precision see page 34.
1 µg of the lin and 3 µg of the ccc isoform were injected 3 times into DNA-NPR
column and the precision of the peak area and the retention time was calculated.
Precision was between 0.9 and 2.3% evaluating peak areas and 0 and 21% for
using retention time for calculation. The results are not significant due to only two
precision measurements.
Table 37: Calculated precision (peak area) (n=3; 1 resp. 3 µg injected)
Peak area [mAU⋅s]
Average value [mAU⋅s] 4120.5
Standard deviation [mAU⋅s] 95.5 Supercoiled pDNA
Relative standard deviation 2.3%
Average value [mAU⋅s] 1429.0
Standard deviation [mAU⋅s] 12.7 Linear pDNA
Relative standard deviation 0.9%
Table 38: Calculated precision (retention time) (n=3; 1 resp. 3 µg injected)
Retention time [min]
Average value [min] 4.0
Standard deviation [min] 0 Supercoiled pDNA
Relative standard deviation 0%
Average value [min] 3.30 resp. 4.37
Standard deviation [min] 0.01 resp 0.01 Linear pDNA
Relative standard deviation 0.21 resp. 0.16%
In Table 38, two different retention times were used for calculation of precision
of linear isoform due to its splitted peak.

Method validation for pGNA3 with TSK-Gel® DNA-NPR
76
Time [min]0 1 2 3 4 5
Absorbance [mAU]
0
50
100
150
200
250
300
350
400
Time [min]0 1 2 3 4 5
Absorbance [mAU]
0
50
100
150
200
250
300
350
400
ccc
Time [min]0 1 2 3 4 5
Absorbance [mAU]
0
50
100
150
200
250
300
350
400
Time [min]0 1 2 3 4 5
Absorbance [mAU]
0
50
100
150
200
250
300
350
400
ccc
Figure 59: Chromatograms of precision measurements (1 µg) of ccc plasmid
Time [min]1 2 3 4 5
Absorbance [mAU]
-10
0
10
20
30
40
Time [min]1 2 3 4 5
Absorbance [mAU]
-10
0
10
20
30
40
lin
Time [min]1 2 3 4 5
Absorbance [mAU]
-10
0
10
20
30
40
Time [min]1 2 3 4 5
Absorbance [mAU]
-10
0
10
20
30
40
lin
Figure 60: Chromatograms of precision measurements (1 µg) of lin plasmid
Overlaid chromatograms of precision measurements of both isoforms illustrate the
high precision of the method validation. Nevertheless, the oc form which is the most
critical isoform could not be eluted from the column.
Determination of the Limit of Detection / Limit of Quantification The limit of quantification for the ccc and linear plasmid was represented by the
lowest injected amount 0.1 µg respectively. To obtain more precisely values for LOD
and LLOQ further measurements of lower concentrations ought to be measured.
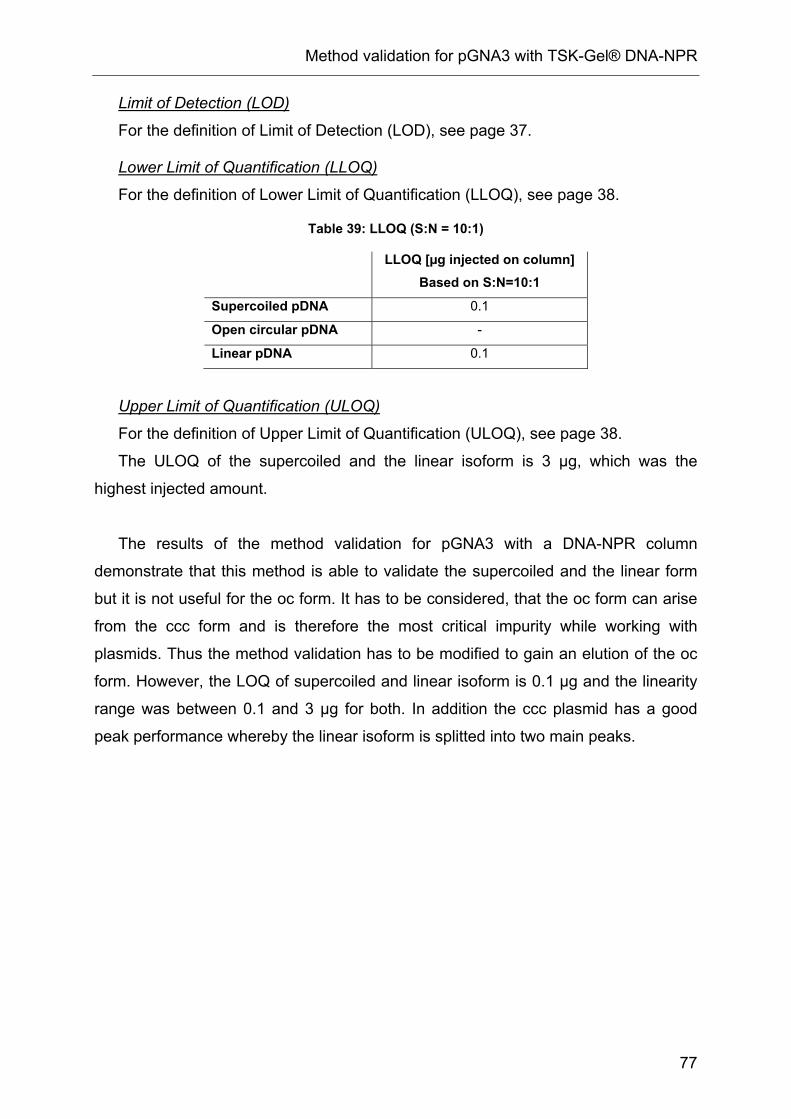
Method validation for pGNA3 with TSK-Gel® DNA-NPR
77
Limit of Detection (LOD)
For the definition of Limit of Detection (LOD), see page 37. Lower Limit of Quantification (LLOQ)
For the definition of Lower Limit of Quantification (LLOQ), see page 38.
Table 39: LLOQ (S:N = 10:1)
LLOQ [µg injected on column] Based on S:N=10:1
Supercoiled pDNA 0.1
Open circular pDNA -
Linear pDNA 0.1
Upper Limit of Quantification (ULOQ)
For the definition of Upper Limit of Quantification (ULOQ), see page 38.
The ULOQ of the supercoiled and the linear isoform is 3 µg, which was the
highest injected amount.
The results of the method validation for pGNA3 with a DNA-NPR column
demonstrate that this method is able to validate the supercoiled and the linear form
but it is not useful for the oc form. It has to be considered, that the oc form can arise
from the ccc form and is therefore the most critical impurity while working with
plasmids. Thus the method validation has to be modified to gain an elution of the oc
form. However, the LOQ of supercoiled and linear isoform is 0.1 µg and the linearity
range was between 0.1 and 3 µg for both. In addition the ccc plasmid has a good
peak performance whereby the linear isoform is splitted into two main peaks.

Method validation for pMCP1 with propylcarbamoyl quinine modified non porous
MICRA
78
11 Method validation for pMCP1 with propylcarbamoyl quinine modified non porous MICRA
MICRA NPS phase (1.5 µm) based on non porous silica is a possibility to improve
the resolution as well as the analysis time. Compared to porous silica, the MICRA
material has a smaller surface area (< 3 m2/g) and therefore lower selector loading
which decreases the retention. Macromolecules like biopolymers (DNA, proteins,
peptides) or polymers have a low diffusion coefficient thus moving inside the pores
takes a long time. Therefore non porosity of the support material accelerates the
mass transfer resulting in higher efficiency of the column. Consequently the analysis
time can be shortened because it is possible to work at higher flow rates without
significant efficiency loss.
As a consequence of lower content of selector, the MICRA support material is
more acidic compared to the 5 µm material. Thus the pH gradient has to be relocated
at lower values.
Based on previous knowledge, separation of plasmid isoforms is improved using
MICRA silica material. The objective of this part of the work was the detailed
elucidation of this stationary material and its characterisation by method validation for
the pMCP1 plasmid.
Si
Si
SiSi
O
OH
OH
O
O OH
OH
Si
Si
SiSi
O
OO
OO
O
Si
O
NH
Si
O
O Ntoluene, reflux
1. MM A58W3, DMAP2. hexamethyldisilazane
TMS EndcappingN
O
Figure 61: Reaction scheme for the synthesis of the MICRA PCQ column
The non-porous silica (NPS MICRA ®) PCQ material (particle size 1.5 µm) was
made in-house and then packed into stainless steel columns (dimension 33 x 4.6 mm
ID) by Bischoff Chromatography Leonberg. A selector coverage of approximately 19
µmol/g was calculated from elemental analysis data.
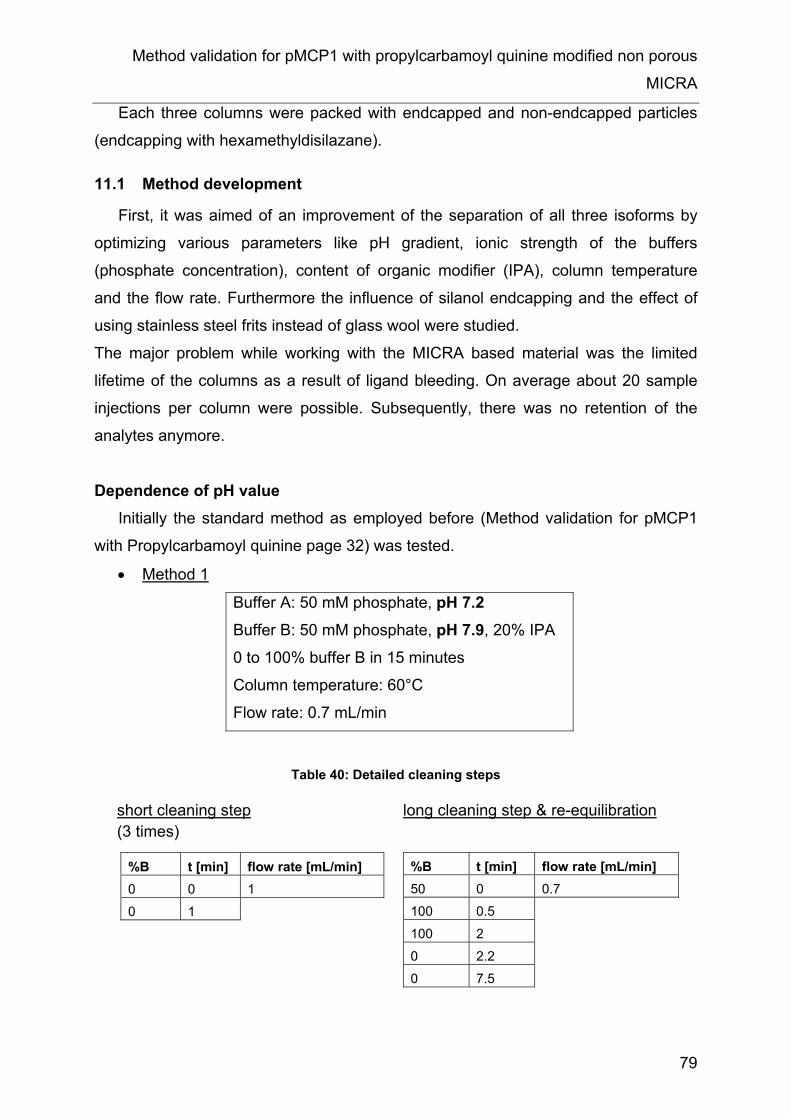
Method validation for pMCP1 with propylcarbamoyl quinine modified non porous
MICRA
79
Each three columns were packed with endcapped and non-endcapped particles
(endcapping with hexamethyldisilazane).
11.1 Method development
First, it was aimed of an improvement of the separation of all three isoforms by
optimizing various parameters like pH gradient, ionic strength of the buffers
(phosphate concentration), content of organic modifier (IPA), column temperature
and the flow rate. Furthermore the influence of silanol endcapping and the effect of
using stainless steel frits instead of glass wool were studied.
The major problem while working with the MICRA based material was the limited
lifetime of the columns as a result of ligand bleeding. On average about 20 sample
injections per column were possible. Subsequently, there was no retention of the
analytes anymore.
Dependence of pH value
Initially the standard method as employed before (Method validation for pMCP1
with Propylcarbamoyl quinine page 32) was tested.
• Method 1
Buffer A: 50 mM phosphate, pH 7.2
Buffer B: 50 mM phosphate, pH 7.9, 20% IPA
0 to 100% buffer B in 15 minutes
Column temperature: 60°C
Flow rate: 0.7 mL/min
Table 40: Detailed cleaning steps
short cleaning step (3 times)
%B t [min] flow rate [mL/min] 0 0 1
0 1
long cleaning step & re-equilibration
%B t [min] flow rate [mL/min] 50 0 0.7
100 0.5
100 2
0 2.2 0 7.5

Method validation for pMCP1 with propylcarbamoyl quinine modified non porous
MICRA
80
If not stated otherwise, for cleaning of the column after each injection, the
conditions and the sequence (3 times the short method and subsequently one single
long cleaning step) specified above were used.
The plasmids were not retained with method 1 and eluted with t0, accordingly a
lower pH range (pH 7.0 to 7.6) was used for following experiments.
• Method 2
Buffer A: 50 mM phosphate, pH 7.0
Buffer B: 50 mM phosphate, pH 7.6, 20% IPA
0 to 75% buffer B in 10 minutes
Column temperature: 60°C
Flow rate: 0.7 mL/min
By reducing the analysis time, the pH values in channel A and B and shortening
of the gradient from 15 to 10 minutes the following chromatogram was observed.
Absorbance [mAU]
time [min]1 2 3 4 5 6 7 8 9
0
50
100
150
200
250
300
350
Absorbance [mAU]
time [min]1 2 3 4 5 6 7 8 9
0
50
100
150
200
250
300
350
time [min]1 2 3 4 5 6 7 8 9
0
50
100
150
200
250
300
350
oc(natural)
lin
ccc
t0
Absorbance [mAU]
time [min]1 2 3 4 5 6 7 8 9
0
50
100
150
200
250
300
350
Absorbance [mAU]
time [min]1 2 3 4 5 6 7 8 9
0
50
100
150
200
250
300
350
time [min]1 2 3 4 5 6 7 8 9
0
50
100
150
200
250
300
350
oc(natural)
lin
ccc
t0
Figure 62: Chromatogram of pMCP1 plasmid (lin, ccc)
As it can be seen in Figure 62 all plasmid isoforms are sufficiently retained and
excellent separation between the open circular and the supercoiled pDNA forms can
be achieved. Moreover, it is remarkable that the PCQ modified MICRA based
stationary phase shows same selectivity between the oc and linear isoform.
Dependence of ionic strength
Column: Micra NPS PCQ with endcapping, HETP/dp=8.91 (33 x 4.6 mm ID)

Method validation for pMCP1 with propylcarbamoyl quinine modified non porous
MICRA
81
Besides the pH of the buffers also the influence of the ionic strength was studied.
Therefore, the three phosphate concentrations (in the range of 10 mM to 50 mM
phosphate) for both buffers and the same elution gradient are compared.
0 to 75% buffer B in 10 minutes
Buffer A: x mM phosphate, pH 7.0
Buffer B: x mM phosphate, pH 7.6, 20% IPA
Flow rate: 0.7 mL/min
time [min]2 4 6 8 10 12
Absorbance [mAU]
0
50
100
150
200
time [min]2 4 6 8 10 12
Absorbance [mAU]
0
50
100
150
200
(a)
(c)(b)
ccc
ccc
ococ
time [min]2 4 6 8 10 12
Absorbance [mAU]
0
50
100
150
200
time [min]2 4 6 8 10 12
Absorbance [mAU]
0
50
100
150
200
(a)
(c)(b)
ccc
ccc
ococ
Figure 63: Stacked Chromatograms of ccc pDNA (4.9 kb) with
different phosphate buffers
Column: Micra NPS PCQ without end-capping, HETP/dp=16.04 Column dimension: 33 x 4.6 mm ID x=10 mM phosphate (a) x=20 mM phosphate (b) x=30 mM phosphate (c)
Figure 63 confirms the influence of the phosphate buffer on the migration time of
the plasmid DNA. The phosphate groups can displace the DNA molecules which are
interacting with the stationary phase hence the retention time decreases (according
to an anion-exchange mechanism). If only a low concentrated phosphate buffer
(10mM) is used, no elution of the supercoiled isoform can be observed. Furthermore
Figure 63 shows that with phosphate concentrations above 20 mM the retention
times are still in a convenient range. Moreover the selectivity between oc and ccc
form is not negatively impacted by higher buffer concentrations.
Thus for further measurements with the Micra PCQ based material, phosphate
concentrations above 20 mM phosphate are recommendable.

Method validation for pMCP1 with propylcarbamoyl quinine modified non porous
MICRA
82
Dependence of column temperature
To investigate the effect of the temperature on the selectivity and retention times,
supercoiled pDNA (4.9 kb) was analyzed at different column temperatures in the
range from 40°C to 60°C.
Buffer A: 30 mM phosphate, pH 7.0
Buffer B: 30 mM phosphate, pH 7.6, 20% IPA
0 to 75% buffer B in 10 minutes
Flow rate: 0.7 mL/min
time [min]0 2 4 6 8 10 12
Absorbance [mAU]
0
25
50
75
100
125
150
175
time [min]0 2 4 6 8 10 12
Absorbance [mAU]
0
25
50
75
100
125
150
175
(a)(b)
(c)(d)
(e)
ccc ccc ccc cccccc
ococ
ococ
oc
time [min]0 2 4 6 8 10 12
Absorbance [mAU]
0
25
50
75
100
125
150
175
time [min]0 2 4 6 8 10 12
Absorbance [mAU]
0
25
50
75
100
125
150
175
(a)(b)
(c)(d)
(e)
ccc ccc ccc cccccc
ococ
ococ
oc
Figure 64: Influence of the temperature on chromatograms
Column: Micra NPS PCQ without end-capping, HETP/dp=16.04 Column dimension: 33 x 4.6 mm ID different column temperatures: 60°C (a), 55°C (b), 50°C (c), 40°C (d), 30°C (e)
This chromatogram shows the variation of the temperature has a great influence
on selectivity and may lead to substantial reduction of the analyzing time.
Table 41: Retention time of supercoiled plasmid as a function of the temperature

Method validation for pMCP1 with propylcarbamoyl quinine modified non porous
MICRA
83
temperature [°C] tR(ccc) [min] tR(oc) [min] α60 4.58 0.41 (t0) -55 5.33 0.41 (t0) -50 6.11 3.03 2.1740 8 4.96 1.6730 9.6 7.2 1.35
Temperature dependence of the retention time
0
1
2
3
4
5
6
7
8
9
10
25 30 35 40 45 50 55 60 65
Temperature [°C]
Ret
entio
n tim
e [m
in]
ccc plasmid
oc plasmid (present in ccc)
Temperature dependence of the retention time
0
1
2
3
4
5
6
7
8
9
10
25 30 35 40 45 50 55 60 65
Temperature [°C]
Ret
entio
n tim
e [m
in]
ccc plasmid
oc plasmid (present in ccc)
Figure 65: Retention time versus temperature
It can be seen (Figure 64, Figure 65 and Table 41) that an increasing temperature
negatively affects the migration of both, ccc and oc form. The best selectivity is,
however, achieved with a column temperature of 50°C i.e. at higher temperatures.
Previous works of our group (M. Mahut, diploma thesis, University of Vienna)
showed the inverse effect with NaCl-gradient elution on the same MICRA-based
material; retention time of the supercoiled plasmid strongly increased with
temperature whereby no impact on the oc and the lin isoform could be observed.
Furthermore, the temperature influences the peak shapes thus a higher
temperature (60°C) was preferred for the further experiments.
Influence of flow rate
Buffer A: 50 mM phosphate, pH 6.5, 0.1M NaCl

Method validation for pMCP1 with propylcarbamoyl quinine modified non porous
MICRA
84
Buffer B: 50 mM phosphate, pH 7.5, 30% IPA
5 to 10% buffer B in 7 minutes, 10-60% buffer B in 8 minutes (ttotal=15 min)
Flow rate: x mL/min
Column temperature: 60°C
time [min]2 4 6 8 10 12 14 16 18
Absorbcane [mAU]
0
20
40
60
80
100
120
140
time [min]2 4 6 8 10 12 14 16 18
Absorbcane [mAU]
0
20
40
60
80
100
120
140
natural oc
ccc
time [min]2 4 6 8 10 12 14 16 18
Absorbcane [mAU]
0
20
40
60
80
100
120
140
time [min]2 4 6 8 10 12 14 16 18
Absorbcane [mAU]
0
20
40
60
80
100
120
140
natural oc
ccc
Figure 66: Influence of flow rate (supercoiled plasmid, 4.9 kb)
The chromatogram above shows that the flow rate of the mobile phase has no
strong impact on the separation. Thus, the analysis time can be cut down without
loosing efficiency or selectivity by increasing the flow rate.
Significance of Endcapping
To proof the necessity of end-capping, the shielded material as well as the non
end-capped material is compared in terms of their chromatographic performance.
The difference between both materials is that the residual silanol groups are
derivatized with hexamethyldisilazane to avoid deprotonation and consequently partly
negatively charged surface of the stationary phase. Before, an elemental
measurement revealed only a small difference between both materials (a negligible
increase of carbon due to endcapping). So it can be expected that the
Column: Micra NPS PCQ without endcapping, HETP/dp=10.51 Column dimension: 33 x 4.6 mm ID red: 0.7 mL/min, blue: 0.4 mL/min

Method validation for pMCP1 with propylcarbamoyl quinine modified non porous
MICRA
85
chromatograms of both materials are very similar. Concerning the packing of the
columns (density and regularity), the non endcapped material showed higher
reduced plate heights (10.5-16, normally 3-4) which can be due to sub-optimal
packing.
Buffer A: 50 mM phosphate, pH 7.0
Buffer B: 50 mM phosphate, pH 7.6, 20% IPA
0 to 75% buffer B in 10 minutes
Flow rate: 0.7 mL/min
Column temperature: 60°C
time [min]1 2 3 4 5 6 7 8 9
Absorbance [mAU]
0
20
40
60
80
100
time [min]1 2 3 4 5 6 7 8 9
Absorbance [mAU]
0
20
40
60
80
100 Spiked sample (pMCP1):0.4 µg ccc, 0.4 µg oc, 0.8 µg lin
time [min]1 2 3 4 5 6 7 8 9
Absorbance [mAU]
0
20
40
60
80
100
time [min]1 2 3 4 5 6 7 8 9
Absorbance [mAU]
0
20
40
60
80
100 Spiked sample (pMCP1):0.4 µg ccc, 0.4 µg oc, 0.8 µg lin
Figure 67: Comparison of end-capped and non end-capped material
As it can be seen from Figure 67 the endcapped material delivered a better peak
shape and the separation was slightly better. Therefore this material is preferable
and the second step of the synthesis (endcapping of the residual silanol groups with
hexamethyldisilazane) is not necessary but improves the chromatographic resolution.
Difference between glass wool and stainless steel frits Previous experiments (carried out by M. Mahut, doctoral thesis (2010) University
of Vienna) showed that the plasmids strongly adsorb to the glass wool which is used
red: endcapped, HETP/dp=10.72 blue: non-endcapped, HETP/dp=15.52 column dimensions: 33 x 4.6 mm ID

Method validation for pMCP1 with propylcarbamoyl quinine modified non porous
MICRA
86
as a filter for our packed columns. This phenomenon negatively affects the recovery
of the plasmids or in worst case it can congest the column. However, to avoid or
even reduce irreversible adsorption, the glass wool filters have been replaced by
stainless steel frits. To investigate the significance of the glass wool, a spike sample
was measured with the same method before and after replacing the glass wool by
steel frits. While removing the filter the packing bed can be injured thus it has to be
done with caution.
Buffer A: 50 mM phosphate, pH 7.0
Buffer B: 50 mM phosphate, pH 7.6, 20% IPA
0 to 75% buffer B in 10 minutes
Flow rate: 0.7 mL/min
Column temperature: 60°C
time [min]1 2 3 4 5 6 7 8 9
Absorbance [mAU]
0
20
40
60
80
100
time [min]1 2 3 4 5 6 7 8 9
Absorbance [mAU]
0
20
40
60
80
100
t0
cccccc
oc oc
lin
lin
time [min]1 2 3 4 5 6 7 8 9
Absorbance [mAU]
0
20
40
60
80
100
time [min]1 2 3 4 5 6 7 8 9
Absorbance [mAU]
0
20
40
60
80
100
t0
cccccc
oc oc
lin
lin
Figure 68: Comparison of glass wool and stainless steel frits
By comparing both chromatograms the higher signal of the glass wool can be a
result of desorbed plasmid. However, the replacement of the filter just generated a
shift in the elution time, but based on the results of the previous experiments
stainless steel frits should be favoured.
Chromatograms of other plasmid (pMCP1, pAcMC1, pGNA3)
Sample (pMCP1): 0.4 µg ccc, 0.4 µg oc, 0.8 µg lin red: glass wool frits, blue: stainless steel frits not endcapped, HETP/dp=15.52 Column dimensions: 33 x 4.6 mm ID

Method validation for pMCP1 with propylcarbamoyl quinine modified non porous
MICRA
87
The separation of three plasmids with different sizes (4.9 kb, 10 kb, 15 kb) have been tested with pre-optimized conditions.
Method:
Buffer A: 50 mM phosphate, pH 7.0
Buffer B: 50 mM phosphate, pH 7.6, 20% IPA
0 to 75% buffer B in 10 minutes
Flow rate: 0.7 mL/min
column temperature: 60°C
• pMCP1
For stacked chromatogram of ccc and lin, see Figure 62 page 80.
• pAcMC1
time [min]1 2 3 4 5 6 7 8 9
Absorbance [mAU]
0
20
40
60
80
100
time [min]1 2 3 4 5 6 7 8 9
Absorbance [mAU]
0
20
40
60
80
100
nat. oc
lin
ccc
t0
time [min]1 2 3 4 5 6 7 8 9
Absorbance [mAU]
0
20
40
60
80
100
time [min]1 2 3 4 5 6 7 8 9
Absorbance [mAU]
0
20
40
60
80
100
nat. oc
lin
ccc
t0
Figure 69: Chromatograms of different isoforms of p
AcMC1
red: 0.4 µg supercoiled pDNA green: 0.8 µg linear pDNA blue: 0.4 µg ccc + 0.8 µg linear column: endcapped, HETP/dp=10.72 column dimensions: 33 x 4.6 mm ID

Method validation for pMCP1 with propylcarbamoyl quinine modified non porous
MICRA
88
• pGNA3
time [min]1 2 3 4 5 6 7 8 9
Absorbance [mAU]
0
20
40
60
80
100
120
140
time [min]1 2 3 4 5 6 7 8 9
Absorbance [mAU]
0
20
40
60
80
100
120
140
t0 nat. oc
lin
ccc
time [min]1 2 3 4 5 6 7 8 9
Absorbance [mAU]
0
20
40
60
80
100
120
140
time [min]1 2 3 4 5 6 7 8 9
Absorbance [mAU]
0
20
40
60
80
100
120
140
t0 nat. oc
lin
ccc
Figure 70: Chromatograms of different isoforms of pGNA3
Figure 69 and 70 demonstrate the suitability of the method for 10 and 15 kb
plasmids. However, the major problems are the selectivity between the linear and the
open circular isoform and the preparation of oc standards. Thus this method can be
used for the smaller plasmids (4.9 kb) but can still be further optimized. Moreover, a
dilution error occurred preparing the 15 kb samples, thus peak areas do not fit to the
injected amounts.
Optimization of gradient for pMCP1
Furthermore, appropriate method conditions considering also the regeneration
and cleaning steps had to be developed. This optimized method should allow
appropriate selectivity between linear and open circular isoform as well as reducing
the cycle time to less than 15 minutes including cleaning and regeneration.
red: 0.4 µg supercoiled pDNA green: 0.8 µg linear pDNA blue: 0.4 µg ccc + 0.8 µg linear column: endcapped, HETP/dp=10.72 (33 x 4.6 mm ID)

Method validation for pMCP1 with propylcarbamoyl quinine modified non porous
MICRA
89
For this fine-tuning just the eluting gradient and the flow rate were modified, the
mobile phases and the column temperature were adapted from the method before.
Buffer A: 50 mM phosphate, pH 7.0
Buffer B: 50 mM phosphate, pH 7.6, 20% IPA
Column temperature: 60°C
The column employed was column no. 5 (not endcapped).
Optimized method:
0
20
40
60
80
100
0 1 2 3 4 5 6 7 8 9 10 11 12 13 14
Time [min]
% B
elution gradient short cleaningstep
Vinj=50µL(3M NaCl)
long cleaningstep
0
20
40
60
80
100
0 1 2 3 4 5 6 7 8 9 10 11 12 13 14
Time [min]
% B
elution gradient short cleaningstep
Vinj=50µL(3M NaCl)
long cleaningstep
Figure 71: Graphic presentation of gradient
Table 42: Optimized method
elution gradient
%B t [min] flow rate [mL/min]
0 0 1 75 7.5
short cleaning step
%B t [min] flow rate [mL/min]
0 0 1 0 1
Long cleaning step & reequilibration
%B t [min] flow rate [mL/min]
50 0 1 100 0.35 100 1.4 0 1.54 0 5.25
Concerning this method, a total cycle time of 13.75 min can be achieved.

Method validation for pMCP1 with propylcarbamoyl quinine modified non porous
MICRA
90
time [min]1 2 3 4 5 6
Absorbance [mAU]
0
2
4
6
8
10
12
time [min]1 2 3 4 5 6
Absorbance [mAU]
0
2
4
6
8
10
12
ccc
oc
lint0
time [min]1 2 3 4 5 6
Absorbance [mAU]
0
2
4
6
8
10
12
time [min]1 2 3 4 5 6
Absorbance [mAU]
0
2
4
6
8
10
12
ccc
oc
lint0
Figure 72: Chromatogram of spiked pMCP1 using optimized method
Table 43: Calculation of the selectivity and the resolution
tR [min] α Rs
t0 0.285 - -
lin 3.344 - -
oc 3.003 1.13 0.70
ccc 5.122 1.58 2.41
The chromatogram above (Figure 72) illustrates an acceptable resolution of 0.7
between the linear and the open circular isoform and retention of 2.4 min between lin
and oc form while the total cycle time is kept below 15 minutes. Taken together, this
method fulfils requirements specified for quality control purposes. The separation
was reasonably repeatable, yet the retention times were slightly shifted as a result of
the decreasing stability of the support material.
Table 44: Comparison of injected and recovered peak ratio
Injected amount on column Recovered ratio of peak areas
ccc 93% 82%
oc 5% 5%
lin 2% 13%
This sample contains 0.7 µg oc, 0.3 µg linear and 13.6 µg supercoiled isoform, oc and linear isoform were purified standards.

Method validation for pMCP1 with propylcarbamoyl quinine modified non porous
MICRA
91
In Table 44 spiked sample with well-known concentrations of isoforms, namely
13.6 µg ccc, 0.7 µg and 0.3 µg lin was injected into the Micra based PCQ column and
the resulting peak area ratio between the isoforms was evaluated. It can be seen that
the value of peak area ratio for the oc fits perfectly but the percentage of ccc is
shifted to the linear form.
Furthermore, the recovery was calculated using the calibration curves for the
supercoiled and linear isoform from the validation (see Figure 77-80). In Table 45 the
calculated recoveries are compared with injected amounts. It can be seen that the
recovered amount of supercoiled and linear isoform are considerably too less.
Table 45: Comparison of injected and recovered amount using calibration curves
Injected amount on column [µg] Recovered amount [µg]
Ccc 13.63 0.53
Oc 0.72 -
Lin 0.3 0.14
11.2 Validation protocol
Method validation with pDNA isoforms of pMCP1 was performed using the
optimized method developed before (summarized in Table 42). Therefore the open
circular standard has to be prepared again according to the protocol on page 28-
2832.

Method validation for pMCP1 with propylcarbamoyl quinine modified non porous
MICRA
92
Results:
time [min]2 4 6 8 10
Absorbance [mAU]
0
200
400
600
800
1000
1200
time [min]2 4 6 8 10
Absorbance [mAU]
0
200
400
600
800
1000
1200
t0
isolated peak (oc) ccc
time [min]2 4 6 8 10
Absorbance [mAU]
0
200
400
600
800
1000
1200
time [min]2 4 6 8 10
Absorbance [mAU]
0
200
400
600
800
1000
1200
t0
time [min]2 4 6 8 10
Absorbance [mAU]
0
200
400
600
800
1000
1200
time [min]2 4 6 8 10
Absorbance [mAU]
0
200
400
600
800
1000
1200
t0
isolated peak (oc) ccc
Figure 73: Isolation of open circular form (pMCP1, 55°C for 24h)
Figure 74: Agarose gel for the verification of oc standard
Column: propylcarbamoyl quinine PCQ based on Kromasil 100 Ǻ, 5 µm Column dimension: 150 x 4 mm ID Buffer A: 50 mM phosphate, pH 7.2, Buffer B: A + 20% IPA pH 7.9, 0-100% buffer B in 15 min, column temperature: 60°C, flow rate: 0.7 mL/min
0.8% agarose, 1x TBE buffer, applied voltage: 200 V for 2 hours, Staining: 2 µL EtdBr (10 mg/mL)

Method validation for pMCP1 with propylcarbamoyl quinine modified non porous
MICRA
93
Figure 74 confirms that the isolated standards contain mainly the open circular
form of the pDNA and a negligible amount of the linear form. However, this standard
was used for the following measurements. Due to the fact that a completely new
column was used for this validation, the steel frits had to be saturated with DNA to
inhibit undesirable adsorptions of the sample. Therefore about 50 µg of oc form was
injected.
11.3 Equipment and Instruments
The validation measurements were performed using a Rapid Resolution Agilent
1200 system equipped with a binary pump, a thermostatted autosampler (cooled to
4°C) and a diode array UV detector (DAD). All buffer solutions were filtered by a
glass filtration unit (Millipore) through a 0.22 µm nylon filter before using.
11.4 Method Information
For the method information, see Table 42 page 89.
Stationary phase used for further measurements is endcapped and packed in-
house (HETP/dp=13.37, column dimension: 33 x 4.6 mm ID).
11.5 Results and evaluation
Amounts from 0.05 to 0.5 µg pDNA of each isoform were measured.
Linearity Range:
Initially, open circular form was injected (beginning with the lowest amount),
followed by linear form and at last the supercoiled plasmid. The oc measurements
showed barely any peak thus they can not be evaluated. Maybe the saturation with
50 µg oc form was not enough consequently the DNA absorbed at the filter and could
not be detected.

Method validation for pMCP1 with propylcarbamoyl quinine modified non porous
MICRA
94
a. Chromatograms
Supercoiled pDNA
Carry overt0
ccc
0.1 µg
0.05 µg
time [min]1 2 3 4 5 6 7 8
Absorbance [mAU]
0
2
4
6
8
10
12
14
time [min]1 2 3 4 5 6 7 8
Absorbance [mAU]
0
2
4
6
8
10
12
14
Carry overt0
ccc
0.1 µg
0.05 µg
time [min]1 2 3 4 5 6 7 8
Absorbance [mAU]
0
2
4
6
8
10
12
14
time [min]1 2 3 4 5 6 7 8
Absorbance [mAU]
0
2
4
6
8
10
12
14
time [min]1 2 3 4 5 6 7 8
Absorbance [mAU]
0
2
4
6
8
10
12
14
time [min]1 2 3 4 5 6 7 8
Absorbance [mAU]
0
2
4
6
8
10
12
14
0.49 µg
Carry overt0
ccc
0.1 µg
0.05 µg
time [min]1 2 3 4 5 6 7 8
Absorbance [mAU]
0
2
4
6
8
10
12
14
time [min]1 2 3 4 5 6 7 8
Absorbance [mAU]
0
2
4
6
8
10
12
14
Carry overt0
ccc
0.1 µg
0.05 µg
time [min]1 2 3 4 5 6 7 8
Absorbance [mAU]
0
2
4
6
8
10
12
14
time [min]1 2 3 4 5 6 7 8
Absorbance [mAU]
0
2
4
6
8
10
12
14
time [min]1 2 3 4 5 6 7 8
Absorbance [mAU]
0
2
4
6
8
10
12
14
time [min]1 2 3 4 5 6 7 8
Absorbance [mAU]
0
2
4
6
8
10
12
14
0.49 µg
Figure 75: Stacked chromatograms of ccc form (0.05-0.49 µg)
Linear pDNA
time [min]1 2 3 4 5 6 7 8
Absorbance [mAU]
0
2
4
6
8
10
12
14
16
time [min]1 2 3 4 5 6 7 8
Absorbance [mAU]
0
2
4
6
8
10
12
14
16
Carry over
t0
lin
0.05 µg
0.1 µg
0.5 µg
time [min]1 2 3 4 5 6 7 8
Absorbance [mAU]
0
2
4
6
8
10
12
14
16
time [min]1 2 3 4 5 6 7 8
Absorbance [mAU]
0
2
4
6
8
10
12
14
16
Carry over
t0
lin
0.05 µg
0.1 µg
0.5 µg
Figure 76: Stacked chromatograms of lin form (0.05-0.5 µg)
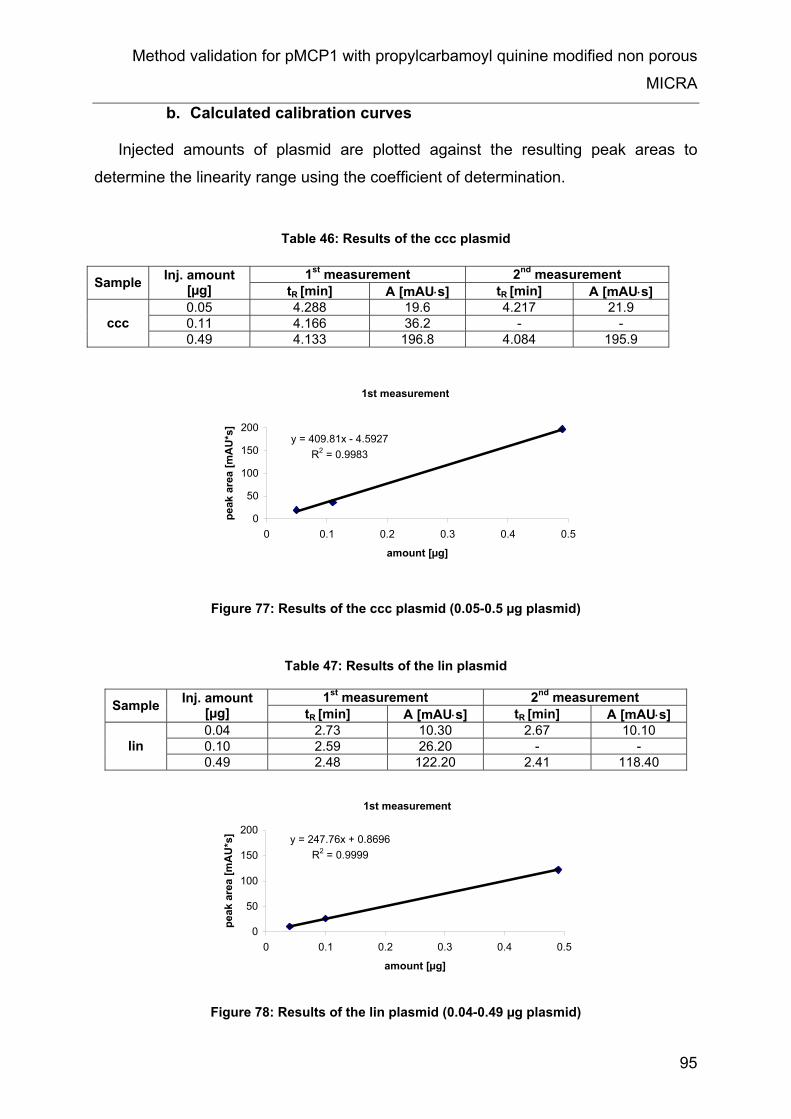
Method validation for pMCP1 with propylcarbamoyl quinine modified non porous
MICRA
95
b. Calculated calibration curves
Injected amounts of plasmid are plotted against the resulting peak areas to
determine the linearity range using the coefficient of determination.
Table 46: Results of the ccc plasmid
1st measurement
y = 409.81x - 4.5927R2 = 0.9983
0
50
100
150
200
0 0.1 0.2 0.3 0.4 0.5
amount [µg]
peak
are
a [m
AU
*s]
Figure 77: Results of the ccc plasmid (0.05-0.5 µg plasmid)
Table 47: Results of the lin plasmid
1st measurement 2nd measurement Sample Inj. amount [µg] tR [min] A [mAU⋅s] tR [min] A [mAU⋅s] 0.04 2.73 10.30 2.67 10.10 0.10 2.59 26.20 - - lin 0.49 2.48 122.20 2.41 118.40
y = 247.76x + 0.8696R2 = 0.9999
0
50
100
150
200
0 0.1 0.2 0.3 0.4 0.5
amount [µg]
peak
are
a [m
AU
*s]
1st measurement
Figure 78: Results of the lin plasmid (0.04-0.49 µg plasmid)
1st measurement 2nd measurement Sample Inj. amount [µg] tR [min] A [mAU⋅s] tR [min] A [mAU⋅s] 0.05 4.288 19.6 4.217 21.9 0.11 4.166 36.2 - - ccc 0.49 4.133 196.8 4.084 195.9

Method validation for pMCP1 with propylcarbamoyl quinine modified non porous
MICRA
96
As it can be seen in Figure 77 and 78 the peak areas increase linearly with
increasing injected amounts, thus the measured concentration range from 0.05 to 0.5
µg can be assumed to be the linearity range for both isoforms (ccc, lin).
Determination of the precision (repeatability)
For the definition of precision see page 35.
0.49 µg supercoiled and 0.5 µg linear isoform were injected 2 times and the
precision of peak areas was calculated. Based on the few measurements, the
significance of these values is not very well.
Table 48: Precision calculation for ccc and lin isoform
peak area [mAU⋅s] Retention time [min]
Average value 196.35 4.109
Standard deviation 3.82 0.035 Supercoiled pDNA
Relative standard deviation 1.94% 0.85%
Average value 121.47 2.417
Standard deviation 2.77 0.06 Linear pDNA
Relative standard deviation 2.28% 2.49%
Time [min]1 2 3 4 5 6
Absorbance [mAU]
0
2
4
6
8
Time [min]1 2 3 4 5 6
Absorbance [mAU]
0
2
4
6
8
Figure 79: Chromatograms of precision measurements (0.49 µg) of ccc plasmid

Method validation for pMCP1 with propylcarbamoyl quinine modified non porous
MICRA
97
Time [min]1 2 3 4 5 6
Absorbance [mAU]
-4
-2
0
2
4
6
8
10
Time [min]1 2 3 4 5 6
Absorbance [mAU]
-4
-2
0
2
4
6
8
10
Figure 80: Chromatograms of precision measurements (0.5 µg) of lin plasmid
Figure 79 and Figure 80 illustrate the precision measurements.
Time [min]1 2 3 4 5 6
Absorbance[mAU ]
-4
-2
0
2
4
6
8
10
Time [min]1 2 3 4 5 6
Absorbance[mAU ]
-4
-2
0
2
4
6
8
10
linccc
Carry over
Time [min]1 2 3 4 5 6
Absorbance[mAU ]
-4
-2
0
2
4
6
8
10
Time [min]1 2 3 4 5 6
Absorbance[mAU ]
-4
-2
0
2
4
6
8
10
linccc
Carry over
Figure 81: Overlayed Chromatgram of ccc and lin isoform (each 0.5 µg)
Determination of the Limit of Detection / Limit of Quantification
The LOD can only be estimated to be the lowest injected amount so
approximately 0.05 µg for the linear and the supercoiled plasmid. To get an accurate
LOD or LOQ, additional measurements would be necessary but could not be
performed because of unusually high instability of the column.
11.6 Conclusions
An optimized gradient elution, which enabled an adequate resolution of oc and lin
form as well as a separation between the oc/lin and ccc form. Furthermore a total
cycle time below 15 minutes could be achieved. During the validation procedure,
certain drawbacks concerning the support material were found: Its stability was

Method validation for pMCP1 with propylcarbamoyl quinine modified non porous
MICRA
98
unexpectedly low resulting in a maximum of 30 injections per column life time
employing optimized conditions. It may be concluded that the pH gradient in
combination with a temperature of 60°C causes a degradation of the MICRA
material. An alternative to the pH gradient would be a sodium chloride gradient
elution but these additional measurements were not performed due to lack of time.
Moreover, these conditions cause separation of topoisomers which is undesirable for
process analysis.
Moreover, the stability of the propylcarbamoyl quinine modified MICRA material
has to be improved by enhancing the bonding chemistry for further experiments.

Development of 2D HPLC method for analysis of topoisomer distribution in
fermentation samples and application to In-Process-Control (IPC) samples
99
12 Development of 2D HPLC method for analysis of topoisomer distribution in fermentation samples and application to In-Process-Control (IPC) samples
Previously our working group presented a HPLC method for chromatographic
topoisomer analysis (M. Mahut, PhD thesis (2010) University of Vienna). This method
works use of the chemoaffinity principle based on quinine carbamate. This stationary
phase exhibits toposiomer selectivity, however, it does not allow injection of samples
from fermentation without thorough prior precipitation. Host cell proteins, gDNA, RNA
and various other components of the fermentation broth interfer with the pDNA
topoisomer peak. T overcome this problem the goal was to develop a 2D HPLC
method which allows to isolate the pDNA peak of SEC in the first dimension and
transfer it to carbamate column in the second dimenstion for topoisomer analysis.
The aim of in-process controlling was to investigate the influence of the circadian
rhythm (day/night cycle) and to define the harvest time point at which the topoisomer
contribution offers the highest supercoiling.
12.1 2D-HPLC system:
Combination of size exclusion and anion exchange chromatography
Connecting two complementary chromatographic separation principles in a two-
dimensional HPLC system enables faster and automated analysis of such complex
samples, eliminating sample preparation steps and exchange of buffer. It is the
method of choice if one chromatographic principle does not provide adequate
selectivity to perform separation in one step. Additionally the purification and analysis
can be done in one single run.
Characterization of size exclusion material Sepax SRT-SEC phases are based on silica support material (5 µm, 1000 Å,
column dimension: 150 x 7.8 mm ID) coated with hydrophilic and neutral nanometer
thick films. The large pore volume (1 mL/g) enables high separation capacity.

Development of 2D HPLC method for analysis of topoisomer distribution in
fermentation samples and application to In-Process-Control (IPC) samples
100
Characterization of anion exchanger
SiO
O
O
OSi S
Si N
O
O
NH
N
O
Figure 82: Molecule structure of O-9-allylcarbamoyl-10,11-dihydroquinine (endcapped, based on 5 µm Daiso, 120 Ǻ)
As it can be seen in Figure 83 size exclusion chromatography (5 µm, 1000 Å)
does not provide satisfactory results due to lack of topoisomer separation. However,
the SRT-SEC column can be used for purification and isolation of the desired peak.
Thus supplemental a complementary chromatography system which provides
topoisomer selectivity has to be performed subsequently.
-
0.0
12.5
25.0
37.5
50.0
60.0 1 - -G- -
1 - DNA - 2.687
2 - RNA - 3.740
3 - Nucleic acid fragment -4 - 5.287
5 - Low molecular substance 5.487 .
0.00 0.50 1.00 1.50 2.00 2.50 3.00 3.50 4.00 4.50 5.00 5.50 6.00 6.50 7.002.0
5.0
10.0
15.0
20.0
Time [min]
1 - Plasmid DNA - 2.707
2 - RNA - 3.7673 - Nucleic acid fragment- - 4.140
4 - Low molecular substance- 5.307
pDNA
RNAlow molecular weightsubstances
purified samplespiked with RNA
crude samplespiked with RNA
→
Plasmid
4.120
Absorbance [mAU]
-
0.0
12.5
25.0
37.5
50.0
60.0 1 - -G- -
1 - DNA - 2.687
2 - RNA - 3.740
3 - Nucleic acid fragment -4 - 5.287
5 - Low molecular substance 5.487 .
0.00 0.50 1.00 1.50 2.00 2.50 3.00 3.50 4.00 4.50 5.00 5.50 6.00 6.50 7.002.0
5.0
10.0
15.0
20.0
Time [min]
1 - Plasmid DNA - 2.707
2 - RNA - 3.7673 - Nucleic acid fragment- - 4.140
4 - Low molecular substance- 5.307
pDNA
RNAlow molecular weightsubstances
purified samplespiked with RNA
crude samplespiked with RNA
→
Plasmid
4.120
Absorbance [mAU]
Figure 83: Resulting chromatograms using only size exclusion column
SRT-SEC 5 µm, 1000 Å, 150 x 7.8 mm ID (M. Mahut, PhD thesis (2010) University of Vienna)
The biomass sample of 4.9 kbp plasmid (pMCP1) was disintegrated performing alkaline lysis and spiked with RNA.

Development of 2D HPLC method for analysis of topoisomer distribution in
fermentation samples and application to In-Process-Control (IPC) samples
101
2 4 6 8 10 12 14 16 18
Absorbance [mAU]
0
20
40
60
80
100
120
Time [min}2 4 6 8 10 12 14 16 182 4 6 8 10 12 14 16 18
Absorbance [mAU]
0
20
40
60
80
100
120
Time [min}2 4 6 8 10 12 14 16 18
Figure 84: Chromatogram of pMCP1 lysate using only anion exchange column
(Results from M. Mahut) O-9-allylcarbamoyl-10,11-dihydroquinine (5 µm, 120 Ǻ,: 150 x 4 mm ID)
0.00
0.25
0.50
0.75
1.00
1.25
1.50
1.75
2.00
2.25
2.50
1 2 3 4 5 6 7 8 9 10 11 12 13 14 15 16 17 18 19 20
23SEP9-P49-QR16.D
Retention time [min]
Ratio A258/A280
0.00
0.25
0.50
0.75
1.00
1.25
1.50
1.75
2.00
2.25
2.50
1 2 3 4 5 6 7 8 9 10 11 12 13 14 15 16 17 18 19 20
23SEP9-P49-QR16.D
Retention time [min]
Ratio A258/A280
Figure 85: A258/A280 plotted against retention time
(Results from M. Mahut)
As it can be seen in Figure 85, analysis of real samples with quinine carbamate
based stationary phase does not enable sufficient separation between plasmidic
DNA and impurities. In Figure 85, the plot A258/A280 against retention time shows that
the pDNA (A258/A280 = 1.8-2.0) is highly contaminated as a result of insufficient
selectivity. Thus, a purification step before analyzing with the quinine modified silica
material is necessary.
However, size exclusion chromatography (Sepax SRT-SEC based on silica 5 µm,
1000 Å, 150 x 7.8 mm ID) in the first dimension enables purification and isolation of
the desired DNA peak which is then directly loaded onto the second column (O-9-
allylcarbamoyl-10,11-dihydroquinine on Daiso 5 µm, 120 Ǻ, column dimension: 150 x
4 mm ID), which provides the separation of topoisomers.

Development of 2D HPLC method for analysis of topoisomer distribution in
fermentation samples and application to In-Process-Control (IPC) samples
102
Details of the 2D HPLC method Measurements were performed with Ultimate 3000 (Dionex) system which
provides two separate ternary gradient pumps, switching valve for fraction transfer in
heartcut and comprehensive online 2D HPLC.
Figure 86 and 87 schematically visualize the 2D HPLC system. Initially, both
valves are in the 10-1 port position thus both columns are not connected with each
other i.e. they are operated individually by two distinct pump. The sample is injected
into the SEC-SRT column using the loading pump followed by detection being
wasted. In contrary, the micro pump transports the buffer into the sample loop
followed by the quinine based column and is afterwards wasted without detection.
By switching both valves to the 1-2 port position, the buffer flows through the SEC
SRT column too but the analytes can not be detected anymore because instead of
getting to the detector they are transported into the sample loop and afterwards to
the waste. Thus, the desired peak of the first size exclusion chromatogram containing
the analyte can be cut out and collected in the sample loop. Before the analyte is
wasted, the left valve has to be switched to the 10-1 position again, whereby the right
valve stays in the 1-2 position. As a consequence, the analyte which is in the sample
loop is transferred to the second column, namely the quinine carbamate phase. After
being separated again, the analyte is detected and subsequently wasted. It would
use implementation of another detector after the first dimension column.
This method enables combination of two steps, purification and topoisomer
selectivity but only the analyte passing both columns can be detected. Detection
directly after passing the size exclusion chromatography is not possible as a
consequence of switching the right valve to the 1-2 port position.

Development of 2D HPLC method for analysis of topoisomer distribution in
fermentation samples and application to In-Process-Control (IPC) samples
103
Left valve: 10-1 port, right valve: 10-1 port Pump 1 (Loading Pump) 6-port injection valve SEC column (1st dimension)
Detector Waste
Sample loop left valve 10-port right valve 10-port
Quinine-based column (2nd dimension)
Pump 2 (Micro Pump)
a) Loading pump → 1st column (SEC) →
detector → waste b) Micro pump → sample loop → 2nd column
(QN) → waste
Left valve: 1-2 port, right valve: 1-2 port
2
10
8 7
1 3
56
2
10
8 7
4
1 3
596
Pump 1 ( Loading Pump)6-port injection valve SEC column (1stdimension )
Detector WasteSample loop
left valve 1 -port right valve 1-port
Quinine-based column (2nddimension )
Pump 2 ( Micro Pump)
49
2
10
8 7
1 3
56
2
10
8 7
4
1 3
596
2
10
8 7
4
1 3
596
Pump 1 ( Loading Pump)6-port injection valve SEC column (1stdimension )
Detector WasteSample loop
left valve 1 -port right valve 1-port
Quinine-based column (2nddimension )
Pump 2 ( Micro Pump)
49
a) Loading pump → 1st column (SEC) → sample loop → waste
b) Micro pump → 2nd column (QN) → detector → waste
Figure 86: Scheme of the 2D HPLC setups (1)
Left valve: 10-1 port, right valve: 1-2 port
2
10
8 7
4
1 3
596
Pump 1 ( Loading Pump)6-port injection valve SEC column (1stdimension )
Detector Waste
Sample loop left valve 10-port right valve 1-port
Quinine-based column (2nddimension )
Pump 2 ( Micro Pump)
2
10
8 7
4
1 3
596
2
10
8 7
4
1 3
596
Pump 1 ( Loading Pump)6-port injection valve SEC column (1stdimension )
Detector Waste
Sample loop left valve 10-port right valve 1-port
Quinine-based column (2nddimension )
Pump 2 ( Micro Pump)
2
10
8 7
4
1 3
596
Pump 1 ( Loading Pump)6-port injection valve SEC column (1stdimension )
Detector Waste
Sample loop left valve 10-port right valve 1-port
Quinine-based column (2nddimension )
Pump 2 ( Micro Pump)
2
10
8 7
4
1 3
596
2
10
8 7
4
1 3
596
Pump 1 ( Loading Pump)6-port injection valve SEC column (1stdimension )
Detector Waste
Sample loop left valve 10-port right valve 1-port
Quinine-based column (2nddimension )
Pump 2 ( Micro Pump)
a) Loading pump → 1st column (SEC) → waste b) Micro pump → sample loop → 2nd column (QN) → detector → waste
Figure 87: Scheme of the 2D HPLC setups (2)

Development of 2D HPLC method for analysis of topoisomer distribution in
fermentation samples and application to In-Process-Control (IPC) samples
104
12.2 Analysis of IPC samples
To investigate the influence of the circadian and harvest time point, the
topoisomer distribution was analyzed. Therefore, biomass samples were taken every
uneven hour (2 h intervals) during fermentation. Subsequently cell disintegration
using alkaline lysis was carried out before analysis. Full topological analysis could be
achieved by chromatographic separation of the crude lysate.
Two different plasmid samples (AS24 – 3347, pMCP1; bp, AS25 – 4892 bp) had
to be investigated, whereby the biomass samples contained all cell compounds
except of genomic DNA.
Notation of AS24 samples
Table 49: Numbering of samples concerning their feed time (3347 bp plasmid)
Sample no. day time feed time [h]
0 7 am -
1 8 am 0
3 10 am 2
5 12 am 4
7 2 pm 6
9 4 pm 8
11 6 pm 10
13 8 pm 12
15 10 pm 14
17 12 pm 16
19 2 am 18
21 4 am 20
23 6 am 22
25 8 am 24
27 10 am 26
29 12 am 28

Development of 2D HPLC method for analysis of topoisomer distribution in
fermentation samples and application to In-Process-Control (IPC) samples
105
Notation of AS25 samples
Table 50: Numbering of samples concerning their feed time (4892 bp plasmid)
sample no. day time feed time [h]
0 10:30 am -
1 01:30 pm 0
3 03:30 pm 2
5 05:30 pm 4
7 07:30 pm 6
9 09:30 pm 8
11 11:30 pm 10
13 01:30 am 12
15 03:30 am 14
17 05:30 am 16
19 07:30 am 18
21 09:30 am 20
23 11:30 am 22
25 01:30 pm 24
27 03:30 pm 26
29 05:30 pm 28
The biomass pellets were suspended in 2 mL buffer A (50 mM Tris-HCl, 10 mM
Di-Na-EDTA adjusted to pH 7.9-8.1 with NaOH) for homogenization. Therefore 2 mL
buffer B (0.2 M NaOH, 1% SDS) was added, mixed and incubated at r.t. for 3
minutes. Afterwards the suspension was neutralized with 2 mL buffer C (3 M
potassium acetate adjusted to pH 5.4-5.6 with glacial acetic acid) and 3 minutes
incubated at 4°C (in the fridge). For the removal of the solid particles the samples
were centrifuged for 15 minutes at 4°C followed by a filtration using a 0.2 µm filter
and then analyzed with a 2D-HPLC system (SEC-AIEX).
In general, the lysate of AS25 samples were less concentrated and needed to be
enriched using a QIAGEN Kit followed by precipitation with isopropanol, washing with
70% ethanol and air-drying of the DNA pellets. The addition of alcohol or organic
solvents changes the solvent polarity and inhibits therefore the interactions of the
hydrophilic groups of the DNA surface with water. In further consequence, the
molecules tend to precipitate because of their decreasing solubility. Afterwards the
DNA was dissolved in about 100 µL 20 mM Tris-HCl (adjusted to pH 8.0).

Development of 2D HPLC method for analysis of topoisomer distribution in
fermentation samples and application to In-Process-Control (IPC) samples
106
By adding SDS to some samples of AS25 (no. 7-13, 25) started strongly to foam
resulting in partial destruction of the samples. Thus no results for those samples
could be obtained.
Optimized method for IPC analysis
Table 51: Column switching program
Time [min] Right valve port Left valve port
0 10-1 10-1
1.35 1-2 1-2
2 10-1 1-2
3.3 1-2 1-2
Table 52: Detailed method for topoisomer separation
1st dimension] 2nd dimension
Time [min] Buffer
Flow rate
[µL/min] Buffer
Flow rate
[µL/min]
0 100% Buffer A 2000 0% Buffer B 1000
1.35 100% Buffer A 2000 0% Buffer B 1000
2 100% Buffer A 2000 0% Buffer B 1000
2.1 100% Buffer A 500 0% Buffer B 1000
4 100% Buffer A 500 0% Buffer B 1000
19 100% Buffer A 500 100% Buffer B 1000
20 100% Buffer A 500 100% Buffer B 1000
20.1 100% Buffer A 500 0% Buffer B 1500
22 100% Buffer A 500 0% Buffer B 1500
22.1 100% Buffer A 500 0% Buffer B 1000
1st dimension: buffer A 0.1 M Tris-HCl, 0.1M NaCl, 1 mM EDTA, pH 7.5
2nd dimension: buffer A: 50 mM phosphate
buffer B: 50 mM phosphate + 0.6 M NaCl, 10% IPA, pH 7.2
To sum up, the analyte was purified using the SRT-SEC column in the first
dimension, whereby the desired peak was collected in the sample loop.
Subsequently, the transfered fraction of pDNA from the SEC column was separated
in the quinine based modified silica column (AIEX) and detected. As a result,
purification and separation of topoisomers could be performed within one step.

Development of 2D HPLC method for analysis of topoisomer distribution in
fermentation samples and application to In-Process-Control (IPC) samples
107
7.00 7.50 8.00 8.50 9.00 9.50 10.00 10.50 11.00 11.50 12.00 12.50 13.00 13.50 14.00 14.50 15.00 15.50 16.00
-100
125
250
375
500
625
750
900
Absorbance [mAU]
Time [min]
4 - 10,147 5 - 10,343
6 - 10,523
7 - 10,723
8 - 10,910
9 - 11,107
10 - 11,310
11 - 11,537
12 - 11,780
13 - 12,003
14 - 12,20715 - 12,393
Figure 88: Chromatogram of supercoiled pMCP1 analyzed employing optimized 2D HPLC method described in Table 51-52
An example for this optimized method is given in Figure 88, which illustrates the
topoisomers separation from the supercoiled pMCP1 plasmid.
12.3 Results
16 crude samples of each plasmid (AS 24, AS 25) were analyzed using the 2D
HPLC system (1st dimension: SRT SEC, 2nd dimension: allylcarbamoyl
dihydroquinine) and the optimized method (see Table 51-52).
In following chromatograms the arrows are indicating the peak of maximum of
supercoiling of topoisomer distribution.

Development of 2D HPLC method for analysis of topoisomer distribution in
fermentation samples and application to In-Process-Control (IPC) samples
108
Analysis of AS24 plasmid (3347 bp)
0,5
1,0
1,80λdet=258nm
Absorbance [mAU]
0,5
1,0
1,5
2,0
1,0
2,0
2,5
7 am
8 am
10 am
-9,0
-5,0
-1,0
-95,0
-92,0
-89,5
7,00 7,50 8,00 8,50 9,00 9,50 10,00 10,50 11,00 11,50 12,00 12,50 13,00 13,50 14,00-6,5
-0,5
Time [min]
12 am
2 pm
4 pm
0,5
1,0
1,80λdet=258nm
Absorbance [mAU]
0,5
1,0
1,5
2,0
1,0
2,0
2,5
7 am
8 am
10 am
-9,0
-5,0
-1,0
-95,0
-92,0
-89,5
7,00 7,50 8,00 8,50 9,00 9,50 10,00 10,50 11,00 11,50 12,00 12,50 13,00 13,50 14,00-6,5
-0,5
Time [min]
12 am
2 pm
4 pm
Figure 89: Topoisomer distribution of 3.3 kbp plasmid from 7 am to 4 pm
-1,0
-1,0
1,0
1,0
2,0
Absorbance [mAU]
λdet=258nm
6 pm
8 pm
10 pm6,0
8,0
12 pm
2 am
7,00 7,50 8,00 8,50 9,00 9,50 10,00 10,50 11,00 11,50 12,00 12,50 13,00 13,50 14,00Time [min]
-1,0
-1,0
1,0
1,0
2,0
Absorbance [mAU]
λdet=258nm
6 pm
8 pm
10 pm6,0
8,0
12 pm
2 am
7,00 7,50 8,00 8,50 9,00 9,50 10,00 10,50 11,00 11,50 12,00 12,50 13,00 13,50 14,00Time [min]
1,0
1,0
2,0
Absorbance [mAU]
λdet=258nm
6 pm
8 pm
10 pm6,0
8,0
12 pm
2 am
7,00 7,50 8,00 8,50 9,00 9,50 10,00 10,50 11,00 11,50 12,00 12,50 13,00 13,50 14,00Time [min]
Figure 90: Topoisomer distribution of 3.3 kbp plasmid from 6 pm to 2 am

Development of 2D HPLC method for analysis of topoisomer distribution in
fermentation samples and application to In-Process-Control (IPC) samples
109
2,5
5,0
8,0Absorbance [mAU]
5,0
10,0
2,5
5,0
9,0
7,00 7,50 8,00 8,50 9,00 9,50 10,00 10,50 11,00 11,50 12,00 12,50 13,00 13,50 14,000,0
2,5
5,0
9,0
Time [min]
λdet=258nm
6 am
8 am
10 am
12 am
2,5
5,0
8,0Absorbance [mAU]
5,0
10,0
2,5
5,0
9,0
7,00 7,50 8,00 8,50 9,00 9,50 10,00 10,50 11,00 11,50 12,00 12,50 13,00 13,50 14,000,0
2,5
5,0
9,0
Time [min]
λdet=258nm
6 am
8 am
10 am
12 am
Figure 91: Topoisomer distribution of 3.3 kbp plasmid from 6 am to 12 am
In Figure 89-91 the topoisomer distribution with labelling of the maximum peak
can be seen. At the beginning, the plasmid showed the highest supercoiling which is
subsequently decreasing with increasing fermentation time. The longer the
fermentation time was, the more concentrated the samples were resulting in a loss of
resolution due to overloading phenomena.
7 am
8 am
10 a
m
12 a
m
2 pm
4 pm
6 pm
8 pm
10 p
m
12 p
m
2 am
4 am
6 am
8 am
10 a
m
12 a
m
day time
-7-6-5-4-3-2-10Sh
iftof
link
ing
num
ber
refe
rred
to s
ampl
eno
. 0
ΔL k
7 am
8 am
10 a
m
12 a
m
2 pm
4 pm
6 pm
8 pm
10 p
m
12 p
m
2 am
4 am
6 am
8 am
10 a
m
12 a
m
day time
-7-6-5-4-3-2-10Sh
iftof
link
ing
num
ber
refe
rred
to s
ampl
eno
. 0
ΔL k
7 am
8 am
10 a
m
12 a
m
2 pm
4 pm
6 pm
8 pm
10 p
m
12 p
m
2 am
4 am
6 am
8 am
10 a
m
12 a
m
day time
-7-6-5-4-3-2-10Sh
iftof
link
ing
num
ber
refe
rred
to s
ampl
eno
. 0
ΔL k
7 am
8 am
10 a
m
12 a
m
2 pm
4 pm
6 pm
8 pm
10 p
m
12 p
m
2 am
4 am
6 am
8 am
10 a
m
12 a
m
day time
-7-6-5-4-3-2-10Sh
iftof
link
ing
num
ber
refe
rred
to s
ampl
eno
. 0
ΔL k
7 am
8 am
10 a
m
12 a
m
2 pm
4 pm
6 pm
8 pm
10 p
m
12 p
m
2 am
4 am
6 am
8 am
10 a
m
12 a
m
day time
-7-6-5-4-3-2-10Sh
iftof
link
ing
num
ber
refe
rred
to s
ampl
eno
. 0
ΔL k
7 am
8 am
10 a
m
12 a
m
2 pm
4 pm
6 pm
8 pm
10 p
m
12 p
m
2 am
4 am
6 am
8 am
10 a
m
12 a
m
day time
-7-6-5-4-3-2-10Sh
iftof
link
ing
num
ber
refe
rred
to s
ampl
eno
. 0
ΔL k
Figure 92: Change of linking number with fermentation time

Development of 2D HPLC method for analysis of topoisomer distribution in
fermentation samples and application to In-Process-Control (IPC) samples
110
This graph shows that after approximately 15 hours fermentation duration (10 pm)
a maximum of linking number difference referred to the sample at the beginning (7
am) was reached. Afterwards the linking number fluctuates between -4 and -6.
Additionally, it should be mentioned that there is no dramatic shift between 6 pm
and 12 am (after 11 hours of fermentation) and that the relative quantity of
topoisomers (distribution pattern) does not change with the fermentation process
anymore. Thus the equilibrium of topoisomers distributions is reached after
approximately 11 to15 hours of fermentation.
Analysis of AS25 plasmid (4892 bp)
2,0
5,0
Absorbance[mAU]
2,0
4,0
6,0
9,00 9,50 10,00 10,50 11,00 11,50 12,00 12,50 13,00 13,50 14,00 14,50 15,00 15,50
-3,0
-2,0
-1,0
0,0
1,0
min
λdet=258nm
10:30 am
01:30 pm
2,0
5,0
Absorbance[mAU]
2,0
4,0
6,0
9,00 9,50 10,00 10,50 11,00 11,50 12,00 12,50 13,00 13,50 14,00 14,50 15,00 15,50
-3,0
-2,0
-1,0
0,0
1,0
min
λdet=258nm
03:30 pm
2,0
5,0
Absorbance[mAU]
2,0
4,0
6,0
9,00 9,50 10,00 10,50 11,00 11,50 12,00 12,50 13,00 13,50 14,00 14,50 15,00 15,50
-3,0
-2,0
-1,0
0,0
1,0
min
λdet=258nm
10:30 am
01:30 pm
2,0
5,0
Absorbance[mAU]
2,0
4,0
6,0
9,00 9,50 10,00 10,50 11,00 11,50 12,00 12,50 13,00 13,50 14,00 14,50 15,00 15,50
-3,0
-2,0
-1,0
0,0
1,0
min
λdet=258nm
03:30 pm
Figure 93: Topoisomer distribution of 4.9 kbp plasmid from 10:30 am to 03:30 pm
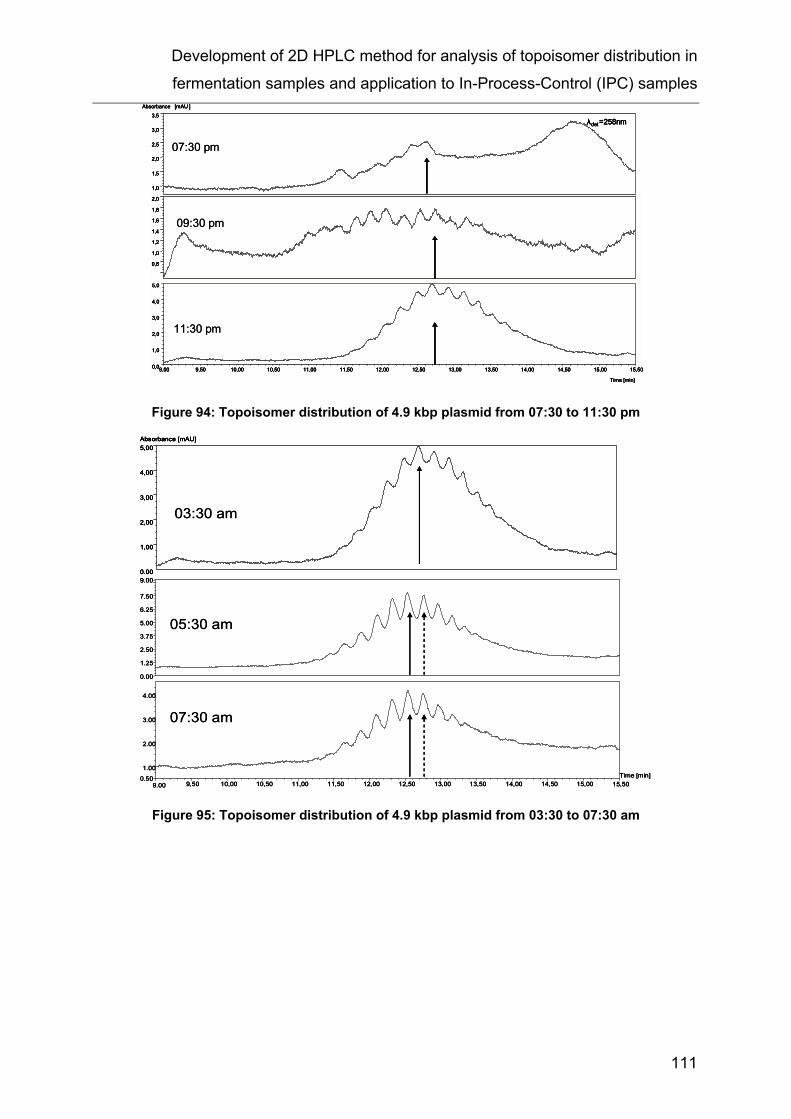
Development of 2D HPLC method for analysis of topoisomer distribution in
fermentation samples and application to In-Process-Control (IPC) samples
111
0,8
1,0
1,2
1,4
1,6
1,8
2,0
9,00 9,50 10,00 10,50 11,00 11,50 12,00 12,50 13,00 13,50 14,00 14,50 15,00 15,500,0
1,0
2,0
3,0
4,0
5,0
Time [min]
1,0
1,5
2,0
2,5
3,0
3,5
Absorbance [mAU ]
07:30 pm
09:30 pm
11:30 pm
λdet=258nm
0,8
1,0
1,2
1,4
1,6
1,8
2,0
9,00 9,50 10,00 10,50 11,00 11,50 12,00 12,50 13,00 13,50 14,00 14,50 15,00 15,500,0
1,0
2,0
3,0
4,0
5,0
Time [min]
1,0
1,5
2,0
2,5
3,0
3,5
Absorbance [mAU ]
λdet=258nm
0,8
1,0
1,2
1,4
1,6
1,8
2,0
9,00 9,50 10,00 10,50 11,00 11,50 12,00 12,50 13,00 13,50 14,00 14,50 15,00 15,500,0
1,0
2,0
3,0
4,0
5,0
Time [min]
1,0
1,5
2,0
2,5
3,0
3,5
Absorbance [mAU ]
07:30 pm
09:30 pm
11:30 pm
λdet=258nm
0,8
1,0
1,2
1,4
1,6
1,8
2,0
9,00 9,50 10,00 10,50 11,00 11,50 12,00 12,50 13,00 13,50 14,00 14,50 15,00 15,500,0
1,0
2,0
3,0
4,0
5,0
Time [min]
1,0
1,5
2,0
2,5
3,0
3,5
Absorbance [mAU ]
λdet=258nm
Figure 94: Topoisomer distribution of 4.9 kbp plasmid from 07:30 to 11:30 pm
0.00
1,00
2,00
3,00
4,00
5,00Absorbance [mAU]
0.00
1.25
2.50
3.75
5.00
6.25
7.50
9.00
9.00 9,50 10,00 10,50 11,00 11,50 12,00 12,50 13,00 13,50 14,00 14,50 15,00 15,500.50
1.00
2.00
3.00
4.00
Time [min]
03:30 am
05:30 am
07:30 am
0.00
1,00
2,00
3,00
4,00
5,00Absorbance [mAU]
0.00
1.25
2.50
3.75
5.00
6.25
7.50
9.00
9.00 9,50 10,00 10,50 11,00 11,50 12,00 12,50 13,00 13,50 14,00 14,50 15,00 15,500.50
1.00
2.00
3.00
4.00
Time [min]
0.00
1,00
2,00
3,00
4,00
5,00Absorbance [mAU]
0.00
1,00
2,00
3,00
4,00
5,00Absorbance [mAU]
0.00
1.25
2.50
3.75
5.00
6.25
7.50
9.00
9.00 9,50 10,00 10,50 11,00 11,50 12,00 12,50 13,00 13,50 14,00 14,50 15,00 15,500.50
1.00
2.00
3.00
4.00
Time [min]
03:30 am
05:30 am
07:30 am
Figure 95: Topoisomer distribution of 4.9 kbp plasmid from 03:30 to 07:30 am

Development of 2D HPLC method for analysis of topoisomer distribution in
fermentation samples and application to In-Process-Control (IPC) samples
112
0,0
5,0
10,0
13,0Absorbance [mAU]
0,0
5,0
10,0
13,0
1,00
2,00
3,00
4,00
5,00
09:30 am
11:30 am
03:30 pm
9,00 9,50 10,00 10,50 11,00 11,50 12,00 12,50 13,00 13,50 14,00 14,50 15,00 15,500,0
2,0
4,0
6,0
8,0
10,0
12,0
9,00 9,50 10,00 10,50 11,00 11,50 12,00 12,50 13,00 13,50 14,00 14,50 15,00 15,500,0
2,0
4,0
6,0
8,0
10,0
12,0
Time [min]
05:30 pm
0,0
5,0
10,0
13,0Absorbance [mAU]
0,0
5,0
10,0
13,0
1,00
2,00
3,00
4,00
5,00
09:30 am
11:30 am
03:30 pm
9,00 9,50 10,00 10,50 11,00 11,50 12,00 12,50 13,00 13,50 14,00 14,50 15,00 15,500,0
2,0
4,0
6,0
8,0
10,0
12,0
9,00 9,50 10,00 10,50 11,00 11,50 12,00 12,50 13,00 13,50 14,00 14,50 15,00 15,500,0
2,0
4,0
6,0
8,0
10,0
12,0
Time [min]
05:30 pm
Figure 96: Topoisomer distribution of 4.9 kbp plasmid from 09:30 am to 05:30 pm
Figure 93-96 show the resulting chromatograms of crude samples of pMCP1
taken every uneven hour during fermentation process. The arrows indicate the
maximum of supercoiling for each topoisomer distribution. The plasmidic samples
were less concentrated compared to the AS24 plasmid, thus all samples except of
no. 3 (03:30 pm) had to be concentrated using the QIAGEN-Kit (see page 103).
By comparing the arrows it can be seen that the supercoiling was increasing with
increasing fermentation time and the equilibrium was reached somewhere between
03:30 am and 03:30 pm.
The samples between 05:30 pm and 11:30 pm do not exist due to a few problems
which emerged during the alkaline lysis – after the addition of buffer B which
contained 1% SDS, the solution foamed over and the sample could not be used for
further measurements.

Development of 2D HPLC method for analysis of topoisomer distribution in
fermentation samples and application to In-Process-Control (IPC) samples
113
0
1
2
3
4
5
6
7
day time
Shift
of li
nkin
gnu
mbe
rre
ferr
edto
sam
ple
no. 1
ΔLk
10:3
0 am
01:3
0 pm
03:3
0 pm
03:3
0 pm
01:3
0 pm
03:3
0 pm
11:3
0 am
09:3
0 am
07:3
0 am
05:3
0 am
03:3
0 am
01:3
0 am
11:3
0 pm
05:3
0 pm
07:3
0 pm
09:3
0 pm
0
1
2
3
4
5
6
7
day time
Shift
of li
nkin
gnu
mbe
rre
ferr
edto
sam
ple
no. 1
ΔLk
10:3
0 am
01:3
0 pm
03:3
0 pm
03:3
0 pm
01:3
0 pm
03:3
0 pm
11:3
0 am
09:3
0 am
07:3
0 am
05:3
0 am
03:3
0 am
01:3
0 am
11:3
0 pm
05:3
0 pm
07:3
0 pm
09:3
0 pm
0
1
2
3
4
5
6
7
day time
Shift
of li
nkin
gnu
mbe
rre
ferr
edto
sam
ple
no. 1
ΔLk
10:3
0 am
01:3
0 pm
03:3
0 pm
03:3
0 pm
01:3
0 pm
03:3
0 pm
11:3
0 am
09:3
0 am
07:3
0 am
05:3
0 am
03:3
0 am
01:3
0 am
11:3
0 pm
05:3
0 pm
07:3
0 pm
09:3
0 pm
0
1
2
3
4
5
6
7
day time
Shift
of li
nkin
gnu
mbe
rre
ferr
edto
sam
ple
no. 1
ΔLk
10:3
0 am
01:3
0 pm
03:3
0 pm
03:3
0 pm
01:3
0 pm
03:3
0 pm
11:3
0 am
09:3
0 am
07:3
0 am
05:3
0 am
03:3
0 am
01:3
0 am
11:3
0 pm
05:3
0 pm
07:3
0 pm
09:3
0 pm
Figure 97: Change of linking number with fermentation
This graph illustrates that after approximately 15 hours of fermentation the
maximum of linking number difference referred to the origin sample and equilibrium
of topoisomer distribution is reached and then fluctuating around the shift of +5
supercoils.
Furthermore, there is no dramatic shift of the distribution between 03:30 am and
03:30 pm which indicates that there is no influence of the reaction time to the
fermentation process anymore. Moreover, it should be mentioned that with these
results, it is not possible to make an explicit distinction between the reaction time and
the daytime.
It could be shown, that the online 2D HPLC can be successfully used for
topoisomer analysis. The combination of size exclusion and anion exchange
chromatography enables analysis within one step in an automated manner.
Furthermore, results mentioned above confirmed that the fermentation time
indeed influences the topoisomer distribution in the first 13 to 15 hours before
reaching an equilibrium of supercoiling.
The consequences of different topoisomers are not clarified yet because so far no
preparation was possible. Eventually, the supercoiling can influence the transcription
process and efficiency of vectors for therapeutic applications.

Summary
114
13 Summary This diploma thesis is dealing with the analysis of plasmid DNA isoforms and
topoisomers. Plasmids are extrachromosomal, double-stranded DNA molecules and
they appear in different topologies: supercoiled (ccc), open-circular (oc) and linear
(lin). They are used as vectors for gene therapy and vaccination, whereby the ccc
form is believed to be the most active topological isoform. Plasmidic DNA can be
analyzed using capillary gel electrophesis (CGE), agarose gel electrophoreses (AGE)
or high performance liquid chromatography (HPLC), whereby an HPLC method is the
one with the most promising future.
During my diploma thesis, validation of new methods employing new stationary
phases based on two different chemoaffinity selectors based on quinine carbamate
(PCQ) was performed for two different plasmids (4.9 kb and 15 kb). This study
involved preparation of suitable standards for the oc form. It is critical and a difficult
task to produce a representative oc standard with a similar topology to the natural
occurring oc. Therefore heat treatment for the pMCP1 plasmid and the enzymatic
reaction (enzyme: Nt.BstNBI) for the larger pGNA3 plasmid were optimized and
subsequently isolated using the PCQ based stationary phase. The preparation was in
both cases successful, as controlled with agarose gel electrophoresis. It is not
completely sure how many nicks within one DNA strand were produced during these
treatments but no obvious differences concerning the chromatographic or
electrophoretic behaviour could be observed between the synthesized oc standards
and natural oc form in ccc plasmid form. In literature, no useful production protocols
of the open circular form could be found, thus it is still a content of research.
Another issue was the reliable detection and quantification of this oc form.
Preliminary measurements performed from M. Mahut (PhD thesis (2010) University
of Vienna) showed, that the poor recovery of this isoform exists due to its reversible
but tight adsorption at the glass wool frits. To make the oc analysis more accurate
glass wool frits were replaced by metal ones like stainless steel frits if possible.
Stainless steel columns (150 x 4 mm ID) were packed with porous PCQ modified
silica particles (100 Å, 5 µm) and the experimental conditions optimized. Resultant
method allowed separation of oc and ccc forms with high resolution, thus greatly
improved compared to state-of-art DNA-NPR (Tosoh). Unfortunately, lin and oc
coeluted. On the other hand, validation showed that recovery for oc form (pMCP1:

Summary
115
~112% recovery, pGNA3: ~102% recovery) is much better than with DNA-NPR
(pMCP1: ~60 % recovery).
The linearity range of the DNA-NPR column yielded slightly wider or equal
concentration ranges (pMCP1: 0.01-7µg ccc, 0.01-1 µg oc, 0.01-3 µg lin) compared
to the novel material (pMCP1: 0.1-7 µg ccc, 0.04-7 µg oc and lin; pGNA3: 0.04-10 µg
ccc and lin, 0.01-3 µg oc) but PCQ based column offers higher sample loadings and
is therefore more suitable for semi-preparative applications. Furthermore the quinine
carbamate based material offered better intra-assay precision (RSD of peak area:
0.6-1.5%; DNA-NPR: RSD of peak area: 0.8-6.4%) and in general lower limits of
detection and quantitation. Based on these results, the novel material has a greater
benefit.
However, the selectivity between the oc and the linear form was improved when
using 1.5 µm NPS silica particles as support (Rs of 0.7 between oc and lin). In
principle, the validation was completed successfully also for this stationary phase
except for the oc standard sample that was degraded, reflecting the complexity of
this topic. Precisions of 1.9% for the ccc and 2.3% for the lin isoform and a linearity
range over the entire measured concentration range (0.05-0.5 µg pDNA) for both
isoforms was found. Furthermore, the stability of this NPS chromatographic material
was unsatisfactory enabling only approximately 20 injections. This approach is still
promising, but the selector binding chemistry and therefore the stability of this column
has to be improved.
The second part of this diploma work dealt with the in-process control (IPC) of the
degree of supercoiling in the course of fermentation process. Thus, topoisomer
distributions had been investigated on two different samples to study the influence of
fermentation duration on relative topoisomer abundances. Therefore, an Ultimate
3000 system which provides two separate ternary pumps and switching valves for
fraction transfer in heartcut and comprehensive online 2D HPLC was used for
measurements. In the first dimension the sample was purified using a SRT-SEC
column (5 µm, 1000 Å, 150 x 7.8 mm ID) and subsequently collected in the sample
loop. Afterwards, the valves were switched enabling the separation of the collected
analyte with allylcarbamoyl dihydroquinine based silica phase (5 µm, 120 Ǻ, 150 x 4
mm ID) in the second dimension and detected. The 2D system is essential due to the
fact that the size exclusion phase only enables purification of the plasmidic sample

Summary
116
and does not provide topoisomer selectivity. In contrast, the quinine carbamate
based stationary phase does indeed provide an adequate toposelectivity but the
material can not separate the plasmid from impurities. Thus this 2D HPLC method is
essential for such a topic.
In process control samples were taken every 2 hours from the fermentation
process and analyzed with the 2D HPLC method described before. The results of the
smaller plasmid (3347 bp) showed that at the beginning the supercoiling is
decreasing until reaching a linking number of -5 after approximately 15 hours.
Afterwards the distribution pattern does not change with the fermentation process
anymore. Analyzing the larger plasmid (4892 bp), a few problems associated with the
alkaline lysis occurred. Moreover, the larger plasmid was less concentrated which
required additional preconcentration steps causing a lack of data for several
samples. Resultant chromatograms showed an increase of +6 supercoils during
fermentation in the first 13 hours followed by fluctuation around the shift of +5
supercoils. Results of both samples revealed that in the first few hours the biggest
shift of supercoiling takes place, but no influence of the circadian rhythm could be
found.
To sum up, the results presented in this thesis point out important properties of a
chromatographic material that is intended for use in pDNA isoform and topoisomer
separation and analysis. Significantly improved chromatographic methods for this
purpose have been developed in this work based on a chemoaffinity principle, and
they have been successfully validated for pDNA isoform analysis of a 4.9 and 15 kb
plasmid. Further on, a new online 2D-HPLC method based on SEC and quinine
carbamate chemoaffinity chromatography has been presented for the in-process
control of supercoiling and topoisomer distributions respectively in pDNA
manufacturing during fermentation on two different plasmids. Ongoing investigations
will hopefully enhance these types of chromatographic separations based on quinine
carbamate and lead to materials with improved long term stability materials.
Moreover, further research is needed for a full understanding of the fundamental
mechanism of pDNA interaction with the quinine carbamate silica, especially
concerning the various open circular isoforms.

Acknowledgments
117
14 Acknowledgments First of all I would like to express my sincere gratitude to my professor Dr.
Lämmerhofer for giving me the opportunity to write my diploma thesis in his working
group. I would like to thank him explicitly for the continuous support of my study and
research.
I would also like to acknowledge Professor Dr. Lindner for his support, help and
participation in my thesis.
Furthermore, I owe my deepest gratitude to Marek. Without his patience,
knowledge and the enormous time he invested in helping me, my thesis would not be
the way it is. He always supported me mentally during my laboratory research and
had faith in me. He proved right: After a huge disappointment, I measured one of the
best resolutions up to this day. His guidance helped me in all times of research and
compiling this thesis.
Moreover, I would like to thank all members of the working group (Lindner group)
who accepted, motivated and encouraged me since my first day (especially with
funny and entertaining movies). I thank you all for being patient and watching my
favourite serials.
Special thanks to Andrea for the electronic music entertainment and also to Heli
for accepting it.
I would like to mention my study colleagues, who accompanied me during the
stressful but also very amusing study, as well as all my friends from Vienna and Linz.
Finally, I am grateful for my familiy's unrestricted support and for the chance to
study in Vienna, even if I decided the subject of my studies very spontaneously. Their
encouragement helped me throughout the years, even if I should be more cautious in
the lab according to my dad. Last but not least, my sister Angela supported me
mentally which I would like to thank her for.
Without the help of all the people mentioned above, I would not have been able to
write this diploma thesis.
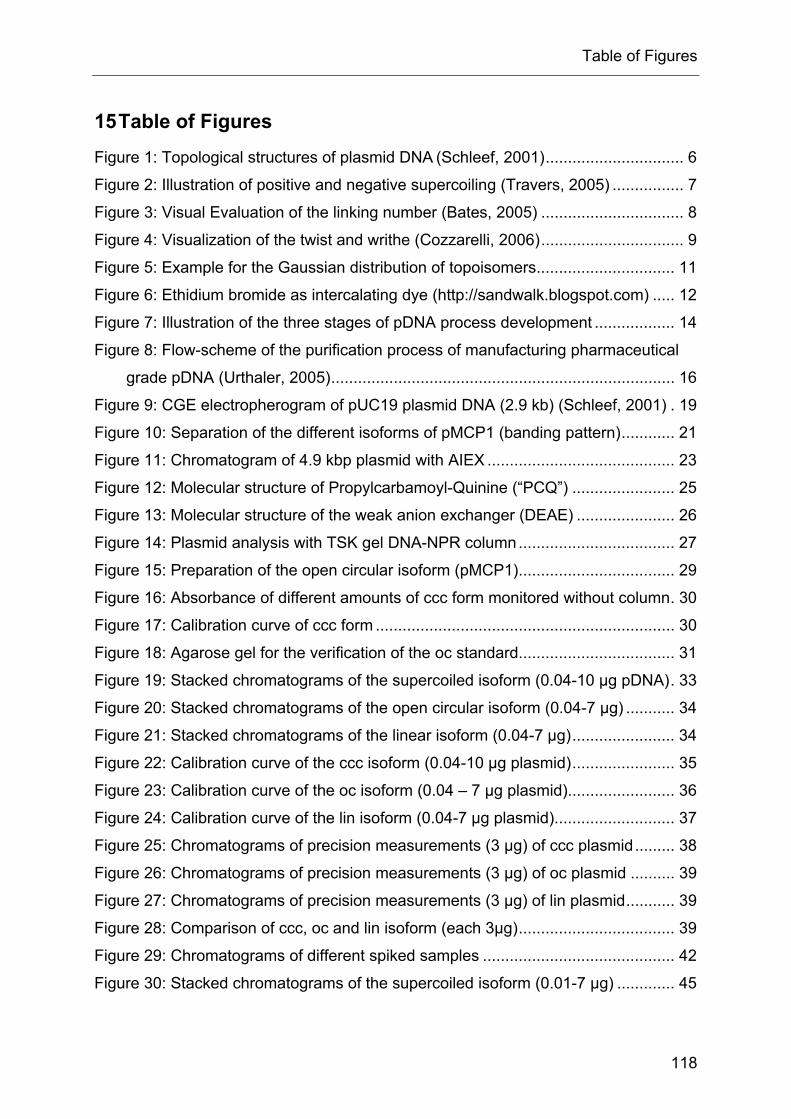
Table of Figures
118
15 Table of Figures Figure 1: Topological structures of plasmid DNA (Schleef, 2001)............................... 6
Figure 2: Illustration of positive and negative supercoiling (Travers, 2005) ................ 7
Figure 3: Visual Evaluation of the linking number (Bates, 2005) ................................ 8
Figure 4: Visualization of the twist and writhe (Cozzarelli, 2006)................................ 9
Figure 5: Example for the Gaussian distribution of topoisomers............................... 11
Figure 6: Ethidium bromide as intercalating dye (http://sandwalk.blogspot.com) ..... 12
Figure 7: Illustration of the three stages of pDNA process development .................. 14
Figure 8: Flow-scheme of the purification process of manufacturing pharmaceutical
grade pDNA (Urthaler, 2005)............................................................................. 16
Figure 9: CGE electropherogram of pUC19 plasmid DNA (2.9 kb) (Schleef, 2001) . 19
Figure 10: Separation of the different isoforms of pMCP1 (banding pattern)............ 21
Figure 11: Chromatogram of 4.9 kbp plasmid with AIEX .......................................... 23
Figure 12: Molecular structure of Propylcarbamoyl-Quinine (“PCQ”) ....................... 25
Figure 13: Molecular structure of the weak anion exchanger (DEAE) ...................... 26
Figure 14: Plasmid analysis with TSK gel DNA-NPR column................................... 27
Figure 15: Preparation of the open circular isoform (pMCP1)................................... 29
Figure 16: Absorbance of different amounts of ccc form monitored without column. 30
Figure 17: Calibration curve of ccc form ................................................................... 30
Figure 18: Agarose gel for the verification of the oc standard................................... 31
Figure 19: Stacked chromatograms of the supercoiled isoform (0.04-10 µg pDNA). 33
Figure 20: Stacked chromatograms of the open circular isoform (0.04-7 µg) ........... 34
Figure 21: Stacked chromatograms of the linear isoform (0.04-7 µg)....................... 34
Figure 22: Calibration curve of the ccc isoform (0.04-10 µg plasmid)....................... 35
Figure 23: Calibration curve of the oc isoform (0.04 – 7 µg plasmid)........................ 36
Figure 24: Calibration curve of the lin isoform (0.04-7 µg plasmid)........................... 37
Figure 25: Chromatograms of precision measurements (3 µg) of ccc plasmid......... 38
Figure 26: Chromatograms of precision measurements (3 µg) of oc plasmid .......... 39
Figure 27: Chromatograms of precision measurements (3 µg) of lin plasmid........... 39
Figure 28: Comparison of ccc, oc and lin isoform (each 3µg)................................... 39
Figure 29: Chromatograms of different spiked samples ........................................... 42
Figure 30: Stacked chromatograms of the supercoiled isoform (0.01-7 µg) ............. 45

Table of Figures
119
Figure 31: Stacked chromatograms of the open circular supercoiled isoform (0.01-1
µg) ..................................................................................................................... 45
Figure 32: Stacked chromatograms of the linear isoform (0.01-3 µg)....................... 46
Figure 33: Calibration curve of the ccc-isoform (0.01-7 µg plasmid)......................... 47
Figure 34: Calibration curve of the oc-isoform (0.01-1 µg plasmid) .......................... 47
Figure 35: Calibration curve of the lin isoform (0.01-3 µg plasmid)........................... 48
Figure 36: Chromatograms of precision measurements (3 µg) of ccc plasmid......... 49
Figure 37: Chromatograms of precision measurements (3 µg) of oc plasmid .......... 50
Figure 38: Chromatograms of precision measurements (3 µg) of lin plasmid........... 50
Figure 39: Chromatogram of different temperature treated ccc pGNA3 ................... 56
Figure 40: Chromatogram after the enzymatic reaction............................................ 58
Figure 41: Calibration curve of ccc form (pGNA3) .................................................... 59
Figure 42: Agarose gel for the verification of the oc standard................................... 59
Figure 43: Stacked chromatograms of the supercoiled isoform (0.04-10 µg pDNA). 61
Figure 44: Stacked chromatograms of the open circular isoform (0.01-3 µg pDNA). 61
Figure 45: Stacked chromatograms of the linear isoform (0.04-10 µg pDNA) .......... 62
Figure 46: Calibration curve of the ccc-isoform (0.04-10 µg plasmid)....................... 63
Figure 47: Calibration curve of the oc-isoform (0.01-3 µg plasmid) .......................... 63
Figure 48: Calibration curve of the lin-isoform (0.04-10 µg plasmid) ........................ 64
Figure 49: Chromatograms of precision measurements (3 µg) of ccc plasmid......... 65
Figure 50: Chromatograms of precision measurements (0.1 µg) of oc plasmid ....... 66
Figure 51: Chromatograms of precision measurements (0.1 µg) of lin plasmid........ 66
Figure 52: Chromatograms of different spiked samples ........................................... 68
Figure 53: Enlargement of chromatogram d ............................................................. 69
Figure 54: Comparison of the chromatograms of all different isoforms .................... 71
Figure 55: Stacked chromatograms of the supercoiled isoform (0.1-3 µg) ............... 73
Figure 56: Stacked chromatograms of the linear isoform (0.1-3 µg)......................... 73
Figure 57: Calibration curve of the ccc isoform (0.1-3 µg plasmid)........................... 74
Figure 58: Calibration curve of the lin isoform (0.1-3 µg plasmid) ............................ 74
Figure 59: Chromatograms of precision measurements (1 µg) of ccc plasmid......... 76
Figure 60: Chromatograms of precision measurements (1 µg) of lin plasmid........... 76
Figure 61: Reaction scheme for the synthesis of the MICRA PCQ column .............. 78
Figure 62: Chromatogram of pMCP1 plasmid (lin, ccc) ............................................ 80
Figure 63: Stacked Chromatograms of ccc pDNA (4.9 kb) with................................ 81

Table of Figures
120
Figure 64: Influence of the temperature on chromatograms..................................... 82
Figure 65: Retention time versus temperature.......................................................... 83
Figure 66: Influence of flow rate (supercoiled plasmid, 4.9 kb)................................. 84
Figure 67: Comparison of end-capped and non end-capped material...................... 85
Figure 68: Comparison of glass wool and stainless steel frits .................................. 86
Figure 69: Chromatograms of different isoforms of p ............................................... 87
Figure 70: Chromatograms of different isoforms of pGNA3...................................... 88
Figure 71: Graphic presentation of gradient ............................................................. 89
Figure 72: Chromatogram of spiked pMCP1 using optimized method...................... 90
Figure 73: Isolation of open circular form (pMCP1, 55°C for 24h) ............................ 92
Figure 74: Agarose gel for the verification of oc standard ........................................ 92
Figure 75: Stacked chromatograms of ccc form (0.05-0.49 µg)................................ 94
Figure 76: Stacked chromatograms of lin form (0.05-0.5 µg) ................................... 94
Figure 77: Results of the ccc plasmid (0.05-0.5 µg plasmid) .................................... 95
Figure 78: Results of the lin plasmid (0.04-0.49 µg plasmid).................................... 95
Figure 79: Chromatograms of precision measurements (0.49 µg) of ccc plasmid.... 96
Figure 80: Chromatograms of precision measurements (0.5 µg) of lin plasmid........ 97
Figure 81: Overlayed Chromatgram of ccc and lin isoform (each 0.5 µg)................. 97
Figure 82: Molecule structure of O-9-allylcarbamoyl-10,11-dihydroquinine
(endcapped, based on 5 µm Daiso, 120 Ǻ) ..................................................... 100
Figure 83: Resulting chromatograms using only size exclusion column................. 100
Figure 84: Chromatogram of pMCP1 lysate using only anion exchange column.... 101
Figure 85: A258/A280 plotted against retention time.................................................. 101
Figure 86: Scheme of the 2D HPLC setups (1) ...................................................... 103
Figure 87: Scheme of the 2D HPLC setups (2) ...................................................... 103
Figure 88: Chromatogram of supercoiled pMCP1 analyzed employing optimized 2D
HPLC method described in Table 51-52.......................................................... 107
Figure 89: Topoisomer distribution of 3.3 kbp plasmid from 7 am to 4 pm ............. 108
Figure 90: Topoisomer distribution of 3.3 kbp plasmid from 6 pm to 2 am ............. 108
Figure 91: Topoisomer distribution of 3.3 kbp plasmid from 6 am to 12 am ........... 109
Figure 92: Change of linking number with fermentation time.................................. 109
Figure 93: Topoisomer distribution of 4.9 kbp plasmid from 10:30 am to 03:30 pm 110
Figure 94: Topoisomer distribution of 4.9 kbp plasmid from 07:30 to 11:30 pm ..... 111
Figure 95: Topoisomer distribution of 4.9 kbp plasmid from 03:30 to 07:30 am ..... 111
Table of Figures
121
Figure 96: Topoisomer distribution of 4.9 kbp plasmid from 09:30 am to 05:30 pm 112
Figure 97: Change of linking number with fermentation ......................................... 113

References
122
16 References Books and papers Bates A. D., Maxwell A. (2005) DNA Topology, Oxford University Press, February 18
Bhikhabhai R., Plasmid DNA Purification using Divalent Alkaline Earth Metal Ions
and two Anion Exchangers, US Patent 6410274
Birnboim H.C., Doly J. (1979) A Rapid Alkaline Extraction Procedure for Screening
Recombinant Plasmid DNA, Nucleic Acids Res 7: 1513-1523
Burda, Jaroslav V., Jiri Sponer, Jerzy Leszczynski and Pavel Hobza (1997)
Interaction of DNA Base Pairs with Various Metal Cations (Mg2+, Ca2+, Sr2+, Ba2+,
Cu+, Ag+, Au+, Zn2+, Cd2+, and Hg2+): Nonempirical ab Initio Calculations on
Structures, Energies, and Nonadditivity of the Interaction, The Journal of Physical
Chemistry B 101, No. 46 (November 1): 9670-9677
Bussey L.B., Adamson R., Atchley A. (1998) Methods for Purifying Nucleic Acids by
Tangential Flow Ultrafiltration, patent WO 9805673 (A1) Center of Biologics Evaluation and Research (CBER, 1996) Points to Consider on
Plasmid DNA Vaccines for Preventive Infectious Disease Indications (Draft
Guidance), US Food and Drug Administration, 5600 Fishers Lane Rockville,
Maryland 20852, USA
Colpan et al., Schorr J., Moritz P. (1999) Process for the Separation and Purification
of Nucleic Acids from Biological Sources, Qiagen GmbH, Hilden, Germany, patent
US005990301A
Cozzarelli, Nicholas R., Gregory J. Cost, Marcelo Nollmann, Thierry Viard and James
E. Stray (2006) Giant Proteins that move DNA: Bullies of the Genomic
Playground, Nature Reviews Molecular Cell Biology 7, No. 8: 580-588
Dean et al., Krasnow M. A., Otter R., Matzuk M. M., Spengler S. J., Cozzarelli N. R.
(1983) Escherichia Coli Type-1 Topoisomerases: Identification, Mechanism, and
Role in Recombination, Cold Spring Harbor Symposia on Quantitative Biology
47(2), page 769-777
Depew D. E. and J. C. Wang (1975) Conformational Fluctuations of DNA Helix,
Proceedings of the National Academy of Sciences of the United States of
America 72, No. 11 (November): 4275-4279
Diogo M. M., Queiroz J. A., Monteiro G. A., Martins S. A. M., Ferreira G. N. M. and
Prazeres D. M. F. (2000) Purification of a Cystic Fibrosis Plasmid Vector for Gene
References
123
Therapy using Hydrophobic Interaction Chromatography, Biotechnol Bioeng 68:
576-583
Eon-Duval A., Burke G. (2004) Purification of pharmaceutical-grade Plasmid DNA by
Anion-Exchange Chromatography in an RNase-free Process, J. Chromatography
B 804: 327-335
Ferreira G. N. M., Cabral J. M. S., Prazeres D. M. F. (1999) Development of Process
Flow Sheets for the Purification of Supercoiled Plasmids for Gene Therapy
Applications, Biotechnol Prog 15: 725-731
Ferreira G., Monteiro G. D. (2000) Downstream Processing of Plasmid DNA for Gene
Therapy and DNA Vaccine Applications, Institute Superior Técnico, Portugal
Green, A. P., Garance M., Helveston N. M., Taittinger B. E., Liu X., Thompson J. A.
(1997) Preparative Purification of Supercoiled Plasmid DNA for Therapeutic
Agents, BioPharm (Eugene, Oregon) No. 10(5), page 52-42, 56, 59-60, 62
Horn N.A., Meek J.A., Budahazi G., Marquet M. (1995) Cancer Gene Therapy using
Plasmid DNA: Purification of DNA for Human Clinical Trials, Hum Gene Ther 6:
565-573
Huber C. G. (1998) Micropellicular Stationary Phases for High-Performance Liquid
Chromatography of double-stranded DNA, Journal of Chromatography A 806, No.
1 (May 8): 3-30
ICH Harmonised Tripartite Guideline (1994) Validation of Analytical procedures: Test
an Methodology, Q2(R1), Current Step 4 version
Kelley B. D., Hatton T. A. (1991) The Fermentation/Downstream Processing
Interface, Bioseparations 1 (5-6) page 333-349
Kutzler M. A., Weiner D. B. (2008) DNA Vaccines: Ready for Prime Time? Nature
Reviews Genetics 9, No. 10 (October): 776-788
Mahut M. (2010) PhD Thesis: Analysis of Plasmid Isoforms and Supercoiled
Topoisomers by Liquid Chromatography, University of Vienna
Middaugh C. R., R. K. Evans, D. L. Montgomery and D. R. Casimiro (1998) Analysis
of Plasmid DNA from a Pharmaceutical Perspective, Journal of Pharmaceutical
Sciences 87, No. 2: 130-146
Mihăsan M., Niţă A., Artenie V. (2007) Optimal parameters for plasmid DNA
preparation using the alkaline lysis method, Analele Ştiinţifice ale Universităţii
„Alexandru Ioan Cuza”, Secţiunea Genetică şi Biologie Moleculară

References
124
Pulleyblank D. E., Shure M., Tang D., Vinograd J. and Vosberg H. P. (1975) Action of
Nicking-Closing Enzyme on Supercoiled and Nonsupercoiled Closed Circular
DNA: Formation of a Boltzmann Distribution of Topological Isomers, Proceedings
of the National Academy of Sciences of the United States of America 72, No. 11
(November): 4280-4284
Schleef M. (2001) Plasmids for Therapy and Vaccination, Wiley-VCH
Schmidt T., Friehs K., Schleef M., Voss C. and Flaschel E. (1999) Quantitative
Analysis of Plasmid Forms by Agarose and Capillary Gel Electrophoresis,
Analytical Biochemistry 274, No. 2 (October 15): 235-240
Stadler J., Lemmens R., Nyhammar T. (2004) Plasmid DNA Purification, J Gene Med
6: 54-66
Thatcher et al., Hitchcock A., Hanak J., Varley D. (1999) Method of Plasmid DNA
Production and Purification, Int Patent WO 9636706 Travers A., Muskhelishvili G. (2005) DNA Supercoiling - A Global Transcriptional
Regulator for Enterobacterial Growth? Nature Reviews Microbiology 3, No. 2
(February): 157-169
Urthaler J. (2005) Improved Downstream Process for the Production of Plasmid DNA
for Gene Therapy, Acta Biochimica Polonica 52 No. 3, 703-711, Boehringer
Ingelheim Austria GmbH, Vienna, Austria
Wang J. C. (1971) Interaction between DNA and an Escherichia Coli Protein Omega,
Journal of Molecular Biology, 55(3), page 523-533
Werner R. G., Urthaler J. (2002) pDNA – From Process Science to Commercial
Manufacture, Boehringer Ingelheim, CD-Biopharmaceuticals, Binger Str. 173,
55216 Ingelheim am Rhein (D)
Zhdanov R. I., Podobed O. V., Vlassov V. V. (2002) Cationic Lipid-DNA Complexes-
Lipoplexes-for Gene Transfer and Therapy, Bioelectrochemistry 58, no. 1
(November): 53-64
Websites http://www.ema.europa.eu http://www.neb.com
New England Biolabs ®, Product Details of enzyme Nt.BstNBI (#R0607)
http://www.separations.us.tosohbioscience.com
Tosoh Bioscience LLC, Product Details of DNA-NPR column

References
125
http://www.wiley.com/legacy/wileychi/genmed/clinical
Gene Therapy Clinical Trials Worldwide (2010) Vectors Used in Gene Therapy
Clinical Trials
http://sandwalk.blogspot.com/2007/07/ethidium-bromide-binds-to-dna.html
Information of Ethidium Bromide binding to DNA

References
126
Curriculum Vitae Elisabeth HALLER
Personal Details
Nationality Austria Born in October 18, 1986 in Linz
Address Wagnerweg 2, 4060 Leonding, Austria Study address Weidmanngasse 41/8, A-1170 Wien, Austria
Contact [email protected]
Education
March 2010 – January 2011 Diploma Student University of Vienna, Faculty of Chemistry Department of Analytical and Food Chemistry Research Group for Molecular Recognition Materials Währinger Straße 38, A-1090 Vienna
October 2005 – January 2011 Student of Chemistry University of Vienna , Faculty of Chemistry Währinger Straße 38, A-1090 Vienna
September 1997– June 2005 Secondary School BG/ WRG Körnerschule, Linz Körnerstraße 9, A-4020 Linz
Acquired qualification: matriculation
September 1993 – July 1997 Primary School, Leonding Alhartinger Weg 8, A-4060 Leonding
September 1992 – July 1993 Preschool, Leonding Alhartinger Weg 8, A-4060 Leonding