differentiating water scarcity and drought a key to ... · pdf filedifferentiating water...
TRANSCRIPT

Differentiating Water Scarcity and Drought
A key to proceed in the development of effective drought management practices
Jochen Froebrich, Koen Roest, Wouter WoltersXerochore conference, Brussels, 23 February 2010

Differentiating Water Scarcity and Drought
While "drought" means a temporary decrease in water availability due for instance to rainfall deficiency, "water scarcity" means that water demand exceeds the water resources exploitable under sustainable conditions. It is important to differentiate both terms carefully as they
are related to different causes and require different measures
COM(2007) 414 final, COMMUNICATION FROM THE COMMISSION OF THE EUROPEAN PARLIAMENT AND THE COUNCIL: Addressing the challenge of water scarcity and droughts in the European Union

Differentiating Water Scarcity and Drought
Why are they named in one breath often and frequently mixed up in discussing sustainable watershed management? The socio-economic and environmental aim to satisfy the requested water
demands is affected by both During water scarcity an occuring drought impose additional hardship Water scarcity is reducing the buffer capacity and resilience of a system
to anticipate future droughts
Under conditions of water scarcity measures to reduce structural overconsumption are a pre-requisite to
increase the buffer capacity drought management cannot be substituted by water scarcity management
and require its own recognition the role of storages in GW and SW is critical and need to be addressed

Differentiating Water Scarcity and Drought
The most widely used measure is the Falkenmark indicator or “water stress index” (Falkenmark et al., 1989). They proposed 1700 m3 per capita per year: water stress 1000 m3 per capita per year: water scarcity < 500 m3 per capita per year: absolute scarcity
… but
water scarcity should be a relative criteria, as situation, water demand and vulnerability differs locally

Drought management
Different phases in water scarcity management (Turton, 1999)

coping with natural rainfall
variability
supply management
large scale irrigation
development
demand management
handle seasonal
water supply deficits
handle man-made
scarcity
adapt system
operations
create strategic reserves
combine rain fed
and irrigation systems
handle meteorological
droughts &dry spells
anticipate on future climate
variability
anticipate on water stress in
intensively used agricultural lands
minimise pollution,increaseusable water
resources,closed
systems (agroparks)
complexity (region, time)uncertainty
water stress problems
increase water productivity of rain fed and irrigated agriculture

Case study Nile Delta, Egypt Egypt completely depends on its annual
share of Nile water: 1959 Nile Waters Agreement between
Egypt and Sudan, Egypt’s share of the Nile flow is 55.5 km3/yr. The agreement was based on the average flow of the Nile during the 1900-1959 period, which was 84 km3/yr at Aswan.
Average annual evaporation and other losses from the Aswan High Dam and reservoir (Lake Nasser) were estimated at 10 km3/yr
Net usable flow of 74 km3/yr, of which 18.5 km3/yr was allocated to Sudan and 55.5 km3/yr to Egypt.
Rainfall on the northern coast of 1.3 BCM annually comparable neglible

Case study Nile Delta, Egypt
Egypt’s population 73.4 million (2004), FAO, is growing at a fast rate and the uncertainty in the future size of the population is large. Projections of future population growth differ, based on
different scenario assumptions: According IPCC and Millennium Ecosystem Assessment
(MA): Maximum prediction150 million in 2050190 million in the year 2100.
Lowest estimate120 million inhabitants in 2075115 million in 2100.

Case study Nile Delta, Egypt
0
1000
2000
3000
4000
5000
6000
1897 1907 1917 1927 1937 1947 1960 1970 1986 1992 2000 2025
Years
Wat
er m
3
0
0.1
0.2
0.3
0.4
0.5
0.6
0.7
0.8
0.9
Agr
icul
tura
l lan
ds (f
edda
ns)
Water Agricultural Lands
Egypt Quota55.5 BCMBCM
El-Atfy, 2009
m3/
c/yr

Case study Nile Delta, Egypt
Water use Water use for drinking, cooking, bathing and flushing:
100 - 300 l/c/d Consumptive use for food production depends on agricultural productivity
and on diet: 1400 - 1700 l/c/d Water needed per inhabitant: 1500 and 2000 l/c/d
Water Scarcity in Egypt: cereal/meat diet: today (2010) potato/meat or vegetarian diet between 2020 and 2030
The situation is more severe since no account is made of the water needs for the industrial sector or for the environment!

Case study Nile Delta, Egypt
Population scenario's Egypt
50
100
150
200
2000 2010 2020 2030 2040 2050 2060 2070 2080 2090 2100Time (years)
Popu
latio
n (m
illio
n)
IPCC-B2MEA-AMMEA-OSMEA-GOMEA-TG

Case study Nile Delta, EgyptWater self sufficiency Egypt
0
500
1000
1500
2000
2500
3000
1990 2010 2030 2050 2070 2090Time (years)
Wat
er s
uppl
y / d
eman
d (l/
c/d)
High population growthLow population growth
cereal/meat diet
potato/meat or vegetarian diet
20212007
2035

Case study Nile Delta, Egypt
Agriculture in Egypt is (almost) completely dependent on the Nile water supply
Egypt is expanding its agricultural area
Large (mega) projects are being developed in the Egyptian desert
Needs for Managing Water Scarcity

Case study Nile Delta, Egypt
• Existing (subsistence) agriculture in the Nile valley and Delta has to cope with less water in the future. The irrigation system in the old lands excels in its simplicity.
• Water is supplied through open canals through a system of rotation to farmers. Farmers themselves are responsible for lifting water from these ditches to the agricultural fields.
• Investments in infrastructure will be required to prevent that farmers at the beginning of canals to use all water, leaving the canal tail-ends dry.

Case study Nile Delta, Egypt
Since the 1960’s the Aswan High Dam enables storing the flood water for more than one growing season and has made it possible for Egyptian farmers to change from one crop per year to a double cropping system. Today, the cropping intensity has increased to 210%,
crop yields in Egypt are among the highest in the world. Yet, the average farmer of today with an area of < 1 ha
obtains only 40% of his income from the farm. The other 60% originates from other non-farming activities.

Case study Nile Delta, EgyptWheat yield
0.00
2.00
4.00
6.00
8.00
10.00
1960 1970 1980 1990 2000 2010Year
Yiel
d (to
nne/
ha)
WorldEgyptNetherlands

Case study Nile Delta, Egypt
Return on water
0.00
0.50
1.00
1.50
0 200 400 600 800 1,000 1,200 1,400 1,600 1,800 2,000
Water use (Irrigation+rain) (mm)
Ret
urn
on w
ater
($/m
3)
Return on waterIsraelNetherlands
Algeria
Jordan Lebanon Oman
EgyptTurkey
???
???

Case study Nile Delta, Egypt
Increasing yields / m3 not more an option. To anticipate pressing water scarcity
and to stabilize economic development in the Nile Delta fundamental paradigm shifts are required. Major Question for the Delta not only
how to have a higher return, but how to maintain crop yields AND financial return with LESS WATER.
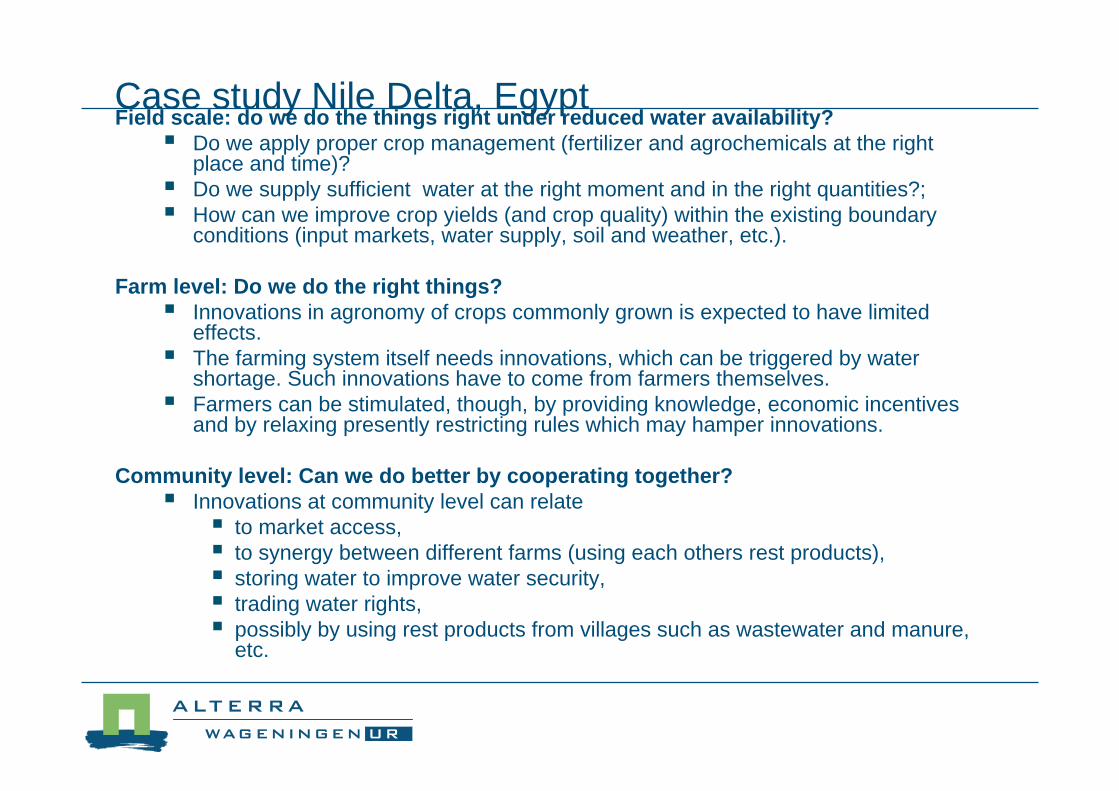
Case study Nile Delta, EgyptField scale: do we do the things right under reduced water availability? Do we apply proper crop management (fertilizer and agrochemicals at the right
place and time)? Do we supply sufficient water at the right moment and in the right quantities?; How can we improve crop yields (and crop quality) within the existing boundary
conditions (input markets, water supply, soil and weather, etc.).
Farm level: Do we do the right things? Innovations in agronomy of crops commonly grown is expected to have limited
effects. The farming system itself needs innovations, which can be triggered by water
shortage. Such innovations have to come from farmers themselves. Farmers can be stimulated, though, by providing knowledge, economic incentives
and by relaxing presently restricting rules which may hamper innovations.
Community level: Can we do better by cooperating together? Innovations at community level can relate to market access, to synergy between different farms (using each others rest products), storing water to improve water security, trading water rights, possibly by using rest products from villages such as wastewater and manure,
etc.

Case study Nile Delta, Egypt
Impact of water scrarcity on drought resilience

Case study Nile Delta, Egypt
01020304050607080
1-YRAVG.
3-YRAVG.
6-YRAVG.
(1913/1914)(1984/1985)Drought Severity TrendDrought Severity Trend
• When AHD storage slipped below 60 Billion m3, MWRI applied a sliding scale to reduce total water releases below 55.5 Billion m3 (annual Egypt’s share from the Nile).

Case study Nile Delta, Egypt
Demand-based water releases in all canals. Time-restricted scheduling of navigational demands. Optimization of hydropower generation. Extensive reuse of drainage water. Increased, but stressed use of groundwater. Minimization of water disposed to the Mediterranean Sea
and Northern Lakes. Transparency with stakeholders and media. Rapid assessment studies conducted in the course of
drought management.
Measures Implemented to manage 1980’s drought

Principal Conclusion
• Appropriate preparedness is critical• Availability and maintenance of reserves is critical• Prioritization of water uses need to be adressed• Risk management including the determination of
irreversible damages is needed

Priority list for water use (Example from NLCategory 4Other uses(economicconsiderations, also for nature)
• shipping• agriculture• nature (as long as no
irreversible damage isdone)
• industry• recreation• fishery
Category 1safety and preventionof irreversible damage
1. stability of dikes2. soil compaction
(peat)3. nature
(connected to soilcharacteristics)
Category 2Public utilities
1. drinking water2. energy production
Category 3small-scale use withhigh added value
• temporary sprinklingof capital-intensivecrops
• process water
precedes precedes precedes
van Bennekom, 2007; Facing future Water Scarcity, Cairo
Drought management

Drought management
Country High priority Low priority Source Cyprus Domestic permanent crops + other
greenhouses agriculture Iglesias et al, 2007
Italy Permanent other crops agriculture
Iglesias et al, 2007
Egypt Drinking industrial agriculture hydropower water supply
NWRP, 2005
Morocco Potable water livestock water Iglesias et al, 2007
Spain Urban irrigation hydro- industry fish recreation navigation Water power farming
EC, 2007
Netherlands Safety + drinking water + process water + all Irrecoverable energy high value other Damage (cooling) crops uses
Min V&W website
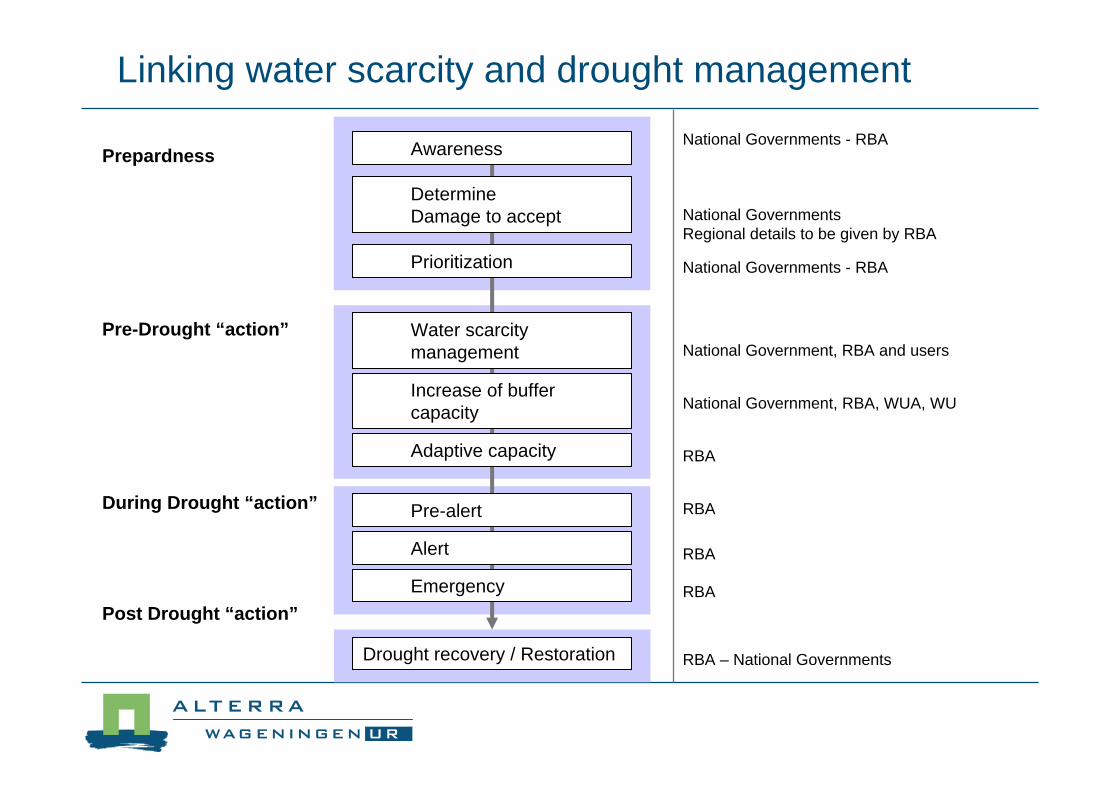
Drought recovery / Restoration
Prepardness
During Drought “action”
Alert
Pre-alert
Emergency
Water scarcity management
Adaptive capacity
Increase of buffer capacity
Determine Damage to accept
Awareness
Prioritization
National Governments - RBA
National Government, RBA and users
National Governments Regional details to be given by RBA
National Government, RBA, WUA, WU
RBA
RBA
RBA
RBA
RBA – National Governments
Post Drought “action”
Pre-Drought “action”
Linking water scarcity and drought management
National Governments - RBA
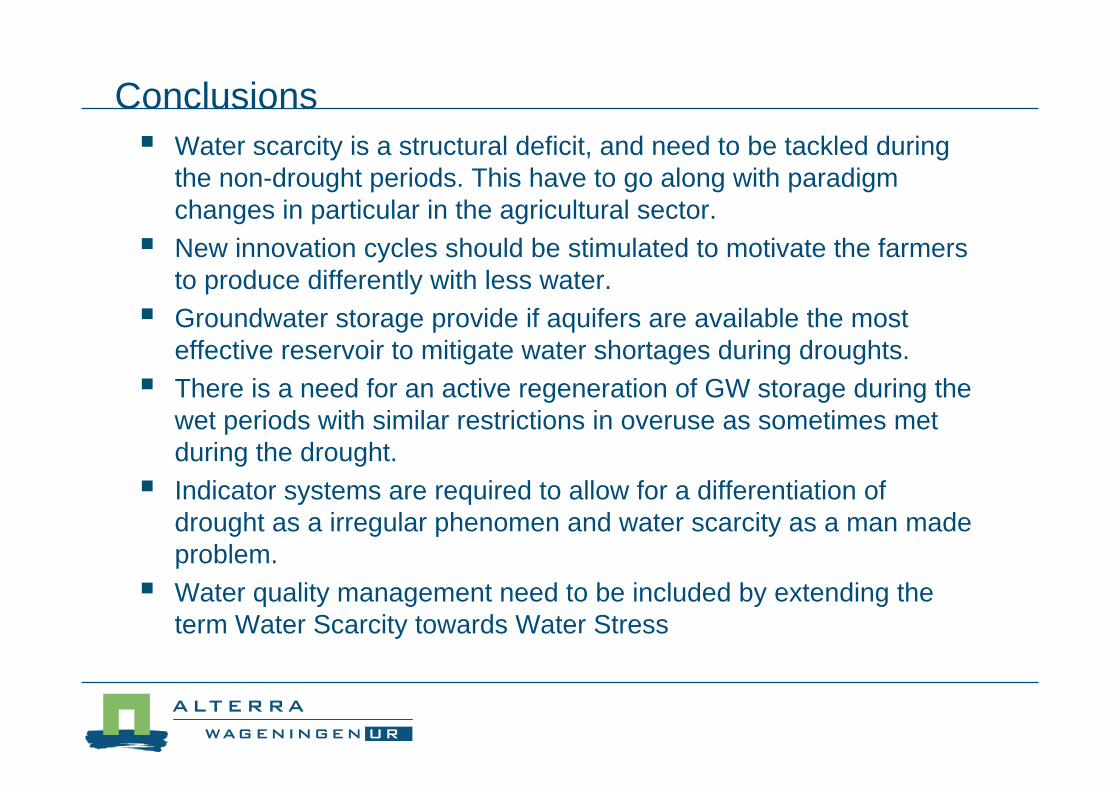
Conclusions Water scarcity is a structural deficit, and need to be tackled during
the non-drought periods. This have to go along with paradigm changes in particular in the agricultural sector.
New innovation cycles should be stimulated to motivate the farmers to produce differently with less water.
Groundwater storage provide if aquifers are available the most effective reservoir to mitigate water shortages during droughts.
There is a need for an active regeneration of GW storage during the wet periods with similar restrictions in overuse as sometimes met during the drought.
Indicator systems are required to allow for a differentiation ofdrought as a irregular phenomen and water scarcity as a man madeproblem.
Water quality management need to be included by extending the term Water Scarcity towards Water Stress

with special thanks to Hussein El-Atfy, Samia El Guindy, Magdy Salah El Deen