diagnosis of ovarian cancer based on mass spectrum of blood samples committee: eugene fink lihua li...
Post on 22-Dec-2015
218 views
TRANSCRIPT
Diagnosis of Ovarian Cancer Based on Mass Spectrum of Blood Samples
Committee:
Eugene Fink
Lihua Li
Dmitry B. Goldgof
Hong Tang
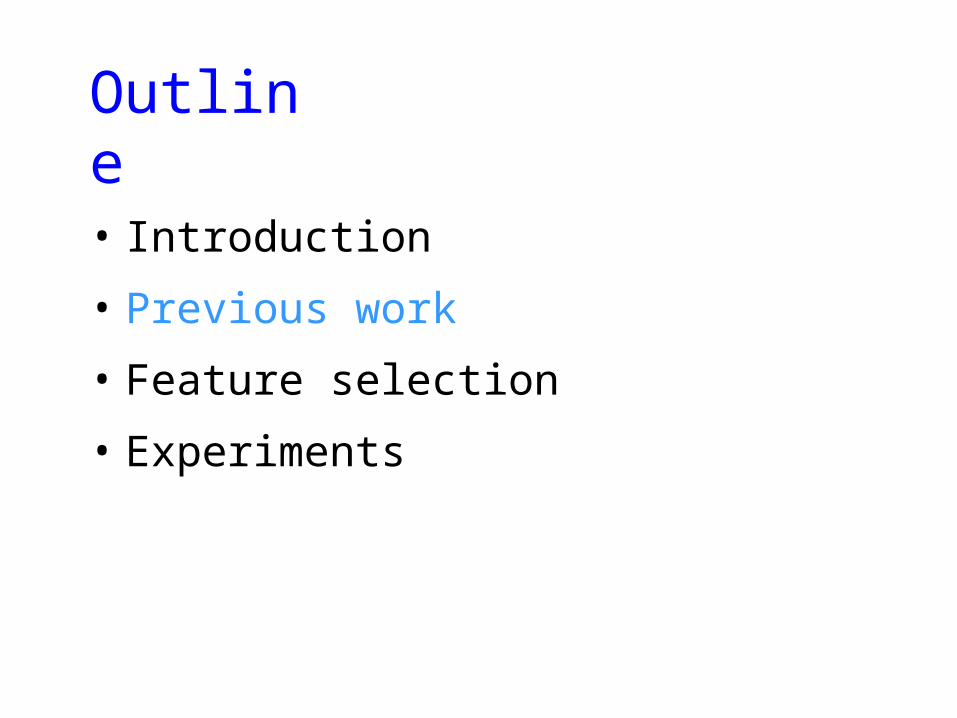
Outline
• Introduction
• Previous work
• Feature selection
• Experiments
Motivation
Early cancer detection is criticalfor successful treatment.
Five year survival for ovarian cancer:• Early stage: 90%• Late stage: 35%
80% are diagnosed at a late stage.
Motivation
Desired features ofcancer detection:
• Early detection
• High accuracy
• Low cost
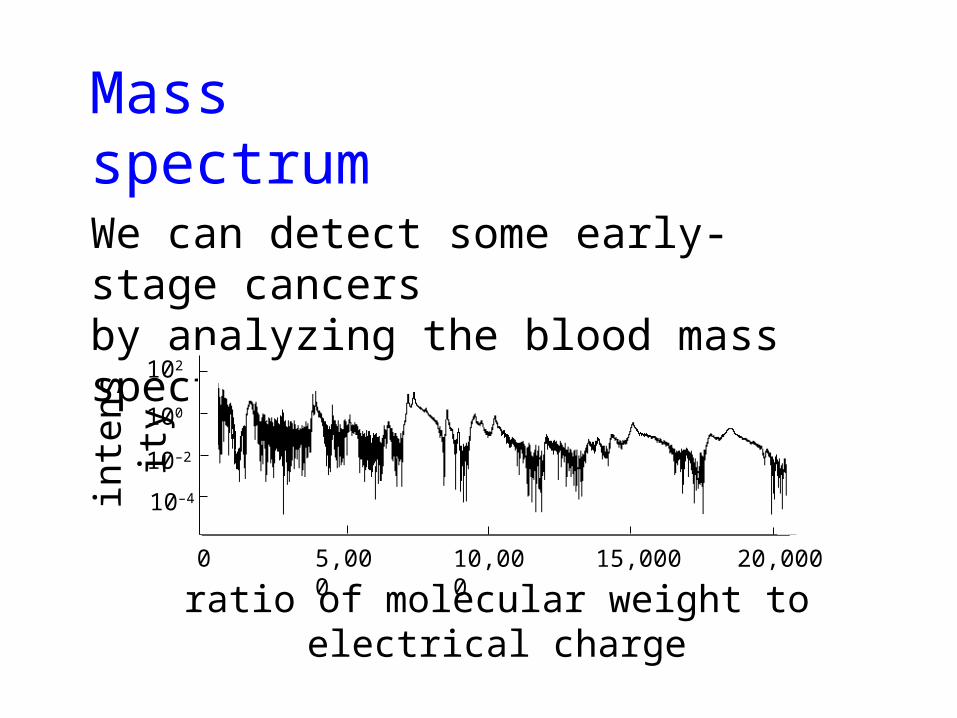
Mass spectrum
We can detect some early-stage cancersby analyzing the blood mass spectrum.
ratio of molecular weight to electrical charge
inte
nsit
y
20,0000 5,000 10,000 15,000
10–4
10–2
100
102
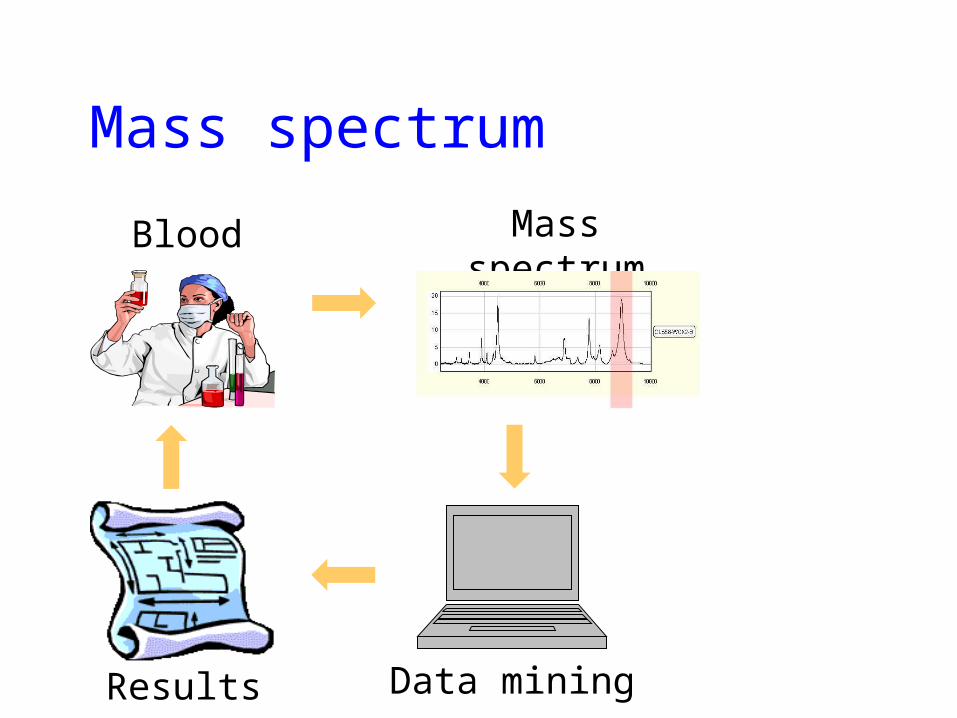
Mass spectrum
Mass spectrum
Data miningResults
Blood
Outline
• Introduction
• Previous work
• Feature selection
• Experiments
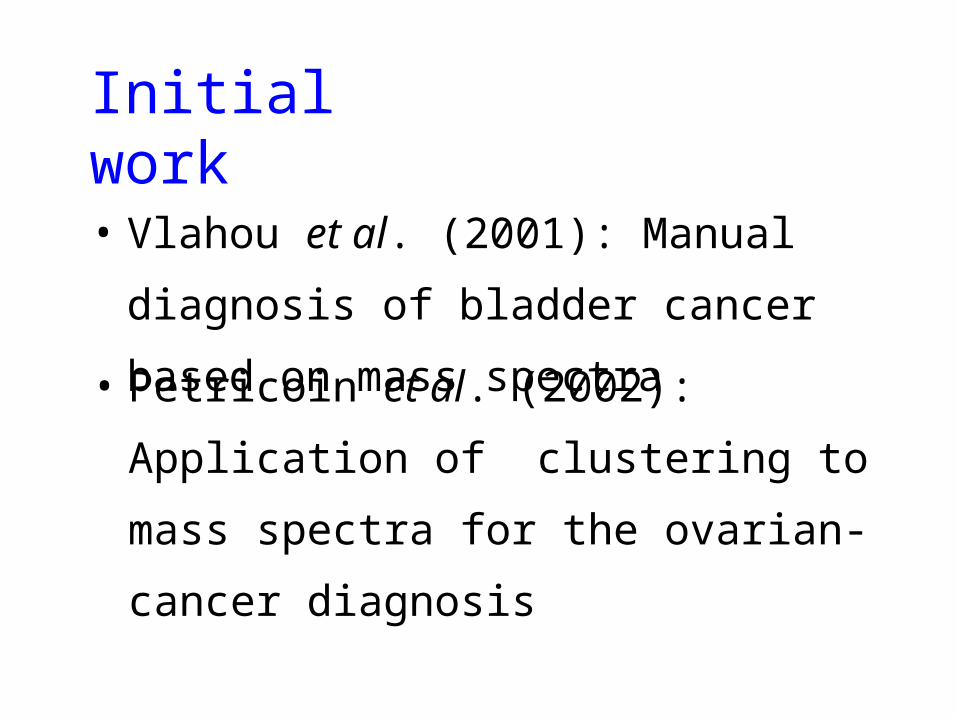
Initial work
• Vlahou et al. (2001): Manual diagnosis
of bladder cancer based on mass spectra
• Petricoin et al. (2002): Application of
clustering to mass spectra for the ovarian-
cancer diagnosis
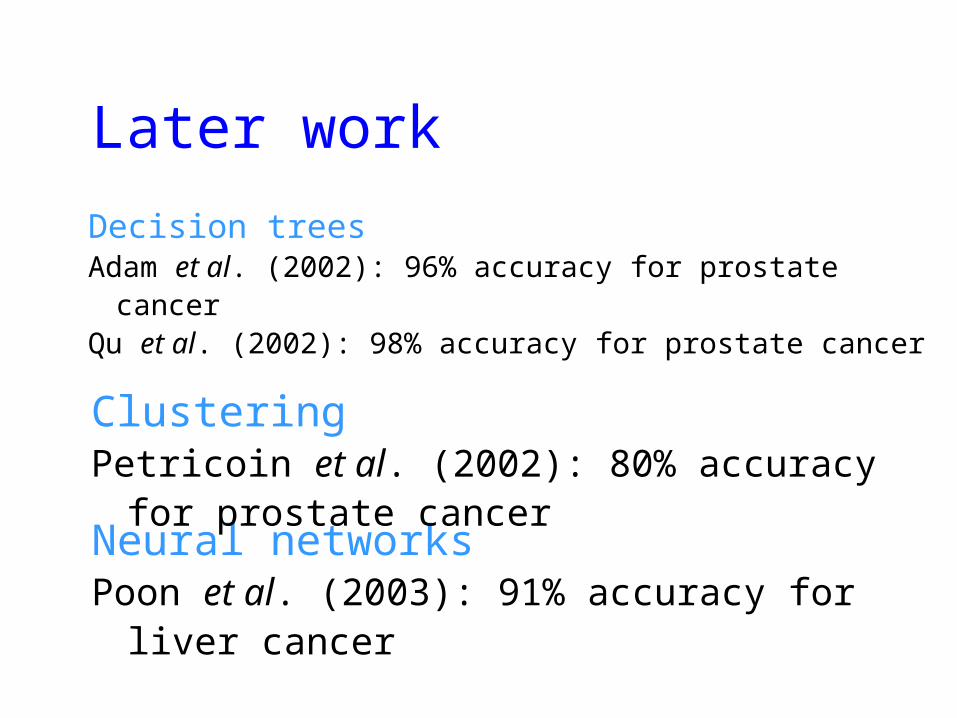
Decision treesAdam et al. (2002): 96% accuracy for prostate cancerQu et al. (2002): 98% accuracy for prostate cancer
Later work
Neural networksPoon et al. (2003): 91% accuracy for liver cancer
ClusteringPetricoin et al. (2002): 80% accuracy for prostate cancer
Outline
• Introduction
• Previous work
• Feature selection
• Experiments
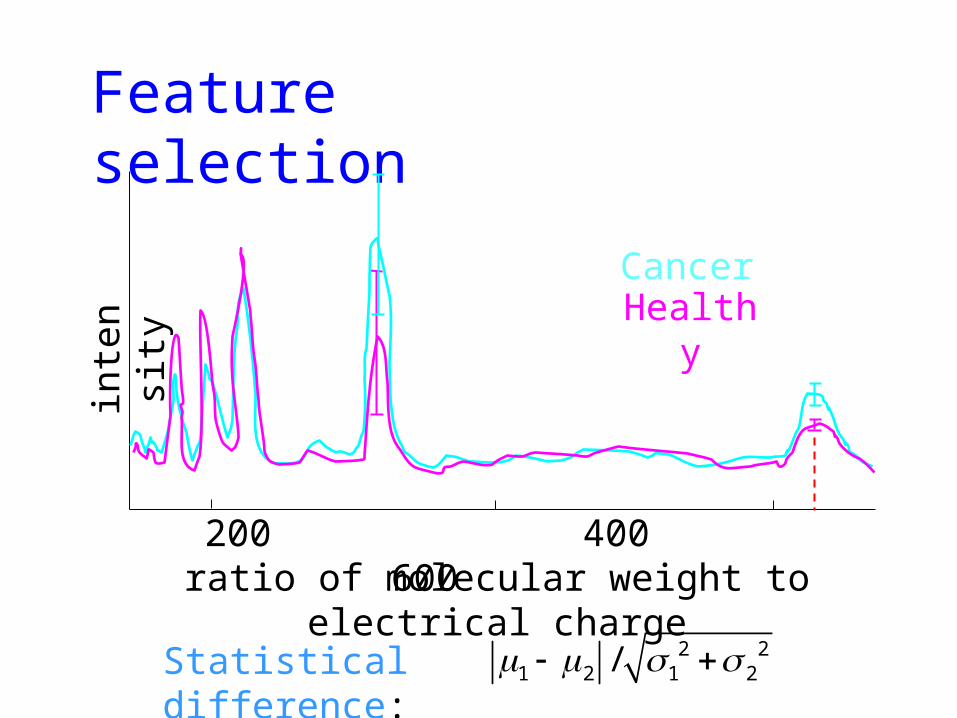
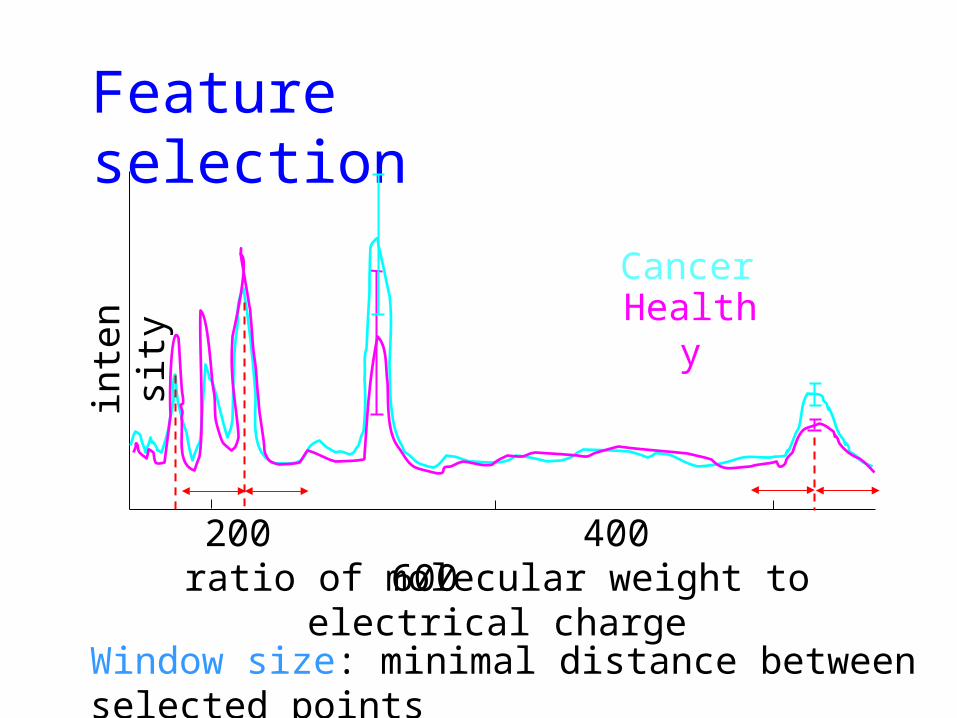
Feature selection
ratio of molecular weight to electrical charge
inte
nsit
y
200 400 600
CancerHealthy
2 21 2 1 2/ Statistical difference:
Feature selection
ratio of molecular weight to electrical charge
inte
nsit
y
200 400 600
Window size: minimal distance between selected points
CancerHealthy
Outline
• Introduction
• Previous work
• Feature selection
• Experiments
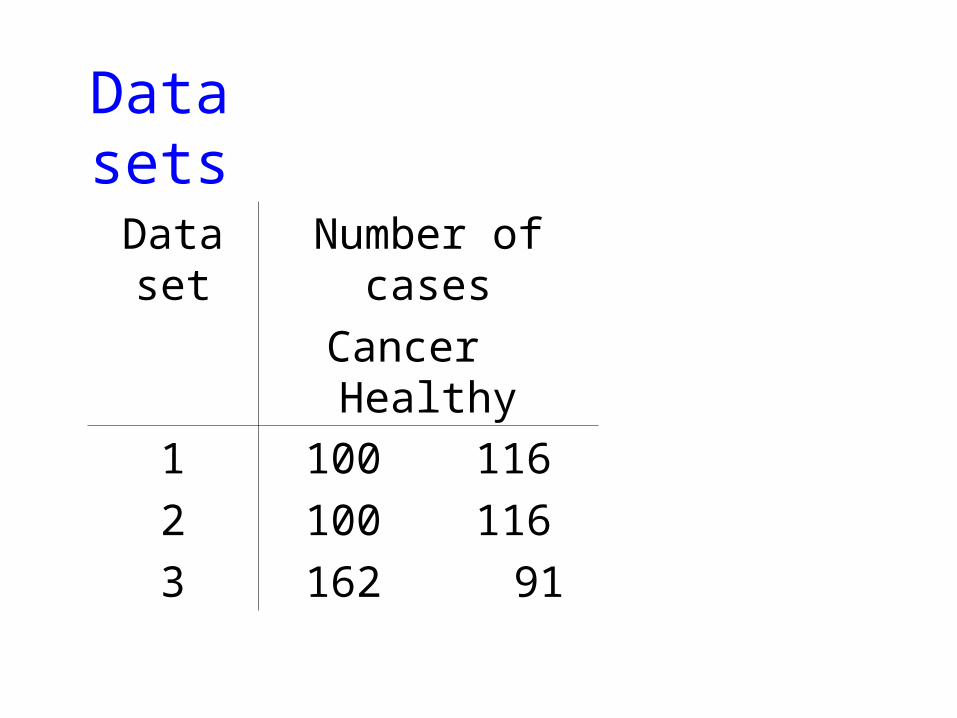
Data sets
Dataset
Number of cases
Cancer Healthy
1
2
3
100
100
162
116
116
91
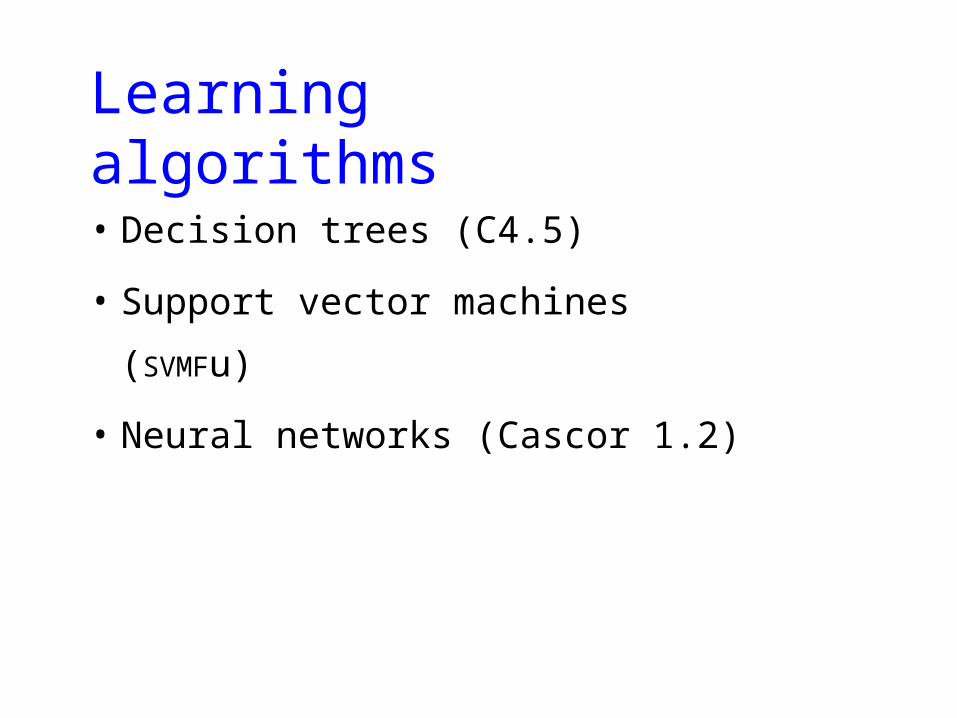
Learning algorithms
• Decision trees (C4.5)
• Support vector machines (SVMFu)
• Neural networks (Cascor 1.2)
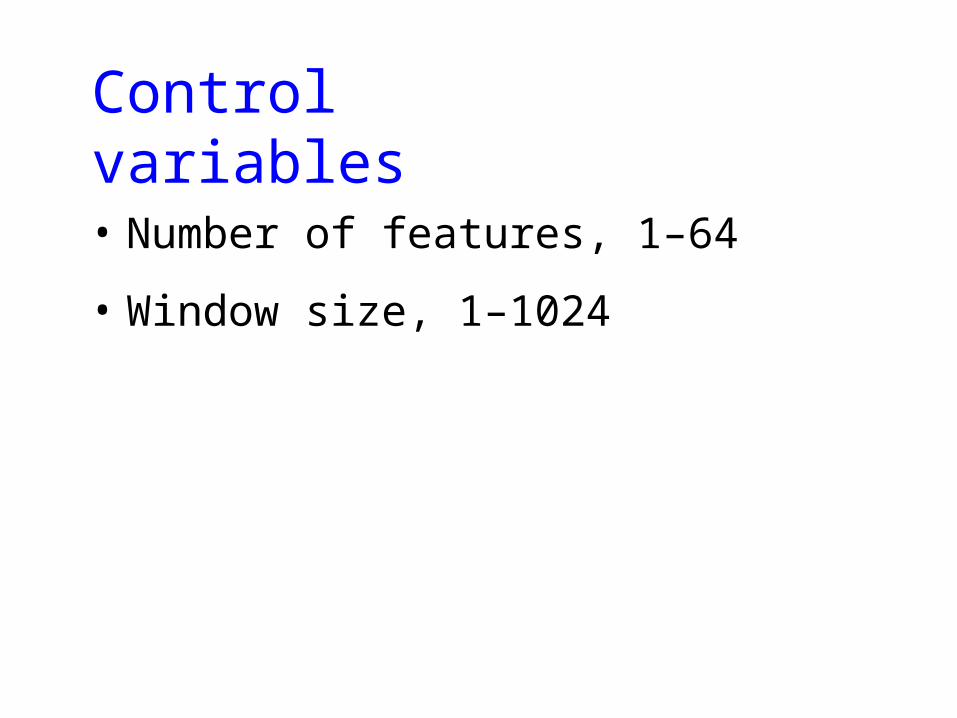
Control variables
• Number of features, 1–64
• Window size, 1–1024
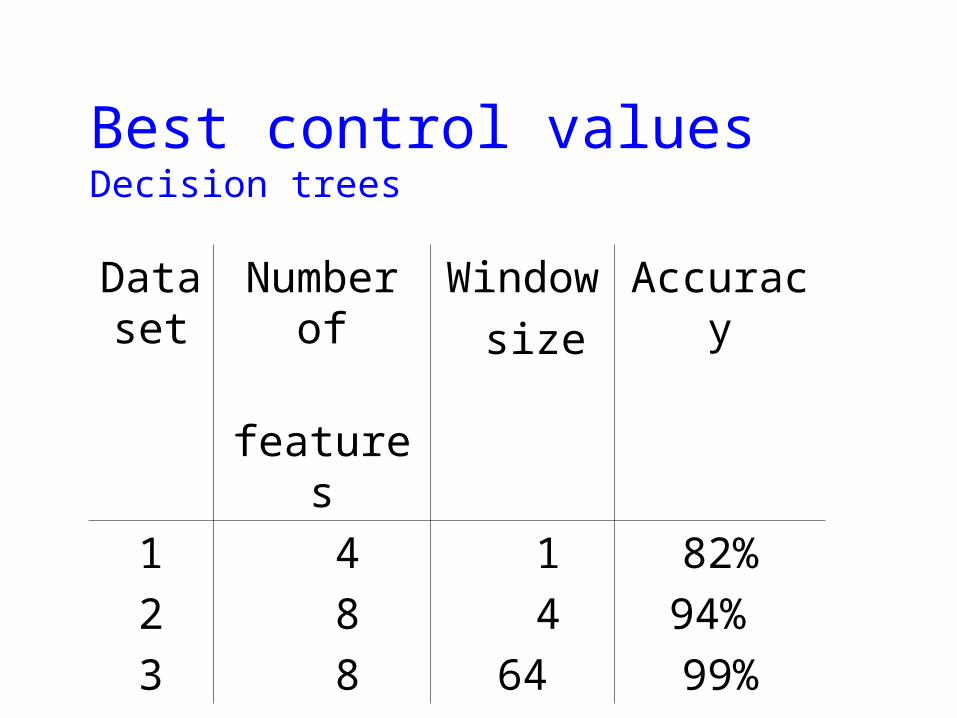
Best control valuesDecision trees
Data set
Number of
features
Window
size
Accuracy
1 4 1 82%
2 8 4 94%
3 8 64 99%
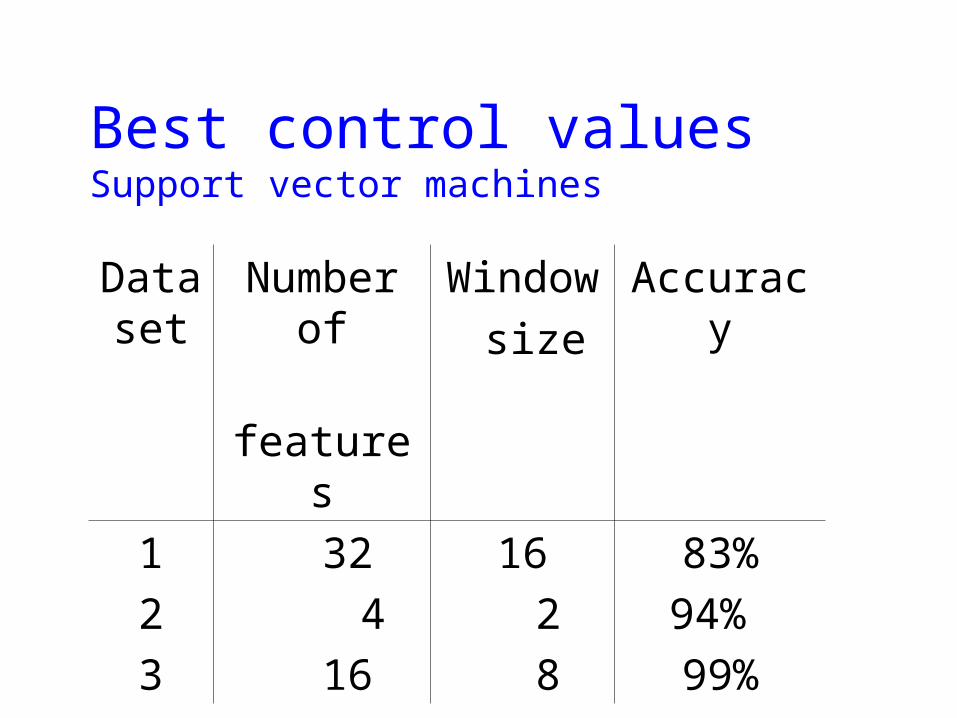
Best control valuesSupport vector machines
Data set
Number of
features
Window
size
Accuracy
1 32 16 83%
2 4 2 94%
3 16 8 99%
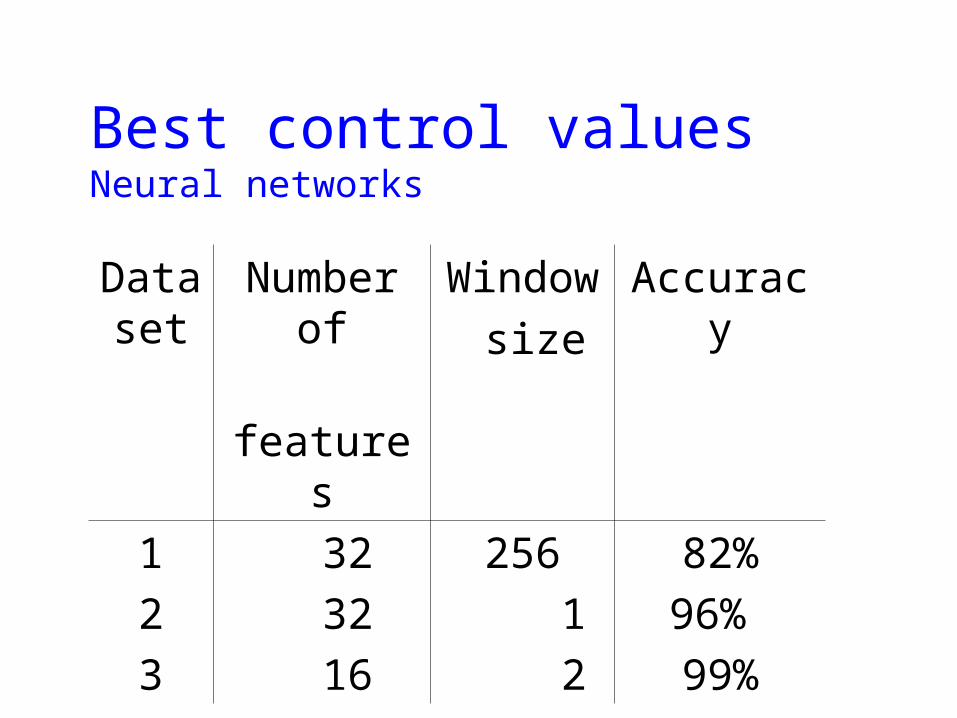
Best control valuesNeural networks
Data set
Number of
features
Window
size
Accuracy
1 32 256 82%
2 32 1 96%
3 16 2 99%
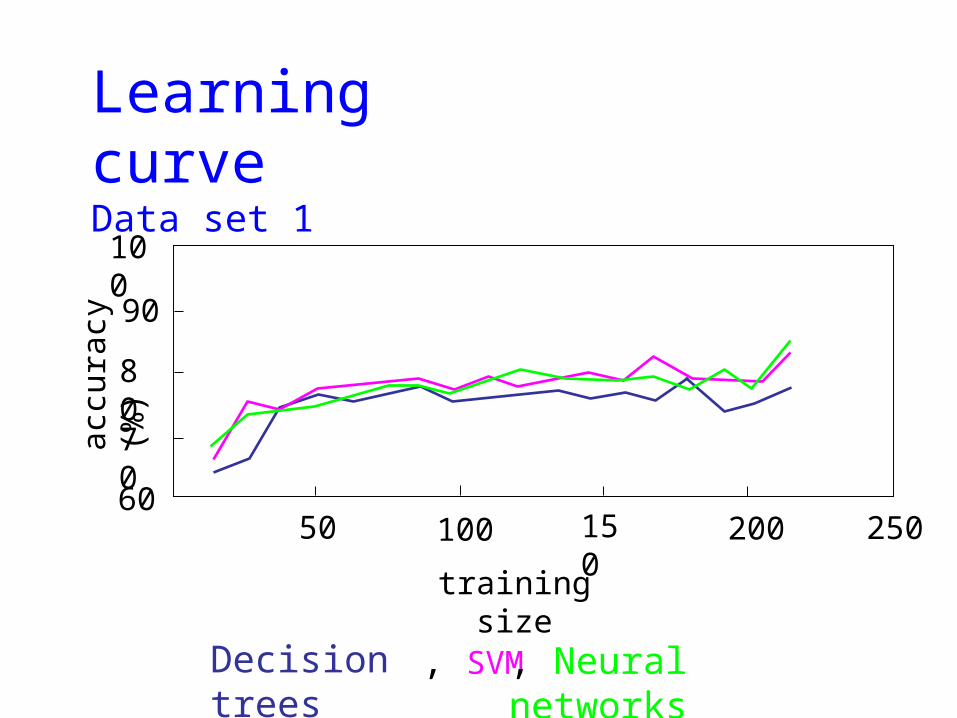
Learning curveData set 1
accu
racy
(%
)
training size
90
80
60
100
70
Decision trees, SVM, Neural networks
50 100 150 200 250
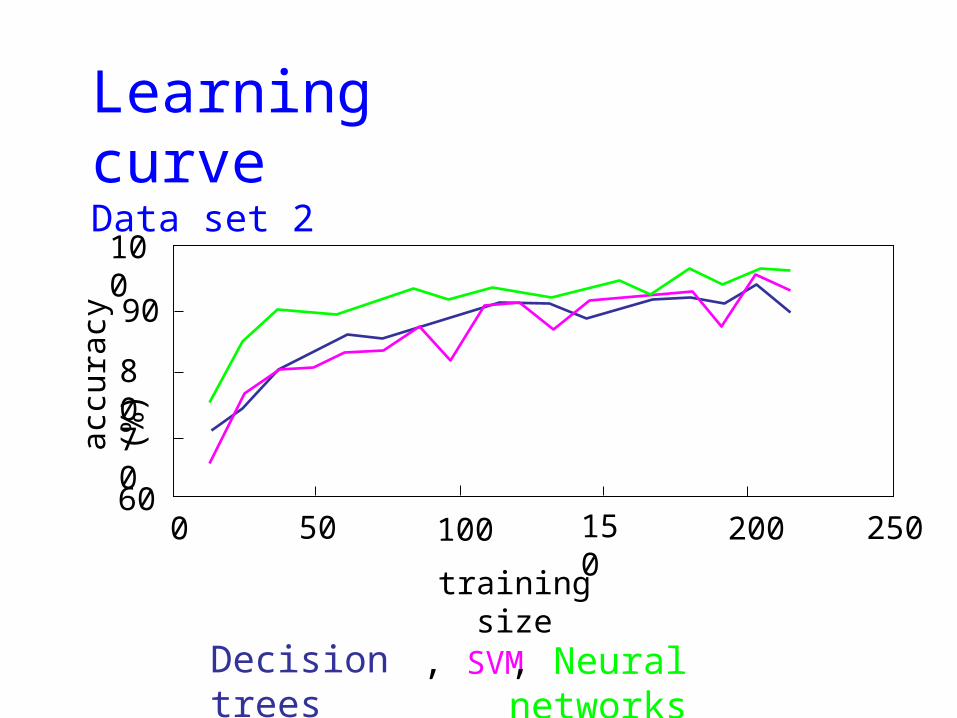
accu
racy
(%
)Learning curveData set 2
training size
90
80
60
100
70
Decision trees, SVM, Neural networks
0 50 100 150 200 250
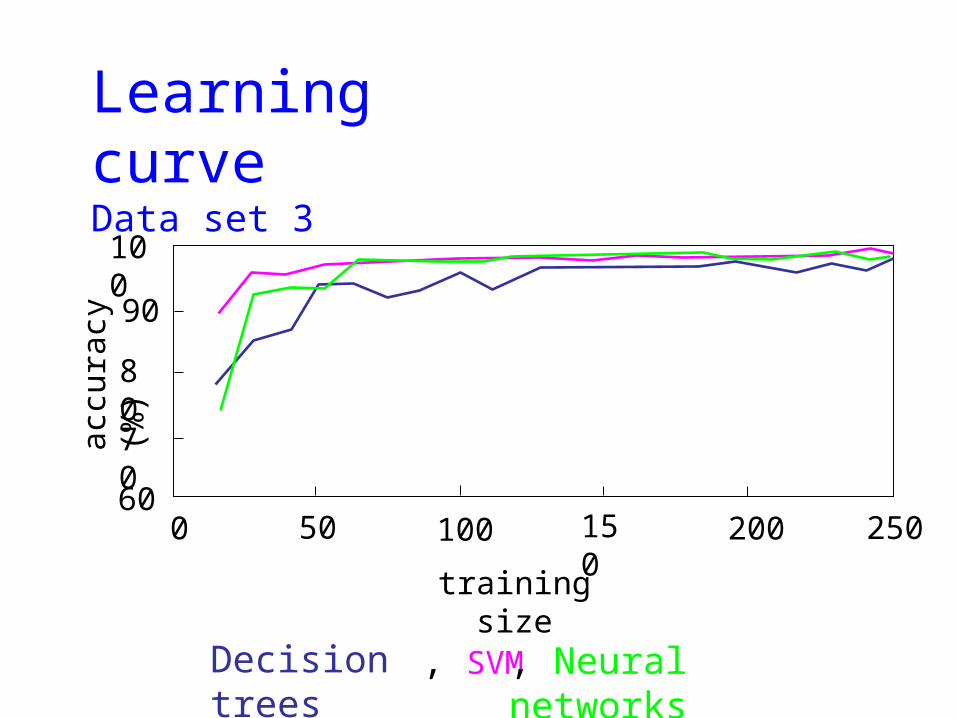
Learning curveData set 3
accu
racy
(%
)
training size
50 100 150 20060
70
90
80
100
0
Decision trees, SVM, Neural networks
250
Main results
Automated detection of ovarian cancer by
analyzing the mass spectrum of the blood
• Experimental comparison of decision
trees, SVM and neural networks
• Identification of the most informative
points of the mass-spectrum curves
Future work
• Experiments with other data sets
• Other methods for feature selection
• Combining with genetic algorithm