development of the poorest of the south - simple …578261/fulltext01.pdf · 2012-12-17 ·...
TRANSCRIPT
School of Social Sciences Peace and Development Studies Tutor: Jonas Ewald
Bachelor Thesis
Development of the Poorest of the South A Quantitative Study of Co-variation between Trade and Human Development in Sub-Saharan Africa
Karin Strömberg 2012-09-06
Development of the Poorest of the South, Karin Strömberg 1
ABSTRACT
The purpose of the study is to investigate the relationship between two phenomena which are much-
disputed and whose mechanisms and processes are interlaced with each other: trade and human
development. The focus is a specific type of South-South trade; interregional trade in Sub-Saharan
Africa, as well as international trade to and from Sub-Saharan Africa.
A quantitate method, using a deductive approach, was utilized in this study. The quantitative
research data was accessed from the World Bank database and the human development reports of
the UNDP. The data was processed in regressions and the level of co-variation (a term used in this
paper as the statistical relation between data) between the variables is established and shown
through the unit of measurement r².
The results tend to indicate that the level of statistical co-variation between interregional trade and
international trade in various commodities and human development in Sub-Saharan Africa exist but
are varied. Interregional trade does not seem to have a stronger co-variation with human
development than general international trade despite the structural viewpoint of the academic field.
Interestingly, the commodity traded with does have a varied impact on the level of co-variation with
human development.
Keywords: Human development, Sub-Saharan Africa, South-South trade, interregional trade, type
of commodity.
Development of the Poorest of the South, Karin Strömberg 2
LIST OF ABBREVIATIONS
BRICS Association of Leading Emerging Economies: Brazil, Russia, India, China and South Africa
GATT General Agreement on Tariffs and Trade
GDP Gross Domestic Product
GNI Gross National Income
HDI Human Development Index
IMF International Monetary Fund
MDGs Millennium Development Goals
OECD Organization for Economic Co-operation and Development
SAPS Structural Adjustment Programs
UNCTAD United Nations Conference on Trade and Development
UNDP United Nations Development Program
LIST OF FIGURES
Figure 1: Illustration of the different elements of the Human Development Index
Figure 2: Relation between research questions and variables
Figure 3: Countries in the North
Figure 4: Countries in the South
Figure 5: Countries in Sub-Saharan Africa
Figure 6: System of case selection
Figure 7: Merchandise trade (% of GDP) 1990 and HDI value 2009
Figure 8: Merchandise trade (% of GDP) 1990 < 200 % and HDI value 2009
Figure 9: Merchandise exports 1990 and HDI value 2009
Figure 10: Merchandise exports (current US$) 1990 < 10000000000 US$ and HDI value 2009
Figure 11: Merchandise exports to developing economies in Sub-Saharan Africa (% of merchandise
exports) 1990 and HDI value 2009
Figure 12: Merchandise imports (current US$) 1990 and HDI value 2009
Figure 13: Merchandise imports (current US$) 1990 < 18399000000 US$ and HDI value 2009
Figure 14: Merchandise imports from developing economies in Sub-Saharan Africa (% of merchandise imports)
1990 and HDI value 2009
Figure 15: Summary of results from the regressions for question 1
Figure 16: Merchandise exports (current US$) 1990 and HDI value 2009
Figure 17: Agricultural raw materials exports (% of merchandise exports) 1990 and HDI value 2009
Figure 18: Merchandise imports (current US$) 1990 and HDI 2009
Figure 19: Agricultural raw materials imports (% of merchandise imports 1990 and HDI value 2009
Figure 20: Agricultural raw materials imports (% of merchandise imports) 1990 < 10 % and HDI value 2009
Figure 21: Food exports (% of merchandise exports) 1990 and HDI value 2009
Development of the Poorest of the South, Karin Strömberg 3
Figure 22: Food imports (% of merchandise imports) 1990 and HDI value 2009
Figure 23: Oil rents (% of GDP) 1990 and HDI value 2009
Figure 24: Ores and metals exports (% of merchandise exports) 1990 and HDI value 2009
Figure 25: Ores and metals imports (% of merchandise imports) 1990 and HDI value 2009
Figure 26: Summary of results from the regressions for question 2
Development of the Poorest of the South, Karin Strömberg 4
TABLE OF CONTENT
1. INTRODUCTION ........................................................................................................................ 5 1.1. Research Problem ...................................................................................................................................... 5 1.2. Purpose of the Study .................................................................................................................................. 6 1.3. Relevance ................................................................................................................................................. 7 1.4. Delimitations ............................................................................................................................................. 7 1.5. Limitations ................................................................................................................................................ 7 1.6. Disposition ................................................................................................................................................ 9
2. BACKGROUND ........................................................................................................................ 10 2.1. Historical Background of the North-South Divide ...................................................................................... 10 2.2. The International Trade Regime and its Impact on Development ................................................................. 12 2.3. Trade in Theory ....................................................................................................................................... 13
2.3.1. Theory of Comparative Advantage ..................................................................................................... 13 2.3.2. North-South Model of Unequal Trade ................................................................................................ 14
2.4. Africa and its Economic Conditions – Problems Related to Trade ................................................................ 14 2.5. Interregional Trade in Africa: A Background ............................................................................................. 15
2.5.1. Interregional Trade in Sub-Saharan Africa .......................................................................................... 16 2.6. The Policy Debate on Trade and Development ........................................................................................... 17
2.6.1. Liberal Point of View on Trade and Development ............................................................................... 18 2.6.2. Structural Point of View on Trade and Development ........................................................................... 19
3. METHODOLOGY ..................................................................................................................... 21 3.1. Choice of Method .................................................................................................................................... 21 3.2. Data and Variables ................................................................................................................................... 21
3.2.1. Independent Variables ....................................................................................................................... 22 3.2.2. The Dependent Variable: Human Development ................................................................................... 23 3.2.3. Definition of the Human Development Index ...................................................................................... 24 3.2.4. Relation between Research Questions and Variables ........................................................................... 25
3.3. Time Span............................................................................................................................................... 26 3.3.1. Discussion on Issues with the Time Span ............................................................................................ 26
3.4. Case Population ....................................................................................................................................... 27 3.4.1. Definitions of the South .................................................................................................................... 28 3.4.2. Definition of Sub-Saharan Africa ....................................................................................................... 33 3.4.3. Definition of the Human Development Index ranking system ............................................................... 34 3.4.4. System of Case Selection .................................................................................................................. 35
3.5. Data Analysis .......................................................................................................................................... 37 3.5.1. Limitations of the Data...................................................................................................................... 37
3.6. Anticipated Ethical Issues ........................................................................................................................ 38 3.7. Evaluation of Sources .............................................................................................................................. 38
4. RESULTS ................................................................................................................................. 39 4.1. Question 1: Co-variation between interregional trade and human development in sub-Saharan Africa............. 39 4.2. Question 2: Relevance of Type of Commodity for Human Development in sub-Saharan Africa ..................... 48
5. ANALYSIS ................................................................................................................................ 60 5.1. Question 1: Co-variation between Interregional Trade and Human Development in Sub-Saharan Africa ......... 60 5.2. Question 2: Relevance of Type of Commodity for Human Development in Sub-Saharan Africa ..................... 62 5.3. Reflections & Afterthoughts ..................................................................................................................... 64
6. CONCLUSIONS ....................................................................................................................... 66
LIST OF REFERENCES ............................................................................................................... 69
ANNEX ......................................................................................................................................... 75
Development of the Poorest of the South, Karin Strömberg 5
1. INTRODUCTION
When studying the subject of Peace and Development studies for a number of years, one area of
interest moves me more than anything; the situation of the poorest of the poor and the populations
in the absolute bottom of the world’s economies. They are sometimes referred to as “the Bottom
Billion” (Collier 2008) or the Global South. Development of the poorest countries of the world is a
challenge for the field of Peace and Development studies as well as for a number of policy-forming
organizations, institutions and states. The concept of development is closely linked to economy, and
development economy is inevitably entwined with international trade, which in turn is a vital part of
the current international economic system.
Trade is relevant for human development, because as Collier states (2008), money is not everything,
but is it a vital part for other types of development to occur. Patterns of international trade shape the
conditions for economic growth and are thus an integral part of the process of development. Trade
is crucial for all economies and poor developing economies in particular (Todaro et al. 2009, p.
668).
The focus of this paper is a specific type of South-South trade; interregional trade in Sub-Saharan
Africa, as well as international trade to and from Sub-Saharan Africa.
Within the field of Peace and Development studies, there are optimists and pessimists as regards
trade. There is talk of poverty levels decreasing and development levels moving upwards and
Millennium Development Goals (MDGs) soon met. Optimists talk of the South and its recent
successes on the world market, and the booming South-South trade as a cure-all for global poverty.
However, as pointed out by Collier (2008), the image of South-South trade has a danger of being
over-optimistic, as the BRICS inflate the overall perception of the current economic situation.
1.1. Research Problem
According to the pessimistic viewpoint as regards trade and development, there is risk of an
excessive optimism as regards the success rate of development of the very poorest countries:
“The development problem we now face is not that of the South in general, but of the very
bottom of the South, those whose plight goes missing in the positive numbers of Southern
Development of the Poorest of the South, Karin Strömberg 6
countries that do good development-wise, such as Brazil, China and India” (Collier 2008, p.
192).
In my opinion, it is not the already “well-on-their-way” countries in the South that is interesting and
that the field of development studies should focus on. It is the poorest of the poor, those who are in
danger of becoming a new South when the more successful Southern economies such as the BRICS
leave them behind to join the North. The research problem is thus, academically, the lack of focus
on the essentials as I see it, and pragmatically, the lack of directed and niched policies and plans to
help poorest countries. Thus, this paper will look at some of the poorest countries in the world and
attempt to study the statistical co-variation between a number of various versions of trade and their
level of human development.
1.2. Purpose of the Study
This study investigates the co-variation between various forms of trade to, from and within Sub-
Saharan Africa and human development. The purpose is to elucidate the relationship between two
phenomena which are much-disputed and whose mechanisms and processes are interlaced with
each other. Furthermore, the intention is, based on the literature presented in chapter 2, to examine a
number of specific areas of international trade: South-South trade and more specifically
interregional trade in Sub-Saharan Africa. The commodities which are traded with and their effect
on human development are also examined. The Human Development Index is used as the
dependent variable representing level of human development. A number of variables on trade are
used as the independent variables. Based on the purpose, the following specific research questions
are investigated:
1. Looking at Sub-Saharan Africa, is it possible to show statistically that a specific type of
South-South trade; interregional trade, has a higher level of co-variation with human
development than trade in general?
2. Looking at Sub-Saharan Africa, is it possible to show statistically that the type of
commodity traded with has an impact on the level of development? The co-variation
between trade with the following commodities and human development will be
investigated and compared to the co-variation between general merchandise trade and
human development:
Development of the Poorest of the South, Karin Strömberg 7
• Agricultural raw material
• Food
• Oil
• Ores and metals
1.3. Relevance
South-South trade and interregional trade and its effects on development have been studied at length
before. This study is relevant because it will illuminate a very specific group of countries, for a very
specific purpose. My intention is to deepen the understanding of the workings of trade in Sub-
Saharan Africa and investigate if this kind of trade is likely to be beneficial for the developing
countries which are under scrutiny. This paper may be useful for scholars within the field of Peace
and Development studies but also for other people with an interest in trade, development and Sub-
Saharan Africa. It may serve as a basis for further and more elaborate and extensive studies on this
topic. Finally, it may act as an example of how to conduct a quantitative study within an area which
is more commonly studied through qualitative methods.
1.4. Delimitations
As stated previously, the focus of this paper is a specific type of South-South trade; interregional
trade in Sub-Saharan Africa, but also international trade to and from this geographical area. The
case selection for this study is explained in detail in chapter 3 but in short, the number of cases that
are studies is 45, all located in Sub-Saharan Africa, all but one part of the South according to the
chosen definition, and all but one part of the two bottom categories of the HDI ranking list. The
case selection is based on data from 2009. I have chosen to focus on (mostly) very poor countries
within the South and not to include the so called BRICS except for South Africa. Furthermore, I
have chosen to concentrate on two very specific research questions for the purpose of narrowing
down the scope of interest to a degree that is manageable in a bachelor thesis.
1.5. Limitations
In this study, I will use official trade statistics from the World Bank and development statistics from
UNDP. As I intend to focus on developing countries, and in particular very poor developing
countries, the usage of official data will prose a number of problems.
Development of the Poorest of the South, Karin Strömberg 8
Firstly, official trade statistics tend to be unreliable and give a wrongful image of the actual amount
of trade occurring between countries, as informal trade is a more or less substantial part of the
financial landscape in developing countries (Todaro et al 2009, p. 760). For instance, significant
levels of trade occur along borders that go unregistered. Besides informal trade, there is also the
concept of illegal trade to take into consideration. Corruption within the state system is common,
and smuggling of valuable and illegal goods is a known feature of the economic landscape between
poor countries, not the least in Sub-Saharan Africa. Thus, it is safe to say that the value of the
informal and illegal trade is considerable as well as difficult to predict. Based on this, one could
argue that it is fruitless to attempt to conduct quantitative studies involving trade as regards
developing countries as the results will build on wrongful and misleading data. However, as the
official data is what I have access to, and as I have chosen to use a quantitative method of research,
I need to accept these issues and have in mind that I study the available data, not reality.
Secondly, some of the cases in this study lack data for some of the variables.
Some variables have less data than others, which shows in the regressions in the chapter on results.
However, I have chosen a source for the data which is comprehensive. Thus, I have done what I can
to ensure that the variables have as much data as possible, but there is obviously still a risk of biased
responses (Creswell 2009, p. 151).
According to Myrdal (1974), human development is a societal concept which is difficult to trace as
regards origin (Myrdal 1974, pp. 729-730). This is because development is a process which is
integral with its components; the various components of human development stimulate each other,
and the result is a circular co-variation. Thus, it is difficult, not to say impossible, to distinguish
between the independent variable and the dependent variable. Trade may cause development to
occur, but development may also cause trade to occur. In this study, various forms of trade have
been chosen as the independent variables, and human development has been chosen as the
dependent variable. However, an equally interesting and relevant research project would have been
to study the reversed relationship of human development as the independent variable, and trade as
the dependent variable.
Finally, the time limit will ultimately have a great impact on the outcome of this study. I need to
limit the study to the allocated time. There is so much one would like to do, and so many aspects
that are interesting, but I have had to limit my scope of interest to a specific group of countries.
Development of the Poorest of the South, Karin Strömberg 9
1.6. Disposition
In chapter 2, a background of the literature on the area of trade and development is outlined. The
concept of South-South trade and the North-South divide is explained and discussed as well as
international trade and the trade regime which has formed the rules of the global economy of today.
Some relevant theories on trade are presented as well as the general policy debate on trade,
development and South-South trade, in particular in an African perspective.
In chapter 3, the methodology for the study is outlined. The choice of method is presented and the
data and variables are described and motivated. I also provide definitions for some of the concepts
which I employ, such as human development, the South and Sub-Saharan Africa. The time span
used in the study is also presented here. I select the cases which are studied through a system of my
own design, and the parameters which make up the system are outlined and explained. Furthermore,
I explain how the data has been analyzed and how it will be presented in the next chapter. The
anticipated ethical issues as well as the limitations are also outlined. The chapter is concluded with
a description of the sources which have been used.
In chapter 4, the results are presented and the two research questions are answered systematically.
In chapter 5, the results are analyzed and compared to the literature review and the policy debate. I
attempt to draw conclusions of the significance of the results. In chapter 6, the paper is concluded
and the results and analysis is reflected upon. I attempt to view the study as part of the field of
development studies and contemplate on the significance and usage of the results.
Development of the Poorest of the South, Karin Strömberg 10
2. BACKGROUND
In this chapter, I present a background on the topic of the paper and the areas which are touched
upon. A literature overview has been made on the historical origin of the North-South Divide and
the International Trade Regime. A number of common and relevant trade theories are presented,
and the general view on trade in Africa is reviewed. Furthermore, the policy debate regarding the
pros and cons of South-South trade is mapped out. Finally, literature on interregional trade in Africa
in general and in Sub-Saharan Africa in particular is presented.
2.1. Historical Background of the North-South Divide
The North-South discourse and its historical, political and economic background are central for
understanding the North-South divide today. Although difficult to establish exactly when the
concept of the North-South divide arose, the specific North-South discourse, however, developed
after the end of the Cold War, as the new political situation after the fall of the Soviet Union
demanded for a new way of politically and economically conceptualizing the world (Ravenhill
2008, p. 413). Before the fall of the Soviet Union, the world was stratified into the first, second and
third world. Policy makers of that time generally believed that the former second world would
belong to the first world and form the North, and many former Soviet Union countries have in fact
done so, depending on the definition of the North and the South (Ravenhill 2008, p 413).
So, according to Ravenhill (2008), the discourse of the South can be traced to the discourse of the
third world. The term “third world” was coined by Alfred Sauvy in 1952 and is part of a structural
framework of thought (Tomlinson 2003, p. 309). The first, second and third world division was first
evident in the literature after the end of the Second World War and is a product of the new
economic politics of that time (Ravenhill 2008, p. 412). The “third world” is more than anything a
political definition of countries that were neither industrialized market economies such as the
United States and Great Britain, nor planned economies such as the Soviet Union and some Eastern
European countries. The third world consisted of countries that were poor and without political and
economic influence, which ultimately left them outside the policy debate. Thus, the third world was
(and is, as it is still in use, although much less so academically nowadays) a concept with economic,
but mostly political connotations (Ravenhill 2008, p. 412).
According to Tomlinson (2003), the South and the Third World, together with a number of other
Development of the Poorest of the South, Karin Strömberg 11
terms such as “the developing world” and “less and least developed countries”, are used
normatively within the field of development studies and development economy: they lack scientific
parameters and exact definitions. The South is often a fluent concept with a vague definition of
those countries that are low in economic development and have historically been so for some time.
Furthermore, Tomlinson (2003) argues that it is problematic to place such a large and diverse group
of countries into a common category, as it signals, when mentioned in policy discussions, that the
South can be regarded as a homogenous group with similar characteristics and similar problems
(Tomlinson 2003, p. 308). This is also a reason for the general reluctance to provide a definition in
the literature. There are few definitions that cover the entire group that scholars refer to. Besides the
fact that these countries are poorer than the North and have a history of economic and political
exclusion, they are very diverse and any attempt to form a common definition will be met with a
number of problems. I continue this discussion in the methodology chapter later on where I provide
the definition of the South that will be used in this study.
An interesting and normative rather than descriptive interpretation of the North-South divide is
provided by Tomlinson (2003). According to him, the main purpose of dividing the world into the
North and the South is essentially to illuminate the fact that the North dominates the economic
arena and that in the South trade and economically exist under less favorable conditions. According
to Tomlinson, such a discourse of division and categorization, although not always appreciated by
the Southern countries themselves, helps to emphasize the existence of negative relationships on the
world market (Tomlinson 2003, p. 309). The workings of the International Trade Regime and its
implications for developing countries will be discussed later in this chapter.
In sum, according to the literature review of the origin of the North-South divide discourse, the
concept has political and economic connotations, with a greater emphasis on the political aspects
historically, and a greater emphasis on the economic aspects today. Previously, it reflected which
countries that had the political power to shape the international economic arena. Today, it is used to
describe countries with differing economic capacities. The concept originated from a structuralist
discourse, but has been used widely by organizations, institutions, states, scholars and media since
the end of the Cold War. The division can be traced as far back as to the end of the Second World
War, but has possible connections to the colonial structure of the 18th and 19th century. There are
few precise definitions of the concept that indicates exactly which countries to include in which
category. One such definition will however be decided upon in the methodology chapter in this
paper for the purpose of justifying which countries to include in the study. Finally, the North-South
Development of the Poorest of the South, Karin Strömberg 12
division can also be used not only as a descriptive concept, but also as a normative concept to
illuminate problems on the global market.
2.2. The International Trade Regime and its Impact on Development
The current international economic system is built upon the International Trade Regime, a product
of liberal theory. The Regime was founded after the end of the Second World War, together with
the North-South divide discourse (Tomlinson 2003, Staiger 2004 and Ravenhill 2008). According
to the more politically oriented understanding of the South, they are the countries that were and are
excluded from the policy debate, and those who did not have a say in the design of the international
economic system (Tomlinson 2003, p. 309 and Ravenhill 2008, p. 412). The International Trade
Regime has great influence over the workings of international trade, however, and the rules of the
Regime decide how and if various countries benefit from trade. As the aim of this paper is to
investigate how trade affects human development, it is thus interesting to consider the impact of the
International Trade Regime on the South.
The rules of the International Trade Regime apply to three economic institutions; international
agreements, trade, and national regulations (Ravenhill 2008, p. 138). The General Agreement on
Tariffs and Trade (GATT) provided the founding framework for the regime. GATT was based on
the principle of free trade and equal competition between countries. The World Trade Organization
has now taken over the function as the primary policy-setting institution (Staiger 2004).
According to Ravenhill (2008), GATT has been problematic for developing countries for a number
of reasons. Primarily, GATT proclaims a reduction of tariffs, which have proved more damaging
for developing countries, as they suffer from the lack of protection that their young and fragile
industries require (Ravenhill 2008, p. 154). Due to this, the South has since the founding of GATT
attempted to apply methods of self-sufficiency in order to participate in trade as little as possible
than attempt to battle with the richer countries on the world market (Ravenhill 2008, p. 155).
Historically, trade has not been as beneficial for development for the South as it is has been for the
North. As this is the case, it is one of the reasons why I find the connection between trade and
human development interesting.
GATT’s policy in tariffs is one reason for the less profitable relationship between developing
countries and international trade. According to Ravenhill, the design of international trade
Development of the Poorest of the South, Karin Strömberg 13
agreements is another. Common for many trade agreements formed in the post-war period and up
until the 1980s was that they were designed primarily by the US and Europe, and was thus
beneficial mainly for them (Ravenhill 2008, p. 157). This is and has been a problem for developing
countries, as they have experienced difficulties on the world market because of this.
In short, trade is - in theory - good for development, but due to the design of the international trade
system, poor economies have a more difficult time than others to assimilate to the benefits.
2.3. Trade in Theory
The fundamental purpose of trade is to get access to something one does not have. Besides that,
international trade is also an important means for states to earn money. Within the modern
international trade system, states do not only trade with goods they cannot produce themselves, they
also trade with goods they profit from not producing themselves, because they can save money by
purchasing it and concentrate their production on something else. Traditional theory of international
trade explains this phenomenon, and is based on the logic of comparative advantage (Todaro et al.
2009, p. 599-600).
2.3.1. Theory of Comparative Advantage
Depending on who has the lowest marginal cost of production of a certain good, countries choose to
specialize in different types of production (Grimwade 1989, p. 6). It is the comparative cost of
production, not the absolute cost, which determines the layout of the international trade system,
according to the theory of comparative advantage. The cost of production is waged against the price
that other countries are prepared to pay for the commodity. In a country with higher living costs and
higher wages, goods from a country with lower wages and lower living costs will comparatively be
cheaper (Grimwade 1989, p. 7).
Countries with comparatively lower living costs will benefit from selling their products on the
world market, as they will be sold at a higher price there than they would in their own domestic
market. Countries with comparatively higher living costs will also benefit from buying these
products, as it is cheaper to buy them than to produce them within their domestic production
(Grimwade 1989, p. 7).
The international trade system is ultimately a win-win situation according to the comparative
Development of the Poorest of the South, Karin Strömberg 14
advantage theory. This theory is part of a liberalist viewpoint and is ultimately positive in its
approach to trade and development. Thus, within liberal theory, trade is beneficial for the
development of all states. In practice, however, some states benefit more from trade more than
others, and at the expense on those who do not benefit as much. Poorer countries experience a
number of drawbacks on the global market, which is why a number of critical theories on trade have
developed over time as a response to the liberal, and in essence positive, theories. One of these
critical structural theories is the North-South Model of Unequal Trade. This theory is central to this
study.
2.3.2. North-South Model of Unequal Trade
The model explains how capital-rich countries stimulate themself into more growth, while capital-
poor countries fall behind, creating a gap between rich and poor countries. The model is a critique
of the neoclassical trade model, concerning the relationship between the North (developed rich
countries) and the South (developing poor countries) and how international trade interacts with
unequal and imperfect relationships. The model criticizes the notion that factor endowments and
relative costs are constant, as they have to be if the neoclassical trade theory is to be correct (Todaro
et al. 2009, p. 607). According to the North-South model of unequal trade, comparative costs of
production change over time. Furthermore, there are a number of resources which are particularly
important for successful development: physical capital, entrepreneurial abilities, scientific
capacities, the ability to carry out technological research and development, and the upgrading of
technology, and upgrading of technological skills of the work force (Todaro et al. 2009, p. 607). As
the South has an abundance of (unskilled) labor, the South specializes in primary production
(according to the factor endowment theory), but that is according to the North-South model of
unequal trade unfavorable. Export of primary products is in general less cost effective than export
of manufactured products. Specialization according to factor endowment traps poor countries in a
mode of production which inhibits accumulation of capital (necessary for successful development)
and distributes incomes from production and export to those few who own capital, which emphasize
and worsens the pattern of unequal distribution, causing underdevelopment for the masses (Todaro
et al. 2009, p. 607).
2.4. Africa and its Economic Conditions – Problems Related to Trade
As regards both trade and development, Africa is an interesting continent to study. It has many of
the world’s least developed economies, it has a history of extreme political and economic exclusion,
Development of the Poorest of the South, Karin Strömberg 15
it suffers and has suffered from a number of financial difficulties such as debt crises, uneven
distribution of wealth and inability to partake in global trade. The opinions as to why this is the case
are diverse and often depend on one’s political viewpoint (mainly liberal or structural ideologies).
However, some facts can be established about the continent.
Historically in Africa, a large proportion of production and exports have been of primary goods,
often agricultural commodities but also other natural resources (Todaro et al. 2009, p. 591). African
countries are often dependent on one or a few commodities which amount to the bulk of their GDP
(Todaro et al. 2009, p. 591). To be dependent on a single commodity creates increased sensitivity
for fluctuations on the world market relating to price and demand of the commodity in question.
The profit for primary goods is also lower compared to secondary goods or services. African
countries that are dependent on exports of primary goods also struggle with a high need to import
secondary goods and refined food products which they do not produce themselves (Todaro et al.
2009, p. 593). A relatively low profit on exports and a high need of imports (which are more
expensive) creates a vicious circle of balance of payment deficits and an increased vulnerability to
crises. This, in turn, leads to an inability to save long term and reinvest capital in the domestic
economy (ibid).
These are the main challenges that many (but not all) African countries face in terms of trade. Thus
far, scholars generally agree. What they disagree on, however, is on why this is so, and how to
remedy the problems that Africa faces in terms of lack of development. There are no direct links
between trade and human development, but as stated by Collier (2008), money is an integral part in
the process of human development, and trade is linked to economic development. I now move on to
the structural discussion on a specific type of South-South trade: interregional trade in Africa. As
one of my research questions is about this specific type of trade, I provide more detail on this.
2.5. Interregional Trade in Africa: A Background
Regionally integrated trade is another more specific type of South-South trade (UNCTAD 2009, p.
2). Interregional trade in Africa is, according to UNCTAD, an opportunity for the African
economies to diversity their trade to mutually benefit all involved and to structurally alter their
economies to gain development effects.
Historically, the share of interregional trade in Africa is considerably lower than interregional trade
Development of the Poorest of the South, Karin Strömberg 16
in other developing regions such as Asia and South America (UNCTAD 2009, p. 21). The colonial
trade patterns established in Africa is believed to be a contributing factor for this (UNCTAD 2009,
pp. 21-22). In the 1980s, the situation started to shift and interregional trade in Africa began to
increase compared to other types of trade. This had, according to UNCTAD its reasons in two major
events; first, the end of Apartheid in South Africa, which resulted in an increase in trade between
South Africa and the rest of Africa, and second, the SAPS. Although structural adjustment
programs caused a number of economic and social problems for Africa, they also contributed to
opening up African markets, which made it possible for African countries to trade with each other
(UNCTAD 2009, pp. 22-23).
Interregional trade in Africa consists of about 10 percent of Africa’s total trade (UNCTAD 2009, p.
23). The growth rate of interregional trade within Sub-Saharan Africa has been significantly higher
from 1960 to 2004 than the rate in North Africa, which is rather surprising. The UNCTAD report
suggests that the linguistic and cultural similarities of Northern Africa should facilitate interregional
trade, but this has not been the case (UNCTAD report 2009, p. 23). This is an interesting
phenomenon which contributed to my decision to focus on Sub-Saharan Africa in this study.
How then, will regional trade in Africa more specifically contribute to development? After the
removal of trade barriers between countries in Africa, low-cost producers within the region will
have access to a larger market and can lower their production costs even more through advantages
of economies-of-scale (UNCTAD 2009, p. 18). Consumers in the region will benefit from lower
prices on commodities, and consumption will go up. Areas that produce more expensive goods will
be able to export to low-income areas, as the low-income areas will become richer as they too will
be able to expand their export. There is a win-win situation. Today, however, trade barriers between
African countries are generally higher than between Africa and the North in general, which
naturally makes interregional trade difficult (UNCTAD 2009, p. 18).
2.5.1. Interregional Trade in Sub-Saharan Africa
Sub-Saharan African countries dominate the interregional African trade sector (UNCTAD 2009, p.
27). South Africa is regarded as a force of growth, spurring on economic growth in surrounding
countries. The positive effect of good neighbors on trade patterns is highlighted in the report
(UNCTAD report 2009, p. 34). If one country is successful in terms of trade and development, so
are its neighbors to a higher extent. South Africa and Botswana in Sub-Saharan Africa has thus a
Development of the Poorest of the South, Karin Strömberg 17
positive still-over effect on its Sub-Saharan neighbors, which is an explanation to the more
favorable (from a structural point of view) trade patterns in the Southern part of Africa as opposed
the Northern part. Paradoxically, the spill-over effect is strengthened through the general lack of
efficient infrastructure (UNCTAD 2009, p.34). Transportation of traded goods over large distances
is due to this expensive, especially if the goods must travel by road. Thus, land-locked countries in
particular will strive to trade with neighbors if possible in order to keep transport costs down. This
will result in a concentration of trade within limited areas, as seen in Sub-Saharan Africa
(UNCTAD 2009, p. 34).
Below follows an outline of the policy debate on the subject of development of the South and
South-South trade.
2.6. The Policy Debate on Trade and Development
The debate on trade and development is large and varied. It is, however, possible to roughly divide
the field into a structural and a liberal side, although it is sometimes not a clear-cut case that should
belong where; instead, the field is more like a linear scale with structuralism at one end and
liberalism at the other end rather than a clear division of opposing sides. The following section will
outline some of the general arguments of the field on how to achieve development for the South,
divided into trade liberalists and trade structuralists. A liberal viewpoint is in essence positive
towards trade and its potential as a tool for development. A structural viewpoint is a critique of the
liberal viewpoint. Please see the previous sections on the Theory of Comparative Advantage and the
North-South Model of Unequal Trade for some general traits of liberal and structural viewpoint.
The subject of trade and development is a contested one, and heated discussions have occurred on
the subject for a long time. An early and famous discussion is the one between Lewis and Riedel
(Bredesen and Strobel 1991, p. 51). Lewis was pessimistic of the market liberal viewpoint of trade
between developed countries and less developed countries leading to economic growth for all
parties. Instead, export of primary goods by less developed countries to developed countries was
beneficial for the growth of developed countries, and not so much of less developed countries
(Bredesen and Strobel 1991, p. 51). Thus, the argument of Lewis was that North-South trade
generated growth, but not necessarily for the South as much as for the North. Riedel, on the other
hand, contested Lewis’ results and suggested that no such stable relationship between export of
primary products and economic growth could be found (Bredesen and Strobel 1991, p. 51). Riedel
Development of the Poorest of the South, Karin Strömberg 18
was thus not convinced that a structural pattern could be proved to exist. These two scholars, in
essence, represent the two sides in this debate. Lewis is structural and Strobel is liberal.
2.6.1. Liberal Point of View on Trade and Development
The World Bank is an example of an institution which has gone from a thoroughly liberal approach
to a more moderate and inclusive version of its former policy. For instance, according to the newly
published policy report by Behar and Crivillé (2011), for a developing country, its level of bilateral
trade will rise regardless of whom the country signs a bilateral trade agreement with (and thus
whomever it later trades with). However, South-South bilateral trade agreements tend to increase
the total share of trade more that North-South bilateral trade agreements do (Behar and Crivillé
2011, p. 16).
Even though their more rigid liberal point of departure of the 70s and 80s has been abandoned, the
IMF and the World Bank together with the WTO stands to maintain a free world market (Geithner
and Nankani 2002, p. 4). These institutions represent the market liberal point of departure of today,
producing a development policy with a more liberal angle compared to for instance UNCTAD
(which has a clear structural discourse). In their joint report (by Geithner and Nankani 2002), the
IMF and the World Bank argues that integration into the entire world market and participation in
international trade will increase economic growth and reduce poverty for the poorest countries
(Geithner and Nankani 2002, p. 4). The organizations are critical of protectionist measures, as they
see it as disruptive for the free market. Their main method for increased development of the South
is to take measures to improve market access for exports from the South. The report by Geithner
and Nankani particularly emphasizes the importance of OECD members to reduce their
protectionist measures on agricultural products and textiles, as those markets are heavily distorted
and because many countries in the South are dependent on those markets (Geithner and Nankani
2002, p. 8-9).
According to the OECD (2006), far-reaching trade liberalization is the most effective way for
developing countries to increase their rate of development. Developing countries would benefit
massively from opening up their markets for the world market in general and also “boost” South-
South trade (OECD 2006, p. 1). The OECD paper states that about 6 % of the total world trade is
South-South trade, which according to them shows that there is considerable scope for improvement
of that particular branch. They also, however, state that the bulk of the South-South trade is
Development of the Poorest of the South, Karin Strömberg 19
happening between the upper layer of the South, and not in the poorest of the South (OECD 2006, p
1). The OECD does not provide a varied policy depending on where on the income scale a country
is situated, which according to the structural point of departure is very important, and a key
explanation as to why development policy works for some countries and regions, but not for others.
2.6.2. Structural Point of View on Trade and Development
According to Reuveny and Thompton, systemic leadership (and cooperation/interdependence with
the leader) is very important for economic success, which explains why the North has succeeded
better in achieving economic growth than the South (2008, p. 597). As the system leaders (Great
Britain and the United States) are part of the North, the growth rate and economic behavior of them
are reflected in the growth rate and economic behavior of the rest of the North, while a similar
pattern cannot be seen among the South (Reuveny of Thompton 2008, p. 598-599). The question of
what is produced/exported and what is most profitable to produce/export is also central for
explaining different economic growth patterns of the North and the South (Reuveny and Thompton
2008, p. 600).
Thus, the structural argument of Reuveny and Thompton (2008) is that the gap between the North
and the South is caused by the fact that the economic policy and behavior of the Northern
hegemonic leader is mirrored by other Northern economies, and that technology, policy and
knowledge developed by the hegemonic leader is more likely to succeed in the North than in the
South. The advantages of these elements are not spread to the South, hence the gap in economic
growth and the current situation with poverty and under-development of the South.
The question of production and what is traded is vital. In the South, labor-intensive sectors are
stimulated while technology-intensive sectors are stimulated in the North. According to Reuveny
and Thompton (2008), this leads to a higher productivity and a more profitable trade for the North,
which explains the higher growth rate over time.
According to the structural viewpoint, the gap between the North and the South is to a large extent
caused by differences in technology (Reuveny and Thompton 2008, p. 601). This structural
interpretation of the lack of economic growth in the South implies that the North-South divide and
the gap between the rich and the poor will not go away until the structure which keeps the system in
place is changed. The gap may decrease temporarily, caused by a comparatively successful
Development of the Poorest of the South, Karin Strömberg 20
development policy in the South (Reuveny and Thompton 2008, p. 602). However, as soon as the
next great technological innovation of the North arrives, the gap will increase again, as the growth
of the North will surge, while the growth of the South will stay comparatively stagnant (Reuveny
and Thompton 2008, p. 602).
These particular scholars point at a number of specific structures that hampers successful
development of the South. The essence is, however, similar to all structural arguments; that the
structure of the international market matters for economic growth and development, and that the
pre-conditions for economic growth are very different depending on structural and hierarchal
position; that is, where a country is positioned on the GDP per capita-scale. Thus, development
policy must have structural awareness.
The structural view point above explains why many institutions, policy-makers and scholars are
hopeful of South-South trade. Through South-South trade, the structure that hampers development
of the South can be avoided.
The work of UNCTAD has an outspoken structural viewpoint. In a report from 2010, the issue of
African development is discussed (UNCTAD 2010).There are several arguments in favor of an
increased South-South economic partnership in Africa. For examples, it may increase the overall
bargaining power of the African region vis á vis the industrial world on the global market. This will
structurally increase the power of the South in global financial matters and within policy-forming
institutions (UNCTAD 2010, p. 11). However, according to UNCTAD (2010), South-South trade in
Africa must be designed in a way that breaks with the trade patterns of the traditional North-South
trade. South-South trade does not per se lead to improved development; structural change is the key
factor, and South-South trade is a tool to reach that change (UNCTAD 2010, p. 13).
The structural pattern that the UNCTAD report (2010) refers to more specifically is, among other
things, the diversity of exports. For South-South trade to have maximum benefits for Africa,
African countries should take this opportunity to diversify their export sector, and strengthen their
capacity for capital accumulation, especially through technological progress (UNCTAD 2010, pp.
13 and 102).
I have now outlined the general policy debate as regards trade and development and its connection
to South-South trade, as well as some specific opinions about African trade.
Development of the Poorest of the South, Karin Strömberg 21
3. METHODOLOGY
This paper employs a deductive approach, using a quantitative method to collect the available data
which is then analyzed. Variables from two reliable sources, the World Bank and the UNDP, are
singled out and data from those variables is gathered. Software developed for analysis of data,
PASW Statistics 18, is then used to create regressions between two variables at a time. The result
from these regressions is based on the theoretical framework presented in the previous chapter. The
results enable me to talk about specific trends within the group of countries (population) chosen as
subjects in this paper. Definitions of the concepts used as well as the choice of variables and
population are discussed later in in this chapter.
3.1. Choice of Method
The design of the research problem necessitates the usage of a quantitative method to answer my
research questions. As stated by Creswell, “if the problem calls for (a) the identification of factors
that influence an outcome… a quantitative approach is best” (Creswell 2009, p. 18). A Had the area
of interest been unexplored and/or if the study had needed to be exploratory in its approach then a
qualitative method would have been more appropriate. Although my particular research problem is
not very well explored (hence the decision to do this study), the economies of the Sub-Saharan
African countries are, which make a qualitative method less useful. Finally, as I intend to use a
deductive approach to my research, the quantitative research is well suited for that way of
approaching the research questions (Creswell 2009, p. 18).
3.2. Data and Variables
The data used in this study is collected from the existing data bases of UNDP and the World Bank.
My material is gathered in this manner for a number of reasons. The main reason is the accessibility
of the data from the above mentioned sources. The format of the data from the World Bank is easy
to convert into excel files and PASW Statistics files. Aiming to use data that is as reliable as
possible, I selected a source that would be able to provide the most adequate number of variables
needed. Had I used data and variables from many different sources, there might have been problems
with compatibility; consequently, the results would have been misleading. By using variables from
the same source, it is also more likely that the data is generated with similar methods: this is turn
contributes to a more reliable result. Other sources of data were rejected in favor of the World
Development of the Poorest of the South, Karin Strömberg 22
Bank’s data as it is, in my viewpoint, always more sound to use data that is as distorted as
possible.
3.2.1. Independent Variables The following variables were gathered from the World Bank data base and were used as
independent variables. Definitions of these variables can be found in the annex.
• Merchandise trade (% of GDP)
• Merchandise exports (current US$)
• Merchandise imports (current US$)
• Merchandise exports to developing economies in Sub-Saharan Africa (% of merchandise
exports)
• Merchandise imports from developing economies in Sub-Saharan Africa (% of merchandise
imports)
• Agricultural raw material export (% of merchandise export)
• Agricultural raw material import (% of merchandise import)
• Food export (% of merchandise export)
• Food import (% of merchandise import)
• Oil rents (% of GDP)
• Ores and metals export (% of merchandise export)
• Ores and metals import (% of merchandise import)
Within quantitative research, the concept of cause and effect is central. This assumes that one
variable (the independent one) causes the other (the dependent one) to occur (Creswell 2009, p. 50).
However, within social science, there is no definitive way of proving an absolute co-variation
between two variables, especially not in a quantitative study. The regressions in this study will thus
only manage to establish a probable co-variation (Creswell 2009, p. 50). At best, I can hope to
claim that one of the independent variables in the bullet list above probably causes the dependent
variable (human development) to occur. I cannot say that there is an absolute co-variation, as there
may be a false connection between the variables that is caused by a number of underlying
mechanisms.
Throughout this paper, I will be using the term “co-variation” to describe the statistical connection
Development of the Poorest of the South, Karin Strömberg 23
between two variables. With co-variation, or level of co-variation, I mean the statistical connection
that is possible to see when comparing two variables in a regression. Whether or not there is an
actual co-variation is more difficult to establish. As stated by Creswell (2009), when using
statistics, one can hope to show tendencies, trends, indications, and such. I hope to be able to see a
general picture of the co-variation between human development in 1990 and various other variables
in 2009. However, to explore the underlying mechanisms and reasons for a specific quantitative co-
variation, in-depth studies of a qualitative nature, and a detailed review of the available data is
necessary. Given that I am aware of the limitations of the data that is used in this study and the
possible criticisms that may be leveled to my including/excluding certain countries or certain years,
I base my findings on statistical regressions calculated in this paper. As such, I use the term co-
variation defined as being one thing causing another but am, nevertheless, aware that this may not
be the case beyond the scope of this study.
3.2.2. The Dependent Variable: Human Development There are a number of different units that one may choose to represent. GDP per capita is often
used, particularly by economic scholars. That is also the variable used by the World Bank when
they have created the independent variables in the list above. I find it necessary, however, to find
another unit of measurement that includes more than just economics as I have chosen to define
development according to the reasoning of Myrdal (1974).
Myrdal offers a definition of development which has been widely accepted and applied within the
field of Peace and Development studies. Myrdal defines development as “the movement upward of
the entire social system” (Myrdal 1974, p. 729). According to Myrdal, his definition is suitable for
the field of study as it incorporates other variables into the concept besides economic factors, such
as non-economic consumption; consumption of education, health, societal distribution of power,
formation and design of institutions, both economic, cultural and social ones (Myrdal 1974, pp.
729-730). Thus, the concept of development reaches far beyond the economic realm, and policy
formation for developmental purposes must also stretch beyond the economic sphere in order to be
successful. This is a suitable definition of development for this study, as the area of interest is
human development rather than economic development.
Similar to Myrdal, Ravenhill (2008) understands the concept of development as a process of
structural transformation. Economic growth is a component in this transformation, but other
elements are equally important, such as human development (Ravenhill 2008, p. 411). Economic
Development of the Poorest of the South, Karin Strömberg 24
growth per se does not necessarily generate an improvement of the living standards of the general
public, which is what development according to Ravenhill is all about. Economic development and
human development must be incorporated into each other in order for this to happen.
The different societal, economic and cultural components which make up development according to
the definitions of Myrdal and Ravenhill often have a causal relationship where it is difficult to
decide in which direction the co-variation is going (Myrdal 1974, p. 730). This is referred to as a
circular co-variation by Myrdal (1974), and common between variables that are part of the
development process. It is thus likely that there will be a circular co-variation between the variables
in this study, as they are part of the same process and together form a structure which is
interdependent of itself. The argument of circular co-variation will be taken into consideration in
the chapter on analysis of the results.
The Human Development Index (HDI) developed by UNDP is an index that measures human
development rather than economic development. It correlates with development as defined by
Myrdal (1974) and Ravenhill (2008) to a higher degree than just purely economic units of
measurement such as GDP or Gross National Income (GNI). HDI will consistently be the
dependent variable in the regressions used in this paper as the aim in all my research questions is to
investigate the effect that the independent variables have on human development.
3.2.3. Definition of the Human Development Index
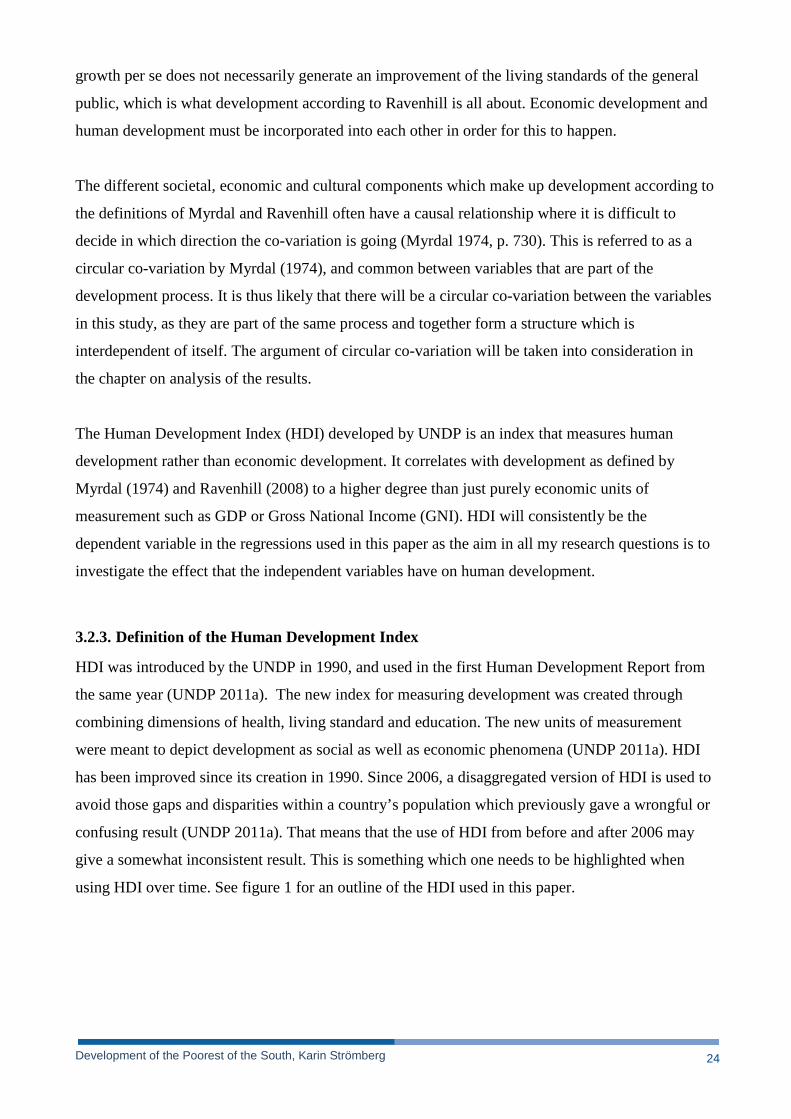
HDI was introduced by the UNDP in 1990, and used in the first Human Development Report from
the same year (UNDP 2011a). The new index for measuring development was created through
combining dimensions of health, living standard and education. The new units of measurement
were meant to depict development as social as well as economic phenomena (UNDP 2011a). HDI
has been improved since its creation in 1990. Since 2006, a disaggregated version of HDI is used to
avoid those gaps and disparities within a country’s population which previously gave a wrongful or
confusing result (UNDP 2011a). That means that the use of HDI from before and after 2006 may
give a somewhat inconsistent result. This is something which one needs to be highlighted when
using HDI over time. See figure 1 for an outline of the HDI used in this paper.
Development of the Poorest of the South, Karin Strömberg 25
Figure 1: Illustration of the different elements of the Human Development Index
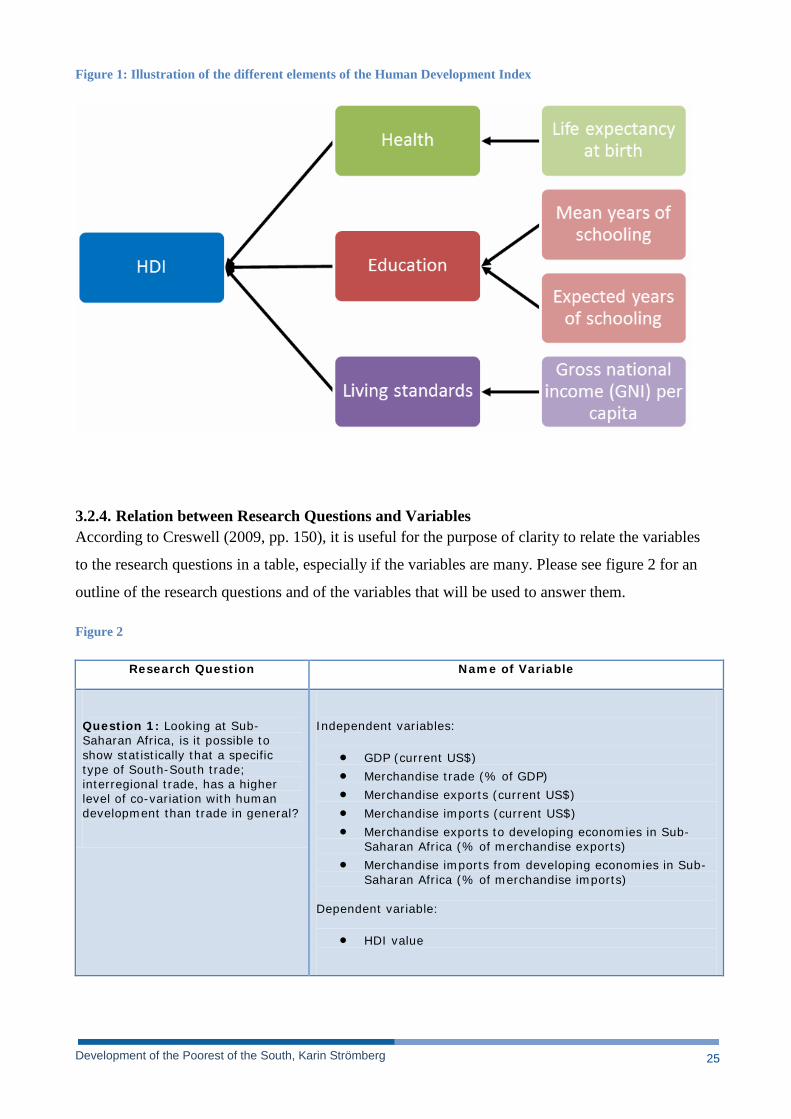
3.2.4. Relation between Research Questions and Variables According to Creswell (2009, pp. 150), it is useful for the purpose of clarity to relate the variables
to the research questions in a table, especially if the variables are many. Please see figure 2 for an
outline of the research questions and of the variables that will be used to answer them.
Figure 2
Research Question Name of Variable
Question 1: Looking at Sub-Saharan Africa, is it possible to show statistically that a specific type of South-South trade; interregional trade, has a higher level of co-variation with human development than trade in general?
Independent variables:
• GDP (current US$) • Merchandise trade (% of GDP) • Merchandise exports (current US$) • Merchandise imports (current US$) • Merchandise exports to developing economies in Sub-
Saharan Africa (% of merchandise exports) • Merchandise imports from developing economies in Sub-
Saharan Africa (% of merchandise imports) Dependent variable:
• HDI value
Development of the Poorest of the South, Karin Strömberg 26
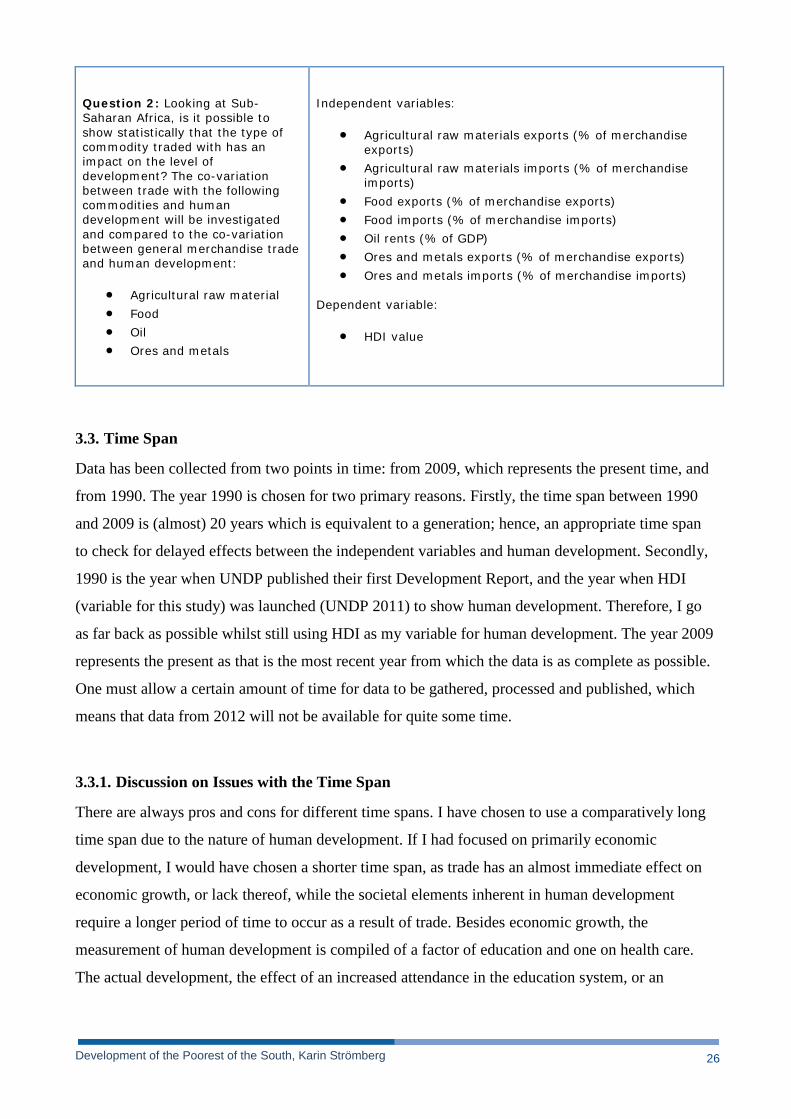
Question 2: Looking at Sub-Saharan Africa, is it possible to show statistically that the type of commodity traded with has an impact on the level of development? The co-variation between trade with the following commodities and human development will be investigated and compared to the co-variation between general merchandise trade and human development:
• Agricultural raw material • Food • Oil • Ores and metals
Independent variables:
• Agricultural raw materials exports (% of merchandise exports)
• Agricultural raw materials imports (% of merchandise imports)
• Food exports (% of merchandise exports) • Food imports (% of merchandise imports) • Oil rents (% of GDP) • Ores and metals exports (% of merchandise exports) • Ores and metals imports (% of merchandise imports)
Dependent variable:
• HDI value
3.3. Time Span
Data has been collected from two points in time: from 2009, which represents the present time, and
from 1990. The year 1990 is chosen for two primary reasons. Firstly, the time span between 1990
and 2009 is (almost) 20 years which is equivalent to a generation; hence, an appropriate time span
to check for delayed effects between the independent variables and human development. Secondly,
1990 is the year when UNDP published their first Development Report, and the year when HDI
(variable for this study) was launched (UNDP 2011) to show human development. Therefore, I go
as far back as possible whilst still using HDI as my variable for human development. The year 2009
represents the present as that is the most recent year from which the data is as complete as possible.
One must allow a certain amount of time for data to be gathered, processed and published, which
means that data from 2012 will not be available for quite some time.
3.3.1. Discussion on Issues with the Time Span
There are always pros and cons for different time spans. I have chosen to use a comparatively long
time span due to the nature of human development. If I had focused on primarily economic
development, I would have chosen a shorter time span, as trade has an almost immediate effect on
economic growth, or lack thereof, while the societal elements inherent in human development
require a longer period of time to occur as a result of trade. Besides economic growth, the
measurement of human development is compiled of a factor of education and one on health care.
The actual development, the effect of an increased attendance in the education system, or an
Development of the Poorest of the South, Karin Strömberg 27
improved general health status due to an expansion of the universal health care system, takes place
when people start to benefit from these stately measures of provision. Thus, for schooling to benefit
an individual, a number of years must elapse from the point of provision to when the education can
be fully applied, e.g. in a profession. Similarly, the developmental benefits of a health care system
may take many years to fully expand, e.g. when a child is saved from dying as an infant, its
contribution to society will occur much later, most likely when that individual reach adulthood, or
when the life-long reduction in income for that individual due to stunting is absent. Thus, a 19
years’ time span between the independent variable and the dependent variable makes sense from a
human development perspective.
From other perspectives, the chose time span may be less suitable. From an economic and political
macro-perspective, a lot of things have happened to the Sub-Saharan countries since 1990, e.g.
several of the countries have found and started to exploit oil and other natural resources. This
naturally alters the economic and political outlook for these countries, and through that changes the
possibilities for human development. Thus, an occurrence in 1998 may alter the economic climate
in a country, which has a greater effect on the level of human development in 2009 more than one
of the variables in 1990 has. Despite this, I maintain that 19 years is an appropriate time span for
this study due to its nature as primarily interested in human development rather than anything else.
That said, it would be interesting to expand this study on another occasion and do a time line of
regressions where the independent variables from 1990, 1991, 1992, 1993, 1994 and so on up until
2008 is tested against the dependent variable from 2009. That way, one could see what happens
over time, and distinguish specific years had a greater effect on human development than others,
and do a mixed method study by qualitatively explore what occurred during those specific years.
The qualitative study could then potentially be used to form appropriate development policies.
3.4. Case Population
The countries that comprise the case population in this study were selected through a three-
parameter system which incorporates geographical and/or political stratification, economic
development and human development. A country was deemed suitable if falling within the first
parameter (the geographical/political one), and at least within one of the two other (economic
and/or human development).
My population from which the data was drawn consisted of 45 countries, all from a part of sub-
Development of the Poorest of the South, Karin Strömberg 28
Saharan Africa. I concentrated the study to a geographically defined area for several reasons.
Firstly, I am interested in the poorest part of the South, as the South is, by anyone’s standards, a
diverse group of countries with a broad spectrum of characteristics. Secondly, a large part of the
countries at the bottom of the South (explained shortly) are Sub-Saharan African countries. Thirdly,
geography is an interesting aspect of development and a firmly established component of the
possibilities of development within the literature on the subject. For the purpose of making my
country selection clear and the choice valid, I will now guide the reader through the process step by
step.
To begin with, I need to define which countries constitute the South today. For that purpose, a
literature overview was made to determine the general definition of the North and the South and the
historical background of the origin of the concept within the field of development studies and
economics. Below follows an outline of the literature and a general definition of the concept.
3.4.1. Definitions of the South
Within the field of development studies and economics, there are many definitions of the South and
interpretations of which countries to include in the concept. According to Reuveney and Thompson
(2008, p. 591), there are no established tradition on how to define the South and it is up to each
author to choose an appropriate definition. Some scholars base their classification of countries
belonging to the North or the South on their level of industrialization or on how long they have been
involved in the process of industrialization (Reuveny and Thompson 2008, p. 591). Others divide
countries into the North and the South based on economic or even military capacities. Ravenhill
(2008) defines the South as “countries which do not have the opportunity to play a significant role
in global rule-making and policy formulation” and use the South as a less politically charged term
than “the third world”, although the two terms are similar and would possibly embody the same
countries (Ravenhill 2008, p. 411). Thus, Ravenhill’s definition of the South is based on politics
and power.
Reuveny and Thompton (2008) use the level of GDP per capita to decide whether a country should
be regarded as belonging to the South or the North. If the GDP per capita of a country is equal or
less than 25 % of the GDP per capita of the country with the highest GDP per capita rating, it
belongs to the South. Thus, as the GDP per capita for different countries varies over time, the group
classified as the South is flexible. The definition provided by Reuveny and Thompson is entirely
Development of the Poorest of the South, Karin Strömberg 29
based on economics in connection with population. I have chosen the Reuveny and Thompson
definition of the South to be used throughout this paper.
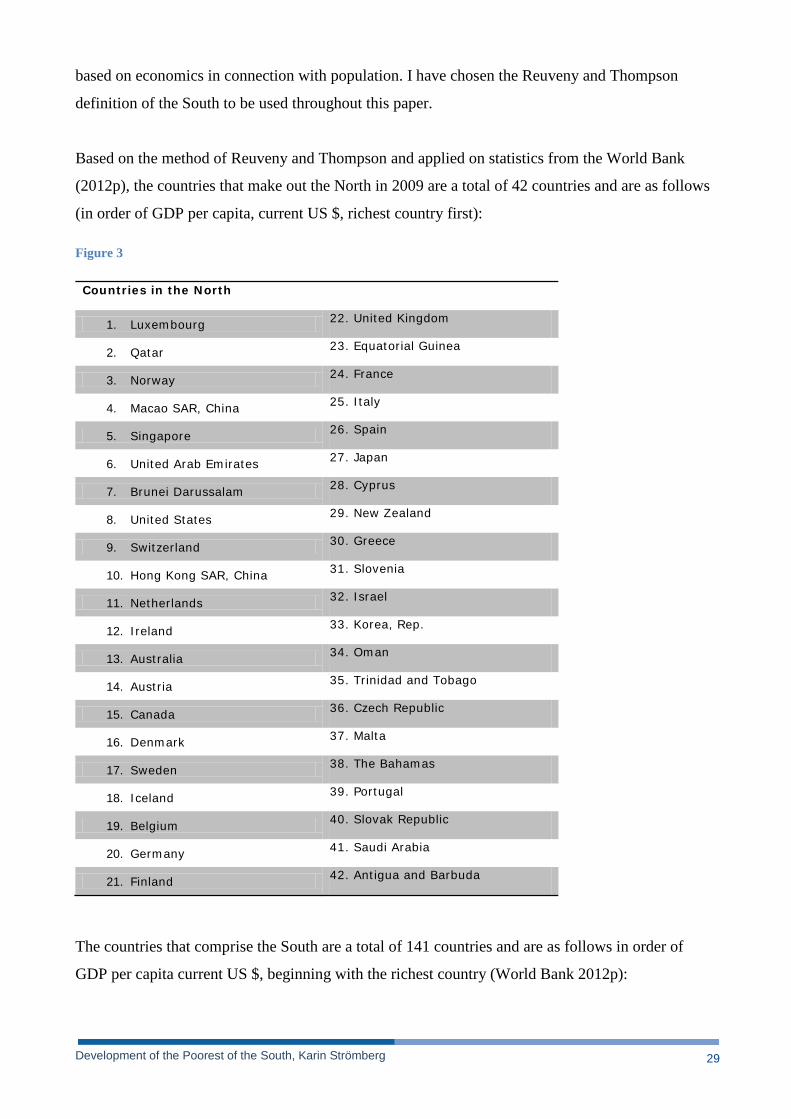
Based on the method of Reuveny and Thompson and applied on statistics from the World Bank
(2012p), the countries that make out the North in 2009 are a total of 42 countries and are as follows
(in order of GDP per capita, current US $, richest country first):
Figure 3
Countries in the North
1. Luxembourg 22. United Kingdom
2. Qatar 23. Equatorial Guinea
3. Norway 24. France
4. Macao SAR, China 25. Italy
5. Singapore 26. Spain
6. United Arab Emirates 27. Japan
7. Brunei Darussalam 28. Cyprus
8. United States 29. New Zealand
9. Switzerland 30. Greece
10. Hong Kong SAR, China 31. Slovenia
11. Netherlands 32. Israel
12. Ireland 33. Korea, Rep.
13. Australia 34. Oman
14. Austria 35. Trinidad and Tobago
15. Canada 36. Czech Republic
16. Denmark 37. Malta
17. Sweden 38. The Bahamas
18. Iceland 39. Portugal
19. Belgium 40. Slovak Republic
20. Germany 41. Saudi Arabia
21. Finland 42. Antigua and Barbuda
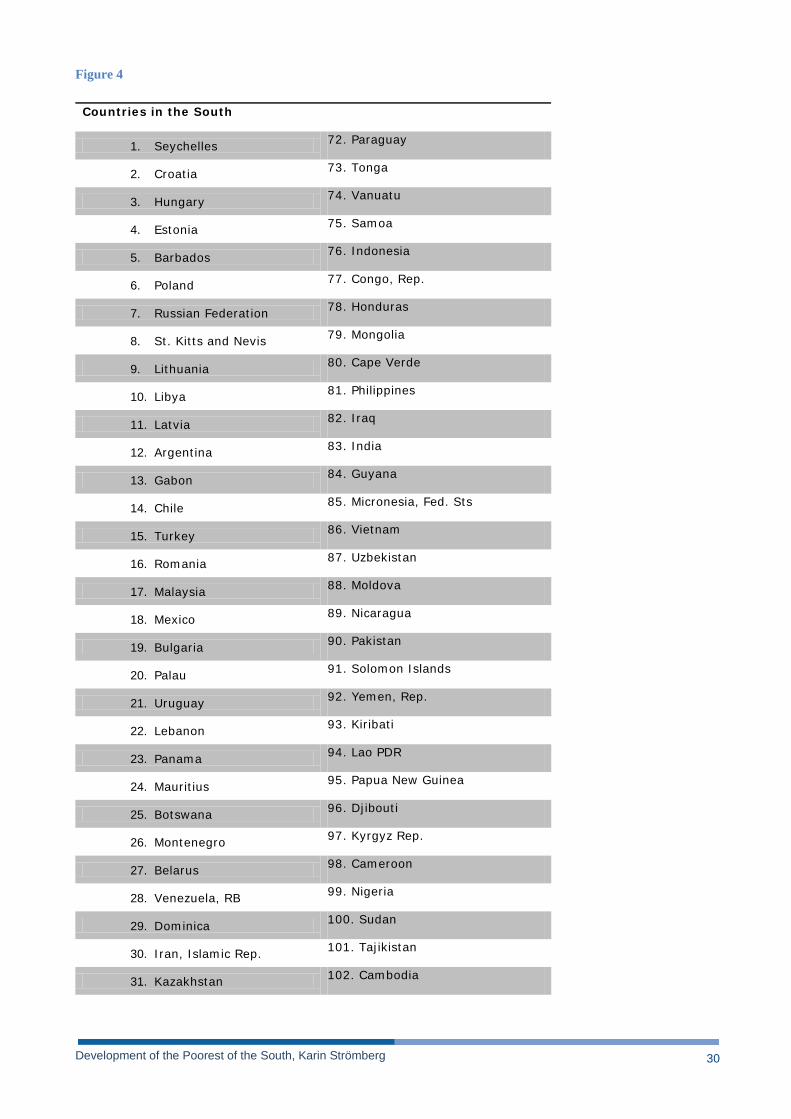
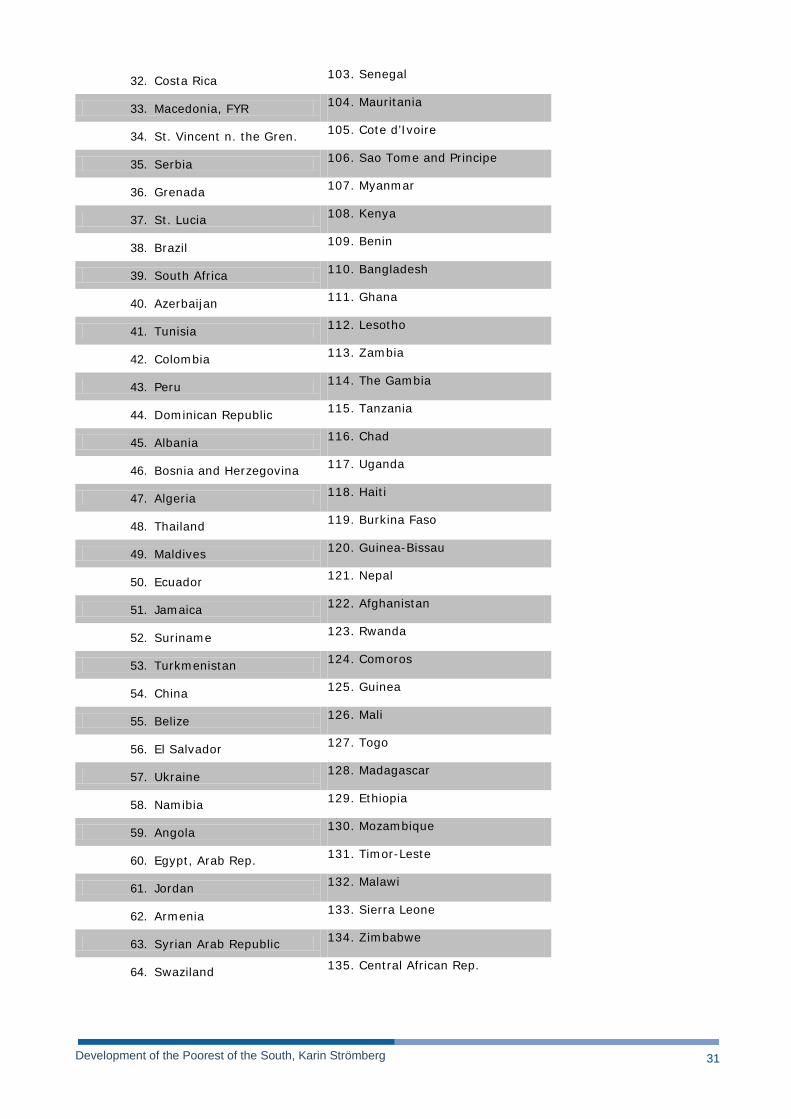
The countries that comprise the South are a total of 141 countries and are as follows in order of
GDP per capita current US $, beginning with the richest country (World Bank 2012p):
Development of the Poorest of the South, Karin Strömberg 30
Figure 4
Countries in the South
1. Seychelles 72. Paraguay
2. Croatia 73. Tonga
3. Hungary 74. Vanuatu
4. Estonia 75. Samoa
5. Barbados 76. Indonesia
6. Poland 77. Congo, Rep.
7. Russian Federation 78. Honduras
8. St. Kitts and Nevis 79. Mongolia
9. Lithuania 80. Cape Verde
10. Libya 81. Philippines
11. Latvia 82. Iraq
12. Argentina 83. India
13. Gabon 84. Guyana
14. Chile 85. Micronesia, Fed. Sts
15. Turkey 86. Vietnam
16. Romania 87. Uzbekistan
17. Malaysia 88. Moldova
18. Mexico 89. Nicaragua
19. Bulgaria 90. Pakistan
20. Palau 91. Solomon Islands
21. Uruguay 92. Yemen, Rep.
22. Lebanon 93. Kiribati
23. Panama 94. Lao PDR
24. Mauritius 95. Papua New Guinea
25. Botswana 96. Djibouti
26. Montenegro 97. Kyrgyz Rep.
27. Belarus 98. Cameroon
28. Venezuela, RB 99. Nigeria
29. Dominica 100. Sudan
30. Iran, Islamic Rep. 101. Tajikistan
31. Kazakhstan 102. Cambodia
Development of the Poorest of the South, Karin Strömberg 31
32. Costa Rica 103. Senegal
33. Macedonia, FYR 104. Mauritania
34. St. Vincent n. the Gren. 105. Cote d’Ivoire
35. Serbia 106. Sao Tome and Principe
36. Grenada 107. Myanmar
37. St. Lucia 108. Kenya
38. Brazil 109. Benin
39. South Africa 110. Bangladesh
40. Azerbaijan 111. Ghana
41. Tunisia 112. Lesotho
42. Colombia 113. Zambia
43. Peru 114. The Gambia
44. Dominican Republic 115. Tanzania
45. Albania 116. Chad
46. Bosnia and Herzegovina 117. Uganda
47. Algeria 118. Haiti
48. Thailand 119. Burkina Faso
49. Maldives 120. Guinea-Bissau
50. Ecuador 121. Nepal
51. Jamaica 122. Afghanistan
52. Suriname 123. Rwanda
53. Turkmenistan 124. Comoros
54. China 125. Guinea
55. Belize 126. Mali
56. El Salvador 127. Togo
57. Ukraine 128. Madagascar
58. Namibia 129. Ethiopia
59. Angola 130. Mozambique
60. Egypt, Arab Rep. 131. Timor-Leste
61. Jordan 132. Malawi
62. Armenia 133. Sierra Leone
63. Syrian Arab Republic 134. Zimbabwe
64. Swaziland 135. Central African Rep.
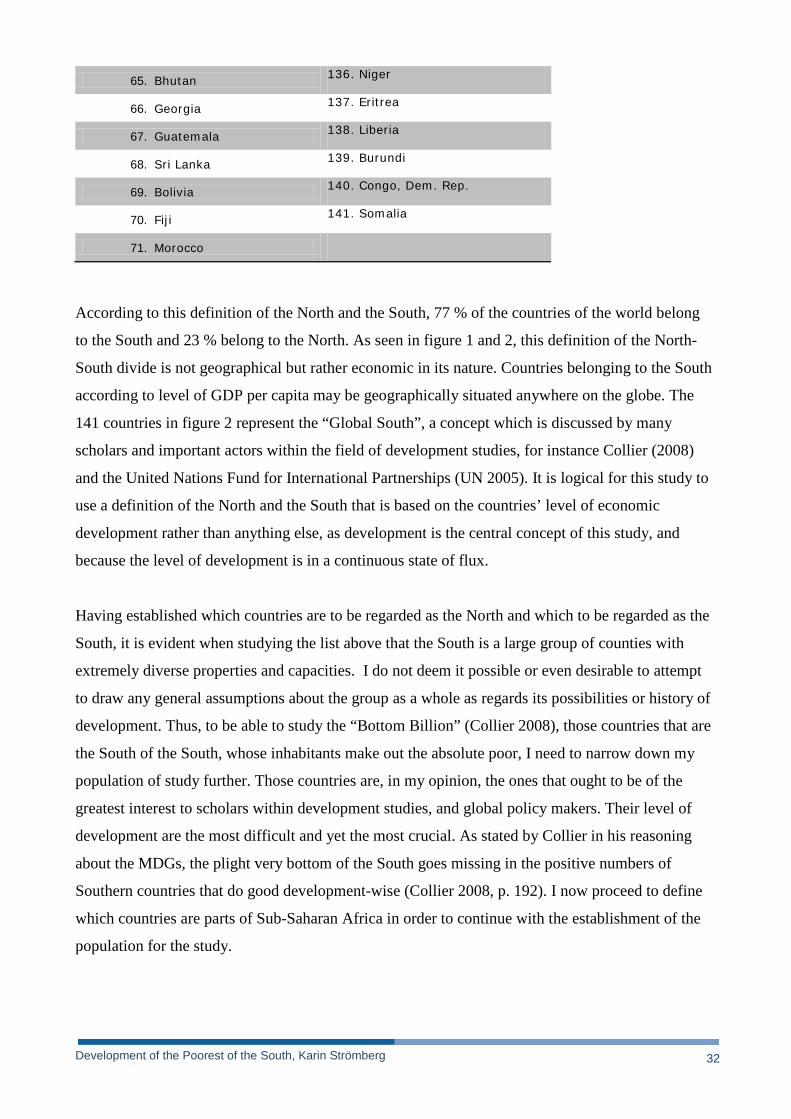
Development of the Poorest of the South, Karin Strömberg 32
65. Bhutan 136. Niger
66. Georgia 137. Eritrea
67. Guatemala 138. Liberia
68. Sri Lanka 139. Burundi
69. Bolivia 140. Congo, Dem. Rep.
70. Fiji 141. Somalia
71. Morocco
According to this definition of the North and the South, 77 % of the countries of the world belong
to the South and 23 % belong to the North. As seen in figure 1 and 2, this definition of the North-
South divide is not geographical but rather economic in its nature. Countries belonging to the South
according to level of GDP per capita may be geographically situated anywhere on the globe. The
141 countries in figure 2 represent the “Global South”, a concept which is discussed by many
scholars and important actors within the field of development studies, for instance Collier (2008)
and the United Nations Fund for International Partnerships (UN 2005). It is logical for this study to
use a definition of the North and the South that is based on the countries’ level of economic
development rather than anything else, as development is the central concept of this study, and
because the level of development is in a continuous state of flux.
Having established which countries are to be regarded as the North and which to be regarded as the
South, it is evident when studying the list above that the South is a large group of counties with
extremely diverse properties and capacities. I do not deem it possible or even desirable to attempt
to draw any general assumptions about the group as a whole as regards its possibilities or history of
development. Thus, to be able to study the “Bottom Billion” (Collier 2008), those countries that are
the South of the South, whose inhabitants make out the absolute poor, I need to narrow down my
population of study further. Those countries are, in my opinion, the ones that ought to be of the
greatest interest to scholars within development studies, and global policy makers. Their level of
development are the most difficult and yet the most crucial. As stated by Collier in his reasoning
about the MDGs, the plight very bottom of the South goes missing in the positive numbers of
Southern countries that do good development-wise (Collier 2008, p. 192). I now proceed to define
which countries are parts of Sub-Saharan Africa in order to continue with the establishment of the
population for the study.
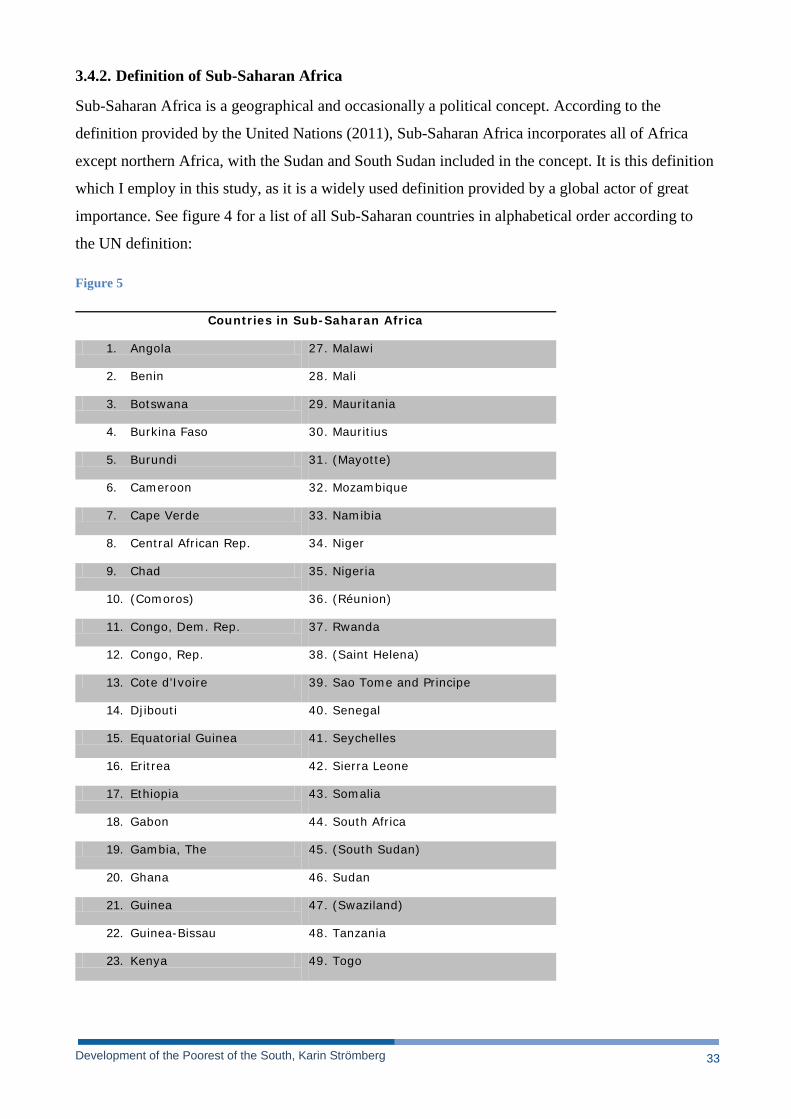
Development of the Poorest of the South, Karin Strömberg 33
3.4.2. Definition of Sub-Saharan Africa
Sub-Saharan Africa is a geographical and occasionally a political concept. According to the
definition provided by the United Nations (2011), Sub-Saharan Africa incorporates all of Africa
except northern Africa, with the Sudan and South Sudan included in the concept. It is this definition
which I employ in this study, as it is a widely used definition provided by a global actor of great
importance. See figure 4 for a list of all Sub-Saharan countries in alphabetical order according to
the UN definition:
Figure 5
Countries in Sub-Saharan Africa
1. Angola 27. Malawi
2. Benin 28. Mali
3. Botswana 29. Mauritania
4. Burkina Faso 30. Mauritius
5. Burundi 31. (Mayotte)
6. Cameroon 32. Mozambique
7. Cape Verde 33. Namibia
8. Central African Rep. 34. Niger
9. Chad 35. Nigeria
10. (Comoros) 36. (Réunion)
11. Congo, Dem. Rep. 37. Rwanda
12. Congo, Rep. 38. (Saint Helena)
13. Cote d’Ivoire 39. Sao Tome and Principe
14. Djibouti 40. Senegal
15. Equatorial Guinea 41. Seychelles
16. Eritrea 42. Sierra Leone
17. Ethiopia 43. Somalia
18. Gabon 44. South Africa
19. Gambia, The 45. (South Sudan)
20. Ghana 46. Sudan
21. Guinea 47. (Swaziland)
22. Guinea-Bissau 48. Tanzania
23. Kenya 49. Togo
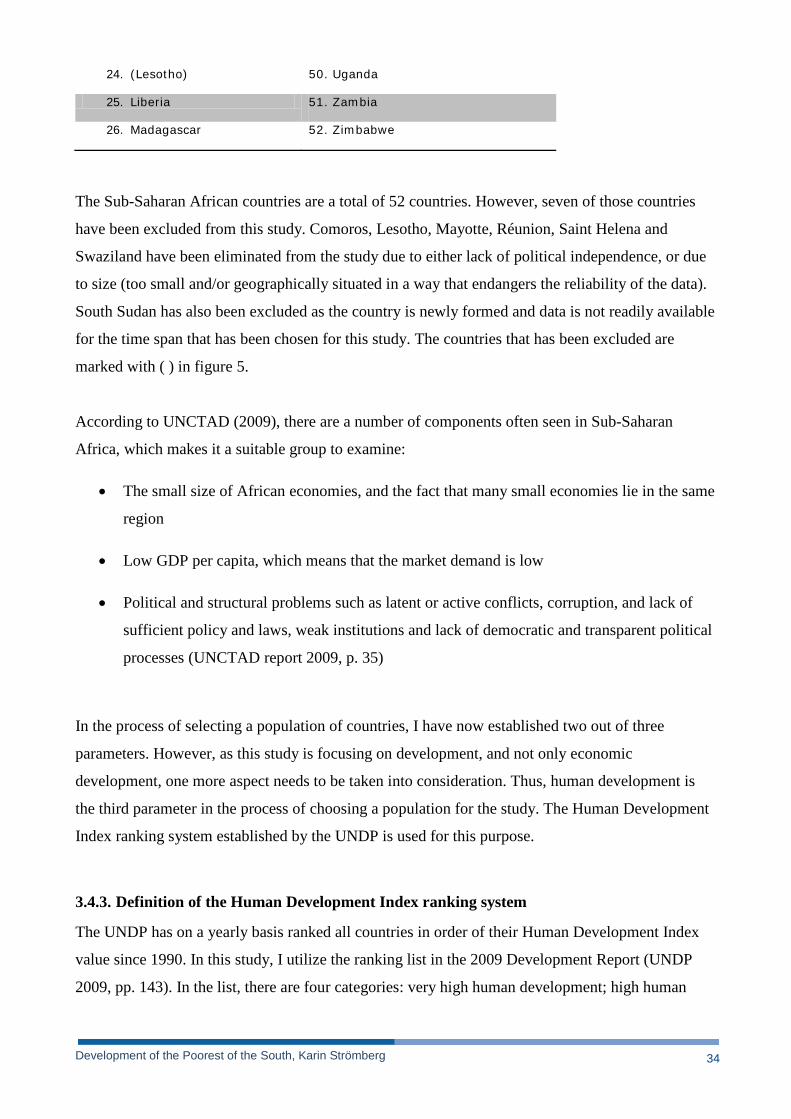
Development of the Poorest of the South, Karin Strömberg 34
24. (Lesotho) 50. Uganda
25. Liberia 51. Zambia
26. Madagascar 52. Zimbabwe
The Sub-Saharan African countries are a total of 52 countries. However, seven of those countries
have been excluded from this study. Comoros, Lesotho, Mayotte, Réunion, Saint Helena and
Swaziland have been eliminated from the study due to either lack of political independence, or due
to size (too small and/or geographically situated in a way that endangers the reliability of the data).
South Sudan has also been excluded as the country is newly formed and data is not readily available
for the time span that has been chosen for this study. The countries that has been excluded are
marked with ( ) in figure 5.
According to UNCTAD (2009), there are a number of components often seen in Sub-Saharan
Africa, which makes it a suitable group to examine:
• The small size of African economies, and the fact that many small economies lie in the same
region
• Low GDP per capita, which means that the market demand is low
• Political and structural problems such as latent or active conflicts, corruption, and lack of
sufficient policy and laws, weak institutions and lack of democratic and transparent political
processes (UNCTAD report 2009, p. 35)
In the process of selecting a population of countries, I have now established two out of three
parameters. However, as this study is focusing on development, and not only economic
development, one more aspect needs to be taken into consideration. Thus, human development is
the third parameter in the process of choosing a population for the study. The Human Development
Index ranking system established by the UNDP is used for this purpose.
3.4.3. Definition of the Human Development Index ranking system
The UNDP has on a yearly basis ranked all countries in order of their Human Development Index
value since 1990. In this study, I utilize the ranking list in the 2009 Development Report (UNDP
2009, pp. 143). In the list, there are four categories: very high human development; high human
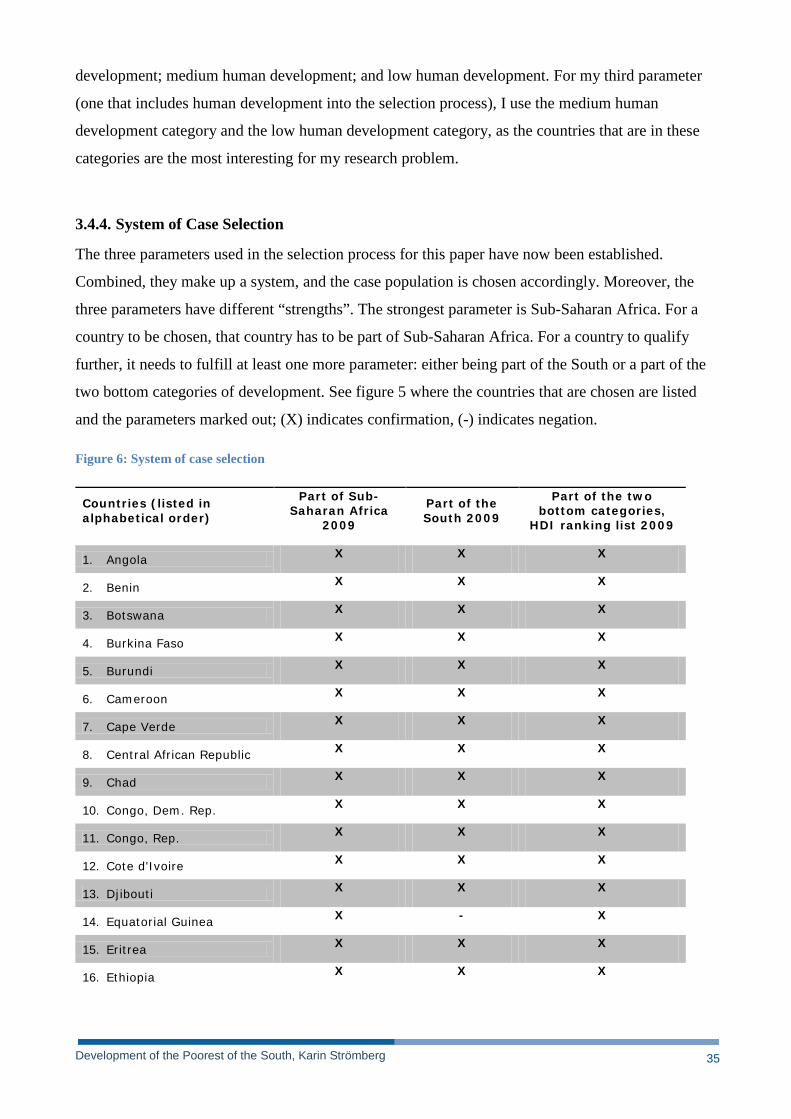
Development of the Poorest of the South, Karin Strömberg 35
development; medium human development; and low human development. For my third parameter
(one that includes human development into the selection process), I use the medium human
development category and the low human development category, as the countries that are in these
categories are the most interesting for my research problem.
3.4.4. System of Case Selection
The three parameters used in the selection process for this paper have now been established.
Combined, they make up a system, and the case population is chosen accordingly. Moreover, the
three parameters have different “strengths”. The strongest parameter is Sub-Saharan Africa. For a
country to be chosen, that country has to be part of Sub-Saharan Africa. For a country to qualify
further, it needs to fulfill at least one more parameter: either being part of the South or a part of the
two bottom categories of development. See figure 5 where the countries that are chosen are listed
and the parameters marked out; (X) indicates confirmation, (-) indicates negation.
Figure 6: System of case selection
Countries (listed in alphabetical order)
Part of Sub-Saharan Africa
2009
Part of the South 2009
Part of the two bottom categories,
HDI ranking list 2009
1. Angola X X X
2. Benin X X X
3. Botswana X X X
4. Burkina Faso X X X
5. Burundi X X X
6. Cameroon X X X
7. Cape Verde X X X
8. Central African Republic X X X
9. Chad X X X
10. Congo, Dem. Rep. X X X
11. Congo, Rep. X X X
12. Cote d'Ivoire X X X
13. Djibouti X X X
14. Equatorial Guinea X - X
15. Eritrea X X X
16. Ethiopia X X X
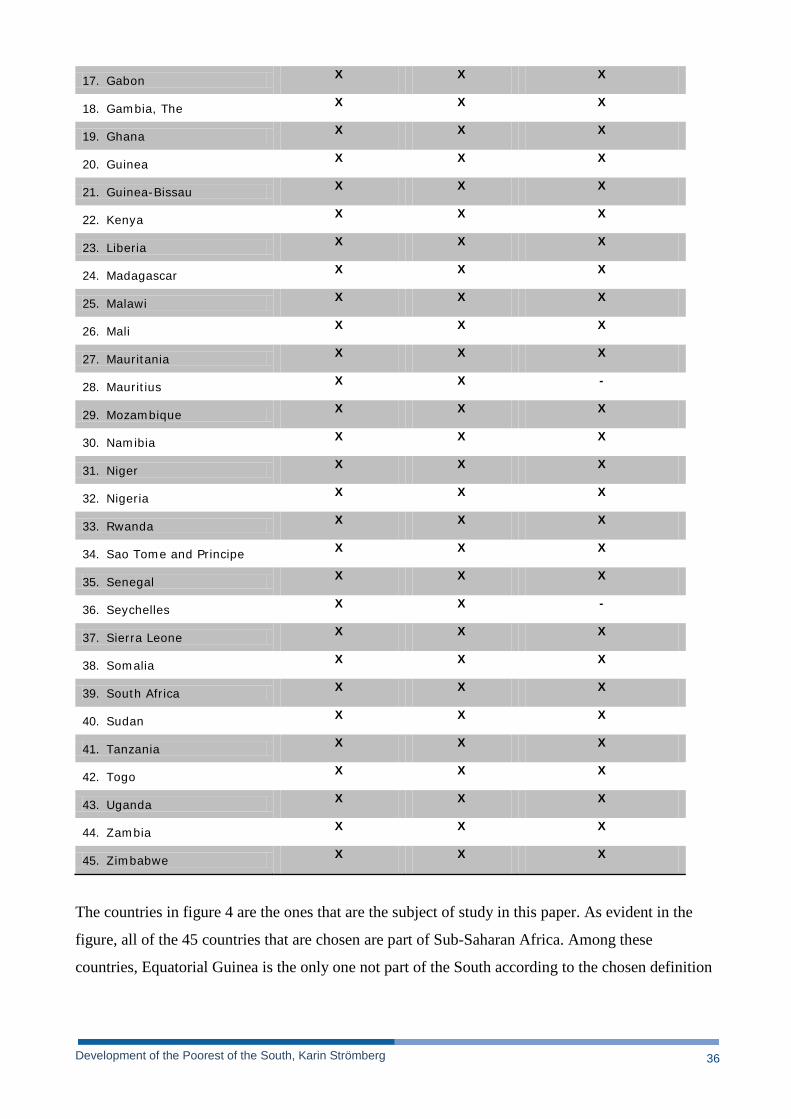
Development of the Poorest of the South, Karin Strömberg 36
17. Gabon X X X
18. Gambia, The X X X
19. Ghana X X X
20. Guinea X X X
21. Guinea-Bissau X X X
22. Kenya X X X
23. Liberia X X X
24. Madagascar X X X
25. Malawi X X X
26. Mali X X X
27. Mauritania X X X
28. Mauritius X X -
29. Mozambique X X X
30. Namibia X X X
31. Niger X X X
32. Nigeria X X X
33. Rwanda X X X
34. Sao Tome and Principe X X X
35. Senegal X X X
36. Seychelles X X -
37. Sierra Leone X X X
38. Somalia X X X
39. South Africa X X X
40. Sudan X X X
41. Tanzania X X X
42. Togo X X X
43. Uganda X X X
44. Zambia X X X
45. Zimbabwe X X X
The countries in figure 4 are the ones that are the subject of study in this paper. As evident in the
figure, all of the 45 countries that are chosen are part of Sub-Saharan Africa. Among these
countries, Equatorial Guinea is the only one not part of the South according to the chosen definition
Development of the Poorest of the South, Karin Strömberg 37
due to its considerably higher income per capita than its neighboring countries. Furthermore, the
Seychelles and Mauritius do not belong to the two bottom categories of the HDI ranking list. There
are thus three cases that derive from the typical conditions within Sub-Saharan Africa.
3.5. Data Analysis
I have now established the 45 cases that will be make up the material for the study. The data that I
gather from the World Bank and UNDP will be analyzed with the help of the statistics software
PASW Statistics 18. I use the software to conduct a specific statistical test: regressions and more
specifically curve estimations. I will thus examine the statistical correlation between two variables
and make graphs that show the estimated curve. The value of the correlation is presented in the unit
r². For example, if the correlation between the independent variable and the dependent variable in a
regression is r²: 0,5, it means in theory that these variables correlate to a degree of 50 %.
For my own sake as the conductor of the study as well as for the reader, it is helpful to see a visual
image of the results, as it can be difficult to see the differences between regressions when one only
has a value to take into account. I include graphs which will help to visualize the results and
facilitate the understanding of the results. The results from the regressions and the graphs will be
presented in chapter 5 and then later discussed and analyzed in chapter 6. It is in this chapter that I
discuss if the research questions were appropriate answered and I will also discuss the implications
of my result. I will compare the result to the literature presented in chapter 2, and also discuss how
the result fits into the theoretical background that I have previously outlined.
3.5.1. Limitations of the Data
Besides the general limitations of this study which is presented in the introduction, another
limitation that may affect the outcome is the theoretical position of my major source of data. The
World Bank is an institution with thoroughly liberal values, which naturally reflect on the type of
data they collect, and the direction in the formation of their variables. They move within a particular
ideological framework, and the data they collect is naturally affected by that framework. I imagine
that problems arise when one attempts to study conditions from another theoretical point of
departure whilst still using data from the World Bank to do so.
Development of the Poorest of the South, Karin Strömberg 38
3.6. Anticipated Ethical Issues
Ethical issues are important to have in mind when one is conducting a study where the data is
collected from for instance surveys or interviews (Creswell 2009, p. 89 ff.). Due to the nature of this
study and the research questions that I have posed, I have a macro perspective rather than
discussing the actions of individual; consequently, I meet no major ethical issues that I need to be
aware of. As I use data that has already been collected by other recognized bodies, I do not need to
take measures to protect the integrity of the people that are studied. It goes without saying that I
make every effort to avoid using biased language throughout the report.
3.7. Evaluation of Sources
The data and literature used in this paper are reliable and from well-renowned sources. The data for
the regressions are all, as stated before, collected from the World Bank database and from the
UNDP database. The literature is a mixture between books and published articles as well as official
reports.
Development of the Poorest of the South, Karin Strömberg 39
4. RESULTS
In this chapter, the results from the regressions are presented. Throughout the presentation of the
results, HDI value is the dependent variable and the independent variables varies. The purpose of
the regressions is to investigate the co-variation between development and various variables that
measure aspects of trade to, from and within Sub-Saharan Africa. As stated in the methodology, the
time span will be 19 years; 1990 (when UNDP launched the HDI) and 2009, which is the most
recent year that at the same time has the most complete data. The research questions will be
answered one by one with the help of the regressions.
As mentioned before in the chapter on methodology, I will be using the term “co-variation” to
describe the statistical connection between two variables. With co-variation, or level of co-
variation, I mean the statistical connection that is possible to see when comparing two variables in a
regression. Whether or not there is an actual co-variation is more difficult to establish, especially
within a quantitative study. As stated by Creswell (2009), when using statistics, one can hope to
show tendencies, trends, indications, and such. I hope to be able to see a general picture of the co-
variation between human development in 1990 and various other variables in 2009. However, to
explore the underlying mechanisms and reasons for a specific quantitative co-variation, in-depth
studies of a qualitative nature, and a detailed review of the available data is necessary. Given that I
am aware of the limitations of the data that is used in this study and the possible criticisms that may
be leveled to my including/excluding certain countries or certain years, I base my findings on
statistical regressions calculated in this paper. As such, I use the term co-variation defined as being
one thing causing another but am, nevertheless, aware that this may not be the case beyond the
scope of this study.
4.1. Question 1: Co-variation between interregional trade and human development in sub-
Saharan Africa
Starting with the first research question: looking at Sub-Saharan Africa, is it possible to show
statistically that a specific type of South-South trade; interregional trade, has a higher level of co-
variation with human development than trade in general?
Co-variation Between Trade in General and Human Development in Sub-Saharan Africa
To answer the question, it is necessary to first establish the co-variation between trade in general
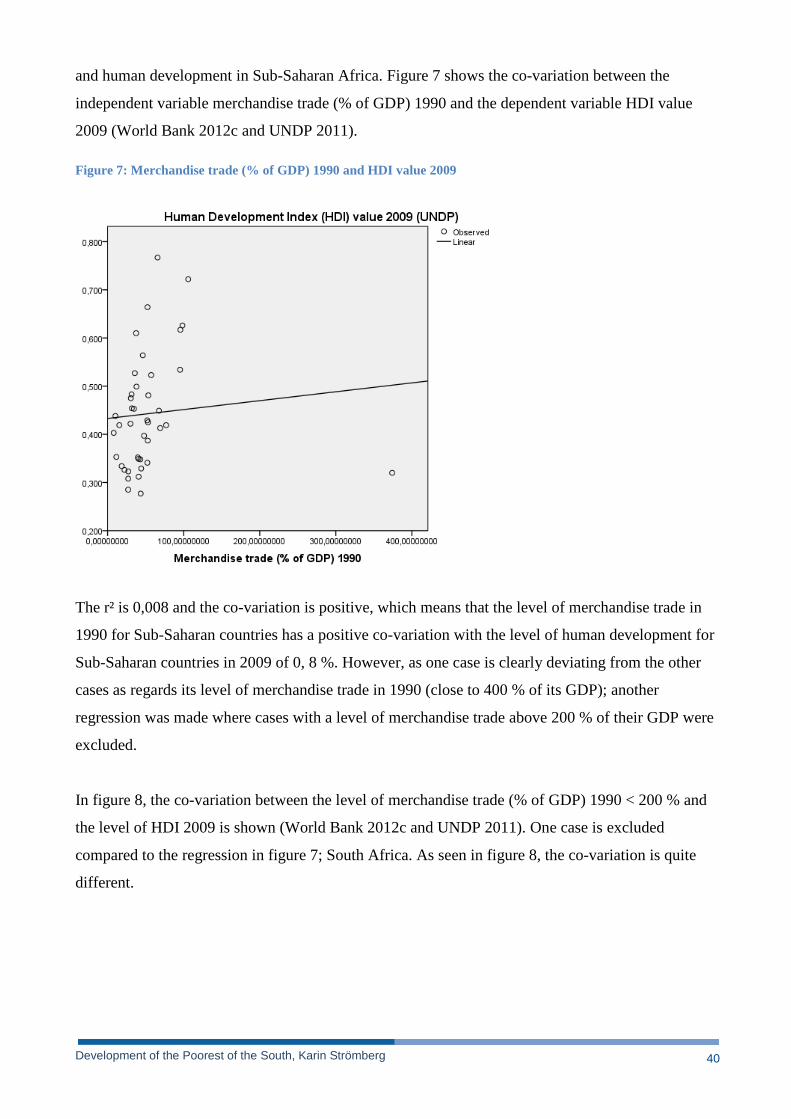
Development of the Poorest of the South, Karin Strömberg 40
and human development in Sub-Saharan Africa. Figure 7 shows the co-variation between the
independent variable merchandise trade (% of GDP) 1990 and the dependent variable HDI value
2009 (World Bank 2012c and UNDP 2011).
Figure 7: Merchandise trade (% of GDP) 1990 and HDI value 2009
The r² is 0,008 and the co-variation is positive, which means that the level of merchandise trade in
1990 for Sub-Saharan countries has a positive co-variation with the level of human development for
Sub-Saharan countries in 2009 of 0, 8 %. However, as one case is clearly deviating from the other
cases as regards its level of merchandise trade in 1990 (close to 400 % of its GDP); another
regression was made where cases with a level of merchandise trade above 200 % of their GDP were
excluded.
In figure 8, the co-variation between the level of merchandise trade (% of GDP) 1990 < 200 % and
the level of HDI 2009 is shown (World Bank 2012c and UNDP 2011). One case is excluded
compared to the regression in figure 7; South Africa. As seen in figure 8, the co-variation is quite
different.
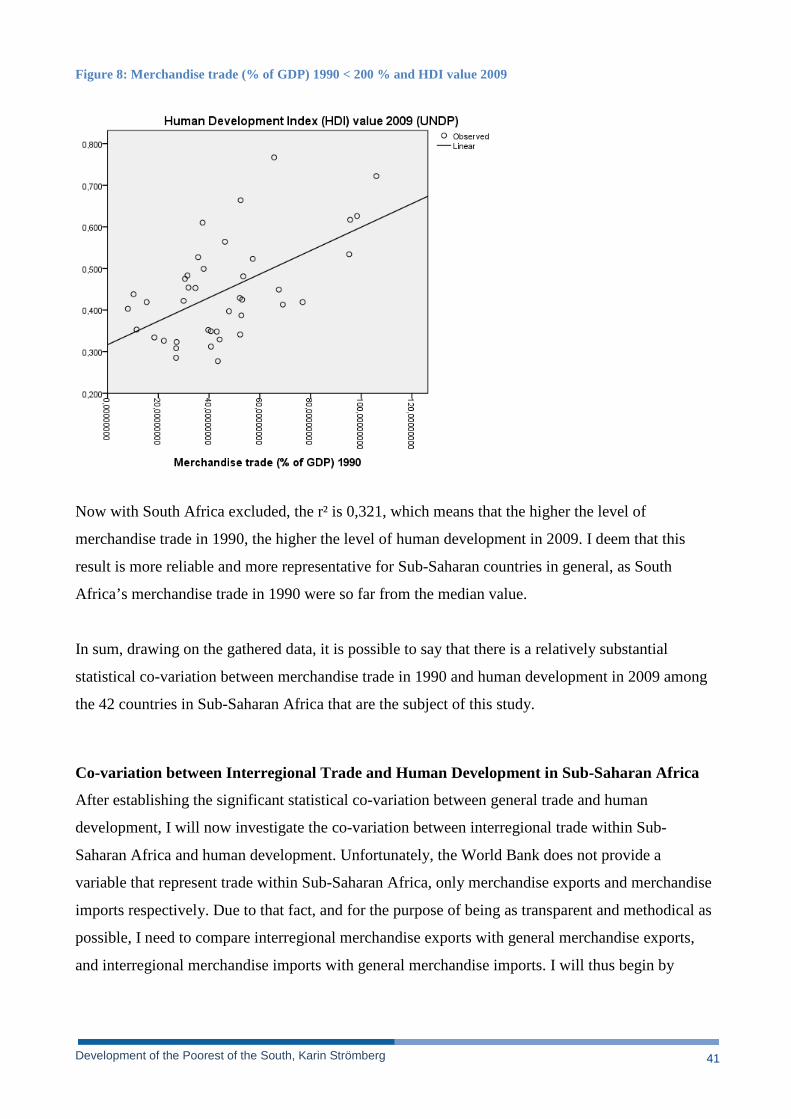
Development of the Poorest of the South, Karin Strömberg 41
Figure 8: Merchandise trade (% of GDP) 1990 < 200 % and HDI value 2009
Now with South Africa excluded, the r² is 0,321, which means that the higher the level of
merchandise trade in 1990, the higher the level of human development in 2009. I deem that this
result is more reliable and more representative for Sub-Saharan countries in general, as South
Africa’s merchandise trade in 1990 were so far from the median value.
In sum, drawing on the gathered data, it is possible to say that there is a relatively substantial
statistical co-variation between merchandise trade in 1990 and human development in 2009 among
the 42 countries in Sub-Saharan Africa that are the subject of this study.
Co-variation between Interregional Trade and Human Development in Sub-Saharan Africa
After establishing the significant statistical co-variation between general trade and human
development, I will now investigate the co-variation between interregional trade within Sub-
Saharan Africa and human development. Unfortunately, the World Bank does not provide a
variable that represent trade within Sub-Saharan Africa, only merchandise exports and merchandise
imports respectively. Due to that fact, and for the purpose of being as transparent and methodical as
possible, I need to compare interregional merchandise exports with general merchandise exports,
and interregional merchandise imports with general merchandise imports. I will thus begin by
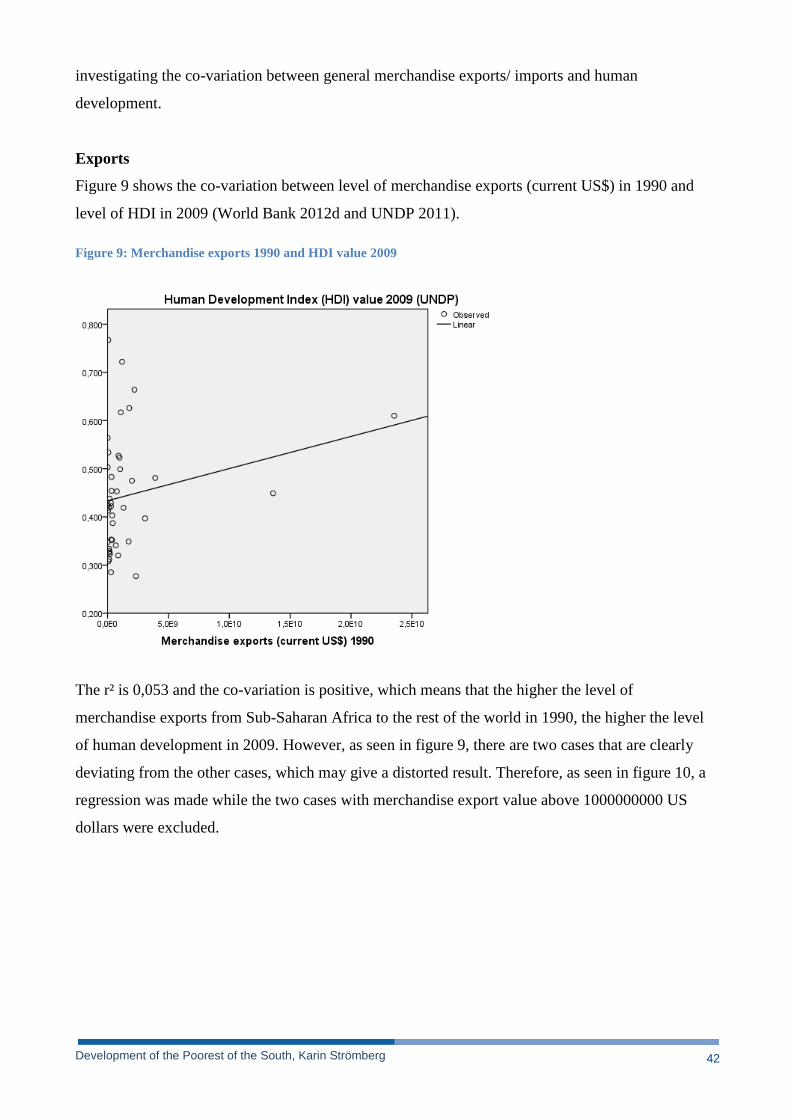
Development of the Poorest of the South, Karin Strömberg 42
investigating the co-variation between general merchandise exports/ imports and human
development.
Exports
Figure 9 shows the co-variation between level of merchandise exports (current US$) in 1990 and
level of HDI in 2009 (World Bank 2012d and UNDP 2011).
Figure 9: Merchandise exports 1990 and HDI value 2009
The r² is 0,053 and the co-variation is positive, which means that the higher the level of
merchandise exports from Sub-Saharan Africa to the rest of the world in 1990, the higher the level
of human development in 2009. However, as seen in figure 9, there are two cases that are clearly
deviating from the other cases, which may give a distorted result. Therefore, as seen in figure 10, a
regression was made while the two cases with merchandise export value above 1000000000 US
dollars were excluded.
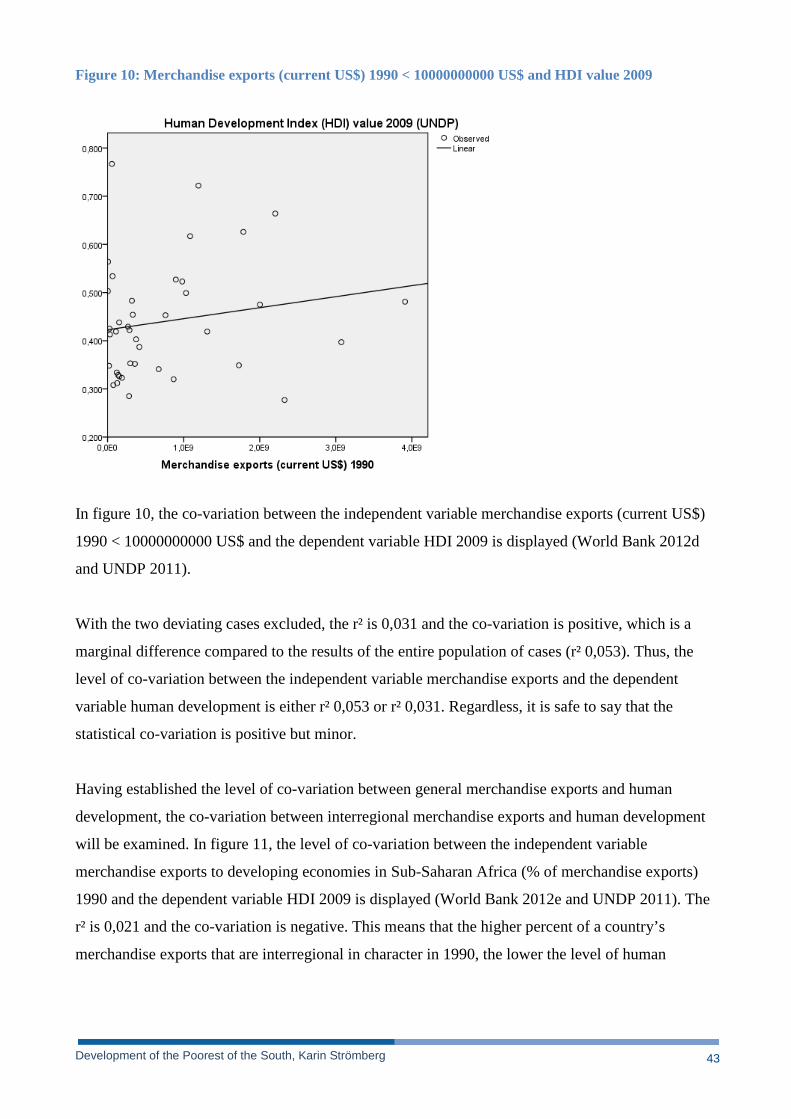
Development of the Poorest of the South, Karin Strömberg 43
Figure 10: Merchandise exports (current US$) 1990 < 10000000000 US$ and HDI value 2009
In figure 10, the co-variation between the independent variable merchandise exports (current US$)
1990 < 10000000000 US$ and the dependent variable HDI 2009 is displayed (World Bank 2012d
and UNDP 2011).
With the two deviating cases excluded, the r² is 0,031 and the co-variation is positive, which is a
marginal difference compared to the results of the entire population of cases (r² 0,053). Thus, the
level of co-variation between the independent variable merchandise exports and the dependent
variable human development is either r² 0,053 or r² 0,031. Regardless, it is safe to say that the
statistical co-variation is positive but minor.
Having established the level of co-variation between general merchandise exports and human
development, the co-variation between interregional merchandise exports and human development
will be examined. In figure 11, the level of co-variation between the independent variable
merchandise exports to developing economies in Sub-Saharan Africa (% of merchandise exports)
1990 and the dependent variable HDI 2009 is displayed (World Bank 2012e and UNDP 2011). The
r² is 0,021 and the co-variation is negative. This means that the higher percent of a country’s
merchandise exports that are interregional in character in 1990, the lower the level of human
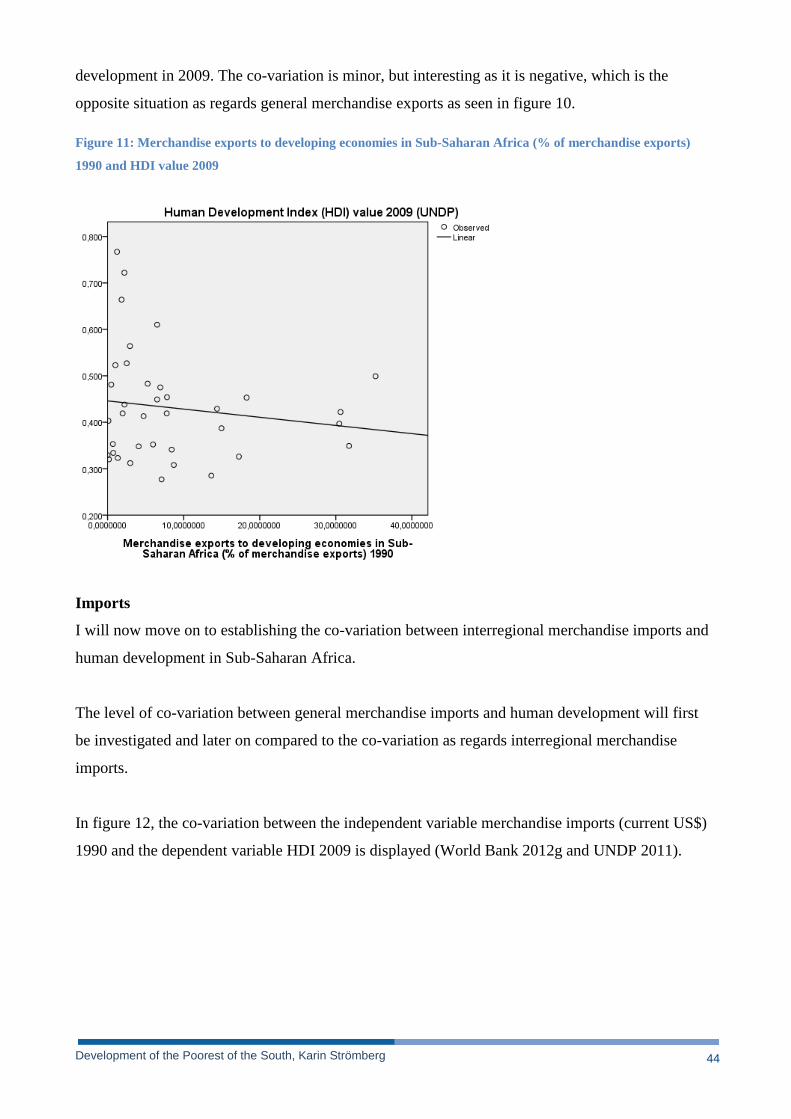
Development of the Poorest of the South, Karin Strömberg 44
development in 2009. The co-variation is minor, but interesting as it is negative, which is the
opposite situation as regards general merchandise exports as seen in figure 10.
Figure 11: Merchandise exports to developing economies in Sub-Saharan Africa (% of merchandise exports)
1990 and HDI value 2009
Imports
I will now move on to establishing the co-variation between interregional merchandise imports and
human development in Sub-Saharan Africa.
The level of co-variation between general merchandise imports and human development will first
be investigated and later on compared to the co-variation as regards interregional merchandise
imports.
In figure 12, the co-variation between the independent variable merchandise imports (current US$)
1990 and the dependent variable HDI 2009 is displayed (World Bank 2012g and UNDP 2011).
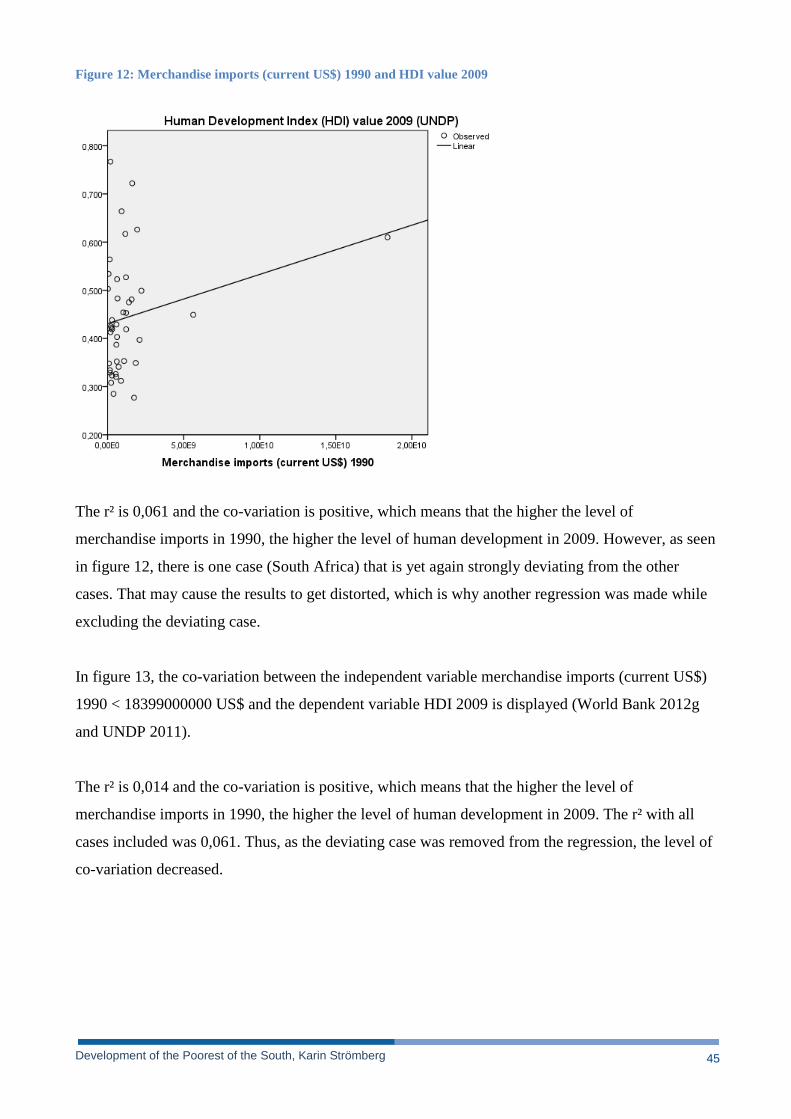
Development of the Poorest of the South, Karin Strömberg 45
Figure 12: Merchandise imports (current US$) 1990 and HDI value 2009
The r² is 0,061 and the co-variation is positive, which means that the higher the level of
merchandise imports in 1990, the higher the level of human development in 2009. However, as seen
in figure 12, there is one case (South Africa) that is yet again strongly deviating from the other
cases. That may cause the results to get distorted, which is why another regression was made while
excluding the deviating case.
In figure 13, the co-variation between the independent variable merchandise imports (current US$)
1990 < 18399000000 US$ and the dependent variable HDI 2009 is displayed (World Bank 2012g
and UNDP 2011).
The r² is 0,014 and the co-variation is positive, which means that the higher the level of
merchandise imports in 1990, the higher the level of human development in 2009. The r² with all
cases included was 0,061. Thus, as the deviating case was removed from the regression, the level of
co-variation decreased.
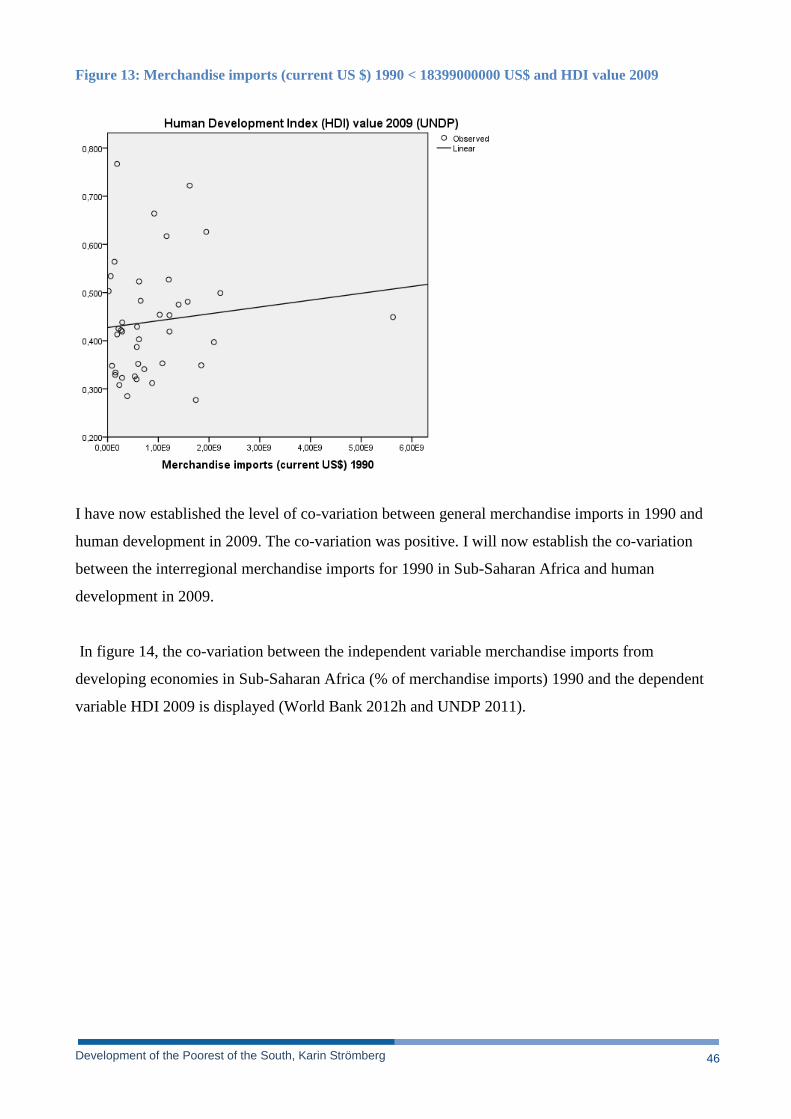
Development of the Poorest of the South, Karin Strömberg 46
Figure 13: Merchandise imports (current US $) 1990 < 18399000000 US$ and HDI value 2009
I have now established the level of co-variation between general merchandise imports in 1990 and
human development in 2009. The co-variation was positive. I will now establish the co-variation
between the interregional merchandise imports for 1990 in Sub-Saharan Africa and human
development in 2009.
In figure 14, the co-variation between the independent variable merchandise imports from
developing economies in Sub-Saharan Africa (% of merchandise imports) 1990 and the dependent
variable HDI 2009 is displayed (World Bank 2012h and UNDP 2011).
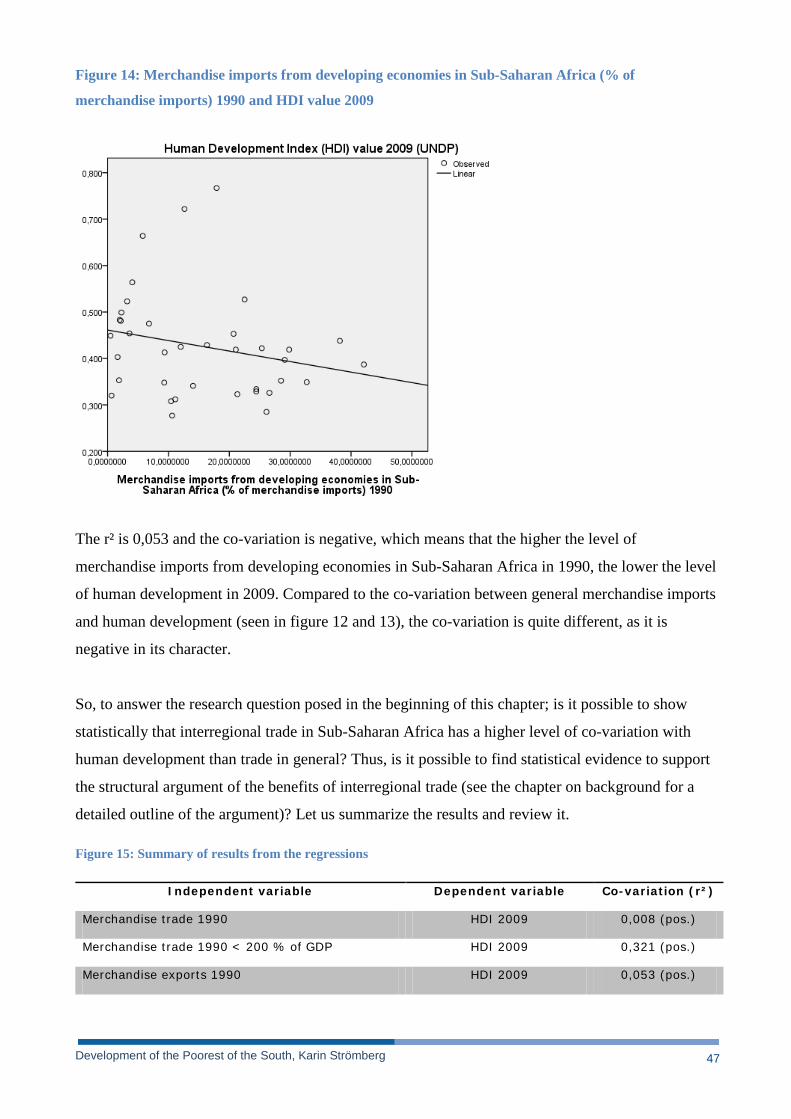
Development of the Poorest of the South, Karin Strömberg 47
Figure 14: Merchandise imports from developing economies in Sub-Saharan Africa (% of
merchandise imports) 1990 and HDI value 2009
The r² is 0,053 and the co-variation is negative, which means that the higher the level of
merchandise imports from developing economies in Sub-Saharan Africa in 1990, the lower the level
of human development in 2009. Compared to the co-variation between general merchandise imports
and human development (seen in figure 12 and 13), the co-variation is quite different, as it is
negative in its character.
So, to answer the research question posed in the beginning of this chapter; is it possible to show
statistically that interregional trade in Sub-Saharan Africa has a higher level of co-variation with
human development than trade in general? Thus, is it possible to find statistical evidence to support
the structural argument of the benefits of interregional trade (see the chapter on background for a
detailed outline of the argument)? Let us summarize the results and review it.
Figure 15: Summary of results from the regressions
Independent variable Dependent variable Co-variation (r²)
Merchandise trade 1990 HDI 2009 0,008 (pos.)
Merchandise trade 1990 < 200 % of GDP HDI 2009 0,321 (pos.)
Merchandise exports 1990 HDI 2009 0,053 (pos.)
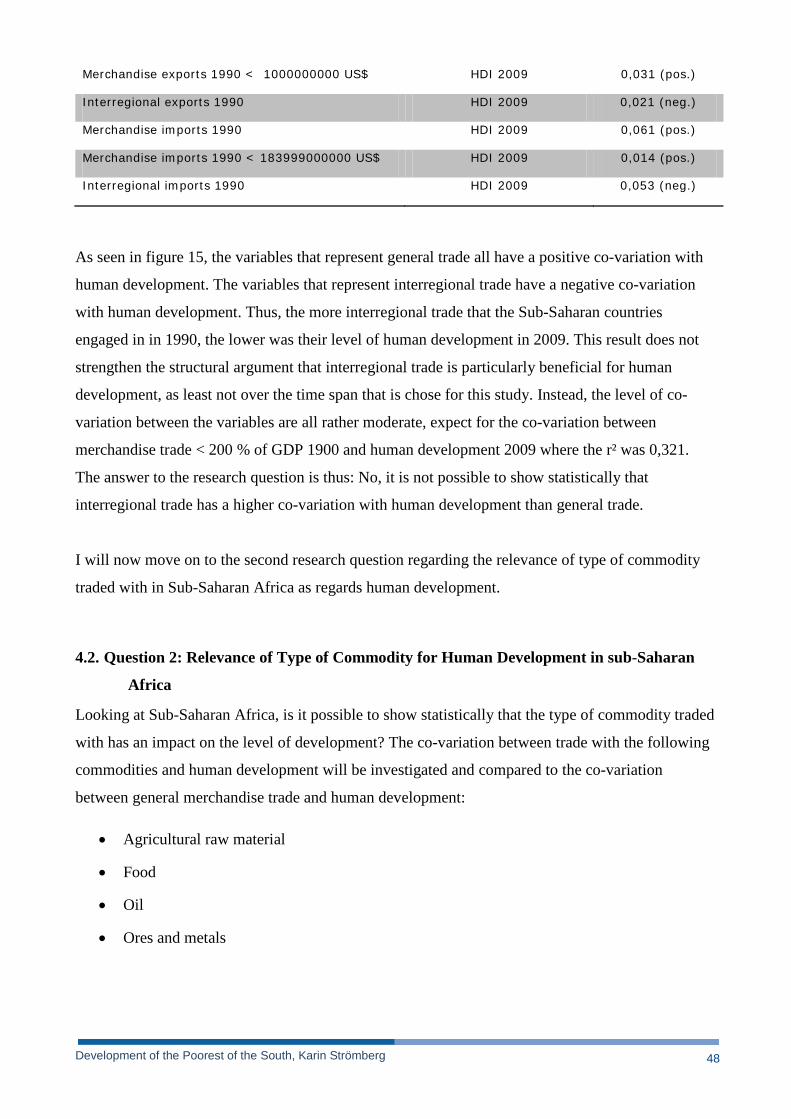
Development of the Poorest of the South, Karin Strömberg 48
Merchandise exports 1990 < 1000000000 US$ HDI 2009 0,031 (pos.)
Interregional exports 1990 HDI 2009 0,021 (neg.)
Merchandise imports 1990 HDI 2009 0,061 (pos.)
Merchandise imports 1990 < 183999000000 US$ HDI 2009 0,014 (pos.)
Interregional imports 1990 HDI 2009 0,053 (neg.)
As seen in figure 15, the variables that represent general trade all have a positive co-variation with
human development. The variables that represent interregional trade have a negative co-variation
with human development. Thus, the more interregional trade that the Sub-Saharan countries
engaged in in 1990, the lower was their level of human development in 2009. This result does not
strengthen the structural argument that interregional trade is particularly beneficial for human
development, as least not over the time span that is chose for this study. Instead, the level of co-
variation between the variables are all rather moderate, expect for the co-variation between
merchandise trade < 200 % of GDP 1900 and human development 2009 where the r² was 0,321.
The answer to the research question is thus: No, it is not possible to show statistically that
interregional trade has a higher co-variation with human development than general trade.
I will now move on to the second research question regarding the relevance of type of commodity
traded with in Sub-Saharan Africa as regards human development.
4.2. Question 2: Relevance of Type of Commodity for Human Development in sub-Saharan
Africa
Looking at Sub-Saharan Africa, is it possible to show statistically that the type of commodity traded
with has an impact on the level of development? The co-variation between trade with the following
commodities and human development will be investigated and compared to the co-variation
between general merchandise trade and human development:
• Agricultural raw material
• Food
• Oil
• Ores and metals
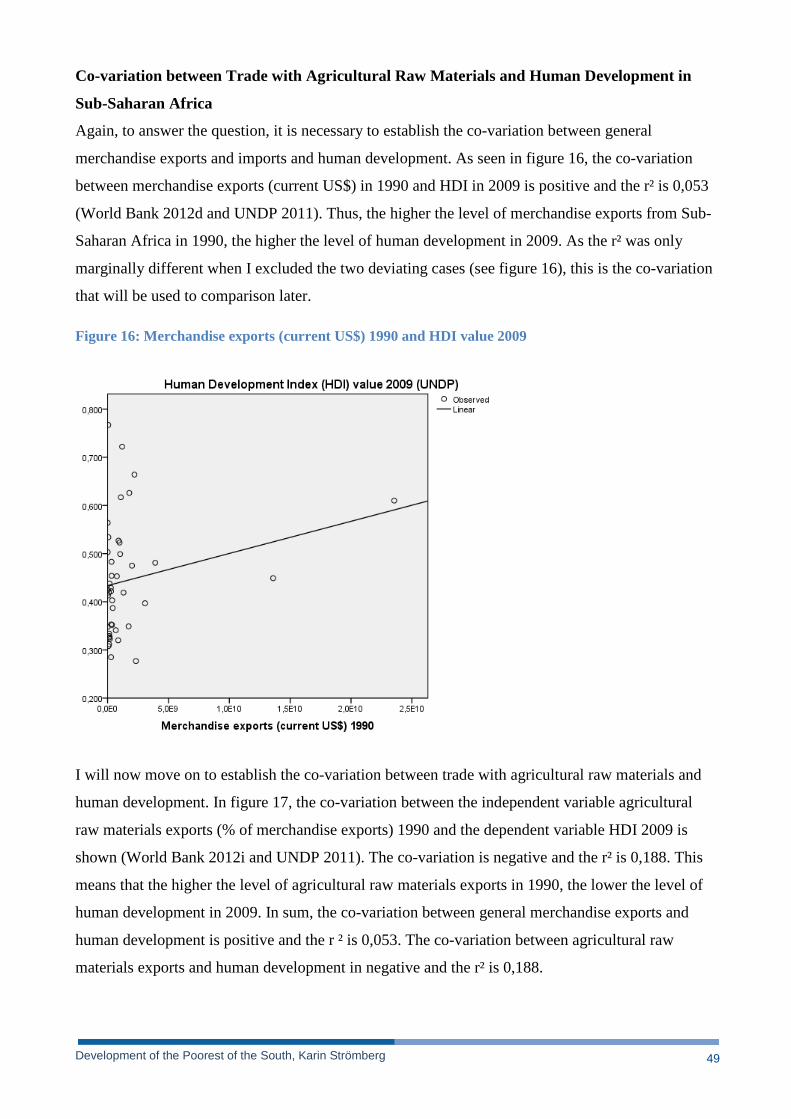
Development of the Poorest of the South, Karin Strömberg 49
Co-variation between Trade with Agricultural Raw Materials and Human Development in
Sub-Saharan Africa
Again, to answer the question, it is necessary to establish the co-variation between general
merchandise exports and imports and human development. As seen in figure 16, the co-variation
between merchandise exports (current US$) in 1990 and HDI in 2009 is positive and the r² is 0,053
(World Bank 2012d and UNDP 2011). Thus, the higher the level of merchandise exports from Sub-
Saharan Africa in 1990, the higher the level of human development in 2009. As the r² was only
marginally different when I excluded the two deviating cases (see figure 16), this is the co-variation
that will be used to comparison later.
Figure 16: Merchandise exports (current US$) 1990 and HDI value 2009
I will now move on to establish the co-variation between trade with agricultural raw materials and
human development. In figure 17, the co-variation between the independent variable agricultural
raw materials exports (% of merchandise exports) 1990 and the dependent variable HDI 2009 is
shown (World Bank 2012i and UNDP 2011). The co-variation is negative and the r² is 0,188. This
means that the higher the level of agricultural raw materials exports in 1990, the lower the level of
human development in 2009. In sum, the co-variation between general merchandise exports and
human development is positive and the r ² is 0,053. The co-variation between agricultural raw
materials exports and human development in negative and the r² is 0,188.
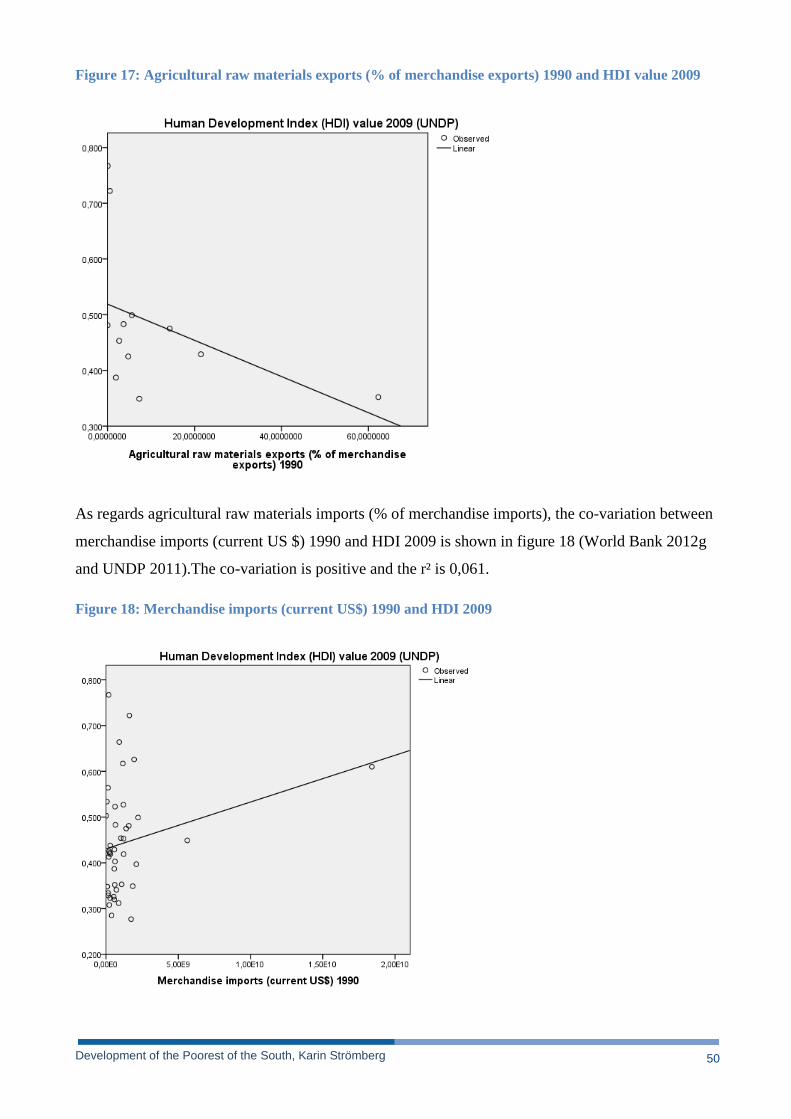
Development of the Poorest of the South, Karin Strömberg 50
Figure 17: Agricultural raw materials exports (% of merchandise exports) 1990 and HDI value 2009
As regards agricultural raw materials imports (% of merchandise imports), the co-variation between
merchandise imports (current US $) 1990 and HDI 2009 is shown in figure 18 (World Bank 2012g
and UNDP 2011).The co-variation is positive and the r² is 0,061.
Figure 18: Merchandise imports (current US$) 1990 and HDI 2009
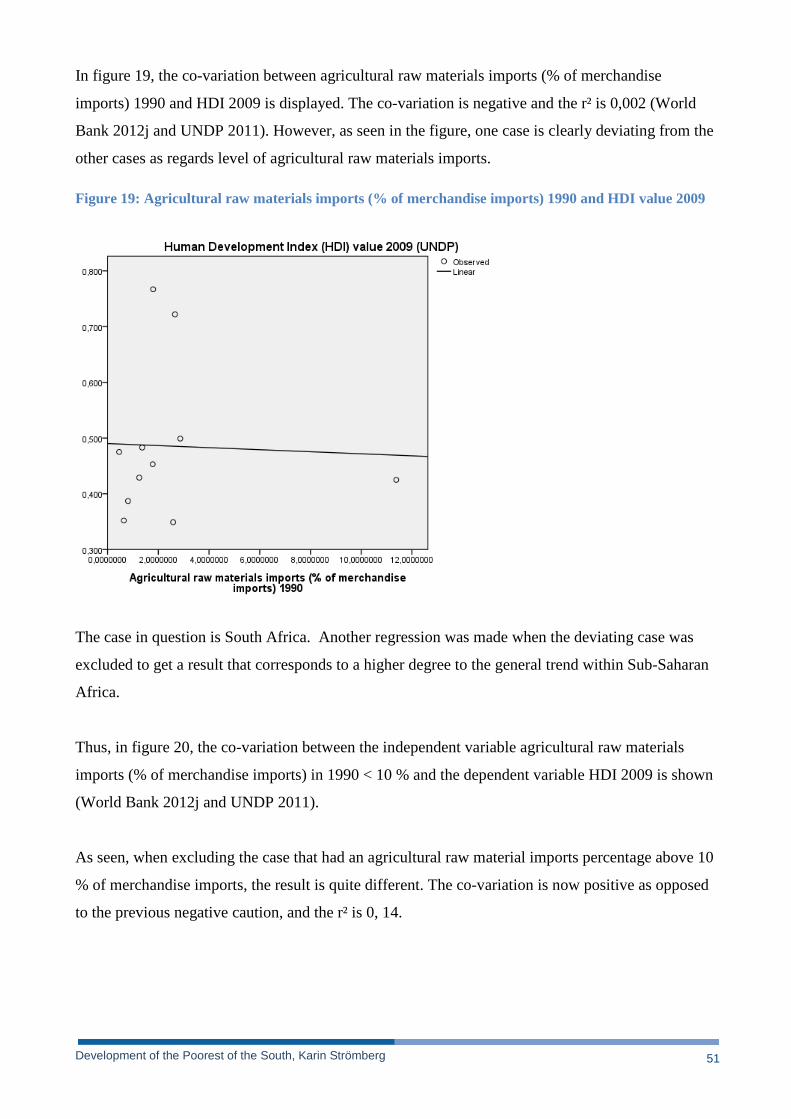
Development of the Poorest of the South, Karin Strömberg 51
In figure 19, the co-variation between agricultural raw materials imports (% of merchandise
imports) 1990 and HDI 2009 is displayed. The co-variation is negative and the r² is 0,002 (World
Bank 2012j and UNDP 2011). However, as seen in the figure, one case is clearly deviating from the
other cases as regards level of agricultural raw materials imports.
Figure 19: Agricultural raw materials imports (% of merchandise imports) 1990 and HDI value 2009
The case in question is South Africa. Another regression was made when the deviating case was
excluded to get a result that corresponds to a higher degree to the general trend within Sub-Saharan
Africa.
Thus, in figure 20, the co-variation between the independent variable agricultural raw materials
imports (% of merchandise imports) in 1990 < 10 % and the dependent variable HDI 2009 is shown
(World Bank 2012j and UNDP 2011).
As seen, when excluding the case that had an agricultural raw material imports percentage above 10
% of merchandise imports, the result is quite different. The co-variation is now positive as opposed
to the previous negative caution, and the r² is 0, 14.
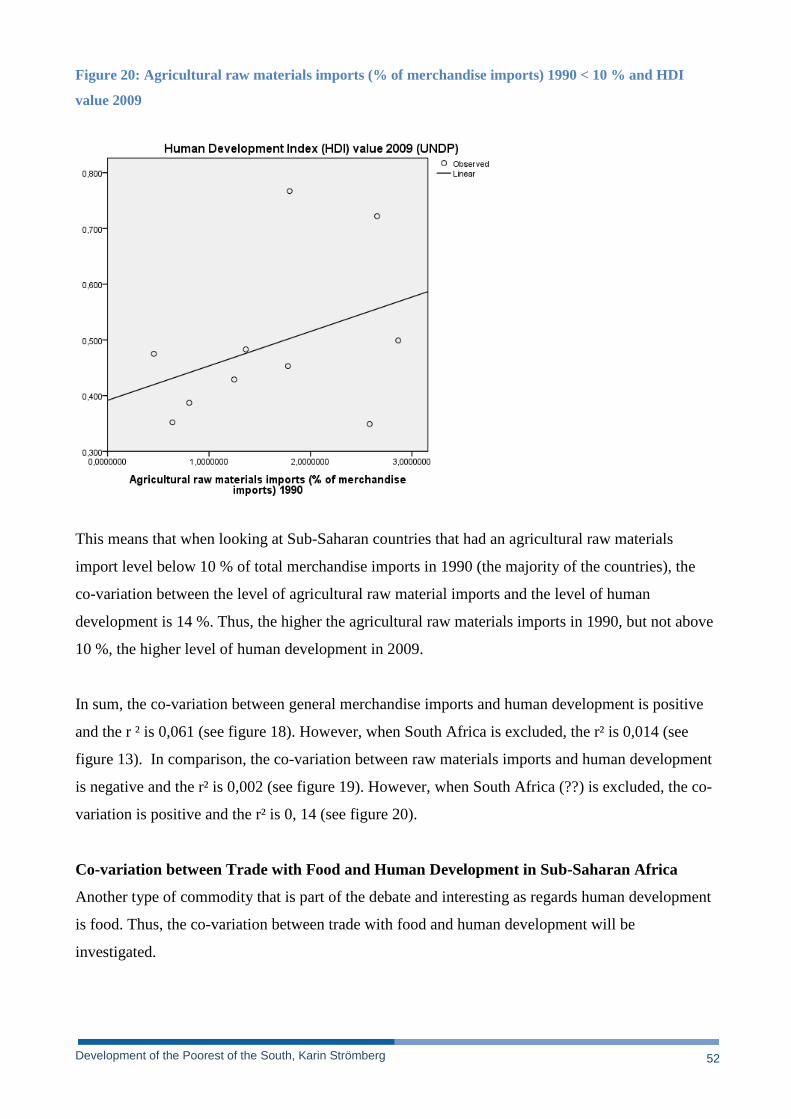
Development of the Poorest of the South, Karin Strömberg 52
Figure 20: Agricultural raw materials imports (% of merchandise imports) 1990 < 10 % and HDI
value 2009
This means that when looking at Sub-Saharan countries that had an agricultural raw materials
import level below 10 % of total merchandise imports in 1990 (the majority of the countries), the
co-variation between the level of agricultural raw material imports and the level of human
development is 14 %. Thus, the higher the agricultural raw materials imports in 1990, but not above
10 %, the higher level of human development in 2009.
In sum, the co-variation between general merchandise imports and human development is positive
and the r ² is 0,061 (see figure 18). However, when South Africa is excluded, the r² is 0,014 (see
figure 13). In comparison, the co-variation between raw materials imports and human development
is negative and the r² is 0,002 (see figure 19). However, when South Africa (??) is excluded, the co-
variation is positive and the r² is 0, 14 (see figure 20).
Co-variation between Trade with Food and Human Development in Sub-Saharan Africa
Another type of commodity that is part of the debate and interesting as regards human development
is food. Thus, the co-variation between trade with food and human development will be
investigated.
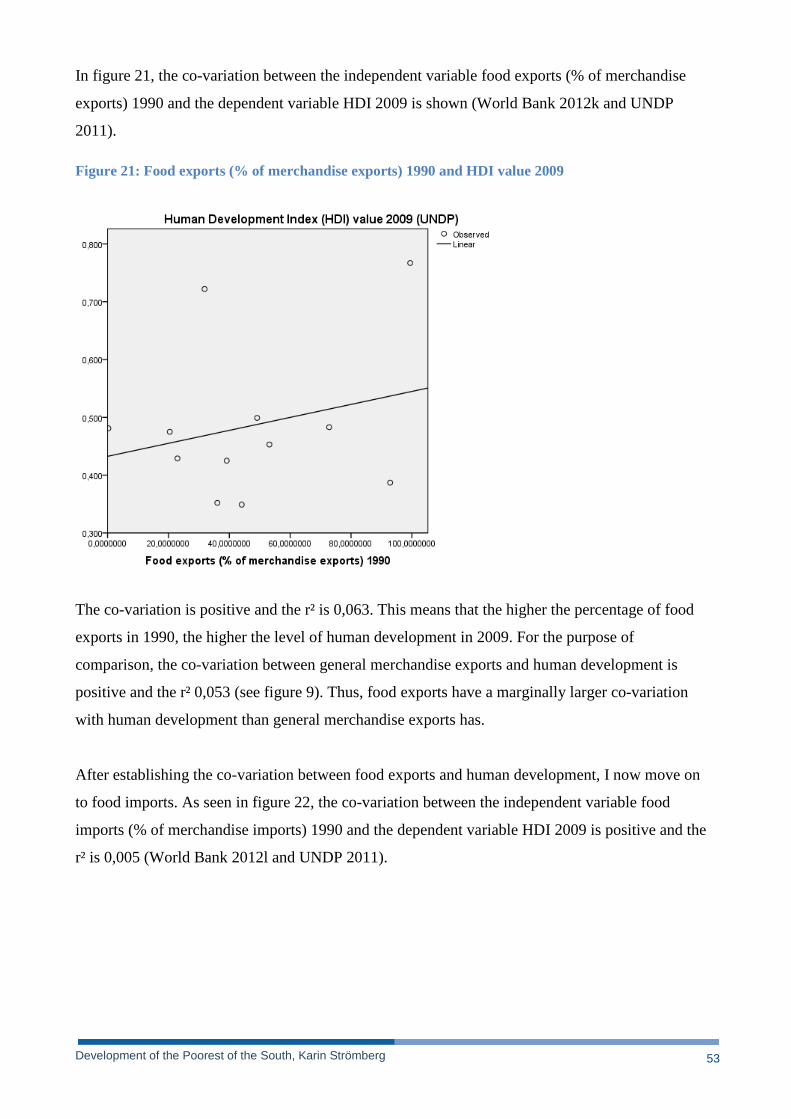
Development of the Poorest of the South, Karin Strömberg 53
In figure 21, the co-variation between the independent variable food exports (% of merchandise
exports) 1990 and the dependent variable HDI 2009 is shown (World Bank 2012k and UNDP
2011).
Figure 21: Food exports (% of merchandise exports) 1990 and HDI value 2009
The co-variation is positive and the r² is 0,063. This means that the higher the percentage of food
exports in 1990, the higher the level of human development in 2009. For the purpose of
comparison, the co-variation between general merchandise exports and human development is
positive and the r² 0,053 (see figure 9). Thus, food exports have a marginally larger co-variation
with human development than general merchandise exports has.
After establishing the co-variation between food exports and human development, I now move on
to food imports. As seen in figure 22, the co-variation between the independent variable food
imports (% of merchandise imports) 1990 and the dependent variable HDI 2009 is positive and the
r² is 0,005 (World Bank 2012l and UNDP 2011).
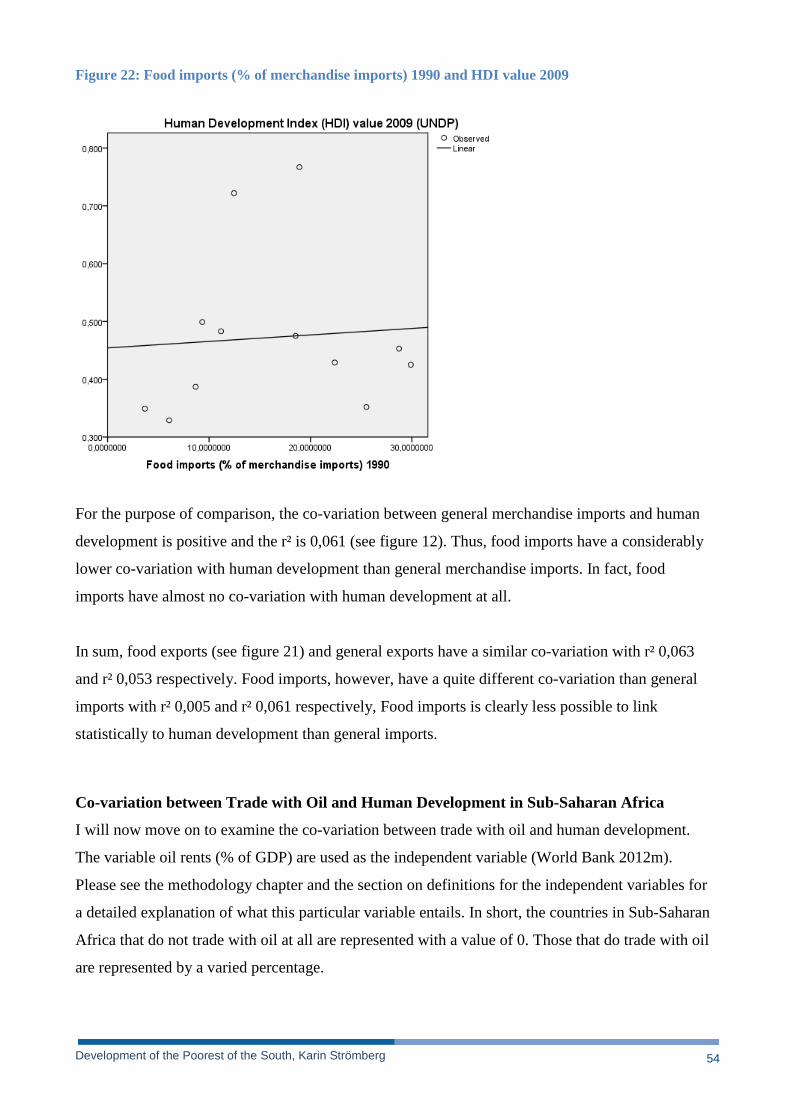
Development of the Poorest of the South, Karin Strömberg 54
Figure 22: Food imports (% of merchandise imports) 1990 and HDI value 2009
For the purpose of comparison, the co-variation between general merchandise imports and human
development is positive and the r² is 0,061 (see figure 12). Thus, food imports have a considerably
lower co-variation with human development than general merchandise imports. In fact, food
imports have almost no co-variation with human development at all.
In sum, food exports (see figure 21) and general exports have a similar co-variation with r² 0,063
and r² 0,053 respectively. Food imports, however, have a quite different co-variation than general
imports with r² 0,005 and r² 0,061 respectively, Food imports is clearly less possible to link
statistically to human development than general imports.
Co-variation between Trade with Oil and Human Development in Sub-Saharan Africa
I will now move on to examine the co-variation between trade with oil and human development.
The variable oil rents (% of GDP) are used as the independent variable (World Bank 2012m).
Please see the methodology chapter and the section on definitions for the independent variables for
a detailed explanation of what this particular variable entails. In short, the countries in Sub-Saharan
Africa that do not trade with oil at all are represented with a value of 0. Those that do trade with oil
are represented by a varied percentage.
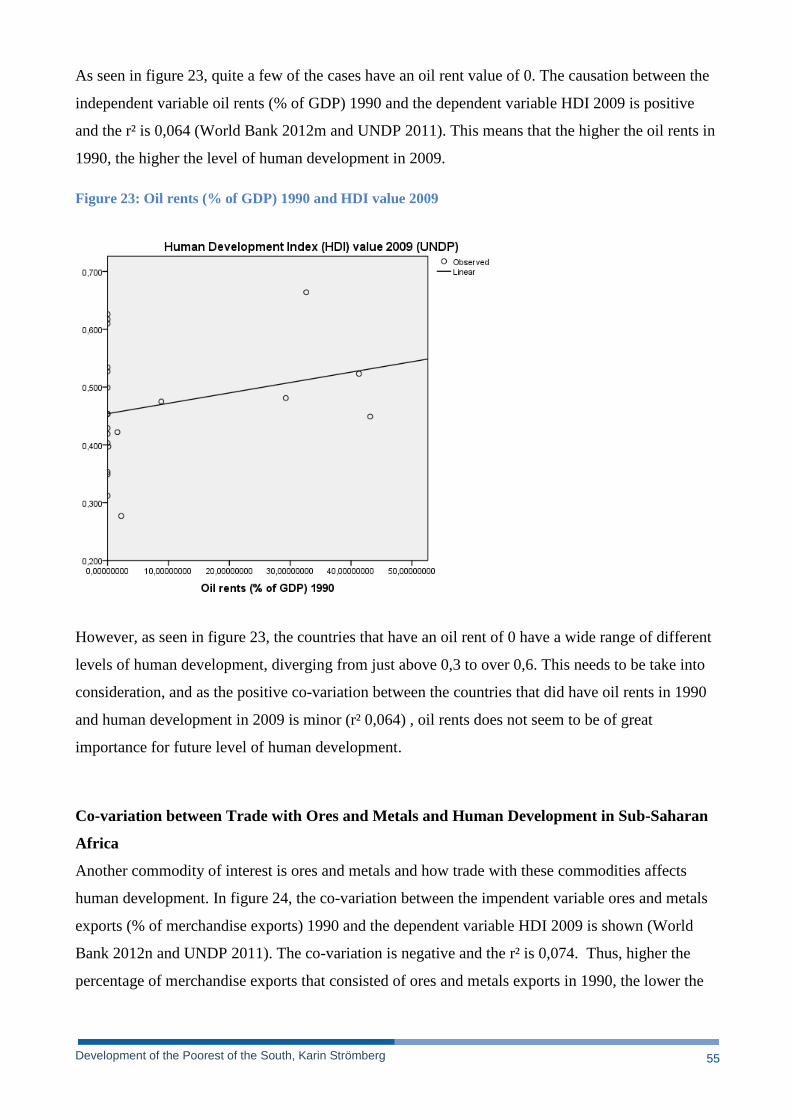
Development of the Poorest of the South, Karin Strömberg 55
As seen in figure 23, quite a few of the cases have an oil rent value of 0. The causation between the
independent variable oil rents (% of GDP) 1990 and the dependent variable HDI 2009 is positive
and the r² is 0,064 (World Bank 2012m and UNDP 2011). This means that the higher the oil rents in
1990, the higher the level of human development in 2009.
Figure 23: Oil rents (% of GDP) 1990 and HDI value 2009
However, as seen in figure 23, the countries that have an oil rent of 0 have a wide range of different
levels of human development, diverging from just above 0,3 to over 0,6. This needs to be take into
consideration, and as the positive co-variation between the countries that did have oil rents in 1990
and human development in 2009 is minor (r² 0,064) , oil rents does not seem to be of great
importance for future level of human development.
Co-variation between Trade with Ores and Metals and Human Development in Sub-Saharan
Africa
Another commodity of interest is ores and metals and how trade with these commodities affects
human development. In figure 24, the co-variation between the impendent variable ores and metals
exports (% of merchandise exports) 1990 and the dependent variable HDI 2009 is shown (World
Bank 2012n and UNDP 2011). The co-variation is negative and the r² is 0,074. Thus, higher the
percentage of merchandise exports that consisted of ores and metals exports in 1990, the lower the
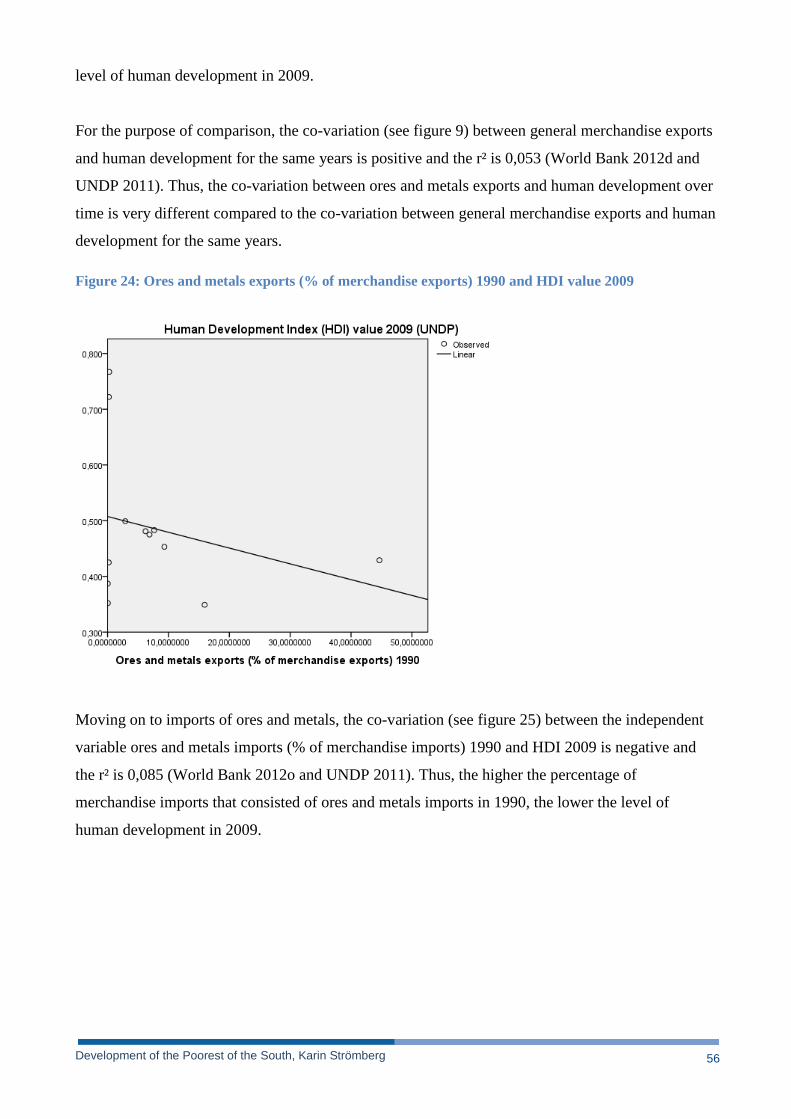
Development of the Poorest of the South, Karin Strömberg 56
level of human development in 2009.
For the purpose of comparison, the co-variation (see figure 9) between general merchandise exports
and human development for the same years is positive and the r² is 0,053 (World Bank 2012d and
UNDP 2011). Thus, the co-variation between ores and metals exports and human development over
time is very different compared to the co-variation between general merchandise exports and human
development for the same years.
Figure 24: Ores and metals exports (% of merchandise exports) 1990 and HDI value 2009
Moving on to imports of ores and metals, the co-variation (see figure 25) between the independent
variable ores and metals imports (% of merchandise imports) 1990 and HDI 2009 is negative and
the r² is 0,085 (World Bank 2012o and UNDP 2011). Thus, the higher the percentage of
merchandise imports that consisted of ores and metals imports in 1990, the lower the level of
human development in 2009.
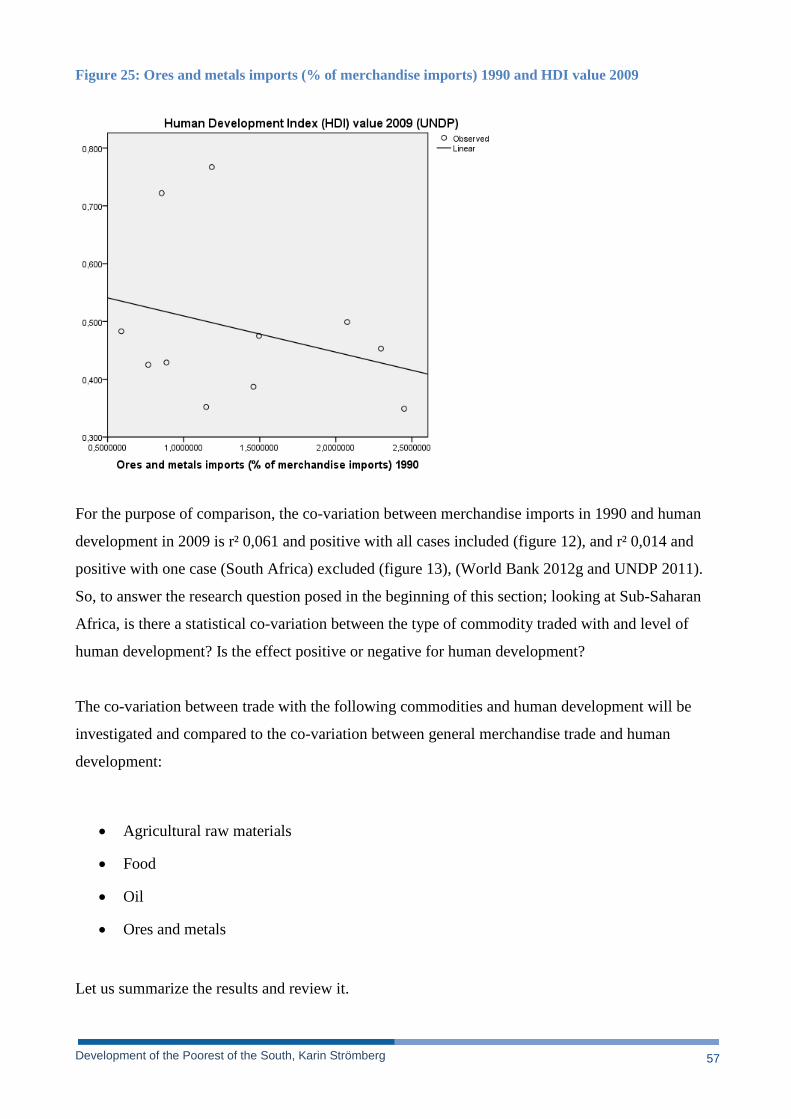
Development of the Poorest of the South, Karin Strömberg 57
Figure 25: Ores and metals imports (% of merchandise imports) 1990 and HDI value 2009
For the purpose of comparison, the co-variation between merchandise imports in 1990 and human
development in 2009 is r² 0,061 and positive with all cases included (figure 12), and r² 0,014 and
positive with one case (South Africa) excluded (figure 13), (World Bank 2012g and UNDP 2011).
So, to answer the research question posed in the beginning of this section; looking at Sub-Saharan
Africa, is there a statistical co-variation between the type of commodity traded with and level of
human development? Is the effect positive or negative for human development?
The co-variation between trade with the following commodities and human development will be
investigated and compared to the co-variation between general merchandise trade and human
development:
• Agricultural raw materials
• Food
• Oil
• Ores and metals
Let us summarize the results and review it.
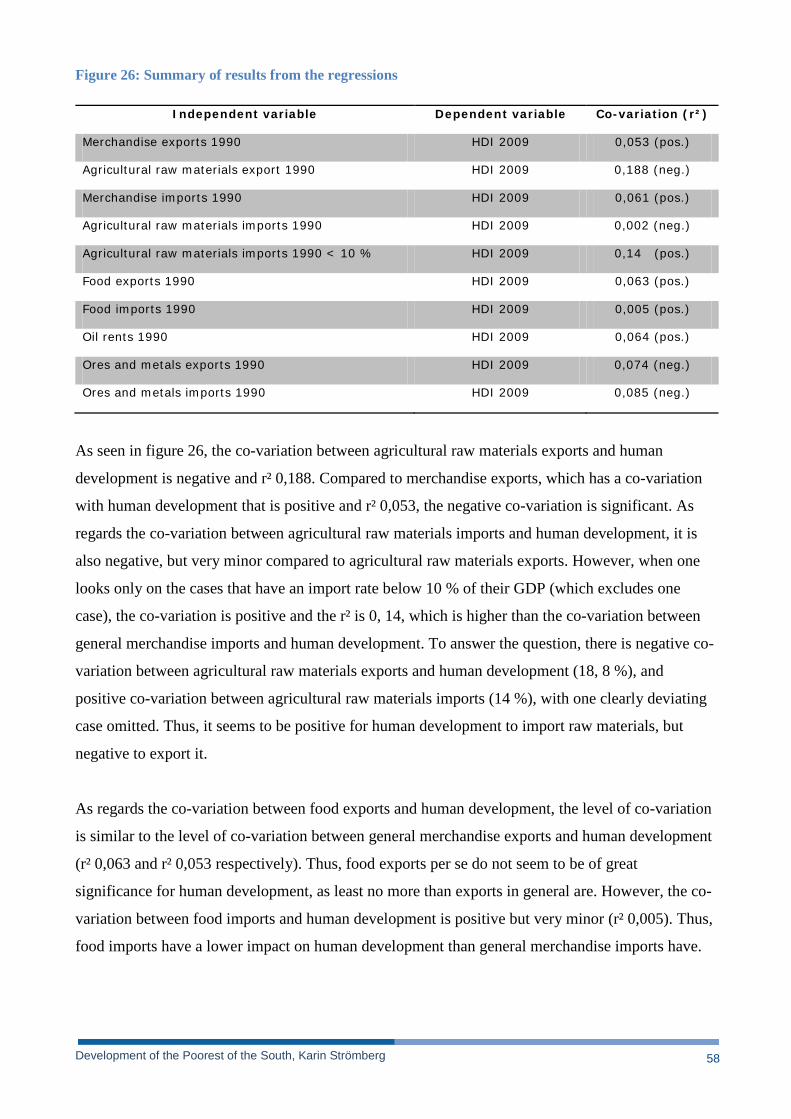
Development of the Poorest of the South, Karin Strömberg 58
Figure 26: Summary of results from the regressions
Independent variable Dependent variable Co-variation (r²)
Merchandise exports 1990 HDI 2009 0,053 (pos.)
Agricultural raw materials export 1990 HDI 2009 0,188 (neg.)
Merchandise imports 1990 HDI 2009 0,061 (pos.)
Agricultural raw materials imports 1990 HDI 2009 0,002 (neg.)
Agricultural raw materials imports 1990 < 10 % HDI 2009 0,14 (pos.)
Food exports 1990 HDI 2009 0,063 (pos.)
Food imports 1990 HDI 2009 0,005 (pos.)
Oil rents 1990 HDI 2009 0,064 (pos.)
Ores and metals exports 1990 HDI 2009 0,074 (neg.)
Ores and metals imports 1990 HDI 2009 0,085 (neg.)
As seen in figure 26, the co-variation between agricultural raw materials exports and human
development is negative and r² 0,188. Compared to merchandise exports, which has a co-variation
with human development that is positive and r² 0,053, the negative co-variation is significant. As
regards the co-variation between agricultural raw materials imports and human development, it is
also negative, but very minor compared to agricultural raw materials exports. However, when one
looks only on the cases that have an import rate below 10 % of their GDP (which excludes one
case), the co-variation is positive and the r² is 0, 14, which is higher than the co-variation between
general merchandise imports and human development. To answer the question, there is negative co-
variation between agricultural raw materials exports and human development (18, 8 %), and
positive co-variation between agricultural raw materials imports (14 %), with one clearly deviating
case omitted. Thus, it seems to be positive for human development to import raw materials, but
negative to export it.
As regards the co-variation between food exports and human development, the level of co-variation
is similar to the level of co-variation between general merchandise exports and human development
(r² 0,063 and r² 0,053 respectively). Thus, food exports per se do not seem to be of great
significance for human development, as least no more than exports in general are. However, the co-
variation between food imports and human development is positive but very minor (r² 0,005). Thus,
food imports have a lower impact on human development than general merchandise imports have.
Development of the Poorest of the South, Karin Strömberg 59
Moving on to oil rents, which has a positive co-variation with human development of r² 0,064. As
stated before, merchandise exports and merchandise imports have a positive co-variation with
human development with r² 0,053 and 0,061 respectively, which is similar to the co-variation
between oil rents and human development. Thus, to trade with oil does not seem to affect human
development more than trade in general does.
Finally, the co-variation between trade with ores and metals and human development has been
examined. The co-variation between both ores and metals exports and imports and human
development is negative. The r² is 0,074 and 0,085 respectively. Thus, trade with ores and metals
seems to have a negative effect on human development.
Development of the Poorest of the South, Karin Strömberg 60
5. ANALYSIS
In this chapter, I analyze and explain the results presented in the previous chapter by applying the
theories and drawing parallels to the literature overview presented in chapter 2.
5.1. Question 1: Co-variation between Interregional Trade and Human Development in Sub-
Saharan Africa
As was established in the results and reviewed in figure 15, the answer to the first research question
is, in essence, no – there is no co-variation. The co-variation between interregional trade & human
development is not higher than between general international trade & human development. In fact,
there is a negative co-variation between interregional exports/imports & human development. The
conclusion that one should draw for this is thus that interregional trade is bad for human
development, because the higher the level of interregional trade countries in Sub-Saharan Africa
had in 1990, the lower the level of human development in 2009.
This is somewhat surprising. It is not what I expected to find, as the general opinions on the benefits
of South-South trade, and in particular interregional trade in Sub-Saharan Africa, is that it is equal
to or better than general international trade. For instance, the UNCTAD report from 2009 describes
interregional African trade as an opportunity for African economies to increase their development,
as interregional trade will help to diversify the market and structurally change the pattern of exports
and imports (UNCTAD 2009, p. 2).
The time period between 1990 and 2009 should provide adequate time for one variable to affect the
other. Also, according UNCTAD (2009, p. 22-23), the rate of interregional trade in Africa started to
increase during the 1980s for a number of reasons, both political and economic. In effect, this
means that in 1990, interregional trade should have reached a level that would potentially affect
other social and economic phenomena, if there were indeed such a connection. As such, I do not
consider that the time span is causing a false lack of positive co-variation.
An explanation for the surprisingly low and negative co-variation between interregional trade and
human development could be found in the fact that interregional trade consists of about 10 % of
Africa’s total trade (UNCTAD 2009, p. 23). Thus, 90 % of African trade goes to other countries
than Sub-Saharan countries, which means that even though interregional trade might be beneficial
Development of the Poorest of the South, Karin Strömberg 61
for human development, the effect is so far so small that other factors cloud the results. The reason
why general international trade has a higher co-variation with human development would then be
explained by the fact that 90 % of total trade generates the bulk of the GDP, which then has an
effect on HDI as 30 % (see the section on HDI in the methodology chapter) of the HDI value is
made up of GDP.
What is clear is that, in spite of the structural argument that very poor economies benefit
considerably less from trade than richer economies, a comparatively high co-variation is found
between merchandise trade and human development (see figure 8), especially after excluding South
Africa (Todaro et al. 2009, Ravenhill 2008, Staiger 2004).
There is a 32 % positive co-variation between merchandise trade & human development, which I
deem as a comparatively high level of co-variation, as the majority of causalities throughout this
study have been below 10 %. In fact, the liberal theories on trade and development seem to be more
applicable to the results than structural theory here. As stated by Grimwade (1989) with regard to
the Theory of Comparative Advantage, countries with comparatively lower living costs will have an
advantage on the world market, and thus be able to financially benefit more than countries with a
higher living cost (Grimwade 1989, p. 7). Drawing from my results, Sub-Saharan countries
certainly seem to benefit a great deal from trade, but if they benefit more or less than richer
countries is difficult to conclude as I have not used a control group of other countries to check for
that in this paper.
Although the data that compiled for this study did not per se support the structural argument of why
interregional trade is good for developing countries, I nevertheless maintain that their arguments are
sound, and that interregional trade should be further researched to better understand the exact
processes and to be able to eventually incorporate interregional trade in development policies to a
greater extent. As stated by UNCTAD, if trade barriers were lowered within Sub-Saharan Africa,
the market access for low-cost producers will increase, and their goods will be available to more
potential consumers. In turn, this will increase the development of exporters who will earn more
money, and increase the development of the importers who will have access to cheaper products;
Consequently, the consumers will increase their living standard and be able to spend more money
on things that will boost the other elements of human development or HDI, such as a larger tax base
that will lead to more funds to the educational system and the health system, which will lead to
better and more schooling, and improved general health (UNCTAD 2009, p. 18). However, the
Development of the Poorest of the South, Karin Strömberg 62
trade barriers within Africa are today higher than those of the rest of the world, which is one of
several structural obstacles that hamper the growth of interregional trade (UNCTAD 2009, p. 18).
5.2. Question 2: Relevance of Type of Commodity for Human Development in Sub-Saharan
Africa
As established in the results that were reviewed in figure 26, the answer here is: yes. The
commodity that is traded with seems to have an effect on human development, and different
commodities have different effects. Four different commodities where examined: agricultural raw
materials, food, oil, and ores and metals.
There is significant negative co-variation between agricultural raw materials exports and human
development (18, 8 %), and an almost equally significant positive co-variation between agricultural
raw materials imports (14 %), with one clearly deviating case omitted. Thus, it seems to be positive
for human development to import raw materials, but negative to export it. This result correlates with
the structural theory as regards the negative aspects of producing and exporting primary goods
(Todaro et al. 2009, p. 591-593). A relatively low profit on exports creates a vicious circle of
balance of payment deficits and an increased vulnerability to crises (ibid).
Agricultural raw materials are a typical primary good that generates a low profit margin. The
negative co-variation between agricultural raw materials exports and human development indicates
that there is not only a connection between primary exports and low economic growth, but also
between primary exports and human development. There is no such negative co-variation between
agricultural raw materials imports, which make sense, as it is good to import cheap commodities
and refine them instead of buying secondary goods. Also, a high production and export rate of
agricultural raw materials indicates that the agricultural sector is large. According to Lewis’ Two
Sector Model, development on a grand scale happens when a society goes from being a rural
agricultural economy to an urban industrial economy (Todaro et al. 2009, p. 118). Thus, according
to the Two Sector Model, the type of commodity traded with can tell us something about the
general characteristics of the economy in question.
Trade of food products is an interesting aspect of Sub-Saharan trade due to the structuralist
argument of developing economies attempting to be self-sufficient thereby avoiding negative
aspects of the global market (Ravenhill 2008, p. 154). Food is one of these commodities that
Development of the Poorest of the South, Karin Strömberg 63
countries in economic crisis strive to be self-sufficient in. Food is also interesting as it is one of the
most heavily subsidized commodities on the global market. Developed countries are generally eager
to protect their own domestic food sector, which creates a distortion of price levels, and makes it
very difficult for developing countries to compete internationally (Ravenhill 2008). Trade in food
and its effects on development are a complex business.
As regards the co-variation between food exports and human development, the level of co-variation
is similar to the level of co-variation between general merchandise exports and human development
(r² 0,063 and r² 0,053 respectively). Thus, food exports per se do not seem to damage a Sub-Saharan
country’s prospects of development, at least not at those levels that the countries in question export.
The co-variation between food imports and human development is positive but very minor (r²
0,005). This would indicate that food imports have a lower impact on human development than
general merchandise imports have; therefore, it seems advisable for countries in Sub-Saharan Africa
to attempt to limit their food imports to a minimum, and thus apply the principle of self-sufficiency.
Oil is always a central concern when one discusses African development, and especially human
development. One of the countries in this study, Equatorial Guinea, has an extremely high annual
GDP per capita, which is due to its exports of oil. In fact, according to the economic parameters
used to define the South in this paper, Equatorial Guinea is part of the North. The country had in
2009 a GDP per capita well above France (World Bank 2009). On the other hand, their level of
human development is a completely different matter. This is a commonly discussed phenomenon
within development studies; it is observed in very poor and undeveloped countries when oil or other
natural resources are discovered. In such cases, the economic growth rate surges, but the human
development rate does not follow. It is also common for political unrest to occur after some time.
This is discussed and theorized by Collier (2008), where he refers to the phenomena as a “Resource
Trap”. It is sometimes also referred to as a “resource curse” or a “paradox of plenty” (Palley 2003).
Investigating the co-variation between oil rents and human development was of great personal
interest to me.
I found that oil rents have a positive co-variation with human development of r² 0,064. As stated
before, merchandise exports and merchandise imports have a positive co-variation with human
development of r² 0,053 and 0,061 respectively, which is similar to the co-variation between oil
rents and human development. Thus, to trade with oil does not seem to affect human development
more than trade in general does. However, it is important to note that far from all cases in the study
Development of the Poorest of the South, Karin Strömberg 64
has a figure for oil rents, which may have contributed to a somewhat distorted result. However,
among the counties that had a 0 in oil rents (did not export oil at all); the level of human
development fluctuated greatly, from very low to moderately high (see figure 23). I am thus
tempted to suggest that although oil often is considered to be a troubled commodity in Africa; other
factors seem to have a greater effect on human development.
Finally, the co-variation between trade with ores and metals and human development has been
examined. Ores and metals fall in two of the categories of commodities that I have already
discussed: primary goods and natural resources. The same analysis will thus apply here. Primary
goods have its drawbacks when exported due to its comparatively low profit margin and natural
resources have a knack to increase economic growth heavily but human development not so much
(Todaro et al. 2009, p. 591-593, Collier 2008 and Palley 2003). As expected, the co-variation
between trade in ores and metals and human development is negative. The r² is 0,074 and 0,085
respectively. Thus, trade with ores and metals seems to have a negative effect on human
development. It is likely that the explanations provided by the scholars above are the reasons behind
this negative co-variation.
5.3. Reflections & Afterthoughts
On completion of the analysis, a few things came to my realization as regards what could have been
done differently.
It would have been interesting to have a number of different time spans for the purpose of
comparison; for instance, the 1990 and 2009 time span could have been compared to a 1995 and
2009 time span and a 2000 and 2009 time span to check for differences and similarities in the level
of co-variation. This way, I could have drawn conclusions on the appropriateness of the time span
that I chose and possibly seen a more detailed pattern of co-variation between trade and human
development. For instance, perhaps a specific level of trade is particularly beneficial or unfavorable
for the furthering of human development? Such a discovery would potentially have been useful for
other scholars within the field of Peace and Development studies, and instigated a more in-depth
study on time spans and co-variation.
It would also have been interesting to have more than one population of cases in the study. I would
have liked to have a test group of countries from the other end of the income scale but still part of
Development of the Poorest of the South, Karin Strömberg 65
the South and see if there is a significant difference in level of co-variation between that group and
the group which was the object of study in the paper. To compare the results would have given a
deeper insight in the importance of trade in relation to human development at different stages in the
development process.
Development of the Poorest of the South, Karin Strömberg 66
6. CONCLUSIONS
The research problem from which the idea to this thesis originated is the one on the complex and
occasionally paradoxical relationship between trade and human development in poor countries. The
research questions are the following two:
1. Looking at Sub-Saharan Africa, is it possible to show statistically that a specific type of South-
South trade; interregional trade, has a higher level of co-variation with human development than
trade in general?
2. Looking at Sub-Saharan Africa, is it possible to show statistically that the type of commodity
traded with has an impact on the level of development? The co-variation between trade with the
following commodities and human development will be investigated and compared to the co-
variation between general merchandise trade and human development:
• Agricultural raw material
• Food
• Oil
• Ores and metals
The research method is quantitative and the approach deductive. A number of trade variables are
used as the independent variable in the regressions which are used to answer the questions. Human
development is the dependent variable and represented by HDI.
The answer to the first research question is in short that no, it is not possible to show statistically
that interregional trade has a higher level of co-variation with human development than trade in
general with the methods that have been used. The answer to the second question is that yes, all
commodities that are tested against human development have an impact, but they do not all have a
positive co-variation. As regards ores and metals trade, the co-variation between the variables that
represent the same and human development is negative, which indicates that the more trade in ores
and metals 1990 that occurred, the lower is the level of human development in 2009. As regards
trade in oil, that specific type of trade has a slight positive level of co-variation with human
development, but not a bigger level of co-variation than general merchandise trade. As regards trade
in food products, exports of foods do not seem to have a damaging effect on the prospects of
Development of the Poorest of the South, Karin Strömberg 67
development. The co-variation between food imports and human development is also positive but
very minor. This would indicate that food imports have a lower impact on human development than
general merchandise imports have; therefore, it seems advisable for countries in Sub-Saharan Africa
to attempt to limit their food imports to a minimum, and thus apply the principle of self-sufficiency.
As regards trade in agricultural raw materials, the negative co-variation between agricultural raw
materials exports and human development indicates that there is not only a connection between
primary exports and low economic growth, but also between primary exports and human
development. There is no such negative co-variation between agricultural raw materials imports,
which make sense, as it is economically sound to import cheap commodities and refine them instead
of buying secondary goods. The two research questions are hereby answered. Please see chapter 3
on results and chapter 4 on analysis for a more detailed presentation and analysis of the results.
The issue of co-variation and how to define and use the concept has been discussed previously in
the paper, and revisited here in the concluding chapter as a reminder to the reader. Please note that
when the term “co-variation” is used, it is the statistical level of co-variation between a dependent
and an independent variable displayed as an r² value that is referred to. To establish an actual co-
variation within a social science quantitative research project is less straight forward and sometimes
very time-consuming and complicated due to the many layers of underlying mechanisms. Thus,
what the results convey is the answers to the research questions and does not attempt to pain a
“true” picture of reality.
As a final note, the original idea was to answer a third research question, but due to time limits and
the realization that this question requires so much more than statistics to answer it properly, that
question was taken out. The question was as follows: Looking at Sub-Saharan Africa, is it possible
to show statistically that the political situation has an impact on both development and trade? Is it
possible to see a connection between level of development and political (in)stability? Is it possible
to say that politics is an as integral part in the opportunities of both trade and development?
• Control of corruption
• Government effectiveness
• Political stability and absence of violence
• Rule of Law
Development of the Poorest of the South, Karin Strömberg 68
For future studies, this third research question would be interesting and relevant to answer, as it
would have a valuable political and legal angle to the discussion on human development vis à vis
trade.
Development of the Poorest of the South, Karin Strömberg 69
LIST OF REFERENCES
Printed sources:
Collier, P. 2008. The Bottom Billion: Why the Poorest Countries Are Failing and What Can Be
Done About It. Oxford: Oxford University Press.
Creswell, J. W., 2009. Research Design: Qualitative, Quantitative, and Mixed Methods Approach.
London: Sage Publications Ltd.
Grimwade, N., 1989. International Trade: New Patterns of Trade, Production and Investment.
London: Routledge.
Ravenhill, J., 2008. Global Political Economy. Oxford: Oxford University Press.
Todaro, M. P. & Smith, S. C., 2009. Economic Development. Edinburgh: Pearson Education Ltd.
Web-based sources:
Agatiello, O. R., 2007. Is South-South trade the answer for alleviating poverty? [online]. Available
at: < www.emeraldinsight.com/0025-1747.htm > [Accessed 2011-10-26].
Behar, A. & Crivillé, L. C., 2011. Does It Matter Who You Sign With? Comparing the Impacts of
North-South and South-South Trade Agreements on Bilateral Trade. Policy Research Working
Paper 5626. The World Bank Development Research Group, Trade and Integration Team. [online].
Available at: <http://www-
wds.worldbank.org/servlet/WDSContentServer/WDSP/IB/2011/04/06/000158349_2011040608105
5/Rendered/PDF/WPS5626.pdf> [Accessed 2012-01-12].
Development of the Poorest of the South, Karin Strömberg 70
Bredesen, I. & Strobel, S., 1991. Trade as an engine of growth: The Lewis versus Riedel
controversy revisited. Intereconomics, Vol. 26, No. 2, pp.51-52. [online]. Available at:
<http://www.springerlink.com/content/003390881v718074/> [Accessed 2012-01-12].
Mehdi, S., 2010. The rationale for South-South trade; An Alternative Approach. MPRA Paper No.
26354, 1 November 2010. [online]. Available at: <http://mpra.ub.uni-muenchen.de/26354/ >
[Accessed 2012-01-11].
Myrdal, G., 1974. What is Development? Journal of Economic Issues Vol. VIII No. 4 December
1974 pp. 729-736. [online]. Available at: <http://www.jstor.org/stable/4224356> [Accessed 2012-
01-11].
OECD Policy Brief, 2006. South-South Trade: Vital for Development. [online]. Available at:
<http://www.oecd.org/dataoecd/30/50/37400725.pdf> [Accessed 2012-01-12].
Osakwe, P. N., 2007. Foreign Aid, Resources and Export Diversification in Africa: A New Test of
Existing Theories. Economic Commission for Africa: African Trade Policy Centre. [online].
Available at: <http://www.uneca.org/atpc/Work%20in%20progress/61.pdf> [Accessed: 2012-01-
12].
Palley, T.I., 2003. Lifting the Natural Resource Curse. Foreign Service Journal, December 2003.
[online] Available at: <http://www.globalpolicy.org/component/content/article/198-natural-
resources/40112.pdf> [Accessed 2012-08-19].
Reuveny, R. & Thompson, W. R., Uneven Economic Growth and the World Economy’s North-
South Stratification. International Studies Quarterly (2008) 52, 579–605. [online] Available at:
<http://onlinelibrary.wiley.com.proxy.lnu.se/doi/10.1111/j.1468-2478.2008.00516.x/pdf>
[Accessed 2012-01-11].
Development of the Poorest of the South, Karin Strömberg 71
Staiger, R. W., 2004. Report on the International Trade Regime for the International Task Force on
Global Public Goods. [online] Available at:
<http://www.stanford.edu/~rstaiger/global.public.goods.paper.020504.pdf> [Accessed 2012-01-12].
Tomlinson, B. R., 2003. What was the Third World? Journal of Contemporary History, Vol. 38(2),
pp. 307-321. London: Sage Publications. [online]. Available at:
<http://www.jstor.org/stable/318066 > [Accessed 2012-01-11].
UN, 2005. Dialogue with the Global South. [online]. Available at:
<http://www.un.org/globalsouth/> [Accessed 2012-08-01].
UNCTAD, 2009. Economic Development in Africa Report 2009, Strengthening Regional Economic
Intergration for Africa’s Development. Geneva: United Nations Publications. [online]. Available at:
<http://www.unctad.org/en/docs/aldcafrica2009_en.pdf > [Accessed: 2012-01-12].
UNCTAD, 2010. Economic Development in Africa Report 2010, South-South Cooperation: Africa
and the new forms of development partnership. Geneva: United Nations Publications. [online].
Available at: <http://www.unctad.org/en/docs/aldcafrica2010_en.pdf> [Accessed: 2012-01-12].
UNDP, 2009. Human Development Report 2009. Overcoming Barriers: Human mobility and
development. United Nations Development Program (UNDP). [online]. Available at:
<http://hdr.undp.org/en/media/HDR_2009_EN_Complete.pdf> [Accessed 2012-08-02].
UNDP, 2011. Human Development Reports; Indices and Data; Human Development Index.
[online]. Available at: <http://hdr.undp.org/en/statistics/hdi/> [Accessed 2012-07-29].
UNDP, 2012. International Human Development Indicators. [online]. Avaliable at:
<http://hdrstats.undp.org/en/tables/default.html > [Accessed 2012-09-05].
Development of the Poorest of the South, Karin Strömberg 72
United Nations, 2004. United Nations Conference on Trade and Development Regionalism and
South-South cooperation: The case of Mercosur and India: Note by the UNCTAD secretariat.
[online]. Available at: < http://www.unctad.org/en/docs/tdxibpd11_en.pdf > [Accessed 2011-10-
26].
United Nations, 2011. United Nations Statistics: Division Composition of macro geographical
(continental) regions, geographical sub-regions, and selected economic and other groupings.
[online]. Available at: <http://unstats.un.org/unsd/methods/m49/m49regin.htm> [Accessed 2012-
01-11].
World Bank, 2012a. The World Bank: Data: World Development Indicators data. [online].
Available at: <http://data.worldbank.org/about/world-development-indicators-data> [Accessed
2012-08-05].
World Bank, 2012b. The World Bank: Data: GDP (current US$). [online]. Available at:
<http://data.worldbank.org/indicator/NY.GDP.MKTP.CD?display=default> [Accessed 2012-08-
05].
World Bank, 2012c. The World Bank: Data: Merchandise trade (% of GDP) [online]. Available at:
<http://data.worldbank.org/indicator/TG.VAL.TOTL.GD.ZS?display=default> [Accessed 2012-08-
05].
World Bank, 2012d. The World Bank: Data: Merchandise exports (% of GDP). [online]. Available
at: <http://data.worldbank.org/indicator/TX.VAL.MRCH.CD.WT?display=default> [Accessed
2012-08-05].
Development of the Poorest of the South, Karin Strömberg 73
World Bank, 2012e. The World Bank: Data: Merchandise exports to developing economies in Sub-
Saharan Africa (% of total merchandise exports). [online]. Available at:
<http://data.worldbank.org/indicator/TX.VAL.MRCH.R6.ZS> [Accessed 2012-08-06].
World Bank, 2012f. The World Bank: Data: Merchandise imports from developing countries in
Sub-Saharan Africa (% of total merchandise imports). [online]. Available at:
<http://data.worldbank.org/indicator/TM.VAL.MRCH.R6.ZS> [Accessed 2012-08-06].
World Bank, 2012g. The World Bank: Data: Merchandise imports (current US$). [online].
Available at: <http://data.worldbank.org/indicator/TM.VAL.MRCH.CD.WT> [Accessed 2012-08-
06].
World Bank, 2012h. The World Bank: Data: Merchandise exports (current US$). [online].
Available at: <http://data.worldbank.org/indicator/TX.VAL.MRCH.CD.WT> [Accessed 2012-08-
06].
World Bank, 2012i. The World Bank: Data: Agricultural raw materials exports (% of merchandise
exports). [online]. Available at: <http://data.worldbank.org/indicator/TX.VAL.AGRI.ZS.UN>
[Accessed 2012-08-06].
World Bank, 2012j. The World Bank: Data: Agricultural raw materials imports (% of merchandise
imports). [online]. Available at: <http://data.worldbank.org/indicator/TM.VAL.AGRI.ZS.UN>
[Accessed 2012-08-06].
World Bank, 2012k. The World Bank: Data: Food exports (% of merchandise exports). [online].
Available at: <http://data.worldbank.org/indicator/TX.VAL.FOOD.ZS.UN> [Accessed 2012-08-
06].
Development of the Poorest of the South, Karin Strömberg 74
World Bank, 2012l. The World Bank: Data: Food imports (% of merchandise imports). [online].
Available at: <http://data.worldbank.org/indicator/TM.VAL.FOOD.ZS.UN> [Accessed 2012-08-
06].
World Bank, 2012m. The World Bank: Data: Oil rents (% of GDP). [online]. Available at:
<http://data.worldbank.org/indicator/NY.GDP.PETR.RT.ZS> [Accessed 2012-08-06].
World Bank, 2012n. The World Bank: Data: Ores and metals exports (% of merchandise exports).
[online]. Available at: < http://data.worldbank.org/indicator/TX.VAL.MMTL.ZS.UN> [Accessed
2012-08-06].
World Bank, 2012o. The World Bank: Data: Ores and metals imports (% of merchandise imports).
[online]. Available at: <http://data.worldbank.org/indicator/TM.VAL.MMTL.ZS.UN> [Accessed
2012-08-06].
World Bank, 2012p. The World Bank: Data: GDP per capita current US$. [online]. Available at:
<http://data.worldbank.org/indicator/NY.GDP.PCAP.CD> [Accessed 2012-09-01].
Development of the Poorest of the South, Karin Strömberg 75
ANNEX
Definitions of independent variables
Variables from the World Bank are part of their World Development Indicators data base (World
Bank 2012a). Below follows definitions of the variables.
GDP (current US$) is defined as: “the sum of gross value added by all resident producers in the
economy plus any product taxes and minus any subsidies not included in the value of the product. It
is calculated without making deduction of fabricated assets or for depletion and degradation of
natural resources. Data are in current US dollars. Dollar figures for GDP are converted form
domestic currencies using single year official exchange rates. For a few countries where the official
exchange rate does not reflect the rate effectively applied to actual foreign exchange transactions,
and alternative conversion factor is used.” (World Bank 2012b). The data is compiled from World
Bank national accounts data and OECD National Accounts data files (ibid).
Merchandise trade (% of GDP) is defined as: “the sum of merchandise exports and imports divided
by the value of GDP, all in current U.S. dollars.” (World Bank 2012c). The data is compiled from
the World Trade Organization and from World Bank GDP estimates (ibid).
Merchandise exports (current US $) are defined as: “the f.o.b. value of goods provided to the rest of
the world valued in current U.S. dollars.” (World Bank 2012d). The data is compiled from the
World Trade Organization (ibid).
Merchandise exports to developing economies in Sub-Saharan Africa (% of total merchandise
exports) are defined as: “the sum of merchandise exports for the reporting economy to developing
economies in the Sub-Saharan Africa region according to World Bank classification of economies.
Data are as a percentage of total merchandise exports by the economy. Data are computed only if
at least half of the economies in the partner country group had non-missing data.” (World Bank
2012e). The data is produced from World Bank staff estimates based on data from International
Monetary Fund’s Direction of Trade database (ibid).
Merchandise imports from developing countries in Sub-Saharan Africa (% of total merchandise
imports) are defined as: “the sum of merchandise imports by the reporting economy from
Development of the Poorest of the South, Karin Strömberg 76
developing economies in the Sub-Saharan Africa region according to the World Bank classification
of economies. Data are expressed as a percentage of total merchandise imports by the economy.
Data are computed only if at least half of the economies in the partner country group had non-
missing data.” (World Bank 2012f). The data is produced from World Bank staff estimates based
on data from International Monetary Fund’s Direction of Trade database (ibid).
Merchandise imports (current US $) are defined as: “the c.i.f. value of goods received from the rest
of the world valued in current U.S. dollars.” (World Bank 2012f). The data is compiled from the
World Trade Organization (ibid).
Agricultural raw materials exports (% of merchandise exports) are comprised by: “SITC section 2
(crude materials except fuels) excluding divisions 22, 27 (crude fertilizers and minerals excluding
coal, petroleum, and precious stones), and 28 (metalliferous ores and scrap).” (World Bank 2012i).
The data is produced by World Bank staff estimates from the Comtrade database maintained by the
United Nations Statistics Division (ibid).
Agricultural raw materials imports (% of merchandise imports) are comprised by: “SITC section 2
(crude materials except fuels) excluding divisions 22, 27 (crude fertilizers and minerals excluding
coal, petroleum, and precious stones), and 28 (metalliferous ores and scrap).” (World Bank 2012j).
The data is produced by World Bank staff estimates from the Comtrade maintained by the United
Nations Statistics Division (ibid).
Food exports (% of merchandise exports) are comprised of: “the commodities in SITC sections 0
(food and live animals), 1 (beverages and tobacco), and 4 (animal and vegetable oils and fats) and
SITC division 22 (oil seeds, oil nuts, and oil kernels).” (World Bank 2012k). The data is produced
by World Bank staff estimates from the Comtrade database maintained by the United Nations
Statistics Division (ibid).
Food imports (% of merchandise imports) are comprised of: “the commodities in SITC sections 0
(food and live animals), 1 (beverages and tobacco), and 4 (animal and vegetable oils and fats) and
SITC division 22 (oil seeds, oil nuts, and oil kernels).” (World Bank 2012l). The data is produced
by World Bank staff estimates from the Comtrade database maintained by the United Nations
Statistics Division (ibid).
Oil rents (% of GDP) are defined as: “the difference between the value of crude oil production at
Development of the Poorest of the South, Karin Strömberg 77
world prices and total costs of production.” (World Bank 2012m). The data is compiled from
estimates based on sources and methods described in "The Changing Wealth of Nations: Measuring
Sustainable Development in the New Millennium" (World Bank, 2011) (World Bank 2012m).
Ores and metals export (% of merchandise export) are comprised of: “the commodities in SITC
sections 27 (crude fertilizer, minerals nes); 28 (metalliferous ores, scrap); and 68 (non-ferrous
metals)” (World Bank 2012n). The data is compiled by World Bank staff estimates from the
Comtrade database maintained by the United Nations Statistics Division (ibid).
Ores and metals imports (% of merchandise imports) are comprised of: “commodities in SITC
sections 27 (crude fertilizer, minerals nes); 28 (metalliferous ores, scrap); and 68 (non-ferrous
metals).” (World Bank 2012o). The data in compiled by World Bank staff estimates from the
Comtrade database maintained by the United Nations Statistics Division (ibid).