development of design response spectra for penang island fadzli bin
TRANSCRIPT
DEVELOPMENT OF DESIGN RESPONSE SPECTRA FOR PENANG ISLAND
FADZLI BIN MOHAMED NAZRI
UNIVERSITI SAINS MALAYSIA
2007
DEVELOPMENT OF DESIGN RESPONSE SPECTRA FOR PENANG ISLAND
by
FADZLI BIN MOHAMED NAZRI
Thesis submitted in fulfilment of the requirements for the degree
of Master of Science
NOVEMBER 2007

ii
This thesis is dedicated to my beloved mom, Rehana bt. Jamaludin.

iii
ACKNOWLEDGEMENTS I am truly indebted to so many individuals whose guidance and assistances
were essential in the completion of this research. My sincere thanks and gratitude go to
my supervisor, Assoc. Prof. Dr. Taksiah A. Majid who graciously devoted a great deal
of her time in this research. Her continuous encouragement, interest and support made
this research possible.
This research is funded by the Construction Industry Development Board
(CiDB), Malaysia and Universiti Teknologi Malaysia (UTM), under project entitled
‘’Seismic Hazard Analysis for Peninsular Malaysia for Structural Design Purposes’’.
The supports provided by the agencies are gratefully acknowledged. I also want to
acknowledge all the private sector companies for providing soil investigation reports for
Penang Island.
To Ade Faisal, a lecturer from Universitas Muhammadiyah Sumatra Utara, who
have generously provided me with some idea and technical help of which I may not
succeed in this research without it.
My sincere thanks to the Universiti Sains Malaysia, Engineering Campus, and
School of Civil Engineering for the facilities that have been provided during this
research. A special thanks go to all postgraduate students and staffs of School of Civil
Engineering for their moral supports and encouragement. I owe a debt of gratitude to
Mohd Rashwan Arshad for such a brilliant suggestion and fruitful discussions we had
and were extremely valuable. There are also many people I would like to express my
gratitude without whom, the research as well as the thesis would have been
impossible.
iv
TABLE OF CONTENTS
Page ACKNOWLEDGEMENTS iii
TABLE OF CONTENTS iv
LIST OF TABLES viii
LIST OF FIGURES x
LIST OF SYMBOLS xiii
LIST OF ABBREVIATION xvi
LIST OF APPENDICES xvii
LIST OF PUBLICATIONS & SEMINARS xviii
ABSTRAK xix
ABSTRACT xx
CHAPTER ONE : INTRODUCTION
1.0 General 1
1.1 Problem Statement 3
1.2 Objectives 4
1.3 Scope of Works 4
1.4 Research Methodology 5
1.5 Organization of Thesis 6
CHAPTER TWO : LITERATURE REVIEW
2.0
Introduction
7
2.1 Earthquake 9
2.1.1 Tectonic Setting 13
2.1.2 Measuring Earthquake
2.1.2.1 Earthquake Magnitude 16
2.1.2.2 Earthquake Intensity 17
2.1.3 Earthquake Clusters 20
2.1.4 Earthquake Catalogue 21
2.2 Sumatran Earthquake 22
2.2.1 Sumatran Subduction Zone 23
2.2.2 Sumatran Fault Zone 25
v
2.3 Tectonic Setting and Earthquakes in Malaysia 27
2.3.1 Geology of Penang 29
2.4 Seismic Hazard Analysis 32
2.4.1 Deterministic 33
2.4.2 Probabilistic 34
2.4.3 Deterministic-Probabilistic 35
2.4.4 Peak Ground Acceleration (PGA) 37
2.4.5 Attenuation 37
2.4.6 Response Spectrum Acceleration (RSA) 39
2.4.7 Design Response Spectra 39
CHAPTER THREE : THEORETICAL BACKGROUND
3.0
Introduction
41
3.1 Phase 1: Prediction of maximum magnitude, mmax 41
3.1.1 Earthquake Catalogue 43
3.1.2 Magnitude Scale 46
3.1.3 Earthquake Clusters 48
3.1.4 Sumatran Subduction zone (SSZ) and Sumatran Fault
Zone (SFZ)
50
3.1.5 Earthquake Recurrence Relationship 51
3.1.6 Estimation of maximum magnitude, mmax 53
3.2 Phase 2: Peak Ground Acceleration (PGA) 55
3.2.1 Attenuation Relationship for Subduction Zone 57
3.2.2 Attenuation Relationship for Fault Zone 58
3.3 Phase 3: Design Response Spectra 60
3.3.1 Soil Data Analysis 61
3.3.2 Response Spectrum of Acceleration (RSA) 73
3.3.2.1 Amplification Factor 75
3.3.3 Design Response Spectra 75
3.3.3.1 Uniform Building Code 1997 (UBC 97) 76
3.3.3.2 National Earthquake Hazards Reduction
Program 2000 (NEHRP 2000)
78
3.3.3.3 Eurocode 1998 (EN 1998) 81
vi
CHAPTER FOUR : RESULTS AND DISCUSSIONS
4.0
Introduction
86
4.1 Results of Phase 1: Prediction of maximum magnitude, mmax 86
4.1.1 Earthquake Catalogue 86
4.1.2 Magnitude Scale 88
4.1.3 Earthquake Clusters 88
4.1.4 Sumatran Subduction zone (SSZ) and Sumatran Fault
Zone (SFZ)
89
4.1.5 Earthquake Recurrence Relationship 90
4.1.6 Summary of Phase 1 93
4.2 Results of Phase 2: Peak Ground Acceleration (PGA) 94
4.2.1 Attenuation for Subduction and Fault Zones 94
4.2.2 Summary of Phase 2 100
4.3 Results of Phase 3: Design Response Spectra 100
4.3.1 Results of Soil Data Analysis 101
4.3.1.1 Site Investigation Reports (S.I Reports) 101
4.3.1.2 Nonlinear Earthquake site Response Analysis
(NERA)
104
4.3.1.3 Site Classification, S 106
4.3.2 Results of Response Spectrum of Acceleration (RSA) 111
4.3.2.1 Results of Amplification Factor (AF) 114
4.3.3 Results of Design Response Spectrum 120
4.3.3.1 Results of Design Response Spectrum based
on UBC 97
121
4.3.3.2 Results of Design Response Spectrum based
on NEHRP 2000
126
4.3.3.3 Results of Design Response Spectrum based
on EN 1998
130
4.3.4 Summary of Phase 3 134
CHAPTER FIVE : CONCLUSIONS
5.0 Phase 1: Prediction of maximum magnitude, mmax 135
5.1 Phase 2: Peak Ground Acceleration (PGA) 135
5.2 Phase 3: Design Response Spectra 136
vii
5.3 Recommendations 140
REFERENCES 141
APPENDIX A: Site Investigation (S.I) Reports
-Typical S.I Reports for Bukit Jambul and Universiti Sains Malaysia
(USM)
153
APPENDIX B:
Strong Motion Data
B1- El Centro Earthquake
B2- Mexico Earthquake
162
APPENDIX C:
Example of NERA Software (Other Worksheet)
165
APPENDIX D: Site Classification for Eurocode 8
173
APPENDIX E: Example of Magnitude Scale (Typical Data for Catalogue Study)
175
viii
LIST OF TABLES
Page
2.1 10 largest earthquakes in the world since 1900
12
2.2 Modified Mercalli Intensity Scale (1956 version)
19
2.3 Earthquakes Felt In Malaysia
29
2.4 Previous tremors reported in Penang
32
2.5 Differentiate between DSHA and PSHA
36
3.1 Earthquake events catalogue
44
3.2 Magnitude are distance in km for mainshock
49
3.3 Example of earthquake data
49
3.4 Typical unit weight, γ
64
3.5 Site classification in the NEHRP 2000 Provision/UBC 97
73
3.6 Example of mean +1 S.D calculation
75
3.7 Amplification factor for short period spectral response acceleration, aF
78
3.8 Amplification factor for mid period spectral response acceleration, vF
78
3.9 Values of parameters describing the recommended Type 1
83
3.10 Values of parameters describing the recommended Type 2
84
4.1 Total number of earthquakes events from each catalogue
87
4.2 Total data according to each earthquake clusters
89
4.3 Data for two different zones 89
4.4 Magnitudes for each zone
90
4.5 Maximum magnitude, mmax
90
4.6 Expected frequency N(m) and recurrence interval T(m) for fault zone
92
4.7 Expected frequency N(m) and recurrence interval T(m) for subduction zone
93
4.8 Value of Mw, Rhypo, rrup and H for subduction and fault zone
98

ix
4.9 Results of peak ground acceleration (PGA)
99
4.10 Locations and total number of S.I reports and borelog
102
4.11 Site classification for each borehole
107
4.12 The highest values of RSA based on El Centro and Mexico earthquake
113
4.13 Results of amplification factor (AF) based on El Centro and Mexico earthquake strong motion data
115
x
LIST OF FIGURES
Page
2.1 Flow of literature review
8
2.2 Schematic diagram of notation for description of earthquake location
10
2.3 Main type of body waves; (a) p-wave, (b) s-wave
10
2.4 Main types of surface waves; (a) Rayleigh wave, (b) Love wave
11
2.5 Internal structure of the earth
14
2.6 Tectonic plates on the earth’s surface
15
2.7 Comparison of intensity values from Modified Mercalli (MMI), Rossi-Forel (RF), Japanese Meteorological Agency (JMA) and Medvedev-Spoonheuer-Karnik (MSK) scales
18
2.8 Active tectonic and seismologic summary, part of the Sumatra
23
2.9 Sumatra subduction zone
25
2.10 Sumatra fault
26
2.11 Tectonic setting around Peninsular Malaysia
27
2.12 Regional tectonic setting of Sumatra earthquake
28
2.13 Location of Penang Island
30
2.14 Geological map of Penang Island
31
3.1 Overall view of this research
41
3.2 Flow chart for Phase 1
42
3.3 Map covered an area for data collection
45
3.4 Empirical relationship between surface-wave magnitudes (Ms) and body-wave magnitude (mb)
47
3.5 Empirical relationship between moment magnitudes, (Mw) and surface-wave magnitude (Ms)
47
3.6 Active tectonics and seismologic summary of the Sumatra plate boundary
51
3.7 Flow chart for Phase 2
56

xi
3.8 Flow chart for Phase 3
61
3.9 Example of S.I reports
62
3.10 Example of summary of laboratory test results
63
3.11 An example of PEER website
67
3.12 Strong motion recorded for El Centro earthquake
68
3.13 Strong motion recorded for Mexico earthquake
68
3.14 Example of NERA worksheet (earthquake worksheet)
70
3.15 Example of NERA worksheet (soil data input)
71
3.16 Construction of design response spectra based on UBC 97
77
3.17 Construction of design response spectra based on NEHRP 2000
80
3.18 Shape of elastic response spectrum
83
3.19 Recommended Type 1 elastic response spectra for site class A to E with 5% damping
85
4.1 Locations of study area, subduction and fault zones
95
4.2 Calculation of Rhypo (hypocentral distance)
96
4.3 Location of each S.I reports
103
4.4 Example of results using NERA software
105
4.5 GIS format (digital Image for every S.I reports)
108
4.6 GIS format (location of every borehole in S.I reports)
109
4.7 GIS format (site classification and soil description for each borehole)
110
4.8 Response spectrum acceleration (RSA) using strong motion data of Mexico earthquake
112
4.9 Response spectrum acceleration (RSA) using strong motion data of El Centro earthquake
113
4.10 Example of peak surface acceleration (PSA) using NERA software
117
4.11 Amplification factor (AF) based on El Centro Earthquake
118
4.12 Amplification factor (AF) based on Mexico Earthquake
119

xii
4.13 Recommended design response spectra based on UBC 97 code for site class, SC (a) table form, (b) graphical form
123
4.14 Recommended design response spectra based on UBC 97 code for site class, SD (a) table form, (b) graphical form
124
4.15 Recommended design response spectra based on UBC 97 code for site class, SE (a) table form, (b) graphical form
125
4.16 Recommended design response spectra based on NEHRP 2000 code for site class, SC (a) table form, (b) graphical form
127
4.17 Recommended design response spectra based on NEHRP 2000 code for site class, SD (a) table form, (b) graphical form
128
4.18 Recommended design response spectra based on NEHRP 2000 code for site class, SE (a) table form, (b) graphical form
129
4.19 Recommended design response spectra based on EN 1998 code for site class, SC (a) table form, (b) graphical form
131
4.20 Recommended design response spectra based on EN 1998 code for site class, SD (a) table form, (b) graphical form
132
4.21 Recommended design response spectra based on EN 1998 code for site class, SE (a) table form, (b) graphical form
133
xiii
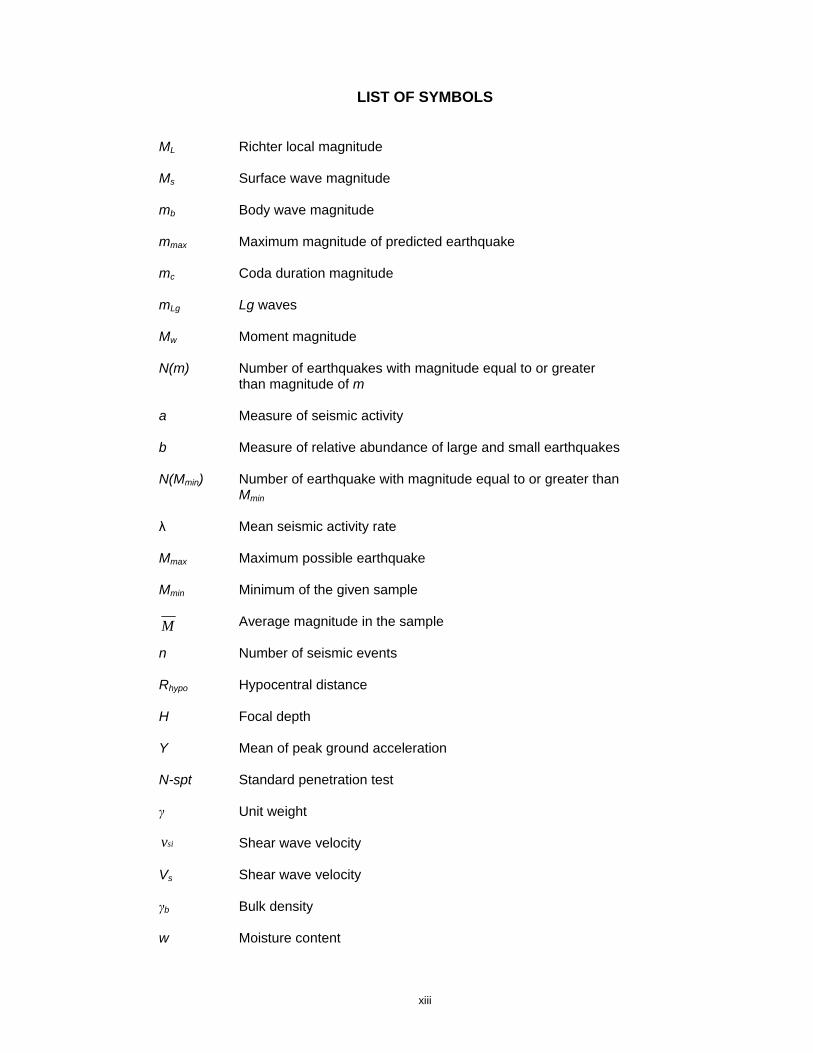
LIST OF SYMBOLS
ML Richter local magnitude
Ms Surface wave magnitude
mb Body wave magnitude
mmax Maximum magnitude of predicted earthquake
mc Coda duration magnitude
mLg Lg waves
Mw Moment magnitude
N(m) Number of earthquakes with magnitude equal to or greater
than magnitude of m
a Measure of seismic activity
b Measure of relative abundance of large and small earthquakes
N(Mmin) Number of earthquake with magnitude equal to or greater than Mmin
λ Mean seismic activity rate
Mmax Maximum possible earthquake
Mmin
Minimum of the given sample
M Average magnitude in the sample
n Number of seismic events
Rhypo Hypocentral distance
H Focal depth
Y Mean of peak ground acceleration
N-spt Standard penetration test
γ Unit weight
siv Shear wave velocity
Vs Shear wave velocity
γb Bulk density
w Moisture content

xiv
id The thickness of any layer between 0 and 30 m from surface
S Site classification
SA Hard Rock
SB Rock
SC
Very Dense Soil/Soft Rock
SD Stiff soil
SE Soft Soil
σ Standard deviation
∑ Sum
M Individual data
n Sample size
aC Ground motion coefficients at oT
vC Ground motion coefficients at sT
oT Short period
sT Longer period
Z Effective peak ground acceleration
aF Amplification factor for short period spectral response acceleration
vF Amplification factor for mid period spectral response acceleration
PSA1.0sec Design response spectra at 1 second period
T Fundamental period of the structure second
Se(T) Elastic response spectrum
ag Design ground acceleration on Type A ground
TB Lower limit of the period of the constant spectral acceleration branch
TC Upper limit of the period of the constant spectral acceleration branch
TD Value defining the beginning of the constant displacement response range of the spectrum

xv
η Damping correction factor with a reference value of η =1 for 5% viscous damping
T(m)
Recurrence interval
rrup Closest distance to fault rupture
xvi
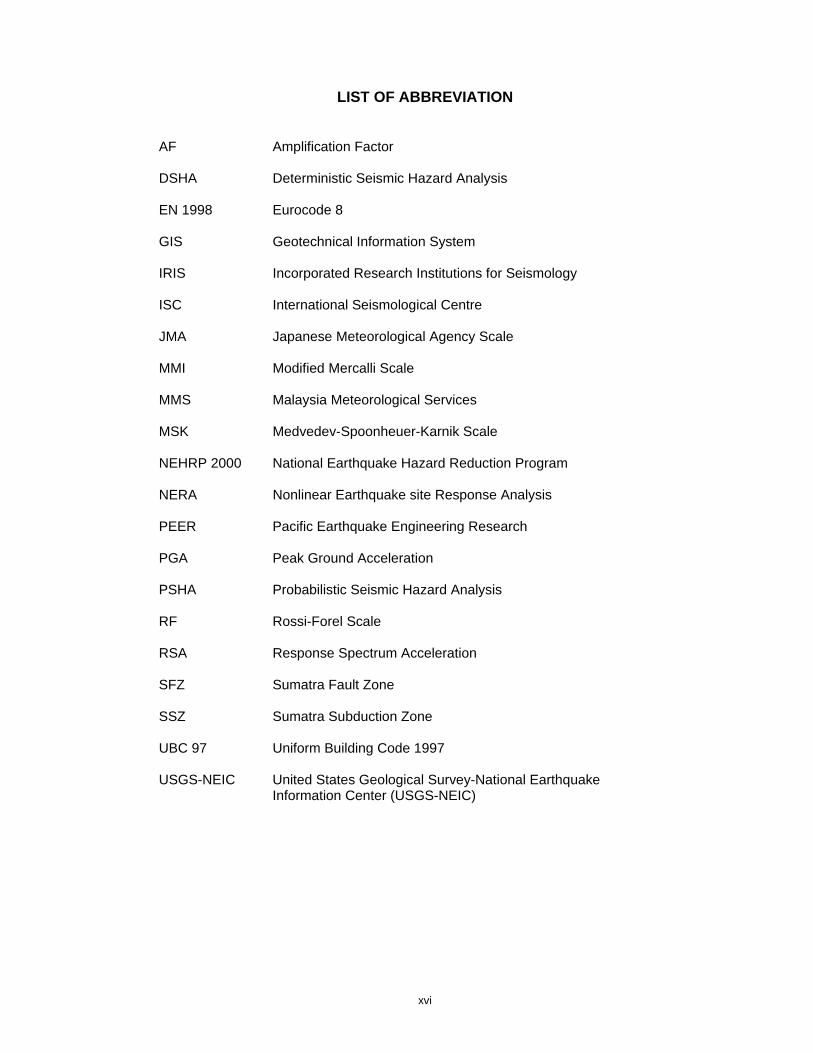
LIST OF ABBREVIATION
AF Amplification Factor
DSHA Deterministic Seismic Hazard Analysis
EN 1998 Eurocode 8
GIS Geotechnical Information System
IRIS Incorporated Research Institutions for Seismology
ISC International Seismological Centre
JMA Japanese Meteorological Agency Scale
MMI Modified Mercalli Scale
MMS Malaysia Meteorological Services
MSK Medvedev-Spoonheuer-Karnik Scale
NEHRP 2000 National Earthquake Hazard Reduction Program
NERA Nonlinear Earthquake site Response Analysis
PEER Pacific Earthquake Engineering Research
PGA Peak Ground Acceleration
PSHA Probabilistic Seismic Hazard Analysis
RF Rossi-Forel Scale
RSA Response Spectrum Acceleration
SFZ Sumatra Fault Zone
SSZ Sumatra Subduction Zone
UBC 97 Uniform Building Code 1997
USGS-NEIC United States Geological Survey-National Earthquake
Information Center (USGS-NEIC)

xvii
LIST OF APPENDICES
Page
APPENDIX A: Site Investigation (S.I) Reports -Typical S.I Reports for Bukit Jambul and University Sains Malaysia
153
APPENDIX B: Strong Motion Data B1-El Centro Earthquake B2-Mexico Earthquake
162
APPENDIX C: Example of NERA Software (Other Worksheet)
165
APPENDIX D: Site Classification for Eurocode 8
173
APPENDIX E: Example of Magnitude Scale (Typical Data for Catalogue Study)
175
xviii
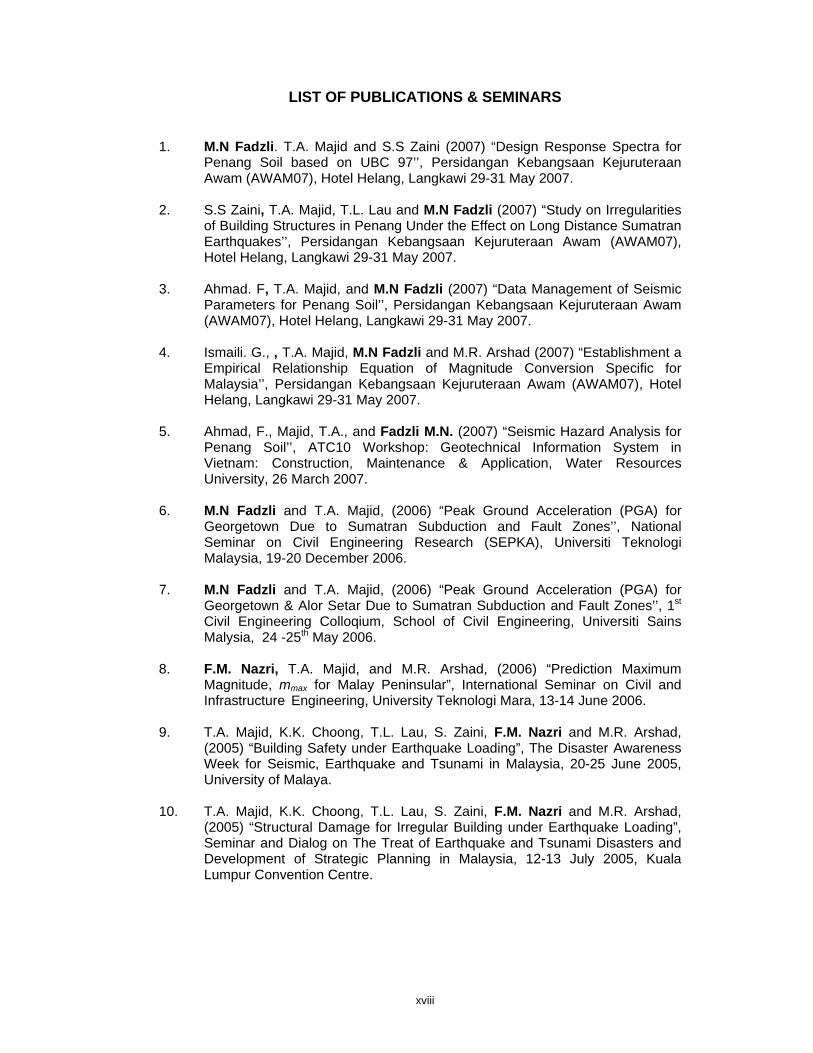
LIST OF PUBLICATIONS & SEMINARS
1. M.N Fadzli. T.A. Majid and S.S Zaini (2007) “Design Response Spectra for
Penang Soil based on UBC 97’’, Persidangan Kebangsaan Kejuruteraan Awam (AWAM07), Hotel Helang, Langkawi 29-31 May 2007.
2. S.S Zaini, T.A. Majid, T.L. Lau and M.N Fadzli (2007) “Study on Irregularities of Building Structures in Penang Under the Effect on Long Distance Sumatran Earthquakes’’, Persidangan Kebangsaan Kejuruteraan Awam (AWAM07), Hotel Helang, Langkawi 29-31 May 2007.
3. Ahmad. F, T.A. Majid, and M.N Fadzli (2007) “Data Management of Seismic Parameters for Penang Soil’’, Persidangan Kebangsaan Kejuruteraan Awam (AWAM07), Hotel Helang, Langkawi 29-31 May 2007.
4. Ismaili. G., , T.A. Majid, M.N Fadzli and M.R. Arshad (2007) “Establishment a Empirical Relationship Equation of Magnitude Conversion Specific for Malaysia’’, Persidangan Kebangsaan Kejuruteraan Awam (AWAM07), Hotel Helang, Langkawi 29-31 May 2007.
5. Ahmad, F., Majid, T.A., and Fadzli M.N. (2007) “Seismic Hazard Analysis for Penang Soil’’, ATC10 Workshop: Geotechnical Information System in Vietnam: Construction, Maintenance & Application, Water Resources University, 26 March 2007.
6. M.N Fadzli and T.A. Majid, (2006) “Peak Ground Acceleration (PGA) for Georgetown Due to Sumatran Subduction and Fault Zones’’, National Seminar on Civil Engineering Research (SEPKA), Universiti Teknologi Malaysia, 19-20 December 2006.
7. M.N Fadzli and T.A. Majid, (2006) “Peak Ground Acceleration (PGA) for Georgetown & Alor Setar Due to Sumatran Subduction and Fault Zones’’, 1st Civil Engineering Colloqium, School of Civil Engineering, Universiti Sains Malysia, 24 -25th May 2006.
8. F.M. Nazri, T.A. Majid, and M.R. Arshad, (2006) “Prediction Maximum Magnitude, mmax for Malay Peninsular”, International Seminar on Civil and Infrastructure Engineering, University Teknologi Mara, 13-14 June 2006.
9. T.A. Majid, K.K. Choong, T.L. Lau, S. Zaini, F.M. Nazri and M.R. Arshad, (2005) “Building Safety under Earthquake Loading”, The Disaster Awareness Week for Seismic, Earthquake and Tsunami in Malaysia, 20-25 June 2005, University of Malaya.
10. T.A. Majid, K.K. Choong, T.L. Lau, S. Zaini, F.M. Nazri and M.R. Arshad, (2005) “Structural Damage for Irregular Building under Earthquake Loading”, Seminar and Dialog on The Treat of Earthquake and Tsunami Disasters and Development of Strategic Planning in Malaysia, 12-13 July 2005, Kuala Lumpur Convention Centre.

xix
PEMBANGUNAN SPEKTRA SAMBUTAN REKABENTUK UNTUK PULAU PINANG
ABSTRAK
Semenanjung Malaysia terletak di dalam kawasan yang kejadian gempa
buminya kurang aktif yang dipanggil ‘para Sunda yang stabil’ dan dianggap sebagai
kawasan yang bebas dari kejadian gempa bumi. Walaupun demikian, tiada kerosakan
yang berlaku tetapi berdasarkan fakta, Semenanjung Malaysia terletak di kawasan
yang dekat dengan kejadian gempa bumi yang memperuntukkan tambahan terhadap
kod rekabentuk yang sedia ada dalam merekabentuk bangunan teruatamanya di Pulau
Pinang. Dalam penyelidikan ini, jangkaan magnitud yang maksimum, mmax bagi zon
gelinciran di Sumatra (SFZ) dan zon subduction di Sumatra (SSZ) adalah 7.8 dan 9.2
yang berkemungkinan menyebabkan gempa bumi di Semenanjung Malaysia.
Hubungan perlemahan dipilih berdasarkan penyelidikan yang lepas bagi setiap zon
dan menentukan pemecutan bumi puncak (PGA) bagi kawasan Pulau Pinang adalah
0.041 g bg SSZ dan 0.063 g untuk SFZ. Dari penyelidikan ini juga didapati
kebanyakan tanah di Pulau Pinang adalah kategori SD (tanah kukuh) iaitu 50 lubang
jara, SE (tanah lembut) 7 lubang jara and SC (tanah tumpat) dengan 38 lubang jara
daripada 95. Batu Feringghi adalah dalam keadaan kritikal dimana faktor penguatan
(AF) adalah 4.76 dan tempat yang paling selamat adalah di kawasan Bukit Jambul iaitu
AF 0.32. Bagi spektra sambutan rekabantuk juga dikaji berdasarkan pelbagai jenis kod
(UBC 97, NEHRP 2000 and EN 1998) bagi keseluruhan jangka masa dalam
penggunaan rekabentuk struktur berdasarkan keputusan spektrum sambutan
pemecutan (RSA). Dalam spektra sambutan rekabentuk, nilai maksimum bagi RSA
untuk SC bagi ketiga-tiga kod adalah 0.7 g dalam jangka masa 0.02 hingga 0.3 saat
berbanding SD dan SE, 0.6 g dalam jangka masa yang lebih panjang (0.15 hingga 0.7
saat). Kesemua nilai ini adalah penting dalam analisis rekabentuk struktur bangunan
dalam jangka masa tertentu.
xx
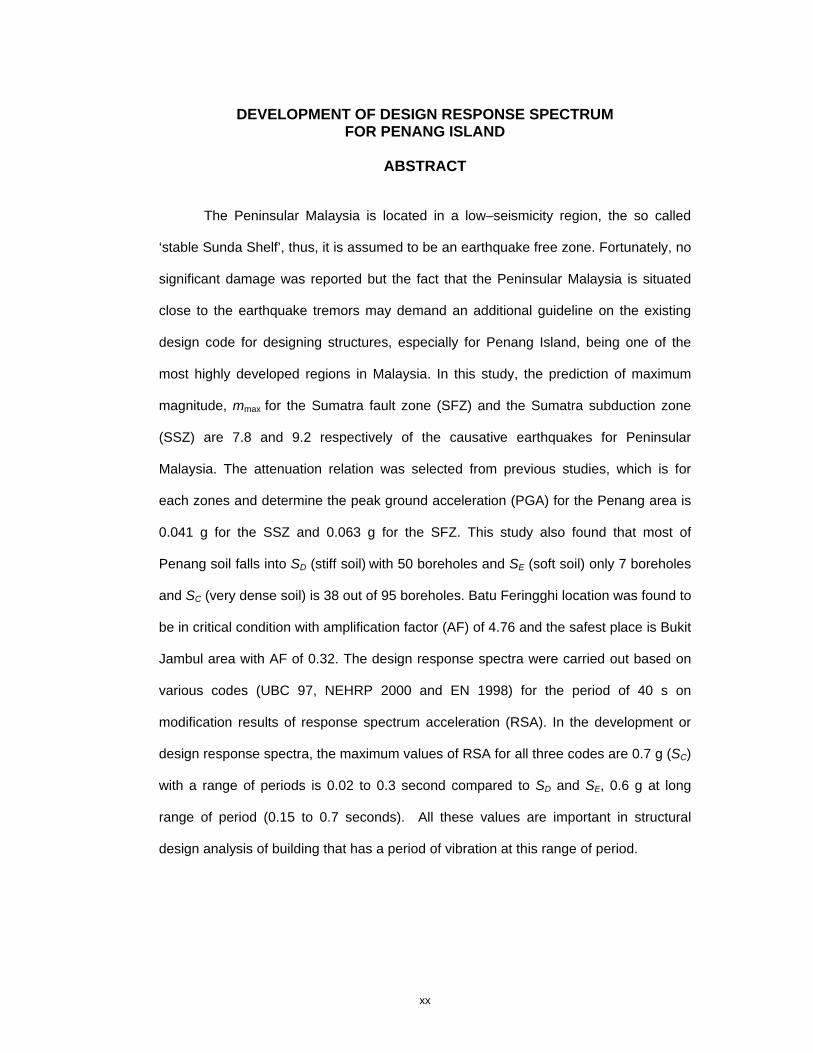
DEVELOPMENT OF DESIGN RESPONSE SPECTRUM
FOR PENANG ISLAND
ABSTRACT
The Peninsular Malaysia is located in a low–seismicity region, the so called
‘stable Sunda Shelf’, thus, it is assumed to be an earthquake free zone. Fortunately, no
significant damage was reported but the fact that the Peninsular Malaysia is situated
close to the earthquake tremors may demand an additional guideline on the existing
design code for designing structures, especially for Penang Island, being one of the
most highly developed regions in Malaysia. In this study, the prediction of maximum
magnitude, mmax for the Sumatra fault zone (SFZ) and the Sumatra subduction zone
(SSZ) are 7.8 and 9.2 respectively of the causative earthquakes for Peninsular
Malaysia. The attenuation relation was selected from previous studies, which is for
each zones and determine the peak ground acceleration (PGA) for the Penang area is
0.041 g for the SSZ and 0.063 g for the SFZ. This study also found that most of
Penang soil falls into SD (stiff soil) with 50 boreholes and SE (soft soil) only 7 boreholes
and SC (very dense soil) is 38 out of 95 boreholes. Batu Feringghi location was found to
be in critical condition with amplification factor (AF) of 4.76 and the safest place is Bukit
Jambul area with AF of 0.32. The design response spectra were carried out based on
various codes (UBC 97, NEHRP 2000 and EN 1998) for the period of 40 s on
modification results of response spectrum acceleration (RSA). In the development or
design response spectra, the maximum values of RSA for all three codes are 0.7 g (SC)
with a range of periods is 0.02 to 0.3 second compared to SD and SE, 0.6 g at long
range of period (0.15 to 0.7 seconds). All these values are important in structural
design analysis of building that has a period of vibration at this range of period.
1
CHAPTER 1 INTRODUCTION
1.0 General
Earthquakes are considered to be the most powerful natural disaster. Seismic
hazards include ground shaking, structural failures, liquefaction, land slides, and
lifelines damages. Most earthquakes can be explained by the two theories of plate
tectonics and elastic rebound.
The crust of Earth is broken into many pieces called plates. These plate
boundaries include spreading ridge, subduction zone, and transform fault boundaries.
Plates separated by spreading ridge boundaries move away from one another without
building up any significant stress. At subduction zone boundaries, one plate subducts
or dives beneath the other, whereas transform fault boundaries exist where plates
move past one another.
Plate tectonics is that the earth’s surface consists of a number of large, intact
blocks called plates, and that these plates move with respect to each other. Currently,
there are seven large plates; that are Pacific plate, Australian plate, the North American
plate, the Eurasian plate, the Antarctic plate, the South American plate and the African
plate.
The elastic rebound theory suggests that elastic strain energy is stored in the
materials near the subduction zone and transform fault boundaries as shear stress
increases on the fault planes that separate the plates. As the shear stress approaches
the shear strength of the rock material along the fault, the rock material begins to fail
and releases the stored energy. If the rock material is strong and brittle, the level of the
2
stored energy can be very high. In addition, rupture along the plain of the fault will be
rapid and the energy release will be violent.
Peninsular Malaysia is located relatively faraway from seismic source zone of
Sumatra but is situated close to the most seismically active plate boundary which is
interplate boundary between the Indo-Australia and Eurasian plates on the west which
is marked by a concave subduction zone known as Sumatra Trench. Also interplate
boundary between the Eurasian and Philippines Sea plates on the east.
Actually, Malaysia is situated on the so call ‘stable Sunda Shelf’, thus it is
assumed to be an earthquake free zone. In fact, this shelf is divided to three directions
an earthquake free zone. Whereas, for the east part, the Indian plate is currently
pushing in the north-easterly direction at the rate of 6-8 mm/yr. Whereas, the Australian
plate have undergoing a north direction compression for the Sunda Shelf for creating
the Java Trench as a southern part. In the other direction, which is the western part,
Philippine plate (pacific plate) is compressed the Sunda Shelf.
However, major earthquake originating from those plate boundaries which is the
‘ground shaking’ have been felt in Malaysia, even though Malaysia is situated on the
stable shelf (Sunda Shelf). The effect still can be felt whenever a moderately to high
earthquake happened at Sumatra Island due to the close proximity to subduction zone,
Sumatra Trench.
Malaysia Meteorological Services (MMS) reports that Peninsular Malaysia
tremors felt along the west coast is originating from large earthquake in the centre
seismic areas of Sumatra and Andaman Sea. East Malaysia has experienced
earthquake of local origin and also affected by tremors originating from large
earthquake located over Southern Philippines and Northern Sulawesi. Beside that, the
3
Great Sumatra Strike-Slips Fault which slicing through Sumatra Island also posing a
potential treat to Malaysia (MMS, 2005).
On 26 December 2004, Malaysia was affected by the Indian Ocean earthquake
that caused panic around the region. Despite its proximity to the epicenter of the
earthquake (approximately 500 km), Malaysia is fortunate to escape from major
damage.
Therefore, the possibility of a large earthquake in Sumatra should not be
ignored, and some preparedness and mitigation place should be in place.
1.1 Problem Statement
Penang Island is located on the north-east coast of Peninsular Malaysia. which
is an island of 293 square kilometers located in the Straits of Malacca bounded by
latitudes, 5°15’N to 5°30’N and longitudes 100°10’E to 100°20’E and one of the most
highly developed regions in Malaysia. In the past few decades, there were a lot of high
rise and commercial buildings built around Penang Island of which some of these
buildings were built on soft soil areas or reclaimed lands.
Large earthquakes from Sumatra may pose threats to these buildings as
Penang is only 350 km away from the Sumatra fault and 500 km away from the
subduction zones.
Malaysian Meteorological Services (MMS) reported that Penang is the second
most frequent earthquake felt area after Kuala Lumpur for the earthquake events
occurred over the last 20 years.
4
For these reasons, Penang Island has been chosen as a case study area and
this seismic hazard analysis is important in order to help some preparedness and
mitigation plan in future.
1.2 Objectives
This study is based on the proximity of Sumatra earthquake and its analytical
effect on the Penang Island. The main objectives of this study are as follows:
i. To predict the maximum magnitude, mmax for Peninsular Malaysia. This include
of determination of the expected frequency and recurrence interval for
Peninsular Malaysia
ii. To determine the Peak Ground Acceleration (PGA) for Penang island
iii. To develop the design response spectrum based on various codes of practice.
This cover the site classification for Penang Island, the response spectrum
acceleration (RSA) and the amplification factor (AF).
1.3 Scope of Works
The following scopes of works are needed to be carried out in order to achieve
all the objectives in this study:
i. Earthquake catalogue study area from years1900-2005.
ii. Study area of 90°E to 110°E longitude and 10°S to 10°N latitude, cover
Peninsular Malaysia and Sumatra earthquake zone.
iii. Two attenuation relationships in determining peak ground acceleration (PGA)
are Adnan et al. (2005) for Sumatra subduction and Campbell (2002) for fault
zones.
iv. Due to availability soil data of Penang Island, only east coast area will be
studied.

5
v. Two strong-motion data in establishing response spectra acceleration (RSA)
are El Centro and Mexico Earthquake.
vi. Non-linear Earthquake site Response Analysis (NERA) software will be used for
performing RSA.
vii. Design response spectra will be established based on three different codes,
which are UBC 97, NEHRP 2000 and EN 1998.
1.4 Research Methodology
This study has been conducted in three main phases:
i. Phase 1: Prediction of maximum magnitude, mmax
This phase is important because the input from this phase will correlate with other
phases. In this phase, it involves a collection of earthquake data from the International
Seismological Centre (ISC), United States Geological Survey-National Earthquake
Information Center (USGS-NEIC) and Incorporated Research Institutions for
Seismology (IRIS). The earthquake data was complied from year 1900 until 2005. In
order to complete the first phase, it is important to differentiate the earthquake data
which occurred along the fault and subduction zone.
ii. Phase 2: Peak Ground Acceleration (PGA)
This phase is divided into two sub phases namely subduction and fault zones. The
relationship between parameters in each zones are determined separately to obtain the
PGA before selecting the maximum PGA as the final value. The highest PGA value
(selected as final value) will be used in phase 3.

6
iii. Phase 3: Design Response Spectra
The main objective in this phase is to develop the design response spectra. The design
response spectrum is based on the analysis of response spectrum acceleration (RSA),
amplification factor and also the site classification. To analyze these factors, a lot of
data which collected from the private sectors in Penang Island is required. The strong
motion data which based on El Centro and Mexico earthquake are used as input for the
Nonlinear Earthquake site Response Analyses (NERA) software was used to generate
RSA. Other tool such as ArcView was also used in order to manage the database of
each location of site investigation (S.I) reports in the GIS format.
1.5 Organization of Thesis
The thesis is arranged so that each chapter can be read individually. In addition,
the chapters were organized in a manner that presented information in a logical order.
Some of the data tables, graphs, and other materials were reproduced more than once
for convenience when it was appropriate.
This thesis is divided into five chapters. Chapter 1 introduces the general
background of this study, the objectives and the research methodology. Chapter 2
describes the studies from previous researchers, which are related to the topic.
Chapter 3 covers the methodology, which is about the theoretical background
and the equation used in this study. Results and discussions for each phase will be
presented in Chapter 4. Chapter 5 presents the conclusions and future
recommendations of this study.

7
CHAPTER 2 LITERATURE REVIEW
2.0 Introduction
Seismology engineering covers a very wide scope, whereby it involves plate
tectonics, types of faults, elastic rebound theory, deterministic and probabilistic method
of analysis. This chapter will focus and highlight on specific topic which is relevant on
this research. This literature review is divided into 4 main divisions:-
i. Stage 1: Earthquakes
ii. Stage 2: Sumatran Earthquake
iii. Stage 3: Tectonic setting and earthquake in Malaysia
iv. Stage 4: Seismic Hazard Analysis
The first stage discusses in general about the phenomenal of the earthquake,
the formation of the quake, the tectonic setting that joint world’s plate as well as
earthquake measurement from magnitude and intensity. Flow chart in Figure 2.1 shows
the details of each stage.
Earthquake clusters will also be discussed in detail of the phenomenal when the
earthquakes happen. The data for this research is from the established earthquake
catalogues.
The second stage will discuss about the Sumatra earthquake which occurs on
the subduction and fault zone. This is due to the fact that most of the earthquake
occurs at these zones and it eventually affects Malaysia too, as what happened during
the major tsunami occurred in 2004.

8
Figure 2.1: Flow of literature review
LITERATURE REVIEW
2.0 Introduction
2.1 Earthquakes 2.1.1 Tectonic setting 2.1.2 Measuring Earthquakes 2.1.2.1 Earthquake magnitudes 2.1.2.2 Earthquake intensity 2.1.3 Earthquake clusters 2.1.4 Earthquake catalogs
2.2 Sumatran Earthquakes 2.2.1 Sumatran subduction zone 2.2.2 Sumatran fault zone
2.3 Tectonic setting and earthquakes in Malaysia
2.3.1 Geology in Penang Island
2.4 Seismic Hazard Analysis 2.4.1 Deterministic 2.4.2 Probabilistic 2.4.3 Deterministic-Probabilistic 2.4.4 Peak Ground Acceleration (PGA) 2.4.5 Attenuation
2.4.6 Response Spectrum Acceleration (RSA)
2.4.7 Design Response Spectra
STAGE 1
STAGE 2
STAGE 3
STAGE 4

9
The third stage explains about tectonic and earthquakes which were recorded in
Malaysia. Geology condition of Penang Island will also be discussed as it is covering
the study area for this research.
Lastly, the fourth stage, which is seismic hazard analysis, was the main
objective in this study. It covers both deterministic and probabilistic hazard analysis to
estimate the nature and intensity of possible ground motion at particular site due to
future earthquakes known as response spectrum acceleration (RSA) and hence
development of design response spectra. This phase also reviews about the
attenuation formula in relation to the importance of magnitude, source to site distance
and also local site condition.
2.1 Earthquakes
An earthquake is a phenomenon that results from the release of stored energy
that radiates seismic waves away from the source and travels rapidly through the
earth’s crust (Shedlock and Pakiser, 1997; Kramer, 1996). This based on the elastic
rebound theory that elastic strain energy is stored in the material near the subduction
zone and transforms fault boundaries as shear stress increases on the fault planes that
separate the plates.
Based on shear stress approaching the shear strength of the rock material
along the fault, the rock material begins to fail and releases the stored energy. The
level of the energy depends on how strong and brittle the rock material is (i.e. more
strong and brittle, the stored energy can be high).
The location within a fault where the rupture takes place is called the
hypocenter and the point on the earth’s surface directly above the hypocenter is called
the epicenter, as shown in Figure 2.2 (Kramer, 1996).

10
Figure 2.2: Schematic diagram of notation for description of earthquake location
(Kramer, 1996).
The released energy is transmitted through the earth in the form of many types
of seismic waves. These waves fall into two main categories, namely, body waves and
surface waves, as shown in Figures 2.3 and 2.4. Body waves include primary and
secondary waves (p-waves and s-waves, respectively). The surface wave includes
Rayleigh waves and Love waves. The most destructive component of seismic waves
are Rayleigh waves, since they carry about two third of the energy of an earthquake.
Figure 2.3: Main type of body waves; (a) p-wave, (b) s-wave (Penington, 2006)
direction waves is moving
(a)
(b)
s-wave
p-wave

11
Figure 2.4: Main types of surface waves; (a) Rayleigh wave, (b) Love wave (Penington, 2006)
The passage of these waves causes vibrations of the ground surface that can
be damaging to the built environment (Bommer, 2005). The strength and duration of
shaking at a particular site depends on the size and location of the earthquake and on
characteristics of the site (Kramer, 1996). The term earthquake is used to describe any
seismic event, whether a natural phenomenon or an event caused by humans which
can generate seismic waves, such as the nuclear weapons test by the North Koreans
that can cause an earthquake (Agensi, 2006). United State geological survey (USGS)
reported that, they recorded an earthquake with a magnitude of 4.2 on the Richter
scale at Hwaderi, east coast of North Korea.
Earthquake effects can cover hundreds of thousands of square kilometers,
which can cause damage to structures or infrastructures facilities, result in loss of life
and injury to hundreds of thousands of people, and disrupt the social and economic
functioning of the affected area (Adnan and Hendriyawan, 2005). This is an important
factor to consider for preserving and safeguarding the built environment, which must be
(a)
(b)
Rayleigh wave
direction waves is moving
Love wave

12
seriously addressed by government officials, administrators, planners, and engineers
worldwide (Taly, 2005).
Table 2.1 shows the top ten largest earthquakes in the world since 1900. Off the
West Coast of Northern Sumatra as a reference in this study is the third largest with
magnitude 9.1 (PDE, 2006), where the earthquake was located at longitude of
95.854°E and latitude 3.316°N and the depth of the earthquake was 30 km (USGS,
2004). It is the greatest earthquake in 40 years, when it generated a disastrous tsunami
that caused destruction in 11 countries bordering the Indian Ocean (Pararas-
Carayannis, 2005).
This earthquake has also been called as the largest disaster in the modern
years, created a tsunami that killed 283,100 people from surrounding countries,
including Malaysia with 68 people dead (Adnan and Hendriyawan, 2005). This shows
that Malaysian also confront such disasters which not only originate from our country
but also from countries near by.
Table 2.1: 10 largest earthquakes in the world since 1900 (USGS, 2007)
No. Location
Date Magnitude Coordinates Reference
1 Chile 22/5/1960 9.5 -38.24 -73.05 Kanamori,
1977
2 Prince William Sound, Alaska 28/3/1964 9.2 61.02 -147.65
Kanamori, 1977
3
Off the West Coast of Northern
Sumatra
26/12/2004 9.1 3.3 95.78 PDE, 2006
4 Kamchatka 4/11/1952 9.0 52.76 160.06 Kanamori,
1977
5 Off the Coast of Ecuador 31/1/1906 8.8 1.0 -81.5
Kanamori, 1977
6 Rat Islands, Alaska 4/2/1965 8.7 51.21 178.5
Kanamori, 1977

13
7 Northern Sumatra,
Indonesia
28/3/2005 8.6 2.08 97.01 PDE, 2006
8 Andrean of Island,
Alaska
9/3/1957 8.6 51.56 -175.39 Johnson, 1994
9 Assam, Tibet 15/8/1950 8.6 28.5 96.5 Kanamori,
1977
10 Kuril Islands 13/10/1963 8.5 44.9 149.6 Kanamori,
1977
2.1.1 Tectonic Setting
Plate tectonics, is the theory that the outer shell of the earth is made up of thin,
rigid plates that move relative to each other. Scientists have successfully used it to
explain many geological events, such as earthquakes and volcanic eruptions as well as
mountain building and the formation of the oceans and continents (Coney, 2006).
Figure 2.5 shows the illustrated of the internal structure of the earth. The
descriptions of each part are:
i. Crust - the rigid, rocky outer surface of the Earth composed mostly of basalt and
granite. The crust is thinner under the oceans.
ii. Inner core - the solid iron-nickel center of the Earth that is very hot and under
great pressure.
iii. Mantle - a rocky layer located under the crust - it is composed of silicon,
oxygen, magnesium, iron, aluminum, and calcium. Convection (heat) currents
carry heat from the hot inner mantle to the cooler outer mantle.
iv. Outer core - the molten iron-nickel layer that surrounds the inner core.

14
Figure 2.5: Internal structure of the earth (http://library.thinkquest.org, 2007)
The tectonic plates are made up of Earth’s crust and the upper part of the
mantle layer underneath. Together the crust and upper mantle are called the
lithosphere (solid part of the earth) and they extend about 80 km deep. The lithosphere
is broken into giant plates that fit around the globe like puzzle pieces. These puzzle
pieces move a little bit each year as they slide on top of a somewhat fluid part of the
mantle called the asthenosphere (ductile part of the earth) is about 180 km thick and is
relatively soft.
The basic hypothesis of plate tectonics is that the earth’s surface consists of a
number of large, intact blocks called plates, and that these plates move with respect to
each other (Kramer, 1996). Currently, there are seven large and several small plates.
The largest plates include the Pacific plate, Australian plate, the North American plate,
the Eurasian plate, the Antarctic plate, the South American plate and the African plate.
Smaller plates include the Cocos plate, the Nazca plate, the Caribbean plate, and the
Gorda plate (Figure 2.6). Plate sizes vary a great deal. The Cocos plate is 2000 km

15
(1400 mi) wide, while the Pacific plate is the largest plate at nearly 14,000 km (nearly
9000 mi) wide (Coney, 2006).
Figure 2.6: Tectonic plates on the earth’s surface (http://geology.er.usgs.gov/eastern/plates.html, 2007)
Tectonic plates move relative to a fixed spot in the earth’s mantle and they
move relative to each other. The first type of motion is called absolute motion, and it
can lead to strings of volcanoes. The second kind of motion, called relative motion,
leads to different types of boundaries between plates: plates moving apart from one
another form a divergent boundary, plates moving toward one another form a
convergent boundary, and plates that slide along one another form a transform plate
boundary. In rare instances, three plates may meet in one place, forming a triple
junction. Current plate movement is making the Pacific Ocean smaller, the Atlantic
Ocean larger, and the Himalayan mountains taller.

16
2.1.2 Measuring Earthquakes 2.1.2.1 Earthquake Magnitudes
An earthquake’s magnitude is an objective, quantitative measurement of the
earthquake’s size. Most measurements of an earthquake’s magnitude are based on
some measured characteristic of ground shaking (Kramer, 1996). The Richter Local
Magnitude, ML is the best-known magnitude scale. Is it defined as the logarithm (base
10) of the maximum trace amplitude (in micrometers) recorded on a Wood-Anderson
seismograph located 100 km from the epicenter of the earthquake (Giovinazzi, 2005).
Other magnitude scales that base the magnitude on the amplitude of a
particular wave have been introduced. The surface wave magnitude Ms is based on the
amplitude of Rayleigh waves with a period of about 20 sec (approximately 18 to 20
sec.), therefore Ms only recorded seismic wave released energy at this period (Wells
and Coppersmith, 1994). The value of Ms will describe the depth (less than 70 km focal
depth) and distance (further than 1000 km) of earthquake from moderate to large
earthquake (Kramer, 1996; Giovinazzi, 2005).
The body wave magnitude, mb is a worldwide magnitude scale based on the
amplitude of the first few cycle of p-waves (usually about one second). mb commonly
used to describe for deep-focus earthquakes (more than 70 km focal depth) (Kramer,
1996; Wells and Coppersmith, 1994).
These magnitude measurements (Ms and mb), however cannot be used to
specify the size of any earthquake within the whole range of sizes of earthquakes,
which is considered a more reliable measure of the energy released during an
earthquake (Wells and Coppersmith, 1994). Aware of this limitation, a new magnitude
specification that can be used to measure earthquakes of any size have been

17
proposed, which is called moment magnitude (Mw), which is defined in terms of the
strain energy drop during faulting (Pacheko and Sykes, 1992).
2.1.2.2 Earthquake Intensity
The intensity is a qualitative description of the effects of the earthquake at a
particular point, as evidenced by observed damage on the natural and built
environment and human reactions at that location (Kramer, 1996) and was used before
the actual instrumental measurements of strong ground motion became available.
The earthquake intensity is the oldest measure of the earthquake size and it
remains, nowadays, a universal recognized parameter to provide, immediately after an
earthquake event, an indicator of the overall earthquake damages. The MMI scale was
originally developed by the Italian seismologist Mercalli and modified in 1931 to better
represent conditions in California.
Intensity scales include the Modified Mercalli (MMI), Rossi-Forel (RF), the
Japanese Meteorological Agency (JMA), and the Medvedev-Spoonheuer-Karnik (MSK)
scale, which is based on seismometer measurements.
MMI is one of the many scales used to classify the intensity of an earthquake by
examining its effect on the earth’s surface, humans, objects of nature and man-made
structures.
The Rossi-Forel (RF) scale of intensity, describing intensities with values
ranging from I to X, was developed in the 1880s and used for many years. The JMA
intensity scale is a measure used in Japan and Taiwan to indicate the strength of
earthquakes. Unlike the Richter scale, JMA scale describes the degree of shaking point
on the Earth’s surface.

18
The MSK scale is a microseismic intensity scale used to evaluate the severity of
ground shaking on the basis of observed effects in an area of the earthquake
occurrence. A comparison of the MMI, RF, JMA and MSK scales is shown in Figure
2.7, according to Ricther, Murphy and O’Brien as quoted by Kramer (1996) and
Giovinazzi (2005).
MMI JMA MSK EMS 0 I I I
II II II
III
I
III III
IV II IV IV
V III V V
IV VI VI VI
VII VII VII
VIII
V
VIII VIII
IX IX IX
X VI
X X
XI XI XI
XII VII
XII XII
Figure 2.7: Comparison of intensity values from Modified Mercalli (MMI),
Rossi-Forel (RF), Japanese Meteorological Agency (JMA) and Medvedev-Spoonheuer-Karnik (MSK) scales
(Kramer, 1996; Giovinazzi, 2005).
Earthquake intensities are usually obtained from interviews of observers after
the events. In some seismically active areas, permanent observers are organized and
trained to produce rational and unemotional accounts of ground shaking. Table 2.2
shows the MMI scale, where the qualitative nature of the MMI scale is apparent from
the descriptions of each intensity level. Table 2.2 shows a rough guide to the degree of
the Modified Mercalli Scale, the lower degrees of the MMI scale generally deals with

19
the manner in which the earthquake is felt by people and the highest numbers of the
scale are based on observed structural damage.
Table 2.2: Modified Mercalli Intensity Scale (1956 version) (GeoNet, 2004)
Intensity value Description
I Instrumental No felt except by a very few under especially favorable conditions
II Feeble Felt only by a few persons at rest, especially on upper floors of buildings. Delicately suspended objects may swing.
III Slight Felt quite noticeably by persons indoors, especially on the upper floors of building. Many do not recognize is as an earthquake. Standing motor cars may rock slightly. Vibration similar to the passing of a truck. Duration estimated.
IV Moderate Felt indoors by many, outdoors by few during the day. At night, some awakened. Dishes, windows, door disturbed; walls make cracking sound. Sensation like heavy truck striking building. Standing motor cars rocked noticeably. Dishes and windows rattle.
V Rather strong Felt by nearly everyone; many awakened. Some dishes and windows broken. Unstable objects overturned. Clocks may stop.
VI Strong Felt by all; many frightened and run outdoors, walk unsteadily. Windows, dishes, glassware broken; books off shelves; some heavy furniture moved or overturned; a few instances of fallen plaster. Damage slight.
VII Very strong Difficult to stand; furniture broken; damage negligible in building of good design and construction; slight to moderate in well-built ordinary structures; considerable damage in poorly built or badly designed structures; some chimneys broken. Noticed by persons driving motor cars.
VIII Destructive Damage slight in specially designed structures; considerable in ordinary substantial buildings with partial collapse. Damage great in poorly built structures. Fall of chimneys, factory stacks, columns, monuments, walls. Heavy furniture moved.
IX Ruinous General panic; damage considerable in specially designed structures, well designed frame structures thrown out of plumb. Damage great in substantial buildings, with partial collapse. Buildings shifted off foundations.
X Disastrous Some well built wooden structures destroyed; most masonry and frame structures destroyed with foundation. Rails bent.
XI Very disastrous Few, if any masonry structures remain standing. Bridges destroyed. Rails bent greatly.
XII Catastrophic Total damage - Almost everything is destroyed. Lines of sight and level distorted. Objects thrown into the air. The ground moves in waves or ripples. Large amounts of rock may move.

20
2.1.3 Earthquake clusters
As mentioned by Reasenberg and John (2005) in their reports of seismologists,
earthquakes occur in clusters. Means that, when one earthquake strikes, other
earthquakes will occur at nearby locations. Uhrhammer (1986) stated that, only events
lying in a zone approximately parallel to the fault rupture or surrounding the main
events are considered as a potential foreshock or aftershock.
For example, the Indian Ocean earthquakes (26 December 2004), reported
that, magnitude with 9.1 on the Richter scale have been recorded which made it
necessary for Malaysians to remain alert (Emmanual and Fatt, 2004), and presumed
that the 8.7 magnitude that struck the off northern coast of Indonesia’s Sumatra Island
on Monday, March 28, 2005 to be an aftershock. The aftershocks can occur within a
few hours to a few days after the mainshock (Wells and Coppersmith, 1994).
In this phenomenon, there are three terms namely foreshock, main shock, and
aftershock. The one with the largest magnitude is called the main shock and the
earthquakes that occur before the main shock are called foreshock, while those that
occur after the main shock are called aftershock. Usually, all these clusters of
earthquakes occur near the location of the main shock. A main shock will be redefined
as a fore shock if a subsequent earthquake in the cluster has a larger magnitude. The
fault will produce most of the aftershocks when the stress on the main shock fault
changes drastically during the main shock.
As a rule of thumb, earthquakes can be considered to be aftershocks if they are
located within a characteristic distance from the main shock. The distance is usually
taken to be one or two times the length of the fault rupture associated with the main
shock (Reasenberg and John, 2005).

21
Gardener and Knopoff (1974) notified that any complete earthquake catalogue
is clearly non-Poissonian, which is means that not entirely all earthquake events are
time-independent because any substantial earthquake is usually followed by a cluster
of aftershocks whose occurrence is dependent on the appearance of the main shock.
Thus, a basic assumption of seismic methodology is that earthquake sources are
independent. Therefore, for estimating seismic future activity catalogs that are
prepared must be free of dependent events such as foreshocks and aftershocks. In
probabilistic analyses of seismic hazard, assumes that seismicity follow a Poisson
process, with generally considered essential to remove any non-Poissonian behaviors
from earthquake catalogues.
2.1.4 Earthquake catalogues
Earthquakes catalogues from past earthquakes are used as a rate for future
seismic activity estimation. In the case of estimation of these rates, the seismograph
will detect the felt even it is a small earthquake. From frequency-magnitude distribution
of past earthquakes, frequency of future larger shocks that control the hazard can be
computed (Petersen et al., 2004).
In this hazard assessment, worldwide earthquake catalogues have been used
by all the scientific and engineering communities. Usually geophysicists use these
catalogues for seismicity studies, long-term earthquake prediction and forecasting, and
detailed studies of plate tectonics.
Earthquakes are classified by their size using either a magnitude or intensity
scale (oldest measure of an earthquake’s size), which is evidenced by observed
damage and human reactions at that location after earthquake occur at a particular
location (Kramer, 1996). Seismicity is generally catalogued by a felt intensity scale

22
(Modified Mercalli Intensity), part of the pre-instrumentally period (Pacheko and Sykes,
1992).
2.2 Sumatran Earthquakes Sumatra is part of the Indonesia island arc, has always experienced volcanoes,
earthquakes and fires and well known-known 1,350 km long Sumatra fault system (Pan
and Lee, 2002), which is located adjacent to the Sunda Trench (Figure 2.8), where the
India-Australia plate subducts below the Eurasian plate along this arc at a rate of about
6 cm/yr (Sun and Pan, 1995a; 1995b; Pan and Megawati, 2002).
The most active seismic source in Indonesia is the Sunda Arc, which extends
approximately 5600 km between the Andaman Islands, in the northwest and Banda Arc
to the east (Newcomd and McCann, 1987). The island is a result from convergence
and subduction of the Indo-Australia, Pacific and Eurasian Plate (Kertapati, 1999).
The Sumatra tectonics generates a very high annual rate of earthquakes in and
near the island of Sumatra (Peterson et al., 2004). These make Sumatra one of the
most active seismic zones on earth (Sieh and Natawidjaja, 2001).
Usually, earthquakes at Sumatra occur at the two most active zones, which is
the fault and subduction zones. Numerous earthquakes ranging from magnitude 5 to 9
have occurred historically in both zones (Figure 2.8). These include the 1994 Liwa (Mw
6.9), 1995 Kerinci (Mw 7.0), and 2006 Yogyakarta (6.2). Sometimes, these
earthquakes that occurred at both the zones were felt in many distant, especially
Malaysia.

23
Figure 2.8: Active tectonic and seismologic summary, part of the Sumatra.
(www.gps.caltech.edu) 2.2.1 Sumatran Subduction Zone The Sumatra subduction zones define one of the most active plate tectonic
margins in the world (Figure 2.9), accommodating about 49 mm/year of oblique north-
westward convergence between the Eurasian and India-Australia plates (Peterson,
2004).
Subduction zones are found where one plate overrides, or subducts, another,
pushing it downward into the mantle where it melts (Shedlock and Pakiser, 1997). This

24
zones vary dramatically in their ability to store elastic strain energy such variation has
been explained by different in convergence rates and subducting plate ages and others
(Prawirodirdjo, 1997). This energy whether is small or strong earthquakes, is of great
significance for human society and for engineering design and corresponding codes as
well (Jeng et al., 2002)
In fact, the 10 largest earthquakes since 1900 have occurred at subduction
zones (www.rpi.edu). Those entire earthquakes occurred near convergent boundaries
where Indo-Australian plates are subducting beneath under Eurasian plate (Figure 2.9)
(Zachariasen et al., 1999), whereby the Indian plate is sliding approximately northward
beneath Sumatra and Java, with the direction of convergence is N20°E and the overall
rate convergence is 7 cm/yr (Adnan et al., 2005).