development of a surface water exposure module for the ... of herbicide loads during run-off or...
TRANSCRIPT
J.M. Hollis. Specialist, Pesticide Environmental Fate. 58, St. Annes Rd., London Colney, St.Albans, Herts. AL2 1LJ, UK
Tel: 01727 823810 E-mail: [email protected]
Development of a Surface Water Exposure Module
for the HardSPEC Railway Scenario
by
J.M. Hollis
May 2010
Report for the Hard Surfaces Steering Committee

1
Foreword
Opinions expressed within this note are those of the author and do not necessarily reflect the
opinions of the sponsoring organisation. No comment within this report should be taken as an
endorsement or criticism of any herbicide compound or product.
Reference to this report should be made as follows:
HOLLIS, J.M. (2010). Development of a Surface Water Exposure Module for the HardSPEC
Railway Scenario. Report for the Hard Surfaces steering committee. 38 pp plus 1 Appendix
Development of a Surface Water Exposure Module for the HardSPEC Railway Scenario. May 2010
2
SUMMARY
The HardSPEC model v 1.2.1 is recommended by the UK Chemicals Regulations Directorate for use
in calculating first-tier Predicted Environmental Concentrations (PEC‟s) in surface and groundwater
resulting from a proposed use of herbicides on hard surface environments. However, no methods for
calculating PEC‟s in surface water bodies associated with railways are incorporated into this model
and this has been identified as a significant limitation with respect to regulatory concerns relating to
herbicides where the proposed non-agricultural use is limited to railway networks.
This report describes the development and characteristics of a new module within HardSPEC that can
be used to calculate Surface Water PEC‟s in a small ditch adjacent to the double railway track similar
to that used in the HardSPEC Groundwater scenario. The module addresses exposure resulting from
spray drift, run-off and leaching through the railway ballast formation.
An identified realistic worst-case surface water body is the relatively static, small 1 metre wide ditch
defined for the FOCUS surface water scenarios (Linders et al, 2003). Such a surface water body is
only likely to be present in low-lying situations where it is hydro-dynamically connected to a shallow
groundwater body and water movement in the ditch is primarily groundwater flow. In such situations,
any railways present are carried on embankments and such ditches thus usually lie alongside that
embankment. The methodologies developed to characterise this situation cover losses from spray
drift (based on measured data), both as a result of application from a „spray train‟ mounted with the
„Radiarc‟ nozzle system (now used as a matter of routine by „Network Rail‟), and as an ad hoc
localised application from a hand-held sprayer along the edge of the track. They also cover losses
from any leaching and run-off that may occur following percolation of the applied herbicide through
the railway formation. The module that has been developed incorporates the following realistic
worst-case characteristics related to various components of the scenario.
Significant rainfall (5mm) occurs on the day after application.
A 75th percentile wettest spring rainfall sequence follows application.
There is a maximum spray target area for leaching and run-off simulation because both „up‟ and
„down‟ sets of tracks are sprayed.
There is a large spray target area for local hand-held application: A 1m wide swath.
As a first tier assessment it is assumed that herbicide is applied to 100% of the target area.
Drift from the spray train is based on the worst-case wind direction which is in the same direction
as that of the sideways pointing nozzles nearest to the ditch.
The amount of drift from the spray train is based on experimental data and an absolute worst-case
wind speed of 12 miles hr-1
derived from recommendations in the code of practice for using plant
protection products (Defra, 2006).

Development of a Surface Water Exposure Module for the HardSPEC Railway Scenario. May 2010
3
The 90th percentile largest losses for most ground applied sprays (2.8 %) from the FOCUS_SW
EU drift calculator are used to calculate spray drift from local hand-held applications (and from
„down track‟ drift losses from the spray train).
88% of the loads leaching out of the railway formation contribute to run-off to surface water.
As a first tier assessment it is assumed that there is no attenuation of herbicide loads during run-
off to the surface water body.
There is no attenuation of loads leached out the railway formation during transport in the
unsaturated zone.
Transport in the saturated zone only considers attenuation from partitioning and longitudinal
dispersion.
The surface water body is a small 1m wide ditch directly next to the railway embankment and with
characteristics similar to those of the FOCUSsw ditch.
Fate dynamics in the ditch are similar to those used in the „STEPS1-2 in FOCUS‟ exposure
assessment, except that all of the previous day‟s residual aqueous phase mass is lost through
groundwater flow out of the ditch because the water body is not static.
The developed railway surface water exposure module has been incorporated into a modified version
of the HardSPEC model, version 1.3.4.
Absolute worst case assumptions of 100% of the track target area receiving spray application and no
attenuation of herbicide loads during run-off or unsaturated zone leaching are included as default
input parameters. Simulations based on such parameters should be considered as first-tier
exposure assessments. However, the parameters can be changed by users to less extreme values,
providing such a change is based on a justified argument. Such modified simulations can be
considered as second tier exposure assessments as they incorporate more realistic assumptions for
these two default parameters but retain the remaining identified worst-case characteristics of the
rainfall patterns, railway track formation, its embankment and associated water body.
Simulated daily PECsw in the Railway ditch for six „test compounds‟ showed that, with the exception
of weakly sorbed compounds such as atrazine and diuron, peak daily aqueous phase PECs in the
railway ditch are the result of spray drift on the day of application. This contrasts with the HardSPEC
stream scenarios where only the most strongly sorbed compounds oxadiazon and glyphosate have
peak daily aqueous phase concentrations resulting from spray drift.
For the most mobile compounds, atrazine and diuron, exposure patterns in the railway ditch are very
different for the leaching and run-off situations and in general, from the day after application, run-off
gives slightly higher concentration peaks than leaching. However, such differences decrease
significantly with increasing compound sorption and, for the least mobile compounds, oxadiazon and

Development of a Surface Water Exposure Module for the HardSPEC Railway Scenario. May 2010
4
glyphosate, leaching and run-off inputs are so small that daily aqueous phase concentrations depend
almost entirely on residual masses from spray drift inputs on the day of application.
Comparison of model predictions with measured data is difficult because of the limited amount of
measured data available and significant differences in the dynamics of the water bodies simulated by
the model and sampled in the field study. . Nevertheless, the limited comparisons possible indicate
that when the railway scenario is adapted to match the application conditions of the field study, the
predicted peak concentrations leaching out of the railway ballast are similar to those measured in the
water sampled from ballast trenches in the field study. When the model results are modified to match
the timing of the measured peak and integrated using 3 day running average values to try to better
reflect the study conditions, they show a very similar pattern in concentrations to that measured,
although concentrations after about 42 mm accumulated rainfall appear to be under-predicted.

Development of a Surface Water Exposure Module for the HardSPEC Railway Scenario. May 2010
5
Contents
FOREWORD ........................................................................................................................................................ 1
SUMMARY ........................................................................................................................................................... 2
1 INTRODUCTION ........................................................................................................................................ 6
2 METHODS FOR CALCULATING PECSW RESULTING FROM SPRAY DRIFT, RUN-OFF AND
LEACHING FOLLOWING HERBICIDE APPLICATION TO A RAILWAY .................................... 7
2.1 IDENTIFICATION OF THE SURFACE WATER BODY ........................................................................................ 7 2.2 SPRAY DRIFT ............................................................................................................................................. 9
2.2.1 Application from a ‘spray train’ mounted with the ‘Radiarc’ nozzle system. .................................. 9 2.2.2 Localised application by a hand-held sprayer along the edge of the railway track nearest to the
surface water body. ........................................................................................................................ 17 2.2.3 Fate in the surface water body ....................................................................................................... 18
2.3 RUN-OFF .................................................................................................................................................. 18 2.3.1 Run-off simulation .......................................................................................................................... 19 2.3.2 Fate in the surface water body ....................................................................................................... 20
2.4 LEACHING ............................................................................................................................................... 21 2.4.1 Herbicide application, interception by plants and spray drift ....................................................... 21 2.4.2 Leaching through the railway formation ....................................................................................... 22 2.4.3 Transport through the railway embankment .................................................................................. 22 2.4.4 Transport in the saturated zone ..................................................................................................... 22 2.4.5 Calculation of total loadings flowing into the ditch ....................................................................... 23 2.4.6 Fate in the surface water body ....................................................................................................... 23
2.5 SUMMARY OF „WORST-CASE‟ ASSUMPTIONS IN THE METHODOLOGY ....................................................... 24 2.5.1 Rainfall patterns ............................................................................................................................. 24 2.5.2 Herbicide application .................................................................................................................... 24 2.5.3 Spray drift ...................................................................................................................................... 24 2.5.4 Run-off ........................................................................................................................................... 24 2.5.5 Leaching ......................................................................................................................................... 24 2.5.6 Fate in the surface water body ....................................................................................................... 24
3 ADAPTION OF THE HARDSPEC MODEL (V. 1.2.1) TO INCORPORATE THE NEWLY
DEVELOPED RAILWAY SURFACE WATER EXPOSURE MODULE. .......................................... 25
3.1 WORKSHEET “HERB_PROPS”................................................................................................................... 25 3.2 WORKSHEET “OUTPUT” ........................................................................................................................ 26 3.3 WORKSHEET “RAILWAY_SCENARIO” ...................................................................................................... 27 3.4 WORKSHEET “LOSSES_BR” .................................................................................................................... 27 3.5 NEW WORKSHEET “RAILWAY_SURFACE_WATER” .................................................................................. 27 3.6 WORKSHEET “LOSSES_AR” .................................................................................................................... 28
4 EVALUATION OF RESULTS FROM THE NEW RAILWAY SURFACE WATER MODULE ...... 29
4.1 COMPARISON OF PECSW SIMULATIONS USING THE NEW RAILWAY MODULE WITH OTHER HARDSPEC
SURFACE WATER MODULES ...................................................................................................................... 29 4.2 COMPARISON OF THE SURFACE WATER MODULE RESULTS WITH MEASURED DATA .................................. 30
5 CONCLUSIONS ......................................................................................................................................... 38
6 REFERENCES ........................................................................................................................................... 40
APPENDIX 1....................................................................................................................................................... 41

Development of a Surface Water Exposure Module for the HardSPEC Railway Scenario. May 2010
6
1 INTRODUCTION
The HardSPEC model (Hollis et al, 2004) is now recommended by the UK Chemicals Regulations
Directorate for use in calculating first-tier Predicted Environmental Concentrations (PEC‟s) in
surface and groundwater resulting from a proposed use of herbicides on hard surface environments.
The model produces relevant aquatic PEC‟s for four exposure scenarios:
1. A surface water stream receiving surface drainage from a major road in a rural setting where the
hard surface areas drain via gully pots. The stream also receives drainage from an adjacent 1ha
agricultural field.
2. A surface water stream receiving surface drainage from an urban catchment within which the hard
surface areas drain via gully pots.
3. A pond receiving surface drainage waters from an urban catchment within which the hard surface
areas drain via gully pots. This scenario is intended to be similar to the use of collecting ponds
within Sustainable Urban Drainage Systems (SUDS).
4. The abstraction point of a local groundwater body that receives herbicide leached from a double
railway track which crosses the groundwater catchment.
The model thus does not include any scenario that is used to calculate PEC‟s in a surface water body
receiving drainage from a railway track to which herbicides may be applied. The Hard Surfaces
Steering Committee has identified this as a significant limitation of the model with respect to
regulatory concerns relating to herbicides where the proposed non-agricultural use is limited to
railway networks.
This report describes the development and characteristics of a new module within HardSPEC that can
be used to calculate Surface Water PEC‟s in a small ditch adjacent to the double railway track similar
to that used in the HardSPEC Groundwater scenario. The module addresses exposure resulting from
spray drift, run-off and leaching through the railway embankment.

Development of a Surface Water Exposure Module for the HardSPEC Railway Scenario. May 2010
7
2 METHODS FOR CALCULATING PECSW RESULTING FROM SPRAY DRIFT, RUN-
OFF AND LEACHING FOLLOWING HERBICIDE APPLICATION TO A RAILWAY
In the following sections, separate methods are developed to address specific routes of herbicide loss
to surface water bodies associated with a railway. Firstly however, it is necessary to identify the most
realistic type of surface water body associated with a railway and define its characteristics.
2.1 Identification of the surface water body
In order to create a realistic worst-case situation, the surface water body associated with the railway
scenario should be relatively static and based on the small 1 metre wide ditch defined for the FOCUS
surface water scenarios (Linders et al, 2003). Such a surface water body is only likely to be present
in low-lying situations such as occur in the Fens, Humber/Trent basin or the Vale of York. It is
hydro-dynamically connected to a shallow groundwater body and water movement in the ditch is
primarily groundwater flow. In such situations, any railways present are carried on embankments and
such ditches thus usually lie alongside that embankment.
Having identified the realistic worst-case type of surface water body associated with a railway, its
characteristics and that of the associated railway are defined as follows:
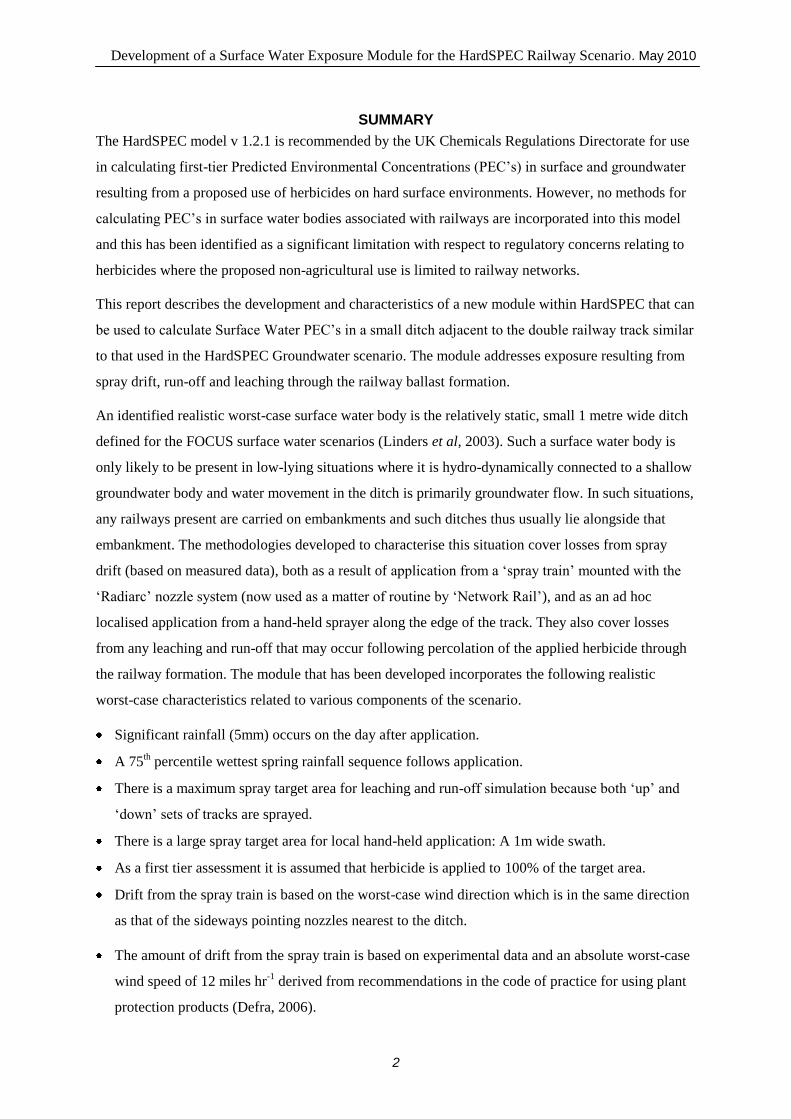
1. The embankment carries a dual track railway line. Individual lines in each „standard gauge‟ rail
track are 4ft 8.5 inches (1.435 m) apart and each set of tracks is 6 ft (1.829 m) apart. The width of
the „cess‟ from the edge of each embankment to the first rail line is 5ft (1.524 m). This gives a
total width of the ballast surface of almost 7.75m.
2. The embankment is 5m high. A realistic slope for the angle of each side of the embankment is 60o,
which means that the horizontal distance from the edge of the top of the embankment to the base
of the embankment is 2.9m.
3. The embankment beneath the railway lines comprises a 0.6 m thick layer of railway ballast over a
0.3 m thick layer of artificial sandy „formation‟ material over 4.1 m of embankment material of
unspecified composition. The thickness and constituents of the railway ballast and underlying
„formation‟ are exactly as in the current HardSPEC Railway Groundwater Scenario (see
HardSPEC worksheet “Railway_scenario”).
4. The dimensions and characteristics of the surface water ditch adjacent to the embankment are
exactly the same as for the FOCUS Surface Water ditch scenario (Linders et al, 2003):
Length: 100m; Width: 1m; Water depth: 30cm; Sediment org. carbon content: 5%
Sediment bulk density: 0.8 gm cm-3
…Effective sediment depth for partitioning: 1cm;
Development of a Surface Water Exposure Module for the HardSPEC Railway Scenario. May 2010
8
5. Water flow in the ditch is controlled principally by flow in the groundwater body which is slow,
1m day-1
and at right angles to the railway line and embankment.
A plan of this basic situation is shown in Figure 2.1-1 and a cross section of the railway, its
embankment, ditch and associated groundwater body is shown in Figure 2.1-2.
Figure 2.1-1 Plan view of the idealised railway surface water catchment
Direction of groundwater flow
10
0 m
Groundwater
Bodye
mb
an
km
en
t
em
ba
nk
me
nt
Du
al
railw
ay t
rack
on
ba
llas
t
Dit
ch
1m
wid
e
2.9 m wide
embankment sides
7.75 m
Direction of groundwater flow
10
0 m
Groundwater
Bodye
mb
an
km
en
t
em
ba
nk
me
nt
Du
al
railw
ay t
rack
on
ba
llas
t
Dit
ch
1m
wid
e
Direction of groundwater flow
10
0 m
Groundwater
Bodye
mb
an
km
en
t
em
ba
nk
me
nt
Du
al
railw
ay t
rack
on
ba
llas
t
Dit
ch
1m
wid
e
Direction of groundwater flowDirection of groundwater flow
10
0 m
Groundwater
Bodye
mb
an
km
en
t
em
ba
nk
me
nt
Du
al
railw
ay t
rack
on
ba
llas
t
Dit
ch
1m
wid
e
em
ba
nk
me
nt
em
ba
nk
me
nt
Du
al
railw
ay t
rack
on
ba
llas
t
Dit
ch
1m
wid
e
2.9 m wide
embankment sides
7.75 m
2.9 m wide
embankment sides
7.75 m
2.9 m wide
embankment sides
7.75 m

Development of a Surface Water Exposure Module for the HardSPEC Railway Scenario. May 2010
9
Figure 2.1-2 Cross section of the idealised railway surface water catchment
2.2 Spray Drift
The issue of spray drift associated with herbicide application to railways is a difficult one because
little data exists on direct inputs from this source. Clearly, the amount of spray drift to the surface
water body depends on the method of application and the amount of railway track surface to which
herbicide is applied. Two methods are considered here:
2.2.1 Application from a ‘spray train’ mounted with the ‘Radiarc’ nozzle system.
This system was developed by J.S.D Research and Development Ltd. and is now used as a matter of
routine by the company „Network Rail‟, who are responsible for maintaining track in the UK.
When using the spray train, operators have confirmed that, in some circumstances, especially on
branch lines, both the „up‟ track and „down‟ track may be sprayed on the same day. Even on some
main lines, both „up‟ and „down lines may be sprayed within one or two days of each other. The spray
width covered by each pass of the train comprises the width of the railway track (4 ft 8.5 inches) plus
the ballast area from the edge of the track to the embankment edge (the „cess‟ area: 5ft) plus half the
distance between the two tracks (6ft / 2), giving a total spray width of 12ft 8.5 inches, equating to
3.8735 m. A realistic worst case assumption for the scenario is thus that both sets of tracks are treated
and the total application area for the spray train scenario is thus 774.7 m2 (100m length of track x
3.8735m width x 2). This situation is illustrated in Figure 2.2-1.
Surface water
ditch
Railway ballast
Railway tracks
Sandy railway „formation‟
Embankment
1 m
Direction of groundwater flow
4 m
2.9 m
7.75 m
1 m

Development of a Surface Water Exposure Module for the HardSPEC Railway Scenario. May 2010
10
Figure 2.2-1 Illustration of spray application for the Railway surface water scenario
However, the Radiarc spray system is fitted with a „magic eye‟ technology designed to significantly
reduce the area to which spray is applied. In such cases it may be acceptable to reduce the effective
application rate (g ha-1
) but, for regulatory applications, such reductions must be supported with
data that shows the effective application rate over a 100 m length of rack.
The advantage of using the spray train as the main application method is that, in addition to it being
the most common form of application to railway tracks, there is measured data available on which to
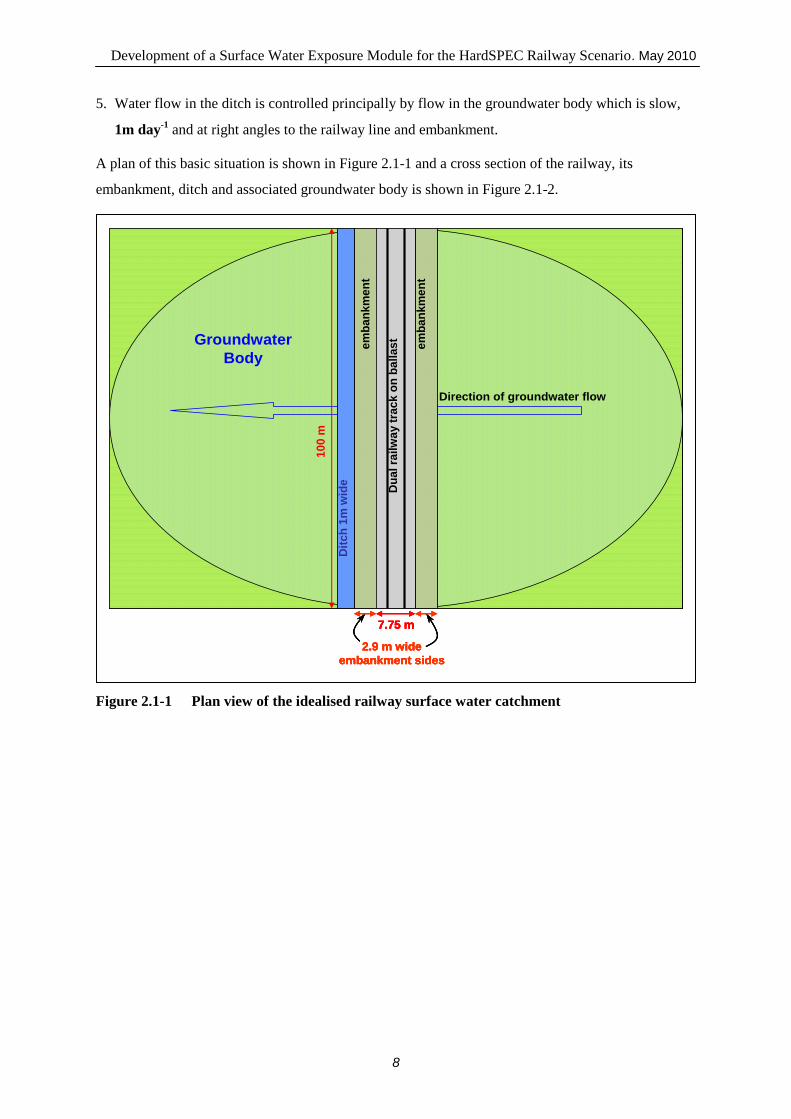
base simulations of drift losses. The Radiarc application technology on the spray train effectively
reduces spray drift and to demonstrate this J.S.D Research and Development Ltd and Network Rail
commissioned research to investigate the amount of drift associated with its use (Parkin & Miller,
2004). The spray system is illustrated in figure 2.2-2.
1.435 m wide
1.524 m wide
0.914 m wide
100 m
Ditch 1m wide
embankment
Spray train on
„down‟ line
Spray train
on „up‟ line
Spray train
application area
embankment
1.435 m wide
1.524 m wide
0.914 m wide
100 m
Ditch 1m wide
embankment
Spray train on
„down‟ line
Spray train
on „up‟ line
Spray train
application area
1.435 m wide
1.524 m wide
0.914 m wide
1.435 m wide
1.524 m wide
0.914 m wide
100 m
Ditch 1m wide
embankment
Spray train on
„down‟ line
Spray train
on „up‟ line
Spray train
application area
100 m
Ditch 1m wide
embankment
Spray train on
„down‟ line
Spray train
on „up‟ line
100 m
Ditch 1m wide
embankment
Spray train on
„down‟ line
100 m
Ditch 1m wide
embankment
Spray train on
„down‟ line
Spray train
on „up‟ line
Spray train
application area
Spray train
application area
embankment
Development of a Surface Water Exposure Module for the HardSPEC Railway Scenario. May 2010
11
Figure 2.2-2 Illustration of the Radiarc nozzle application technology used on the Network
Rail spray train.
This shows that there are two different components of the spray: A vertical spray component directed
downwards onto the „4 foot‟ track area; A „sideways‟ component directed at an angle from the side of
the train in order to treat the cess area of ballast at the side of the track or half of the ballast area
between the „up‟ and „down‟ tracks. The commissioned research investigated spray drift from both
these spray components, using a wind tunnel in which the „sideways‟ component of the spray was
directed in the same direction as the wind. Results from this latter component (called the „cess
configuration‟) relate to drift from the spray directed towards the cess area of track whereas results
from the vertical component (called the „4 foot configuration‟) relate to drift from the spray directly
down onto the track area. In summary, the experiment produced duplicate measurements of the %
drift at three different down wind distances (2, 4 and 19 m) and three different wind speeds (12.2,
18.1 and 24.3 miles hr-1
). Percentage loss from spray drift is dependent on both wind speed and
downwind distance and for the purposes of scenario development it is thus necessary to derive a
realistic worst case situation for both these variables.
Realistic worst-case wind speed
Downward
spray onto the
„4 ft‟ track
Sideways spray
onto the „5 ft‟
cess area

Development of a Surface Water Exposure Module for the HardSPEC Railway Scenario. May 2010
12
The „Code of Practice for using plant protection products‟ (Defra, 2006) recommends (table 6, page
90) that spraying should not take place if there is a force 4 wind (Beaufort scale) and that, if possible
spraying of herbicides should be avoided if there is a force 3 wind. The spray train operators confirm
that they adhere to this code of practice and thus these wind speeds impose an upper limit on the
realistic worst-case wind speed for the scenario. According to the code of practice, Force 3 wind
relates to speeds of 4 to 6 miles hr-1
at the height of the spray nozzles assuming there is a crop
covering the ground. If there is no crop or grass cover, the wind speed at the height of the spray
nozzles will be higher and this will be the case for the spray train applications. The height of the
spray train nozzles above the track is 0.8 m and this was also the height of the nozzle used in the
experimental study. However, the scenario embankment is 5m above ground level and thus the total
height above ground for the spray train nozzles is 5.8 m. Using the Beaufort scale, force 3 wind
speeds at a height of 10 m above the ground range from 8 to 12 miles hr-1
. Given the uncertainty
related to operator‟s estimation of wind forces and the variability of wind over short periods during
application, it is likely that there will be occasions when spraying takes place at the upper range of
force 3 winds which, at a height above ground of 5.8 m will be somewhere between 6 and 12 miles
hr-1
. The latter wind speed is virtually the same as one of the wind speeds for which experimental
drift data is available and the ability to use this data, combined with the uncertainty related to wind
speed, supports the selection of a worst-case wind speed of 12 miles hr-1
for the scenario. It is
important to recognise that this is an absolute worst case for wind speed during spraying as it
represents a value at the uppermost limit of force 3 on the Beaufort scale and, to take into account
operators uncertainty in estimating wind speed, is the speed at a height of 10m whereas the actual
wind speed at the spray train nozzle height of 5.8 m will be significantly lower than this.
Realistic worst-case drift distances
The measured data for spray drift (Parkin & Miller, 2004) represents a „worst case‟ situation with
respect to wind direction which is at right angles to the direction of travel of the train and in the same
direction as the spray component directed sideways onto the cess nearest to the railway ditch (during
the „up‟ track pass of the train) or sideways onto the central half of the ballast surface between the
two tracks (during the „down‟ track pass of the train). Similarly, it represents a worst case situation
for the „4 foot‟ spray component directed downwards onto the track during both the „up‟ and „down‟
track passes of the train. However, for the spray components directed sideways onto the central half
of the ballast surface between the two tracks (during the „up‟ track pass of the train) and sideways
onto the cess furthest from the railway ditch (during the „down‟ track pass of the train), the wind
direction is directly against the direction of spray and will thus counteract the direction of spray,
significantly reducing the amount of drift (see figure 2.2-5 below).

Development of a Surface Water Exposure Module for the HardSPEC Railway Scenario. May 2010
13
In order to simplify this situation for calculation purposes, the different components of spray from the
train have been separated into six sections, each of which has a defined target area of spray and
distance from the spray nozzle to the edge of the water body. These target areas and distances were
calculated as follows
Spray section 1.
The target area is that for the nozzles mounted at the edge of the „up‟ train and directed sideways
towards the cess area nearest to the ditch. The width of the target area is thus the distance from the
edge of the train to the edge of the cess area nearest to the ditch. The train is 2.6 m wide, which, for
most lines, is the maximum allowable size for rolling stock to allow clearance under bridges and
between tracks (the „loading gauge‟) ,and the track is 1.4351 m wide so the „overhang‟ of each side of
the train beyond the rail edge is:
[2.6 – 1.4351] / 2 = 0.58245 m
The width of the target area is thus: 1.524 – 0.58245 = 0.94155 m
and the target spray area is 100 x 0.94155 = 94.155 m2
The distance from the spray nozzle to the edge of the surface water body is:
2.9 (the width of the embankment) + 0.94155 = 3.84155 m
Spray section 2.
The target area is that for the nozzles mounted below the „up‟ train and pointed directly downwards
onto the „up‟ track area. The width of the target area is thus the width of the train and the spray
section area is:
100 x 2.6 = 260 m2
The distance from the spray nozzle to the edge of the surface water body obviously varies as nozzles
are located at different points underneath the train. However, to simplify the calculations a single
point in the centre of the train is used because this represents an average of the distances of each
spray nozzles underneath the train. The travel distance for this spray section is thus:
2.9 + 0.94155 + [2.6 / 2] = 5.1455 m
Spray section 3.
The target area is that for the nozzles mounted at the edge of the „up‟ train and directed sideways
towards the ballast surface between the „up‟ and „down‟ tracks. The width of the target area is thus
half the distance between the tracks minus the „overhang‟ of the side of the train beyond the far rail
edge of the „up‟ track:
0.914 - 0.58245 = 0.33195 m, so the target spray area is:
100 x 0.33195 = 33.195 m2
And the distance from the spray nozzles to the edge of the water body is:

Development of a Surface Water Exposure Module for the HardSPEC Railway Scenario. May 2010
14
2.9 + 0.94155 + 2.6 = 6.44155 m
Spray section 4.
The target area is that for the nozzles mounted at the edge of the „down‟ train and directed sideways
towards the ballast surface between the „down‟ and „up‟ tracks. The width of the target area is thus
half the distance between the tracks minus the „overhang‟ of the side of the train beyond the far rail
edge of the „down‟ track:
[1.8288 / 2] - 0.58245 = 0.33195 m, so the target spray area is:
100 x 0.33195 = 33.195 m2
And the distance from the spray nozzles to the edge of the water body is:
2.9 + 1.524 + 1.4351 + [1.8288 - 0.58245] = 7.10545 m
Spray section 5.
The target area is that for the nozzles mounted below the „down‟ train and pointed directly
downwards onto the „down‟ track area. The width of the target area is thus the width of the train and
the spray section area is:
100 x 2.6 = 260 m2
As with spray section 2, a single point in the centre of the train is used to calculate the spray travel
distance because it represents an average of the distances of each spray nozzles underneath the train.
The travel distance for this spray section is thus:
2.9 + 1.524 + 1.4351 + 1.8288 + [1.4351/2] = 8.40545 m
Spray section 6.
The target area is that for the nozzles mounted at the edge of the „down‟ train and directed sideways
towards the cess area furthest from the ditch. The width of the target area is thus the same as that for
spray section 1: 94.155 m2
However the spray travel distance is:
2.9 + 1.524 + 1.4351 + 1.8288 + 1.4351 + 0.58245 = 9.70545 m
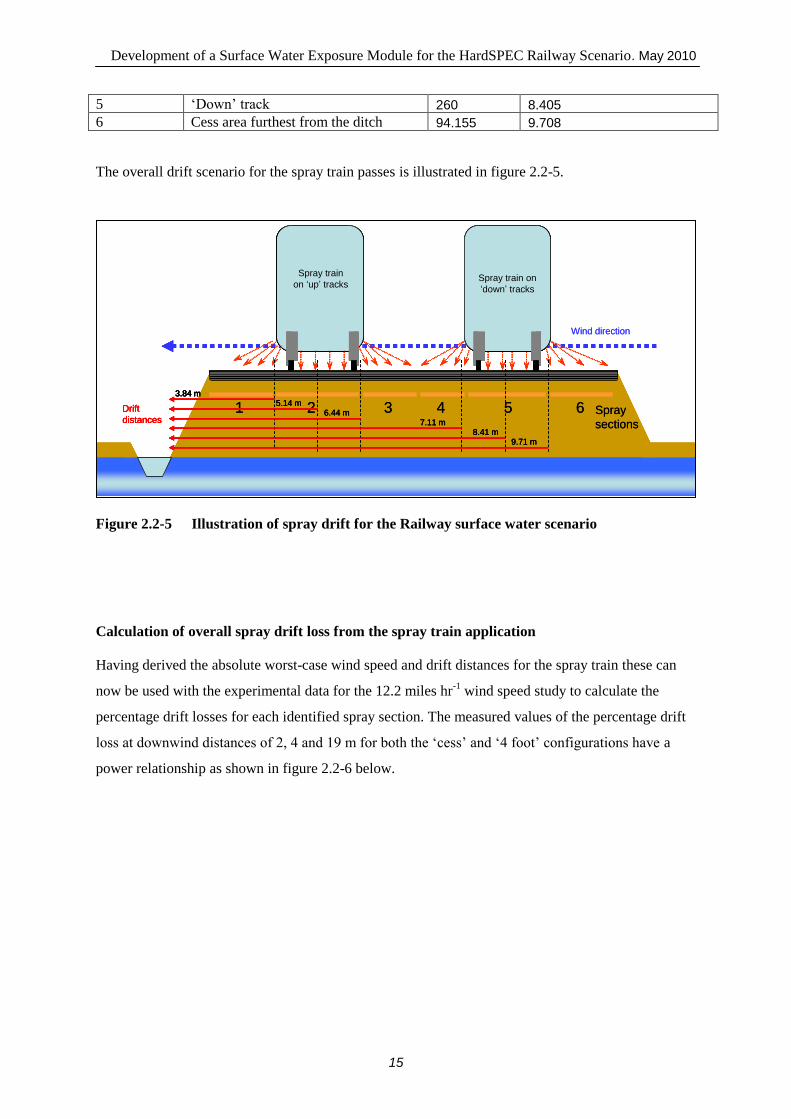
The critical parameters derived from these calculations and used to calculate overall spray drift from
the train are summarized in table 2.2-2.
Table 2.2-2 Spray sections, target areas and distances from spray nozzle to edge of the ditch for the
spray train application.
Spray section
number Description
Spray target
area (m2)
Distance (m) from the spray
nozzle to the edge of the ditch
1 Cess area nearest to the ditch 94.155 3.842
2 „Up track 260 5.142
3 Half of the section between the tracks 33.195 6.442
4 Half of the section between the tracks 33.195 7.105
Development of a Surface Water Exposure Module for the HardSPEC Railway Scenario. May 2010
15
5 „Down‟ track 260 8.405
6 Cess area furthest from the ditch 94.155 9.708
The overall drift scenario for the spray train passes is illustrated in figure 2.2-5.
Figure 2.2-5 Illustration of spray drift for the Railway surface water scenario
Calculation of overall spray drift loss from the spray train application
Having derived the absolute worst-case wind speed and drift distances for the spray train these can
now be used with the experimental data for the 12.2 miles hr-1
wind speed study to calculate the
percentage drift losses for each identified spray section. The measured values of the percentage drift
loss at downwind distances of 2, 4 and 19 m for both the „cess‟ and „4 foot‟ configurations have a
power relationship as shown in figure 2.2-6 below.
Spray
sections
1 2 43 65
Spray train
on ‘up’ tracksSpray train on
‘down’ tracks
3.84 m5.14 m
6.44 m7.11 m
8.41 m9.71 m
Drift
distances
Wind direction
Spray
sections
1 2 43 65
Spray train
on ‘up’ tracksSpray train on
‘down’ tracks
3.84 m5.14 m
6.44 m7.11 m
8.41 m9.71 m
Drift
distancesSpray
sections
1 2 43 65
Spray train
on ‘up’ tracksSpray train on
‘down’ tracks
Spray
sections
1 2 43 65
Spray train
on ‘up’ tracksSpray train on
‘down’ tracks
Spray
sections
1 2 43 65 Spray
sections
1 2 43 65
Spray train
on ‘up’ tracksSpray train on
‘down’ tracks
Spray train
on ‘up’ tracksSpray train on
‘down’ tracks
3.84 m5.14 m
6.44 m7.11 m
8.41 m9.71 m
Drift
distances
3.84 m5.14 m
6.44 m7.11 m
8.41 m9.71 m
3.84 m5.14 m
6.44 m7.11 m
8.41 m9.71 m
Drift
distances
Wind direction

Development of a Surface Water Exposure Module for the HardSPEC Railway Scenario. May 2010
16
Cess configuration y = 3.1314x-1.404
R2 = 0.9989
0
0.2
0.4
0.6
0.8
1
1.2
1.4
0 2 4 6 8 10 12 14 16 18 20
Distance down wind (m)
Mean
perc
en
tag
e l
oss
4 foot configuration y = 0.5424x-1.3427
R2 = 0.9959
0
0.05
0.1
0.15
0.2
0.25
0 2 4 6 8 10 12 14 16 18 20
Distance downwind (m)
Mean
perc
en
tag
e l
oss
Figure 2.2-6 Relationships between down wind distance and percentage loss for the cess and 4
foot configurations and a wind speed of 12.2 miles hr-1
Development of a Surface Water Exposure Module for the HardSPEC Railway Scenario. May 2010
17
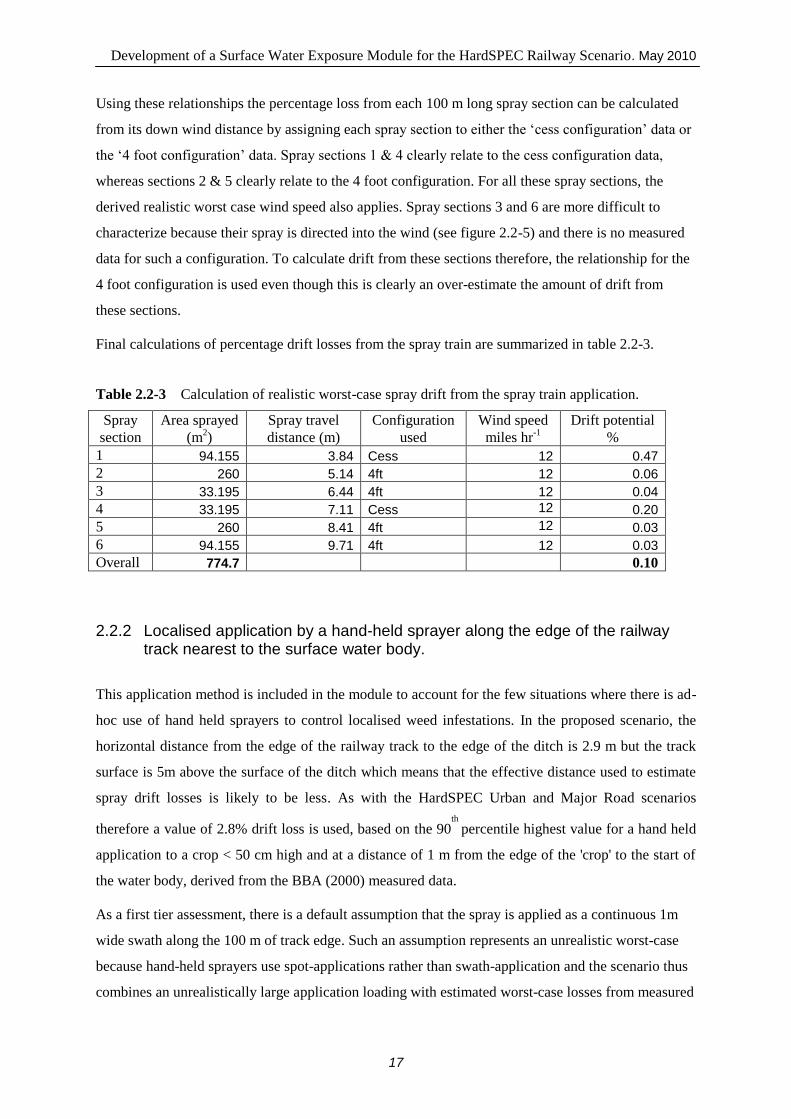
Using these relationships the percentage loss from each 100 m long spray section can be calculated
from its down wind distance by assigning each spray section to either the „cess configuration‟ data or
the „4 foot configuration‟ data. Spray sections 1 & 4 clearly relate to the cess configuration data,
whereas sections 2 & 5 clearly relate to the 4 foot configuration. For all these spray sections, the
derived realistic worst case wind speed also applies. Spray sections 3 and 6 are more difficult to
characterize because their spray is directed into the wind (see figure 2.2-5) and there is no measured
data for such a configuration. To calculate drift from these sections therefore, the relationship for the
4 foot configuration is used even though this is clearly an over-estimate the amount of drift from
these sections.
Final calculations of percentage drift losses from the spray train are summarized in table 2.2-3.
Table 2.2-3 Calculation of realistic worst-case spray drift from the spray train application.
Spray
section
Area sprayed
(m2)
Spray travel
distance (m)
Configuration
used
Wind speed
miles hr-1
Drift potential
%
1 94.155 3.84 Cess 12 0.47
2 260 5.14 4ft 12 0.06
3 33.195 6.44 4ft 12 0.04
4 33.195 7.11 Cess 12 0.20
5 260 8.41 4ft 12 0.03
6 94.155 9.71 4ft 12 0.03
Overall 774.7 0.10
2.2.2 Localised application by a hand-held sprayer along the edge of the railway track nearest to the surface water body.
This application method is included in the module to account for the few situations where there is ad-
hoc use of hand held sprayers to control localised weed infestations. In the proposed scenario, the
horizontal distance from the edge of the railway track to the edge of the ditch is 2.9 m but the track
surface is 5m above the surface of the ditch which means that the effective distance used to estimate
spray drift losses is likely to be less. As with the HardSPEC Urban and Major Road scenarios
therefore a value of 2.8% drift loss is used, based on the 90th
percentile highest value for a hand held
application to a crop < 50 cm high and at a distance of 1 m from the edge of the 'crop' to the start of
the water body, derived from the BBA (2000) measured data.
As a first tier assessment, there is a default assumption that the spray is applied as a continuous 1m
wide swath along the 100 m of track edge. Such an assumption represents an unrealistic worst-case
because hand-held sprayers use spot-applications rather than swath-application and the scenario thus
combines an unrealistically large application loading with estimated worst-case losses from measured

Development of a Surface Water Exposure Module for the HardSPEC Railway Scenario. May 2010
18
data. It is also recognized that other types of application method may be used on an ad-hoc basis and,
in order to investigate such methods or a range of more realistic application loadings from hand-held
sprayers, users can change both the percentage loss from ad-hoc application and the fraction of 100
m2 target area of track to which spray is applied. For regulatory applications, any changes to the
default percentage drift loss resulting from different application methods or reductions in the
fraction of track treated must be supported with data to justify the values used.
2.2.3 Fate in the surface water body
Inputs to the railway ditch from spray drift occur on the day of application and all go into the aqueous
phase. At this stage therefore there is no herbicide mass in the ditch sediment phase.
During this first day, partitioning occurs between water and sediment phases of the ditch but, as with
the „STEPS1-2 in FOCUS‟ model, only 2/3 of the spray drift inputs are available for partitioning, the
remaining 1/3 stays in the ditch water phase. This is because some of the inputs from spray drift
remain in the upper parts of the water column and are too far away from the sediment to be subject to
sorption forces. The figure of 1/3 is a calibrated number based on experimental observations
(Linders et al (2003) and is intended as a „first tier‟ approach. A possible second tier approach to this
would be to use specific water partitioning kinetic data from experimental studies using aerial
deposition inputs but this could only be done if the model was to be specifically adapted by changing
the calculations in the worksheet “Losses_AR”.
Following partitioning, masses of herbicide in both the water and sediment phases are calculated
using values for soil Koc, water depth (30 cm), effective sediment depth (1 cm), sediment bulk
density & organic carbon content exactly as in the existing HardSPEC stream model. They represent
the final masses present in the water and sediment phases of the ditch at the end of the first day.
However, as with all the other surface water modules in HardSPEC, PECsw on the day of application
is calculated from the mass of herbicide in the ditch before partitioning occurs.
2.3 Run-off
Run-off directly from Railway track formations is not likely as the ballast that forms the main part of
the formation upon which railway tracks are placed is very permeable. However, if an impermeable
layer underlies the formation, any excess rain water reaching that layer will percolate sideways and
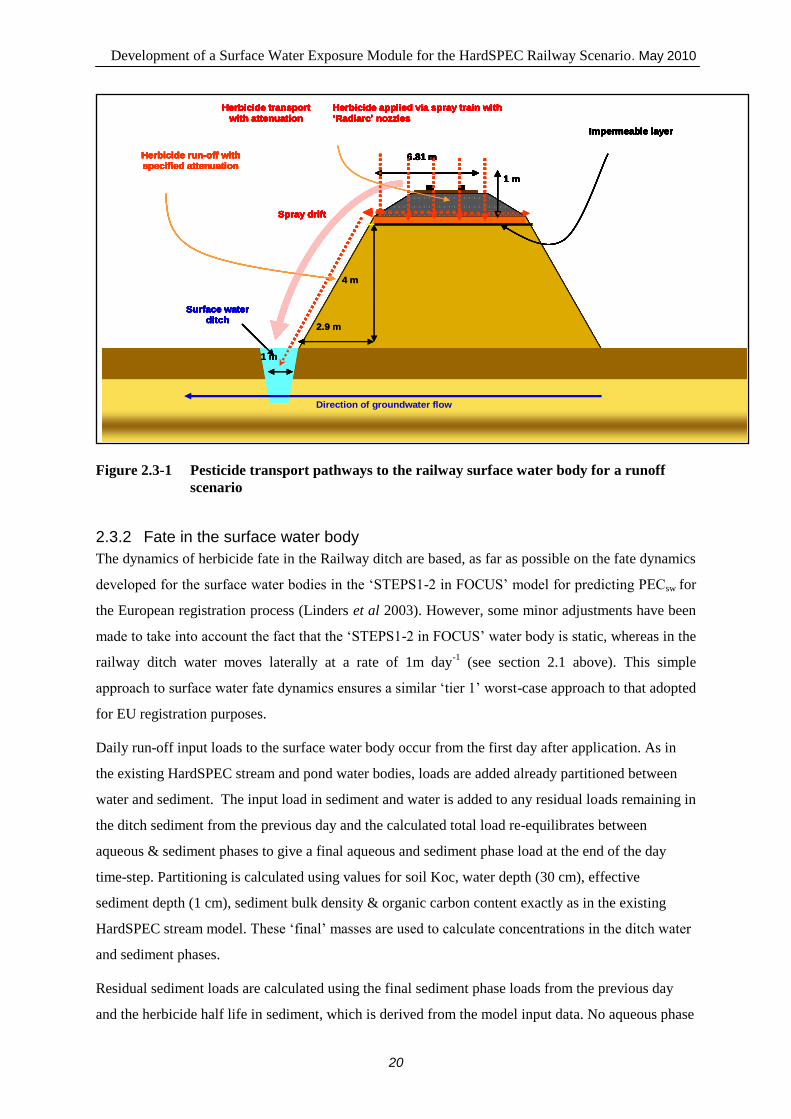
run off down the embankment to the adjacent ditch, as illustrated in figure 2.3-1 below. The amount
of such runoff and the extent of attenuation of herbicide loads during transport down the embankment
are uncertain as no data are available on such a specific subject.

Development of a Surface Water Exposure Module for the HardSPEC Railway Scenario. May 2010
19
2.3.1 Run-off simulation
In order to simulate this scenario, the daily mass lost (mg) per 0.492 m² of ballast (calculated by the
ballast leaching model in the worksheet “masses lost per 0.5 mm rain”), which is input to cells F100
to F172 of the worksheet “losses_AR” in HardSPEC v. 1.1, are converted into a daily total load ( g)
lost from the ballast based on the application area associated with the Network Rail spray train
mounted with the „Radiarc‟ nozzle system (see section 2.2.1 above). However, although all 774.7 m2
of the track receives spray which is then subject to leaching through the railway ballast, not all of the
leached mass will move laterally to the side of the embankment nearest to the surface water ditch.
This is because some of the mass leached from ballast area furthest from the ditch will move to its
nearest embankment side. In this runoff scenario there is a worst case assumption that all the
herbicide mass leached from spray sections 1 to 5 (see figure 2.2-4) moves to the ditch side of the
embankment and is lost through runoff, giving a total contributing area of 100 x 6.81 = 681
m2, representing 88% of the total mass leached through the railway formation.
For the runoff scenario therefore, the total daily load ( g) lost from the ballast application area
= daily mass (mg) lost per 0.492 m² of ballast x 1000 x 681 / 0.492.
This mass is then used as a direct input to the surface water body but, because the amount of
attenuation that may occur during run off is uncertain, the mass is first multiplied by an attenuation
factor. This factor is specified by the user as an additional input parameter in cell C21 of the
worksheet “Herb_props”. The default value in this first tier version of the module is 1, i.e. there is no
attenuation of loads during transport down the railway embankment which is clearly very
conservative and probably unrealistic. However, it can be changed by the user to a smaller
fraction, providing the change is based on a justified argument.
Development of a Surface Water Exposure Module for the HardSPEC Railway Scenario. May 2010
20
Figure 2.3-1 Pesticide transport pathways to the railway surface water body for a runoff
scenario
2.3.2 Fate in the surface water body
The dynamics of herbicide fate in the Railway ditch are based, as far as possible on the fate dynamics
developed for the surface water bodies in the „STEPS1-2 in FOCUS‟ model for predicting PECsw for
the European registration process (Linders et al 2003). However, some minor adjustments have been
made to take into account the fact that the „STEPS1-2 in FOCUS‟ water body is static, whereas in the
railway ditch water moves laterally at a rate of 1m day-1
(see section 2.1 above). This simple
approach to surface water fate dynamics ensures a similar „tier 1‟ worst-case approach to that adopted
for EU registration purposes.
Daily run-off input loads to the surface water body occur from the first day after application. As in
the existing HardSPEC stream and pond water bodies, loads are added already partitioned between
water and sediment. The input load in sediment and water is added to any residual loads remaining in
the ditch sediment from the previous day and the calculated total load re-equilibrates between
aqueous & sediment phases to give a final aqueous and sediment phase load at the end of the day
time-step. Partitioning is calculated using values for soil Koc, water depth (30 cm), effective
sediment depth (1 cm), sediment bulk density & organic carbon content exactly as in the existing
HardSPEC stream model. These „final‟ masses are used to calculate concentrations in the ditch water
and sediment phases.
Residual sediment loads are calculated using the final sediment phase loads from the previous day
and the herbicide half life in sediment, which is derived from the model input data. No aqueous phase
4 m
2.9 m
Impermeable layer
Spray drift
Herbicide run-off with specified attenuation
Herbicide applied via spray train with
„Radiarc‟ nozzles
Herbicide transport
with attenuation
6.81 m
1 m
Surface waterditch
1 m
Direction of groundwater flow
4 m
2.9 m
Impermeable layer
Spray drift
Herbicide run-off with specified attenuation
Herbicide applied via spray train with
„Radiarc‟ nozzles
Herbicide transport
with attenuation
6.81 m
1 m
Surface waterditch
1 m
Direction of groundwater flow
4 m
2.9 m
Impermeable layer
Spray drift
Herbicide run-off with specified attenuation
Herbicide applied via spray train with
„Radiarc‟ nozzles
Herbicide transport
with attenuation
6.81 m
1 m
Surface waterditch
1 m
Direction of groundwater flow
4 m
2.9 m
Impermeable layer
Spray drift
Herbicide run-off with specified attenuation
Herbicide applied via spray train with
„Radiarc‟ nozzles
Herbicide transport
with attenuation
6.81 m
1 m
Surface waterditch
1 m
Direction of groundwater flow
4 m
2.9 m
4 m
2.9 m
4 m
2.9 m
4 m
2.9 m
Impermeable layer
Spray drift
Herbicide run-off with specified attenuation
Herbicide applied via spray train with
„Radiarc‟ nozzles
Herbicide transport
with attenuation
6.81 m
1 m
Surface waterditch
1 m
Direction of groundwater flow
Impermeable layer
Spray drift
Herbicide run-off with specified attenuation
Herbicide applied via spray train with
„Radiarc‟ nozzles
Herbicide transport
with attenuation
6.81 m
1 m
Surface waterditch
1 m
Impermeable layer
Spray drift
Herbicide run-off with specified attenuation
Herbicide applied via spray train with
„Radiarc‟ nozzles
Herbicide transport
with attenuation
6.81 m
1 m
Impermeable layerImpermeable layer
Spray drift
Herbicide run-off with specified attenuation
Herbicide applied via spray train with
„Radiarc‟ nozzles
Herbicide transport
with attenuation
Spray drift
Herbicide run-off with specified attenuation
Herbicide applied via spray train with
„Radiarc‟ nozzles
Herbicide transport
with attenuation
6.81 m
1 m
6.81 m
1 m
Surface waterditch
1 m
Surface waterditch
1 m1 m
Direction of groundwater flow

Development of a Surface Water Exposure Module for the HardSPEC Railway Scenario. May 2010
21
residual loads remain from the previous day because flow in the ditch is determined by the
groundwater flow rate of 1 m day-1
. This flow is at right angles to the 1 m wide ditch and thus an
equivalent volume of each day‟s input water flows out of the ditch thus keeping its water depth static
and removing any aqueous phase loads that are present at the end of the time step.
Calculated final masses in the ditch aqueous and water phases are then used to calculate
concentrations in the ditch water and sediment phases, exactly as in the existing HardSPEC model.
2.4 Leaching
If there is no impermeable layer below the railway formation, then any herbicide loads that leach out
of it will continue to leach vertically to the underlying groundwater body. The rate of such leaching
and the amount of attenuation that occurs during that leaching is very much dependent on the nature
and characteristics of the embankment material. As the purpose of this study is to undertake a worst
case approach to exposure assessment, a set of worst-case assumptions are made with respect to
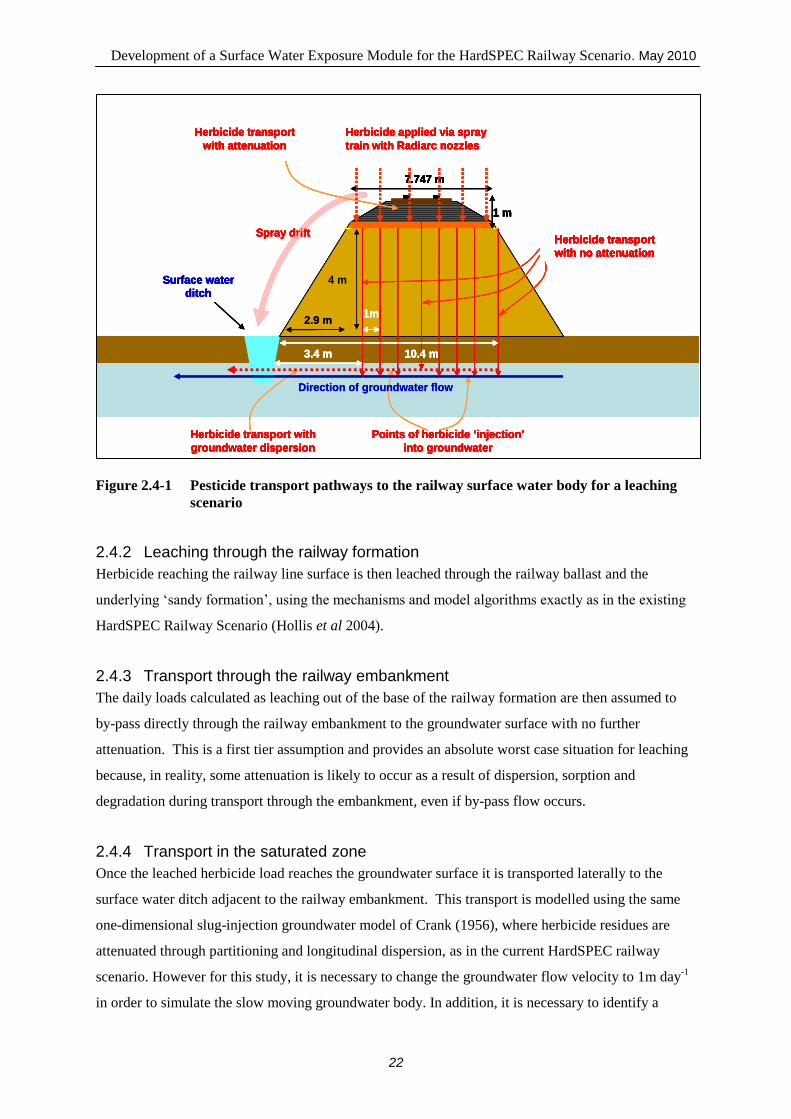
herbicide application and fate of residues following leaching out of the railway formation. These
assumptions are described in the following sections and illustrated in Figure 2.4-1 below.
2.4.1 Herbicide application, interception by plants and spray drift
As a realistic worst-case for leaching, it is assumed that herbicide is applied at a recommended rate to
the entire 774.7 m2 of track and ballast area associated with „up‟ and „down‟ track passes of the
Network Rail spray train mounted with the „Radiarc‟ nozzle system (see figure 2.2-1 above).
Of the herbicide sprayed onto the railway line, 10% is intercepted by growing plants exactly as
described in the existing HardSPEC railway scenario. The amount of spray drift losses associated
with use of the spray train are described in section 2.2.1 and, as a result of this, a further 0.68% of the
applied mass is not deposited on the application area.
Development of a Surface Water Exposure Module for the HardSPEC Railway Scenario. May 2010
22
Figure 2.4-1 Pesticide transport pathways to the railway surface water body for a leaching
scenario
2.4.2 Leaching through the railway formation
Herbicide reaching the railway line surface is then leached through the railway ballast and the
underlying „sandy formation‟, using the mechanisms and model algorithms exactly as in the existing
HardSPEC Railway Scenario (Hollis et al 2004).
2.4.3 Transport through the railway embankment
The daily loads calculated as leaching out of the base of the railway formation are then assumed to
by-pass directly through the railway embankment to the groundwater surface with no further
attenuation. This is a first tier assumption and provides an absolute worst case situation for leaching
because, in reality, some attenuation is likely to occur as a result of dispersion, sorption and
degradation during transport through the embankment, even if by-pass flow occurs.
2.4.4 Transport in the saturated zone
Once the leached herbicide load reaches the groundwater surface it is transported laterally to the
surface water ditch adjacent to the railway embankment. This transport is modelled using the same
one-dimensional slug-injection groundwater model of Crank (1956), where herbicide residues are
attenuated through partitioning and longitudinal dispersion, as in the current HardSPEC railway
scenario. However for this study, it is necessary to change the groundwater flow velocity to 1m day-1
in order to simulate the slow moving groundwater body. In addition, it is necessary to identify a
Surface water
ditch
1 m
Spray drift
Herbicide transport with
groundwater dispersion
Points of herbicide „injection‟
into groundwater
1m
3.4 m
Herbicide transport
with no attenuation
10.4 m
1 m
7.747 m
Herbicide transport
with attenuation
Herbicide applied via spray
train with Radiarc nozzles
Direction of groundwater flow
4 m
2.9 m
Surface water
ditch
1 m
Spray drift
Herbicide transport with
groundwater dispersion
Points of herbicide „injection‟
into groundwater
1m
3.4 m
Herbicide transport
with no attenuation
10.4 m
1 m
7.747 m
Herbicide transport
with attenuation
Herbicide applied via spray
train with Radiarc nozzles
Surface water
ditch
1 m
Surface water
ditch
1 m
Spray driftSpray drift
Herbicide transport with
groundwater dispersion
Points of herbicide „injection‟
into groundwater
1m
3.4 m
Herbicide transport
with no attenuation
10.4 m
Herbicide transport with
groundwater dispersion
Points of herbicide „injection‟
into groundwater
1m
3.4 m
Herbicide transport
with no attenuation
10.4 m
1m
3.4 m
Herbicide transport
with no attenuation
10.4 m3.4 m
Herbicide transport
with no attenuation
10.4 m
1 m
7.747 m
Herbicide transport
with attenuation
Herbicide applied via spray
train with Radiarc nozzles
1 m
7.747 m
Herbicide transport
with attenuation
1 m
7.747 m
Herbicide transport
with attenuation
Herbicide applied via spray
train with Radiarc nozzles
Direction of groundwater flowDirection of groundwater flow
4 m
2.9 m2.9 m
Development of a Surface Water Exposure Module for the HardSPEC Railway Scenario. May 2010
23
suitable „point of injection‟ for leached herbicide loadings into the groundwater body in order to
calculate the distance of travel to the surface water ditch.
Herbicide residues leaching from the railway formation are likely to reach the groundwater surface at
any point along the width of the area to which herbicide is applied and thus each point of herbicide
injection will have a different travel distance. In order to simplify the groundwater modelling, eight
„points of injection‟ have been used, associated with the mid-point of each 1m section of track across
the 7.747 m width of the ballast surface that receives herbicide from the spray train. A 1m section
was used because this equates with the daily rate of groundwater flow and thus represents the daily
input to the water body from each 1m strip of track surface.
The eight points of injection are thus 0.5, 1.5, 2.5, 3.5, 4.5, 5.5 6.5 & 7.5 m from the upper edge of
the embankment nearest to the surface water ditch and each one has a different groundwater travel
distance associated with it. As indicated in section 2.1 above, the horizontal distance from the upper
surface of the embankment to the top of the ditch bank is 2.9 m, and the groundwater travel
distances used in the groundwater fate model are thus 3.4, 4.4, 5.4, 6.4, 7.4, 8.4, 9.4 & 10.4 m. These
distances are used in the Crank groundwater model to calculate daily inputs to the surface water ditch
resulting from each of the eight points of injection of herbicide residues into the groundwater body.
2.4.5 Calculation of total loadings flowing into the ditch
Daily total loads flowing into the ditch from the groundwater body are calculated from the daily
inputs to the surface water body from each of the eight points of groundwater injection across the
width of the railway track. The Crank groundwater model calculates the daily input loads associated
with herbicide impacting on a single 0.492 m2 of railway ballast surface. The area associated with the
eight calculated input loads is therefore 8 x 0.492 = 3.936 m2 and in order to calculate
the total load input to the 100 m length of ditch, it is necessary to multiply the calculated load by the
number of 3.936 m2 areas in the 774.7 m
2 of sprayed track. This equates to 196.824 areas of 0.492 m
2
and the total daily load of herbicide residues flowing into the ditch is thus:
[18 Daily load from injection point n] x 196.824)
2.4.6 Fate in the surface water body
Daily input loads from the groundwater body to the ditch occur from the first day after application.
Once input to the ditch, their fate is calculated in exactly the same way as that of the run-off input
loads described in section 2.3.2 above thus ensuring a similar „tier 1‟ worst-case approach to that
adopted for EU registration purposes.

Development of a Surface Water Exposure Module for the HardSPEC Railway Scenario. May 2010
24
2.5 Summary of „worst-case‟ assumptions in the methodology
Firstly, it should be noted that the methods for run-off and for leaching described above are „mutually
exclusive‟ worst-cases because each one assumes that ALL of the herbicide leaching out of the base
of the railway formation following application, contributes EITHER to run-off down the railway
embankment to the surface water body, OR to leaching through the unsaturated zone to the
underlying shallow groundwater body and thence to the surface water ditch.
In addition, the following „worst-case‟ assumptions are incorporated:
2.5.1 Rainfall patterns
Significant rainfall (5mm) occurs on the day after application.
A 75th percentile wettest spring rainfall sequence follows application.
2.5.2 Herbicide application
There is a maximum spray target area for leaching and run-off simulation because both „up‟
and „down‟ sets of tracks are sprayed.
There is a large spray target area for local hand-held application: A 1m wide swath.
As a first tier assessment it is assumed that herbicide is applied to 100% of the target area.
2.5.3 Spray drift
Drift from the spray train is based on the worst-case wind direction which is in the same
direction as that of the sideways pointing nozzles nearest to the ditch.
The amount of drift from the spray train is based on experimental data and an absolute worst-
case wind speed of 12 miles hr-1
derived from recommendations in the code of practice for
using plant protection products (Defra, 2006).
The 90th percentile largest losses for most ground applied sprays (2.8 %) from the
FOCUS_SW EU drift calculator are used to calculate spray drift from local hand-held
applications.
2.5.4 Run-off
88% of the total load leaching out of the railway formation contributes to run-off.
As a first tier assessment it is assumed that there is no attenuation of herbicide loads during
run-off to the surface water body.
2.5.5 Leaching
There is no attenuation of loads leached out the railway formation during transport in the
unsaturated zone.
Transport in the saturated zone only considers attenuation from partitioning and longitudinal
dispersion.
2.5.6 Fate in the surface water body
The surface water body is a small 1m wide ditch directly next to the railway embankment and
with characteristics similar to those of the FOCUSsw ditch.
Fate dynamics in the ditch are similar to those used in the „STEPS1-2 in FOCUS‟ exposure
assessment, except that all of the previous day‟s residual aqueous phase mass is lost by
groundwater turnover. The railway ditch is not static.
Development of a Surface Water Exposure Module for the HardSPEC Railway Scenario. May 2010
25
3 ADAPTION OF THE HARDSPEC MODEL (V. 1.2.1) TO INCORPORATE THE NEWLY
DEVELOPED RAILWAY SURFACE WATER EXPOSURE MODULE.
In order to incorporate the methods developed and described in section 2 the following modifications
to the existing HardSPEC model (v. 1.2.1) were implemented.
3.1 Worksheet “Herb_props”
Cells B20 to C22 have been added to enable a user to specify what fraction of the full 774.7 m2 of
railway track application area actually has herbicide applied to it by the spray train and what
attenuation factor is applied to the run-off from railway formations (see section2.3.1). The default
values for both of these are 1 and are already inserted in cells C21 & C22. These values can be
changed by the user providing such a change is based on a justified argument.
Cells B25 to C29 have been modified to enable the user to examine the surface water exposure in the
Railway ditch resulting from application by a hand-held sprayer. Because the application method is
used in a very limited context and results in loads to the railway track that are potentially much less
than those from the spray train applications, it is not necessary to incorporate spray drift inputs from
hand held applications into the main surface water exposure calculations in the worksheet
“losses_AR” which use spray drift inputs only from the spray train application method. However, to
ensure that all possible contamination routes are covered, equations have been added to cells C29 and
C30 to calculate the PECsw resulting direct from spray drift from the hand-held application method.
This can then be compared with the predicted exposure data from the main module to identify the
worst-case situation. The user inputs for this calculation are in cells C27 and C28 which specify the
percentage of the applied amount impacting as spray drift and the fraction of the 100m2 target area of
track to which spot spray is applied. The drift input mass resulting from such a fraction is shown in
Cell C29 and the resulting surface water concentration in the ditch shown in cell C30. It is
important to note that users should only change the values in cells C27 and C28.
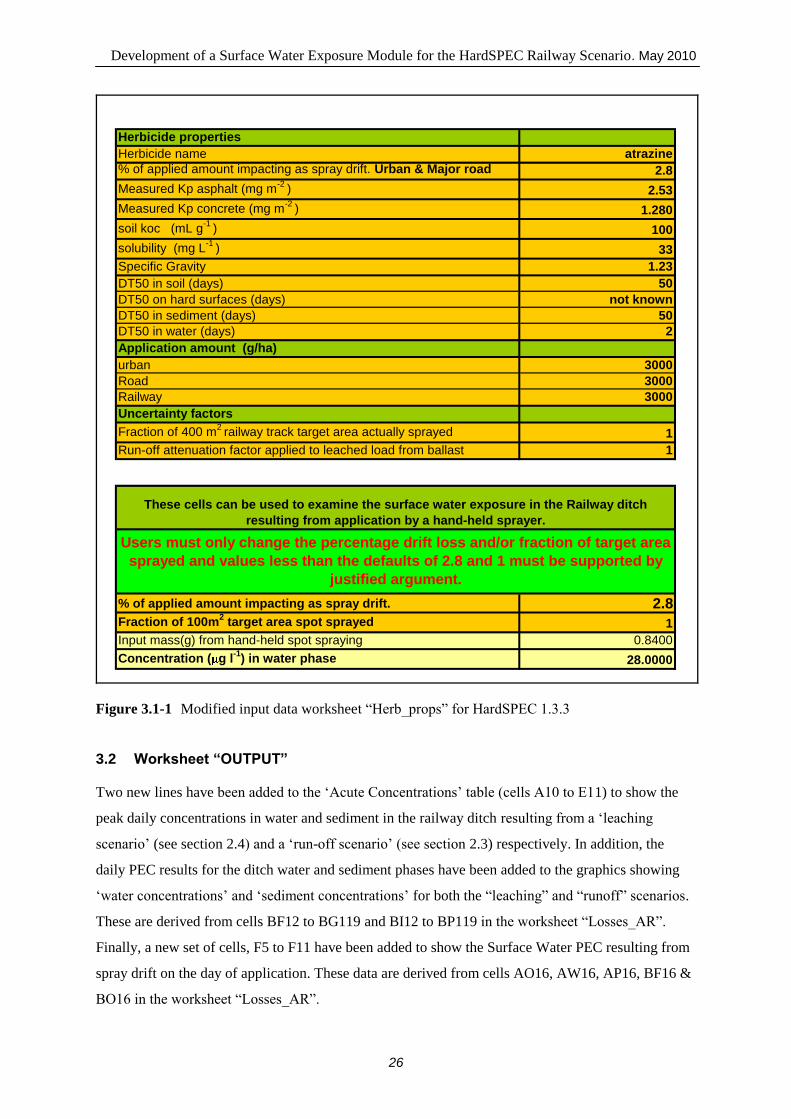
The format of the modified input data worksheet “Herb_props” is shown in figure 3.1-1 below.
Development of a Surface Water Exposure Module for the HardSPEC Railway Scenario. May 2010
26
Herbicide properties
Herbicide name atrazine
% of applied amount impacting as spray drift. Urban & Major road 2.8
Measured Kp asphalt (mg m-2
) 2.53
Measured Kp concrete (mg m-2
) 1.280
soil koc (mL g-1
) 100
solubility (mg L-1
) 33
Specific Gravity 1.23
DT50 in soil (days) 50
DT50 on hard surfaces (days) not known
DT50 in sediment (days) 50
DT50 in water (days) 2
Application amount (g/ha)
urban 3000
Road 3000
Railway 3000
Uncertainty factors
Fraction of 400 m2
railway track target area actually sprayed 1
Run-off attenuation factor applied to leached load from ballast 1
% of applied amount impacting as spray drift. 2.8
Fraction of 100m2 target area spot sprayed 1
Input mass(g) from hand-held spot spraying 0.8400
Concentration ( g l-1
) in water phase 28.0000
These cells can be used to examine the surface water exposure in the Railway ditch
resulting from application by a hand-held sprayer.
Users must only change the percentage drift loss and/or fraction of target area
sprayed and values less than the defaults of 2.8 and 1 must be supported by
justified argument.
Figure 3.1-1 Modified input data worksheet “Herb_props” for HardSPEC 1.3.3
3.2 Worksheet “OUTPUT”
Two new lines have been added to the „Acute Concentrations‟ table (cells A10 to E11) to show the
peak daily concentrations in water and sediment in the railway ditch resulting from a „leaching
scenario‟ (see section 2.4) and a „run-off scenario‟ (see section 2.3) respectively. In addition, the
daily PEC results for the ditch water and sediment phases have been added to the graphics showing
„water concentrations‟ and „sediment concentrations‟ for both the “leaching” and “runoff” scenarios.
These are derived from cells BF12 to BG119 and BI12 to BP119 in the worksheet “Losses_AR”.
Finally, a new set of cells, F5 to F11 have been added to show the Surface Water PEC resulting from
spray drift on the day of application. These data are derived from cells AO16, AW16, AP16, BF16 &
BO16 in the worksheet “Losses_AR”.

Development of a Surface Water Exposure Module for the HardSPEC Railway Scenario. May 2010
27
3.3 Worksheet “Railway_scenario”
The values in cells C8 to C9 have been changed to 0.07749 to reflect the changed surface area of the
scenario and the area to which herbicide is applied.
3.4 Worksheet “Losses_BR”
The railway component of this worksheet has been comprehensively modified. The contents of cells
G7 to I10 have been removed and cells G7 to N19 added in order to calculate the amounts of
herbicide applied to the track, the amounts intercepted by plants and the amounts lost to the surface
water body by spray drift. The equations in cells J11 to J16 which calculate the amount of herbicide
sprayed (g) on the different spray sections of the railway track include a multiplier referring to cell
C21 in worksheet “Herb_props”, to account for the fraction of the railway track application target
area to which herbicide is applied from the spray train with „Radiarc‟ nozzles. This automatically
reduces the average surface loading when the user changes the fraction in the “Herb_props”
worksheet. The modifications to the railway component of this sheet are shown in figure 3.2-1.
RAILWAY
Cess section of track nearest to ditch 94.155 28.2465 2.82465 3.84155 0.47 0.1336768
'Up' section of track 260 78 7.8 5.14155 0.06 0.0469492
Up' line central section of track 33.195 9.9585 0.99585 6.44155 0.04 0.0044288
Down' line central section of track 33.195 9.9585 0.99585 7.10545 0.20 0.0198746
'Down' section of track 260 78 7.8 8.40545 0.03 0.0242665
Cess section of track furthest from ditch 94.155 28.2465 2.82465 9.70545 0.03 0.0072447
Totals 774.7 232.41 23.241 0.2364405
Amount reaching surface (g) 208.933
Overall % of application impacting as spray drift 0.10
Drift
potential
Amount of
herbicide
sprayed (g)
Section of track to which spray is applied Drift loss
Amount
intercepted by
plants (g)
Distance to
water body
m
Area
sprayed
m2
Figure 3.2-1 Modification of the Railway component of worksheet “losses_BR”.
3.5 New Worksheet “Railway_surface_water”
A new worksheet “Railway_surface_water” has been added before the existing worksheet
“Losses_AR”.
This worksheet calculates transport and dispersion in groundwater moving from each of the four
„groundwater injection points‟ below the surface of the railway track to the surface water ditch. The
calculations are based on the Crank (1956) „one dimensional slug injection‟ model. Fixed model
input values are given in cells A1 to G19, whilst calculations related to each of the eight groundwater
injection points are given in cells L5 to CL2945. Summed daily loads for each of the six sets of
model data are given in cells K5 to K369.
Development of a Surface Water Exposure Module for the HardSPEC Railway Scenario. May 2010
28
3.6 Worksheet “Losses_AR”
Additional calculations have been added to this spreadsheet in order to calculate the daily and
cumulative daily masses leached out of sandy formation using the attenuation factor model applied to
the calculated daily masses leached out of the overlying ballast. These calculations have been added
in cells J98 to K172, adjacent to the existing HardSPEC attenuation factor calculations for the
unsaturated zone component of the railway groundwater module.
New routines for calculating the daily water and sediment phase concentrations in the railway surface
water ditch have been added. Those in cells AZ12 to BG119 are calculations relating to the „Leaching
scenario‟ whilst those in cells BI12 to BP119 relate to the „Run-off scenario‟. They cover daily input
masses to the surface water body (cells AZ12 to BA119 and BI12 to BJ119), daily residual masses in
the surface water body (cells BB12 to BC119 and BK12 to BL119), final masses in the surface water
body (cells BD12 to BE119 and BM12 to BN119) and daily concentrations in the surface water body
(cells BF12 to BG119 and BO12 to BP119).
Development of a Surface Water Exposure Module for the HardSPEC Railway Scenario. May 2010
29
4 EVALUATION OF RESULTS FROM THE NEW RAILWAY SURFACE WATER
MODULE
The adapted version of the HardSPEC model described in section 3 which implements the methods
developed and described in section 2, was run for the six „test compounds‟ used in the laboratory and
field monitoring studies used to develop HardSPEC. Basic physico-chemical characteristics and
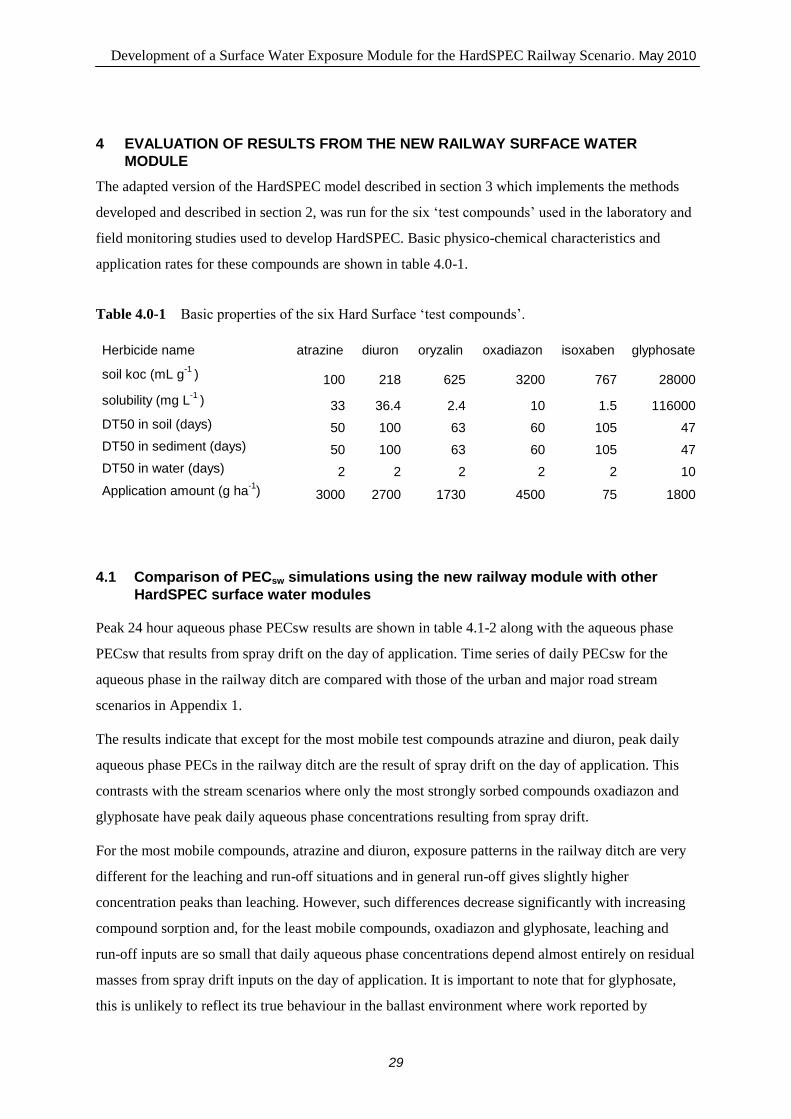
application rates for these compounds are shown in table 4.0-1.
Table 4.0-1 Basic properties of the six Hard Surface „test compounds‟.
Herbicide name atrazine diuron oryzalin oxadiazon isoxaben glyphosate
soil koc (mL g-1
) 100 218 625 3200 767 28000
solubility (mg L-1
) 33 36.4 2.4 10 1.5 116000
DT50 in soil (days) 50 100 63 60 105 47
DT50 in sediment (days) 50 100 63 60 105 47
DT50 in water (days) 2 2 2 2 2 10
Application amount (g ha-1
) 3000 2700 1730 4500 75 1800
4.1 Comparison of PECsw simulations using the new railway module with other
HardSPEC surface water modules
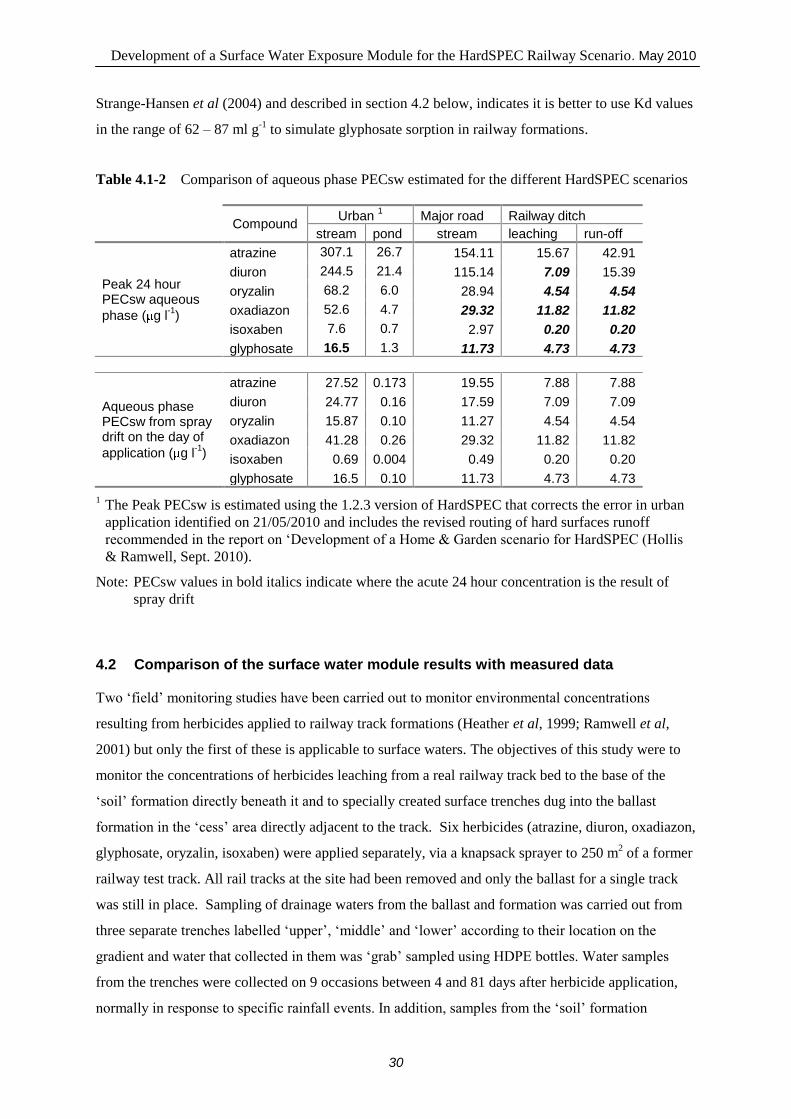
Peak 24 hour aqueous phase PECsw results are shown in table 4.1-2 along with the aqueous phase
PECsw that results from spray drift on the day of application. Time series of daily PECsw for the
aqueous phase in the railway ditch are compared with those of the urban and major road stream
scenarios in Appendix 1.
The results indicate that except for the most mobile test compounds atrazine and diuron, peak daily
aqueous phase PECs in the railway ditch are the result of spray drift on the day of application. This
contrasts with the stream scenarios where only the most strongly sorbed compounds oxadiazon and
glyphosate have peak daily aqueous phase concentrations resulting from spray drift.
For the most mobile compounds, atrazine and diuron, exposure patterns in the railway ditch are very
different for the leaching and run-off situations and in general run-off gives slightly higher
concentration peaks than leaching. However, such differences decrease significantly with increasing
compound sorption and, for the least mobile compounds, oxadiazon and glyphosate, leaching and
run-off inputs are so small that daily aqueous phase concentrations depend almost entirely on residual
masses from spray drift inputs on the day of application. It is important to note that for glyphosate,
this is unlikely to reflect its true behaviour in the ballast environment where work reported by
Development of a Surface Water Exposure Module for the HardSPEC Railway Scenario. May 2010
30
Strange-Hansen et al (2004) and described in section 4.2 below, indicates it is better to use Kd values
in the range of 62 – 87 ml g-1
to simulate glyphosate sorption in railway formations.
Table 4.1-2 Comparison of aqueous phase PECsw estimated for the different HardSPEC scenarios
Compound
Urban 1 Major road Railway ditch
stream pond stream leaching run-off
Peak 24 hour PECsw aqueous
phase ( g l-1
)
atrazine 307.1 26.7 154.11 15.67 42.91
diuron 244.5 21.4 115.14 7.09 15.39
oryzalin 68.2 6.0 28.94 4.54 4.54
oxadiazon 52.6 4.7 29.32 11.82 11.82
isoxaben 7.6 0.7 2.97 0.20 0.20
glyphosate 16.5 1.3 11.73 4.73 4.73
Aqueous phase PECsw from spray drift on the day of
application ( g l-1
)
atrazine 27.52 0.173 19.55 7.88 7.88
diuron 24.77 0.16 17.59 7.09 7.09
oryzalin 15.87 0.10 11.27 4.54 4.54
oxadiazon 41.28 0.26 29.32 11.82 11.82
isoxaben 0.69 0.004 0.49 0.20 0.20
glyphosate 16.5 0.10 11.73 4.73 4.73
1 The Peak PECsw is estimated using the 1.2.3 version of HardSPEC that corrects the error in urban
application identified on 21/05/2010 and includes the revised routing of hard surfaces runoff
recommended in the report on „Development of a Home & Garden scenario for HardSPEC (Hollis
& Ramwell, Sept. 2010).
Note: PECsw values in bold italics indicate where the acute 24 hour concentration is the result of
spray drift
4.2 Comparison of the surface water module results with measured data
Two „field‟ monitoring studies have been carried out to monitor environmental concentrations
resulting from herbicides applied to railway track formations (Heather et al, 1999; Ramwell et al,
2001) but only the first of these is applicable to surface waters. The objectives of this study were to
monitor the concentrations of herbicides leaching from a real railway track bed to the base of the
„soil‟ formation directly beneath it and to specially created surface trenches dug into the ballast
formation in the „cess‟ area directly adjacent to the track. Six herbicides (atrazine, diuron, oxadiazon,
glyphosate, oryzalin, isoxaben) were applied separately, via a knapsack sprayer to 250 m2 of a former
railway test track. All rail tracks at the site had been removed and only the ballast for a single track
was still in place. Sampling of drainage waters from the ballast and formation was carried out from
three separate trenches labelled „upper‟, „middle‟ and „lower‟ according to their location on the
gradient and water that collected in them was „grab‟ sampled using HDPE bottles. Water samples
from the trenches were collected on 9 occasions between 4 and 81 days after herbicide application,
normally in response to specific rainfall events. In addition, samples from the „soil‟ formation

Development of a Surface Water Exposure Module for the HardSPEC Railway Scenario. May 2010
31
beneath the railway ballast adjacent to the „middle‟ and „lower‟ surface water trenches were taken for
analysis 33 days after application and from the „soil‟ formation adjacent to the „upper‟ trench 83 days
after application. There was a small rainfall event of 0.4mm on the first day after application and a
more significant rainfall event of 4 mm on the second day after application. Subsequent rainfall was
unusually large for the time of year. 25 days after application, 81.8 mm of rain had fallen on the site
whilst by the end of the study, 83 days after application, a total of 153 mm of rain had fallen.
The conditions of this study are thus analogous to the „Runoff‟ component of the new Railway
module because the measured concentrations relate to leachate moving laterally over the
impermeable layer at the base of the railway formation. However, before any comparison of such
measured data with model predictions can take place, there are a number of issues that need to be
addressed.
Firstly, some of the HardSPEC railway scenario characteristics defined in this report need to be
modified to match those of the field study. Thus, the newly developed railway ditch model was
modified so that the amount of herbicide applied and the subsequent rainfall pattern matched those of
the study and there was no input to the surface water ditch from spray drift.
Secondly, the limitations of the railway field study mean that it is not possible to directly compare
measured concentrations with model predicted concentrations in the railway ditch because the
measured data represent effective concentrations leaching from the base of the ballast formation. It is
however possible to take the model predicted loads leaching out of the base of the railway formation
and convert them to a concentration using the area of railway track involved in the sampling and the
daily rainfall values during the study period. Even so there remain a number of uncertainties with
such a comparison:
There are only measured data for grab samples taken from the ballast trenches on 9 days of the 83 day
study period, in contrast to the continuous daily data produced by the model. For these days, analysis
produced quantifiable measurements only for atrazine, diuron and glyphosate. Oryzalin, oxadiazon
and isoxaben were detected in some of the samples but only at concentrations below the
quantification level and similar to the detections identified in the control samples taken before
herbicides were applied. This means that they are of little use for comparison purposes. In addition
there is no data available for the organic component of any fine material in the ballast from the
railway study so the default values of ballast organic matter in the current HardSPEC railway
scenario have to be used for model simulation. Water fluxes within the railway ballast and underlying
formation during the sampling period are not known but are likely to be very different from the
simple assumptions of daily drainage used in the model. The ballast leaching model produces daily
loads leaching out of the ballast per unit area and these are then reduced during transport through the

Development of a Surface Water Exposure Module for the HardSPEC Railway Scenario. May 2010
32
underlying sandy formation using an attenuation factor model. The assumption is that the ballast and
underlying formation remain unsaturated in all parts. This contrasts with the likely hydrological
dynamics in the ballast and formation during the field study where the lower parts are likely to
remain saturated for a few days after rainfall. It is thus not likely to be valid to compare the measured
concentration for a specific day with the predicted concentration for that day. The contrast is
highlighted by the fact that the limited number of measured concentrations suggest a time lag in
herbicide break through to the trenches with an apparent peak occurring 6 days after application,
whereas the model predicts an „instantaneous‟ break through peak on the day of the first rainfall
event after application (day 1). In order to match the study conditions as closely as possible therefore,
a further modification was made to the model.
Because the sandy formation is assumed to be effectively saturated for most of the time, the
attenuation factor model is not considered appropriate and instead the daily loads leaching out of the
ballast per unit area were partitioned between the aqueous and solid phases of the saturated sandy
formation using the relevant default organic carbon content, bulk density and hydraulic property
values from the model. The aqueous phase loads were then converted to concentrations using the
volume of daily rain falling on the ballast per unit area.
In addition, it is known that glyphosate is not principally sorbed to organic matter and so Koc values
are of little use for determining partitioning in railway ballast leaching. However, a study reported by
Strange-Hansen et al (2004) measured sorption of glyphosate in different types of gravel and relevant
measured Kd data from this study was therefore used to simulate glyphosate partitioning in the ballast
and underlying sandy formation. The data used is shown in table 4.2-1.
Table 4.2-1 Measured Kd values used to simulate glyphosate partitioning in the railway ballast and
underlying sandy formations (after Strange-Hansen et al, 2004).
Railway
surface type
Gravel type from Strange-
Hansen et al, 2004
% volume of
stones (>2mm)
% volume of fines
(<0.063 mm)
Kd (ml g-1
)
+ s.d.
Ballast 2/8 83 0.45 87.1 + 12.0
Sandy
formation 0/4 18 1.09 62.1 + 9.6
In order to address the contrast in timing of break through concentrations between the measured and
predicted data, a modified version of the model results was produced. This was done by setting the
predicted time series of concentrations (starting on the first day after application) to start on the 6th
day after application, so matching the apparent timing of the measured peak. Concentrations for the
first five days were then set to 0 and, for each day after application, a „forward three day running

Development of a Surface Water Exposure Module for the HardSPEC Railway Scenario. May 2010
33
average‟ concentration calculated. This procedure attempts to give an integration of the daily
predicted data that better reflects the measured data.
Comparisons of the measured and predicted (for both the modified and unmodified model results)
peak concentrations of all six test compounds from the railway field study are given in table 4.2-2,
whereas the time series of measured and predicted concentrations are shown graphically in figures
4.2-1 (based on the unmodified version of the model results) and 4.2-2 (based on the modified 3 day
running average version of the model results). For the field study data, the mean value and range for
the three samples taken on each sampling date are given.
Table 4.2-2 Measured peak concentrations ( g l-1
) in the ballast trenches from the railway field
study compared with predicted peak concentrations leaching out of the base of the
ballast from the modified HardSPEC railway model.
Compound Railway study Peak Concentration (day 6) Mean value (range)
Predicted concentrations in railway ballast leachate Unmodified daily peak Peak 3 day running average
Atrazine 1097 (860 – 1280) 1316 1082
Diuron 133 (60 – 210) 164 136
Oryzalin <10 10.6 7.0
Oxadiazon <20 1.24 1.06
Isoxaben <10 0.50 0.41
Glyphosate 12.4 (6.7 – 15.3) 15.8 11.0
Table 4.2-2 shows that, for the three compounds where meaningful comparisons can be made
(atrazine, diuron & glyphosate), the measured peak concentrations compare well with the predicted
peak concentrations for the unmodified daily model results and even better for the modified 3 day
running average values. For oryzalin, oxadiazon and isoxaben, where all samples were analysed as
being either just above or below the level of detection, peak concentrations were also predicted to be
very near to or below the level of detection. This is encouraging as it suggests that the ballast
leaching component of the new surface water runoff scenario is producing peak concentrations that
are similar to the limited measured data available.
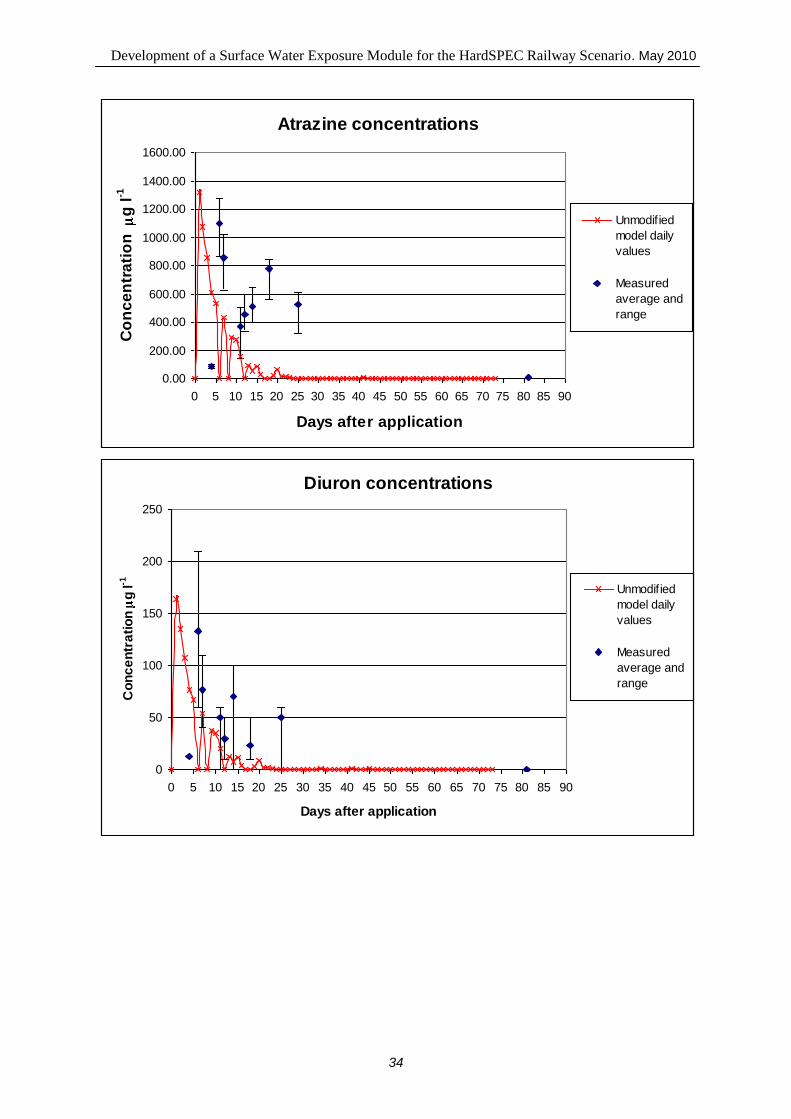
Development of a Surface Water Exposure Module for the HardSPEC Railway Scenario. May 2010
34
Atrazine concentrations
0.00
200.00
400.00
600.00
800.00
1000.00
1200.00
1400.00
1600.00
0 5 10 15 20 25 30 35 40 45 50 55 60 65 70 75 80 85 90
Days after application
Co
nc
en
tra
tio
n
g l
-1
Unmodified
model daily
values
Measured
average and
range
Diuron concentrations
0
50
100
150
200
250
0 5 10 15 20 25 30 35 40 45 50 55 60 65 70 75 80 85 90
Days after application
Co
nc
en
tra
tio
n
g l
-1
Unmodified
model daily
values
Measured
average and
range

Development of a Surface Water Exposure Module for the HardSPEC Railway Scenario. May 2010
35
Glyphosate concentrations
0
2
4
6
8
10
12
14
16
18
0 5 10 15 20 25 30 35 40 45 50 55 60 65 70 75 80 85 90
Days after application
Co
ncen
trati
on
g
l-1 Unmodified
model daily
values
Measured
average and
range
Figure 4.2-1 Measured concentrations of atrazine, diuron and glyphosate from the railway field
study compared with predicted daily concentrations using the unmodified ballast sub-
model from the modified HardSPEC railway scenario.

Development of a Surface Water Exposure Module for the HardSPEC Railway Scenario. May 2010
36
Atrazine concentrations
0.00
200.00
400.00
600.00
800.00
1000.00
1200.00
1400.00
0 5 10 15 20 25 30 35 40 45 50 55 60 65 70 75 80 85 90
Days after application
Co
nc
en
tra
tio
n
g l
-1
Modelled 3 day
running average
Measured
average and
range
Diuron concentrations
0.00
50.00
100.00
150.00
200.00
250.00
0 5 10 15 20 25 30 35 40 45 50 55 60 65 70 75 80 85 90
Days after application
Co
nc
en
tra
tio
n
g l
-1
Modelled 3 day
running average
Measured
average and
range

Development of a Surface Water Exposure Module for the HardSPEC Railway Scenario. May 2010
37
Glyphosate concentrations
0.00
2.00
4.00
6.00
8.00
10.00
12.00
14.00
16.00
0 5 10 15 20 25 30 35 40 45 50 55 60 65 70 75 80 85 90
Days after application
Co
nc
en
tra
tio
n
g l
-1
Modelled 3 day
running average
Measured
average and
range
Figure 4.2-2 Measured concentrations of atrazine, diuron and glyphosate from the railway field
study compared with predicted 3 day running average concentrations using the
modified ballast sub-model results from the modified HardSPEC railway scenario.
It is difficult to undertake a robust statistical comparison of the patterns of predicted concentrations
for atrazine, diuron and glyphosate in figures 4.2-1 and 4.2-2 with the measured data because the
latter contain only 9 values with only two sets of samples on consecutive days. It is therefore
impossible to know whether the apparent peaks in the measured data represent real peaks in the daily
concentration pattern. Also, as discussed previously, the timing of model predicted herbicide
breakthrough and that apparent from the measured data is different (see figure 4.2-1). However, the
modified 3 day running average version of the model results (see figure 4.2-2) shows a good fit to the
measured data, at least up to about 12 days after application (up to 40.2 mm accumulated rain). For
atrazine and glyphosate, predicted concentrations after day 12 appear to be under-estimated. This
does not seem to be the case for diuron although the predicted concentrations after day 12 are at the
lowest end of the measured data range.

Development of a Surface Water Exposure Module for the HardSPEC Railway Scenario. May 2010
38
5 CONCLUSIONS
Methodologies have been developed to calculate the aquatic PEC‟s in surface water resulting from
the application of herbicides to railway track formations. The methodologies cover losses from spray
drift (based on measured data), run-off and leaching and incorporate a number of realistic worst-case
assumptions related to the type of water body associated with railway tracks, the characteristics of the
railway track and its associated water body and the application methods used. The methodologies
have been incorporated into a modified version of the HardSPEC model, version 1.3.4, which
calculates surface water PEC‟s that are likely to result from use of herbicides applied to railway
tracks.
However, there are significant uncertainties related to the amount of track that actually receives
herbicide and the amount of attenuation that is likely to occur during run-off or leaching in any
unsaturated zone below the railway formation. Absolute worst-case assumptions of 100% of the track
target area receiving spray application and no attenuation of herbicide loads during run-off or
unsaturated zone leaching are used to calculate PECsw. Simulations based on such assumptions
should be considered as first-tier exposure assessments.
These first tier absolute worst case assumptions are included as default input parameters in the
worksheet “Herb_props” and can be changed by users to less extreme values, providing such a
change is based on a justified argument. Such simulations can be considered as second tier
exposure assessments as they incorporate more realistic assumptions but retain the identified worst-
case characteristics of the railway track formation, its embankment and associated water body.
Simulated daily PECsw in the Railway ditch for six „test compounds‟ showed that, with the exception
of weakly sorbed compounds such as atrazine and diuron, peak daily aqueous phase PECs in the
railway ditch are the result of spray drift on the day of application. This contrasts with the HardSPEC
stream scenarios where only the most strongly sorbed compounds oxadiazon and glyphosate have
peak daily aqueous phase concentrations resulting from spray drift. Such a contrast emphasizes the
need for a separate railway surface water scenario which may give a favourable risk assessment in
contrast to those for the Urban and major Road scenarios and thus enable applicants to apply for a
specific use only on railways.
For the most mobile compounds, atrazine and diuron, exposure patterns in the railway ditch are very
different for the leaching and run-off situations and in general, run-off gives slightly higher
concentration peaks than leaching. However, such differences decrease significantly with increasing
compound sorption and, for the least mobile compounds, oxadiazon and glyphosate, leaching and

Development of a Surface Water Exposure Module for the HardSPEC Railway Scenario. May 2010
39
run-off inputs are so small that daily aqueous phase concentrations depend almost entirely on residual
masses from spray drift inputs on the day of application.
Comparison of model predictions with measured data is difficult because of the limited amount of
measured data available and significant differences in the dynamics of the water bodies simulated by
the model and sampled in the field study. Nevertheless, the limited comparisons possible indicate that
when the railway scenario is adapted to match the application conditions of the field study, the
predicted peak concentrations leaching out of the railway ballast are similar to those measured in the
water sampled from ballast trenches in the field study. When the model results are modified to match
the timing of the measured peak and integrated using 3 day running average values to try to better
reflect the study conditions, they show a very similar pattern in concentrations to that measured,
although concentrations after about 42 mm accumulated rainfall appear to be under-predicted.

Development of a Surface Water Exposure Module for the HardSPEC Railway Scenario. May 2010
40
6 REFERENCES
CRANK, J. (1956). The mathematics of diffusion. New York University Press.
DEFRA (2006). Pesticides: Code of practice for using plant protection products. Defra Publications,
London. 166 pp.
HEATHER, A.I.J., HOLLIS, J.M. & SHEPHERD, A.J. (1999). Losses of six herbicides from a
disused railway formation. Final report to Hard Surfaces project Consortium. February, 1999.
30 pp.
HOLLIS, J.M., RAMWELL, C.T. AND HOLMAN, I.P. (2004). HardSPEC: A first-tier model for
estimating surface- and ground-water exposure resulting from herbicides applied to hard
surfaces. NSRI research report No. SR3766E for DEFRA project PL0531, March 2004. 79 pp +
3 Appendices.
LINDERS, J., ADRIAANSE, P., ALLEN, R., CAPRI, E., GOUY, V., HOLLIS, J., JARVIS, N.,
KLEIN, M., MAIER, W.-M., MAUND, S., RUSSELL, M., SMEETS, L., TEIXERA, J.-L.,
VIZANTINOPOULOS, S. & YON, D. (2003). Development and description of Surface Water
Scenarios to be used in the Regulation Decision of 91/414/EEC. Final report of the FOCUS
Working Group on Surface Water Scenarios.
PARKIN, C.S. & MILLER, P.C.H. (2004). Measurements of the drift potential of a spray application
system (the Radiarc nozzle) when operating to treat areas around railway lines: a summary report.
Confidential report CR/1510/04/3471 by Silsoe Research Institute. April 2004. 6 pp + 3
Appendices.
RAMWELL, C.T., BOXALL, A.B.A. & HOLLIS, J.M. (2001). Potential contamination of surface
and groundwaters following herbicide application to a railway. Soil Survey and Land Research
Centre draft report for the Environment Agency, 22 pp.
STRANGE-HANSEN, R., HOLM, P. E., JACOBSEN, O.S. & JACOBSEN, A.S. (2004). Sorption,
mineralization and mobility of N-(phosphonomethyl) glycine (glyphosate) in five different
types of gravel. Pest Manag Sci 60: 570-578.

Development of a Surface Water Exposure Module for the HardSPEC Railway Scenario. May 2010
41
APPENDIX 1
Comparison of PEC time series for the HardSPEC railway surface water scenario with those of
the Urban and Major Road scenarios.
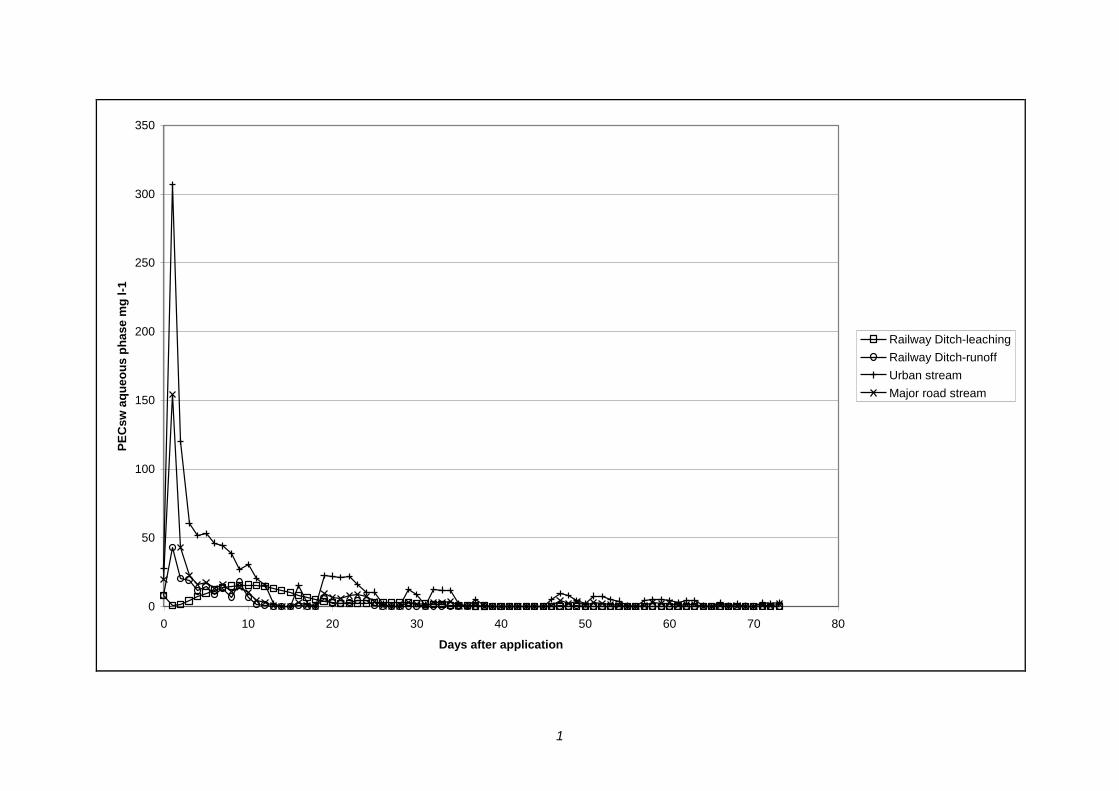
1
0
50
100
150
200
250
300
350
0 10 20 30 40 50 60 70 80
Days after application
PE
Csw
aq
ueo
us p
hase m
g l-1
Railway Ditch-leaching
Railway Ditch-runoff
Urban stream
Major road stream

Development of a Surface Water Exposure Module for the HardSPEC Railway Scenario. May 2010
2
Figure A-1 Daily PECsw for atrazine in the Railway ditch, urban stream and major road stream.
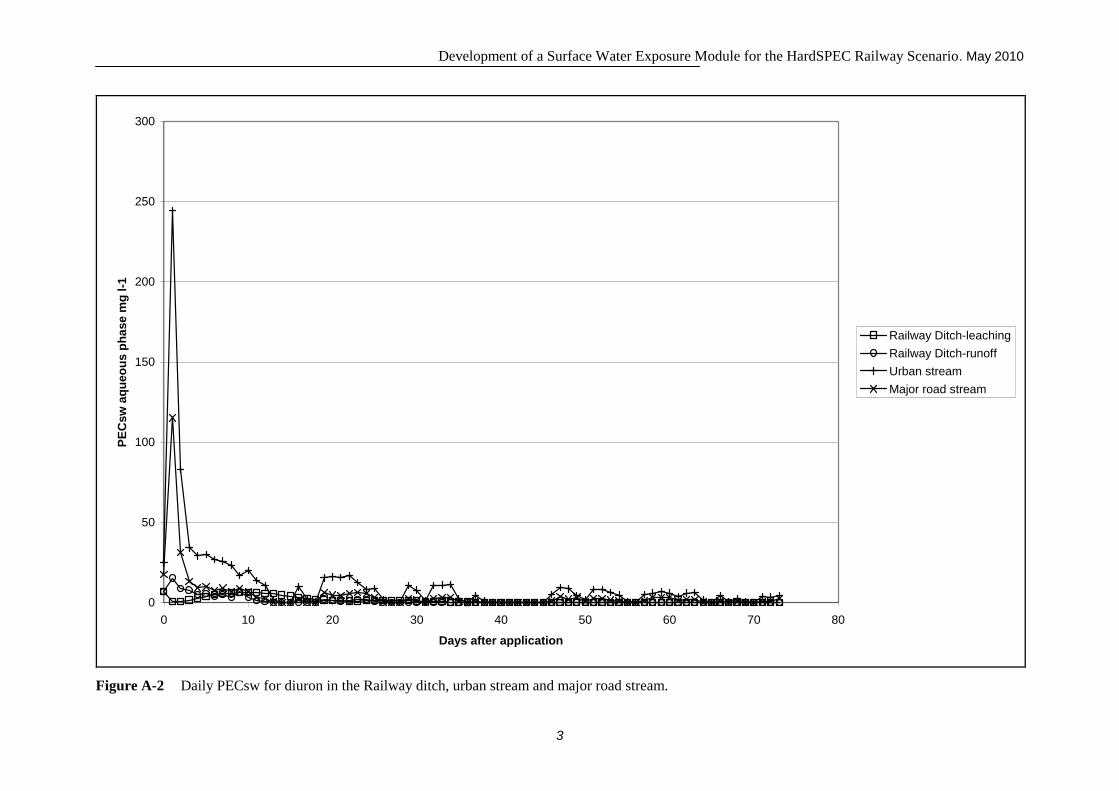
Development of a Surface Water Exposure Module for the HardSPEC Railway Scenario. May 2010
3
0
50
100
150
200
250
300
0 10 20 30 40 50 60 70 80
Days after application
PE
Csw
aq
ueo
us p
hase m
g l-1
Railway Ditch-leaching
Railway Ditch-runoff
Urban stream
Major road stream
Figure A-2 Daily PECsw for diuron in the Railway ditch, urban stream and major road stream.

Development of a Surface Water Exposure Module for the HardSPEC Railway Scenario. May 2010
4
0
10
20
30
40
50
60
70
80
0 10 20 30 40 50 60 70 80
Days after application
PE
Csw
aq
ueo
us p
hase m
g l-1
Railway Ditch-leaching
Railway Ditch-runoff
Urban stream
Major road stream
Figure A-3 Daily PECsw for oryzalin in the Railway ditch, urban stream and major road stream.

Development of a Surface Water Exposure Module for the HardSPEC Railway Scenario. May 2010
5
0
10
20
30
40
50
60
0 10 20 30 40 50 60 70 80
Days after application
PE
Csw
aq
ueo
us p
hase m
g l-1
Railway Ditch-leaching
Railway Ditch-runoff
Urban stream
Major road stream
Figure A-4 Daily PECsw for oxadiazon in the Railway ditch, urban stream and major road stream.

Development of a Surface Water Exposure Module for the HardSPEC Railway Scenario. May 2010
6
0
1
2
3
4
5
6
7
8
0 10 20 30 40 50 60 70 80
Days after application
PE
Csw
aq
ueo
us p
hase m
g l-1
Railway Ditch-leaching
Railway Ditch-runoff
Urban stream
Major road stream
Figure A-5 Daily PECsw for isoxaben in the Railway ditch, urban stream and major road stream.

Development of a Surface Water Exposure Module for the HardSPEC Railway Scenario. May 2010
7
0
2
4
6
8
10
12
14
16
18
0 10 20 30 40 50 60 70 80
Days after application
PE
Csw
aq
ueo
us p
hase m
g l-1
Railway Ditch-leaching
Urban stream
Major road stream
Railway Ditch-runoff
Figure A-6 Daily PECsw for glyphosate in the Railway ditch, urban stream and major road stream.