development of a sulfate reducing packed bed …
TRANSCRIPT
DEVELOPMENT OF A SULFATE REDUCING PACKED BED
BIOREACTOR FOR USE IN A SUSTAINABLE HYDROGEN
PRODUCTION PROCESS
by
Matthew James Lee McMahon
A thesis submitted to the Department of Chemical Engineering
In conformity with the requirements for
the degree of Master of Science (Engineering)
QUEEN’S UNIVERSITY
Kingston, Ontario, Canada
September, 2007
Copyright © Matthew James Lee McMahon, 2007
ii
Abstract
Matthew J.L. McMahon: Development of a Sulfate Reducing Packed Bed Bioreactor For Use In A Sustainable Hydrogen Production Process
A two-stage process is proposed that is based on the biological production of H2S from
organic waste and its subsequent overall conversion to H2 via an exothermic reaction.
The current study examined the first step of this process, namely, the design and
operation of a packed bed bioreactor with high volumetric H2S production (mol/m3.d) and
its comparison to analogous methanogenic technology.
A novel method of inoculum design was developed by evaluating the kinetics and
immobilization potential of Desulfovibrio desulfuricans (ATCC 7757) and a sulfate
reducing bacteria (SRB) consortium. The consortium’s kinetics, as measured by the
specific rate of sulfate reduction (1.2 g SO42-/g CDW.h), were approximately twice as fast
as those of D. desulfuricans. The pure strain however exhibited superior immobilization
potential. Studies revealed that a mixed inoculum containing 96 % D. desulfuricans and
4 % consortium facilitated the rapid immobilization of a highly active SRB biomass and
contributed to improved bioreactor performance.
Diatomaceous earth (DE) pellets, porous glass beads, polyurethane foam, and bone char
were evaluated as potential carrier materials for SRB immobilization. The DE pellets
immobilized the most biomass, were well suited for use at the industrial scale, and were
thus employed in all continuous flow bioreactor experiments.
iii
Using the designed inoculum and DE pellets, a 615 mL bioreactor achieved a volumetric
productivity of 493 mol H2S/m3.d (at D = 1.6 h-1) and a dissolved sulfide concentration of
9.9 mM. This occurred after 8 d of operation and represents a tenfold reduction in the
required start-up period compared to similar bioreactors in the literature.
An N2 strip gas was later used to remove the dissolved sulfide to the gas phase and
enhance sulfate conversion. Shifting the medium pH from 7 to 6 increased the fraction of
strippable sulfide and improved the strip gas composition from 3.6 to 5.8 mol % H2S. The
strip gas to liquid feed ratio (G/L, m3/m3) was investigated in the range of 0-14 and was
found to be a suitable basis for scale-up indicating that productivities of up to 830
mol/m3.d were readily achievable. This represents a considerable improvement over
current methanogenic bioreactor productivities.
Key words: sulfate reducing bacteria (SRB), packed bed bioreactor, Desulfovibrio desulfuricans, consortium, hydrogen

iv
Acknowledgments
I would like to thank my advisor Dr. Andrew Daugulis for his involvement in this unique
project and for his enthusiasm in revisiting the peculiarities of packed bed bioreactors.
His knowledge and advice have been invaluable. I am fortunate to consider him both a
mentor and a friend.
Many thanks are also extended to Dr. Boyd Davis and Alain Roy for recognizing my
early interest in this project and providing me with my first glimpse into the world of
industrial research.
Dr. Gerrit Voordouw and Brenton Buziak were gracious hosts at the University of
Calgary and provided valuable assistance with sulfate reducing bacteria cultures and
anaerobic microbiological methods. The technical assistance and academic insights
provided by Dr. Kunal Karan over the past few years are also greatly appreciated.
Finally, I am most thankful to God and my parents for their endless love and support
throughout my academic career and beyond.
Research grants and scholarships were generously provided by the Natural Sciences and
Engineering Research Council of Canada (NSERC), Kingston Process Metallurgy Inc.,
BioCap, and Queen’s University.

v
Table of Contents
Abstract ii
Acknowledgements iv
List of Tables ix
List of Figures xii
Chapter 1: Introduction 1
Chapter 2: Literature Review 3
2.1 Anaerobic Degradation of Organic Matter 3
2.2 Direct Biological Production of H2 4
2.3 Photosynthetic H2 Production 5
2.4 Overview of Biological Methane Production 5
2.5 Overview of Biological Sulfate Reduction 6 2.5.1 Classification of Sulfate Reducing Bacteria 7 2.5.2 Ecological Context of Sulfate Reduction 8 2.5.3 Electron Donors and Reaction Stoichiometry 9 2.5.4 Complex Substrates 11 2.5.5 Sulfite and SO2 as Alternative Electron Acceptors 12 2.5.6 Factors Affecting Growth 13
2.5.6.1 pH 13 2.5.6.2 Sulfide 14
2.6 Methanogenesis and Sulfate Reduction Comparison 17 2.6.1 Overall Volumetric Performance 18 2.6.2 Process Operability 23 2.6.3 H2 and CO2 Balance 24 2.6.4 Sulfate/Sulfite Reduction with H2S Splitting 24 2.6.5 Methanogenesis with Steam Methane Reforming and Water-Gas Shift 25
2.7 Practical Applications of Biological Sulfate Reduction 26
2.8 Sulfate Reducing Packed Bed Reactors 27 2.8.1 Rationale for Biofilm Immobilization 27 2.8.2 Biofilm Immobilization Fundamentals 29 2.8.3 Recent Literature 30
2.9 Scope of Thesis 40
vi
Chapter 3: Materials and Analytical Methods 42
3.1 Chemicals 42
3.2 Analytical Methods 42 3.2.1 Total Dissolved Sulfide (TDS) 42 3.2.2 Dissolved Sulfate 43 3.2.3 Gas Phase H2S 44 3.2.4 Lactate and Acetate 44 3.2.5 Suspended Biomass Concentration 45 3.2.6 Phase Contrast Microscopy 46 3.2.7 Scanning Electron Microscopy 46 3.2.8 pH Measurement 46
3.3 Culture and Fermentation Methods 47 3.3.1 Postgate B Medium and Stock Culture Maintenance 47 3.3.2 Postgate C Medium 47 3.3.3 Serum Bottle Culture 48 3.3.4 2 L Bioflo Fermentations 48 3.3.5 Packed Bed Bioreactor (PBR) Fermentations 49
3.4 Sulfate Reducing Bacteria Cultures 52 3.4.1 Desulfovibrio desulfuricans (ATCC 7757) 52 3.4.2 Sulfate Reducing Bacteria Consortium 52
3.5 Carrier Materials 53 3.5.1 Polyurethane Foam Plugs 55 3.5.2 Poraver™ Porous Glass Beads 55 3.5.3 Bone Char 55 3.5.4 Celite™ R-635 56
Chapter 4: Experimental Methods 57
4.1 Microbial Systems Characterization Experiments: 57
4.2 Comparison of Carrier Materials Experiments 58
4.3 Comparison of Desulfovibrio desulfuricans and SRB Consortium Immobilization Potential Experiments 59
4.4 Continuous Packed Bed Reactor Experiments 60 4.4.1 PBR Fermentation Experiment 1: System Characterization 60 4.4.2 PBR Fermentation Experiment 2: Sustained Operation and Recovery After Shutdown 61 4.4.3 PBR Fermentation Experiment 3 (with Stripping): System Characterization 62 4.4.4 Basic Model for PBR Operation with Stripping 64 4.4.5 PBR Fermentation Experiment 4 (with Stripping): Performance Enhancement 64
4.4.5.1 Stripping with pH 6 Buffered System 65 4.4.5.2 Stripping with pH 7 Buffered System 66
vii
Chapter 5: Results and Discussion 67
5.1 Microbial Systems Characterization Experiments 67 5.1.1 Stoichiometry 67 5.1.2 Microbial Kinetics 70
5.2 Comparison of Carrier Materials 72 5.2.1 Bone Char Pellets 73 5.2.2 Poraver™ Porous Glass Beads 74 5.2.3 Polyurethane Foam Plugs 76 5.2.4 Celite™ R-635 Diatomaceous Earth Pellets 77
5.3 Immobilization Potential 80
5.4 PBR Fermentation #1 86
5.5 PBR Fermentation #2 94
5.6 PBR Fermentation #3 100
5.7 Basic Model for PBR Operation with Stripping 105
5.8 PBR Fermentation Experiment #4 107
Chapter 6: Sulfide Product Recovery Considerations 113
6.1 H2S and CO2 Partitioning Simulation 113 6.1.1 Sulfide Equilibrium 114 6.1.2 Carbonate Equilibrium 116 6.1.3 Simulation Results 119
6.2 Downstream Sulfide Product Recovery 122 6.2.1 Design Equations and Mass Balance 122 6.2.2 Gas to Liquid (G/L) Requirements for Dissolved Sulfide Recovery 125
6.2.2.1 Use of Fresh N2 Strip Gas 125 6.2.2.2 Use of Bioreactor Strip Gas 126
Chapter 7: Conclusions 131
Chapter 8: Future Work 135
Chapter 9: References 138
Chapter 10: Appendices 154
10.1 Appendix A: Prediction of Volumetric CH4 Production 155
10.2 Appendix B: Volumetric Sulfate Reduction Rates from Literature 156
10.3 Appendix C: Calibration Curves for Analytical Methods 158 10.3.1 Calibration Curve for Dissolved Sulfide 158 10.3.2 Calibration Curve for Dissolved Sulfate 159

viii
10.3.3 Calibration Curve for Gas Phase H2S 160 10.3.4 Calibration Curves for Dissolved Lactate and Acetate 161 10.3.5 Calibration Curve for Suspended Cell Concentration 162
10.4 Appendix D: Basic PBR Model Description 163

ix
List of Tables
Table 2.1: Reaction stoichiometry for the formation of methane from various substrates by methanogenic
bacteria (Madigan et al., 1997 as cited by Metcalf and Eddy, 2003). ....................................................6 Table 2.2: Order of magnitude most probable number (MPN) count of sulfate reducing bacteria in
environmental samples as cited by Hao et al. (1996). MPN per 100 mL unless otherwise stated. .......9 Table 2.3: Reaction stoichiometry and Gibbs free energy for the incomplete oxidation of lactate and the
mineralization of acetate by SRB (Widdel et al., 1988).......................................................................10 Table 2.4: Stoichiometry of SRB metabolic functions with lactate as the incompletely oxidized substrate.
Biomass is approximated by the ratio C5H7NO2. The balanced overall metabolism is based on
experimental values (D’Alessandro et al., 1974 and Traore et al., 1982 as cited by Okabe and
Characklis, 1992). ................................................................................................................................11 Table 2.5: Complex substrates utilized by mixed cultures of fermentative heterotrophs and sulfate reducing
bacteria.................................................................................................................................................12 Table 2.6: Summary of literature reporting the effects of sulfide on growth and activity on sulfate reducing
bacteria (adapted from Okabe et al., 1995). .........................................................................................16 Table 2.7: Summary of microbial kinetic parameters for Desulfovibrio desulfuricans grown at 35 oC on
lactate media. .......................................................................................................................................17 Table 2.8: Typical organic loading rates and predicted CH4 production in methanogenic anaerobic
bioreactors (adapted from Metcalf and Eddy, 2003). Abbreviations: CSTR - continuous stirred tank
reactor; SBR, -sequential batch reactor; UASB - upflow anaerobic sludge blanket; ABR - anaerobic
baffled reactor; AMBR - anaerobic migrating blanket reactor; PBR - packed bed reactor; AEBR -
anaerobic expanded bed reactor; WW -wastewater. ............................................................................19 Table 2.9: Organic loading rates and associated CH4 production in recent methanogenic literature. All
bioreactors were run at mesophilic conditions (25-37 oC). Abbreviations: SBR - sequential batch
reactor; UASB - upflow anaerobic sludge blanket; ABR - anaerobic baffled reactor; PBR - packed
bed reactor; AEBR - anaerobic expanded bed reactor; FBR - fluidized bed reactor; UASFF - upflow
anaerobic sludge fixed film; WW - wastewater. .................................................................................20 Table 2.10: Volumetric sulfate reduction rates (mol SO4
2-/m3.d) from recent SRB literature.
Abbreviations: CSTR- continuous stirred tank reactor; UASB - upflow anaerobic sludge blanket;
PBR - packed bed reactor; FBR - fluidized bed reactor; WW - wastewater. All bioreactors were run
at mesophilic conditions (20-37 oC).....................................................................................................21 Table 2.11: Summary of H2 and CO2 yields for production of H2 via biologically produced CH4 and H2S
precursor molecules. ............................................................................................................................25 Table 2.12: Characteristics of support materials evaluated by Silva et al. (2006). Abbreviations: PU -
x
polyurethane foam; AC- activated carbon; CE - alumina ceramic; PE - polyethylene. .......................40 Table 3.1: Composition of sulfate assay conditioning fluid (per 1000 mL). ................................................44 Table 3.2: General carrier material dimensions and prices...........................................................................54 Table 4.1: List of 2 L batch BioFlo fermentations and their inoculum composition used in microbial
kinetics and stoichiometry experiments. ..............................................................................................58 Table 4.2: List of inoculum compositions and carrier materials used in immobilization potential
experiments. .........................................................................................................................................59 Table 4.3: Liquid feed rates, feed duration, and respective hydraulic residence times (HRT), dilution rates
(D), and equivalent column volumes (CV) for this first PBR fermentation experiment (no stripping).
.............................................................................................................................................................61 Table 4.4: Liquid feed rates, feed duration, and respective hydraulic residence times (HRT), dilution rates
(D), and equivalent column volumes (CV) for this second PBR fermentation experiment. ................62 Table 4.5: List of stripping ratios (G/L) evaluated for PBR fermentation at constant 80 mL/h liquid feed.
L = liquid feed rate; G = N2 strip gas rate. ...........................................................................................63 Table 4.6: List of stripping conditions (G/L) at which strip gas samples were taken for gas phase H2S
analysis. ...............................................................................................................................................63 Table 4.7: List of stripping ratios (G/L) evaluated for PBR fermentation using media buffered to pH 6.1. L
= liquid feed rate; G = nitrogen strip gas rate. .....................................................................................66 Table 4.8: List of stripping conditions (G/L) evaluated for PBR fermentation using media buffered to pH 7.
L = liquid feed rate; G = nitrogen strip gas rate. ..................................................................................66 Table 5.1: Summary of yield coefficients (Y) for serum bottle batch cultures of Desulfovibrio desulfuricans
and an SRB consortium. Parameters measured were sulfate reduced (SO42-), total dissolved sulfide
(TDS), lactate oxidized, and cell dry weight (CDW) produced. At the experimental conditions (pH ~
7.5) the majority of sulfide was in the dissolved phase........................................................................67 Table 5.2: Batch growth kinetic properties for Desulfovibrio desulfuricans and an SRB enriched
consortium as measured in 2 L batch fermentations. ...........................................................................67 Table 5.3: Summary of relevant volumetric productivities reported in literature for sulfate reducing
bioreactors............................................................................................................................................94 Table 5.4: Summary of highest volumetric productivities observed for PBR fermentations #1 and #2.......95 Table 5.5: Maximum theoretical suspended biomass concentrations assuming complete conversion of
substrate to biomass according to the equation [X = (YX/S)(S0)]. The initial sulfate concentration is 32
mM but only 27 mM can be reduced due to a stoichiometric limiting amount of lactate. ...................98 Table 5.6: Results of a PBR experiment with stripping at various G/L ratios and the resulting partitioning
of sulfide between dissolved and gas phases. The molar sulfur mass balance is also reported as total
sulfide produced per sulfate reduced (mol/mol). ...............................................................................104 Table 5.7: Distribution of 20 mM total dissolved sulfide and the equilibrium H2S partial pressure at 37 oC
xi
for the pH range 6-8. ..........................................................................................................................105 Table 5.8: Observed changes in pH during the fourth PBR fermentation with potassium phosphate buffered
media..................................................................................................................................................107 Table 5.9: Summary of highest volumetric productivities (based on total reactor volume and port 3 outlet
concentrations) from separate fermentations in this study. The volumetric productivity for the fourth
fermentation accounts for both dissolved and gas phase sulfide product streams. ............................111 Table 6.1: Nomenclature for sulfide equilibrium calculations. ..................................................................114 Table 6.2: Nomenclature for carbonate equilibrium equations...................................................................117 Table 6.3: Nomenclature for stripping column analysis. It is assumed that the solute is sufficiently dilute
in the liquid phase that its molar fraction and mole concentration are equivalent (i.e. Ci = xi)..........123 Table 10.1: Volumetric sulfate reduction rates (mol SO4
2-/m3.d) from recent SRB literature.
Abbreviations: CSTR - continuous stirred tank reactor; UASB, upflow anaerobic sludge blanket;
PBR - packed bed reactor; FBR - fluidized bed reactor; WW - wastewater. .....................................156 Table 10.2: Nomenclature for basic PBR model for volumetric productivity based on equilibrium
relationships. ......................................................................................................................................163
xii
List of Figures
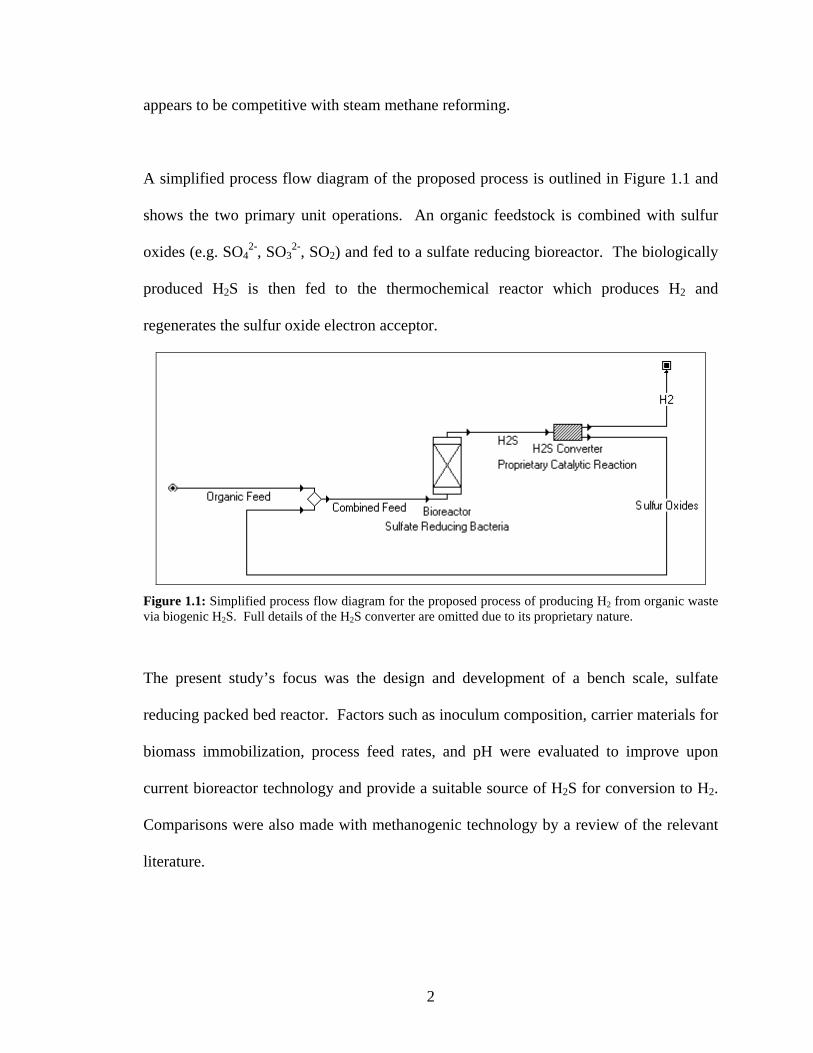
Figure 1.1: Simplified process flow diagram for the proposed process of producing H2 from organic waste
via biogenic H2S. Full details of the H2S converter are omitted due to its proprietary nature. .............2 Figure 2.1: Pathways of anaerobic degradation of organic compounds under methanogenic and
sulfidogenic conditions (Colleran et al., 1995). Fermentation intermediates includes short chain
organic acids and alcohols. Abbreviations: FB – fermentative bacteria; OHPA – obligate hydrogen-
producing bacteria; MPB – methane producing bacteria; SRB – sulfate reducing bacteria; HAc –
hydrogenotrophic acidogenic bacteria. ..................................................................................................4 Figure 2.2: General metabolic process of sulfate reducing bacteria. As in other anaerobic bacteria, the
main fraction of the electron donor is oxidized for energy conservation, and only a minor fraction is
assimilated into cell mass. Catabolism (energy conservation) is shown in white-outline; anabolism
(cell synthesis) is shown in heavy black lines (adapted from Rabus et al., 2000). ................................7 Figure 2.3: Phylogenetic tree reflecting the relationship of sulfate reducing bacteria to other organisms on
the basis of 16S rRNA sequences. The three domains of life are labeled (1) Eubacteria; (2)
Archaebacteria; and (3) Eukaryotes (adapted from Rabus et al., 2000).................................................8 Figure 2.4: Fraction of total dissolved sulfide (TDS) present as H2S(aq) as a function of pH at 25 oC and 37
oC. The balance of TDS is present as HS-(aq).......................................................................................15
Figure 2.5: Effect of total sulfide concentration on maintenance coefficient (m) for Desulfovibrio
desulfuricans growing on lactate medium (Okabe et al., 1995)...........................................................17 Figure 2.6: Typical configuration for an upflow, packed bed reactor. Attached cells and biofilms remain
immobilized on inert carrier materials while high liquid flow rates are applied to improve volumetric
productivity. .........................................................................................................................................28 Figure 2.7: Conceptual model of a single species biofilm in a flowing environment. Microcolony structure
is varied and convective fluid flow occurs around and below these microstructures within biofilms
(Costerton et al., 1995).........................................................................................................................29 Figure 3.1: Diagram of 615 mL (4.5 cm x 38 cm) packed bed bioreactor (PBR) used for continuous SRB
fermentations. The PBR contained barbed fittings for liquid and gas inlet/outlet, butyl rubber
sampling ports, and was surrounded with Tygon tubing heat coils and foam insulating material (not
shown). The column of the PBR was packed with biomass carrier material while the end pieces
contained a polyethylene mesh to improve gas/liquid dispersion. .......................................................51 Figure 3.2: Photographs of carrier materials (ruler for scale). A) Poraver™ porous glass beads; B)
polyurethane foam plug; C) bone char; D) Celite™ R-635 diatomaceous earth pellets. .....................54 Figure 4.1: Diagram of experimental setup for the evaluation of carrier material immobilization potential.
2 L stationary phase Desulfovibrio desulfuricans cultures were circulated from a BioFlo bioreactor to

xiii
a column packed with carrier material at ambient conditions at flow rate of 200 mL/h. .....................59 Figure 5.1: Specific growth rate (μ, h-1) of 2 L batch fermentations as a function of inoculum composition.
0 % consortium corresponds to 100 % Desulfovibrio desulfuricans. ..................................................71 Figure 5.2: Quantities of immobilized Desulfovibrio desulfuricans biomass (mg CDW per reactor) on
different carrier materials after 20 h circulation of 2 L stationary phase cultures through 615 mL
packed bed reactors. Abbreviations: BC - bone char; PPG - Poraver porous glass beads; PF -
polyurethane foam; R-635 - Celite diatomaceous earth pellets............................................................73 Figure 5.3: Scanning electron micrograph (100x) of the surface of Celite™ R-635 carrier material. Scale
bar shows 100 μm. ...............................................................................................................................79 Figure 5.4: Scanning electron micrograph (2000x) of the surface Celite™ R-635 carrier material. Scale
bar shows 20 μm. .................................................................................................................................79 Figure 5.5: Biomass immobilized (mg CDW per reactor) to carrier material in a packed bed as a function
of inoculum composition. 0 % consortium corresponds to 100 % pure culture (Desulfovibrio
desulfuricans). Diamonds represent results obtained using polyurethane foam as the carrier material.
Squares represent results obtained using Celite™ R-635 as the carrier material.................................82 Figure 5.6: Desulfovibrio desulfuricans (A) and SRB consortium (B) cultures grown under identical
conditions. Detached biofilm ‘streamers’ are clearly visible in (A). The SRB consortium cultures
contained only a small amount of floc particles that settled to the bottom of the tube (not visible). ...82 Figure 5.7: Volumetric sulfide productivity-time course plot for PBR fermentation #1..............................86 Figure 5.8: Concentration-time course plot for total dissolved sulfide (A), sulfate (B), and suspended
biomass (C) concentrations for PBR fermentation #1. Port 3 corresponds to the reactor’s outlet. .....87 Figure 5.9: Scanning electron micrograph (5000x) of the surface of a Celite™ R-635 pellet retrieved from
the bioreactor inlet after an 11 d fermentation. Scale bar shows 2 μm. ..............................................90 Figure 5.10: Scanning electron micrograph (5000x) of the surface of a Celite™ R-635 pellet retrieved from
the midpoint of the bioreactor after an 11 d fermentation. Scale bar shows 2 μm..............................91 Figure 5.11: Scanning electron micrograph (5000x) of the surface of a Celite™ R-635 pellet retrieved from
the bioreactor outlet after an 11 d fermentation. Scale bar shows 2 μm. ............................................91 Figure 5.12: Volumetric sulfide productivity-time course plot for PBR fermentation #2............................95 Figure 5.13: Concentration-time course plot for total dissolved sulfide (A), sulfate (B), and suspended
biomass (C) concentrations for PBR fermentation #2. Port 3 corresponds to the bioreactor’s outlet.96 Figure 5.14: Results of a PBR experiment at constant liquid flow (80 mL/h) and a varying N2 strip gas
flow rate (reported as a normalized G/L ratio). pH (A), total dissolved sulfide (B), sulfate conversion
(C), and suspended biomass concentration (D) were measured at port 3 (outlet) of the bioreactor...102 Figure 5.15: Predicted volumetric sulfide production (mol/m3.d) for a PBR with reactor volume of 600 mL
and liquid feed rate of 80 mL/h. Effluent conditions were assumed to be 37 oC and 20 mM TDS.
G/L is the ratio of strip gas to liquid feed. Volumetric productivities were calculated using total
xiv
reactor volume. ..................................................................................................................................106 Figure 5.16: Results of a PBR fermentations at various feed rates and pH values showing the effect of G/L
ratio on sulfate conversion (A) and total dissolved sulfide concentration (B). All measurements were
based on port 3 (outlet) samples. .......................................................................................................108 Figure 6.1: Diagrammatic representation of a closed system model describing sulfide and carbonate
dissolved phase ionization and vapour-liquid equilibrium.................................................................114 Figure 6.2 Effect of temperature and pH on the mol % of H2S (A) and mol % of CO2 (B) in a closed
system. The system was assumed to have a liquid volume of 100 mL, headspace volume of 100 mL
(with N2 at 1 atm), and 20 mM of total sulfide (H2S(g), H2S(aq), HS-(aq)) and 40 mM total carbonate
(CO2(g), H2CO3(aq), HCO3-(aq), CO3
2-(aq))............................................................................................119
Figure 6.3: Temperature dependence of the first dissociation equilibrium constants for H2S(aq) and
CO2/H2CO3(aq) (B). .............................................................................................................................120 Figure 6.4: Diagram for mass balance analysis of a counter-current gas stripping column (adapted from
Metcalf and Eddy, 2003). Nomenclature described in Table 6.3. .....................................................123 Figure 6.5: Gas to liquid ratios (G/L, m3/m3) required to remove varying % dissolved sulfide from a liquid
stream (20 mM) at 20 oC (293 K) and 37 oC (310 K). It was assumed that the pH was sufficiently
low (pH < 5.0) that all of the dissolved sulfides were in the strippable H2S(aq) form and that
temperature dependent ionization was negligible. .............................................................................125 Figure 6.6: Process flow diagram of a possible process where an H2S free strip gas is first fed to bioreactor
to strip a portion of H2S in situ. The liquid is then acidified to convert the residual total dissolved
sulfides (TDS) to the strippable H2S(aq) species which are removed in a countercurrent stripping
column using gas from the bioreactor. Ci = liquid phase concentration (mM); Pi = gas phase H2S
partial pressure (atm). ........................................................................................................................127 Figure 6.7: Gas to liquid (G/L, m3/m3) ratios required to remove 100% dissolved sulfide from a liquid
stream (20 mM) using strip gases of varying initial H2S partial pressures (atm). G/L values were
evaluated at 20 oC (293 K) and 37 oC (310 K). The equilibrium H2S partial pressure in the exiting
gas (Pe = P3) is 0.17 atm at 293 K (vertical dotted line) and 0.25 atm at 310 K (vertical dotted-dashed
line). It was assumed that the pH was sufficiently low (pH < 5.0) that all of the dissolved sulfides
were in the strippable H2S(aq) form and that temperature dependent ionization was negligible. H2S
partial pressure of entering strip gas will likely be in the range of 0.04-0.21 atm. ............................128 Figure 10.1: Linear relationship between A480 nm and total dissolved sulfide concentration (mM). Data
points are mean values of triplicate analysis and the vertical error bars are standard deviation. .......158 Figure 10.2: Relationship between A420 nm and total dissolved sulfide concentration (mM). Data points are
mean values of triplicate analysis and the vertical error bars are standard deviation.........................159 Figure 10.3: Relationship between square root peak height (counts) and gas phase H2S concentration
(PPM, v/v). Data points are mean values of triplicate analysis and the vertical error bars are standard
xv
deviation. ...........................................................................................................................................160 Figure 10.4: Relationship between peak area and dissolved lactate concentration (mM). .........................161 Figure 10.5: Relationship between peak area and dissolved acetate concentration (mM)..........................161 Figure 10.6: Relationship between A600 nm and suspended cell biomass measured as cell dry weight (CDW
g/L). ...................................................................................................................................................162
1
Chapter 1: Introduction
In response to the world’s growing energy demands, it has become clear that there must
be an eventual shift away from the current fossil fuels based energy infrastructure. H2, as
a clean and potentially renewable fuel source, has been the focus of much research at all
levels of an alternative energy infrastructure, including its efficient production, storage,
and use. The potential for H2 as a ‘green’ fuel will only be realized if it can be produced
from a renewable source.
Today’s highly industrialized and populous society produces larges volumes of solid and
liquid organic wastes that contain significant amounts of recoverable energy. The
traditional method of recovering H2 from organic waste has been to produce CH4 via
anaerobic degradation followed by thermochemical conversion to H2. The most common
process for the conversion of CH4 to H2 is a combination of steam methane reforming and
the water gas shift reaction. Despite being an established process for H2 production,
steam methane reforming has the disadvantages of being highly endothermic and
requiring considerable plant infrastructure.
A proposed alternative is the production of H2S gas (by sulfate reducing bacteria) with
organic waste as the energy feedstock. Several methods for converting H2S to H2 are
currently under investigation (Luinstra, 1995; Ohashi et al., 1998). The industrial
sponsor for this study (Kingston Process Metallurgy Inc.) has developed a proprietary
technology that converts H2S to H2 via an exothermic reaction. This catalytic,
thermochemical conversion process has rapid kinetics, nearly complete yields and
2
appears to be competitive with steam methane reforming.
A simplified process flow diagram of the proposed process is outlined in Figure 1.1 and
shows the two primary unit operations. An organic feedstock is combined with sulfur
oxides (e.g. SO42-, SO3
2-, SO2) and fed to a sulfate reducing bioreactor. The biologically
produced H2S is then fed to the thermochemical reactor which produces H2 and
regenerates the sulfur oxide electron acceptor.
Figure 1.1: Simplified process flow diagram for the proposed process of producing H2 from organic waste via biogenic H2S. Full details of the H2S converter are omitted due to its proprietary nature.
The present study’s focus was the design and development of a bench scale, sulfate
reducing packed bed reactor. Factors such as inoculum composition, carrier materials for
biomass immobilization, process feed rates, and pH were evaluated to improve upon
current bioreactor technology and provide a suitable source of H2S for conversion to H2.
Comparisons were also made with methanogenic technology by a review of the relevant
literature.

3
Chapter 2: Literature Review
2.1 Anaerobic Degradation of Organic Matter
Anaerobic degradation is the basis for most methods of biological H2 production. It can
broadly be described as the process by which complex organic matter is sequentially
degraded by microorganisms, in the absence of oxygen, to produce CO2 and other
terminal products such as CH4 and H2S. Each step of this process involves syntrophic
relationships between different trophic levels of anaerobic bacteria. Figure 2.1 illustrates
the sequential nature of anaerobic degradation. Hydrolysis of the large, insoluble,
polymeric organic matter (e.g. fats, polysaccharides, and proteins) is accomplished by
extra-cellular enzymes. The soluble monomers (e.g. sugars, long chain fatty acids, and
amino acids) are further degraded by fermentative bacteria to intermediate products (e.g.
alcohols and organic acids). The most common terminal step in anaerobic degradation is
methanogenesis, but sulfate can become a significant alternative terminal pathway in the
presence of sulfate or similar sulfur oxide electron acceptor.

4
Figure 2.1: Pathways of anaerobic degradation of organic compounds under methanogenic and sulfidogenic conditions (Colleran et al., 1995). Fermentation intermediates includes short chain organic acids and alcohols. Abbreviations: FB – fermentative bacteria; OHPA – obligate hydrogen-producing bacteria; MPB – methane producing bacteria; SRB – sulfate reducing bacteria; HAc – hydrogenotrophic acidogenic bacteria.
2.2 Direct Biological Production of H2
Figure 2.1 reveals that H2 is produced as an intermediate product of anaerobic
degradation before it is consumed in either the methanogenic or sulfate reduction steps.
The direct production of H2 via anaerobic processes (dark fermentation) is an active area
of research. Recent review papers (Kapdan and Kargi, 2006; Ni et al., 2006) have
reported volumetric H2 productivities as high as 470 mol H2/m3.d (Lin and Jo, 2003)
which is within the same range of methane and sulfate reduction volumetric rates.
Despite high volumetric productivities, dark fermentation suffers from low yields. H2 is a
by-product of acidogenic fermentation and only a fraction of the total electron

5
equivalents are channeled into H2 with the balance being directed to organic acid
products (acetic, propionic, butyric, lactic, etc.). Due to thermodynamic limitations and
the numerous metabolic pathways that are simultaneously active in anaerobic
degradation, dark fermentation is unable to convert any more than 15 % of the electron
equivalents in a carbohydrate rich wastewater to H2 (Angenent et al., 2004). The balance
of the electron equivalents (as organic acids) can be further degraded by sulfate reducing
bacteria (SRB) or eventually methanogens. H2 itself is a substrate for SRB and
methanogens and will eventually be converted to CH4 or H2S if the anaerobic degradation
process is allowed to reach either of these terminal steps.
2.3 Photosynthetic H2 Production
Photosynthetic organisms such as the purple non-sulfur bacteria have been shown to
convert lactate and other fermentation intermediates, with input of light, into H2 (Lee et
al., 2002; Koku et al., 2002; Kondo et al., 2002 as cited by Nath and Das, 2004). The
high capital costs associated with photo-bioreactors and current gas recovery methods
renders this process cost-prohibitive until major advances are made in the relevant
technology areas.
2.4 Overview of Biological Methane Production
Biological methane production is carried out by a group of strict, obligate anaerobic
prokaryotes classified as archaea. Methanogens, as they are more commonly known,
convert the penultimate products of anaerobic degradation to CH4. The two most
common substrates are acetate and H2 (Table 2.1) of which the former accounts for 72 %
6
of methane production.
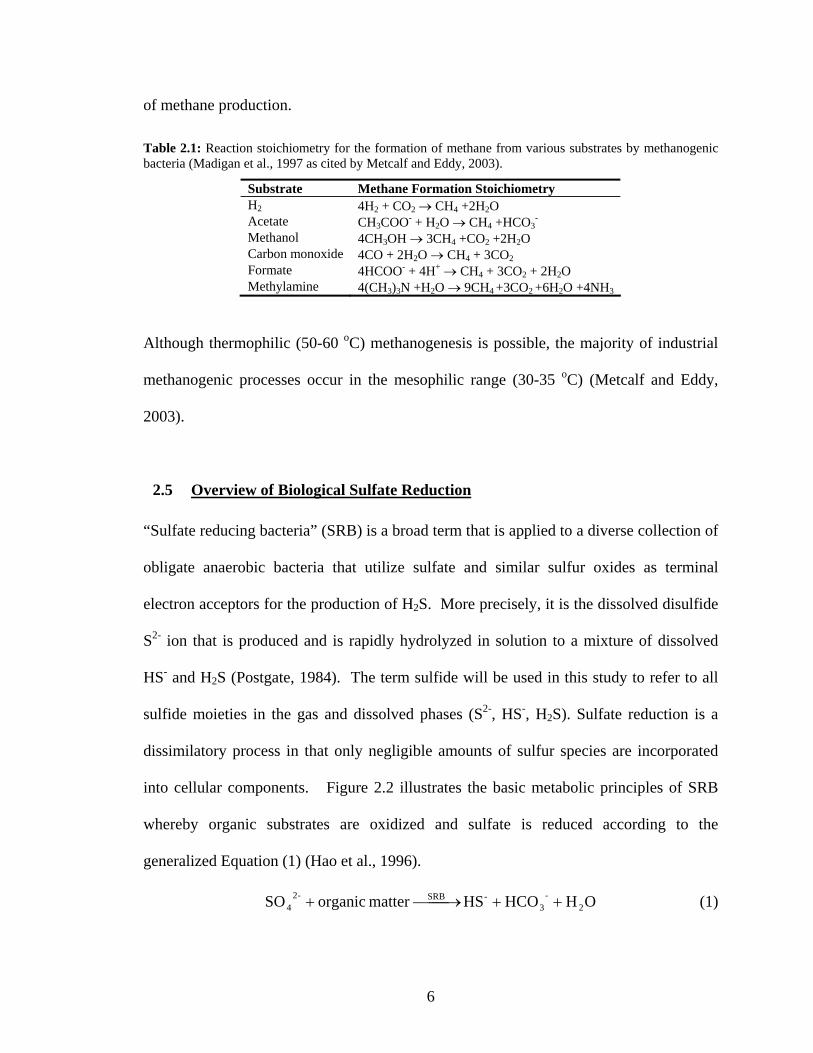
Table 2.1: Reaction stoichiometry for the formation of methane from various substrates by methanogenic bacteria (Madigan et al., 1997 as cited by Metcalf and Eddy, 2003).
Substrate Methane Formation Stoichiometry H2 4H2 + CO2 → CH4 +2H2O Acetate CH3COO- + H2O → CH4 +HCO3
- Methanol 4CH3OH → 3CH4 +CO2 +2H2O Carbon monoxide 4CO + 2H2O → CH4 + 3CO2 Formate 4HCOO- + 4H+ → CH4 + 3CO2 + 2H2O Methylamine 4(CH3)3N +H2O → 9CH4 +3CO2 +6H2O +4NH3
Although thermophilic (50-60 oC) methanogenesis is possible, the majority of industrial
methanogenic processes occur in the mesophilic range (30-35 oC) (Metcalf and Eddy,
2003).
2.5 Overview of Biological Sulfate Reduction
“Sulfate reducing bacteria” (SRB) is a broad term that is applied to a diverse collection of
obligate anaerobic bacteria that utilize sulfate and similar sulfur oxides as terminal
electron acceptors for the production of H2S. More precisely, it is the dissolved disulfide
S2- ion that is produced and is rapidly hydrolyzed in solution to a mixture of dissolved
HS- and H2S (Postgate, 1984). The term sulfide will be used in this study to refer to all
sulfide moieties in the gas and dissolved phases (S2-, HS-, H2S). Sulfate reduction is a
dissimilatory process in that only negligible amounts of sulfur species are incorporated
into cellular components. Figure 2.2 illustrates the basic metabolic principles of SRB
whereby organic substrates are oxidized and sulfate is reduced according to the
generalized Equation (1) (Hao et al., 1996).
OHHCO HSmatter organic SO 2-
3-SRB-2
4 ++⎯⎯→⎯+ (1)
7
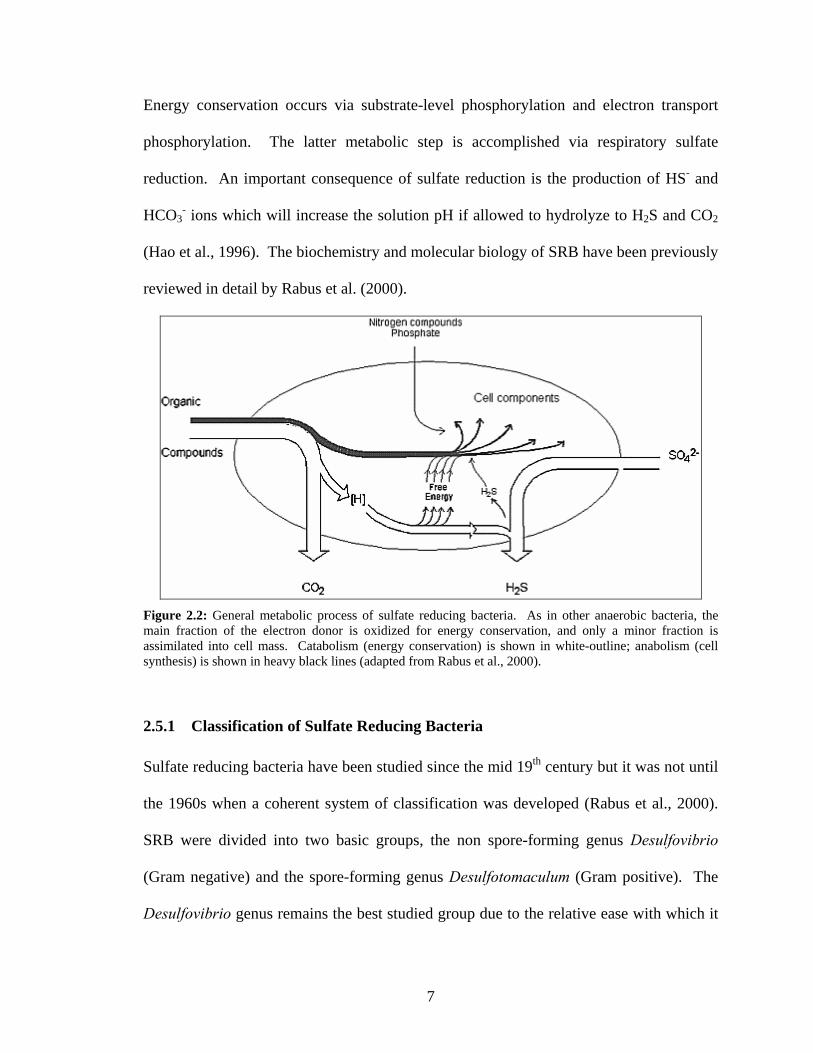
Energy conservation occurs via substrate-level phosphorylation and electron transport
phosphorylation. The latter metabolic step is accomplished via respiratory sulfate
reduction. An important consequence of sulfate reduction is the production of HS- and
HCO3- ions which will increase the solution pH if allowed to hydrolyze to H2S and CO2
(Hao et al., 1996). The biochemistry and molecular biology of SRB have been previously
reviewed in detail by Rabus et al. (2000).
Figure 2.2: General metabolic process of sulfate reducing bacteria. As in other anaerobic bacteria, the main fraction of the electron donor is oxidized for energy conservation, and only a minor fraction is assimilated into cell mass. Catabolism (energy conservation) is shown in white-outline; anabolism (cell synthesis) is shown in heavy black lines (adapted from Rabus et al., 2000).
2.5.1 Classification of Sulfate Reducing Bacteria
Sulfate reducing bacteria have been studied since the mid 19th century but it was not until
the 1960s when a coherent system of classification was developed (Rabus et al., 2000).
SRB were divided into two basic groups, the non spore-forming genus Desulfovibrio
(Gram negative) and the spore-forming genus Desulfotomaculum (Gram positive). The
Desulfovibrio genus remains the best studied group due to the relative ease with which it
8
is cultured and isolated. The archetypical species are the curved, motile cells of
Desulfovibrio desulfuricans that incompletely oxidize the preferred substrate lactate (or
pyruvate) to acetate (Widdel, 1988). During the 1970s and early 1980s the discovery of
significantly distinct groups of SRB, including complete oxidizers that were capable of
mineralizing acetate, lead to the creation of further genera (Desulfobacter, Desulfococcus,
Desulfonema, Desulfobulbus, and Desulfosarcina). Until the mid-1980s, classification
had been accomplished largely by observation of microbial nutrition, morphology and
some biochemical markers such as desulfoviridin protein, specific lipid fatty acids, or
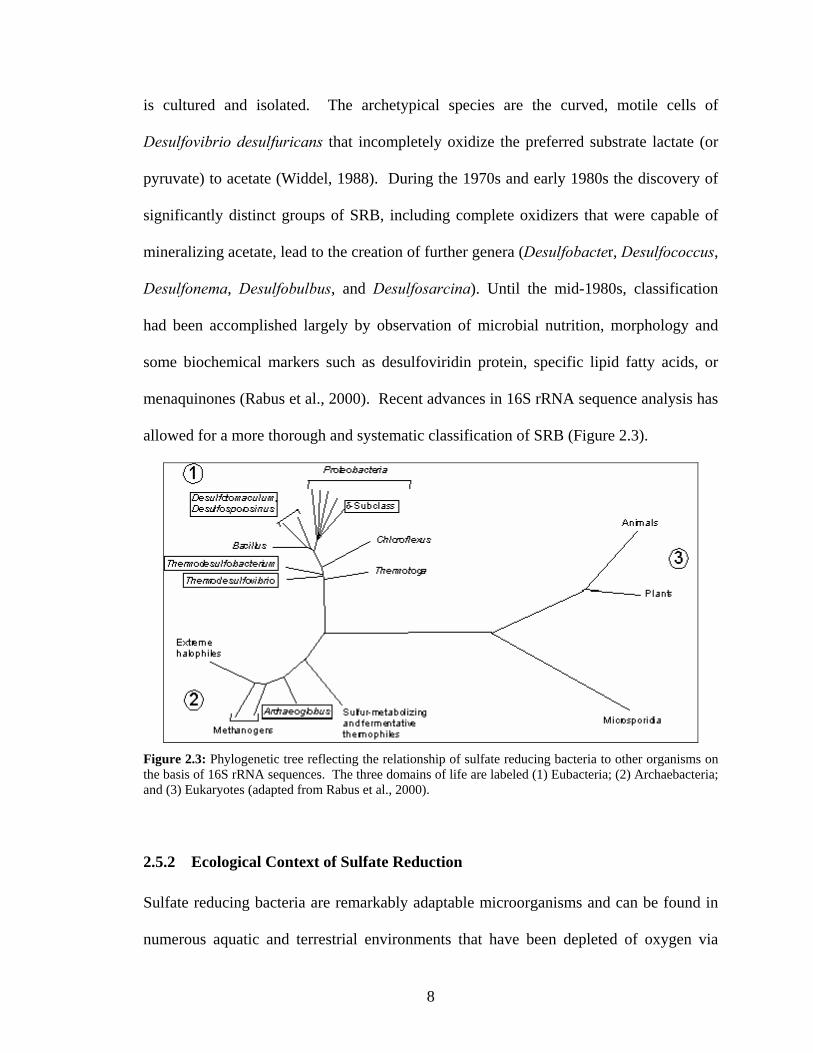
menaquinones (Rabus et al., 2000). Recent advances in 16S rRNA sequence analysis has
allowed for a more thorough and systematic classification of SRB (Figure 2.3).
Figure 2.3: Phylogenetic tree reflecting the relationship of sulfate reducing bacteria to other organisms on the basis of 16S rRNA sequences. The three domains of life are labeled (1) Eubacteria; (2) Archaebacteria; and (3) Eukaryotes (adapted from Rabus et al., 2000).
2.5.2 Ecological Context of Sulfate Reduction
Sulfate reducing bacteria are remarkably adaptable microorganisms and can be found in
numerous aquatic and terrestrial environments that have been depleted of oxygen via

9
aerobic decomposition of organic matter. SRB are found in soils; fresh, marine, and
brackish waters; hot springs; oil and gas wells; estuaries; sewage; and mammalian
intestines (Postgate, 1984). Incomplete oxidizing species such as Desulfovibrio are
frequently found in freshwater environments while marine environments contain larger
numbers of acetate mineralizing species. The well known Desulfovibrio species can
generally be found in any waterlogged area that contains sufficient sources of organic
matter and sulfate (Hao et al., 1996; Postgate, 1984). Table 2.2 provides an indication of
the relative number of SRB found in various environmental samples.
Table 2.2: Order of magnitude most probable number (MPN) count of sulfate reducing bacteria in environmental samples as cited by Hao et al. (1996). MPN per 100 mL unless otherwise stated.
Sample Type MPN Count (per 100 mL)
Sample Type MPN Count (per 100 mL)
aerobic fixed film 106-108 (per g VSS) marine sediment 105 activated sludge 105 (per g VSS) estuary sediment 107 anaerobic sludge 107-108 (per g VSS) raw wastewater 108 stream water 550 primary wastewater 108 methanogenic sewage sludge
106 secondary wastewater 102
pond water 104 activated sludge (aerobic)
105
gravel pit water 104 activated sludge (anaerobic)
105
SRB pure culture 109 anaerobic digested sludge
107
clay stratum groundwater
105 anaerobic sludge (enriched)
108
stagnant water 105 harbour silt 105 polluted stream water 103 estuary mud 105 stream water downriver from a paper mill
105 primary wastewater effluent
107
2.5.3 Electron Donors and Reaction Stoichiometry
Sulfate reducing bacteria are capable of using a wide range of substrates as electron
donors. SRB are divided into two broad nutritional groups based on their metabolic
products. One group comprises the SRB that incompletely oxidizes its carbon substrates
10
to acetate. The second group is capable of mineralizing select carbon substrates
(including acetate) to CO2 (Widdel, 1988). The incomplete oxidizers include the genera
Desulfovibrio and Desulfotomaculum. Incomplete oxidizers have significantly faster
growth rates than complete oxidizers and can achieve doubling times of 3-4 h if provided
with preferred substrates such as lactate and H2 under ideal conditions. Doubling times
for slower growing complete oxidizers are often greater than 20 h (Widdel, 1988). The
incomplete oxidation of lactate and the mineralization of acetate are described in Table
2.3.
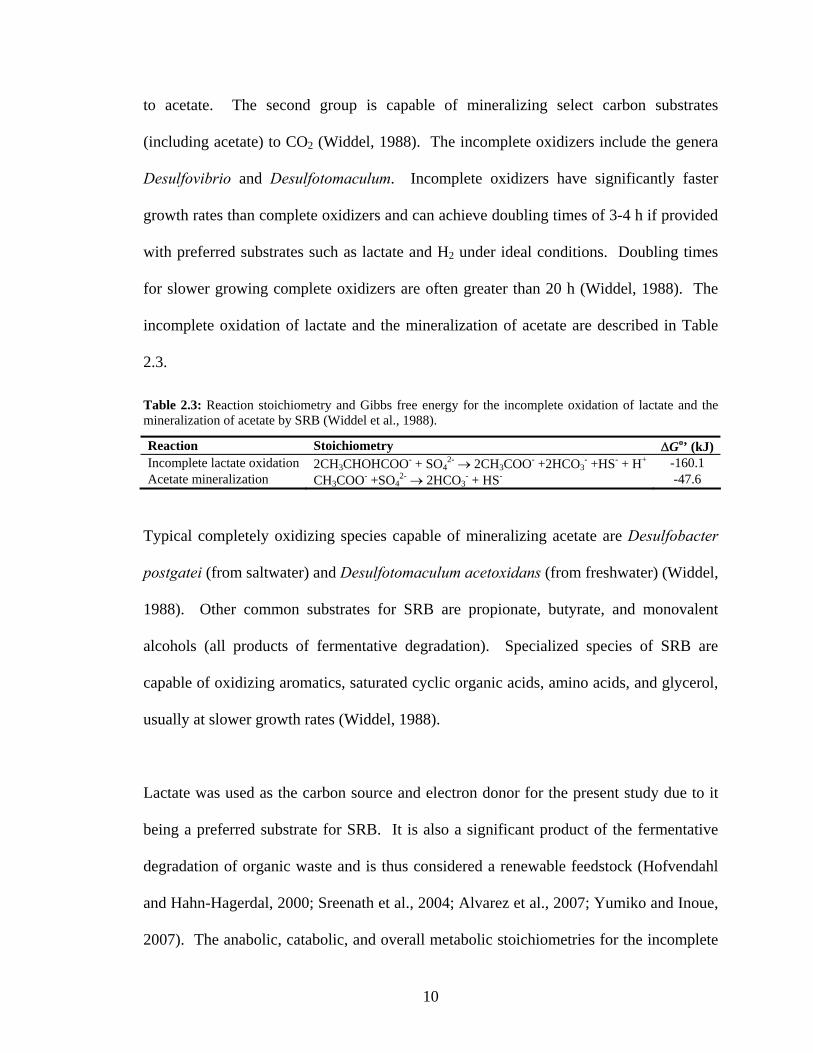
Table 2.3: Reaction stoichiometry and Gibbs free energy for the incomplete oxidation of lactate and the mineralization of acetate by SRB (Widdel et al., 1988).
Reaction Stoichiometry ΔGo’ (kJ) Incomplete lactate oxidation 2CH3CHOHCOO- + SO4
2- → 2CH3COO- +2HCO3- +HS- + H+ -160.1
Acetate mineralization CH3COO- +SO42- → 2HCO3
- + HS- -47.6
Typical completely oxidizing species capable of mineralizing acetate are Desulfobacter
postgatei (from saltwater) and Desulfotomaculum acetoxidans (from freshwater) (Widdel,
1988). Other common substrates for SRB are propionate, butyrate, and monovalent
alcohols (all products of fermentative degradation). Specialized species of SRB are
capable of oxidizing aromatics, saturated cyclic organic acids, amino acids, and glycerol,
usually at slower growth rates (Widdel, 1988).
Lactate was used as the carbon source and electron donor for the present study due to it
being a preferred substrate for SRB. It is also a significant product of the fermentative
degradation of organic waste and is thus considered a renewable feedstock (Hofvendahl
and Hahn-Hagerdal, 2000; Sreenath et al., 2004; Alvarez et al., 2007; Yumiko and Inoue,
2007). The anabolic, catabolic, and overall metabolic stoichiometries for the incomplete
11
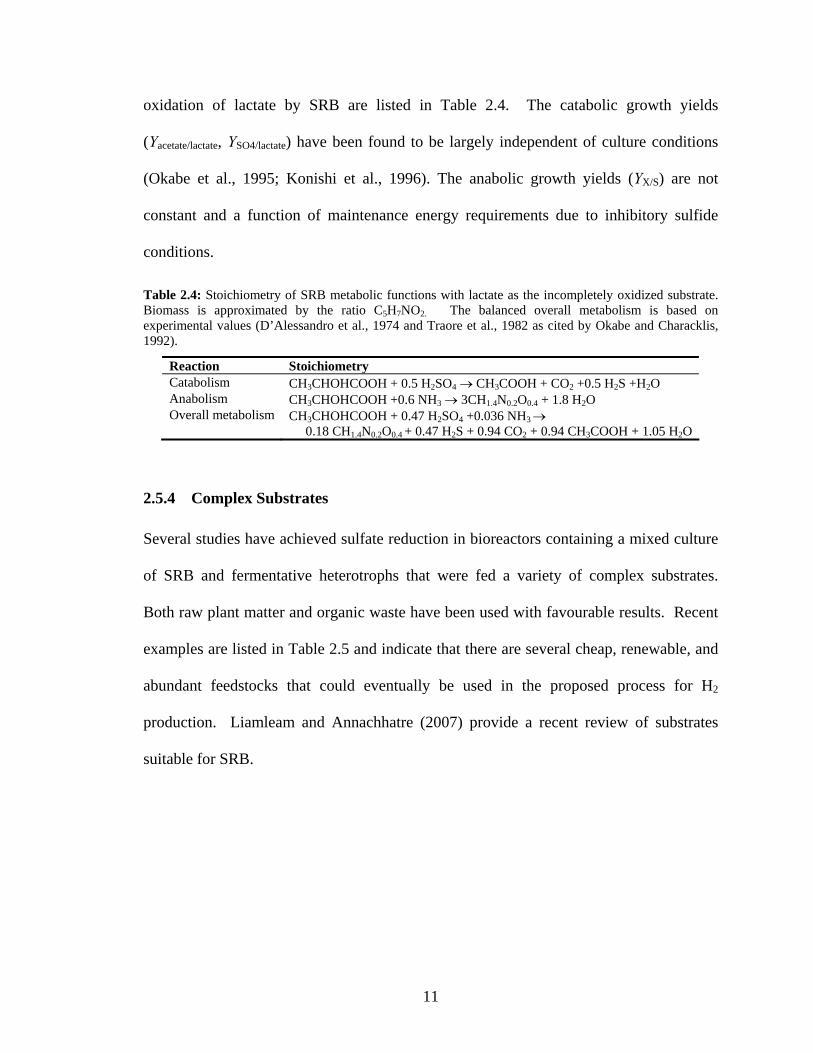
oxidation of lactate by SRB are listed in Table 2.4. The catabolic growth yields
(Yacetate/lactate, YSO4/lactate) have been found to be largely independent of culture conditions
(Okabe et al., 1995; Konishi et al., 1996). The anabolic growth yields (YX/S) are not
constant and a function of maintenance energy requirements due to inhibitory sulfide
conditions.
Table 2.4: Stoichiometry of SRB metabolic functions with lactate as the incompletely oxidized substrate. Biomass is approximated by the ratio C5H7NO2. The balanced overall metabolism is based on experimental values (D’Alessandro et al., 1974 and Traore et al., 1982 as cited by Okabe and Characklis, 1992).
Reaction Stoichiometry Catabolism CH3CHOHCOOH + 0.5 H2SO4 → CH3COOH + CO2 +0.5 H2S +H2O Anabolism CH3CHOHCOOH +0.6 NH3 → 3CH1.4N0.2O0.4 + 1.8 H2O Overall metabolism CH3CHOHCOOH + 0.47 H2SO4 +0.036 NH3 →
0.18 CH1.4N0.2O0.4 + 0.47 H2S + 0.94 CO2 + 0.94 CH3COOH + 1.05 H2O
2.5.4 Complex Substrates
Several studies have achieved sulfate reduction in bioreactors containing a mixed culture
of SRB and fermentative heterotrophs that were fed a variety of complex substrates.
Both raw plant matter and organic waste have been used with favourable results. Recent
examples are listed in Table 2.5 and indicate that there are several cheap, renewable, and
abundant feedstocks that could eventually be used in the proposed process for H2
production. Liamleam and Annachhatre (2007) provide a recent review of substrates
suitable for SRB.

12
Table 2.5: Complex substrates utilized by mixed cultures of fermentative heterotrophs and sulfate reducing bacteria.
Complex Substrate Reference wild type grass, bagasse, fresh blue gum prunings, fresh pine prunings, molasses, blue buffalo grass, wattle prunings, blue gum chips, Eragrostis grass, wattle sawdust, pine chips
Coetser et al., 2006
raw sewage sludge Yeh, 1999 cheese whey Deswaef et al., 1996 tannery effluent Boshoff et al., 2004a algae Boshoff et al., 2004b mushroom compost Hammack and Ednborn,
1992 oak chips, spent mushroom compost, waste newspaper recycling plant sludge Chang et al., 2000 whey Christensen et al., 1996 maple wood chips, sphagnum peat moss, leaf compost, conifer compost, poultry manure, and conifer sawdust
Zagury et al., 2006
cow manure La et al., 2003 leaf mulch, wood chips, sludge Waybrant, 2002 landfill leachate Nedwell and Reynolds,
1996 landfill leachate Henry and Prasad, 2000 molasses Annachhatre and
Suktrakoolvait, 2001 anaerobically digested municipal sewage sludge Selvaraj et al., 1997
2.5.5 Sulfite and SO2 as Alternative Electron Acceptors
The reduction of sulfate to sulfide is a complex biochemical process involving numerous
enzymes and electron carriers. Among the first steps in sulfate reduction is the activation
of sulfate with ATP to produce the intermediate adenosine-5’-phosphosulfate (APS).
APS is reduced to sulfite and then to the terminal product sulfide (Rabus et al., 2001). As
an intermediate in the sulfate reduction process, sulfite can also be provided in solution as
an alternative electron acceptor.
Sulfur dioxide gas is highly soluble in solution (Henry’s constant, H = 36 atm at 20 oC)
and is hydrolyzed to form sulfurous acid according to Equation (2). Sulfurous acid then
dissociates to form bisulfite and sulfite ions according to Equations (3) and (4).

13
3(aq)2(l)22(aq) SOHOHSO ↔+ (2)
(aq)3(aq)3(aq)2 HSOHSOH −+ +↔ (3)
(aq)2
3(aq)(aq)-
3 SOHHSO −+ +↔ (4)
The H2S conversion technology developed by the industrial sponsor has H2 and SO2 as its
products. It is proposed that eventually the SO2 stream will be recycled to the SRB
bioreactor as the terminal electron acceptor sulfite. In this manner the sulfur species is
retained in a closed process loop (Figure 1.1). The process of dissolving SO2 in solution
to form sulfite ions has been shown in the literature to be a suitable substitute for sulfate
ions. The use of SO2 has been reported with pure culture SRB grown on lactate (Dutta et
al., 2007) and in coculture with an anaerobic consortium grown on anaerobically digested
sewage sludge (Selvaraj et al., 1997). The later study experimentally confirmed the
stoichiometric conversion of SO2 to H2S with a COD requirement of 48 g COD/mol
SO32-.
2.5.6 Factors Affecting Growth
2.5.6.1 pH
The preferred pH range of SRB is around pH 7 with inhibition occurring at pH values
below 6.5 and above 8.5 (Widdel, 1988; Reis et al., 1992; Konishi et al., 1996; Azabou et
al., 2005). SRB however can survive acidic conditions and are commonly used to treat
acid mine drainage (AMD) wastewaters with pH values initially as low as 3.
Metabolically produced bicarbonate alkalinity neutralizes AMD to more favourable pH

14
conditions (Tsukamoto et al., 2004; Kolmert and Johnson, 2001; Glombitza, 2000).
2.5.6.2 Sulfide
The toxic effects of sulfide on bacteria, including SRB are well known and reported
qualitatively in the literature (Okabe et al., 1995). Not surprisingly, SRB have a greater
tolerance towards sulfide than most bacteria but the exact nature of the toxicity and
microbial inhibition continues to be the subject of investigation (Icgen and Harrison,
2006).
H2S is a weakly acidic gas when dissolved in solution and its aqueous concentrations are
governed by both pH and gas phase equilibria. Under the normal range of culture pH
values (6 to 8), sulfide is present in solution as either the HS-(aq) or H2S(aq) forms. The
first acid dissociation constant Ka1 is a function of temperature and the second
dissociation (Ka2 = 10-19 mol/L, 25 oC) may be considered negligible at typical microbial
culture conditions. The dissolved phase equilibrium is described by Equation (5). The
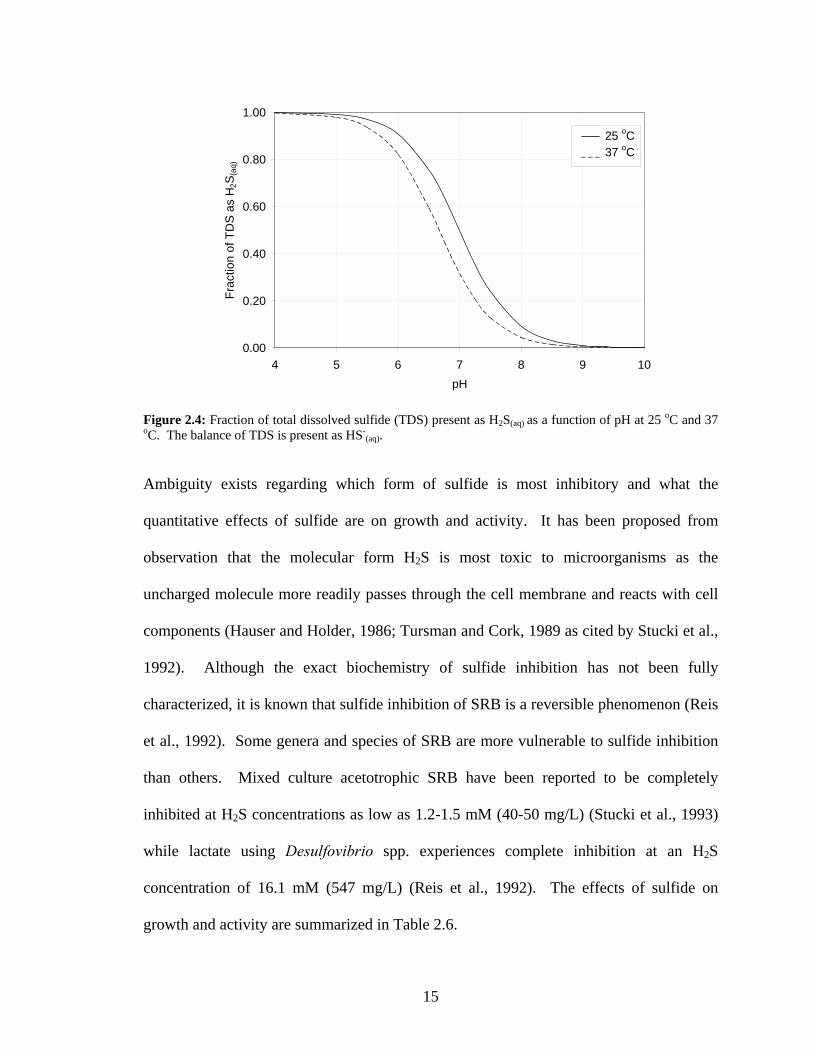
fraction of total dissolved sulfide (TDS) present in the H2S(aq) form is a function of pH is
shown in Figure 2.4.
(aq)(aq)(aq)2 HHS SH a1 +− +⎯⎯→←K (5)
15
0.00
0.20
0.40
0.60
0.80
1.00
4 5 6 7 8 9 10pH
Frac
tion
of T
DS
as
H2S
(aq)
293 K
300 K
25 oC37 oC
Figure 2.4: Fraction of total dissolved sulfide (TDS) present as H2S(aq) as a function of pH at 25 oC and 37 oC. The balance of TDS is present as HS-
(aq).
Ambiguity exists regarding which form of sulfide is most inhibitory and what the
quantitative effects of sulfide are on growth and activity. It has been proposed from
observation that the molecular form H2S is most toxic to microorganisms as the
uncharged molecule more readily passes through the cell membrane and reacts with cell
components (Hauser and Holder, 1986; Tursman and Cork, 1989 as cited by Stucki et al.,
1992). Although the exact biochemistry of sulfide inhibition has not been fully
characterized, it is known that sulfide inhibition of SRB is a reversible phenomenon (Reis
et al., 1992). Some genera and species of SRB are more vulnerable to sulfide inhibition
than others. Mixed culture acetotrophic SRB have been reported to be completely
inhibited at H2S concentrations as low as 1.2-1.5 mM (40-50 mg/L) (Stucki et al., 1993)
while lactate using Desulfovibrio spp. experiences complete inhibition at an H2S
concentration of 16.1 mM (547 mg/L) (Reis et al., 1992). The effects of sulfide on
growth and activity are summarized in Table 2.6.

16
Table 2.6: Summary of literature reporting the effects of sulfide on growth and activity on sulfate reducing bacteria (adapted from Okabe et al., 1995).
Microbe Substrate Conc. (mM)
pH Temp. (oC)
Reactor Observation References.
Desulfovibrio desulfuricans
lactate 16.1 7.0 35 chemostat 50% decrease in lactate oxidation. Decreased biomass yield and cell size.
Okabe et al., 1992
Desulfovibrio spp.
lactate 16.2 6.2-6.6
37 batch Ceased sulfate reduction. H2S was most toxic form.
Reis et al., 1991
Desulfovibrio spp.
lactate 16.1 6.2-6.6
37 batch Completely inhibited growth. Reversible toxicity
Reis et al, 1992
Desulfovibrio desulfuricans
lactate 7.84 7.0 35 chemostat 50% decrease in biomass yield.
Okabe et al., 1995
Studies evaluating the effect of sulfide inhibition of Desulfovibrio desulfuricans growing
on lactate media were carried out by Okabe et al. (1995). Microbial kinetics were
described by a non-competitive inhibition model [Equation (6)] where the specific growth
rate (μ) is decreased by the presence of sulfide, but the substrate half-saturation (KLac,)
coefficient is unaffected. Sulfide was found to increase the maintenance coefficient value
as shown in Figure 2.5. Other model parameters were: μmax - maximum specific growth
rate; S – lactate substrate concentration; Ki - inhibition coefficient; and i - sulfide product
concentration. Typical parameter values are summarized in Table 2.7.
( )( )iKSKSK
iLac
i
++= maxμ
μ (6)

17
Table 2.7: Summary of microbial kinetic parameters for Desulfovibrio desulfuricans grown at 35 oC on lactate media.
Kinetic Parameter Value Unit Reference μmax 0.34 h-1 Okabe et al., 1995 KLac 3.08 mg/L Okabe and Characklis, 1992 intrinsic
X/LacY 0.03 g cell/g lactate Okabe et al., 1995
m 0-11.5 g lactate/g cell.h Adapted from Okabe et al., 1995 Ki 251 mg/L Okabe et al., 1995
Figure 2.5: Effect of total sulfide concentration on maintenance coefficient (m) for Desulfovibrio desulfuricans growing on lactate medium (Okabe et al., 1995).
2.6 Methanogenesis and Sulfate Reduction Comparison
The production of H2 from organic waste via H2S is a novel proposal that compels a
comparison with the established CH4 based route. What follows is a comparison between
the two biological processes and a brief analysis of overall process yields.
As shown in Figure 2.1, sulfate reduction and methanogenesis are parallel pathways that
occupy roughly the same trophic level in the sequential anaerobic degradation of organic
matter. Due to their ecological overlap, methanogens and SRB often coexist wherever
anaerobic degradation occurs. The flow of electrons to a specific pathway is dictated
18
largely by the availability of a suitable terminal electron acceptor. SRB activity in nature
is often limited by the relative scarcity of sulfate in terrestrial environments.
Methanogenesis, in comparison, commonly use CO2 as a terminal electron acceptor
(Table 2.1). In the presence of sufficient sulfate concentrations, the metabolic pathway of
anaerobic degradation will often shift to toward sulfate reduction (Yamguchi et al., 1999;
Henry and Prasad, 2000).
2.6.1 Overall Volumetric Performance
In performing an overall comparison of methanogenesis and sulfate reduction, a useful
metric is bioreactor volumetric productivity (i.e. volumetric rate - the rate of substrate
consumption or product formation normalized with respect to reactor volume; mol/m3.d,
g/L.d). Volumetric productivity is an overall performance indicator that represents the
collective effect of various intrinsic system parameters such as microbial population,
kinetics, mass transfer, substrate type, residence times, and bioreactor design. Due to the
general similarity between the two microbial groups, overall volumetric productivities for
methanogenic and sulfate reducing bioreactors reported in literature are within the same
range with upper values in the range of 500-700 mol/m3.d. Typical methanogenic
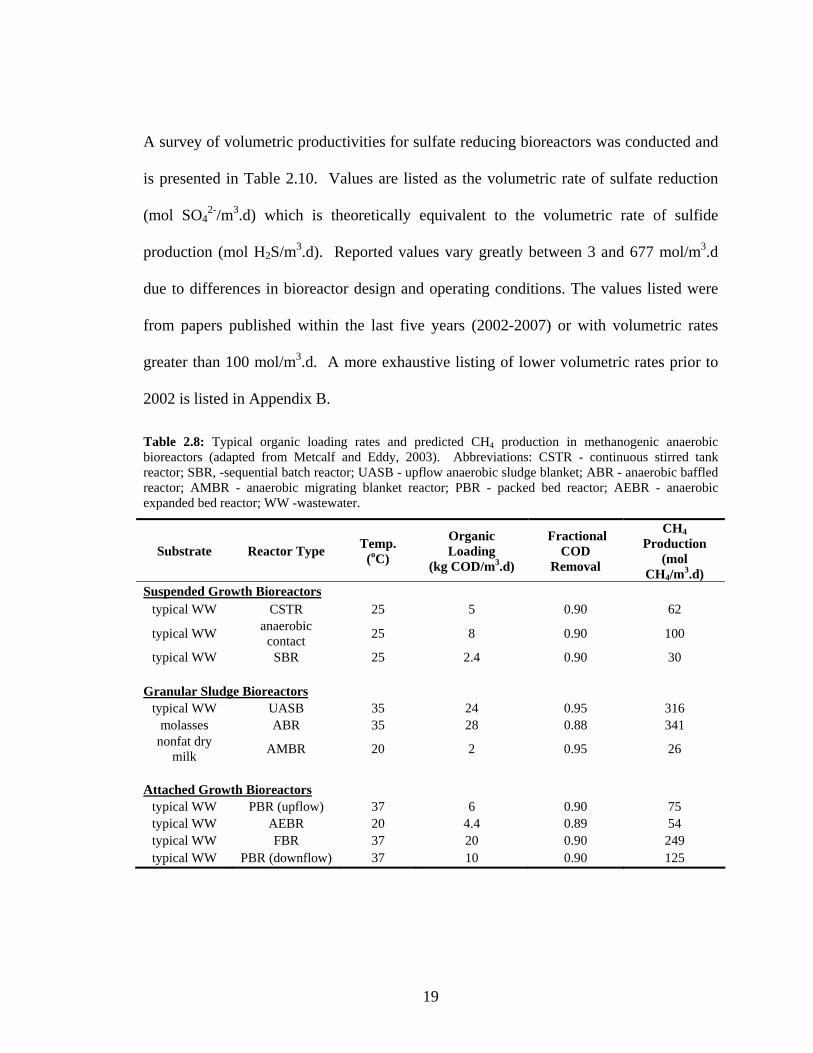
volumetric productivities are summarized in Table 2.8. Volumetric COD removal rates
(kg COD/m3.d) were converted to volumetric methane production rates (mol CH4/m3.d)
using the theoretical methane yield coefficient (YCOD/CH4 = 64 g COD/mol CH4) as
described in Appendix A. A review of recent methanogenic literature was also performed
(Table 2.9) and, expectedly, the values were within the same range of those listed in
Table 2.8.
19
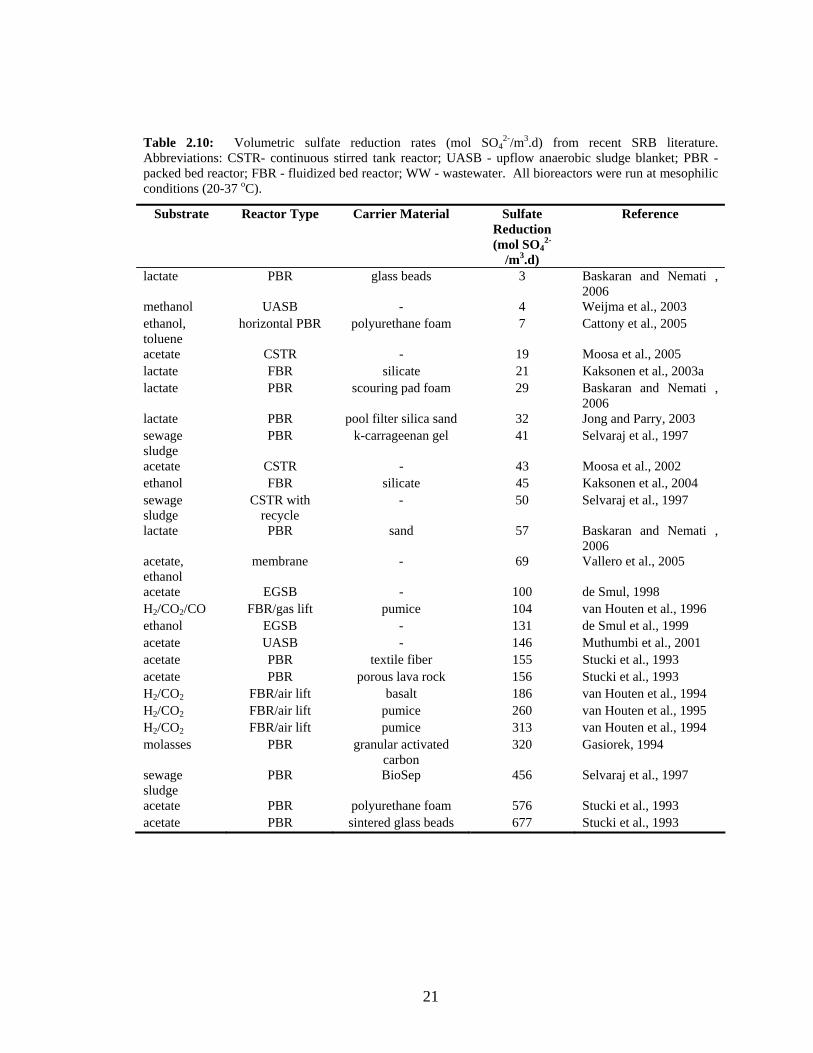
A survey of volumetric productivities for sulfate reducing bioreactors was conducted and
is presented in Table 2.10. Values are listed as the volumetric rate of sulfate reduction
(mol SO42-/m3.d) which is theoretically equivalent to the volumetric rate of sulfide
production (mol H2S/m3.d). Reported values vary greatly between 3 and 677 mol/m3.d
due to differences in bioreactor design and operating conditions. The values listed were
from papers published within the last five years (2002-2007) or with volumetric rates
greater than 100 mol/m3.d. A more exhaustive listing of lower volumetric rates prior to
2002 is listed in Appendix B.
Table 2.8: Typical organic loading rates and predicted CH4 production in methanogenic anaerobic bioreactors (adapted from Metcalf and Eddy, 2003). Abbreviations: CSTR - continuous stirred tank reactor; SBR, -sequential batch reactor; UASB - upflow anaerobic sludge blanket; ABR - anaerobic baffled reactor; AMBR - anaerobic migrating blanket reactor; PBR - packed bed reactor; AEBR - anaerobic expanded bed reactor; WW -wastewater.
Substrate Reactor Type Temp. (oC)
Organic Loading
(kg COD/m3.d)
Fractional COD
Removal
CH4 Production
(mol CH4/m3.d)
Suspended Growth Bioreactors typical WW CSTR 25 5 0.90 62
typical WW anaerobic contact 25 8 0.90 100
typical WW SBR 25 2.4 0.90 30
Granular Sludge Bioreactors typical WW UASB 35 24 0.95 316
molasses ABR 35 28 0.88 341 nonfat dry
milk AMBR 20 2 0.95 26
Attached Growth Bioreactors
typical WW PBR (upflow) 37 6 0.90 75 typical WW AEBR 20 4.4 0.89 54 typical WW FBR 37 20 0.90 249 typical WW PBR (downflow) 37 10 0.90 125

20
Table 2.9: Organic loading rates and associated CH4 production in recent methanogenic literature. All bioreactors were run at mesophilic conditions (25-37 oC). Abbreviations: SBR - sequential batch reactor; UASB - upflow anaerobic sludge blanket; ABR - anaerobic baffled reactor; PBR - packed bed reactor; AEBR - anaerobic expanded bed reactor; FBR - fluidized bed reactor; UASFF - upflow anaerobic sludge fixed film; WW - wastewater.
Substrate Reactor Type
Organic Loading (kg/m3.d)
FractionalCOD
Removal
CH4 Production (mol/m3.d)
Reference
tannery liquor UASB 0.5 0.78 5 Lefebvre et al., 2006 food and sewage sludge SBR - - 24 Kim et al., 2006 potato leachate PBR 4.7 0.90 27 Parawira et al., 2006 pulp and paper liquor ABR - - 35 Grover et al., 1999 potato leachate UASB 6.1 0.90 50 Parawira et al., 2006 olive mill WW SBR 5.3 0.80 59 Ammary, 2005 sunflower extract WW FBR 9.3 0.80 97 Borja et al., 2001 synthetic dairy WW FBR 10.0 0.85 129 Haridas et al., 2005 dairy wastewater UASB 13.5 0.86 161 Ramasamy et al., 2004 food waste UASB 12.9 0.96 161 Han et al., 2005 palm oil mill WW UASFF 23.2 0.90 266 Zinatizadeh et al., 2006 landfill leachate PBR 23.5 0.85 277 Calli et al., 2006 slaughterhouse WW PBR 30.0 0.71 295 del Pozo et al., 2000 slaughterhouse WW FBR 54.0 0.75 561 Borja et al, 1995
21
Table 2.10: Volumetric sulfate reduction rates (mol SO42-/m3.d) from recent SRB literature.
Abbreviations: CSTR- continuous stirred tank reactor; UASB - upflow anaerobic sludge blanket; PBR - packed bed reactor; FBR - fluidized bed reactor; WW - wastewater. All bioreactors were run at mesophilic conditions (20-37 oC).
Substrate Reactor Type Carrier Material Sulfate Reduction (mol SO4
2-
/m3.d)
Reference
lactate PBR glass beads 3 Baskaran and Nemati , 2006
methanol UASB - 4 Weijma et al., 2003 ethanol, toluene
horizontal PBR polyurethane foam 7 Cattony et al., 2005
acetate CSTR - 19 Moosa et al., 2005 lactate FBR silicate 21 Kaksonen et al., 2003a lactate PBR scouring pad foam 29 Baskaran and Nemati ,
2006 lactate PBR pool filter silica sand 32 Jong and Parry, 2003 sewage sludge
PBR k-carrageenan gel 41 Selvaraj et al., 1997
acetate CSTR - 43 Moosa et al., 2002 ethanol FBR silicate 45 Kaksonen et al., 2004 sewage sludge
CSTR with recycle
- 50 Selvaraj et al., 1997
lactate PBR sand 57 Baskaran and Nemati , 2006
acetate, ethanol
membrane - 69 Vallero et al., 2005
acetate EGSB - 100 de Smul, 1998 H2/CO2/CO FBR/gas lift pumice 104 van Houten et al., 1996 ethanol EGSB - 131 de Smul et al., 1999 acetate UASB - 146 Muthumbi et al., 2001 acetate PBR textile fiber 155 Stucki et al., 1993 acetate PBR porous lava rock 156 Stucki et al., 1993 H2/CO2 FBR/air lift basalt 186 van Houten et al., 1994 H2/CO2 FBR/air lift pumice 260 van Houten et al., 1995 H2/CO2 FBR/air lift pumice 313 van Houten et al., 1994 molasses PBR granular activated
carbon 320 Gasiorek, 1994
sewage sludge
PBR BioSep 456 Selvaraj et al., 1997
acetate PBR polyurethane foam 576 Stucki et al., 1993 acetate PBR sintered glass beads 677 Stucki et al., 1993

22
The similar volumetric rates between methanogenesis and sulfate reduction are not
surprising considering that both CH4 and H2S have an identical COD requirement of 64 g
COD/mol CH4 or H2S (Speece, 1996). Henry and Prasad (2000) performed a direct,
experimental comparison of sulfate reduction and methanogenesis using a series of
anaerobic bioreactors to treat landfill leachate. Bioreactors were inoculated with an
anaerobic consortium and supplemented with varying concentrations of sulfate. The
study confirmed that by varying the COD/SO42- ratio, the degradation pathway could be
directed towards either CH4 or H2S production. Volumetric COD removal rates (kg
COD/m3.d) remained similar across all the COD/SO42- ratios, verifying the equivalence
of the degradative pathways.
Due to the intrinsic similarity between methanogenesis and sulfate reduction, the most
significant differences between the two processes may arise from factors such as
bioreactor design, operability, and H2/CO2 mass balances. Methanogenic bioreactors are
an established and well characterized technology while sulfate reduction is a younger,
nascent technology (Colleran et al., 1995). Much of the past research in anaerobic
bioreactor design has focused on optimizing CH4 production by retention (i.e.
immobilization) of methanogenic biomass. SRB are known to exhibit inferior
immobilization properties compared to methanogens under certain circumstances
(Speece, 1996). It is foreseeable that improvements in volumetric sulfate reduction rates
will be accomplished via bioreactor designs that increase the immobilization of highly
active SRB biomass.
23
2.6.2 Process Operability
Minor process operability distinctions exist between methanogenic and sulfate reducing
bioreactors. Substrate overloading of anaerobic digesters can frequently lead to the
accumulation of organic acid intermediates decreasing the pH in a phenomenon known as
‘souring’. The souring process disrupts methanogenesis and can lead to total process
failure (Torre and Stephanopolous, 1986). In contrast, SRB are known for their ability
to treat highly acidic wastewaters. A tolerance to a greater range of pH values and
decreased sensitivity towards temperature disturbances (Sarner, 1990) suggests that SRB
are more resilient to potential process upsets.
The ideal feedstock for anaerobic processes is a high-COD wastewater such as industrial
effluent from food processing industries. These wastewaters are a source of easily
degradable and relatively innocuous organic substrates. SRB have the advantage of being
able to accept a wider range of substrates including recalcitrant aromatics that might be
otherwise toxic and/or resistant to methanogenic degradation (Chen and Taylor, 1997;
Boopathy et al., 1998; Chang et al., 2002). Sulfate reducing processes are also more
tolerant to heavy metals exposure, sequestering the metal cations as recoverable sulfide
precipitates. These advantages could be exploited if the feedstock was landfill leachate
which in addition to high COD levels, contains significant concentrations of heavy metals
and xenobiotics (Wiszniowski et al., 2007).
Both SRB and methanogens are obligate anaerobes and biologically inactive under
aerobic conditions. In the event of an oxygen incursion to an SRB bioreactor, the sulfide

24
product acts as a reducing agent to remove the oxygen. Methanogenic systems would
have to have oxygen removed by either aerobic depletion or gas scrubbing.
2.6.3 H2 and CO2 Balance
For the sustainable production of H2 it is desirable to minimize CO2 generation while
maximizing the H2 recovered from the organic feedstock. The CO2 and H2 yields for the
overall methanogenic and sulfate reducing processes are presented below using lactate as
a representative carbon source (1 mol lactate = 96 g COD). Yield values are summarized
in Table 2.11.
2.6.4 Sulfate/Sulfite Reduction with H2S Splitting
Assuming that lactate is oxidized completely to CO2 the net reaction is described by
Equation (7).
SH 3 OH 6 CO 6 SOH 3 CHOHCOOHCH 2 22 2 423 ++→+ (7)
The thermochemical conversion process produces H2 from H2S at a 1.0 mol/mol ratio.
The overall H2 yield for the sulfate reduction process is thus 1.5 mol H2/mol lactate or
15.6 mol H2/kg COD.
The theoretical COD demand for sulfite reduction is 48 g COD/mol SO32- (compared to
64 g COD/mol SO42-) which provides a small advantage to using SO2 (i.e. sulfite) over
sulfate as the electron acceptor [Equation (8)]. The overall H2 yield becomes 2.0 mol
H2/mol lactate or 20.8 mol H2/kg COD.

25
SH 2 OH 3 CO 3 SOH 2 CHOHCOOHCH 22 2 323 ++→+ (8)
2.6.5 Methanogenesis with Steam Methane Reforming and Water-Gas Shift
Degradation of lactate to CH4 is a multi-step process involving H2 and acetate
intermediates; the net reaction is shown in Equation (9).
243 CO 3 CH 3 CHOHCOOHCH 2 +→ (9)
The steam methane and water gas shift reactions are shown in Equations (10) and (11)
respectively. The net reforming equation is shown in Equation (12).
CO H 3 OH CH 224 +→+ (10)
222 CO H OH CO +→+ (11)
[ ] [ ]22242224 CO 3 H 12 OH 6 CH 3CO H 4 OH 2 CH3 +→+=+→+ (12)
The sum of Equation (9) and Equation (12) is the net reaction for production of H2 via a
methane based process [Equation (13)].
2223 H 12 CO 6 OH 6 CHOHCOOHCH 2 +→+ (13)
The overall H2 yield is thus 6 mol H2/mol lactate or 62.5 mol H2/kg COD.
Table 2.11: Summary of H2 and CO2 yields for production of H2 via biologically produced CH4 and H2S precursor molecules.
Reactions H2 Yield (mol H2/mol
lactate)
H2 Yield (mol H2/kg
COD)
CO2 Yield (mol CO2/mol
H2) Sulfate reduction with H2S splitting 1.5 15.6 2.0 Sulfite reduction with H2S splitting 2.0 20.8 1.5 Methanogenesis with steam methane and water-gas shift
6.0 62.5 0.5
Initial analysis of the yield values suggests that the CH4 based route for H2 production is

26
more efficient with regard to COD utilization and CO2 production. These calculations
however have omitted the external energy requirements of operating the thermochemical
conversion processes at elevated temperature and/or pressures. The biological reactions
occur at 1 atm and ambient temperatures (20-37 oC). The exothermic nature of H2S
splitting and the endothermic nature of steam methane may shift the H2 and CO2 yields in
favour of the H2S based process due to the diversion of CH4 for heating requirements.
There is also a significant difference in the plant and infrastructure requirements for the
thermochemical conversion processes. A detailed thermodynamic and cost analysis of all
the pertinent reactions and unit operations is outside the scope of this study but is
required to provide a more accurate appraisal of the two H2 production methods.
In summary, the biological production of CH4 and H2S occurs at similar volumetric rates.
Sulfate reducing bioreactors are a relatively inchoate technology that may benefit from
enhancements in immobilized cell bioreactor design to improve volumetric rates. The
exothermic nature of the H2S splitting process is a key advantage over endothermic CH4
conversion and further analysis is required for a more accurate comparison.
2.7 Practical Applications of Biological Sulfate Reduction
Production of H2S as an H2 precursor molecule is a novel use of sulfate reducing
bioreactor technology which has conventionally been applied to the treatment of sulfate
waste streams and for environmental bioremediation. Paper mills, molasses based
fermentation, flue gas desulfurization, phosphate fertilizer manufacturing are common
industries and processes that generate significant sulfate wastes (Colleran et al., 1995;

27
Lens et al, 2003; Azabou et al., 2007).
Treatment of AMD is the most common bioremediation application for SRB (Hulshoff et
al., 2001; Lens et al., 2002; Luptakova and Kusnierova 2005; Kaksonen et al., 2006;
Cohen, 2006; Sheoran and Sheoran, 2006). Biological sulfate reduction produces
bicarbonate alkalinity that neutralizes the acidic wastewater and the biogenic sulfide
complexes with heavy metals to form easily recoverable metal-sulfide precipitates.
Chromium, nickel, copper, zinc, iron, aluminium, and magnesium are among the metals
that have been recovered using SRB bioreactors (Jong and Parry 2003; Viera et al.,
2003).
A select number of SRB are capable of degrading aromatic compounds (Widdel, 1988).
This ability has been exploited for the destruction of priority pollutants such as benzene,
toluene, ethylbenzene and toluene (Chen and Taylor, 1997), polycyclic aromatic
hydrocarbons (Chang et al., 2002), and nitroaromatic explosives (Boopathy et al., 1998).
2.8 Sulfate Reducing Packed Bed Reactors
2.8.1 Rationale for Biofilm Immobilization
As anaerobic bacteria, SRB have intrinsically slow growth rates. This characteristic
limits their use in suspended cell bioreactors where under high flow rates, cells are
washed out faster than they can replicate. Biomass immobilization techniques allow the
retention of a high biomass concentration with simultaneous application of high liquid
throughput leading to improved volumetric rates. The solids residence time (SRT) and

28
hydraulic residence time (HRT) are effectively decoupled in an immobilized cell
bioreactor.
Granular sludge bioreactors have previously been applied for sulfate reduction but proper
granule development requires several months and is better suited for methanogenic
applications (O’Flaherty, 1997, Omil et al., 1997). More recent research has focused on
SRB biofilm reactors in the packed bed (Figure 2.6) and fluidized bed configurations
(Cattony et al., 2005; Kaksonen et al., 2006; Silva et al., 2006; and Alvarez et al., 2006).
The highest reported volumetric productivities have been accomplished in packed bed
reactors (Stucki et al., 1993; Selvaraj et al., 1997).
Liquid In
Liquid Out
Carrier material with attached
cells
Figure 2.6: Typical configuration for an upflow, packed bed reactor. Attached cells and biofilms remain immobilized on inert carrier materials while high liquid flow rates are applied to improve volumetric productivity.
Packed/fluidized bed reactors offer the advantages of faster start-up times and fewer
maintenance requirements compared to granular sludge bioreactors. Immobilization of
SRB in biofilms provides a degree of protection against oxygen exposure (Kolmert et al.,

29
1997) and increased process stability (Alvarez et al., 2006). Biofilm reactors may also
enhance microbial growth as it has been suggested that bacteria preferentially live in
surface attached communities (Chen et al., 1994; Costerton and Wilson, 2004).
2.8.2 Biofilm Immobilization Fundamentals
Attached growth in flowing systems is a common phenomenon and initiated by the
adhesion of a single monolayer of cells. Subsequent production of extracellular
polysaccharides (EPS) aids surface attachment and promotes the formation of microbial
communities surrounded by a ‘slimy’ matrix (Ye et al., 2005). Biofilm structure is non-
homogenous with the presence of individual microcolonies (Figure 2.7). A phenotypic
distinction exists between attached growth and suspended cells. Changes in genetic
regulation are responsible for production of molecular signals between cells and role
specialization can occur even among bacterial cells of the same species. Increased gene
expression has also been observed in mixed culture biofilms which suggests syntrophic
interaction between microbial species (Costerton and Wilson, 2004).
Figure 2.7: Conceptual model of a single species biofilm in a flowing environment. Microcolony structure is varied and convective fluid flow occurs around and below these microstructures within biofilms (Costerton et al., 1995).
In the presence of sufficient substrates and appropriate culture conditions, biofilms reach
a steady state thickness when the rate of cell detachment due to sloughing equals the rate
30
of biofilm growth. By varying the rate of biomass sloughing, biofilm reactors are capable
of operating at different steady state biomass concentrations (Van Loosdrecht and
Heijnen, 1993).
There are many factors responsible for the biofilm formation and the adhesion of cells to
inert surfaces. Of these factors, carrier pore size has been described as the most
important having a greater effect than macroscopic surface roughness and total surface
area (Huysman et al., 1983; Seth et al., 1995; Joo-Hwa et al., 1996). Optimal pore
diameter is in the range of one to five times the major diameter of the microbe, such that
materials with pores in the range of 1-10 μm are ideal for the immobilization of bacterial
cells (Ince et al., 2000). The importance of these pores stems from their ability to provide
an environment protected from fluid shear where cells can establish foundation
monolayers that serve as the basis for further growth. Carrier materials can either be
natural substances such as granular activated carbon (Harendranath et al., 1996) or highly
engineered materials with customizable surface charges such as ion exchange resin (Krug
and Daugulis, 1983).
2.8.3 Recent Literature
Development of improved packed bed sulfate reducing bioreactors is an active area of
research. Specific topics of focus have included evaluation of different carrier materials,
reactor geometry, substrate selection, and ability to treat heavy metal contaminated acidic
wastewaters. A review of the literature is presented below. Unless otherwise specified,
volumetric productivity is reported as volumetric sulfate reduction (mol SO42-

31
reduced/m3.d) which is theoretically equivalent to volumetric sulfide production.
Stucki et al. (1993) published a benchmark setting paper describing two acetate fed PBR
capable of volumetric rates that remain the highest in literature to date. A bioreactor
filled with polyurethane foam achieved a rate of 576 mol/m3.d. A similar bioreactor with
sintered glass packing achieved a rate of 677 mol/m3.d after 150 d. Inoculum included a
mix of pure strain acetotrophic SRB and biomass from anaerobic digesters exposed to
elevated levels of sulfate. The weakness of this bioreactor was that volumetric sulfate
loading had to be started at near zero levels and increased linearly over a period of 100 d
in order to maintain stable operation. Volumetric rates of approximately 260 mol/m3.d
were achieved within a start-up period of 30-40 d.
Gasiorek (1994) evaluated the use of granular activated carbon (0.5 cm diameter) in a
PBR for the reduction of SO2 to H2S. The downflow PBR was part of a larger system
that combined biotic and abiotic reactors to treat gas streams containing various sulfur
species. The paper did not discuss in detail the biochemical engineering aspects of their
bioreactor. Relatively high volumetric rates (320 mol/m3.d) were achieved using
Desulfovibrio desulfuricans fed with molasses. It was not clear as to how a pure culture
SRB was able to metabolize the complex substrate molasses without fermentative
heterotrophs.
Van Houten et al. (1994) compared the performance of basalt (diameter, 0.29 mm) and
pumice (diameter, 0.2-0.5 mm) particles as carrier materials and using H2 and CO2 for
32
autotrophic growth in a gas-lift bioreactor. Using granular sludge as inoculum, biofilm
formation was observed on pumice but not on basalt particles. Maximum sulfate
reduction was achieved on pumice particles at volumetric rate of 312 mol SO42-/m3.d
(HRT 4.5 h) after 10 d of operation.
Fukui and Takii (1994) investigated Desulfovibrio desulfuricans attached growth on FeS
precipitated particles and anion exchange resin (Dowex 1-X4, 100-200 mesh, chloride
form). Under lactate and sulfate rich conditions the sulfide production of resin and FeS
associated cells was found to be 2-3 % and 19-56 % respectively of suspended cells. The
authors cited other instances in literature where cells associated with anion exchange
resin performed at orders of magnitude less than suspended growth cells suggesting this
material is not a suitable carrier material for SRB.
du Preez and Maree (1995) investigated the treatment of waste streams rich in nitrate and
sulfate by SRB reactors. Using a PBR with pelletized ash, a volumetric rate of 25
mol/m3d was achieved using H2 and CO as the electron and carbon sources respectively.
Immobilization properties of the carrier was not the focus of the paper and the topic was
largely ignored in the discussion.
Deswaef et al. (1996) proposed using two PBR reactors in series to treat gypsum (calcium
sulfate) wastes. The bioreactors were packed with Plasdek™ PVC materials. Using a
mixed inoculum of fermentative bacteria and SRB in the first reactor (HRT, 6 h), cheese
whey was successfully applied as the carbon source. The second reactor (HRT, 12 h) was

33
inoculated with acetate degrading SRB. The combined reactors achieved a volumetric
rate of approximately 35 mol/m3.d.
Selvaraj et al. (1997) compared immobilization by coculture with floc-forming bacteria,
κ-carrageenan gel beads, and Bio-Sep™ porous polymer. An earlier paper (Selvaraj et
al., 1996) compared κ-carrageenan gel beads to alginate beads and found the former to be
more stable. Maximum volumetric rate of the CSTR with SRB flocs was found to be
only 50.4 mol SO2/m3.d. A PBR configuration with κ-carrageenan beads was unstable
beyond volumetric rates of 40.8 mol SO2/m3.d Bio-Sep™ porous polymer beads in a
PBR configuration achieved the highest volumetric rate of 456 mol SO32-/m3.d.
Unfortunately a start-up period with gradual increases in volumetric loading over four to
six months was required to attain this performance.
Cadavid et al. (1999) studied the impact of increasing the SO42-/COD ratio in a
horizontal-flow anaerobic immobilized sludge (HAIS) bioreactor. The biofilm carrier
used was polyurethane foam cubes with dimensions of 3-5 mm. Despite elevated sulfate
levels (COD/SO42- = 4.3) methanogenic bacteria were the dominant immobilized
population. The authors suggested this may be due to the incompatibility of polyurethane
foam with SRB. It is more likely that the origin of the inoculum, granular sludge, was the
cause of high methanogenic activity. The highest volumetric rate was 12.83 mol/m3.d.
Nagpal et al. (2000b) investigated the use of porous glass beads in a fluidized bed
configuration. Using ethanol as the feedstock, in conjunction with N2 sparging, a
volumetric rate of 66 mol/m3.d was achieved at HRT of 5.1 h. Inoculum was a mixture
34
of Desulfovibrio desulfuricans for ethanol degradation and Desulfobacter postgatei for
acetate degradation. Only partial oxidation of acetate was achieved. The fluidized bed
design was rationalized by its improved mass transfer characteristics over packed beds.
Christy (2001) compared the rate of sulfate reduction in column reactors with and without
polypropylene pall ring packing (diameter, 15.0 mm; surface area, 10.8 m2/m3). Using
mixed cultures obtained from local sewage treatment plants the lactate fed bioreactors
achieved a volumetric rate of 6.97 mol/m3.d (HRT, 0.83 d). The author did not ascertain
if the packing material or inoculum source was responsible for the negligible SRB
immobilization that was observed.
Glombitza (2001) used crushed lava rocks successfully in a pilot scale PBR treating
AMD. The bioreactor was 3.9 m3 in volume achieved a volumetric rate of 33.5 mol /m3.d
at HRT of 4.2 h. Methanol was the organic substrate and operation was found to be
stable for a period of several months.
Kolmert and Johnson (2001) investigated sulfate reduction in PBRs packed with
Poraver™ porous glass beads at pH levels representative of AMD (pH < 4). Earlier work
had shown Poraver beads to have superior performance to suspended plastic carrier
particles (Kolmert et al., 1997). Average volumetric rates were 2.6-3.1 mol/m3.d at HRT
of 2.1 d. A mixed ethanol/lactic acid/glycerol feed was used as the organic substrate.
After three months biofilm thoroughly colonized the surface and outer pores of the beads
but the inner pores remained relatively bare. It is possible that absence of inner
colonization was due to low inner pore connectivity.
35
Battaglia-Brunet et al., (2002) used a fluidized bed reactor with a volcanic ash basaltic
carrier material (2-5 mm major dimension) to study the mechanism of Cr (VI) reduction
by SRB. Immobilization evaluation was not the focus of this study and the presence of Cr
(VI) acted as a sulfate reduction inhibitor (Smith and Gadd, 2000). An accurate appraisal
of the potential of this carrier for SRB immobilization is therefore difficult. The
volumetric rate achieved was 45 mol/m3.d
Waybrant et al. (2002) proposed the use of a packed bed style reactor for in situ treatment
of AMD. A reactive barrier was built into the site and incorporated crushed pyrite, silica
sand, leaf mulch, wood chips, sawdust, sewage sludge, creek sediment, and limestone for
the combined purposes of biofilm carrier, inoculum source and electron donor source.
The mixture was also supplemented with lactate and calcium sulfate to assist in the
initiation of sulfate reduction. Relatively low volumetric rates were observed (1.21
mol/m3.d) and the in situ configuration employed would likely not be well adapted for an
industrial, high-rate application.
A recent series of articles from the Kaksonen research group based in Finland has studied
the use of sulfate reducing FBR for the treatment of AMD. Kaksonen et al. (2003a)
reported that a silicate (diameter 0.5-1 mm) packed FBR and a UASB bioreactor both had
comparable volumetric rates of 20.8 mol/m3.d. A second paper (Kaksonen et al., 2003b)
found that lactate as the substrate promoted rapid reactor startup. The substrate could
then be switched to less costly ethanol over a period of 50 d without a significant
decrease in performance. A third paper (Kaksonen et al., 2004) achieved a volumetric
36
rate of 44.8 mo/m3.d (HRT, 6.5 h) in the ethanol fed PBR. A non-competitive model was
developed to describe sulfide inhibition kinetics. Comparison of the model with the
literature highlighted the need to recognize that inhibition is a function of pH, SRB
species, organic substrate, and biomass morphology (biofilm, granular, or suspended). It
also emphasized that sulfide inhibition has independent effects on growth, substrate
utilization, and sulfate reduction. A fourth paper (Kaksonen et al., 2004) investigated the
long term effect (393 d) of lactate and ethanol feeding on microbial ecology. Molecular
methods were used for species identification. The ethanol fed bioreactor exhibited
greater population diversity which was credited with providing greater adaptability to
environmental changes. The most recent paper (Kaksonen et al., 2006) summarized the
key findings from their previous papers and demonstrated the applicability of sulfate
reducing FBRs for treatment of acidic metal- and sulfate-containing wastewater.
Silva et al. (2002) evaluated the treatment of a sulfate-rich wastewater using a PBR with
polyurethane foam. The focus of the study was to test different parameters and operation
conditions (batch, semi-continuous) for treating an industrial effluent with sulfate
concentration of 12-35 g/L. In semi-continuous mode, volumetric rates of up to 22.3
mol/m3.d were achieved. Inoculum was obtained from an industrial wastewater treatment
plant and from granular sludge treating domestic sewage and required 83 d to adapt to
sulfate reducing conditions. No clear indication of was made to the suitability of
polyurethane foam for SRB immobilization.
Jong and Perry (2003) investigated the use of a PBR with commercial pool filter sand for
the treatment of heavy metal contaminated water. Sulfate reduction rates reached 31.7

37
mol/m3.d treating a lactate supplemented metal contaminated influent. Inoculum
enriched from mine site water required 14 d until sufficient biofilm had developed for
bioreactor operation. Observations from this paper revealed that the silica sand may be
prone to clogging with excessive biomass and that high up-flow velocities will result in
sloughing.
Beyenal and Lewandowski (2004) investigated the use of hematite and quartz packed flat
plate reactors for treatment of dissolved Pb2+ ions. After seven weeks of operation
Desulfovibrio desulfuricans (G20) biofilm densities reached values of 90 g/L (hematite)
and 60 g/L (quartz). Despite having a higher biomass density, the hematite system had
lower sulfide concentrations due to precipitation of sulfide with Fe2+ ions within the
hematite. The iron-free quartz would likely be a better carrier material for the production
of free sulfide.
Tsukamoto et al. (2004) compared the use of rock (diameter 0.64-1.9 cm), wood (major
dimension 2-7 cm), and plastic packing (major dimension < 1 cm) in PBRs for the
removal of iron and other metals from AMD. These materials were found to have
superior characteristics compared to straw and horse manure which had been used at a
field scale bioreactor. Exact volumetric rates were not reported but sulfate reduction was
highest in the rock filled bioreactor. This work was consistent with that of Lyew and
Sheppard (1997) that suggested rock/gravel was a suitable SRB a carrier material,
although detailed quantification of biomass immobilization was not provided.
Gibert et al. (2005) attempted to treat synthetic AMD using SRB immobilized in a
38
column filled with crushed calcite, municipal compost, and river sediment. The compost
was intended as the organic substrate and the river sediment served as the primary
inoculum. Sulfate reduction was unsuccessful and sulfide was not detected in the column
effluent. Metals removal was attributed to sorption onto the compost material and
inorganic precipitation reactions. Municipal compost as the organic substrate was found
to have insufficient and/or unsuitable organic material to support to sulfate reduction,
consistent with earlier findings (Gibert et al., 2004). Due to low SRB microbial activity
the applicability of calcite as a carrier material was not sufficiently evaluated.
Inappropriate inoculum selection may also have played a role in sulfate reduction failure.
Cattony et al. (2005) used a horizontal-flow anaerobic immobilized biomass (HAIB)
bioreactor packed with polyurethane foam to degrade ethanol and toluene. The intended
application was bioremediation of Brazilian gasoline spills which contain high fractions
of ethanol. A sulfate volumetric rate of 7.28 mol/m3.d (HRT, 12 h) was obtained using
inoculum from a poultry slaughterhouse UASB bioreactor. Immobilization of biomass
on the polyurethane foam was greatest near the inlet of the reactor with loadings as high
as 620 mg VSS/g PU foam.
Baskaran and Nemati (2006) evaluated sand (diameter, 225 μm), scouring pad foam (1 x
1 x. 0.5 cm), and glass beads (diameter, 3 mm) as carrier materials for a mixed SRB
culture being fed lactate. The PBR packed with sand achieved the highest volumetric rate
of 57 mol/m3.d, followed by scouring pad foam (29 mol/m3.d), and finally glass beads (3
mol/m3.d). A direct relationship existed between sulfate reduction rates and available
surface area. Available surface area in the sand PBR was 145 m2, scouring pad foam had
39
3.2 m2/bioreactor and glass beads had 0.6 m2/bioreactor. This study provided good
comparative performance data on the carrier materials, but extensive reactor run times
(71-119 d) were required to obtain the listed volumetric rates.
Alvarez et al. (2006) compared the performance of Poraver™ porous glass beads
(diameter 10-20 mm) and pumice (10 x 15 x 15 mm) in PBRs. Factorial design methods
were used to optimize the dissolved sulfide concentration by adjusting the lactate and
sulfate concentrations to 67 mM and 46 mM respectively. Effluent sulfide concentrations
of 9.8 mM and 15 mM for the pumice and Poraver™ packed reactors respectively. The
inoculum (brewery sludge) required a recirculation period of two months at an HRT of
100 h for satisfactory biofilm development. Volumetric rates were not reported but both
carrier materials were found to be able to support stable and robust biofilms. The
development of good biofilms was partially attributed to the presence of several SRB
species and non-SRB heterotrophs as identified by molecular methods.
Silva et al. (2006) evaluated four carrier materials for their ability to immobilize
methanogenic bacteria and SRB. The materials evaluated were polyurethane foam,
activated carbon, alumina ceramic, and polyethylene (Table 2.12). Volumetric rates were
not assessed, rather the paper focused on microbial ecology of the biofilms that
developed on each of the carrier materials. Granular sludge from an UASB bioreactor
treating poultry slaughterhouse wastewater served as the inoculum. Polyurethane foam
exhibited the best specific immobilization capability of (872 mg total volatile solids/g
support). Polyurethane and the activated carbon were found to be preferentially

40
colonized by SRB; polyethylene by hydrolytic and fermentative bacteria; and alumina
ceramic by methanogens. This work was consistent with other research that had
suggested that polyurethane foam (Stucki et al., 1993) and granular activated carbon type
materials such as activated carbon (Gasiorek, 1994) are ideally suited for SRB
immobilization.
Table 2.12: Characteristics of support materials evaluated by Silva et al. (2006). Abbreviations: PU - polyurethane foam; AC- activated carbon; CE - alumina ceramic; PE - polyethylene.
Support material characteristics PU AC CE PE Shape Cubic Irregular pellet Cubic Cylindrical Apparent density (g/mL) 0.023 0.51 0.46 0.40 Equivalent diameter (cm) 0.6 0.5 0.5 0.5 Porosity 0.92 0.43 0.75 - Mean pore diameter (μm) 543 1.9 84.7 - Surface area (m2/g) 43.8 3.51 - 2.05
2.9 Scope of Thesis
Recent research in the area of sulfate reducing bioreactors has focused on the packed bed
reactor configuration. High volumetric rates (~600 mol/m3.d) have been achieved only
after extended start-up periods in excess of 100 d. Two key design criteria that affect
bioreactor performance are carrier material selection and the microbial inoculum. While
numerous carrier materials have been evaluated for immobilization potential the research
has been spread across individual studies under different experimental conditions. Two
recent studies (Baskaran and Nemati, 2006; Silva et al., 2006) have performed
meaningful evaluations of several carrier materials, but many of the materials tested have
been found to be unsuitable for SRB immobilization.
The inoculum’s microbial kinetics and intrinsic ability for attached growth have a
considerable effect on bioreactor performance. Despite this fact, most previous studies
41
have used undefined consortia and neglected to investigate the potential benefit of
rational inoculum composition design.
The majority of sulfate reducing bioreactor applications are wastewater treatment where
the production of H2S is considered a nuisance by-product or AMD remediation where
the preferred state of the sulfide product is in the dissolved phase. There has been little
interest in the recovery of a gas phase product.
The objectives of the present study were to maximize the volumetric productivity of a
sulfate reducing PBR and optimize conditions for recovery of a gas phase H2S product.
The aspect of carrier material selection was addressed by evaluating four candidate
materials under controlled experimental conditions. Polyurethane foam and Poraver™
porous glass beads were selected due to their proven ability for SRB immobilization.
Bone char and Celite™ R-635 diatomaceous earth pellets had not been previously been
used with SRB but were selected due their proven ability to immobilize other anaerobic
bacteria. The effect of inoculum composition was investigated by comparing a
benchmark pure culture (Desulfovibrio desulfuricans) with an undefined SRB
consortium. Inoculum composition optimization was based on immobilization potential
and kinetic performance criteria. Initial continuous PBR fermentations were performed
to characterize the bioreactor system behaviour and decrease the start-up period required
to achieve high volumetric productivities. An N2 strip gas was implemented in the final
PBR fermentations for H2S product recovery. pH adjustment was investigated as a
method of increasing both stripping efficiency and H2S concentration in the strip gas.
42
Chapter 3: Materials and Analytical Methods
3.1 Chemicals
All chemicals (unless otherwise specified) were analytical grade and obtained from
Fisher Scientific Ltd. (Nepean, Ontario), Sigma Aldrich Canada Ltd. (Oakville, Ontario),
and Alfa Aesar (Ward Hill, Massachusetts).
3.2 Analytical Methods
3.2.1 Total Dissolved Sulfide (TDS)
Total dissolved sulfide (H2S(aq), HS-(aq),) S2-
(aq)) were determined by the
spectrophotometric method of Cord-Ruwisch (1985). The assay is based on the
precipitation of sulfide as colloidal copper sulfide. Samples were analyzed immediately
to minimize oxidation and volatilization.
Using 1.5 mL microcentrifuge tubes, 50 μL of culture sample was mixed with 950 μL
copper reagent solution (aqueous solution of 50 mM HCl and 5 mM CuSO4.5H2O) and
then vortexed for 5 seconds and the relative absorbance was measured immediately at
480 nm using a Biochrom Ultrospec 3000 UV/Visible spectrophotometer.
Calibration standards from (0-20 mM, 0-641 mg/L S2-) were prepared by diluting
certified solutions of 3 % w/v Na2S.9H2O (LabChem, Pittsburgh, Pennsylvania) in
degassed, deionized water. Efforts were made to minimize contact of the standards with
air. The linear calibration curve is shown in Appendix C.

43
3.2.2 Dissolved Sulfate
Sulfate concentrations were determined by the turbidimetric method of Kolmert et al.
(2000). The assay is based on the precipitation soluble sulfate ions as barium sulfate.
Samples to be analyzed for sulfate were treated with an excess of crushed zinc acetate
dihydrate crystals to precipitate dissolved sulfide as zinc sulfide. Fixation of sulfide
prevented oxidation to sulfate.
Using 1.5 mL microcentrifuge tubes, 1 mL culture samples were vortexed for 5 seconds
with ~0.01 g of crushed zinc acetate dihydrate crystals. The mixture was then
centrifuged for 10 min at 6000 RPM and 4 oC using a Jouan MR 14.11 centrifuge. 50 μL
of the supernatant was mixed with 950 μL of conditioning fluid (Table 3.1) in a fresh
microcentrifuge tube and vortexed for 5 seconds. Finally, ~0.01 g of crushed barium
chloride dihydrate crystals was added to the mixture which was then vortexed for 15
seconds and the relative absorbance was immediately read at 420 nm using a Biochrom
Ultrospec 3000 UV/Visible spectrophotometer.
Calibration standards (0-48 mM) were prepared using sodium sulfate (ACS grade, Fisher
Scientific) and deionized water. The relationship between sulfate concentration and A420
was a 3rd order polynomial as described by Kolmert et al. (2000). The calibration curve
is shown in Appendix C.

44
Table 3.1: Composition of sulfate assay conditioning fluid (per 1000 mL).
Component Quantity NaCl 150 g glycerol 100 mL (126 g) concentrated HCl (12.1 M) 60 mL 90 % ethanol (histological grade) 200 mL deionized water 640 mL
3.2.3 Gas Phase H2S
Gas phase H2S concentration was measured using a Varian 3400CX gas chromatograph
(GC) equipped with a pulsed flame photometric detector and a Varian 1.5 % silicone
Carbopack B 60-80 mesh 8’x1/8”x2.4 mm analytical column. Bioreactor strip gas
samples were diluted as required with ultra high purity (UHP) N2 to obtain H2S
concentrations within the linear range of the GC. Helium was used as the carrier gas and
the injector, column, and detector were set to 110 oC, 150 oC, and 60 oC respectively.
Calibration standards were prepared using 20 and 200 PPM H2S (v/v, balance N2)
calibration gases (Calgaz Air Liquide, Cambridge, Maryland). All injections were 250
μL using a gas tight syringe and appropriate dilutions were made using UHP N2. Peaks
were analyzed using the Varian Star software package and a linear calibration curve for
H2S concentration and square root peak height was obtained (Appendix C)
3.2.4 Lactate and Acetate
Dissolved lactate and acetate were measured by high pressure liquid chromatography
using the following Waters (Milford, Massachusetts) components: Model 515 HPLC

45
Pump, Model 2487 Dual λ Absorbance Detector (set to 210 nm), Atlantis dC18 5 μm,
4.6x20 mm guard column, and Atlantis dC18 5 μm, 40x150 mm analytical column. The
mobile phase was 20 mM NaH2PO4.2H2O (pH adjusted to 2.7 with 3 M H3PO4) at 1.2
mL/min. The mobile phase and calibration standards were prepared using degassed
deionized water. Calibration standards were prepared using sodium lactate (60 % syrup
w/w, Sigma-Aldrich) and sodium acetate trihydrate (HPLC grade, Fisher Scientific).
Linear calibrations curves are shown in Appendix C.
1 mL of liquid culture samples were centrifuged at 6000 RPM for 10 min. Samples were
assayed immediately after centrifugation or frozen for later analysis. 200 μL of the
supernatant was mixed with 40 μL of concentrated (15 M, 86 % w/v) H3PO4 before being
injected as 20 μL (measured loop) volumes.
Chromatographic data was collected using Waters Millenium32 Chromatography
Manager software and peak areas were calculated using Origin Pro 7.5 (Student Version)
software.
3.2.5 Suspended Biomass Concentration
Suspended biomass concentrations were measured using a Biochrom Ultrospec 3000
UV/Visible spectrophotometer. The optical density of the culture was measured at 600
nm and correlated to cell dry weight (CDW). Samples were diluted a necessary to fit
within the range of the linear calibration curve as shown in Appendix C.
46
3.2.6 Phase Contrast Microscopy
Phase contrast microscopy was performed using a Nikon Eclipse E600 microscope with
100x oil immersion lens.
3.2.7 Scanning Electron Microscopy
Celite™ R-635 pellets were taken from different points along the bioreactor after it had
been drained of its liquid contents. Pellets were immediately dehydrated by successive
immersion in aqueous solutions of 25 %, 50 %, 75 % and 100 % v/v histological grade
alcohol (90 % ethanol, 5 % methanol, and 5 % v/v isopropanol) for 20 min each and then
allowed to dry overnight. The dried samples were coated with high purity, SEM grade
silver paint, affixed to aluminum stubs and allowed to dry. Samples were examined
using a LEO 1530 field emission SEM at an accelerator voltage of 3.5 kV and working
distance of 3-6 mm.
3.2.8 pH Measurement
pH was measured using a Cole Parmer sulfide resistant double junction reference
(Ag/AgCl) electrode with an Orion Research Expandable ionAnalyzer EA 920. The
electrode was calibrated before each use using reference pH solutions (Cole Parmer
Canada, Montreal, Quebec) of pH 7 and either 4 or 10 depending on the anticipated pH
value of the sample.
47
3.3 Culture and Fermentation Methods
3.3.1 Postgate B Medium and Stock Culture Maintenance
Postgate B (PB) medium (Postgate, 1984) was used for preparing stock cultures of SRB.
The medium consisted of the following components per L of tap water: 0.5 g/L KH2PO4,
1 g/L NH4Cl, 1.26 g/L CaSO4.2H2O, 2 g/L MgSO4.7H2O, 5.83 g/L sodium lactate (60 %
w/w syrup), 1 g/L yeast extract (BD Difco, Franklin Lake, New Jersey), 0.1 g/L ascorbic
acid, 0.1 g/L sodium thioglycollate, and 0.5 g/L FeSO4.7H2O. pH was adjusted to 7.25
using 3 M NaOH and 1 M HCl.
Subcultures (3 % v/v) were made on a monthly basis using 100 mL (liquid volume)
serum bottles. Subcultures were incubated statically at 33 oC for 48 h and then wrapped
in aluminum foil for storage at 4 oC.
3.3.2 Postgate C Medium
Postgate C (PC) medium (Postgate, 1984) was used for culturing SRB in batch and
continuous culture. The medium consisted of the following components per L of distilled
water: 0.5 g/L KH2PO4, 1 g/L NH4Cl, 4.5 g/L Na2SO4, 0.06 g/L MgSO4.7H2O, 0.06 g/L
CaCl2.H2O, 10 g/L sodium lactate (60 % w/w syrup), 1 g/L yeast extract (BD Difco,
Franklin Lake, New Jersey), 0.1 g/L sodium thioglycollate (97 %, Alfa Aesar), 0.004 g/L
FeSO4.7H2O, and 5.0 g/L sodium citrate dihydrate. pH was adjusted to 7.25 using 3 M
NaOH and 1 M HCl. After autoclaving the measured pH of the media was 6.5. Nutrient,
pH, and buffer concentrations were later adjusted in some experiments as noted in the
48
respective Experimental Methods sections.
3.3.3 Serum Bottle Culture
Sulfate reducing bacteria were cultured in 150 mL serum bottles for small scale batch
experiments and preparation of inoculum for bioreactor experiments. The bottle head
space was made anaerobic by placing the bottles in a -20” Hg abs. vacuum and restoring
atmospheric pressure with an anaerobic gas mixture (5 % CO2, 10 % H2, 85 % N2 v/v,
Praxair certified standard). This process was performed 3x before the bottles were sealed
with butyl rubber stoppers (Bellco Biotechnology, Vineland, New Jersey) and then
autoclaved at 121 oC for 20 min. Alternatively, serum bottles with media were sparged
with UHP N2 for 60 s before being sealed and autoclaved. Neither method resulted in
noticeably different serum bottle culture growth behaviour suggesting both methods
provided equivalent anaerobic conditions. Inoculation and sampling procedures were
performed using sterile, disposable 1-3 mL medical syringes. Unless otherwise specified
serum bottle cultures were incubated under static conditions at 33 oC in a Forma
Scientific model 3956 Reach-in incubator. Smaller volumes of cultures were revived as
needed using similar methods in 20 mL (liquid volume) anaerobic culture tubes with
butyl rubber stoppers.
3.3.4 2 L Bioflo Fermentations
2 L (liquid volume) fermentations were performed in Bioflo 1/Multigen stirred tank
bioreactors (New Brunswick Scientific, Edison, New Jersey). Bioreactors and 1680-1700
mL of medium were autoclaved at 121 oC separately, then sparged with filter sterilized
(0.2 μm) UHP N2 for 10 min while being agitated at 180 RPM by two Rushton turbines

49
to remove dissolved O2. Bioflo fermentations were inoculated using 300-320 mL (at
0.200-0.240 g CDW/L) of growth phase PC SRB cultures revived from 4 oC stocks.
Bioreactors were maintained at 34 ± 1 oC by circulating water from a thermostated bath
through Tygon tubing coils. 3 vertical baffles and agitation by the turbines at 90 RPM
maintained well mixed conditions.
3.3.5 Packed Bed Bioreactor (PBR) Fermentations
A 615 mL glass column bioreactor was constructed for packed bed fermentations (Figure
3.1). The overall bioreactor dimensions of the bioreactor were 38 cm x 4.5 cm and
consisted of a main column to which two end pieces were clamped. The main column
was fitted with three butyl rubber sampling ports located at each end (inlet/outlet) and at
the column midpoint. The end pieces were each fitted with two barbed fittings for liquid
and gas inlet/outlets. The main column contained the carrier material and the end pieces
were filled with polyethylene mesh to improve fluid and gas dispersion. Bioreactors
were maintained at 38 ± 1 oC by circulating water from a thermostated bath through
Tygon tubing coils. The entire apparatus was covered in removable foam insulation.
Bioreactors were filled with carrier packing material and autoclaved at 121 oC. The
bioreactors were then purged with filter sterilized UHP N2 before being inoculated with
SRB cultures by circulating 2 L stationary phases Bioflo cultures through the bioreactor
for 48 h at 200 mL/h. After inoculation, the liquid feed was switched to sterile PC media
from a 12 L carboy that was maintained anaerobic by a continuous filter sterilized UHP
N2 purge. Liquid flowrates were adjusted using an IMED Gemini 1 digital peristaltic

50
infusion pump (Cardinal Health, Canada). Stripping experiments were conducted by
sparging filter sterilized UHP N2 to the bottom of the bioreactor. Gas flow rates were
controlled by precision rotameters (Cole Parmer, Montreal, Quebec) with maximum flow
rates of either 5.6 mL/min or 112.5 mL/min depending on the required flow rate. Gas
and liquid sulfide waste streams were treated with 3 M NaOH and bleach before disposal.

51
Figure 3.1: Diagram of 615 mL (4.5 cm x 38 cm) packed bed bioreactor (PBR) used for continuous SRB fermentations. The PBR contained barbed fittings for liquid and gas inlet/outlet, butyl rubber sampling ports, and was surrounded with Tygon tubing heat coils and foam insulating material (not shown). The column of the PBR was packed with biomass carrier material while the end pieces contained a polyethylene mesh to improve gas/liquid dispersion.
Tygon tubing with 38 ± 1 oC thermostated water
Liquid in
Gas in
Liquid out
Sampling port with butyl rubber stopper
Endcap filled with polyethylene mesh
Gas out
52
3.4 Sulfate Reducing Bacteria Cultures
3.4.1 Desulfovibrio desulfuricans (ATCC 7757)
Desulfovibrio desulfuricans subsp. desulfuricans (ATCC 7757) was obtained as a freeze
dried specimen from the American Type Culture Collection (Manassas, Virginia).
Desulfovibrio desulfuricans was revived as per ATCC instructions and then transferred to
PB medium stocks. Phase contrast microscopy of the cultures revealed a homogenous
population of motile cells with a vibrio morphology consistent with the ATCC
description.
3.4.2 Sulfate Reducing Bacteria Consortium
A complex (undefined) consortium of sulfate reducing bacteria was enriched from
landfill leachate samples collected from a municipal landfill in Calgary, Alberta at an
approximate depth of 15 m. Initial enrichment work was performed at the University of
Calgary by Mr. Brenton Buziak of Dr. Gerrit Voordouw’s research group. 1 mL of
leachate was used to inoculate 100 mL of CSB-K media. CSB-K is a defined lactate,
sulfate based media in which yeast extract has been replaced with a defined trace element
solution. Four successive 1 % (v/v) transfers were performed until an SRB enriched
culture was obtained and confirmed by a decrease in sulfate concentration and
concomitant sulfide production. The CSB-K enrichment culture was then transferred to
Queen’s University at Kingston for further enrichment.
53
Further enrichments at Queen’s University were conducted using PC media in serum
bottle cultures. Cultures were incubated until TDS concentrations reached approximately
15 mM and then transferred to fresh media. Eight such transfers at 2 % v/v were
performed. The ratio of TDS to cell density (YP/X) was used as an indicator of the
consortium’s relative sulfate reducing activity. The initial PC transfer exhibited a YP/X
value of 54 mmol TDS/g CDW. An SRB enriched consortium with stable population
composition was assumed to be achieved when four successive transfers exhibited similar
YP/X values of 95 ± 7 mmol TDS/g CDW. Six successive transfers of the culture (2 %
v/v) were then performed at 24 h intervals in PB media to ensure a stable consortium
composition in all future transfers from PB stock cultures.
3.5 Carrier Materials
Four different carrier materials (Table 3.1, Figure 3.2) were evaluated for their biomass
immobilization potential. Polyurethane foam plugs and Poraver™ porous glass beads
were selected based upon their previous use for SRB immobilization as reported in the
recent literature (Silva et al., 2006 and Alvarez et al., 2006 respectively). Bone char and
Celite™ R-635 diatomaceous earth pellets were evaluated based on their general
suitability for the immobilization of anaerobic bacteria based on the recent literature
(Quereshi et al., 2005 and Wright, 2005 respectively).

54
Table 3.2: General carrier material dimensions and prices.
Material Bulk Density (kg/L)
Shape Dimensions Price (per kg)
Price (per L)
Bone char 0.604 irregular pellet 5 x 8 mesh $ 3.30 $ 1.99 Poraver™ 0.234 spherical 1-2 mm D $ 1.54 $ 0.36 Polyurethane foam 0.027 cylindrical 40 mm D x 45 mm H $ 192.98 $ 5.18 Celite™ R-635 0.540 cylindrical pellet 6.35 mm D x 12.7 mm H $ 22.00 $ 13.30
A) B)
C) D)
Figure 3.2: Photographs of carrier materials (ruler for scale). A) Poraver™ porous glass beads; B) polyurethane foam plug; C) bone char; D) Celite™ R-635 diatomaceous earth pellets.
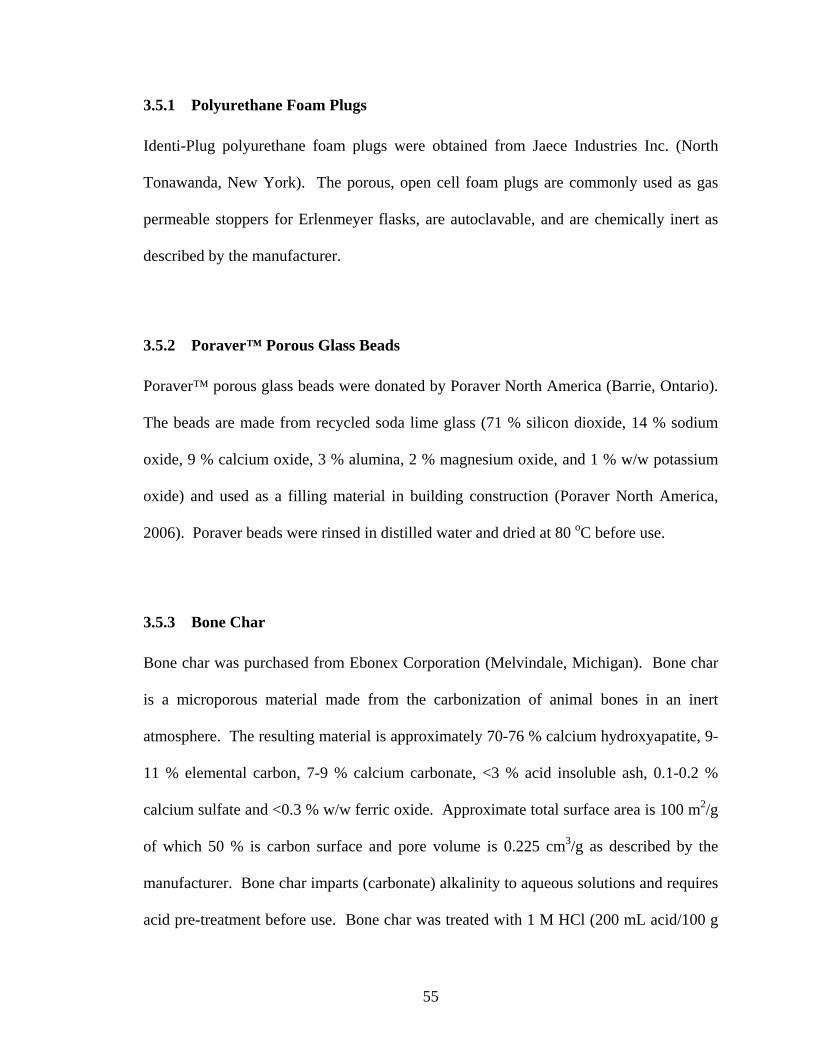
55
3.5.1 Polyurethane Foam Plugs
Identi-Plug polyurethane foam plugs were obtained from Jaece Industries Inc. (North
Tonawanda, New York). The porous, open cell foam plugs are commonly used as gas
permeable stoppers for Erlenmeyer flasks, are autoclavable, and are chemically inert as
described by the manufacturer.
3.5.2 Poraver™ Porous Glass Beads
Poraver™ porous glass beads were donated by Poraver North America (Barrie, Ontario).
The beads are made from recycled soda lime glass (71 % silicon dioxide, 14 % sodium
oxide, 9 % calcium oxide, 3 % alumina, 2 % magnesium oxide, and 1 % w/w potassium
oxide) and used as a filling material in building construction (Poraver North America,
2006). Poraver beads were rinsed in distilled water and dried at 80 oC before use.
3.5.3 Bone Char
Bone char was purchased from Ebonex Corporation (Melvindale, Michigan). Bone char
is a microporous material made from the carbonization of animal bones in an inert
atmosphere. The resulting material is approximately 70-76 % calcium hydroxyapatite, 9-
11 % elemental carbon, 7-9 % calcium carbonate, <3 % acid insoluble ash, 0.1-0.2 %
calcium sulfate and <0.3 % w/w ferric oxide. Approximate total surface area is 100 m2/g
of which 50 % is carbon surface and pore volume is 0.225 cm3/g as described by the
manufacturer. Bone char imparts (carbonate) alkalinity to aqueous solutions and requires
acid pre-treatment before use. Bone char was treated with 1 M HCl (200 mL acid/100 g

56
bone char) for 1 h under static ambient conditions followed by rinsing with distilled water
and drying at 80 oC.
3.5.4 Celite™ R-635
Celite™ R-635 diatomaceous earth pellets were donated by World Minerals Inc. (Santa
Barbara, California). The pellets are a flux calcined diatomaceous earth product with
composition similar to high silica glass (approximate composition: 82.3 % silica, 7.2 %
alumina, 3.3 % sodium oxide, 2.6 % calcium oxide, 1.9 % ferric oxide, 1.2 % magnesium
and trace inorganics). The pellets have a microporous structure with a mean pore
diameter of 20 μm and a reported BET surface area of 0.27 m2/g. Designed specifically
for bacterial immobilization, R-635 pellets exhibit good mechanical strength, chemical
stability, and resistance to microbial degradation as described by the manufacturer.
57
Chapter 4: Experimental Methods
4.1 Microbial Systems Characterization Experiments:
A series of experiments was conducted to evaluate the reaction stoichiometry (yield
coefficients) and microbial kinetics of the pure strain Desulfovibrio desulfuricans and an
SRB consortium. Stoichiometry experiments were conducted using 150 mL serum
bottles containing PC media and inoculated (1 % v/v) with SRB stocks from 4 oC storage.
Serum bottles were incubated statically at 33 oC and sampled daily until they reached
stationary phase (~48 h or TDS concentrations of ~20 mM). Samples were analyzed for
lactate, sulfate, TDS, and suspended cell concentrations.
The Monod specific growth rate (μ, h-1) was used a measure of microbial kinetics. μ was
calculated by periodically measuring the suspended biomass concentration of 2 L BioFlo
fermentations during the exponential growth phase. μ values were taken as the slope of
the linear portion of [ln (X/X0) vs. t] plots where X is the suspended biomass
concentration at a given time t (h). Initial and final sulfate concentrations were also
measured to confirm consistent YX/SO4 yield coefficients.
To examine the effects of inoculum composition on stoichiometry and kinetics, various
fractions of Desulfovibrio desulfuricans and consortium culture were used for the 300-
320 mL inoculum (e.g. a 33 % consortium inoculum contained 100 mL of consortium at
0.200 g CDW/L and 200 mL of Desulfovibrio desulfuricans at 0.200 g CDW/L). Eight
BioFlo fermentations were conducted using inoculum compositions as described in Table
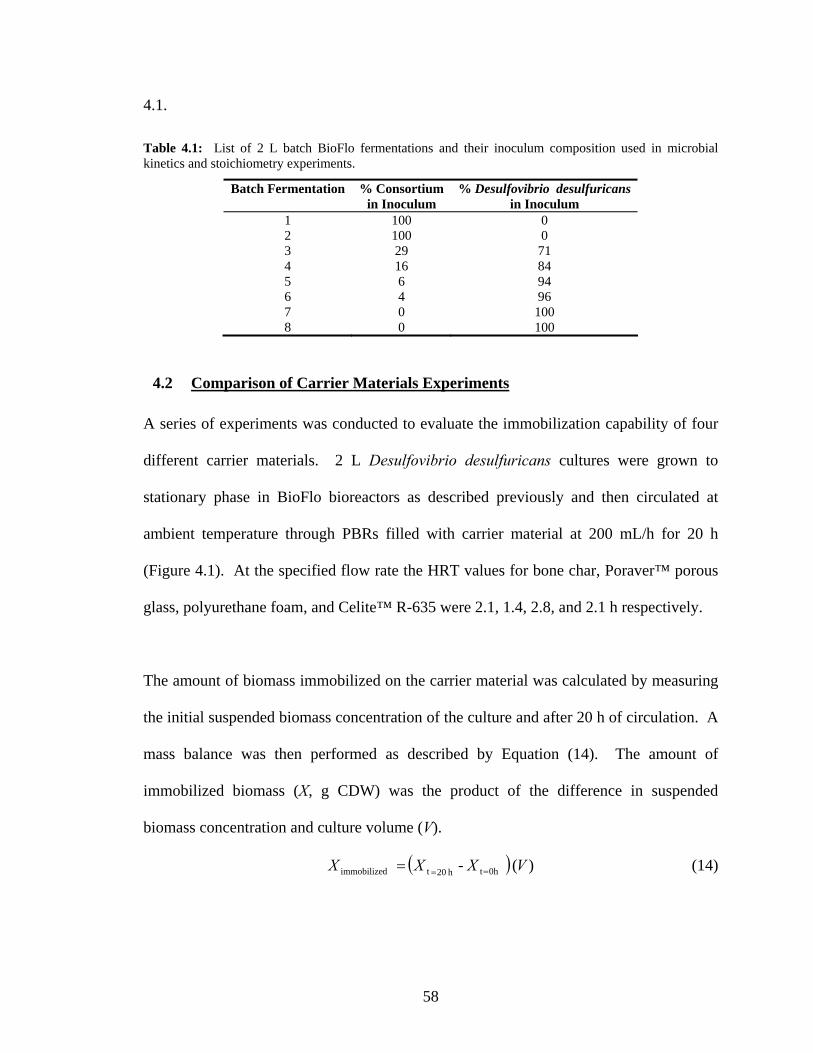
58
4.1.
Table 4.1: List of 2 L batch BioFlo fermentations and their inoculum composition used in microbial kinetics and stoichiometry experiments.
Batch Fermentation % Consortium in Inoculum
% Desulfovibrio desulfuricans in Inoculum
1 100 0 2 100 0 3 29 71 4 16 84 5 6 94 6 4 96 7 0 100 8 0 100
4.2 Comparison of Carrier Materials Experiments
A series of experiments was conducted to evaluate the immobilization capability of four
different carrier materials. 2 L Desulfovibrio desulfuricans cultures were grown to
stationary phase in BioFlo bioreactors as described previously and then circulated at
ambient temperature through PBRs filled with carrier material at 200 mL/h for 20 h
(Figure 4.1). At the specified flow rate the HRT values for bone char, Poraver™ porous
glass, polyurethane foam, and Celite™ R-635 were 2.1, 1.4, 2.8, and 2.1 h respectively.
The amount of biomass immobilized on the carrier material was calculated by measuring
the initial suspended biomass concentration of the culture and after 20 h of circulation. A
mass balance was then performed as described by Equation (14). The amount of
immobilized biomass (X, g CDW) was the product of the difference in suspended
biomass concentration and culture volume (V).
( ) )( - 0hth 20tdimmobilize VXXX === (14)
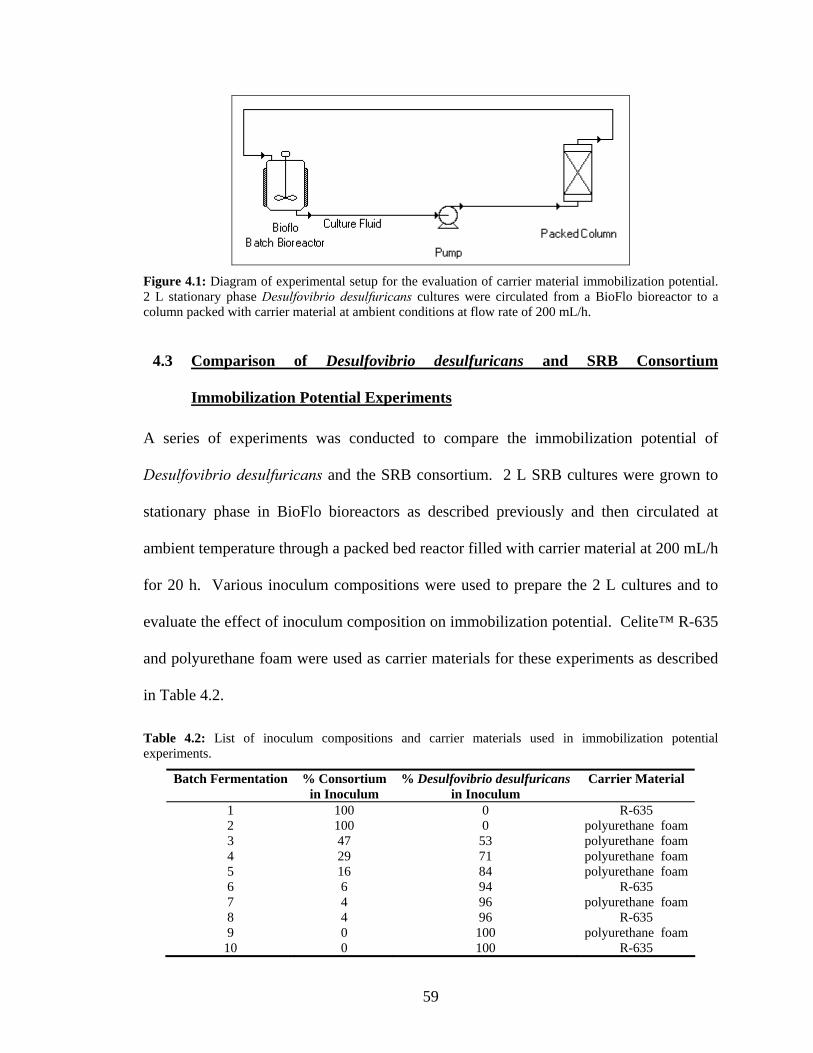
59
Figure 4.1: Diagram of experimental setup for the evaluation of carrier material immobilization potential. 2 L stationary phase Desulfovibrio desulfuricans cultures were circulated from a BioFlo bioreactor to a column packed with carrier material at ambient conditions at flow rate of 200 mL/h.
4.3 Comparison of Desulfovibrio desulfuricans and SRB Consortium
Immobilization Potential Experiments
A series of experiments was conducted to compare the immobilization potential of
Desulfovibrio desulfuricans and the SRB consortium. 2 L SRB cultures were grown to
stationary phase in BioFlo bioreactors as described previously and then circulated at
ambient temperature through a packed bed reactor filled with carrier material at 200 mL/h
for 20 h. Various inoculum compositions were used to prepare the 2 L cultures and to
evaluate the effect of inoculum composition on immobilization potential. Celite™ R-635
and polyurethane foam were used as carrier materials for these experiments as described
in Table 4.2.
Table 4.2: List of inoculum compositions and carrier materials used in immobilization potential experiments.
Batch Fermentation % Consortium in Inoculum
% Desulfovibrio desulfuricans in Inoculum
Carrier Material
1 100 0 R-635 2 100 0 polyurethane foam 3 47 53 polyurethane foam 4 29 71 polyurethane foam 5 16 84 polyurethane foam 6 6 94 R-635 7 4 96 polyurethane foam 8 4 96 R-635 9 0 100 polyurethane foam
10 0 100 R-635

60
4.4 Continuous Packed Bed Reactor Experiments
After Celite™ R-635 had been determined to be the best carrier material and ~4 %
consortium to be the optimal inoculum composition, several continuous flow PBR
fermentations were conducted using said carrier and inoculum. The experiments were
divided into two general sets. The first set consisted of experiments involving only a
liquid stream entering and leaving the bioreactor. Due to the high solubility of H2S and
the operating pH, practically all the sulfide product emerged as dissolved sulfide in the
first set of experiments. The second set of experiments involved both liquid and gas (N2
stripping) streams and with the sulfide product emerging in both phases. Details and
objectives of each experiment are described.
4.4.1 PBR Fermentation Experiment 1: System Characterization
The objective of the first PBR fermentation was to characterize the system behaviour, its
ability to adapt to step changes in liquid feed rates (L, mL/h), and to achieve high
volumetric productivity in minimal start-up time. After the bioreactor had been
inoculated by circulating a stationary phase culture as described previously, a sterile feed
of PC media was fed at 20 mL/h (HRT = 20 h, D = 0.05 h-1). Samples were taken daily
from the bioreactor’s three ports and analyzed for TDS, sulfate, and suspended biomass
concentrations. When TDS concentrations had stabilized around the inhibitory
concentration (15-20 mM) the liquid feed rate was increased and the system was allowed
to stabilize at the new flow rate. In this manner the feed rate was increased step-wise
from 20 mL/h to 640 mL/h (HRT = 39 min, D = 1.6 h-1) over a period of 200 h. After
operating at a feed rate of 640 mL/h, the effect of arbitrary step changes in the feed rate

61
were evaluated by reducing the feed rate to 160 mL/h for 15-22 h and then restoring the
feed rate to 500 mL/h. The liquid feed was decreased in two steps to 0 mL/h and restored
to 500 mL/h in two steps. Details of the liquid feed step changes are listed in Table 4.3.
Table 4.3: Liquid feed rates, feed duration, and respective hydraulic residence times (HRT), dilution rates (D), and equivalent column volumes (CV) for this first PBR fermentation experiment (no stripping).
Time (h) Feed Rate (mL/h) Time at Feed (h) HRT (h) D (h-1) CVs 0 20 74.5 20 0.05 3.7
74.5 40 5 10 0.10 0.5 79.5 0 15 - - - 94.5 40 24.75 10 0.10 2.5
119.25 80 24.25 5 0.20 4.9 143.50 160 22 2.5 0.40 8.8 165.5 320 28.5 1.25 0.80 22.8 194 640 6.5 0.625 1.60 10.4
200.5 160 14.5 2.5 0.40 5.8 215 500 9.5 0.8 1.25 11.9
224.5 160 4.75 2.5 0.40 1.9 229.25 40 0.75 10 0.10 0.1
230 0 12.75 - - - 242.75 160 22.25 2.5 0.40 8.9
265 500 5 0.8 1.25 6.3
4.4.2 PBR Fermentation Experiment 2: Sustained Operation and Recovery After
Shutdown
From the first PBR fermentation it was observed that biomass immobilization allowed for
rapid increases in feed rates without biomass washout and attainment of high volumetric
productivities. The objectives of the second PBR fermentation were to evaluate sustained
bioreactor operation at high liquid feed rates (250 mL/h for periods of ~ 48 h) and the
ability of the bioreactor to recover from a complete shutdown period of 24 h where both
the feed rate and heating coil operation were halted. Details of the liquid feed step
changes are listed in Table 4.4.

62
Table 4.4: Liquid feed rates, feed duration, and respective hydraulic residence times (HRT), dilution rates (D), and equivalent column volumes (CV) for this second PBR fermentation experiment.
Time (h) Feed Rate
(mL/h)
Time at Feed (h)
HRT (h) D (h-1) CVs
0 20 24.75 20 0.05 1.2 24.75 40 42.50 10 0.10 4.3 67.25 80 53.75 5.0 0.20 10.8 121 160 19.25 2.5 0.40 7.7
140.25 250 47.00 1.6 0.63 29.4 187.25 0 25.75 - - -
213 250 46.25 1.6 0.63 28.9 259.25 500 22.50 0.8 1.25 28.1
4.4.3 PBR Fermentation Experiment 3 (with Stripping): System Characterization
The third PBR experiment added an N2 strip gas to the bioreactor system. The purpose of
implementing a strip gas was to improve volumetric productivity by in situ removal of
the inhibitory sulfide product and to partition more of the sulfide product in to the gas
phase as H2S(g).
The stripping experiments were conducted by starting a PBR fermentation as previously
described. The feed rate was increased step wise over a period of 66 h from 20 mL/h to
80 mL/h (HRT = 6 h, D = 0.17 h-1) where a stable TDS concentration (~20 mM) was
achieved. The effects of four different stripping rates on the system were evaluated by
setting the N2 gas flow rate (G, mL/min) to specified value and allowing the system to
stabilize over a 24 h period (4 CV). TDS, sulfate, and suspended biomass concentrations
were measured for each condition. Gas flow rates were reported as a normalized
stripping ratio (G/L) of gas flow rate (G) to liquid feed rate (L). G/L ratios were evaluated
non-sequentially as described in Table 4.5.

63
Table 4.5: List of stripping ratios (G/L) evaluated for PBR fermentation at constant 80 mL/h liquid feed. L = liquid feed rate; G = N2 strip gas rate.
Experimental Condition L (mL/h) G (mL/min) G/L (m3/m3) 1 80 5.1 3.8 2 80 2.4 1.8 3 80 3.4 2.6 4 80 0 0
Gas samples were analyzed at another four operating conditions as described in Table
4.6. in order to evaluate the sulfur mass balance and investigate the partitioning of the
product sulfide between dissolved and gas phases.
Table 4.6: List of stripping conditions (G/L) at which strip gas samples were taken for gas phase H2S analysis.
Experimental Condition L (mL/h) G (mL/min) G/L (m3/m3) 1 80 5.1 3.8 2 40 1.7 2.5 3 40 1.7 2.5 4 40 4.1 6.2

64
4.4.4 Basic Model for PBR Operation with Stripping
A simple steady-state model was developed to better understand the system behaviour
and the interaction of variables such as substrate concentration, G/L ratio, volumetric
productivity, and sulfide product partitioning. The model assumed that the bioreactor
was capable of maintaining a constant 20 mM TDS concentration in the effluent
independent of the G/L ratio. Dissolved sulfide speciation was then calculated using
known ionization equilibrium constants and vapour liquid equilibrium was calculated
using Henry’s Law as described in Appendix D.
The effect of pH values of 6, 7 and 8 and G/L ratios of 0, 1.3, 2.4, and 3.8 on volumetric
productivity and sulfide partitioning was evaluated.
4.4.5 PBR Fermentation Experiment 4 (with Stripping): Performance
Enhancement
The objectives of the fourth PBR fermentation were to experimentally evaluate the effect
of initial medium pH and higher G/L ratios on the bioreactor performance
Nutrient concentrations in the PC medium were doubled for this experiment and
determined to be sufficient to avoid substrate limitation at the operating conditions being
evaluated.
A citric acid buffer system (pKa3 = 6.4) composed of 20 g/L sodium citrate dihydrate and
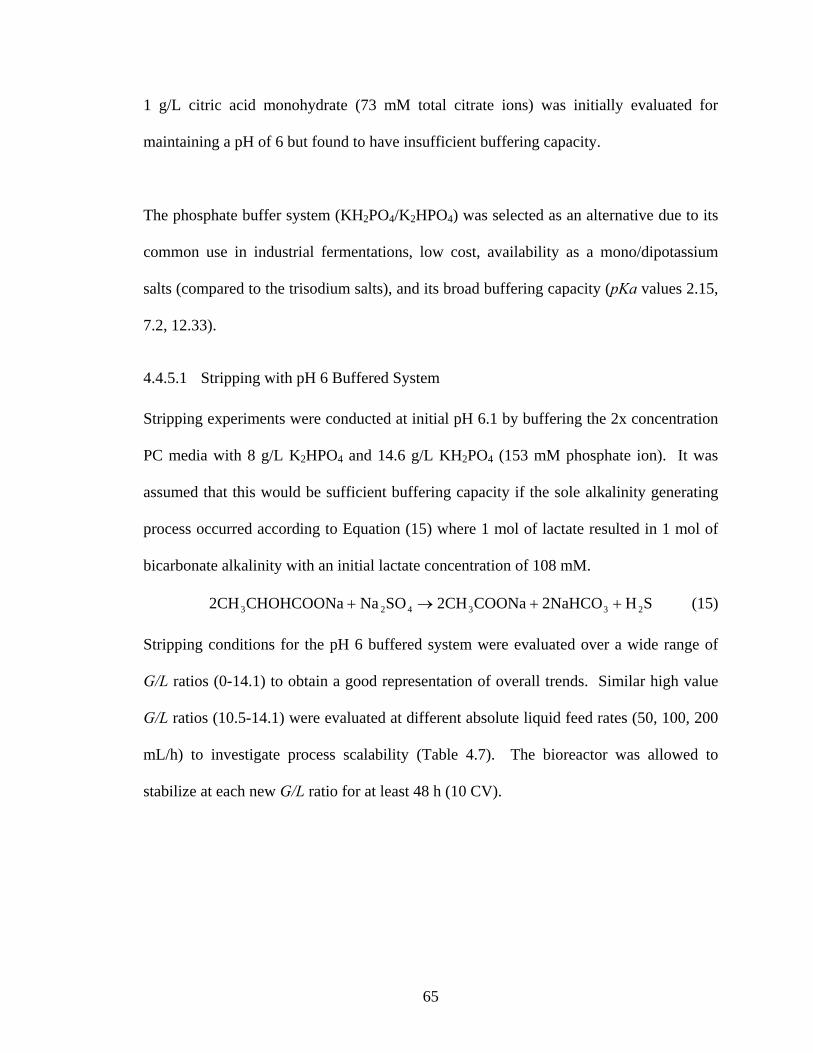
65
1 g/L citric acid monohydrate (73 mM total citrate ions) was initially evaluated for
maintaining a pH of 6 but found to have insufficient buffering capacity.
The phosphate buffer system (KH2PO4/K2HPO4) was selected as an alternative due to its
common use in industrial fermentations, low cost, availability as a mono/dipotassium
salts (compared to the trisodium salts), and its broad buffering capacity (pKa values 2.15,
7.2, 12.33).
4.4.5.1 Stripping with pH 6 Buffered System
Stripping experiments were conducted at initial pH 6.1 by buffering the 2x concentration
PC media with 8 g/L K2HPO4 and 14.6 g/L KH2PO4 (153 mM phosphate ion). It was
assumed that this would be sufficient buffering capacity if the sole alkalinity generating
process occurred according to Equation (15) where 1 mol of lactate resulted in 1 mol of
bicarbonate alkalinity with an initial lactate concentration of 108 mM.
SH 2NaHCO COONa2CH SONa CHOHCOONa2CH 233423 ++→+ (15)
Stripping conditions for the pH 6 buffered system were evaluated over a wide range of
G/L ratios (0-14.1) to obtain a good representation of overall trends. Similar high value
G/L ratios (10.5-14.1) were evaluated at different absolute liquid feed rates (50, 100, 200
mL/h) to investigate process scalability (Table 4.7). The bioreactor was allowed to
stabilize at each new G/L ratio for at least 48 h (10 CV).
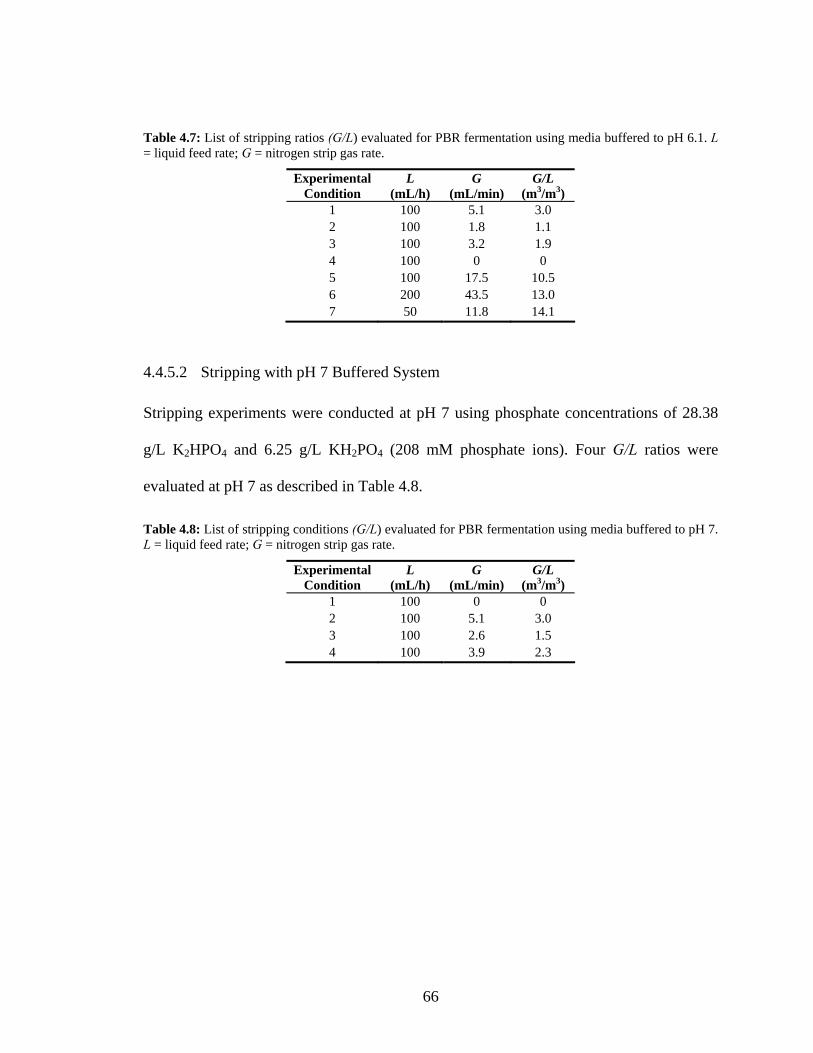
66
Table 4.7: List of stripping ratios (G/L) evaluated for PBR fermentation using media buffered to pH 6.1. L = liquid feed rate; G = nitrogen strip gas rate.
Experimental Condition
L (mL/h)
G (mL/min)
G/L (m3/m3)
1 100 5.1 3.0 2 100 1.8 1.1 3 100 3.2 1.9 4 100 0 0 5 100 17.5 10.5 6 200 43.5 13.0 7 50 11.8 14.1
4.4.5.2 Stripping with pH 7 Buffered System
Stripping experiments were conducted at pH 7 using phosphate concentrations of 28.38
g/L K2HPO4 and 6.25 g/L KH2PO4 (208 mM phosphate ions). Four G/L ratios were
evaluated at pH 7 as described in Table 4.8.
Table 4.8: List of stripping conditions (G/L) evaluated for PBR fermentation using media buffered to pH 7. L = liquid feed rate; G = nitrogen strip gas rate.
Experimental Condition
L (mL/h)
G (mL/min)
G/L (m3/m3)
1 100 0 0 2 100 5.1 3.0 3 100 2.6 1.5 4 100 3.9 2.3
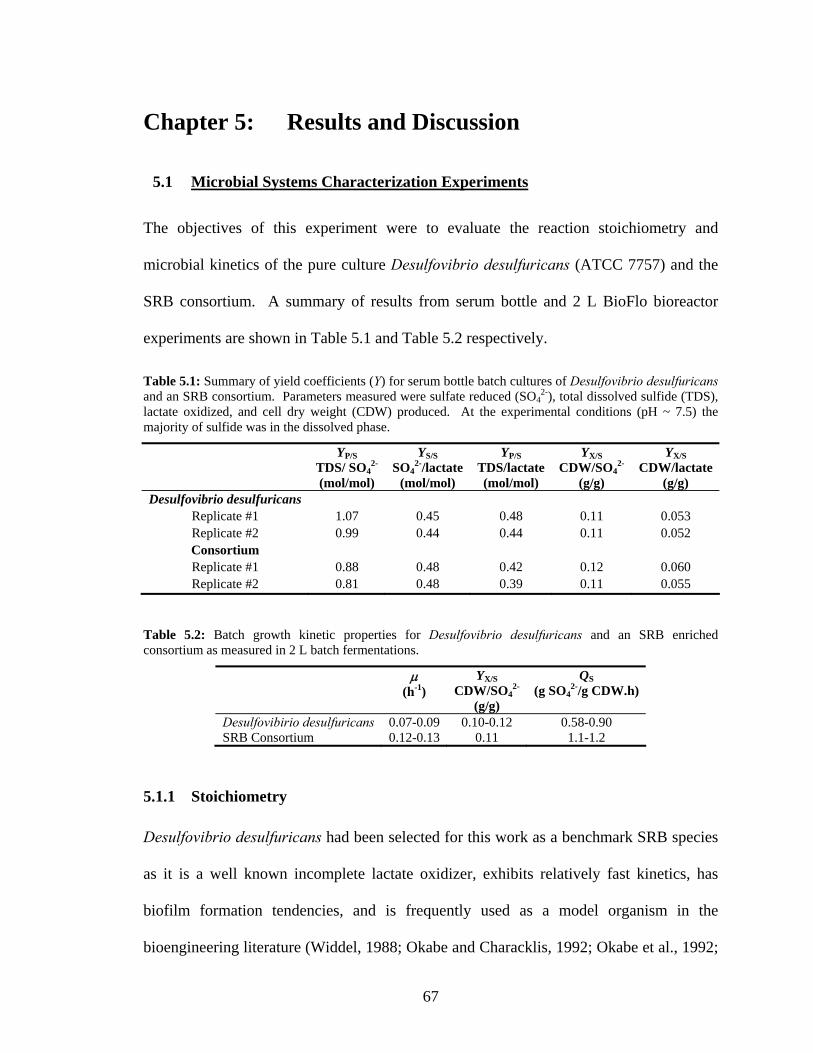
67
Chapter 5: Results and Discussion
5.1 Microbial Systems Characterization Experiments
The objectives of this experiment were to evaluate the reaction stoichiometry and
microbial kinetics of the pure culture Desulfovibrio desulfuricans (ATCC 7757) and the
SRB consortium. A summary of results from serum bottle and 2 L BioFlo bioreactor
experiments are shown in Table 5.1 and Table 5.2 respectively.
Table 5.1: Summary of yield coefficients (Y) for serum bottle batch cultures of Desulfovibrio desulfuricans and an SRB consortium. Parameters measured were sulfate reduced (SO4
2-), total dissolved sulfide (TDS), lactate oxidized, and cell dry weight (CDW) produced. At the experimental conditions (pH ~ 7.5) the majority of sulfide was in the dissolved phase.
YP/S TDS/ SO4
2- (mol/mol)
YS/S SO4
2-/lactate (mol/mol)
YP/S TDS/lactate (mol/mol)
YX/S CDW/SO4
2- (g/g)
YX/S CDW/lactate
(g/g) Desulfovibrio desulfuricans
Replicate #1 1.07 0.45 0.48 0.11 0.053 Replicate #2 0.99 0.44 0.44 0.11 0.052 Consortium Replicate #1 0.88 0.48 0.42 0.12 0.060 Replicate #2 0.81 0.48 0.39 0.11 0.055
Table 5.2: Batch growth kinetic properties for Desulfovibrio desulfuricans and an SRB enriched consortium as measured in 2 L batch fermentations.
μ (h-1)
YX/S CDW/SO4
2- (g/g)
QS (g SO4
2-/g CDW.h)
Desulfovibirio desulfuricans 0.07-0.09 0.10-0.12 0.58-0.90 SRB Consortium 0.12-0.13 0.11 1.1-1.2
5.1.1 Stoichiometry
Desulfovibrio desulfuricans had been selected for this work as a benchmark SRB species
as it is a well known incomplete lactate oxidizer, exhibits relatively fast kinetics, has
biofilm formation tendencies, and is frequently used as a model organism in the
bioengineering literature (Widdel, 1988; Okabe and Characklis, 1992; Okabe et al., 1992;

68
Gasiorek, 1994; Fukui and Takii, 1994; Konishi et al., 1996; Nagpal et al., 2000a;
Beyenal and Lewandowski, 2004). The observed yield coefficients for Desulfovibrio
desulfuricans (Table 5.1, Table 5.2) were similar to those reported in literature and to
theoretical values. The molar ratio of total dissolved sulfide (TDS) to sulfate reduced
(YTDS/ SO4) was close to the theoretical value of 1.0 mol/mol. That practically all the sulfide
was present in the dissolved phase at these conditions emphasized the high solubility of
the desired product. The ratio of sulfate reduced to lactate oxidized (YSO4/lactate) was close
to the theoretical value of 0.47 mol/mol. Lactate consumption is coupled with sulfate
reduction for catabolic purposes at a sulfate:lactate ratio of 0.50 mol/mol. The diversion
of a small amount of lactate for anabolic purposes reduces the observed yield to
approximately 0.47 mol/mol. The observed biomass yield (YCDW/SO4 = 0.11 g/g) for
Desulfovibrio desulfuricans was within range of values reported (YCDW/SO4 = 0.074-0.140
g/g) for various incomplete lactate oxidizing SRB as summarized in papers by Okabe and
Characklis (1992) and Okabe et al. (1992). As discussed in the literature review, the
catabolic yields (e.g. Ysulfide/SO4, YSO4/lactate) are generally constant and independent of
culture conditions. The anabolic biomass yields (YCDW/SO4, YCDW/lactate) are subject to
greater variability due to their dependence on culture conditions and the maintenance
coefficient especially under conditions of high product sulfide inhibition. Culture
conditions at the 2 L BioFlo batch bioreactor scale were similar to those at the 100 mL
serum bottle scale. As anticipated, Desulfovibrio desulfuricans and the SRB consortium
had similar biomass yields (YCDW/SO4 = 0.10-0.12 g/g) that were independent of liquid
culture size.

69
The consortium had been enriched under conditions that selected for incomplete lactate
oxidizing SRB. All of the observed yield coefficients for the consortium were nearly
identical to those of Desulfovibrio desulfuricans. It was therefore assumed the
consortium was composed overwhelmingly of incomplete lactate oxidizing SRB, likely
of the common Desulfovibrio genus. The observed stoichiometric reduction of sulfate
coupled to lactate oxidation for the consortium further suggested that Desulfovibrio-type
SRB were the predominant consumers of the lactate carbon source. The serial
enrichment process used to develop the consortium allowed TDS concentrations to reach
inhibitory levels for several successive transfers with the assumption that non-sulfate
reducing bacteria would have been unable to compete in such adverse conditions. Light
micrograph examination of the pure culture Desulfovibrio desulfuricans had revealed a
homogenous, mobile population with characteristic vibrio morphology. The consortium
light micrograph revealed a population with similar members but also a small proportion
of other morphologies, most noticeably elongated species several microns in length.
These elongated morphologies could be further subdivided into filamentous, segmented,
and spiral shapes. Other incompletely oxidizing SRB that may have been present as well
include the Desulfotomaculum (spore formers) and Desulfobulbus genera which have
been previously detected with the more common Desulfovibrio in consortia enriched
from wastewater samples using PC medium (Alvarez et al., 2006). SRB are known to
exhibit variable morphology even among the same species (Postgate, 1984) and
ultimately these visual observations are sufficient only to suggest that a mixed population
of SRB was present. Molecular identification techniques would be required to provide a
more detailed picture of the SRB consortium’s composition.
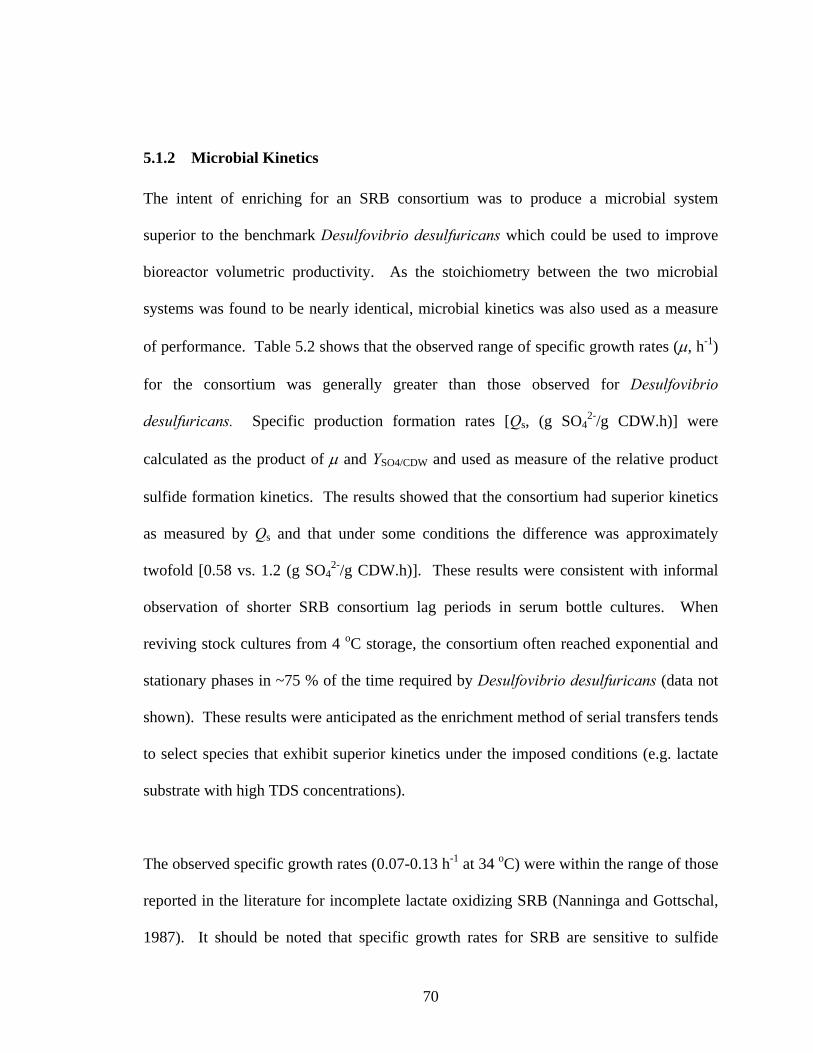
70
5.1.2 Microbial Kinetics
The intent of enriching for an SRB consortium was to produce a microbial system
superior to the benchmark Desulfovibrio desulfuricans which could be used to improve
bioreactor volumetric productivity. As the stoichiometry between the two microbial
systems was found to be nearly identical, microbial kinetics was also used as a measure
of performance. Table 5.2 shows that the observed range of specific growth rates (μ, h-1)
for the consortium was generally greater than those observed for Desulfovibrio
desulfuricans. Specific production formation rates [Qs, (g SO42-/g CDW.h)] were
calculated as the product of μ and YSO4/CDW and used as measure of the relative product
sulfide formation kinetics. The results showed that the consortium had superior kinetics
as measured by Qs and that under some conditions the difference was approximately
twofold [0.58 vs. 1.2 (g SO42-/g CDW.h)]. These results were consistent with informal
observation of shorter SRB consortium lag periods in serum bottle cultures. When
reviving stock cultures from 4 oC storage, the consortium often reached exponential and
stationary phases in ~75 % of the time required by Desulfovibrio desulfuricans (data not
shown). These results were anticipated as the enrichment method of serial transfers tends
to select species that exhibit superior kinetics under the imposed conditions (e.g. lactate
substrate with high TDS concentrations).
The observed specific growth rates (0.07-0.13 h-1 at 34 oC) were within the range of those
reported in the literature for incomplete lactate oxidizing SRB (Nanninga and Gottschal,
1987). It should be noted that specific growth rates for SRB are sensitive to sulfide
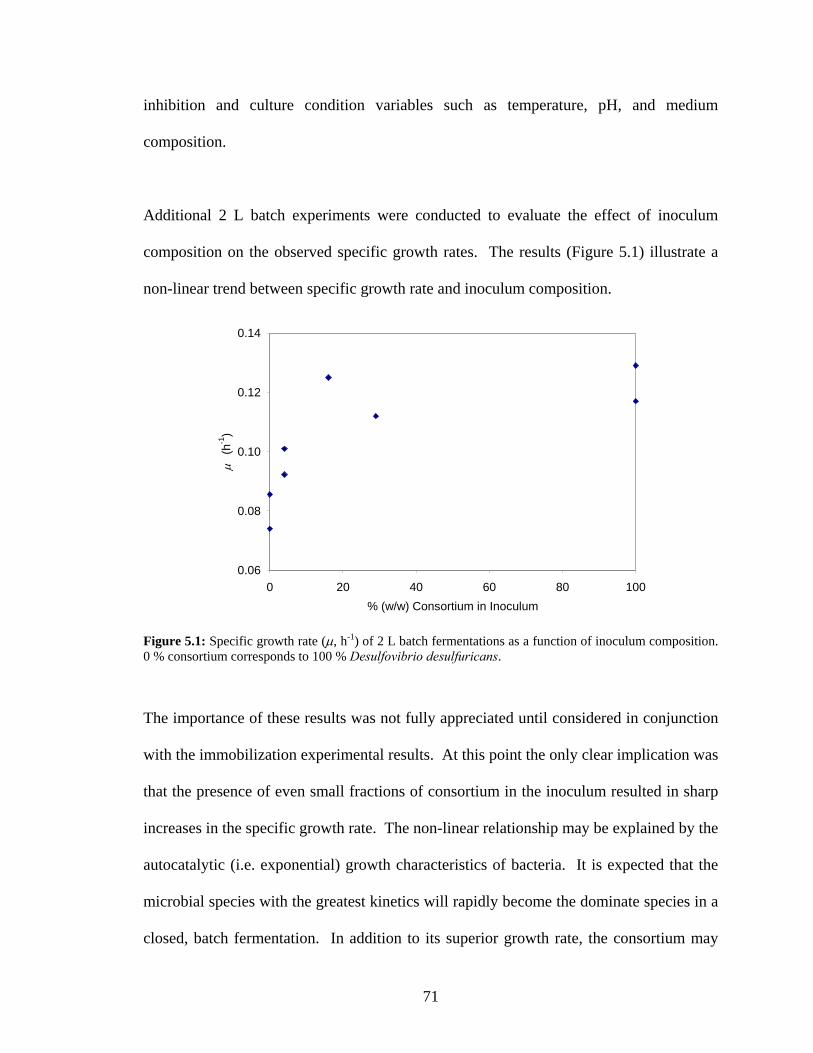
71
inhibition and culture condition variables such as temperature, pH, and medium
composition.
Additional 2 L batch experiments were conducted to evaluate the effect of inoculum
composition on the observed specific growth rates. The results (Figure 5.1) illustrate a
non-linear trend between specific growth rate and inoculum composition.
0.06
0.08
0.10
0.12
0.14
0 20 40 60 80 100% (w/w) Consortium in Inoculum
μ (
h-1)
Figure 5.1: Specific growth rate (μ, h-1) of 2 L batch fermentations as a function of inoculum composition. 0 % consortium corresponds to 100 % Desulfovibrio desulfuricans.
The importance of these results was not fully appreciated until considered in conjunction
with the immobilization experimental results. At this point the only clear implication was
that the presence of even small fractions of consortium in the inoculum resulted in sharp
increases in the specific growth rate. The non-linear relationship may be explained by the
autocatalytic (i.e. exponential) growth characteristics of bacteria. It is expected that the
microbial species with the greatest kinetics will rapidly become the dominate species in a
closed, batch fermentation. In addition to its superior growth rate, the consortium may

72
have had other undetected advantages over Desulfovibrio desulfuricans. One possible
advantage is an increased resistance to sulfide inhibition. This characteristic may have
been selected for during the enrichment process by allowing the cultures to consistently
reach inhibitory sulfide concentrations (> 15 mM TDS) before performing transfers.
Monod saturation constants (Ks) were not measured but it is unlikely that the consortium
would have been able to exploit a substrate affinity advantage. Initial substrate
concentrations (lactate, 54 mM; sulfate, 32 mM) were both well above the Ks values
reported in literature for Desulfovibrio desulfuricans (Ks < 0.1 mM for both substrates).
5.2 Comparison of Carrier Materials
The results of experiments to evaluate the relative biomass immobilization potential of
four carrier materials is shown in Figure 5.2. Desulfovibrio desulfuricans was used as the
model SRB for these experiments.
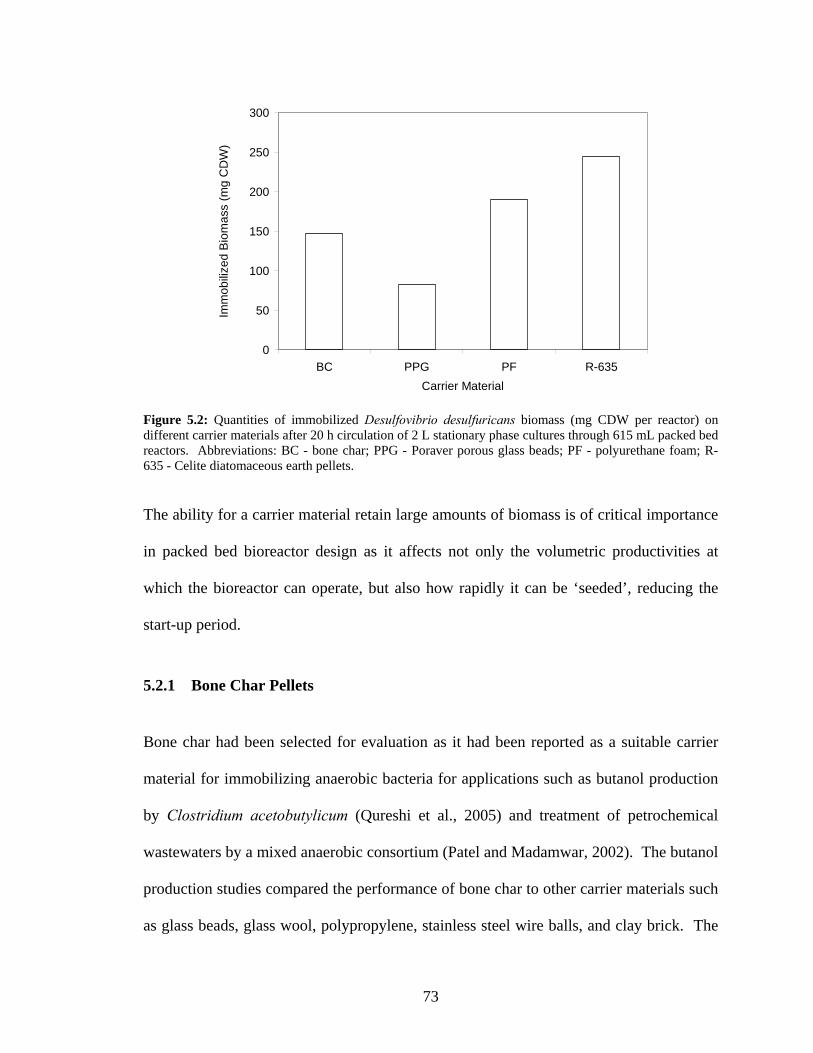
73
0
50
100
150
200
250
300
BC PPG PF R-635Carrier Material
Imm
obili
zed
Bio
mas
s (m
g C
DW
)
Figure 5.2: Quantities of immobilized Desulfovibrio desulfuricans biomass (mg CDW per reactor) on different carrier materials after 20 h circulation of 2 L stationary phase cultures through 615 mL packed bed reactors. Abbreviations: BC - bone char; PPG - Poraver porous glass beads; PF - polyurethane foam; R-635 - Celite diatomaceous earth pellets.
The ability for a carrier material retain large amounts of biomass is of critical importance
in packed bed bioreactor design as it affects not only the volumetric productivities at
which the bioreactor can operate, but also how rapidly it can be ‘seeded’, reducing the
start-up period.
5.2.1 Bone Char Pellets
Bone char had been selected for evaluation as it had been reported as a suitable carrier
material for immobilizing anaerobic bacteria for applications such as butanol production
by Clostridium acetobutylicum (Qureshi et al., 2005) and treatment of petrochemical
wastewaters by a mixed anaerobic consortium (Patel and Madamwar, 2002). The butanol
production studies compared the performance of bone char to other carrier materials such
as glass beads, glass wool, polypropylene, stainless steel wire balls, and clay brick. The
74
bone char was found to have measurable advantages over these other materials with
respect to immobilization rates, ability to retain immobilized biomass under aggressive
hydrodynamic conditions, and improved specific product formation rates. Bone char had
not previously been evaluated for SRB immobilization but for the reasons mentioned it
was regarded as having good potential as a carrier material.
The experimental results confirmed that bone char was capable of immobilizing the
model SRB Desulfovibrio desulfuricans (0.147 g CDW/reactor), but not as effectively as
polyurethane foam or R-635 pellets. The bone char material was found to be very brittle
and crumbled under normal handling conditions, forming a fine black powder. This was
undesirable as it would increase the total suspended solids in the bioreactor effluent and
decrease the operational life time of the carrier material. Another significant
disadvantage of the bone char was that it is known to increase the pH of process waters
due to its composition of 7-9 % w/w CaCO3. If the bone char was not pretreated with
acid to neutralize these carbonates it was found that Desulfovibrio desulfuricans cells
would not remain viable in the alkaline environment.
Due to its limited ability to immobilize Desulfovibrio desulfuricans, low durability, and
carbonate alkalinity, bone char was eliminated from further consideration as a carrier
material for SRB immobilization.
5.2.2 Poraver™ Porous Glass Beads
Poraver™ beads were selected as a benchmark carrier material as the material had been

75
reported suitable for both general bacterial immobilization (Zellner et al., 1994;
Senthuran et al., 1999; Sa and Boaventura, 2001; Andersson and Bjornsson, 2002; Held
et al., 2002; Lacayor et al., 2004) and SRB specific immobilization (Kolmert et al., 1997;
Nagpal et al., 2000b; Kolmert and Johnson, 2001; Alvarez et al., 2006).
Of the four materials evaluated, Poraver™ was found to immobilize the least amount of
Desulfovibrio desulfuricans (0.083 g CDW/reactor) and exhibited packing problems.
Poraver may be more suited fluidized bed bioreactors as it entrains air/gas in its pores,
decreasing packed bed stability. The glass material was also found to be brittle, though
more durable than bone char. The crushability of the packing material would decrease its
reusability and its applicability at larger scales. The low strength of Poraver™ may be
due to its microporous structure. Usually the presence of micropores is beneficial for
providing cells with surfaces protected from fluid shear but it has been reported that the
pores in Poraver™ has low interconnectivity (Kolmert et al., 2001). The interior
microporous structure therefore cannot be used for immobilization and results in the
material’s reduced mechanical strength.
Although considered a suitable carrier material for SRB by recent literature, Poraver™
was found to immobilize the least amount of Desulfovibrio desulfuricans compared to the
other materials evaluated. One advantage of Poraver™ is its low cost ($1.54/kg,
$0.36/L). The literature suggested that Poraver™ would provide adequate
immobilization performance but this study has identified superior carrier materials and so
it will not receive further consideration.
76
5.2.3 Polyurethane Foam Plugs
Polyurethane foam was selected as another benchmark carrier material that was capable
of general anaerobic bacterial immobilization (Harendranath et al., 1996; Picanco et al.,
2001; Oliveira et al., 2004; Yang et al., 2004; de Ory et al, 2004; and Ribeiro et al., 2005)
and SRB specific immobilization (Stucki et al., 1993; Cadavid et al., 1999; Cattony et al.,
2005, Silva et al., 2006).
Experimental observations from this study confirmed literature reports (Silva et al., 2006)
of the suitability of polyurethane for the immobilization of SRB. Polyurethane foam
immobilized the second highest amount of Desulfovibrio desulfuricans (0.405 g
CDW/reactor) second only to Celite™ R-635. In these experiments the immobilized
biomass was visible as grey particulate slime on the white foam material. Despite its high
capacity for rapid biomass immobilization, polyurethane foam exhibited some
disadvantages. The diameter of the foam plugs matched the bioreactor diameter (~4.5
cm) which maximized the available amount of pore surface area present. The
macropores, similar to those found in synthetic sponges were large enough to seen by the
unaided eye, had high interconnectivity and allowed good fluid flow, but had poor gas
permeability due to bubble surface tension effects. Using the current foam plug
dimensions would have prevented implementation of a strip gas in later experiments.
Cutting the foam into smaller pieces may have alleviated the gas entrainment issue but
would have decreased the available pore surface area for immobilization. Advantages of

77
the polyurethane foam were its chemical inertness, durability, and ease of handling. For
these reasons the polyurethane foam plugs were used in additional experiments that
evaluated the immobilization potential of mixed inoculum SRB populations. They were
not considered for use in the long term packed bed fermentation experiments.
5.2.4 Celite™ R-635 Diatomaceous Earth Pellets
Celite™ R-635 was evaluated as carrier material as it had been reported as a suitable
carrier material for aerobic and anaerobic bacteria in bioscrubber (Sorial et al., 1997;
Sorial et al., 1998; and Wright, 2005) and wastewater treatment applications (Durham et
al, 1994; Peres, 1999; Kim, 2002; and Bertin et al., 2004).
R-635 pellets immobilized the most Desulfovibrio desulfuricans biomass (0.522 g
CDW/reactor) of the four materials evaluated. R-635’s superior immobilization
performance was attributed to it being the only carrier material that was designed for
bacterial immobilization. SEM micrographs (Figure 5.3; Figure 5.4) of R-635 pellets
revealed a highly microporous structure with average pore size of 20 μm as reported by
the manufacturer. Pore sizes are ideally 10-20x the major diameter of the bacteria for
optimal adsorption, bacterial growth, substrate/product diffusion, and protection from
fluid shear forces.
Celite™ R-636 was regarded as the best of the four materials due to its combination of
excellent immobilization capabilities, durability, chemical inertness, ease of handling,
and previous success in other bioreactor applications. Scale-up concerns with Celite™
R-635 are minimal as its intended use is at the industrial scale as described by the
78
manufacturer. Although it was the most expensive of the materials tested ($22.00/kg,
$13.30/L), its price was still an order of magnitude lower than more highly engineered
carrier materials such as ion exchange resins (e.g. Dowex™ 1x8, $564/kg) and
microcarriers (e.g. Cytoline™, $1826/L) which have been used in the literature for
similar applications such as immobilization of ethanol producing bacteria (Krug and
Daugulis, 1983) and anaerobic wastewater consortia (Chauhan and Ogram, 2005).

79
Figure 5.3: Scanning electron micrograph (100x) of the surface of Celite™ R-635 carrier material. Scale bar shows 100 μm.
Figure 5.4: Scanning electron micrograph (2000x) of the surface Celite™ R-635 carrier material. Scale bar shows 20 μm.

80
5.3 Immobilization Potential
Earlier experiments in this study had compared the microbial kinetics of Desulfovibrio
desulfuricans and the SRB consortium. The consortium exhibited superior growth rates
and specific product formation rates. The immobilization potential of the two microbial
systems was evaluated to determine which is more readily retained within the bioreactor.
Results of immobilization experiments using varying inoculum compositions of
Desulfovibrio desulfuricans and the SRB consortium are shown in Figure 5.5. Using
both polyurethane foam and R-635 pellets as carrier materials a non-linear, inverse
relationship between inoculum composition and biomass immobilized (mg CDW/reactor)
was observed. Desulfovibrio desulfuricans appeared to have a high immobilization
potential compared to the SRB consortium.
The literature had indicated that Desulfovibrio desulfuricans is well known for its
attached growth properties and frequently used as model organism for SRB biofilm
formation (Chen et al., 1994; Okabe et al., 1994; Beyenal and Lewandowski, 2004; Lopes
et al., 2005; Lopes et al., 2006; Lee et al., 2006). Qualitative observations had also
indicated that Desulfovibrio desulfuricans had superior immobilization potential
compared to the consortium. Desulfovibrio desulfuricans serum bottle cultures were
observed to form distinct biofilms on the bottle’s surface 24-48 h after reaching stationary
phase (Figure 5.6). Shaking the serum bottle would detach the biofilms which then
aggregated into ‘streamers’. The liquid medium’s viscosity increased such that after
agitation, gas bubbles became entrained in the liquid and slowly rose to the surface. The
increased viscosity was attributed to increased extracellular polysaccharide (EPS)

81
formation. This phenomenon had been observed in other pure culture work using the
similar Desulfovibrio vulgaris (Hildenborough) species. In contrast, the SRB consortium
produced only small amounts of rapidly settling flocs that were less than 1 mm in
diameter. Similar biofilm or EPS production was not observed for the consortium.

82
0
50
100
150
200
250
300
0 20 40 60 80 100% (w/w) Consortium in Inoculum
Biom
ass
Imm
obili
zed
(mg
CD
W)
PU FoamR-635
Figure 5.5: Biomass immobilized (mg CDW per reactor) to carrier material in a packed bed as a function of inoculum composition. 0 % consortium corresponds to 100 % pure culture (Desulfovibrio desulfuricans). Diamonds represent results obtained using polyurethane foam as the carrier material. Squares represent results obtained using Celite™ R-635 as the carrier material.
A) B)
Figure 5.6: Desulfovibrio desulfuricans (A) and SRB consortium (B) cultures grown under identical conditions. Detached biofilm ‘streamers’ are clearly visible in (A). The SRB consortium cultures contained only a small amount of floc particles that settled to the bottom of the tube (not visible).
83
Despite the absence of visible biofilm formation, the consortium was not expected to
exhibit nearly negligible immobilization potential. The recent literature had reported the
successful use of similarly enriched SRB consortia in packed bed bioreactors (Baskaran
and Nemati, 2006; Alvarez et al., 2006). The low observed immobilization potential may
have been a result of an insufficient circulation period. It was clear though that the
consortium did not immobilize nearly as well as Desulfovibrio desulfuricans. In a
manner similar to the trend observed in Figure 5.1, the addition of even small fractions of
consortium to the inoculum was apparently sufficient for the consortium to become the
dominant population, sharply decreasing the immobilization potential.
Sulfate reducing bacteria are well known to produce biofilms in their natural
environment. Their tendency to adhere to surfaces allows them to be significant
nuisances with regard to pipeline corrosion and clogging (Chen et al., 1994). This
suggests that the environmental sample from which the consortium was enriched may
have originally contained SRB with greater immobilization potential. The serial transfer
enrichment process may have inadvertently selected for SRB with poor biofilm
tendencies. Transfers were performed using syringes that collected suspended growth
species rather than those attached to the glass surfaces. The serial transfer method also
selected for kinetically superior species as previously demonstrated by the consortium’s
greater growth rates. Biofilm forming SRB may be at a disadvantage in this regard. An
organism that directs a greater proportion of energy and carbon source towards
extracellular products (e.g. EPS, biofilm) would have a slower growth rate to that of a
competitor that devoted the majority its resources towards cellular replication.

84
Recognizing the consortium’s poor immobilization capabilities, an attempt was made to
re-enrich for kinetically superior SRB species with good attached growth properties. The
original enrichment received from the University of Calgary was used to inoculate culture
tubes containing PC media and packed with R-635 pellets. Several transfers failed to
produce a consortium that exhibited similar biofilm properties to Desulfovibrio
desulfuricans as measured qualitatively by observation and simple biofilm staining
techniques. This failure was attributed to the Calgary consortium having already
undergone four serial transfers that enriched for suspended growth species before its
delivery to Queen’s. The presence of increased surface area alone was also unlikely to
enrich for biofilm producers, even if they had been present. In order to impose the
correct selective pressure, enrichment should have occurred in a continuous flow reactor
that would washout the suspended species while retaining the biofilm prone species.
Furthermore, it is also unlikely that the addition of surface area to a closed system would
induce a ‘poor’ biofilm producer to modify its phenotype. Christy (2001) observed
similar results with an SRB consortium, similarly enriched from wastewater that
exhibited poor immobilization potential in the presence of pall ring packing material.
The consortium’s attached growth properties could not be readily improved, thus it was
decided that an inoculum composition of approximately 5 % consortium and balance
Desulfovibrio desulfuricans would be ideal for use in future PBR fermentations, the
rationale being that the initial establishment of a substantial biofilm foundation in a
packed bed is vital to stable bioreactor operation. The EPS produced by the

85
Desulfovibrio desulfuricans biofilm foundation would serve to immobilize the rapidly
growing consortium. Continuous flow conditions would then naturally select for the
optimal balance between the slower growing Desulfovibrio desulfuricans and the faster
growing consortium. This hypothesis was confirmed qualitatively by inoculating a serum
bottle culture with a sample from a PBR after 11 d of operation with an initial ~5%
consortium inoculum. The serum bottle culture exhibited sulfate reducing activity, but
did not form the characteristic biofilms of Desulfovibrio desulfuricans, suggesting it was
no longer the dominant species.
In summary, it was found that while the consortium had superior kinetics its
immobilization potential was relatively poor. Literature studies that used similarly
enriched cultures have reported extended bioreactor startup times which may be due in
part to the poor immobilization potential of their suspended growth enriched consortia.
Carrier material evaluation is a common method of improving packed bed bioreactor
design and Celite™ R-635 diatomaceous earth pellets were found to have the best
performance of the materials tested. Rational design of an inoculum containing both
kinetically favoured and attached growth (biofilm) prone species is a novel approach to
SRB bioprocess improvement and may offer significant advantages with regards to
decreasing bioreactor startup time and increasing volumetric productivities.
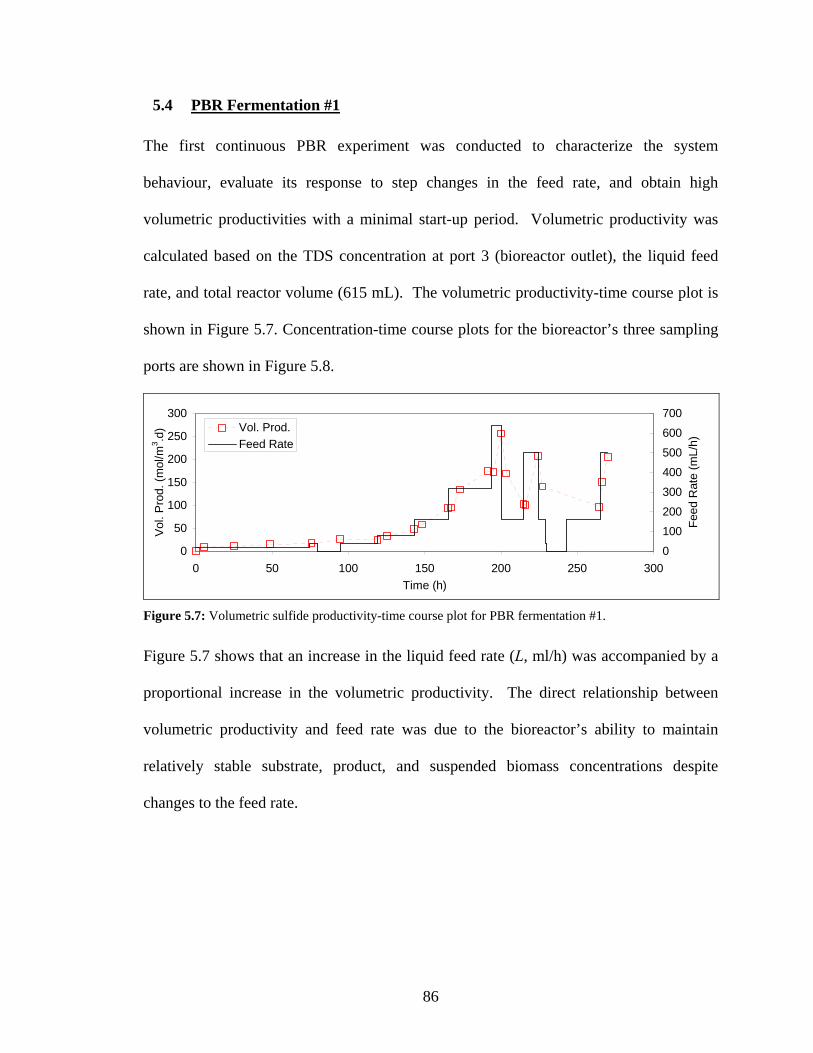
86
5.4 PBR Fermentation #1
The first continuous PBR experiment was conducted to characterize the system
behaviour, evaluate its response to step changes in the feed rate, and obtain high
volumetric productivities with a minimal start-up period. Volumetric productivity was
calculated based on the TDS concentration at port 3 (bioreactor outlet), the liquid feed
rate, and total reactor volume (615 mL). The volumetric productivity-time course plot is
shown in Figure 5.7. Concentration-time course plots for the bioreactor’s three sampling
ports are shown in Figure 5.8.
0
50
100
150
200
250
300
0 50 100 150 200 250 300Time (h)
Vol
. Pro
d. (m
ol/m
3 .d)
0
100
200
300
400
500
600
700
Feed
Rat
e (m
L/h)
Vol. Prod. Feed Rate
Figure 5.7: Volumetric sulfide productivity-time course plot for PBR fermentation #1.
Figure 5.7 shows that an increase in the liquid feed rate (L, ml/h) was accompanied by a
proportional increase in the volumetric productivity. The direct relationship between
volumetric productivity and feed rate was due to the bioreactor’s ability to maintain
relatively stable substrate, product, and suspended biomass concentrations despite
changes to the feed rate.

87
A)
0
5
10
15
20
25
30
0 50 100 150 200 250 300Time (h)
Sul
fide
(mM
)
0
100
200
300
400
500
600
700
Feed
Rat
e (m
L/h)
Port 1 Port 2Port 3 Feed Rate
B)
0
5
10
15
20
25
30
0 50 100 150 200 250 300Time (h)
Sul
fate
(mM
)
0
100
200
300
400
500
600
700
Feed
Rat
e (m
L/h)
Port 3 Feed Rate
C)
0.000
0.200
0.400
0.600
0.800
1.000
0 50 100 150 200 250 300
Time (h)
X (g
CD
W/L
)
0
100
200
300400
500
600
700
Feed
Rat
e (m
L/h)
Port 1 Port 2Port 3 Feed Rate
Figure 5.8: Concentration-time course plot for total dissolved sulfide (A), sulfate (B), and suspended biomass (C) concentrations for PBR fermentation #1. Port 3 corresponds to the reactor’s outlet.

88
Figure 5.8 shows that as step increases were made to the feed rate, the product (TDS and
suspended biomass) concentrations decreased briefly and the substrate (sulfate)
concentration increased briefly. These transient responses were due to the minor dilution
effect of increasing the feed rate. After a few column volumes had passed, steady-state
concentrations were re-established. The behaviour of the PBR could be described in
some respects as analogous to a chemostat stirred tank bioreactor. Whereas a chemostat
responds to feed fluctuations by regulating its suspended biomass concentration to
maintain constant substrate/product concentrations, the PBR likely regulated its
immobilized biomass inventory to maintain state-state conditions. The PBR differed
from the chemostat in that the steady-state TDS concentration always approached the
inhibitory range (15-20 mM) and was practically independent of the feed rate. In
contrast, the steady-state concentrations in a chemostat are a function of the feed rate at
conditions that approach washout (D = μ).
The TDS product concentration profile increased along the length of the bioreactor
(Figure 5.8A). Likewise the sulfate substrate concentration decreased along the length of
the bioreactor, behavior typical of a PBR configuration. The TDS concentration profile
indicated that the majority of the biological activity was occurring within a small portion
of the bioreactor between the inlet and the first sampling port. By the time the liquid had
reached the first sampling port, the TDS concentration had reached at least 50 % of the
final exiting concentration. The upper two-thirds of the bioreactor were thus only
contributing marginally to total product formation and represented an inefficient use of
bioreactor volume under the evaluated operating conditions. Chen et al. (1994) observed
89
similar results in their sand packed SRB PBR. Daugulis and Swaine (1987) presented a
model that predicted identical behaviour for an ethanol inhibited PBR system. As
product concentration increases along the length of the bioreactor, kinetic rates and
conversion efficiency are expected to decrease rapidly. The highest immobilized biomass
concentrations would thus be expected at the bioreactor inlet where substrate
concentrations are high and product inhibition is minimal. In densely packed systems it
is not uncommon for excessive microbial overgrowth to lead to clogging and pressure
drops across the column (Daugulis et al., 1985).
Concomitant spikes in the suspended biomass and TDS concentrations were observed
after large decreases to the feed rate were imposed at ~200 h and ~230 h. The spike in
TDS concentration was attributed to transient product accumulation due to the decrease
in the feed (dilution) rate. The increase in suspended biomass however was considered
too great to be attributed solely to product biomass accumulation. Adverse bioreactor
conditions may have induced partial biofilm sloughing although this link was uncertain
and the subject of further investigation in the second PBR fermentation.
Experimental conditions in the first PBR fermentation were such that bioreactor clogging
was not an issue and biofilm coverage of the R-635 pellets was apparent as dark
discolourations on the packing material near the bioreactor inlet. The assumption that the
first third of the bioreactor length contained a disproportionately high concentration of
immobilized biomass that was responsible for the majority of biological activity was
confirmed by SEM analysis. Figure 5.9, Figure 5.10, and Figure 5.11 are typical SEM
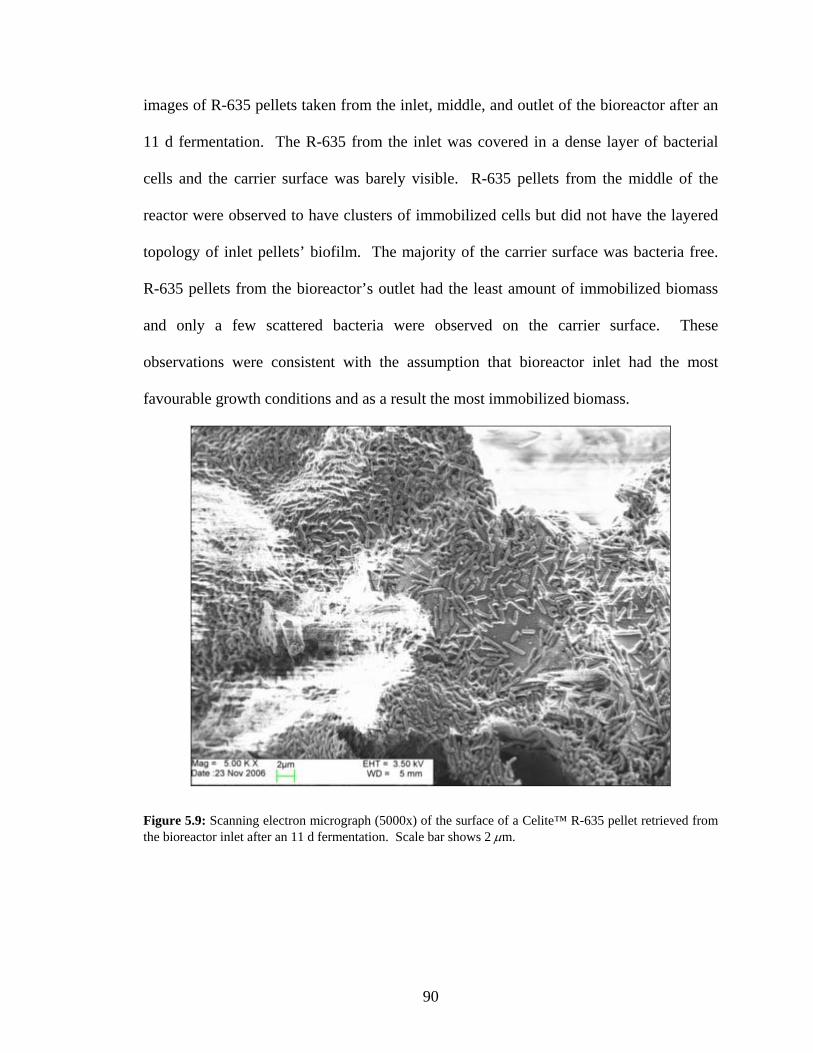
90
images of R-635 pellets taken from the inlet, middle, and outlet of the bioreactor after an
11 d fermentation. The R-635 from the inlet was covered in a dense layer of bacterial
cells and the carrier surface was barely visible. R-635 pellets from the middle of the
reactor were observed to have clusters of immobilized cells but did not have the layered
topology of inlet pellets’ biofilm. The majority of the carrier surface was bacteria free.
R-635 pellets from the bioreactor’s outlet had the least amount of immobilized biomass
and only a few scattered bacteria were observed on the carrier surface. These
observations were consistent with the assumption that bioreactor inlet had the most
favourable growth conditions and as a result the most immobilized biomass.
Figure 5.9: Scanning electron micrograph (5000x) of the surface of a Celite™ R-635 pellet retrieved from the bioreactor inlet after an 11 d fermentation. Scale bar shows 2 μm.

91
Figure 5.10: Scanning electron micrograph (5000x) of the surface of a Celite™ R-635 pellet retrieved from the midpoint of the bioreactor after an 11 d fermentation. Scale bar shows 2 μm.
Figure 5.11: Scanning electron micrograph (5000x) of the surface of a Celite™ R-635 pellet retrieved from the bioreactor outlet after an 11 d fermentation. Scale bar shows 2 μm.
92
As noted previously, the TDS concentration profile increased along the length of the
bioreactor. This pattern was consistently observed except after the bioreactor had been
briefly shutdown for 15 h (after ~80 h of fermentation time). After the shutdown a
reverse profile was observed (highest TDS concentration near the inlet). This
phenomenon was due to the PBR behaving essentially as a series of static batch reactors
with concentrations of biomass (i.e. biocatalyst) decreasing from bottom to top. After
the liquid feed had been resumed and a few column volumes had passed, the typical
concentration profile associated for a continuous flow regime was re-established.
The highest volumetric productivity for the bioreactor was observed when the feed rate
was at its highest value (L = 640 mL/h; HRT = 0.63 h; D = 1.6 h-1; t = 200 h ≈ 8 d). At
these conditions the volumetric productivity based on the outlet (port 3) concentration
was 257 mol/m3.d. The TDS concentrations at the second and third ports were 9.9 and
10.3 mM respectively. If only the first half of the bioreactor is considered, the calculated
volumetric productivity increases to 493 mol/m3.d. These volumetric rates are
comparable to the highest values reported in literature (Table 5.3) and occurred at TDS
concentrations close to the inhibitory concentration range (15-20 mM). Had the
bioreactor been allowed to operate longer at 640 mL/h it is likely that higher volumetric
productivities would have been obtained due to the TDS concentration approaching 20
mM. Continuous operation at this feed rate was not feasible due to the excessive
volumes of media required. This was a limitation of laboratory logistics and not intrinsic
to the bioreactor system.

93
While the highest volumetric productivity achieved in this experiment was below the
highest value reported in literature [(493 mol/m3.d) < (677 mol/m3.d)] it is important to
consider the conditions under which these values were obtained. The high volumetric
productivities obtained by Stucki et al. (1993) and Selvaraj et al. (1997) were achieved
using more elaborate PBR systems that included recycle loops and online pH controllers.
This study was able to achieve comparable volumetric productivities using a simple PBR
configuration without an external pH control loop and a drastically reduced startup period
of 8 d compared to 150 d for the case of the highest literature value. Growth medium and
temperature variation may be partially responsible for the differences in system
performance but it is more likely that the use of a superior carrier material (Celite™ R-
635) and critical inoculum design were the key factors that improved biomass retention
and overall bioreactor performance. Baskaran and Nemati’s (2006) experience with a
similar system further supports this hypothesis. Their suspended growth enriched
consortium was not supplemented with an SRB species prone to biofilm formation and
their packing materials lacked a microporous structure. Despite operating under
otherwise similar conditions over several months they were only able to achieve
volumetric productivities between 3-57 mol/m3.d.
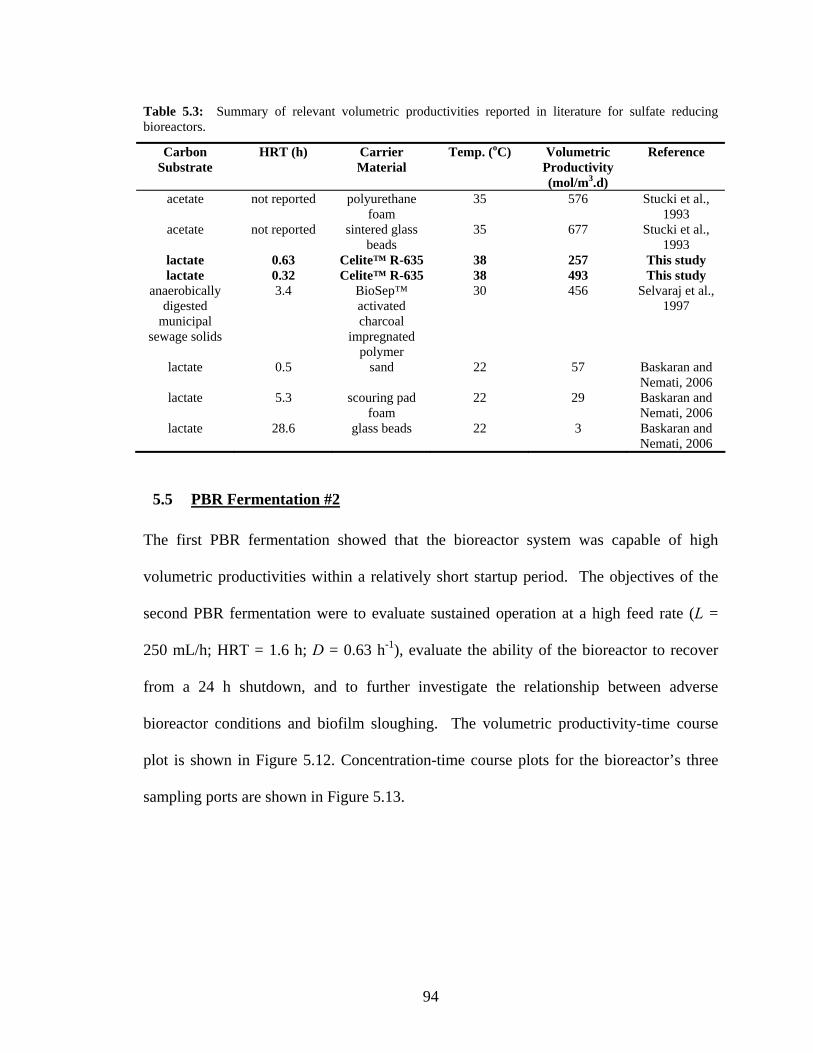
94
Table 5.3: Summary of relevant volumetric productivities reported in literature for sulfate reducing bioreactors.
Carbon Substrate
HRT (h) Carrier Material
Temp. (oC) Volumetric Productivity (mol/m3.d)
Reference
acetate not reported polyurethane foam
35 576 Stucki et al., 1993
acetate not reported sintered glass beads
35 677 Stucki et al., 1993
lactate 0.63 Celite™ R-635 38 257 This study lactate 0.32 Celite™ R-635 38 493 This study
anaerobically digested
municipal sewage solids
3.4 BioSep™ activated charcoal
impregnated polymer
30 456 Selvaraj et al., 1997
lactate 0.5 sand 22 57 Baskaran and Nemati, 2006
lactate 5.3 scouring pad foam
22 29 Baskaran and Nemati, 2006
lactate 28.6 glass beads 22 3 Baskaran and Nemati, 2006
5.5 PBR Fermentation #2
The first PBR fermentation showed that the bioreactor system was capable of high
volumetric productivities within a relatively short startup period. The objectives of the
second PBR fermentation were to evaluate sustained operation at a high feed rate (L =
250 mL/h; HRT = 1.6 h; D = 0.63 h-1), evaluate the ability of the bioreactor to recover
from a 24 h shutdown, and to further investigate the relationship between adverse
bioreactor conditions and biofilm sloughing. The volumetric productivity-time course
plot is shown in Figure 5.12. Concentration-time course plots for the bioreactor’s three
sampling ports are shown in Figure 5.13.
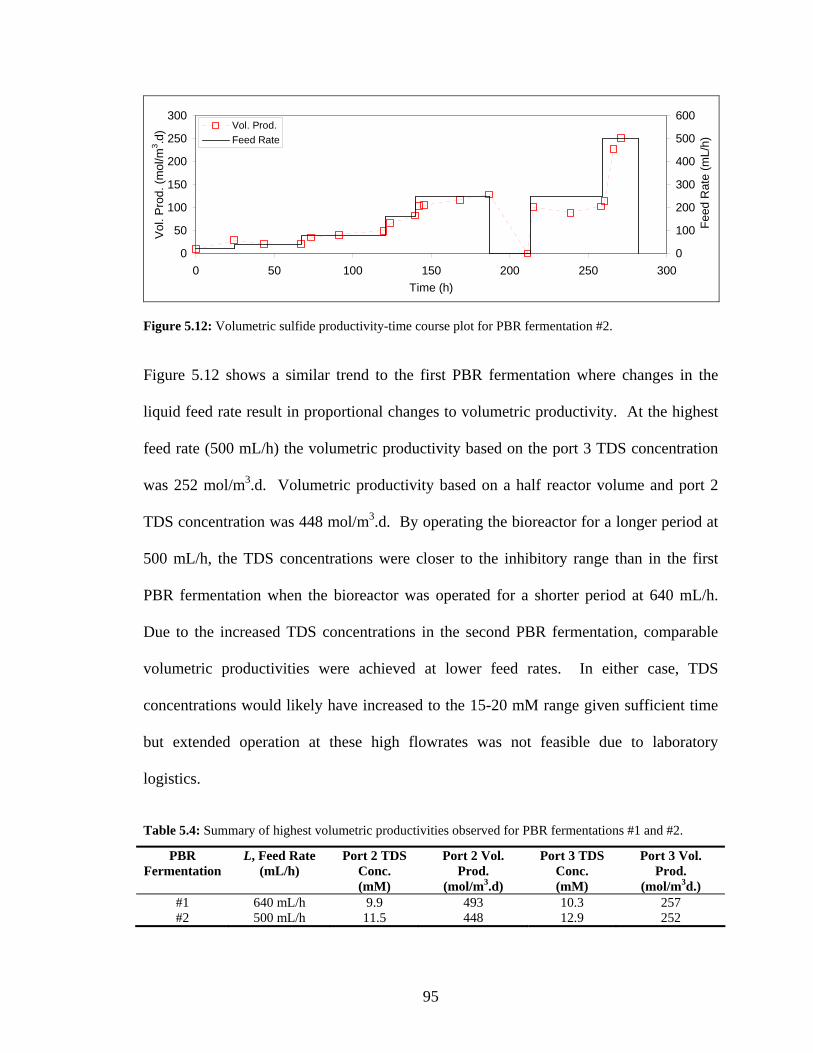
95
0
50
100
150
200
250
300
0 50 100 150 200 250 300Time (h)
Vol
. Pro
d. (m
ol/m
3 .d)
0
100
200
300
400
500
600
Fee
d R
ate
(mL/
h)
Vol. Prod.Feed Rate
Figure 5.12: Volumetric sulfide productivity-time course plot for PBR fermentation #2.
Figure 5.12 shows a similar trend to the first PBR fermentation where changes in the
liquid feed rate result in proportional changes to volumetric productivity. At the highest
feed rate (500 mL/h) the volumetric productivity based on the port 3 TDS concentration
was 252 mol/m3.d. Volumetric productivity based on a half reactor volume and port 2
TDS concentration was 448 mol/m3.d. By operating the bioreactor for a longer period at
500 mL/h, the TDS concentrations were closer to the inhibitory range than in the first
PBR fermentation when the bioreactor was operated for a shorter period at 640 mL/h.
Due to the increased TDS concentrations in the second PBR fermentation, comparable
volumetric productivities were achieved at lower feed rates. In either case, TDS
concentrations would likely have increased to the 15-20 mM range given sufficient time
but extended operation at these high flowrates was not feasible due to laboratory
logistics.
Table 5.4: Summary of highest volumetric productivities observed for PBR fermentations #1 and #2.
PBR Fermentation
L, Feed Rate (mL/h)
Port 2 TDS Conc. (mM)
Port 2 Vol. Prod.
(mol/m3.d)
Port 3 TDS Conc. (mM)
Port 3 Vol. Prod.
(mol/m3d.) #1 640 mL/h 9.9 493 10.3 257 #2 500 mL/h 11.5 448 12.9 252
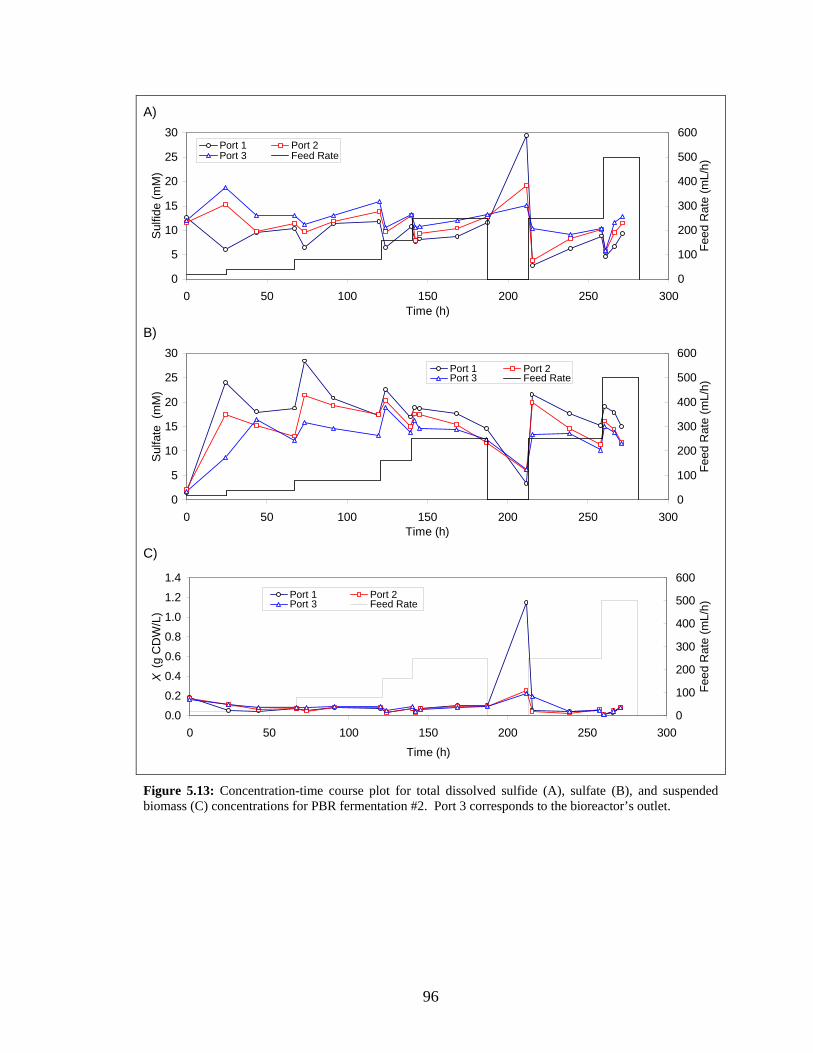
96
A)
0
5
10
15
20
25
30
0 50 100 150 200 250 300Time (h)
Sul
fide
(mM
)
0
100
200
300
400
500
600
Feed
Rat
e (m
L/h)
Port 1 Port 2Port 3 Feed Rate
B)
0
5
10
15
20
25
30
0 50 100 150 200 250 300Time (h)
Sul
fate
(m
M)
0
100
200
300
400
500
600
Feed
Rat
e (m
L/h)
Port 1 Port 2Port 3 Feed Rate
C)
0.0
0.2
0.4
0.6
0.8
1.0
1.2
1.4
0 50 100 150 200 250 300Time (h)
X (g
CD
W/L
)
0
100
200
300
400
500
600
Feed
Rat
e (m
L/h)
Port 1 Port 2Port 3 Feed Rate
Figure 5.13: Concentration-time course plot for total dissolved sulfide (A), sulfate (B), and suspended biomass (C) concentrations for PBR fermentation #2. Port 3 corresponds to the bioreactor’s outlet.

97
Concentrations profiles in the second PBR fermentation were similar to those observed in
the previous fermentation. Sustained operation at a relatively high feed rate of 250 mL/h
showed relatively stable TDS and sulfate concentration profiles. After the transient TDS
decrease due to increasing the feed from 160 mL/h to 250 mL/h at 140 h, the TDS
concentration slowly reestablished a relatively steady value near the inhibitory range. At
250 mL/h the equivalent dilution rate was 0.63 h-1, nearly twice the commonly reported μ
values at non-inhibited growth conditions (Okabe et al., 1992; Konishi et al., 1996) and
over four times the observed μ values observed experimentally in the kinetics
experiments. The sustained operation at this dilution rate for the equivalent of 30 column
volumes confirmed the system’s ability for biomass retention and that the majority of the
biological activity was due to immobilized rather than suspended biomass.
After 187 h of continuous operation, the bioreactor was shutdown. The liquid feed was
halted and the bioreactor was allowed to cool to ambient temperature. After 24 h, sulfate
and TDS concentrations were measured at each port (Figure 5.13A, B). Sulfate
concentrations were found to have been reduced to approximately 5 mM along the entire
column, indicating complete conversion of the stoichiometric limiting lactate carbon
source. Very high TDS concentrations of 30, 19, and 15 mM at the inlet, middle, and
outlet respectively were observed. The decreasing TDS profile along the bioreactor
length was similar to that observed in the first fermentation after a shutdown period. In
both cases this was attributed to the immobilized biomass concentration profile that also
decreased along the bioreactor length.
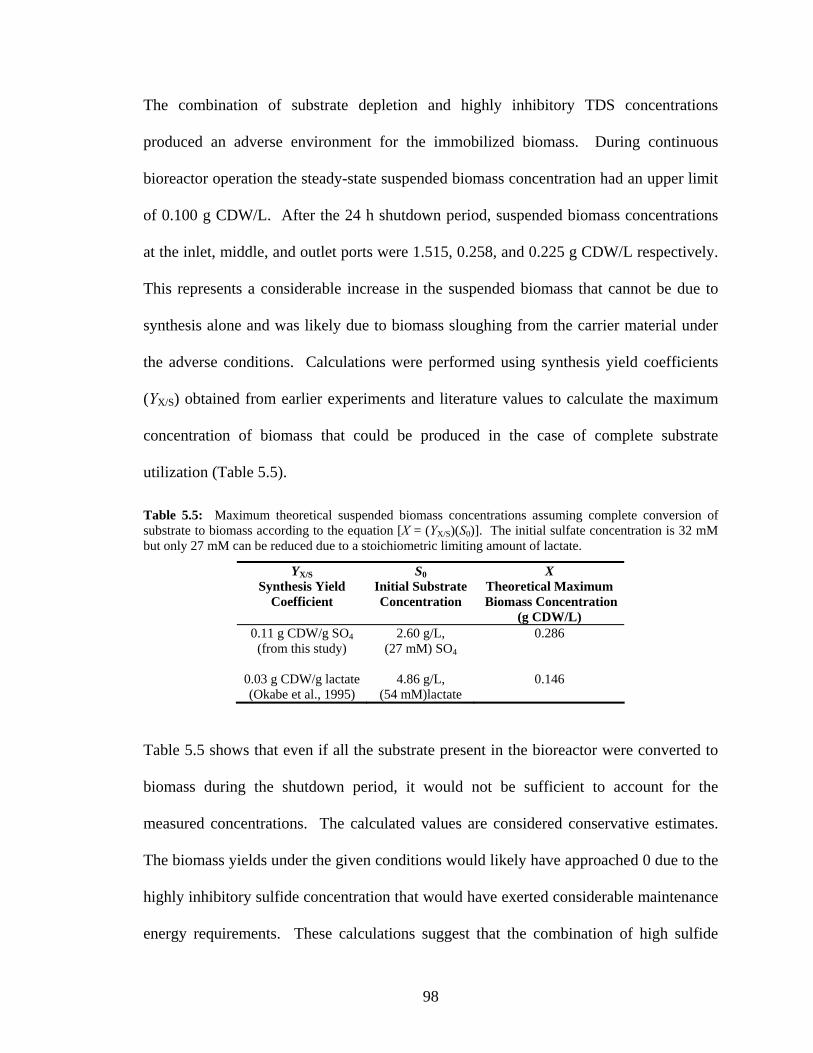
98
The combination of substrate depletion and highly inhibitory TDS concentrations
produced an adverse environment for the immobilized biomass. During continuous
bioreactor operation the steady-state suspended biomass concentration had an upper limit
of 0.100 g CDW/L. After the 24 h shutdown period, suspended biomass concentrations
at the inlet, middle, and outlet ports were 1.515, 0.258, and 0.225 g CDW/L respectively.
This represents a considerable increase in the suspended biomass that cannot be due to
synthesis alone and was likely due to biomass sloughing from the carrier material under
the adverse conditions. Calculations were performed using synthesis yield coefficients
(YX/S) obtained from earlier experiments and literature values to calculate the maximum
concentration of biomass that could be produced in the case of complete substrate
utilization (Table 5.5).
Table 5.5: Maximum theoretical suspended biomass concentrations assuming complete conversion of substrate to biomass according to the equation [X = (YX/S)(S0)]. The initial sulfate concentration is 32 mM but only 27 mM can be reduced due to a stoichiometric limiting amount of lactate.
YX/S Synthesis Yield
Coefficient
S0 Initial Substrate Concentration
X Theoretical Maximum
Biomass Concentration (g CDW/L)
0.11 g CDW/g SO4 (from this study)
2.60 g/L, (27 mM) SO4
0.286
0.03 g CDW/g lactate(Okabe et al., 1995)
4.86 g/L, (54 mM)lactate
0.146
Table 5.5 shows that even if all the substrate present in the bioreactor were converted to
biomass during the shutdown period, it would not be sufficient to account for the
measured concentrations. The calculated values are considered conservative estimates.
The biomass yields under the given conditions would likely have approached 0 due to the
highly inhibitory sulfide concentration that would have exerted considerable maintenance
energy requirements. These calculations suggest that the combination of high sulfide
99
concentration and substrate limitation had an adverse effect on the system and induced
considerable sloughing of immobilized biomass.
To test the bioreactor’s robustness and ability to recover from the shutdown, the feed rate
was resumed at the previous value of 250 mL/h (t = 213 h, Figure 5.12). The bioreactor
rapidly recovered and within 48 h the volumetric productivity had returned to 102
mol/m3.d with an outlet TDS concentration of 10.5 mM (both 80 % of the pre-shutdown
values). The bioreactor was operated at 250 mL/h for 46 h (29 column volumes) and then
was further challenged by doubling the feed rate to 500 mL/h for a further 23 h (28
column volumes). The bioreactor adapted successfully and achieved a volumetric
productivity of 448 mol/m3.d as described in Table 5.4. The observed robustness of the
system and swift recovery after shutdown was remarkable. After experiencing such
adverse conditions and considerable loss of biomass it was thought that restoration of the
feed rate to 250 mL/h may have led to complete biomass washout or at least require a
longer, more gradual recovery process. The system’s rapid 48 h recovery and subsequent
feed rate doubling highlighted the bioreactor’s capacity for biomass immobilization and
ability to sustain microbial growth under adverse conditions. The resiliency of the
biomass to TDS concentrations well beyond the known inhibitory level (30 mM) may be
due partially to the consortium enrichment method that continuously exposed the
transfers to high TDS concentrations as previously discussed.
In summary, two PBR fermentations were conducted to characterize the system
behaviour and achieve high rates of volumetric sulfide production. It was found that the
100
majority of the immobilized biomass and thus most of the biological activity was located
within the first third of the bioreactor. The bioreactor was able to respond to changes in
feed rates by adjusting its biomass inventory to maintain relatively constant TDS
concentrations near the inhibitory level of approximately 15 mM. The combination of a
superior carrier material (Celite™ R-635) and critical inoculum design resulted in
excellent biomass immobilization. This facilitated rapid bioreactor startup, achievement
of high volumetric productivities, and the ability to recover from shutdown periods
concomitant with highly adverse conditions of substrate depletion and sulfide inhibition.
This relatively simple bioreactor system was able to achieve volumetric productivities
comparable to more complex systems reported in the literature while requiring a startup
period on the scale of 10 d rather than 100 d (Stucki et al., 1993; Selvaraj et al., 1997;
Baskaran and Nemati, 2006).
5.6 PBR Fermentation #3
The objective of the third PBR fermentation was to characterize the system behaviour
while operating with an N2 strip gas. The sulfide product does not readily transfer to the
gas phase due to its high aqueous solubility. This was observed experimentally and
reported in the literature under similar conditions (Baskaran and Nemati, 2006; Alvarez et
al., 2007) where practically all the sulfide product was measured in the dissolved phase.
A strip gas was therefore considered an essential element of product recovery. CH4 in
comparison is highly insoluble (HCH4 = 37,600 atm @ 20 oC) and is easily recovered as a
gas phase product without the need for additional stripping. CH4 saturation
concentrations (1.5 mM, 18 mg/L) are readily achieved as CH4 is not inhibitory to
anaerobic bacteria. In contrast, H2S is roughly two orders of magnitude more soluble in

101
solution (HH2S = 483 atm @ 20 oC). Due to its inhibitory nature, biologically produced
dissolved sulfide concentrations have an upper limit of about 20 mM (640 mg/L), far
below the saturation concentration of 115 mM (3910 mg/L). pH effects further hinder
H2S recovery since at biologically favourable pH values (6-8) significant fractions of
dissolved sulfides are present as the non-strippable ion HS- (Figure 2.4).
The results of the PBR fermentation with a constant feed rate (L = 80 mL/h) and a
varying N2 (G, mL/min) flow rate are shown in Figure 5.14. Strip rates were reported as
the normalized volumetric stripping ratio G/L (m3/m3).
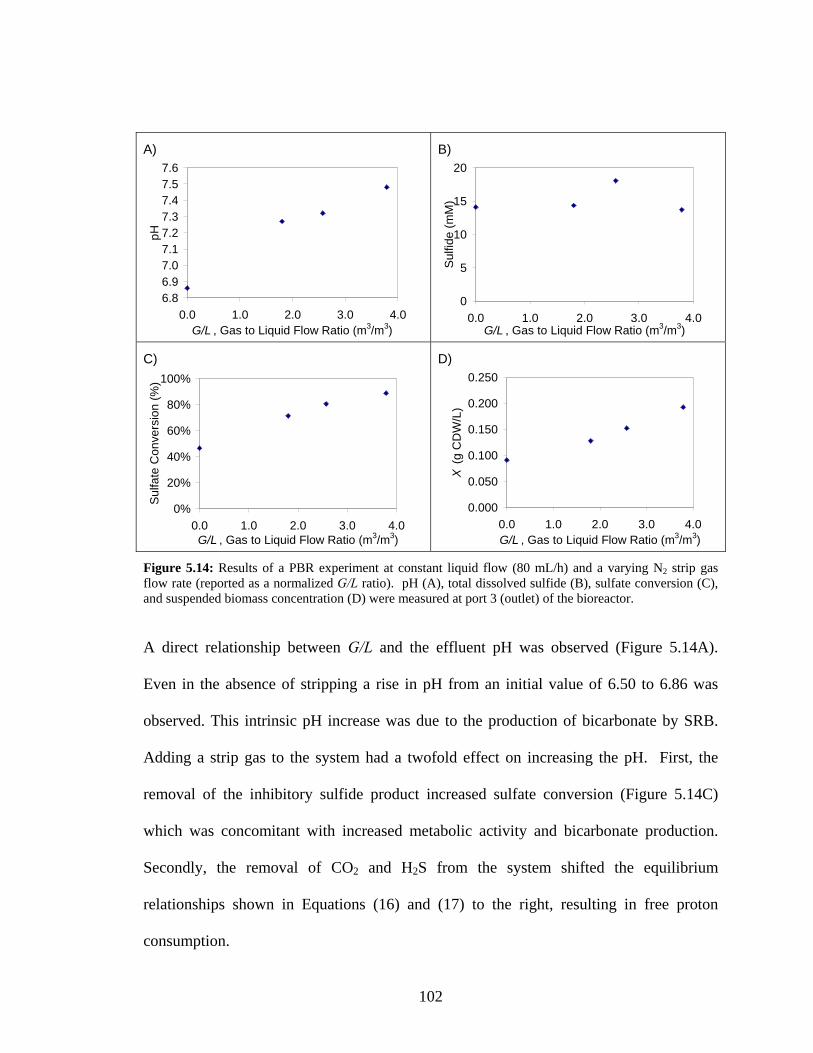
102
A)
6.86.97.07.17.27.37.47.57.6
0.0 1.0 2.0 3.0 4.0G/L , Gas to Liquid Flow Ratio (m3/m3)
pH
B)
0
5
10
15
20
0.0 1.0 2.0 3.0 4.0G/L , Gas to Liquid Flow Ratio (m3/m3)
Sul
fide
(mM
)
C)
0%
20%
40%
60%
80%
100%
0.0 1.0 2.0 3.0 4.0G/L , Gas to Liquid Flow Ratio (m3/m3)
Sul
fate
Con
vers
ion
(%)
D)
0.000
0.050
0.100
0.150
0.200
0.250
0.0 1.0 2.0 3.0 4.0G/L , Gas to Liquid Flow Ratio (m3/m3)
X (g
CD
W/L
)
Figure 5.14: Results of a PBR experiment at constant liquid flow (80 mL/h) and a varying N2 strip gas flow rate (reported as a normalized G/L ratio). pH (A), total dissolved sulfide (B), sulfate conversion (C), and suspended biomass concentration (D) were measured at port 3 (outlet) of the bioreactor.
A direct relationship between G/L and the effluent pH was observed (Figure 5.14A).
Even in the absence of stripping a rise in pH from an initial value of 6.50 to 6.86 was
observed. This intrinsic pH increase was due to the production of bicarbonate by SRB.
Adding a strip gas to the system had a twofold effect on increasing the pH. First, the
removal of the inhibitory sulfide product increased sulfate conversion (Figure 5.14C)
which was concomitant with increased metabolic activity and bicarbonate production.
Secondly, the removal of CO2 and H2S from the system shifted the equilibrium
relationships shown in Equations (16) and (17) to the right, resulting in free proton
consumption.

103
2232-
3 COOHCOHHHCO +↔↔+ + (16)
SHHHS 2- ↔+ + (17)
The TDS concentration remained relatively constant in the inhibitory range of 15-20 mM
(Figure 5.14B) despite large increases in the sulfate conversion from 47 % to 89 %
(Figure 5.14C). The additional sulfide that was produced was later confirmed to be
leaving the bioreactor with the strip gas. The molar ratio of TDS to sulfate was 0.95
mol/mol in the absence of stripping. This confirmed that without the N2 strip gas, the
majority of the sulfide product remained in the dissolved phase.
It was assumed that the increase in conversion (i.e. metabolic activity) was due to a
similar increase in immobilized biomass. Although the suspended biomass had a minor
contribution to the overall metabolic activity, it was used as an indicator of the amount of
immobilized biomass present. The basis for this correlation was that when operating at
washout conditions (D > μ) suspended cells are overwhelmingly due to steady-state
sloughing rather than suspended cell replication. It would then be anticipated that an
increase in immobilized biomass would be accompanied by a proportional increase in the
steady-steady sloughing. Figure 5.14C,D shows this direct relationship between G/L,
conversion, and suspended biomass concentration.
Additional G/L ratios were evaluated and gas phase samples were analyzed to confirm
that the increase in reduced sulfate could be attributed to the removal of sulfide as H2S(g)
in the strip gas. Table 5.6 shows the relative partitioning of total sulfides (H2S(g), H2S(aq),
HS-(aq)) between the dissolved and gas phases and the ratio between total sulfide produced
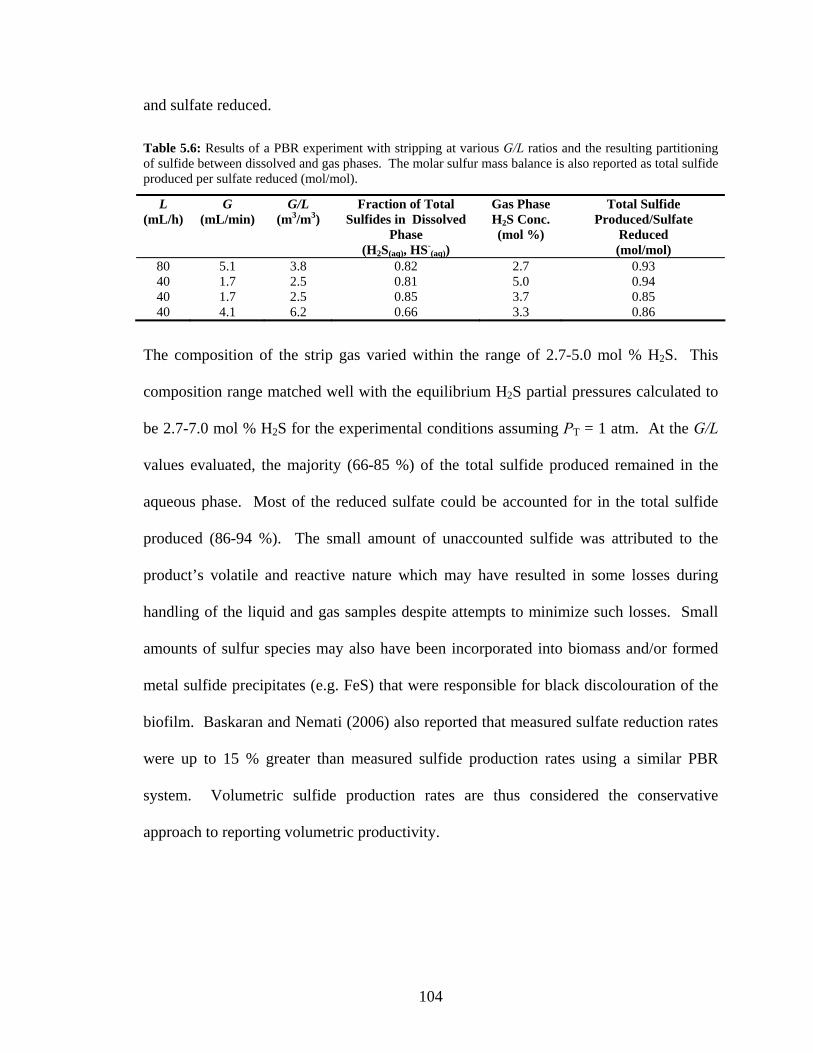
104
and sulfate reduced.
Table 5.6: Results of a PBR experiment with stripping at various G/L ratios and the resulting partitioning of sulfide between dissolved and gas phases. The molar sulfur mass balance is also reported as total sulfide produced per sulfate reduced (mol/mol).
L (mL/h)
G (mL/min)
G/L (m3/m3)
Fraction of Total Sulfides in Dissolved
Phase (H2S(aq), HS-
(aq))
Gas Phase H2S Conc. (mol %)
Total Sulfide Produced/Sulfate
Reduced (mol/mol)
80 5.1 3.8 0.82 2.7 0.93 40 1.7 2.5 0.81 5.0 0.94 40 1.7 2.5 0.85 3.7 0.85 40 4.1 6.2 0.66 3.3 0.86
The composition of the strip gas varied within the range of 2.7-5.0 mol % H2S. This
composition range matched well with the equilibrium H2S partial pressures calculated to
be 2.7-7.0 mol % H2S for the experimental conditions assuming PT = 1 atm. At the G/L
values evaluated, the majority (66-85 %) of the total sulfide produced remained in the
aqueous phase. Most of the reduced sulfate could be accounted for in the total sulfide
produced (86-94 %). The small amount of unaccounted sulfide was attributed to the
product’s volatile and reactive nature which may have resulted in some losses during
handling of the liquid and gas samples despite attempts to minimize such losses. Small
amounts of sulfur species may also have been incorporated into biomass and/or formed
metal sulfide precipitates (e.g. FeS) that were responsible for black discolouration of the
biofilm. Baskaran and Nemati (2006) also reported that measured sulfate reduction rates
were up to 15 % greater than measured sulfide production rates using a similar PBR
system. Volumetric sulfide production rates are thus considered the conservative
approach to reporting volumetric productivity.

105
5.7 Basic Model for PBR Operation with Stripping
The third PBR fermentation suggested that a strip gas could improve volumetric
productivity by increasing the bioreactor’s sulfate conversion. A simple model
(Appendix D) was created that calculated bioreactor volumetric productivity based upon
assumed values for the liquid feed, gas strip rate, temperature, pH, and a constant effluent
TDS concentration of 20 mM. The assumption of a constant TDS concentration of 20
mM was based on previous observations that the system was capable of adjusting its
biomass inventory to maintain the sulfide concentration in the inhibitory range despite
changes in operating conditions. The purpose of the model was to evaluate the effect of
pH and G/L ratios on volumetric productivity and sulfide product partitioning. The
results of a simulation for a 600 mL void volume PBR operating at a constant liquid feed
rate of 80 mL/h are shown in Figure 5.15 and Table 5.7. Volumetric sulfide production
was calculated using the total bioreactor volume. G/L values from 0 to 3.8 and pH values
from 6 to 8 were evaluated.
Table 5.7: Distribution of 20 mM total dissolved sulfide and the equilibrium H2S partial pressure at 37 oC for the pH range 6-8.
TDS Distribution pH TDS (mM) HS-
(aq) (mM) H2S(aq) (mM) PH2S (atm) 6 20 3.6 16.6 0.21 7 20 13.6 6.4 0.08 8 20 19 1 0.01
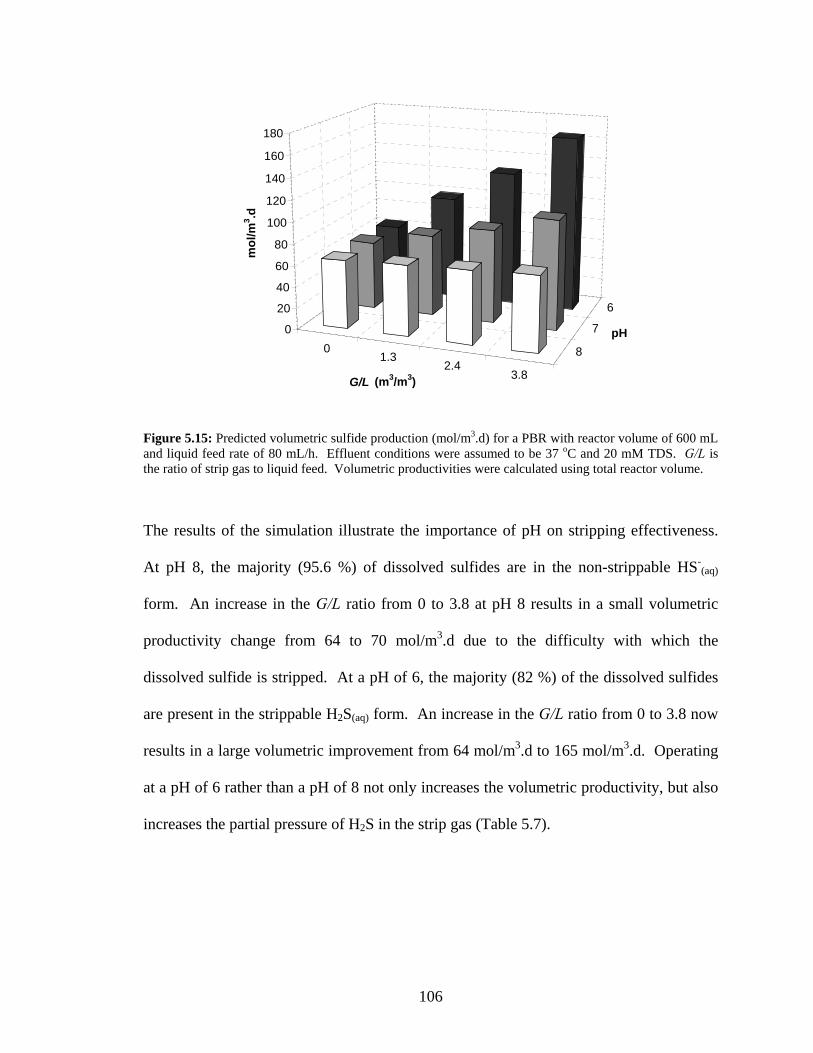
106
01.3
2.43.8
8
7
6
0
20
40
60
80
100
120
140
160
180
mol
/m3 .d
G/L (m3/m3)
pH
Figure 5.15: Predicted volumetric sulfide production (mol/m3.d) for a PBR with reactor volume of 600 mL and liquid feed rate of 80 mL/h. Effluent conditions were assumed to be 37 oC and 20 mM TDS. G/L is the ratio of strip gas to liquid feed. Volumetric productivities were calculated using total reactor volume.
The results of the simulation illustrate the importance of pH on stripping effectiveness.
At pH 8, the majority (95.6 %) of dissolved sulfides are in the non-strippable HS-(aq)
form. An increase in the G/L ratio from 0 to 3.8 at pH 8 results in a small volumetric
productivity change from 64 to 70 mol/m3.d due to the difficulty with which the
dissolved sulfide is stripped. At a pH of 6, the majority (82 %) of the dissolved sulfides
are present in the strippable H2S(aq) form. An increase in the G/L ratio from 0 to 3.8 now
results in a large volumetric improvement from 64 mol/m3.d to 165 mol/m3.d. Operating
at a pH of 6 rather than a pH of 8 not only increases the volumetric productivity, but also
increases the partial pressure of H2S in the strip gas (Table 5.7).
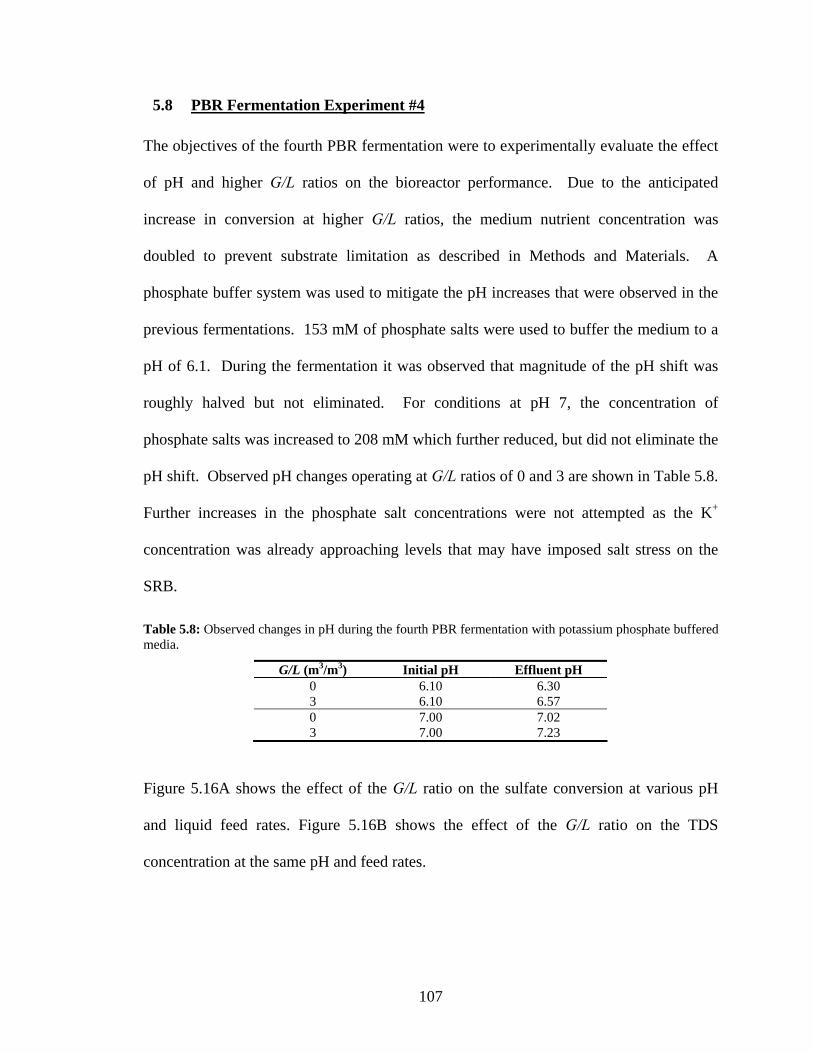
107
5.8 PBR Fermentation Experiment #4
The objectives of the fourth PBR fermentation were to experimentally evaluate the effect
of pH and higher G/L ratios on the bioreactor performance. Due to the anticipated
increase in conversion at higher G/L ratios, the medium nutrient concentration was
doubled to prevent substrate limitation as described in Methods and Materials. A
phosphate buffer system was used to mitigate the pH increases that were observed in the
previous fermentations. 153 mM of phosphate salts were used to buffer the medium to a
pH of 6.1. During the fermentation it was observed that magnitude of the pH shift was
roughly halved but not eliminated. For conditions at pH 7, the concentration of
phosphate salts was increased to 208 mM which further reduced, but did not eliminate the
pH shift. Observed pH changes operating at G/L ratios of 0 and 3 are shown in Table 5.8.
Further increases in the phosphate salt concentrations were not attempted as the K+
concentration was already approaching levels that may have imposed salt stress on the
SRB.
Table 5.8: Observed changes in pH during the fourth PBR fermentation with potassium phosphate buffered media.
G/L (m3/m3) Initial pH Effluent pH 0 6.10 6.30 3 6.10 6.57 0 7.00 7.02 3 7.00 7.23
Figure 5.16A shows the effect of the G/L ratio on the sulfate conversion at various pH
and liquid feed rates. Figure 5.16B shows the effect of the G/L ratio on the TDS
concentration at the same pH and feed rates.
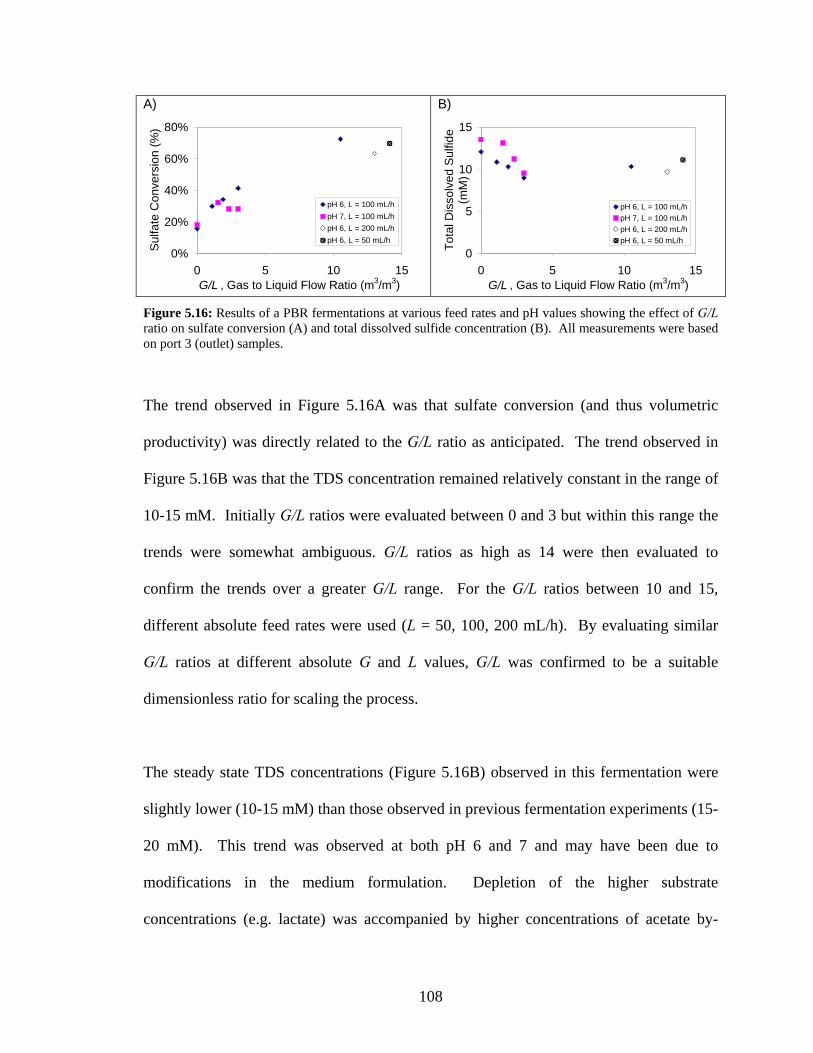
108
A)
0%
20%
40%
60%
80%
0 5 10 15G/L , Gas to Liquid Flow Ratio (m3/m3)
Sul
fate
Con
vers
ion
(%)
pH 6, L = 100 mL/hpH 7, L = 100 mL/hpH 6, L = 200 mL/hpH 6, L = 50 mL/h
B)
0
5
10
15
0 5 10 15G/L , Gas to Liquid Flow Ratio (m3/m3)
Tota
l Dis
solv
ed S
ulfid
e (m
M)
pH 6, L = 100 mL/hpH 7, L = 100 mL/hpH 6, L = 200 mL/hpH 6, L = 50 mL/h
Figure 5.16: Results of a PBR fermentations at various feed rates and pH values showing the effect of G/L ratio on sulfate conversion (A) and total dissolved sulfide concentration (B). All measurements were based on port 3 (outlet) samples.
The trend observed in Figure 5.16A was that sulfate conversion (and thus volumetric
productivity) was directly related to the G/L ratio as anticipated. The trend observed in
Figure 5.16B was that the TDS concentration remained relatively constant in the range of
10-15 mM. Initially G/L ratios were evaluated between 0 and 3 but within this range the
trends were somewhat ambiguous. G/L ratios as high as 14 were then evaluated to
confirm the trends over a greater G/L range. For the G/L ratios between 10 and 15,
different absolute feed rates were used (L = 50, 100, 200 mL/h). By evaluating similar
G/L ratios at different absolute G and L values, G/L was confirmed to be a suitable
dimensionless ratio for scaling the process.
The steady state TDS concentrations (Figure 5.16B) observed in this fermentation were
slightly lower (10-15 mM) than those observed in previous fermentation experiments (15-
20 mM). This trend was observed at both pH 6 and 7 and may have been due to
modifications in the medium formulation. Depletion of the higher substrate
concentrations (e.g. lactate) was accompanied by higher concentrations of acetate by-
109
product. Unlike the sulfide product that was being removed by the strip gas, the
dissolved acetate accumulated in the liquid phase. Acetate in its undissociated form
(acetic acid) is inhibitory to SRB (Reis et al., 1992) and may have had the net effect of
decreasing the SRB’s ability to cope with higher sulfide concentrations. Another factor
that may have decreased the SRB’s resistance to sulfide is the increased Na+ and K+
concentrations in the medium. Doubling the concentration of substrates (sodium lactate,
Na2SO4) and extensive use of potassium phosphate buffers may had contributed to salt
stress on the SRB. Lactate and sulfate substrates supplied 234 mM Na+ and the
phosphate buffer supplied at least 200 mM K+ (depending on the pH value being
buffered). Mukhopadhyay et al. (2006) reported significant inhibition effects of
Desulfovibrio vulgaris (Hildenborough) at Na+ and K+ concentrations greater than 250
mM. Mukhopadhyay et al. (2006) also reported prominent elongation of the cell
morphology under salt stress conditions. This phenomenon may explain the qualitative
observation (by phase contrast microscopy) of greater numbers of elongated cells in
samples taken from the bioreactor. Salt tolerance varies among SRB species however
and since the composition of the consortium was unknown, it is difficult to gauge the full
effect of salt stress on overall bioreactor performance. It is possible that acetate and salt
stress both played a role in decreasing the SRB’s sulfide resistance. Despite the small
decrease in the steady-state TDS range, the bioreactor’s ability to sustain TDS
concentrations at stripping rates 14 times the liquid feed demonstrates the system
robustness and potential for operation at higher rates.
According to previous simulation calculations, conversion at pH 6 should have been

110
higher than at pH 7. Experimentally this relationship was not clearly observed (Figure
5.16). The conversion trends at pH 7 could be interpreted as either being equal to or less
than those at pH 6. The similarity in conversion may have been due to the pH shifts
which had the net result of producing smaller differences in effluent pH (e.g. 6.57 v.
7.23) than desired. Despite these results, even if conversion (i.e. volumetric productivity)
was independent between pH 6 and 7, there would still be a significant advantage to
operating at pH 6 with regard to sulfide product recovery. As previously discussed, the
lower pH values shift the dissolved sulfide equilibrium towards H2S(aq) allowing for
higher H2S(g) partial pressures. This was confirmed experimentally. The average H2S
composition of the strip gas was 5.8 mol % at initial pH 6 compared to 3.6 mol % at
initial pH 7.
The PBR experiments with stripping were conducted by running the bioreactor
continuously for a period of approximately 100 d at feed rates between 20 and 200 mL/h
and strip gas rates as high as 43.5 mL/min (G/L = 13 m3/m3). During the course of the
fermentation visible accumulation of black biomass was observed along the bioreactor.
The black biofilm was thickest at the reactor inlet and decreased along the bioreactor
length. With such a large biomass accumulation and high gas strip rates there were
concerns of biofilm shearing, increased backpressure due to clogging, and decreased
biofilm-liquid mass transfer due to gas hold-up. Fortunately none of these issues was
apparent during the course of the experiment, indicating the system had good long-term
stability and the potential to operate at more aggressive flow conditions. The only
notable problem with long-term operation was the inability to measure suspended

111
biomass concentrations. The usual method of obtaining liquid samples by syringe
resulted in perturbation of the thick biofilm layers and contamination of the translucent
colloidal suspended cell sample with thick, black, viscous biofilm.
The highest observed rate of volumetric sulfide production during the stripping
fermentation experiments was 261 mol/m3.d and occurred at the highest feed rate (L =
200 mL/h) and a G/L ratio of 13. Table 5.9 summarizes the operating conditions for the
highest volumetric productivities (based on port 3 conditions) for the first, second, and
fourth PBR fermentations. By doubling the feed concentration and using a strip gas to
remove the sulfide product, higher conversions were achieved than previously possible.
Had all the sulfide in the fourth fermentation remained in solution, the TDS concentration
would have been 33 mM, well beyond the inhibitory range. The volumetric productivity
attained in the fourth fermentation was nearly identical to values obtained in earlier
fermentations but at a liquid feed rate of 200 mL/h rather than 500-640 mL/h. Operating
at lower feed rates is desirable to minimize fluid shear and sloughing of the immobilized
biomass.
Table 5.9: Summary of highest volumetric productivities (based on total reactor volume and port 3 outlet concentrations) from separate fermentations in this study. The volumetric productivity for the fourth fermentation accounts for both dissolved and gas phase sulfide product streams.
PBR Fermentation
L (mL/h)
G (mL/min)
G/L (m3/m3)
H2S in Strip Gas
(mol %)
Port 3 TDS Conc. (mM)
Port 3 Vol. Prod.
(mol/m3d.) #1 640 - - - 10.3 257 #2 500 - - - 12.9 252 #4 200 43.5 13 4.5 9.7 261
The G/L dimensionless ratio had been shown to be a suitable basis for scaling the process
and if the conditions at a G/L = 13 were scaled to a liquid feed of 640 mL/h, the resulting
112
productivity would be 835 mol/m3.d. This value represents a 20 % increase over the
highest volumetric productivity reported literature (Stucki et al., 1993). This was not
attempted experimentally due to logistical limitations but all previous experience in this
study suggested that such a scale-up was feasible.
In summary, PBR fermentation experiments were conducted using an N2 strip gas for in
situ removal of the sulfide product. The removal of the inhibitory product allowed for
higher conversions and volumetric productivities to be achieved at lower feed rates than
previously possible. Operating at the lower end of the biologically acceptable pH range
(~6), increased the stripping effectiveness and the H2S composition of the strip gas. Long
term, stable operation of the bioreactor at various G/L ratios suggests that further
improvements in volumetric productivity are attainable with appropriate scale-up.

113
Chapter 6: Sulfide Product Recovery Considerations
6.1 H2S and CO2 Partitioning Simulation
The experimental portion of this study has shown that an N2 strip gas is capable of
recovering the dissolved sulfide product from the liquid to gas phase. Concomitant
biological production of sulfide and carbonate species results in a strip gas containing N2,
H2S, and CO2. As a downstream gas separation unit operation will be necessary to purify
the H2S, it is desirable to have an estimate of the possible strip gas compositions over a
range of temperature and pH values. An equilibrium closed system model was developed
(Figure 6.1) to estimate gas phase composition by taking into account dissolved phase
ionization and vapour-liquid equilibria relationships. The closed system was assumed to
contain a fixed 100 mL liquid volume and a fixed 100 mL gas volume composed initially
of N2 at 1 atm. It was assumed that the N2 was insoluble in solution. 20 mM of total
sulfide species was assumed to be present with the stoichiometric amount of total
carbonate species (40 mM). A closed system model was required to calculate the
partitioning of species between fixed volume gas and liquid phases. The closed system
model is considered an approximation of behaviour within an open bioreactor system
with stripping occurring at equilibrium conditions. Equations describing the vapour-
liquid equilibria and dissolved phase ionization equilibria within the range of typical
operating conditions (T = 10-50 oC, pH = 6-8) formed the basis of the steady-state model
as described below.
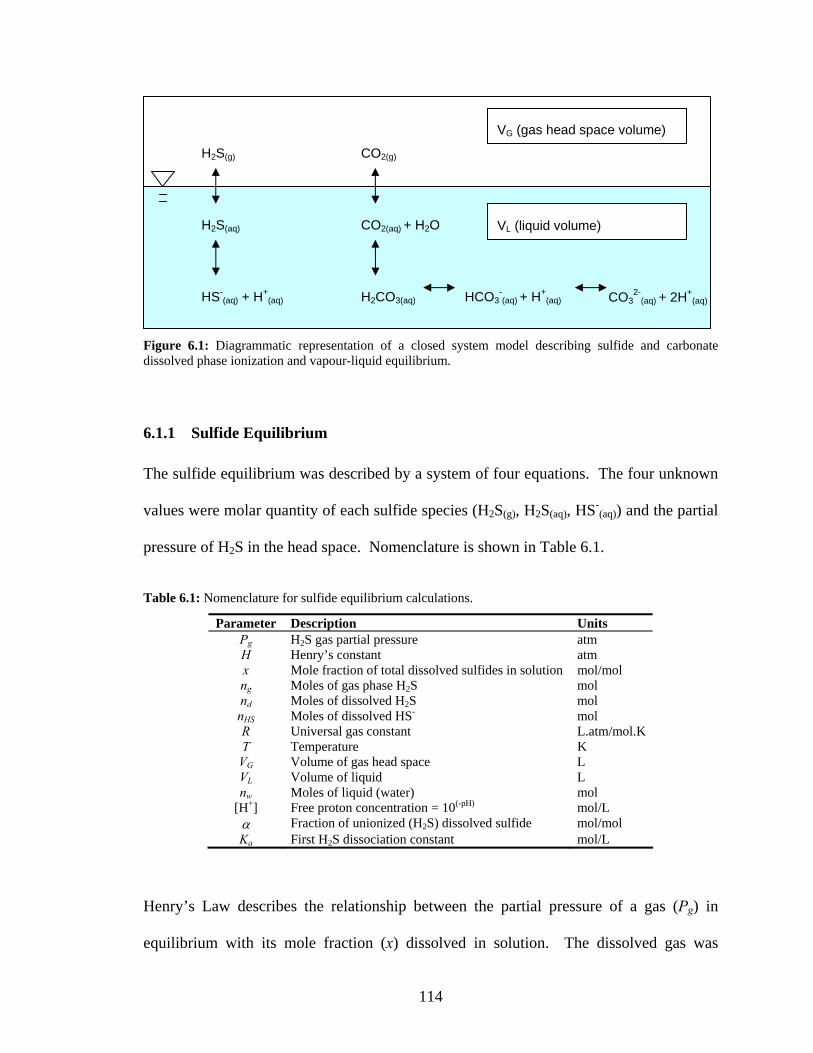
114
Figure 6.1: Diagrammatic representation of a closed system model describing sulfide and carbonate dissolved phase ionization and vapour-liquid equilibrium.
6.1.1 Sulfide Equilibrium
The sulfide equilibrium was described by a system of four equations. The four unknown
values were molar quantity of each sulfide species (H2S(g), H2S(aq), HS-(aq)) and the partial
pressure of H2S in the head space. Nomenclature is shown in Table 6.1.
Table 6.1: Nomenclature for sulfide equilibrium calculations.
Parameter Description Units Pg H2S gas partial pressure atm H Henry’s constant atm x Mole fraction of total dissolved sulfides in solution mol/mol ng Moles of gas phase H2S mol nd Moles of dissolved H2S mol nHS Moles of dissolved HS- mol R Universal gas constant L.atm/mol.K T Temperature K
VG Volume of gas head space L VL Volume of liquid L nw Moles of liquid (water) mol
[H+] Free proton concentration = 10(-pH) mol/L α Fraction of unionized (H2S) dissolved sulfide mol/mol Ka First H2S dissociation constant mol/L
Henry’s Law describes the relationship between the partial pressure of a gas (Pg) in
equilibrium with its mole fraction (x) dissolved in solution. The dissolved gas was
H2S(aq)
HS-(aq) + H+
(aq)
H2S(g)
CO2(aq) + H2O
H2CO3(aq)
CO2(g)
HCO3-(aq) + H+
(aq)
VG (gas head space volume)
VL (liquid volume)
CO32-
(aq) + 2H+(aq)
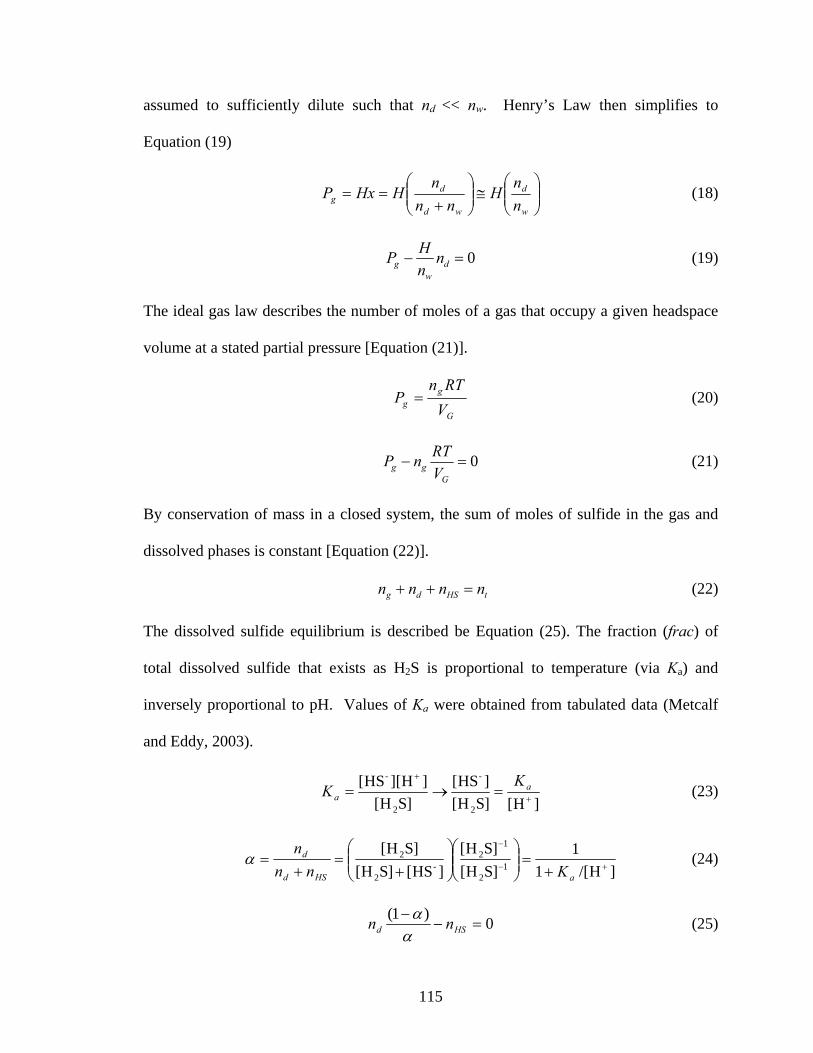
115
assumed to sufficiently dilute such that nd << nw. Henry’s Law then simplifies to
Equation (19)
⎟⎟⎠
⎞⎜⎜⎝
⎛≅⎟⎟
⎠
⎞⎜⎜⎝
⎛+
==w
d
wd
dg n
nH
nnn
HHxP (18)
0=− dw
g nnHP (19)
The ideal gas law describes the number of moles of a gas that occupy a given headspace
volume at a stated partial pressure [Equation (21)].
G
gg V
RTnP = (20)
0=−G
gg VRTnP (21)
By conservation of mass in a closed system, the sum of moles of sulfide in the gas and
dissolved phases is constant [Equation (22)].
tHSdg nnnn =++ (22)
The dissolved sulfide equilibrium is described be Equation (25). The fraction (frac) of
total dissolved sulfide that exists as H2S is proportional to temperature (via Ka) and
inversely proportional to pH. Values of Ka were obtained from tabulated data (Metcalf
and Eddy, 2003).
]H[]SH[
]HS[]SH[
]H][HS[
2
-
2
-
+
+
=→= aa
KK (23)
]H/[1
1]SH[]SH[
]HS[]SH[]SH[
12
12
-2
2+−
−
+=⎟⎟
⎠
⎞⎜⎜⎝
⎛⎟⎟⎠
⎞⎜⎜⎝
⎛+
=+
=aHSd
d
Knnn
α (24)
0)1(=−
−HSd nn
αα (25)
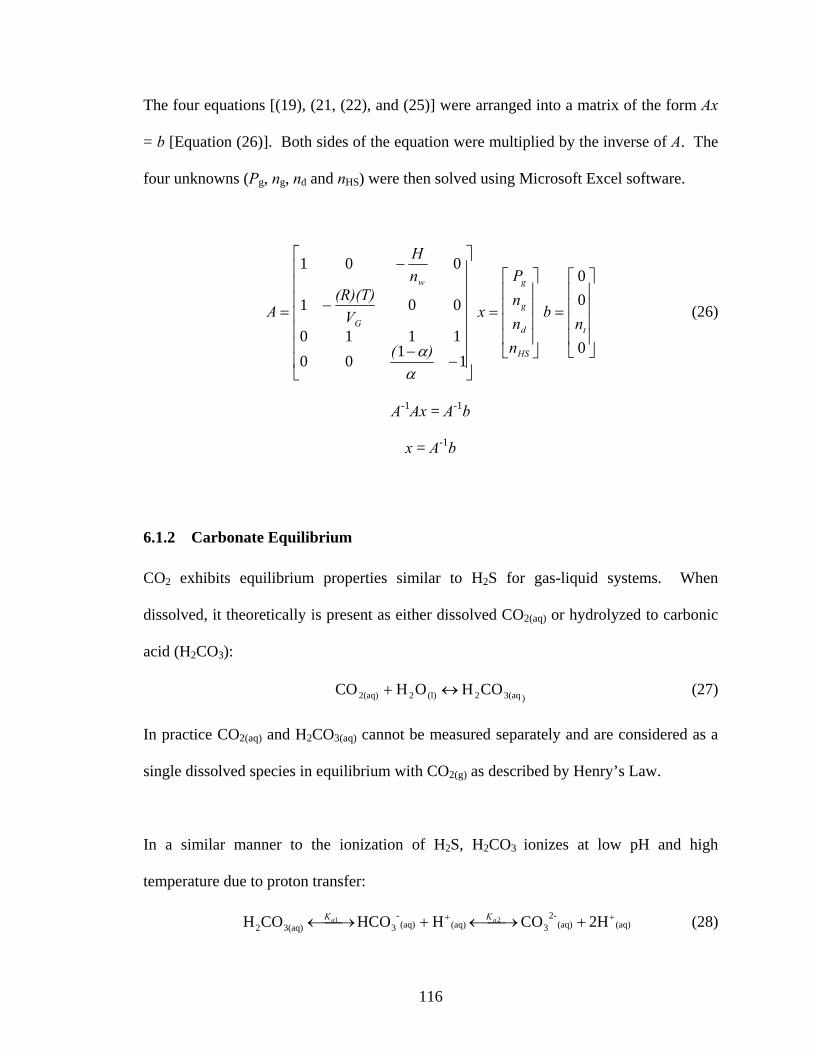
116
The four equations [(19), (21, (22), and (25)] were arranged into a matrix of the form Ax
= b [Equation (26)]. Both sides of the equation were multiplied by the inverse of A. The
four unknowns (Pg, ng, nd and nHS) were then solved using Microsoft Excel software.
⎥⎥⎥⎥⎥⎥⎥
⎦
⎤
⎢⎢⎢⎢⎢⎢⎢
⎣
⎡
−−
−
−
=
11001110
001
001
αα)(
V(R)(T)
nH
AG
w
⎥⎥⎥⎥
⎦
⎤
⎢⎢⎢⎢
⎣
⎡
=
HS
d
g
g
nnnP
x
⎥⎥⎥⎥
⎦
⎤
⎢⎢⎢⎢
⎣
⎡
=
0
00
tnb (26)
A-1Ax = A-1b
x = A-1b
6.1.2 Carbonate Equilibrium
CO2 exhibits equilibrium properties similar to H2S for gas-liquid systems. When
dissolved, it theoretically is present as either dissolved CO2(aq) or hydrolyzed to carbonic
acid (H2CO3):
)3(aq2(l)22(aq) COH OH CO ↔+ (27)
In practice CO2(aq) and H2CO3(aq) cannot be measured separately and are considered as a
single dissolved species in equilibrium with CO2(g) as described by Henry’s Law.
In a similar manner to the ionization of H2S, H2CO3 ionizes at low pH and high
temperature due to proton transfer:
(aq)(aq)-2
3(aq)(aq)-
33(aq)2 2H CO H HCO COH 21 ++ +⎯⎯→←+⎯⎯→← aa KK (28)
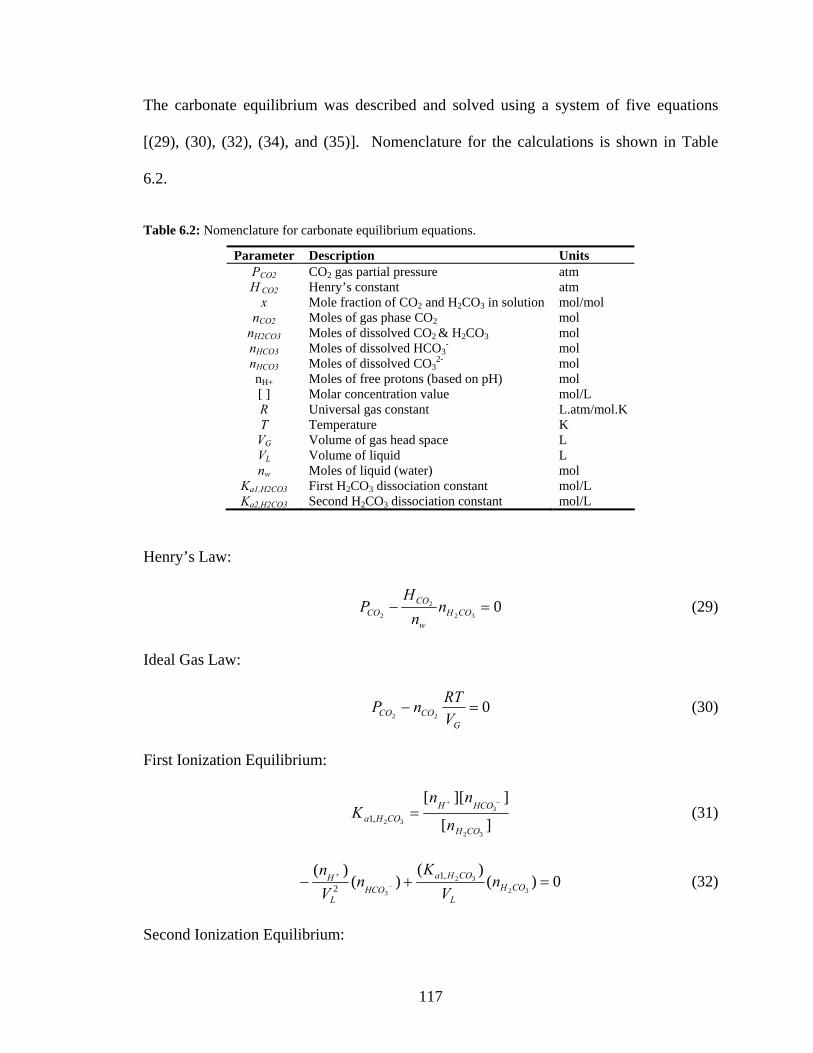
117
The carbonate equilibrium was described and solved using a system of five equations
[(29), (30), (32), (34), and (35)]. Nomenclature for the calculations is shown in Table
6.2.
Table 6.2: Nomenclature for carbonate equilibrium equations.
Parameter Description Units PCO2 CO2 gas partial pressure atm H CO2 Henry’s constant atm
x Mole fraction of CO2 and H2CO3 in solution mol/mol nCO2 Moles of gas phase CO2 mol
nH2CO3 Moles of dissolved CO2 & H2CO3 mol nHCO3 Moles of dissolved HCO3
- mol nHCO3 Moles of dissolved CO3
2- mol nH+ Moles of free protons (based on pH) mol [ ] Molar concentration value mol/L R Universal gas constant L.atm/mol.K T Temperature K
VG Volume of gas head space L VL Volume of liquid L nw Moles of liquid (water) mol
Ka1,H2CO3 First H2CO3 dissociation constant mol/L Ka2,H2CO3 Second H2CO3 dissociation constant mol/L
Henry’s Law:
032
2
2=− COH
w
COCO n
nH
P (29)
Ideal Gas Law:
022
=−G
COCO VRTnP (30)
First Ionization Equilibrium:
][
]][[
32
3
32,1COH
HCOHCOHa n
nnK
−+
= (31)
0)()(
)()(
32
32
3
,12 =+− −
+
COHL
COHaHCO
L
H nV
Kn
Vn
(32)
Second Ionization Equilibrium:
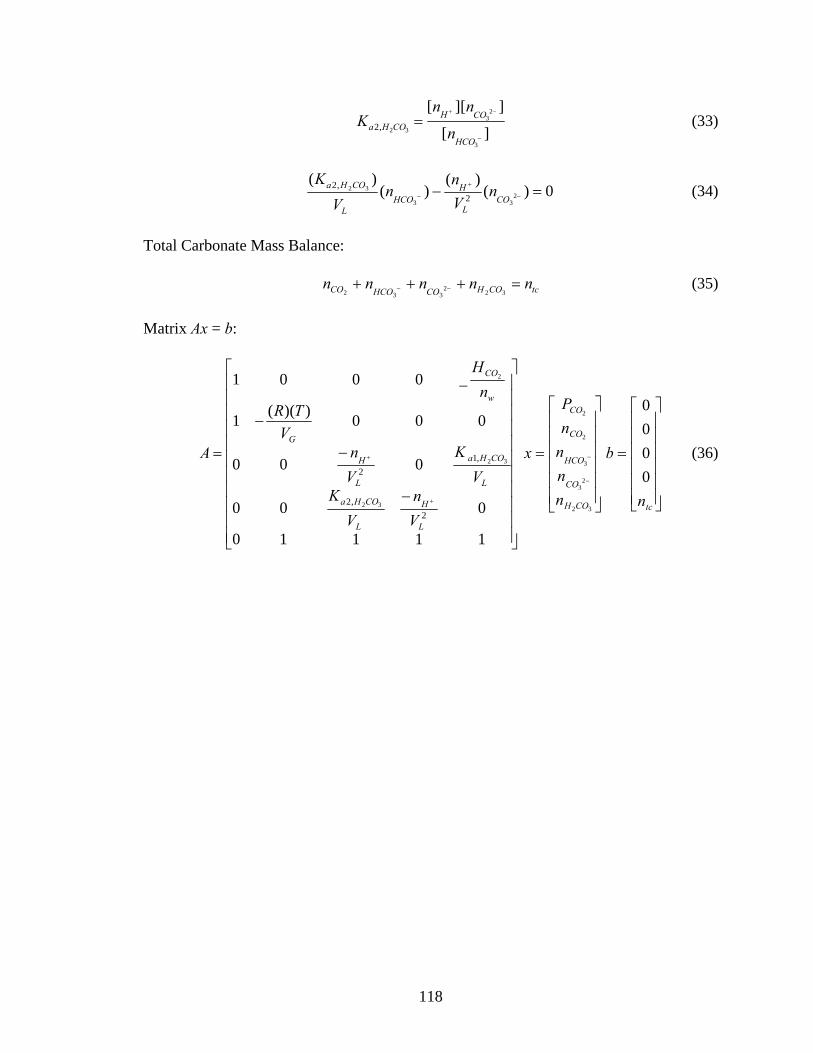
118
][
]][[
3
23
32,2−
−+
=HCO
COHCOHa n
nnK (33)
0)()(
)()(
233
32
2,2 =− −
+
− COL
HHCO
L
COHa nVn
nV
K (34)
Total Carbonate Mass Balance:
tcCOHCOHCOCO nnnnn =+++ −− 322332
(35)
Matrix Ax = b:
⎥⎥⎥⎥⎥⎥⎥⎥⎥⎥⎥
⎦
⎤
⎢⎢⎢⎢⎢⎢⎢⎢⎢⎢⎢
⎣
⎡
−
−
−
=
+
+
11110
000
000
000))((1
_0001
2,2
,12
32
32
2
L
H
L
COHa
L
COHa
L
H
G
w
CO
Vn
VK
VK
Vn
VTR
nH
A
⎥⎥⎥⎥⎥⎥
⎦
⎤
⎢⎢⎢⎢⎢⎢
⎣
⎡
=
−
−
32
23
3
2
2
COH
CO
HCO
CO
CO
nnnnP
x
⎥⎥⎥⎥⎥⎥
⎦
⎤
⎢⎢⎢⎢⎢⎢
⎣
⎡
=
tcn
b0000
(36)
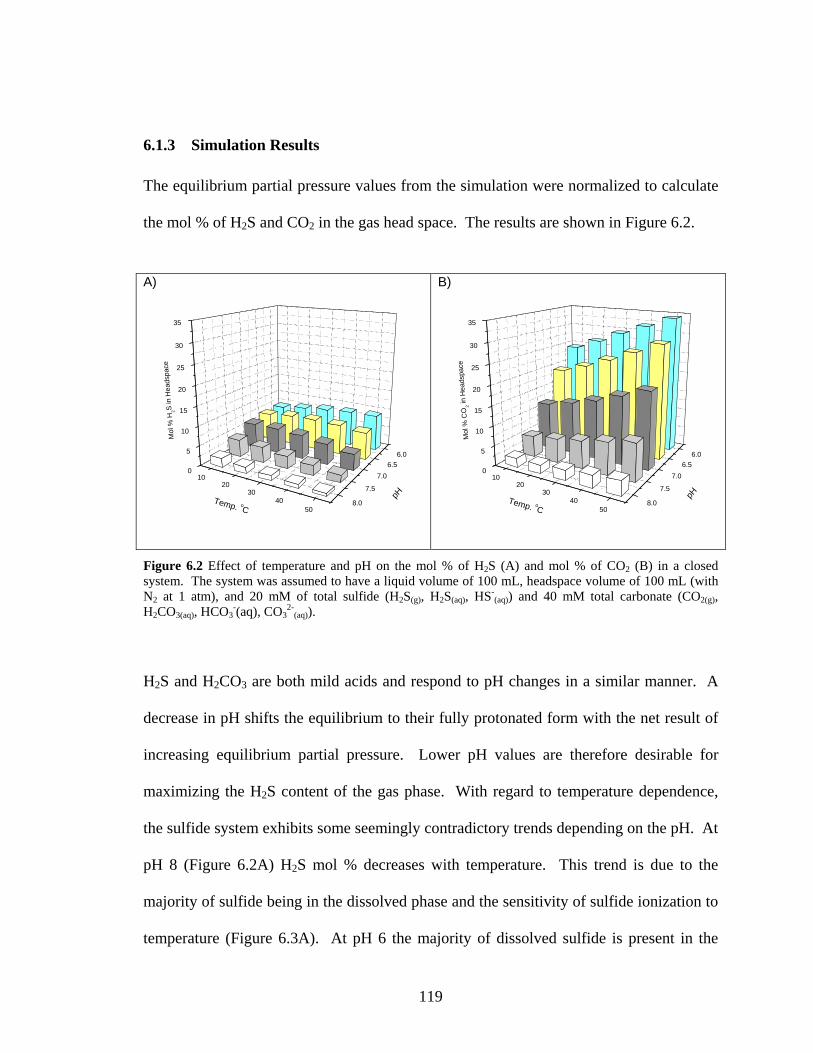
119
6.1.3 Simulation Results
The equilibrium partial pressure values from the simulation were normalized to calculate
the mol % of H2S and CO2 in the gas head space. The results are shown in Figure 6.2.
A)
1020
3040
50
0
5
10
15
20
25
30
35
8.0
7.5
7.06.5
6.0
Mol
% H
2S in
Hea
dspa
ce
pHTemp. oC
B)
1020
3040
50
0
5
10
15
20
25
30
35
8.0
7.5
7.06.5
6.0M
ol %
CO
2 in H
eads
pace
pHTemp. oC
Figure 6.2 Effect of temperature and pH on the mol % of H2S (A) and mol % of CO2 (B) in a closed system. The system was assumed to have a liquid volume of 100 mL, headspace volume of 100 mL (with N2 at 1 atm), and 20 mM of total sulfide (H2S(g), H2S(aq), HS-
(aq)) and 40 mM total carbonate (CO2(g), H2CO3(aq), HCO3
-(aq), CO32-
(aq)).
H2S and H2CO3 are both mild acids and respond to pH changes in a similar manner. A
decrease in pH shifts the equilibrium to their fully protonated form with the net result of
increasing equilibrium partial pressure. Lower pH values are therefore desirable for
maximizing the H2S content of the gas phase. With regard to temperature dependence,
the sulfide system exhibits some seemingly contradictory trends depending on the pH. At
pH 8 (Figure 6.2A) H2S mol % decreases with temperature. This trend is due to the
majority of sulfide being in the dissolved phase and the sensitivity of sulfide ionization to
temperature (Figure 6.3A). At pH 6 the majority of dissolved sulfide is present in the
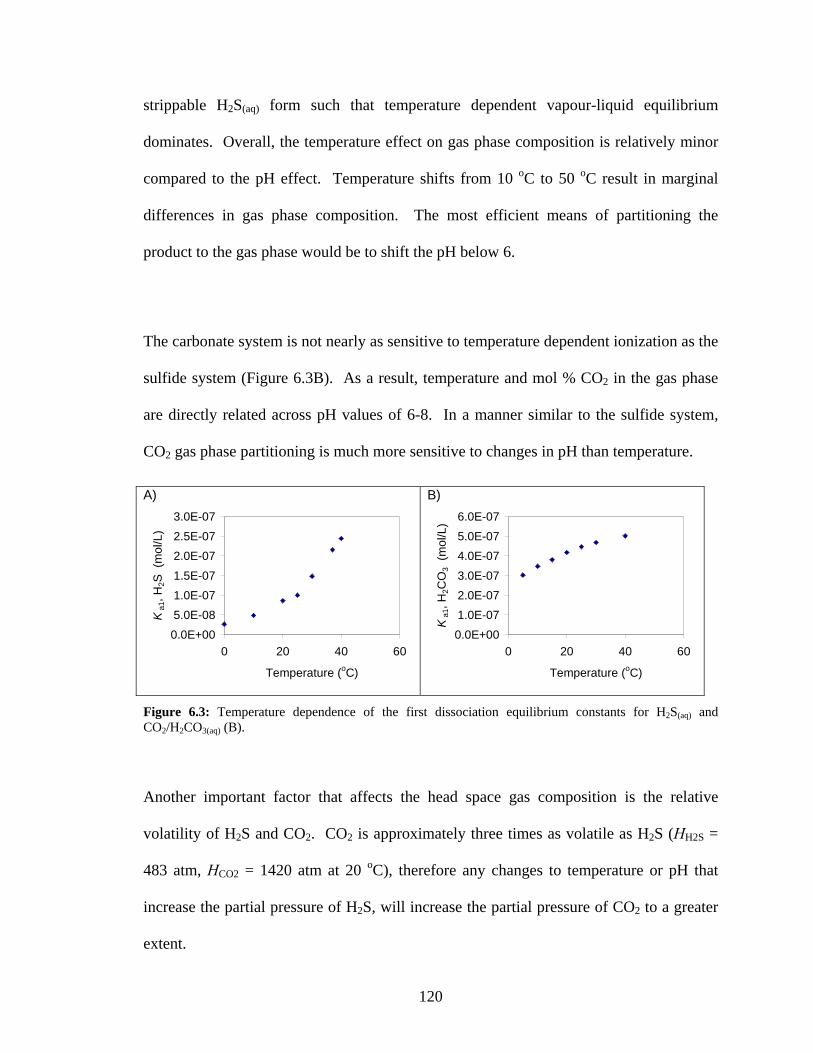
120
strippable H2S(aq) form such that temperature dependent vapour-liquid equilibrium
dominates. Overall, the temperature effect on gas phase composition is relatively minor
compared to the pH effect. Temperature shifts from 10 oC to 50 oC result in marginal
differences in gas phase composition. The most efficient means of partitioning the
product to the gas phase would be to shift the pH below 6.
The carbonate system is not nearly as sensitive to temperature dependent ionization as the
sulfide system (Figure 6.3B). As a result, temperature and mol % CO2 in the gas phase
are directly related across pH values of 6-8. In a manner similar to the sulfide system,
CO2 gas phase partitioning is much more sensitive to changes in pH than temperature.
A)
0.0E+005.0E-081.0E-071.5E-07
2.0E-072.5E-073.0E-07
0 20 40 60
Temperature (oC)
Ka1
, H2S
(m
ol/L
)
B)
0.0E+001.0E-072.0E-073.0E-07
4.0E-075.0E-076.0E-07
0 20 40 60
Temperature (oC)
Ka1
, H2C
O3
(mol
/L)
Figure 6.3: Temperature dependence of the first dissociation equilibrium constants for H2S(aq) and CO2/H2CO3(aq) (B).
Another important factor that affects the head space gas composition is the relative
volatility of H2S and CO2. CO2 is approximately three times as volatile as H2S (HH2S =
483 atm, HCO2 = 1420 atm at 20 oC), therefore any changes to temperature or pH that
increase the partial pressure of H2S, will increase the partial pressure of CO2 to a greater
extent.

121
In summary, a model was developed to provide estimations of the strip gas composition
under varying pH and temperature conditions. Due to dissolved phase molecule
ionization and vapour-liquid equilibrium effects, the highest partial pressures and mol %
of H2S and CO2 in nitrogen strip gas are obtained at pH values less than 6 and at elevated
temperatures. For a bioreactor system with an N2 strip gas operating at biologically
relevant conditions (pH = 6; T = 37 oC, total sulfides = 20 mM) the strip gas will have an
approximate composition of 9 mol % H2S, 31 mol % CO2, and 60 mol % N2. These
values are consistent with the experimental trends of this study and those reported in the
literature for an acidified stripping column that recovered biologically produced sulfide
(Stucki et al., 1993).

122
6.2 Downstream Sulfide Product Recovery
Regardless of whether in situ stripping is applied, the bioreactor liquid effluent will
contain a significant concentration of total dissolved sulfide (in the range of 10-20 mM).
It is desirable to recover these dissolved sulfides in a downstream stripping process to
maximize the H2 yield of the overall process. The following section outlines the initial
design considerations for such a unit operation.
6.2.1 Design Equations and Mass Balance
A counter-current stripping column is the most appropriate unit operation for downstream
sulfide recovery. Counter-current design maximizes both the amount of sulfide
recovered and the concentration of H2S in the exiting strip gas. The overall mass balance
on a stripping column can be described by the following general word statement:
Moles of solute entering in liquid
stream +
Moles of solute entering in gas
stream =
Moles of solute leaving in liquid
stream +
Moles of solute leaving in gas
stream
The stripping column mass balance is illustrated in Figure 6.4. Individual analysis of the
internal column stage equilibria can be accomplished by more advanced methods but
present calculations will be limited to an overall mass balance (nomenclature described in
Table 6.3).
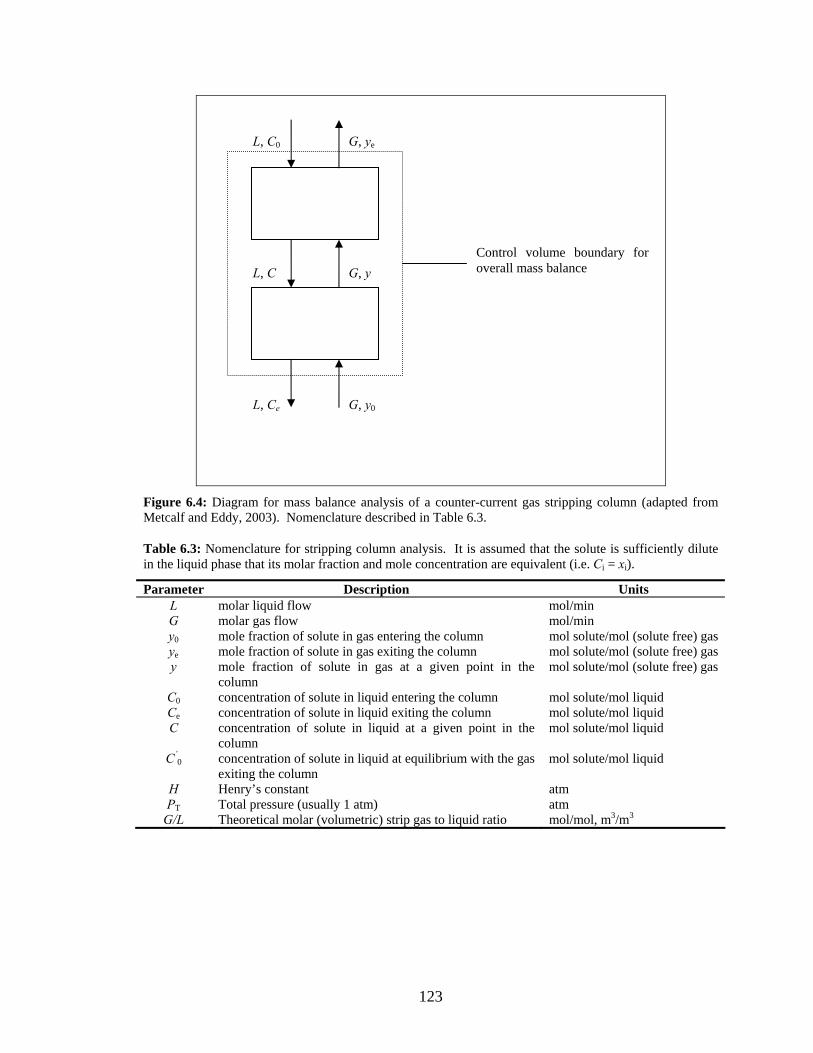
123
Figure 6.4: Diagram for mass balance analysis of a counter-current gas stripping column (adapted from Metcalf and Eddy, 2003). Nomenclature described in Table 6.3.
Table 6.3: Nomenclature for stripping column analysis. It is assumed that the solute is sufficiently dilute in the liquid phase that its molar fraction and mole concentration are equivalent (i.e. Ci = xi).
Parameter Description Units L molar liquid flow mol/min G molar gas flow mol/min y0 mole fraction of solute in gas entering the column mol solute/mol (solute free) gas ye mole fraction of solute in gas exiting the column mol solute/mol (solute free) gas y mole fraction of solute in gas at a given point in the
column mol solute/mol (solute free) gas
C0 concentration of solute in liquid entering the column mol solute/mol liquid Ce concentration of solute in liquid exiting the column mol solute/mol liquid C concentration of solute in liquid at a given point in the
column mol solute/mol liquid
C’0 concentration of solute in liquid at equilibrium with the gas
exiting the column mol solute/mol liquid
H Henry’s constant atm PT Total pressure (usually 1 atm) atm
G/L Theoretical molar (volumetric) strip gas to liquid ratio mol/mol, m3/m3
L, C0
L, C
L, Ce
G, ye
G, y
G, y0
Control volume boundary for overall mass balance

124
The overall solute mass balance is written as:
ee GyLCGyLC +=+ 00 (37)
Combining terms the mass balance is re-written as:
( ) ( )00 CCGLyy ee −=− (38)
Assuming the strip gas entering the column contains no solute (y0 = 0) the mass balance
becomes:
( )ee CCGLy −= 0 (39)
The exit gas mole fraction (ye) can also be described by Henry’s law:
'0C
PHy
Te = (40)
Substituting Henry’s Law (40) into Equation (39) and isolating for C’0:
( )eT CC
HP
GLC −= 0
'0 (41)
Assuming that the concentration of solute in the liquid entering the column (C0) is
equilibrium with the exiting gas (i.e. C’0 = C0), Equation (41) becomes:
( )
0
0
CCC
HP
LG eT −
= (42)
Where G/L is the theoretical molar ratio of strip gas to liquid required for operation at
assumed values of C0, Ce, ye, and y0 at equilibrium. In practice, 1.5 to 3 times the
theoretical value of G/L is applied in stripping column design (Metcalf and Eddy, 2003).

125
6.2.2 Gas to Liquid (G/L) Requirements for Dissolved Sulfide Recovery
6.2.2.1 Use of Fresh N2 Strip Gas
Figure 6.5 shows the results of calculations to estimate the G/L ratios required to strip a
bioreactor effluent containing 20 mM of dissolved sulfides. It was assumed that the pH
of effluent was lowered sufficiently (pH < 5.0) such that all of the dissolved sulfides were
in the strippable H2S(aq) form and that sulfide ionization due to temperature effects was
negligible. It was also assumed that N2 was insoluble in liquid and contained no H2S
before entering the stripping column (y0 = 0). G/L requirements were evaluated at 20 oC
(293 K) and 37 oC (310 K).
0.0
0.5
1.0
1.5
2.0
2.5
3.0
0% 20% 40% 60% 80% 100%% Sulfide Removal from Liquid Stream
G/L
, Gas
to L
iqui
d Fl
ow R
atio
(m3 /m
3 )
293 K310 K
Figure 6.5: Gas to liquid ratios (G/L, m3/m3) required to remove varying % dissolved sulfide from a liquid stream (20 mM) at 20 oC (293 K) and 37 oC (310 K). It was assumed that the pH was sufficiently low (pH < 5.0) that all of the dissolved sulfides were in the strippable H2S(aq) form and that temperature dependent ionization was negligible.
Due to the temperature dependence of Henry’s constant, the solute is more readily

126
stripped at higher temperatures resulting in lower G/L ratios to remove equal amounts of
sulfide. Operating at elevated temperature also has the benefit of producing a strip gas
with a higher partial pressure of H2S. For conditions evaluated in Figure 6.5 the
equilibrium partial pressure of H2S in the exiting strip gas is 0.17 atm (at 20 oC/293 K)
and 0.25 atm (at 37 oC/310 K).
6.2.2.2 Use of Bioreactor Strip Gas
The gas fed to the downstream stripping column need not be H2S free and may be
substituted with the gas from in situ bioreactor stripping. Assuming that the bioreactor
effluent pH is decreased before being sent to the stripping column, the bioreactor gas
should be suitable for use downstream column use (Figure 6.6). Figure 6.7 shows the
G/L ratios required to strip 100 % of the dissolved sulfides from a 20 mM liquid stream
as a function of initial H2S partial pressure in the strip gas. G/L requirements were
evaluated at 20 oC (293 K) and 37 oC (310 K).
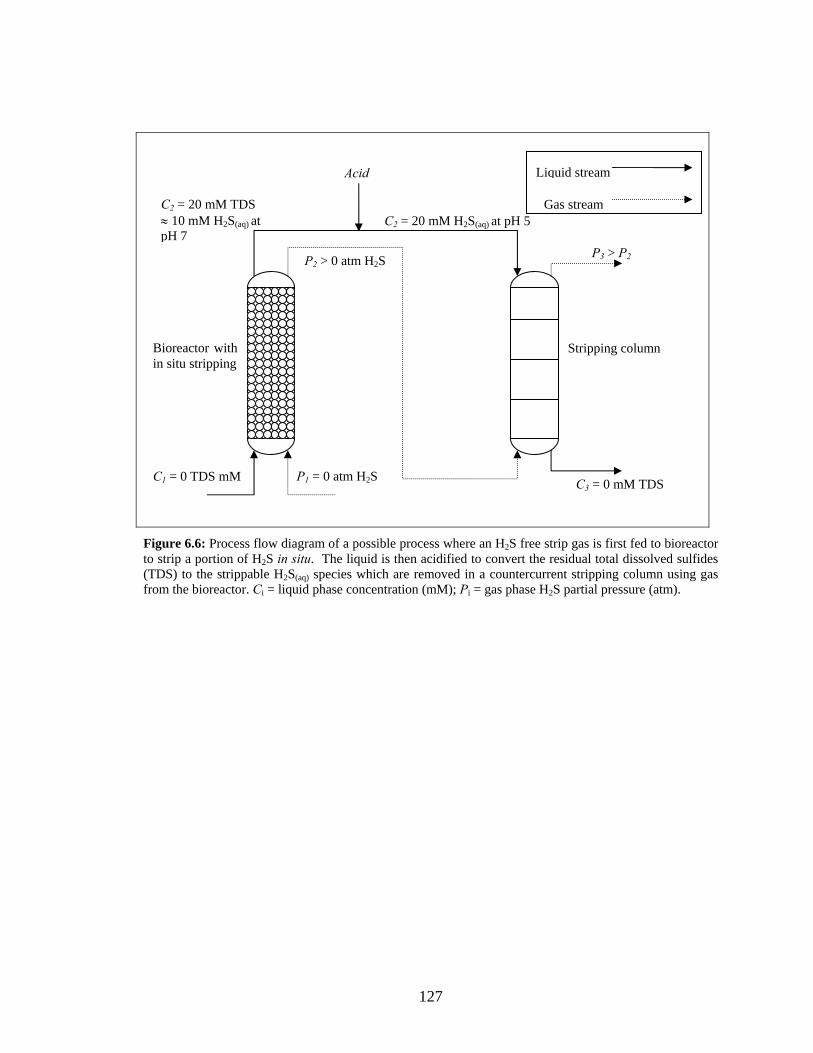
127
Figure 6.6: Process flow diagram of a possible process where an H2S free strip gas is first fed to bioreactor to strip a portion of H2S in situ. The liquid is then acidified to convert the residual total dissolved sulfides (TDS) to the strippable H2S(aq) species which are removed in a countercurrent stripping column using gas from the bioreactor. Ci = liquid phase concentration (mM); Pi = gas phase H2S partial pressure (atm).
Bioreactor with in situ stripping
Stripping column
P1 = 0 atm H2S C1 = 0 TDS mM
C2 = 20 mM TDS ≈ 10 mM H2S(aq) at pH 7
C2 = 20 mM H2S(aq) at pH 5
P2 > 0 atm H2S P3 > P2
Acid
C3 = 0 mM TDS
Liquid stream
Gas stream

128
1
10
100
1000
0 0.05 0.1 0.15 0.2 0.25 0.3H2S Partial Pressure of Entering Strip Gas (atm)
G/L
, Gas
to L
iqui
d Fl
ow R
atio
(m3 /m
3 )
G/L at 293 KExit H2S Partial Pressure at 293 KG/L at 310 KExit H2S Partial Pressure at 310 K
Figure 6.7: Gas to liquid (G/L, m3/m3) ratios required to remove 100% dissolved sulfide from a liquid stream (20 mM) using strip gases of varying initial H2S partial pressures (atm). G/L values were evaluated at 20 oC (293 K) and 37 oC (310 K). The equilibrium H2S partial pressure in the exiting gas (Pe = P3) is 0.17 atm at 293 K (vertical dotted line) and 0.25 atm at 310 K (vertical dotted-dashed line). It was assumed that the pH was sufficiently low (pH < 5.0) that all of the dissolved sulfides were in the strippable H2S(aq) form and that temperature dependent ionization was negligible. H2S partial pressure of entering strip gas will likely be in the range of 0.04-0.21 atm.
Figure 6.7 shows that if the initial partial pressure of H2S increases, greater G/L ratios are
required to remove the same amount of dissolved sulfide. When the inlet H2S partial
pressure equals the equilibrium H2S partial pressure at the top of the column, G/L
requirements rise to infinity as there is no longer a concentration difference to serve as a
stripping driving force. Again there are advantages associated with operating at elevated
temperatures due to the higher equilibrium partial pressures. This is illustrated in Figure
6.7 where a strip gas entering with a H2S partial pressure of 0.17 cannot remove any
dissolved sulfides (G/L → ∞) at 20 oC (293 K), but requires only a G/L ratio of 6.2 to
remove 100 % of the dissolved sulfides at 37 oC (310 K).
129
The calculations shown (Figure 6.5 and Figure 6.7) have not considered the simultaneous
stripping of CO2 from the liquid stream which would result in a reduction of the mole
fraction of H2S in the product stream (i.e. yH2S < 0.17-0.25). This is due to gas partial
pressures being independent of the presence of other gases whereas gas mole fractions are
not.
The G/L values required for complete sulfide recovery under the given conditions when
practical design considerations are applied (G/L = 3-9) are within the same range as those
applied experimentally in situ to the bioreactor. Use of the strip gas from the bioreactor
(expected to have H2S partial pressures between 0.04-0.21 atm) will result in only
moderate increases in G/L values (G/L = 12-36) assuming the stripping column is
operated at elevated temperatures (T = 37 oC/310 K). The required G/L ratios are
consistent with experimental values reported by Stucki et al. (1993) for recovery of
biogenic sulfide in a stripping column operated at similar conditions. These G/L ratios are
relatively low compared to the requirements for other common wastewater applications
such as ammonia stripping. G/L ratios for ammonia removal from wastewater are often
in the order of 103 (Metcalf and Eddy, 2003).
Complete stripping column design requires the selection of an appropriate packing
material to allow for calculation of the corresponding column height, cross sectional area,
pressure drop, and other design parameters. These initial calculations have shown that
dissolved sulfide can be recovered using reasonable volumes of stripping gas (either fresh
or from the bioreactor) and that more detailed calculations would be an important part of

130
future work regarding this key product recovery unit operation.

131
Chapter 7: Conclusions
This study has developed a sulfate reducing packed bed bioreactor as part of a multi-step
process to convert organic waste to H2. Key findings with respect to carrier material
selection, inoculum composition, and operating protocols have advanced the current
state-of-the-art for sulfate reducing bioreactor technology and set the standard for
attainable volumetric productivity as high as 830 mol/m3.d. Experimental and theoretical
gas stripping work has highlighted the challenges associated with the recovery of the
soluble sulfide product. Although further work is required to develop the overall H2
production process, many of this study’s conclusions are relevant to existing sulfate
reducing bioreactor applications.
Results from this study have demonstrated the largely unrecognized importance of critical
inoculum design for improving the performance of sulfate reducing bioreactors. The
standard method of suspended growth serial transfers enriched for a kinetically
favourable SRB consortium with a specific sulfate reduction rate of 1.2 g SO42-/g CDW.h
that was nearly double that of the benchmark species. Unfortunately the consortium
exhibited negligible immobilization potential. Desulfovibrio desulfuricans (ATCC 7757)
was the benchmark species and despite its slower kinetics, it was capable of visible
biofilm formation and had superior immobilization potential. By combining these two
microbial systems, a mixed inoculum was designed that exploited the advantages of the
individual cell lines. Celite™ R-635 diatomaceous earth pellets were shown, for the first
time, to be a suitable carrier material for SRB and outperformed other known SRB carrier
132
materials such as Poraver™ porous glass beads and polyurethane foam.
Using an inoculum with an initial composition of 96 % Desulfovibrio desulfuricans and 4
% consortium, a Celite™ R-635 filled PBR was able to achieve a volumetric sulfide
production rate of 493 mol/m3.d (HRT = 38 min; D = 1.6 h-1) after only 8 d of operation.
This represents an order of magnitude decrease in start-up time compared to other PBR
studies that achieved similar volumetric rates after approximately 100 d with more
elaborate bioreactor systems involving recycle loops and online pH control (Stucki et al.,
1993; Selvaraj et al., 1997). Baskaran and Nemati (2006) employed a single-pass, sand
filled PBR system similar to this study’s but was only able to obtain a volumetric sulfate
reduction rate of 57 mol/m3.d after 100 d of operation. The relatively poor performance
of the similar system was likely due to the poor immobilization potential of the SRB
consortium that was employed.
The bioreactor exhibited continuous stable operation for extended experimental periods
(100 d) with steady-state effluent TDS concentrations were in the range of 15-20 mM.
These values were consistent with the recent literature that reported maximum TDS
concentrations of 16 mM from Poraver™ filled PBRs supplied lactate (Alvarez et al.,
2006) and organic waste (Alvarez et al., 2007). Partial biofilm detachment during a 24 h
shutdown period was attributed to a combination of sulfide inhibition and substrate
limitation. The bioreactor’s ability to recover from the adverse shutdown conditions in
only 48 h was attributed to the rapid kinetics and excellent immobilization potential
imparted by the initial inoculum and the effectiveness of Celite™ R-635 as a carrier

133
material.
Implementing an N2 strip gas in the bioreactor was an effective method of increasing the
sulfate conversion and recovering the sulfide product in the gas phase. Feed substrate
concentrations were doubled to exploit the bioreactor’s increased operating capacity and
sulfate conversions as high as 33 mM were achieved while maintaining sub-inhibitory
concentrations of TDS (< 20 mM). The net result was attainment of volumetric
productivities at liquid feed rates lower than previously possible which allows for more
quiescent hydrodynamic conditions and decreased sloughing. Similar values of the G/L
ratio were evaluated at different absolute feed rates and G/L was shown to be an
appropriate design parameter for process scale-up. From the various experimental
conditions evaluated, a volumetric productivity of at least 830 mol/m3.d was considered
easily attainable but not attempted due to practical limitations of the current bench-scale
bioreactor setup.
Decreasing the pH of the liquid feed was effective in partitioning greater fractions of the
sulfide product to the gas phase. By lowering the initial pH from a value of 7 to 6, the
H2S composition of the strip gas was observed to increase from 3.6 mol % to 5.8 mol %.
An undesirable effect of decreasing the pH is an associated increase in the CO2 content of
the strip gas. A simple mathematical model that incorporated ionization and vapour-
liquid equilibria indicated that under ideal conditions, a strip gas composition of
approximately 9 mol % H2S, 31 mol % CO2, and 60 mol % N2 can be obtained from a
bioreactor producing a pH 6 effluent with 20 mM TDS.

134
Due to the nature of co-current bioreactor stripping, the effluent is expected to contain
15-20 mM of TDS. The residual dissolved sulfides can be recovered if the effluent is
acidified to below pH 5.0 and fed to the top of a counter-current abiotic stripping column.
Model results indicated that a G/L ratio of around 2.0 is required for 100 % sulfide
recovery with a fresh N2 strip gas. A G/L ratio of around 12.0 is required if the bioreactor
strip gas is used, assuming its feed H2S partial pressure is below 0.21 atm.
The biological methanogenic and sulfate reducing processes were evaluated and found to
be similar with regard to current bioreactor technology performance. The methods
developed in this preliminary study to enhance bioreactor performance suggest that
sulfate reducing bioreactor technology is capable of considerably outpacing its
methanogenic counterpart with regard to volumetric productivity. More detailed
comparisons of the thermochemical conversion processes to H2 are required to determine
the feasibility of the overall process. The potential for large improvements in sulfate
reducing bioreactor technology is a key contributing factor to the competitiveness of the
H2S based process. Finally, the insights from this study will find immediate application
in improving existing SRB bioreactor technology for the bioremediation of acid mine
drainage, destruction of xenobiotics, and the treatment of sulfate-laden waste streams.
135
Chapter 8: Future Work
Due to the preliminary nature of the current study, several areas of investigation remain
open for further exploration. These include the use of complex organic substrates and the
integration of an SO2 gas stream. Modification of the carrier material, addition of growth
factors to the liquid feed, and further characterization and refinement of the SRB
inoculum are also recommended to further enhance bioreactor performance.
Several potential sources of organic waste were listed in the literature review (Table 2.5)
but a more thorough examination of the literature and possible experimental work is
required to identify a feedstock that exhibits the optimal balance of degradable COD,
cost, and availability. Fermentative heterotrophs will be required to breakdown the
complex substrate to lactate and other substrates suitable for SRB. The fermentative
bacteria can be co-cultured with the SRB (Selvaraj et al., 1997) but there may be
advantages to operating a separate upstream bioreactor dedicated to hydrolysis and
fermentation. The upstream bioreactor could utilize an alumina ceramic carrier material
which immobilizes hydrolytic and fermentative bacteria preferentially over SRB (Silva et
al., 2006). Concerns regarding sulfide inhibition of the fermentative process would also
be eliminated.
Due to the metabolism of the incompletely oxidizing SRB, the effluent from the sulfate
reducing bioreactor will contain considerable concentrations of acetate. Mineralization of
the residual acetate to H2S and CO2 can be accomplished in additional downstream

136
bioreactors seeded with acetotrophic SRB as described by Deswaef et al. (1996). If
organic waste is completely degraded to H2S and CO2 then the theoretical feedstock
requirements will be 48 g COD/mol SO2 or 64 g COD/mol SO42-.
Ideally the SO2 stream can be blended with the N2 bioreactor strip gas so that it dissolves
gradually along the length of the column. SO2 is 1000x more soluble than N2 in aqueous
solution and it may be possible to design the SO2/N2 ratio in a manner that 100 % of the
SO2 transfers to solution before the strip gas exits the bioreactor. This method of SO2
delivery avoids inhibition concerns due to high sulfite concentrations and provides a
degree of pH moderation. Protons for sulfide hydrolysis to H2S are provided by
sulfurous acid (H2SO3) rather than an alkalinity generating reaction. Additional methods
of pH control may also be required if sufficiently high conversions are obtained.
Immediate improvements in bioreactor volumetric productivity can be obtained by using
previously tested G/L ratios but increasing the absolute feed rate values. This is a
relatively simple matter of laboratory logistics (e.g. increasing the medium reservoir
volume, upgrading pump capacity, etc.). More fundamental improvements to bioreactor
design may be accomplished by further refining the inoculum composition and reducing
the size of the Celite™ R-635 pellets to provide increased surface area. Molecular
methods can be applied to track changes in microbial population during the course of
bioreactor operation. Identification of the kinetically superior SRB species will allow for
the development of a defined consortium that can be distributed and reproduced with
consistent results. The effect of cofactors such as Ni2+ should be investigated as a

137
method of improving biofilm adhesion as proposed by Lopes et al. (2006). If the
kinetically superior SRB species could be induced to form biofilms, it would reduce the
need for Desulfovibrio desulfuricans but more importantly would allow for the selective
induction of replication and biofilm growth modes. This would serve as valuable tool for
rapid bioreactor start-up and recovery from shutdown periods.

138
Chapter 9: References
Alvarez MT, Crespo C, Mattiasson B. Precipitation of Zn(II), Cu(II) and Pb(II) at bench-scale using biogenic hydrogen sulfide from the utilization of volatile fatty acids. Chemosphere. 2007; 66(9): 1677-83.
Alvarez MT, Pozzo T, Mattiasson B. Enhancement of sulphide production in anaerobic packed bed bench-scale biofilm reactors by sulphate reducing bacteria. Biotechnology Letters. 2006; 28(3): 175-81.
Ammary BY. Treatment of olive mill wastewater using an anaerobic sequencing batch reactor. Desalination. 2005; 177(1-3): 157-65.
Andersson J, Björnsson L. Evaluation of straw as a biofilm carrier in the methanogenic stage of two-stage anaerobic digestion of crop residues. Bioresource Technology. 2002; 85(1): 51-6.
Angenent LT, Karim K, Al-Dahhan MH, Wrenn BA, Domiguez-Espinosa R. Production of bioenergy and biochemicals from industrial and agricultural wastewater. Trends in Biotechnology. 2004; 22(9): 477-85.
Annachhatre AP, Suktrakoolvait S. Biological sulfate reduction using molasses as a carbon source. Water Environment Research. 2001; 73(1): 118-26.
Azabou S, Mechichi T, Sayadi S. Zinc precipitation by heavy-metal tolerant sulfate-reducing bacteria enriched on phosphogypsum as a sulfate source. Minerals Engineering. 2007; 20(2): 173-8.
Azabou S, Mechichi T, Sayadi S. Sulfate reduction from phosphogypsum using a mixed culture of sulfate-reducing bacteria. International Biodeterioration & Biodegradation. 2005; 56(4): 236-42.
Baskaran V, Nemati M. Anaerobic reduction of sulfate in immobilized cell bioreactors, using a microbial culture originated from an oil reservoir. Biochemical Engineering Journal. 2006; 31(2): 148-59.
Battaglia-Brunet F, Foucher S, Denamur A, Ignatiadis I, Michel C, Morin DE. Reduction
139
of chromate by fixed films of sulfate-reducing bacteria using hydrogen as an electron source. Journal of Industrial Microbiology and Biotechnology. 2002; 28(3): 154-9.
Bertin L, Berselli S, Fava F, Petrangeli-Papini M, Marchetti L. Anaerobic digestion of olive mill wastewaters in biofilm reactors packed with granular activated carbon and "Manville" silica beads. Water Research. 2004; 38(14-15): 3167-78.
Beyenal H, Lewandowski Z. Dynamics of lead immobilization in sulfate reducing biofilms. Water Research. 2004; 38(11): 2726-36.
Boopathy R, Kulpa CF, Manning J. Anaerobic biodegradation of explosives and related compounds by sulfate-reducing and methanogenic bacteria: a review. Bioresource Technology. 1998; 63(1): 81-9.
Borja R, Banks CJ, Zhengjian W. Effect of organic loading rate on anaerobic treatment of slaughterhouse wastewater in a fluidised-bed reactor. Bioresource Technology. 1995; 52(2): 157-62.
Borja R, Gonzalez E, Raposo F, Millan F, Martin A. Performance evaluation of a mesophilic anaerobic fluidized-bed reactor treating wastewater derived from the production of proteins from extracted sunflower flour. Bioresource Technology. 2001; 76(1): 45-52.
Boshoff G, Duncan J, Rose PD. Tannery effluent as a carbon source for biological sulphate reduction. Water Research. 2004a; 38(11): 2651-8.
Boshoff G, Duncan J, Rose PD. The use of micro-algal biomass as a carbon source for biological sulphate reducing systems. Water Research. 2004b; 38(11): 2659-66.
Cadavid DL, Zaiat M, Foresti E. Performance of horizontal-flow anaerobic immobilized sludge (HAIS) reactor treating synthetic substrate subjected to decreasing COD to sulfate ratios. Water Science and Technology. 1999; 39(10-11): 99-106.
Calli B, Mertoglu B, Roest K, Inanc B. Comparison of long-term performances and final microbial compositions of anaerobic reactors treating landfill leachate. Bioresource Technology. 2006; 97(4): 641-7.
Cattony EBM, Chinalia FA, Ribeiro R, Zaiat M, Foresti E, Varesche MBA. Ethanol and toluene removal in a horizontal-flow anaerobic immobilized biomass reactor in the

140
presence of sulfate. Biotechnology and Bioengineering. 2005; 91(2): 244-53.
Chang BV, Shiung LC, Yuan SY. Anaerobic biodegradation of polycyclic aromatic hydrocarbon in soil. Chemosphere. 2002; 48(7): 717-24.
Chang IS, Shin PK, Kim BH. Biological treatment of acid mine drainage under sulphate-reducing conditions with solid waste materials as substrate. Water Research. 2000; 34(4): 1269-77.
Chauhan A, Ogram A. Evaluation of support matrices for immobilization of anaerobic consortia for efficient carbon cycling in waste regeneration. Biochemical and Biophysical research communications. 2005; 327(3): 884-93.
Chen CI, Taylor RT. Thermophilic biodegradation of BTEX by two consortia of anaerobic bacteria. Applied Microbiology and Biotechnology. 1997; 48(1): 121-8.
Chen C, Mueller RF, Griebe T. Kinetic analysis of microbial sulfate reduction by Desulfovibrio desulfuricans in an anaerobic upflow porous media biofilm reactor. Biotechnology and Bioengineering. 1994; 43(4): 267-74.
Christensen B, Laake M, Lien T. Treatment of acid mine water by sulfate-reducing bacteria; results from a bench scale experiment. Water Research. 1996; 30(7): 1617-24.
Christy BCP. Effect of hydraulic retention time and attachment media on sulfide production by sulfate reducing bacteria (MASc thesis). University of Windsor. 2001.
Coetser S, Pulles W, Heath R, Cloete TE-. Chemical characterisation of organic electron donors for sulfate reduction for potential use in acid mine drainage treatment. Biodegradation. 2006.
Cohen RRH. Use of microbes for cost reduction of metal removal from metals and mining industry waste streams. Journal of Cleaner Production. 2006; 14(12-13): 1146-57.
Colleran E, Finnegan S, Lens PE-. Anaerobic treatment of sulphate-containing waste streams. Antonie van Leeuwenhoek. 1995; 67(1): 29-46.
Cord-Ruwisch R. A quick method for the determination of dissolved and precipitated sulfides in cultures of sulfate-reducing bacteria. Journal of Microbiological Methods. 1985; 4(1): 33-6.

141
Costerton JW, Lewandowski Z, Caldwell DE, Korber DR, Lappin-Scott HM. Microbial biofilms. Annual Review of Microbiology. 1995; 49: 711-45.
Costerton WJ, Wilson M. Introducing biofilms. Biofilms. 2004; 1(1): 1-4.
D'Alessandro PL, Characklis WG, Kessick MA, Ward CH. Developments in industrial microbiology. Washington, DC: American Institute of Biological Sciences; 1974.
Daugulis AJ, Krug TA, Choma CET. Filament formation and ethanol production by Zymomoas mobilis in adsorbed cell bioreactors. Biotechnology and Bioengineering. 1985; 27: 626-31.
Daugulis AJ, Swaine DE. Examination of substrate and product inhibition kinetics on the production of ethanol by suspended and immobilized cell reactors. Biotechnology and Bioengineering. 1987; 24: 639-45.
de Ory I, Romero LE, Cantero D. Optimization of immobilization conditions for vinegar production. Siran, wood chips and polyurethane foam as carriers for Acetobacter aceti. Process Biochemistry. 2004; 39(5): 547-55.
de Smul. A combined biotechnological and physico-chemical process for the desulfurization of waste waters (PhD thesis). University of Ghent. 1998.
de Smul A, Goethals L, Verstraete W. Effect of COD to sulphate ratio and temperature in expanded-granular-sludge-blanket reactors for sulphate reduction. Process Biochemistry. 1999; 34(4): 407-16.
del Pozo R, Diez V, Beltrán S. Anaerobic pre-treatment of slaughterhouse wastewater using fixed-film reactors. Bioresource Technology. 2000; 71(2): 143-9.
Deswaef S, Salmon T, Hiligsmann S, Taillieu X, Milande N, Thonart P, et al. Treatment of gypsum waste in a two stage anaerobic reactor. Water Science and Technology. 1996; 34(5-6): 367-74.
Dries J, De Smul A, Goethals L, Grootaerd H, Verstraete W. High rate biological treatment of sulfate-rich wastewater in an acetate-fed EGSB. Biodegradation. 1998; 9(2): 103-11.
du Preez LA, Maree JP. Pilot-scale biological sulphate and nitrate removal utilizing
142
producer gas as energy source. Water Science and Technology. 1994; 30(12): 275-85.
Durham DR, Marshall LC, Miller JG, Chmurny AB. Characterization of inorganic biocarriers that moderate system upsets during fixed-film biotreatment processes. Applied Environmental Microbiology. 1994; 60(9): 3329-35.
Dutta S, Chowdhury R, Bhattacharya P. Stability and response of bioreactor: An analysis with reference to microbial reduction of SO2. Chemical Engineering Journal. 2007; 133(1-3): 343-54.
Fedorovich V, Greben M, Kalyuzhnyi S, Lens P, Hulshoff Pol L. Use of hydrophobic membranes to supply hydrogen to sulphate reducing bioreactors. Biodegradation. 2000; 11(5): 295-303.
Foucher S, Battaglia-Brunet F, Ignatiadis I, Morin D. Treatment by sulfate-reducing bacteria of Chessy acid-mine drainage and metals recovery. Chemical Engineering Science. 2001; 56(4): 1639-45.
Fukui M, Takii S. Kinetics of sulfate respiration by free-living and particle-associated sulfate-reducing bacteria. FEMS Microbiology Ecology. 1994; 13(4): 241-7.
Gibert O, de Pablo J, Cortina JL, Ayora C. Municipal compost-based mixture for acid mine drainage bioremediation: Metal retention mechanisms. Applied Geochemistry. 2005; 20(9): 1648-57.
Gibert O, de Pablo J, Luis Cortina J, Ayora C. Chemical characterisation of natural organic substrates for biological mitigation of acid mine drainage. Water Research. 2004; 38(19): 4186-96.
Glombitza F. Treatment of acid lignite mine flooding water by means of microbial sulfate reduction. Waste Management. 2001; 21(2): 197-203.
Grover R, Marwaha SS, Kennedy JF. Studies on the use of an anaerobic baffled reactor for the continuous anaerobic digestion of pulp and paper mill black liquors. Process Biochemistry. 1999; 34(6-7): 653-7.
Hammack RW, Edenborn HM, Dvorak DH. Treatment of water from an open pit copper mine using biogenic sulfide and limestone: a feasibilty study. Water Resources. 1994; 28: 2321-9.
143
Han S, Kim S, Shin H. UASB treatment of wastewater with VFA and alcohol generated during hydrogen fermentation of food waste. Process Biochemistry. 2005; 40(8): 2897-905.
Hao JH, Chen JM, Huang L, Buglass RL. Sulfate-reducing bacteria. Critical Reviews in Environmental Science and Technology. 1996; 26(1): 155-87.
Harendranath CS, Anuja K, Singh A, Gunaseelan A, Satish K, Lala K. Immobilization in fixed film reactors: An ultrastructural approach. Water Science and Technology. 1996; 33(8): 7-15.
Haridas A, Suresh S, Chitra KR, Manilal VB. The Buoyant Filter Bioreactor: a high-rate anaerobic reactor for complex wastewater--process dynamics with dairy effluent. Water Research. 2005; 39(6): 993-1004.
Hauser JY, Holder GA. Iron availability in mixed cultures of sulfate-reducing bacteria. Biotechnology and Bioengineering. 1986; 28(1): 101-6.
Held C, Wellacher M, Robra K, Gubitz GM. Two-stage anaerobic fermentation of organic waste in CSTR and UFAF-reactors. Bioresource technology. 2002; 81(1): 19-24.
Henry JG, Prasad D. Anaerobic treatment of landfill leachate by sulfate reduction. Water Science and Technology. 2000; 41(3): 239-46.
Hiligsmann S, Deswaef S, Taillieu X, Crine M, Milande N, Thonart P. Production of sulfur from gypsum as an industrial byproduct. Applied Biochemistry and Biotechnology. 1996; 57/58: 959-969.
Hofvendahl K, Hahn-Hagerdal B. Factors affecting the fermentative lactic acid production from renewable resources. Enzyme and Microbial Technology. 2000; 26(2-4): 87-107.
Hulshoff Pol LW. New developments in reactor and process technology for sulfate reduction. Water science and technology. 2001; 44(8): 67.
Huysman P, Van Meenen P, Van Assche P, Verstraete W. Factors affecting the colonization o fnon porous and porous packing material in model upflow methane reactors. Biotechnology Letters. 1983; 5(9): 643-8.
144
Icgen B, Harrison S. Exposure to sulfide causes populations shifts in sulfate-reducing consortia. Research in Microbiology. 2006; 157(8): 784-91.
Ince O, Ince K, Donnelly T. Attachment, strength and performance of a porous media in an upflow anaerobic filter treating dairy wastewater. Water Science and Technology. 2000; 41(4-5): 261-70.
Jong T, Parry DL. Removal of sulfate and heavy metals by sulfate reducing bacteria in short-term bench scale upflow anaerobic packed bed reactor runs. Water Research. 2003; 37(14): 3379-89.
Joo-Hwa T, S. J, Kuan-Yeow S. Performance of anaerobic packed-bed system with different media characteristics. Water Science and Technology. 1996; 34(5-6): 453-9.
Kaksonen AH, Plumb JJ, Robertson WJ, Riekkola-Vanhanen M, Franzmann PD, Puhakka JA. The performance, kinetics and microbiology of sulfidogenic fluidized-bed treatment of acidic metal- and sulfate-containing wastewater. Hydrometallurgy. 2006; 83(1-4): 204-13.
Kaksonen AH, Riekkola-Vanhanen M-, Puhakka JA. Optimization of metal sulphide precipitation in fluidized-bed treatment of acidic wastewater. Water Research. 2003a; 37(2): 255-66.
Kaksonen AH, Franzmann PD, Puhakka JA. Effects of hydraulic retention time and sulfide toxicity on ethanol and acetate oxidation in sulfate-reducing metal-precipitating fluidized-bed reactor. Biotechnology and Bioengineering. 2004; 86(3): 332-43.
Kaksonen AH, Franzmann PD, Puhakka JA. Performance and ethanol oxidation kinetics of a sulfate-reducing fluidized-bed reactor treating acidic metal-containing wastewater. Biodegradation. 2003b; 14(3): 207-17.
Kaksonen AH, Plumb JJ, Franzmann PD, Puhakka JA. Simple organic electron donors support diverse sulfate-reducing communities in fluidized-bed reactors treating acidic metal- and sulfate-containing wastewater. FEMS Microbiology Ecology. 2004; 47(3): 279-89.
Kapdan IK, Kargi F. Bio-hydrogen production from waste materials. Enzyme and Microbial Technology. 2006; 38(5): 569-82.

145
Kim HW, Han SK, Shin HS. Simultaneous treatment of sewage sludge and food waste by the unified high-rate anaerobic digestion system. Water Science and Technology. 2006; 53(6): 29-35.
Kim J, Oh K, Lee S, Kim S, Hong S. Biodegradation of phenol and chlorophenols with defined mixed culture in shake-flasks and a packed bed reactor. Process Biochemistry. 2002; 37(12): 1367-73.
Koku H, Eroglu I, Gunduz U, Yucel M, Turker L. Aspects of the metabolism of hydrogen production by Rhodobacter sphaeroides. International Journal of Hydrogen Energy. 2002; 27: 1315-29.
Kolmert A, Henrysson T, Hallberg R, Mattiasson B. Optimization of sulphide production in an anaerobic continuous biofilm process with sulphate reducing bacteria. Biotechnology Letters. 1997; 19(10): 971-5.
Kolmert A, Johnson DB. Remediation of acidic waste waters using immobilised, acidophilic, sulfate-reducing bacteria. Journal of Chemical Technology and Biotechnology. 2001; 76(8): 836-43.
Kolmert A, Wikstrom P, Hallberg KB. A fast and simple turbidimetric method for the determination of sulfate in sulfate-reducing bacterial cultures. Journal of Microbiological Methods. 2000; 41(3): 179-84.
Kondo T, Arakawa M, Waakayama T, Miyake J. Hydrogen production by combining two types of photosynthetic bacteria with different characteristics. International Journal of Hydrogen Energy. 2002; 27: 1303-8.
Konishi Y, Yoshida N, Asai S. Desorption of dydrogen sulfide duringbatch growth and the sulfate-reducing bacterium Desulfovibrio desulfuricans. Biotechnology Progress. 1996; 12(3): 322-30.
Krug TA, Daugulis AJ. Ethanol production using Zymomonas mobilis immobilized on an ion exchange resin. Biotechnology Letters (Historical Archive). 1983; 5(3): 159-64.
Kuo W, Shu T. Biological pre-treatment of wastewater containing sulfate using anaerobic immobilized cells. Journal of hazardous materials. 2004; 113(1-3): 147-55.
La H, Kim K, Quan Z, Cho Y, Lee SE-. Enhancement of sulfate reduction activity using

146
granular sludge in anaerobic treatment of acid mine drainage. Biotechnology Letters. 2003; 25(6): 503-8.
Lacayo M, van Bavel B, Mattiasson B. Degradation of toxaphene in water during anaerobic and aerobic conditions. Environmental Pollution. 2004; 130(3): 437-43.
Lee CM, Chen PC, Wang CC, Tung YC. Photohydrogen production using purple non-sulfur bacteria with hydrogen fermentation reactor effluent. International Journal of Hydrogen Energy. 2002; 1308(1314).
Lee AK, Buehler MG, Newman DK. Influence of a dual-species biofilm on the corrosion of mild steel. Corrosion Science. 2006; 48(1): 165-78.
Lefebvre O, Vasudevan N, Torrijos M, Thanasekaran K, Moletta R. Anaerobic digestion of tannery soak liquor with an aerobic post-treatment. Water Research. 2006; 40(7): 1492-500.
Lens P, Vallerol M, Esposito G, Zandvoort M. Perspectives of sulfate reducing bioreactors in environmental biotechnology. Reviews in Environmental Science and Biotechnology. 2002; 1(4): 311-25.
Lens PNL, Gastesi R, Lettinga G. Use of sulfate reducing cell suspension bioreactors for the treatment of SO2 rich flue gases. Biodegradation. 2003; 14(3): 229-40.
Liamleam W, Annachhatre AP. Electron donors for biological sulfate reduction. Biotechnology Advances. 2007; 25(5): 452-63.
Lin C, Jo C. Hydrogen production from sucrose using an anaerobic sequencing batch reactor process. Journal of Chemical Technology & Biotechnology. 2003; 78(6): 678-84.
Lopes FA, Morin P, Oliveira R, Melo LF. Interaction of Desulfovibrio desulfuricans biofilms with stainless steel surface and its impact on bacterial metabolism. Journal of Applied Microbiology. 2006; 101(5): 1087-95.
Lopes FA, Morin P, Oliveira R, Melo LF. The influence of nickel on the adhesion ability of Desulfovibrio desulfuricans. Colloids and Surfaces B: Biointerfaces. 2005; 46(2): 127-33.
Luinstra EA. Hydrogen from H2S: technologies and economics. Calgary, Alberta:
147
Sulfotech; 1995.
Luptakova A, Kusnierova M. Bioremediation of acid mine drainage contaminated by SRB. Hydrometallurgy. 2005; 77(1-2): 97-102.
Madigan MT, Martinko JM, Parker J editors. Brock biology ofmicroorganisms, 8th Ed. Upper Saddle River, NJ: Prentice Hall; 1997.
Maree JP, Strydom WF. Biological sulphate removal from industrial effluent in an upflow packed bed reactor. Water Resources. 1987; 21: 141-6.
Metcalf and Eddy Inc., Tchobanoglous G., Burton FL, Stensel HD editors. Wastewater engineering: treatment and reuse. New York, NY: McGraw Hill; 2003.
Moosa S, Nemati M, T. L. Harrison S. A kinetic study on anaerobic reduction of sulphate, part I: Effect of sulphate concentration. Chemical Engineering Science. 2002; 57(14): 2773-80.
Moosa S, Nemati M, Harrison STL. A kinetic study on anaerobic reduction of sulphate, part II: incorporation of temperature effects in the kinetic model. Chemical Engineering Science. 2005; 60(13): 3517-24.
Mukhopadhyay A, He Z, Alm EJ, Arkin AP, Baidoo EE, Borglin SC, et al. Salt stress in Desulfovibrio vulgaris Hildenborough: an integrated genomics approach. The Journal of Bacteriology. 2006; 188(11): 4068-78.
Muthumbi W, Boon N, Boterdaele R, De Vreese I, Top EM, Verstraete W. Microbial sulfate reduction with acetate: process performance and composition of the bacterial communities in the reactor at different salinity levels. Applied Microbiology and Biotechnology. 2001; 55(6): 787-93.
Nagpal S, Chuichulcherm S, Livingston A, Peeva L. Ethanol utilization by sulfate-reducing bacteria: An experimental and modeling study. Biotechnology and Bioengineering. 2000a; 70(5): 533-43.
Nagpal S, Chuichulcherm S, Peeva L, Livingston A. Microbial sulfate reduction in a liquid-solid fluidized bed reactor. Biotechnology and Bioengineering. 2000b; 70(4): 370-80.
148
Nanninga HJ, Gottschal JC. Properties of Desulfovibrio carbinolicus sp. nov. and other sulfate-reducing bacteria isolated from an anaerobic-purification plant. Applied and Environmental Microbiology. 1987; 53(4): 802-9.
Nath K, Das DE-. Improvement of fermentative hydrogen production: various approaches. Applied Microbiology and Biotechnology. 2004; 65(5): 520-9.
Nedwell DB, Reynolds PJ. Treatment of landfill leachate by methanogenic and sulphate-reducing digestion. Water research. 1996; 30(1): 21-8.
Ni M, Leung DYC, Leung MKH, Sumathy K. An overview of hydrogen production from biomass. Fuel Processing Technology. 2006; 87(5): 461-72.
O'Flaherty V. Microbial interactions during anaerobic treatment of sulphate-containing wastewaters (PhD thesis). National University of Ireland. 1997.
Ohkouchi Y, Inoue Y. Impact of chemical components of organic wastes on L(+)-lactic acid production. Bioresource Technology. 2007; 98(3): 546-53.
Okabe S, Characklis WG. Effects of temperature and phosphorus concentration on microbial sulfate reduction by Desulfovibrio desulfuricans. Biotechnology and Bioengineering. 1992; 39: 1031-42.
Okabe S, Neilson PH, Characklis WG. Factors affecting microbial sulfate reduction by Desulfovibrio desulfuricans in continuous culture: limiting nutrients and sulfide concentration. Biotechnology and Bioengineering. 1992; 40: 725-34.
Okabe S, Nielsen PH, Jones WL, Characklis WG. Sulfide product inhibition of Desulfovibrio desulfuricans in batch and continuous cultures. Water Research. 1995; 29(2): 571-8.
Oliveira SVWB, Moraes EM, Adorno MAT, Varesche MBA, Foresti E, Zaiat M. Formaldehyde degradation in an anaerobic packed-bed bioreactor. Water Research. 2004; 38(7): 1685-94.
Omil F, Lens P, Pol LWH, Lettinga G. Characterization of biomass from a sulfidogenic, volatile fatty acid-degrading granular sludge reactor. Enzyme and Microbial Technology. 1997; 20(3): 229-36.
149
Parawira W, Murto M, Zvauya R, Mattiasson B. Comparative performance of a UASB reactor and an anaerobic packed-bed reactor when treating potato waste leachate. Renewable Energy. 2006; 31(6): 893-903.
Patel H, Madamwar D. Effects of temperatures and organic loading rates on biomethanation of acidic petrochemical wastewater using an anaerobic upflow fixed-film reactor. Bioresource Technology. 2002; 82(1): 65-71.
Picanco AP, Vallero MVG, Gianotti EP, Zaiat M, Blundi CE. Influence of porosity and composition of supports on the methanogenic biofilm characteristics developed in a fixed bed anaerobic reactor. Water Science and Technology. 2001; 44(4): 197-204.
Postgate JR. The sulphate-reducing bacteria. London: Cambridge University Press; 1984.
Ohashi H, Ohya, H, Aihara, H. Hydrogen production from hydrogen sulfide using membrane reactor integrated with porous membranes having thermal and corrosion resistance. Journal of Membrane Science. 1998; 146: 39-42.
Quereshi N, Annous BA, Ezeji TC, Karcher P, Maddox IS. Biofilm reactors for industrial bioconversion processes: employing potential of enhanced reaction rates. 2005; 4(24): BioMed Online Journal.
Rabus R, Hansen T, Widdel F. Dissimilatory sulfate- and sulfur-reducing prokaryotes. 2000; Available at: http://141.150.157.117:8080/prokPUB/chaprender/jsp/showchap.jsp?chapnum=274&initsec=04_00. Accessed 08/01, 2005.
Ramasamy EV, Gajalakshmi S, Sanjeevi R, Jithesh MN, Abbasi SA. Feasibility studies on the treatment of dairy wastewaters with upflow anaerobic sludge blanket reactors. Bioresource Technology. 2004; 93(2): 209-12.
Reis MAM. Effect of hydrogen sulfide on growth of sulfate reducing bacteria. Biotechnology and bioengineering. 1992; 40(5): 593.
Reis MAM, Lemos PC, Almeida JS, Carrondo MJTE-. Evidence for the intrinsic toxicity of H2S to sulphate-reducing bacteria. Applied Microbiology and Biotechnology. 1991; 36(1): 145-7.
Ribeiro R, Varesche MBA, Foresti E, Zaiat M. Influence of the carbon source on the
150
anaerobic biomass adhesion on polyurethane foam matrices. Journal of Environmental Management. 2005; 74(2): 187-94.
Sa CSA, Boaventura RAR. Biodegradation of phenol by Pseudomonas putida DSM 548 in a trickling bed reactor. Biochemical Engineering Journal. 2001; 9(3): 211-9.
Sarner E. Removal of sulphate and sulphite in an anaerobic tricking (Antric) filter. Water Science and Technology. 1990; 22: 395-404.
Selvaraj PT, Little MH, Kaufman EN. Biodesulfurization of flue gases and other sulfate/sulfite waste streams using immobilized mixed sulfate-reducing bacteria. Biotechnology Progress. 1997; 13: 583-9.
Senthuran A, Senthuran V, Hatti-Kaul R, Mattiasson B. Lactic acid production by immobilized Lactobacillus casei in recycle batch reactor: a step towards optimization. Journal of Biotechnology. 1999; 73(1): 61-70.
Seth R, Goyal SK, Handa BK. Fixed film biomethanation of distillery spentwash using low cost porous media. Resources, Conservation and Recycling. 1995; 14(2): 79-89.
Sheoran AS, Sheoran V. Heavy metal removal mechanism of acid mine drainage in wetlands: A critical review. Minerals Engineering. 2006; 19(2): 105-16.
Silva AJ, Hirasawa JS, Varesche MB, Foresti E, Zaiat M. Evaluation of support materials for the immobilization of sulfate-reducing bacteria and methanogenic archaea. Anaerobe. 2006; 12(2): 93-8.
Silva AJ, Varesche MB, Foresti E, Zaiat M. Sulphate removal from industrial wastewater using a packed-bed anaerobic reactor. Process Biochemistry. 2002; 37(9): 927-35.
Sorial GA, Smith FL, Suidan MT, Pandit A, Biswas P, Brenner RC. Evaluation of trickle bed Air biofilter performance for BTEX removal. Journal of Environmental Engineering. 1997; 123(6): 530-7.
Sorial GA, Smith FL, Suidan MT, Pandit A, Biswas P, Brenner RC. Evaluation of trickle-bed air biofilter performance for styrene removal. Water Research. 1998; 32(5): 1593-603.
Speece RE. Anaerobic biotechnology. Nashville, Tennessee: Archae Press; 1996.

151
Sreenath HK, Moldes AB, Koegel RG, Straub RJE-. Lactic acid production from agriculture residues. Biotechnology Letters. 2001; 23(3): 179-84.
Stucki G, Hanselmann KW, Hurzeler RA. Biological sulfuric acid transformation: reactor design and process optimization. Biotechnoloy and Bioengineering. 1993; 41: 303-15.
Torre AD, Stephanopoulos G. Simulation study of anaerobic digestion control. Biotechnology and Bioengineering. 1986; 28(8): 1138-53.
Traore AS, Hatchikian CE, Le Gall J, Belaich JP. Microcalorimetric studies of the growth of sulfate-reducing bacteria: comparison of the growth parameters of some Desulfovibrio species. Journal of Bacteriology. 1982; 149(2): 606-11.
Tsukamoto TK, Killion HA, Miller GC. Column experiments for microbiological treatment of acid mine drainage: low-temperature, low-pH and matrix investigations. Water Research. 2004; 38(6): 1405-18.
Tursman JF, Cork DJ. Influence of sulfate and sulfate-reducing bacteria on anaerobic digestion technology. In: Mizhari A, editor. Advances in biotechnological processes. New York, NY: A.R. Liss Inc.; 1989. p. 273-285.
Vallero MVG, Lettinga G, Lens PNL. High rate sulfate reduction in a submerged anaerobic membrane bioreactor (SAMBaR) at high salinity. Journal of Membrane Science. 2005; 253(1-2): 217-32.
van Houten RT, Elferink SJWHO, van Hamel SE, Pol LWH, Lettinga G. Sulphate reduction by aggregates of sulphate-reducing bacteria and homo-acetogenic bacteria in a lab-scale gas-lift reactor. Bioresource Technology. 1995; 54(1): 73-9.
van Houten RT, Hulshoff Pol LW, Lettinga G. Biological sulphate reduction using gas-lift reactors fed with hydrogen and carbon dioxide as energy and carbon source. Biotechnology and Bioengineering. 1994; 44(5): 586-94.
van Houten RT, van der Spoel H, van Aelst AC, Hulshoff Pol LW, Lettinga G. Biological sulfate reduction using synthesis gas as energy and carbon source. Biotechnology and Bioengineering. 1996; 50(2): 136-44.
van Houten RT, Yun SY, Lettinga G. Thermophilic sulphate and sulphite reduction in lab-scale gas-lift reactors using H2 and CO2 as energy and carbon source. Biotechnology

152
and Bioengineering. 1997; 55(5): 807-14.
Van Loosdrecht MCM, Heijnen SJ. Biofilm bioreactors for waste-water treatment. Trends in Biotechnology. 1993; 11(4): 117-21.
Viera M, Curutchet G, Donati E. A combined bacterial process for the reduction and immobilization of chromium. International Biodeterioration & Biodegradation. 2003; 52(1): 31-4.
Waybrant KR, Ptacek CJ, Blowes DW. Treatment of mine drainage using permeable reactive barriers: column experiments. Environmental Science & Technology. 2002; 36(6): 1349-56.
Weijma J, Chi TM, Hulshoff Pol LW, Stams AJM, Lettinga G. The effect of sulphate on methanol conversion in mesophilic upflow anaerobic sludge bed reactors. Process Biochemistry. 2003; 38(9): 1259-66.
Widdel F. Microbiology and ecology of sulfate- and sulfur-reducing bacteria. In: Zehnder AJB, editor. Biology of anaerobic microorganisms. New York: John Wiley and Sons; 1988. p. 469-585.
Wiszniowski J, Surmacz-Górska J, Robert D, Weber J-. The effect of landfill leachate composition on organics and nitrogen removal in an activated sludge system with bentonite additive. Journal of Environmental Management. 2007; 85(1): 59-68.
Wright WF. Transient response of vapor-phase biofilters. Chemical Engineering Journal. 2005; 113(2-3): 161-73.
Yamaguchi T, Harada H, Hisano T, Yamazaki S, Tseng I. Process behavior of UASB reactor treating a wastewater containing high strength sulfate. Water Research. 1999; 33(14): 3182-90.
Yang Y, Tada C, Tsukahara K, Sawayama S. Methanogenic community and performance of fixed- and fluidized-bed reactors with reticular polyurethane foam with different pore sizes. Materials Science and Engineering: C. 2004; 24(6-8): 803-13.
Ye F, Chen Y, Feng X. Advanced start-up of anaerobic attached film expanded bed reactor by pre-aeration of biofilm carrier. Bioresource Technology. 2005; 96(1): 115-9.
153
Yeh, E. Raw sludge as substrate for sulphate-reducing bacteria (MASc thesis). University of Toronto. 1999.
Zagury GJ, Kulnieks VI, Neculita CM. Characterization and reactivity assessment of organic substrates for sulphate-reducing bacteria in acid mine drainage treatment. Chemosphere. 2006; 64(6): 944-54.
Zellner G, Neudorfer F, Diekmann H. Degradation of lactate by an anaerobic mixed culture in a fluidized-bed reactor. Water Research. 1994; 28(6): 1337-40.
Zinatizadeh AAL, Mohamed AR, Najafpour GD, Hasnain Isa M, Nasrollahzadeh H. Kinetic evaluation of palm oil mill effluent digestion in a high rate up-flow anaerobic sludge fixed film bioreactor. Process Biochemistry. 2006; 41(5): 1038-46.

154
Chapter 10: Appendices
155
10.1 Appendix A: Prediction of Volumetric CH4 Production
Procedure for calculating volumetric CH4 production in a bioreactor with a known COD removal efficiency. Adapted from Metcalf and Eddy (2003).
1. The sum of the CH4 yield (YCH4 ) and volumetric COD removal rate is the volumetric CH4 production rate.
⎟⎠⎞
⎜⎝⎛⎟⎟⎠
⎞⎜⎜⎝
⎛=
.dmCOD g
COD gCH mol
.dmCH4 mol
3removed
removed
43
2. To determine the CH4 yield, the numerator (moles of CH4 produced) and
denominator (g COD removed) for the entire process must be individually calculated.
3. A COD mass balance on the process is performed. The CODremoved is the product
of CODin and removal efficiency η. CODremoved can also be expressed by two alternate and equal relationships. The removal of COD in a methanogenic processe occurs via the synthesis of cells (VSS) and CH4.
CH4VSS
outin
inremoved
CODCODCOD-COD
CODCOD
+==
⋅= η
4. Determine the amount of COD converted to cells. Typically 0.08 g of cells (VSS)
are synthesized from each g CODremoved. Assuming an average cell composition of C5H7NO2, each g of VSS has a COD content of 1.42 g.
removedremoved
VSSVSS COD g
COD gVSS g 08.0
VSS gCOD g 1.42COD g ⋅⎟⎟
⎠
⎞⎜⎜⎝
⎛⎟⎟⎠
⎞⎜⎜⎝
⎛=
5. The amount of COD converted to CH4 can now be calculated.
( ) VSSoutinCH4 CODCOD-CODCOD −=
6. Calculate the amount of CH4 produced from CODCH4. Based upon the theoretical
oxygen demand of methane, (1 mol of CH4 = 64 g COD). This corresponds to 0.40 L CH4 produced per g COD at 35 oC which correlates well with experimental values from literature.
CH44
4 COD gCOD g 64CH molCH mol ⋅=
All necessary values for the methane yield have now been obtained.
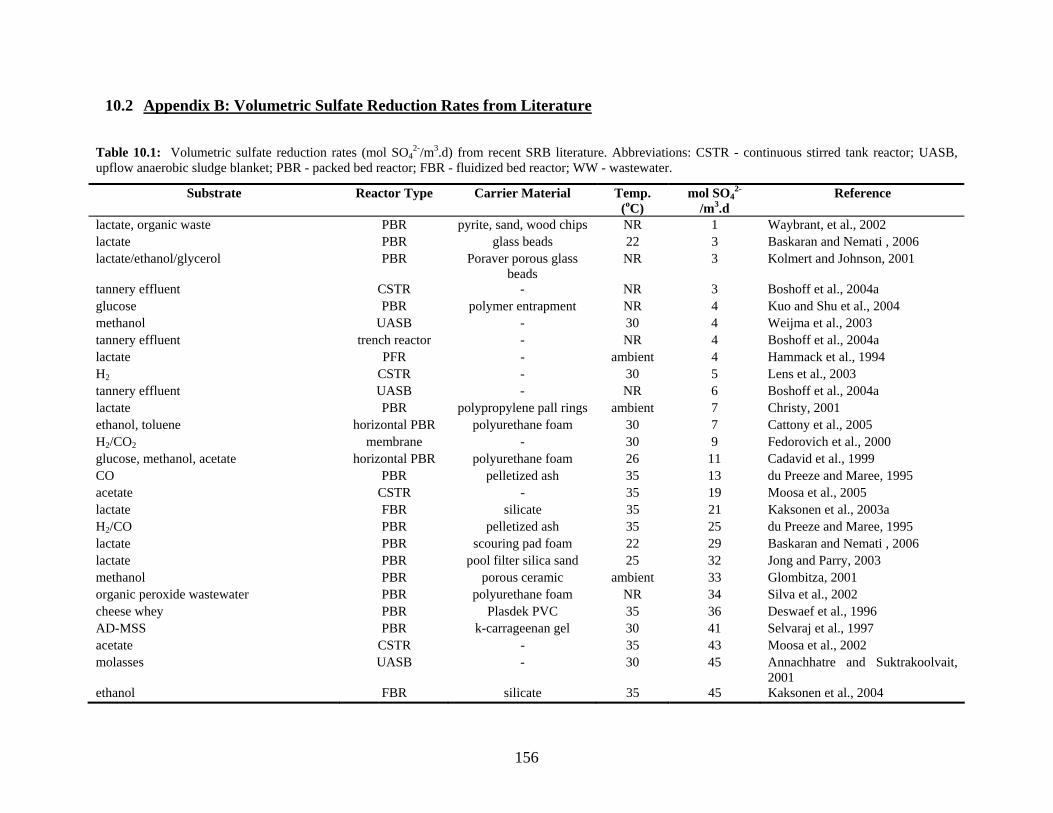
156
10.2 Appendix B: Volumetric Sulfate Reduction Rates from Literature
Table 10.1: Volumetric sulfate reduction rates (mol SO42-/m3.d) from recent SRB literature. Abbreviations: CSTR - continuous stirred tank reactor; UASB,
upflow anaerobic sludge blanket; PBR - packed bed reactor; FBR - fluidized bed reactor; WW - wastewater.
Substrate Reactor Type Carrier Material Temp. (oC)
mol SO42-
/m3.d Reference
lactate, organic waste PBR pyrite, sand, wood chips NR 1 Waybrant, et al., 2002 lactate PBR glass beads 22 3 Baskaran and Nemati , 2006 lactate/ethanol/glycerol PBR Poraver porous glass
beads NR 3 Kolmert and Johnson, 2001
tannery effluent CSTR - NR 3 Boshoff et al., 2004a glucose PBR polymer entrapment NR 4 Kuo and Shu et al., 2004 methanol UASB - 30 4 Weijma et al., 2003 tannery effluent trench reactor - NR 4 Boshoff et al., 2004a lactate PFR - ambient 4 Hammack et al., 1994 H2 CSTR - 30 5 Lens et al., 2003 tannery effluent UASB - NR 6 Boshoff et al., 2004a lactate PBR polypropylene pall rings ambient 7 Christy, 2001 ethanol, toluene horizontal PBR polyurethane foam 30 7 Cattony et al., 2005 H2/CO2 membrane - 30 9 Fedorovich et al., 2000 glucose, methanol, acetate horizontal PBR polyurethane foam 26 11 Cadavid et al., 1999 CO PBR pelletized ash 35 13 du Preeze and Maree, 1995 acetate CSTR - 35 19 Moosa et al., 2005 lactate FBR silicate 35 21 Kaksonen et al., 2003a H2/CO PBR pelletized ash 35 25 du Preeze and Maree, 1995 lactate PBR scouring pad foam 22 29 Baskaran and Nemati , 2006 lactate PBR pool filter silica sand 25 32 Jong and Parry, 2003 methanol PBR porous ceramic ambient 33 Glombitza, 2001 organic peroxide wastewater PBR polyurethane foam NR 34 Silva et al., 2002 cheese whey PBR Plasdek PVC 35 36 Deswaef et al., 1996 AD-MSS PBR k-carrageenan gel 30 41 Selvaraj et al., 1997 acetate CSTR - 35 43 Moosa et al., 2002 molasses UASB - 30 45 Annachhatre and Suktrakoolvait,
2001 ethanol FBR silicate 35 45 Kaksonen et al., 2004

157
H2/CO2 PBR "special packing" 30 50 Foucher et al., 2001 anaerobically digested municipal sewage sludge
CSTR with recycle
- 30 50 Selvaraj et al., 1997
lactate PBR sand 22 57 Baskaran and Nemati , 2006 ethanol UASB - 35 63 Kalyuhnyi cheese whey PBR Plasdek PVC 35 64 Hiligsmann et al, 1996 ethanol FBR Poraver porous glass
beads ambient 66 Nagpal et al., 2000b
molasses PBR N/A 31 68 Maree and Strydom, 1987 acetate, ethanol membrane - 33 69 Vallero et al., 2005 ethanol EGSB - 35 92 de Smul et al., 1997 acetate EGSB - 33 92 Dries et al., 1998 acetate, propionate, butyrate UASB - 30 94 Omil et al., 1996 acetate EGSB - 35 99 de Smul, 1998 acetate EGSB - 35 100 de Smul, 1998 H2/CO2/CO FBR/gas lift pumice 35 104 van Houten et al., 1996 H2/CO2 gas-lift pumice 55 116 van Houten et al., 1997 ethanol EGSB - 33 131 de Smul et al., 1999 acetate UASB - 32 146 Muthumbi et al., 2001 acetate PBR textile fiber 35 155 Stucki et al., 1993 acetate PBR porous lava rock 35 156 Stucki et al., 1993 H2/CO2 FBR/air lift basalt 30 186 van Houten et al., 1994 H2/CO2 FBR/air lift pumice 30 260 van Houten et al., 1995 H2/CO2 FBR/air lift pumice 30 313 van Houten et al., 1994 molasses PBR granular activated
carbon 35 320 Gasiorek, 1994
anaerobically digested municipal sewage sludge
PBR BioSep 30 456 Selvaraj et al., 1997
acetate PBR polyurethane foam 35 576 Stucki et al., 1993 acetate PBR sintered glass beads 35 677 Stucki et al., 1993
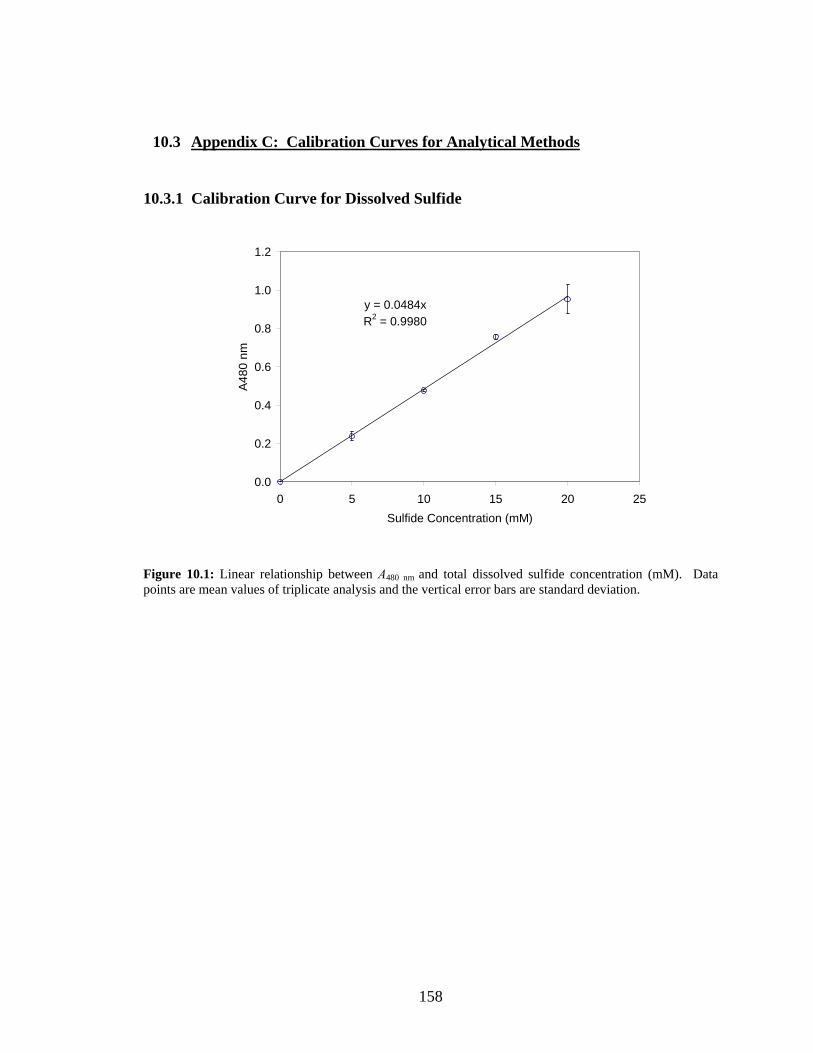
158
10.3 Appendix C: Calibration Curves for Analytical Methods
10.3.1 Calibration Curve for Dissolved Sulfide
y = 0.0484xR2 = 0.9980
0.0
0.2
0.4
0.6
0.8
1.0
1.2
0 5 10 15 20 25Sulfide Concentration (mM)
A480
nm
Figure 10.1: Linear relationship between A480 nm and total dissolved sulfide concentration (mM). Data points are mean values of triplicate analysis and the vertical error bars are standard deviation.

159
10.3.2 Calibration Curve for Dissolved Sulfate
The relationship between dissolved sulfate and A420 nm was described by a 3rd order
polynomial of the form y = ax3 + bx2 + cx + d. (Figure 10.2). Coefficient values were a =
-1.49598E-05, b = 9.72374E-04, c = 2.37134E-02, and d = 6.71879E-02 with an R2 value
of 0.997.
-0.200
0.000
0.200
0.400
0.600
0.800
1.000
1.200
1.400
1.600
1.800
2.000
0.0 10.0 20.0 30.0 40.0 50.0 60.0
Sulfate Concentration (mM)
A42
0 nm
Figure 10.2: Relationship between A420 nm and total dissolved sulfide concentration (mM). Data points are mean values of triplicate analysis and the vertical error bars are standard deviation.
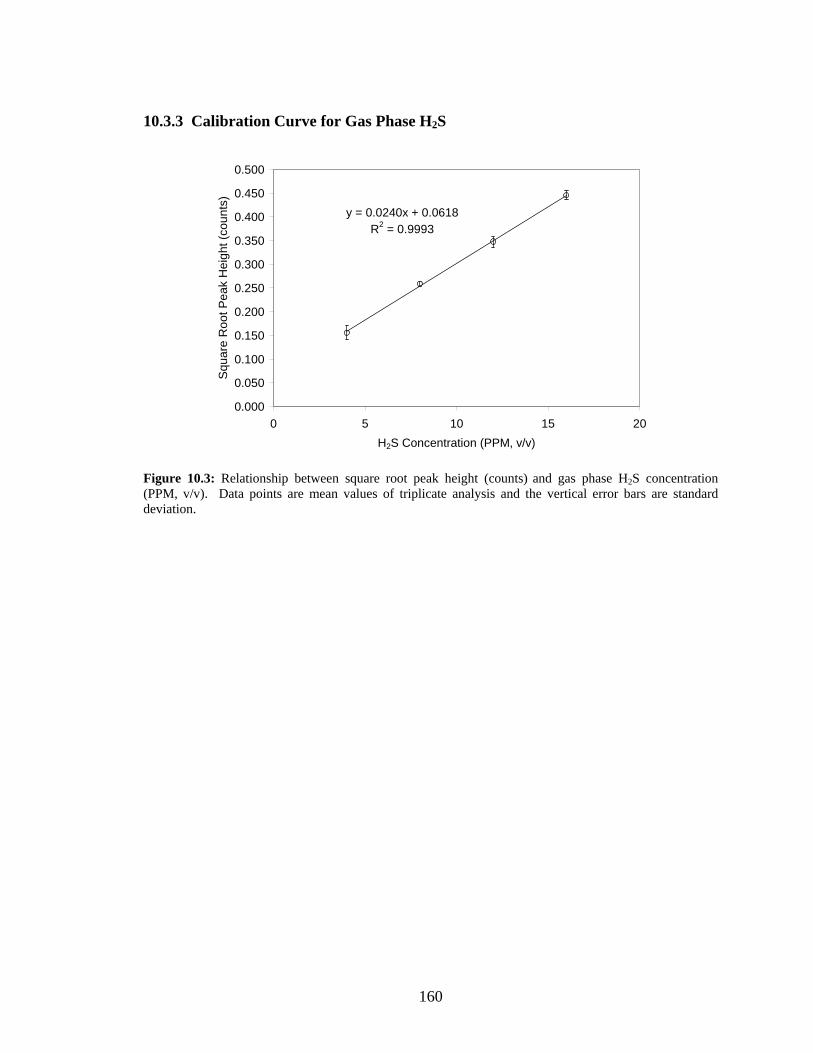
160
10.3.3 Calibration Curve for Gas Phase H2S
y = 0.0240x + 0.0618R2 = 0.9993
0.000
0.050
0.100
0.150
0.200
0.250
0.300
0.350
0.400
0.450
0.500
0 5 10 15 20H2S Concentration (PPM, v/v)
Squ
are
Roo
t Pea
k H
eigh
t (co
unts
)
Figure 10.3: Relationship between square root peak height (counts) and gas phase H2S concentration (PPM, v/v). Data points are mean values of triplicate analysis and the vertical error bars are standard deviation.
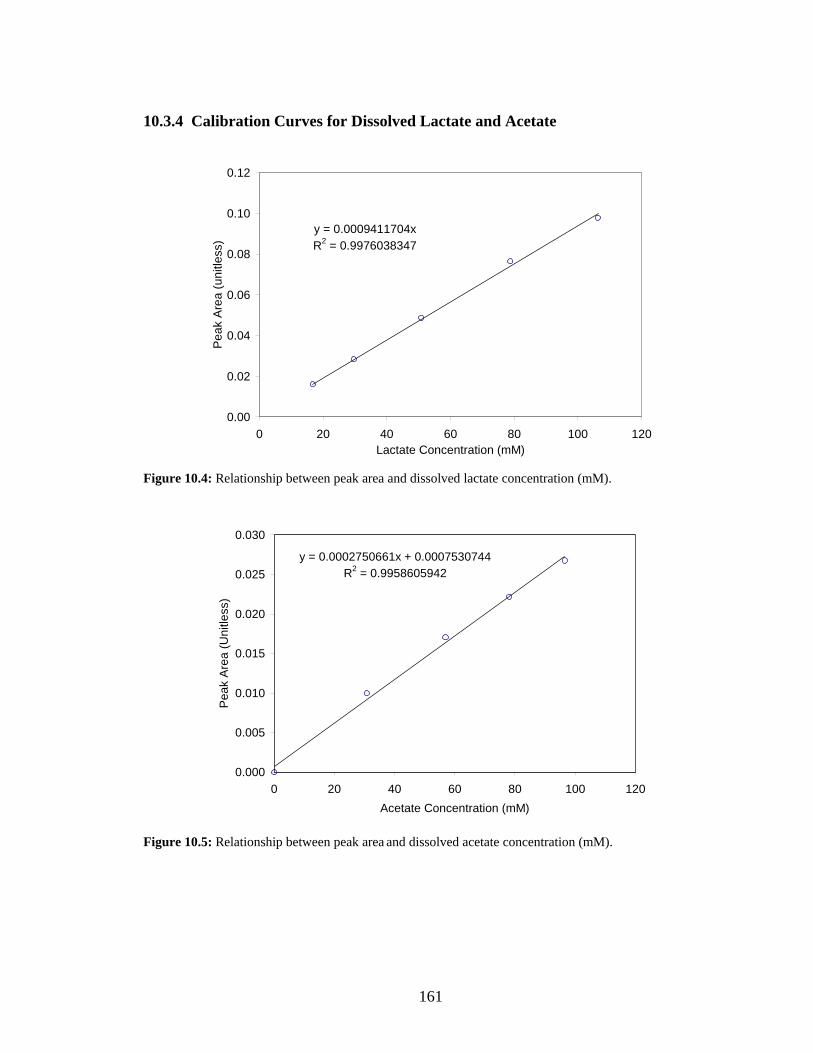
161
10.3.4 Calibration Curves for Dissolved Lactate and Acetate
y = 0.0009411704xR2 = 0.9976038347
0.00
0.02
0.04
0.06
0.08
0.10
0.12
0 20 40 60 80 100 120Lactate Concentration (mM)
Pea
k A
rea
(uni
tless
)
Figure 10.4: Relationship between peak area and dissolved lactate concentration (mM).
y = 0.0002750661x + 0.0007530744R2 = 0.9958605942
0.000
0.005
0.010
0.015
0.020
0.025
0.030
0 20 40 60 80 100 120Acetate Concentration (mM)
Pea
k A
rea
(Uni
tless
)
Figure 10.5: Relationship between peak area and dissolved acetate concentration (mM).

162
10.3.5 Calibration Curve for Suspended Cell Concentration
y = 4.2536xR2 = 0.9926
0
0.1
0.2
0.3
0.4
0.5
0.6
0.7
0.8
0.9
0 0.05 0.1 0.15 0.2 0.25Cell Dry Weight (g/L)
A600
nm
Figure 10.6: Relationship between A600 nm and suspended cell biomass measured as cell dry weight (CDW g/L).
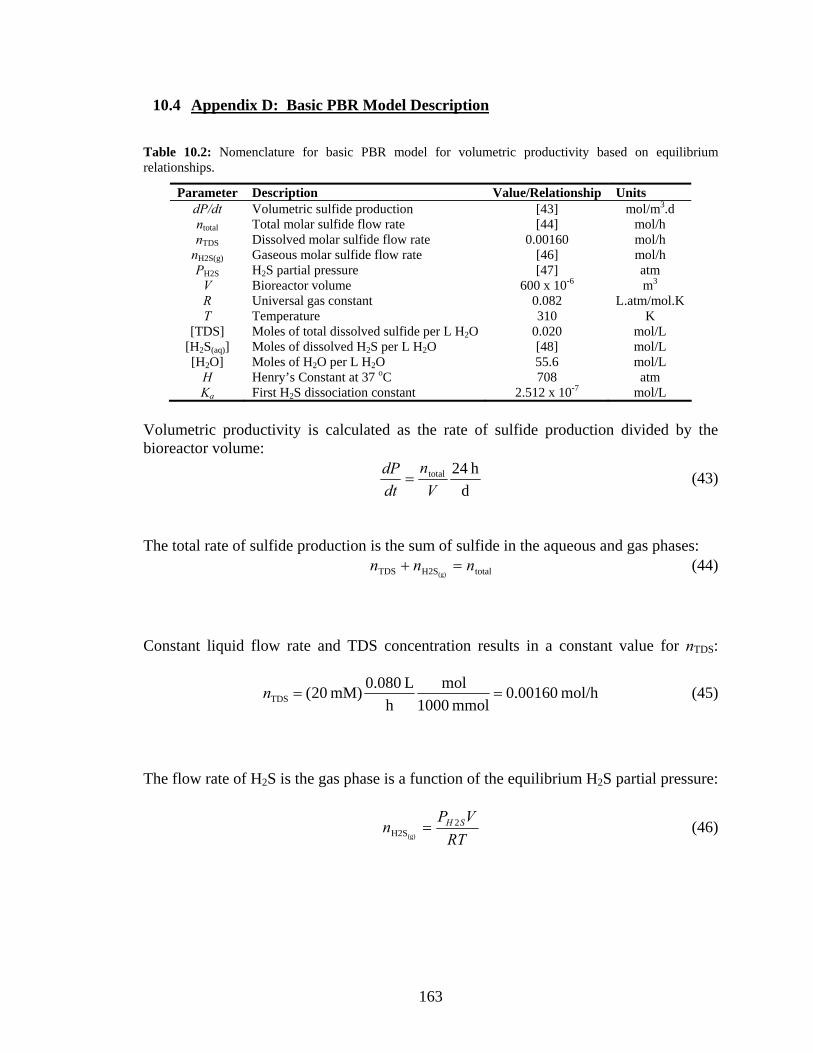
163
10.4 Appendix D: Basic PBR Model Description
Table 10.2: Nomenclature for basic PBR model for volumetric productivity based on equilibrium relationships.
Parameter Description Value/Relationship Units dP/dt Volumetric sulfide production [43] mol/m3.d ntotal Total molar sulfide flow rate [44] mol/h nTDS Dissolved molar sulfide flow rate 0.00160 mol/h
nH2S(g) Gaseous molar sulfide flow rate [46] mol/h PH2S H2S partial pressure [47] atm
V Bioreactor volume 600 x 10-6 m3 R Universal gas constant 0.082 L.atm/mol.K T Temperature 310 K
[TDS] Moles of total dissolved sulfide per L H2O 0.020 mol/L [H2S(aq)] Moles of dissolved H2S per L H2O [48] mol/L [H2O] Moles of H2O per L H2O 55.6 mol/L
H Henry’s Constant at 37 oC 708 atm Ka First H2S dissociation constant 2.512 x 10⁻⁷ mol/L
Volumetric productivity is calculated as the rate of sulfide production divided by the bioreactor volume:
d
h 24total
Vn
dtdP
= (43)
The total rate of sulfide production is the sum of sulfide in the aqueous and gas phases: totalH2STDS (g)
nnn =+ (44)
Constant liquid flow rate and TDS concentration results in a constant value for nTDS:
mol/h 00160.0mmol1000
molh
L 0.080mM) 20(TDS ==n (45)
The flow rate of H2S is the gas phase is a function of the equilibrium H2S partial pressure:
RT
VPn SH 2
H2S(g)= (46)
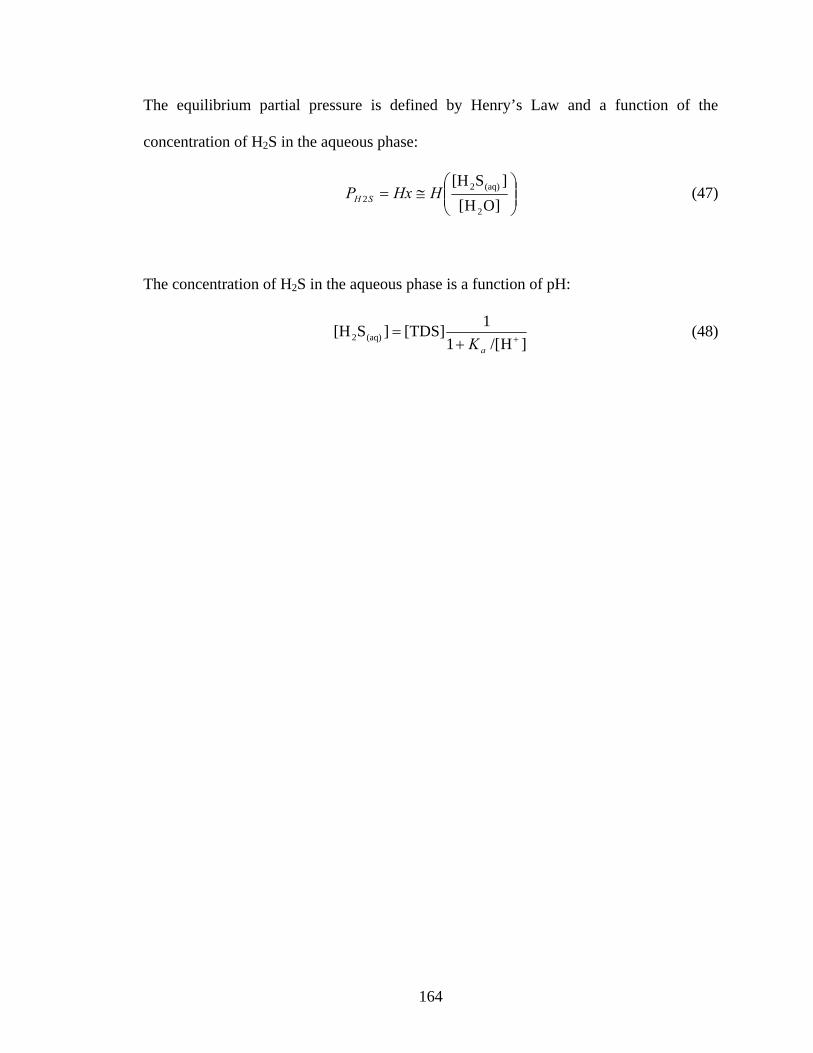
164
The equilibrium partial pressure is defined by Henry’s Law and a function of the
concentration of H2S in the aqueous phase:
⎟⎟⎠
⎞⎜⎜⎝
⎛≅=
]OH[]S[H
2
(aq)22 HHxP SH (47)
The concentration of H2S in the aqueous phase is a function of pH:
]H/[1
1[TDS]]S[H (aq)2 ++=
aK (48)