reactivity of oxygen carriers for clc in packed bed ... · reactivity of oxygen carriers for clc in...
TRANSCRIPT

1
Reactivity of oxygen carriers for CLC in packed bed reactors under
pressurized conditions
H.P. Hamersa, F. Gallucci
a, G. Williams
b, P.D. Cobden
c, M. van Sint Annaland
a,1
a Chemical Process Intensification, Department of Chemical Engineering and Chemistry,
Eindhoven University of Technology, P.O. Box 513, 5600MB Eindhoven, The Netherlands.
b Johnson Matthey Public Limited Company, UK
c Energy research Centre of the Netherlands (ECN), P.O. Box 1, 1755ZG Petten, The
Netherlands.
Abstract
For the design, scale-up and optimization of pressurized packed bed reactors for chemical-
looping combustion, understanding of the effect of the pressure on the reactivity of the
oxygen carriers is very important. In this work, the redox reactivity of CuO/Al2O3 and
NiO/CaAl2O4 particles at elevated pressures have been measured in a pressurized high-
temperature magnetic suspension balance. The experiments have demonstrated that the
pressure has a negative influence on the reactivity and that this effect is kinetically controlled.
The negative effect of the pressure might be caused by the decrease in the number of oxygen
vacancies at higher pressures. Moreover, the reactant gas fraction has been demonstrated as
an important parameter, probably related to competition between different species for
adsorption on the oxygen carrier surface. These effects have been included in the kinetic
model leading to a good description of the experimental results. The impact of these findings
on packed-bed CLC applications with larger oxygen carrier particles has been investigated
with a particle model that considers diffusion limitations and kinetics. It has been shown that
the impact of diffusion limitations decrease with increasing pressure, due to the decrease in
reaction rates and the increase in diffusion fluxes caused by Knudsen diffusion. The results
have been validated by experiments with 1.7 mm NiO/CaAl2O4 particles. These results
corroborate that the selection of larger particles because of pressure drop considerations, does
not lead to a large decrease in effective reaction rates, which is beneficial for packed-bed
CLC applications.
Keywords: chemical-looping combustion, packed beds, CO2 capture, NiO/CaAl2O4,
CuO/Al2O3
1 Corresponding author. Tel.: +31 40 247 2241; fax: +31 40 247 5833.
E-mail address: [email protected] (M. van Sint Annaland).
2
1. Introduction
With chemical-looping combustion (CLC), fossil fuels can be converted in power, while no
additional separation step is required to obtain a relatively pure CO2 stream, thus the carbon
capture is integrated in the power production process. During the CLC process, hot air is
produced and converted into power; the highest electrical efficiency is obtained if a combined
cycle is applied, which means that the hot air stream has to be produced at high temperature
(at least 1200 °C) and elevated pressure (around 20 bar). In most power plant integration
studies it is assumed that the process is operated at elevated pressure, but at this moment little
information is known about the reactivity of the oxygen carriers at elevated pressures.
García-Labiano et al. have published the kinetics at elevated pressure for copper, nickel and
iron based oxygen carriers 1. The kinetics have been determined at 450-950 °C and a pressure
between 1 and 30 bar. It appears that a high total pressure has a negative effect on the
kinetics. They observed the same behavior with different particle sizes (0.09-0.25 mm),
which indicates that they were measuring kinetics 1. The authors have indicated that the
decline in reactivity cannot be caused by a decrease in surface area and pore volume. For
other gas solid reactions, similar results have been obtained, for example for the reactions
between CaO and H2S or calcination of CaCO3. Chauk et al. have found a decrease in the
reactivity of CaO with H2S at higher pressures, but have attributed this to a lower pore
volume and surface area 2. Similar behavior was found for the calcination reaction where the
reactivity was described by increasing the negative pressure effect in Fuller’s equation for
molecular diffusion 3. From these studies, it can be concluded that the pressure could have a
negative effect on the reactivity, but there is no general consensus on the cause for the
observed negative effect.
Some experimental work has been carried out to the application of CLC in pressurized
circulating fluidized bed reactors. Such a system has been constructed by Xiao et al. 4.
Experiments have been carried out with Shenhua bituminous coal as fuel and iron ore as
oxygen carrier at three different operating pressures (1, 3 and 5 bar). Stable operation has
been reached. A higher combustion efficiency was observed at elevated pressure. However,
the oxygen carrier fine production was also higher which is very detrimental for power
production in downstream turbines. In our previous work we demonstrated that the maximum
efficiency of the process will be mainly influenced by the generated temperature and pressure
of the hot air stream and is not much affected by the type of reactor selected, as long as the
reactor can work at these conditions 5.
To better accommodate the CLC process at elevated pressure, packed-bed reactors have been
selected in this study. In packed bed reactors, larger oxygen carrier particles are required to
maintain a low pressure drop. But the selection of larger particles may also imply that the role
of diffusion limitations inside the particle may become more dominant. The effect of
diffusion limitations has been described by Noorman et al. for atmospheric applications 6.
This model considers molecular diffusion and Knudsen diffusion. From these studies, it was
concluded that Knudsen diffusion was the rate determining step in the oxygen carrier
particles considered.

3
The objective for this paper is to measure the pressure effect on the kinetics and to evaluate
this impact for packed bed CLC applications. For the oxygen carrier reaction rate
measurements, CuO/Al2O3 and NiO/CaAl2O4 particles have been tested in a high pressure
magnetic suspension balance. An kinetic expression is determined from these measurements
and this correlation is used to describe the behavior in packed-bed reactors using an advanced
particle model. The model is validated by experiments with larger particles.
2. Materials and methods
2.1.Oxygen carriers
The CuO/Al2O3 particles were obtained from Sigma-Aldrich with an active weight content of
13wt% and a particle size of 1.1 mm. For kinetic experiments, the particles were crushed and
sieved to a size of 110-150 μm.
The NiO/CaAl2O4–particles used in this work is a Johnson Matthey product, HiFUEL®
R110
(Ni based catalyst supported on CaAl2O4 for steam reforming of natural gas), available in
pelleted form from Alfa Aesar. The particles were received in the form of shaped pellets,
comprising of 4 holes, 4 flute domed cylinders. For this study, the pellets were crushed and
sieved to particle sizes of 1.7 mm and 0.15 mm. Separate TGA experiments proved that the
mass change (and thus the active weight content) is not the same for each particle. The
experiments with CO and O2 were carried out with a particle with an active weight content of
18.5wt%, while an active weight content was measured of 17wt% for the experiments with
H2. Before the tests, the oxygen carrier was activated by exposure to two redox cycles with
reductions with H2 at 900 °C.
2.2.High pressure magnetic suspension balance
The experiments have been carried out in a magnetic suspension balance (Rubotherm) that
can operate between 200-1200 °C and 1-30 bar. An oxygen carrier sample of 100 mg is
placed in a porous quartz glass sample holder. The basket is placed on an Ir wire that is
hanging on a permanent magnet. The mass is determined by the strength of the magnet.
The reactant gases are supplied at the top of the reactor. The reactor is surrounded by a vessel
that is maintained at lower temperature. Argon is supplied to this vessel to prevent that
reactant gases can enter and mix in the insulation layer. A schematic overview of the setup is
provided in Figure 1.
Before a series of experiments is started, the system is pressurized and the reactor is set at the
desired operating temperature. When this temperature is reached and the system has been
stabilized, redox cycles are carried out that consist of a 20 min reduction, a 10 min purge, a
10 min oxidation and a 10 min purge. During experiments, a total flow rate of 480 mLn/min.
is fed. Some experiments have been carried out with a lower flow rate (320 mLn/min.) to
demonstrate that the measured reactivity is not influenced by external mass transfer
limitations. Every experiment has been repeated at least two times to assure the
reproducibility of the results.

4
Blank experiments have been carried out with only a sample holder (and no oxygen carrier)
so that the influence of the flow change on the measured mass change can be determined and
corrected for. The blank experiment data are subtracted from the data obtained with the
oxygen carrier sample.
Figure 1: Schematic overview of the magnetic suspension balance setup.
2.3.Particle model
The conversion of the solid is described by a numerical particle model that assumes a
spherical oxygen carrier particle with a uniform porosity, fixed particle diameter and a
uniform pore size 6. The model describes the gas transport inside the particle from the
moment that the particle is exposed to a reactant at certain operating conditions. For the gas
transport, the reaction kinetics and molecular and Knudsen diffusion and external mass
transfer limitations are taken into account. Based on this description, the solid conversion is
simulated as a function of time and these data is compared with TGA results. The equations
applied in the model are listed in Table 1. The kinetics for CuO are same as used by Hamers
et al. 7 (which are based on García-Labiano
1,8) and the kinetics for the NiO/CaAl2O4 are
taken from Medrano et al. 9. The particle properties are based on pycnometer (Quantachrome
Micro-ultrapyc1200) and BET (Thermscientific Surfer) measurements and are listed in Table
2.
Pre
ssu
re v
esse
l
N2
Air
H2
CO
CO2
H2O
Ar
PC
vent
sample
magnet

5
Table 1: The equations of the particle model 6.
Continuity equation
2
21
1 gNtotg g
i i
i
r nr M
t rr
Gas phase components 2
,
2
1 ig g g i
i i
r nr M
t rr
where
1
,
, , ,
1
gN
g k
i i g i tot g eff ik g i tot
k
n j n D nr
Solid phase components
,
1
gNs s s j
i j
i
r Mt
where , , , , ,1 1ox ox s MeO
s MeO s act s Me s Me s act
Me
v M
M
Energy balance g,reactants
2
, , ,21
1N
g g p g s s p s eff i R i
i
T TC C r r H
t r rr
Kinetics
copper: , 0 5exp
10
q
nact tot
i g p g
E pr k C
R T
nickel:
0
,s p s act
i
j
dXr
b M dt
0
2 1
0 03 3
3
1(1 ) (1 )
n
g
s
C
b r CdX
dt r rX X
k D D
0 5exp
10
q
totApE
Rk k
T
0 exp expD
x
ED D k X
RT
Diffusion
- Binary molecular diffusion: Knudsen diffusion:
-
1.75 1 1
, 23 3
0.01013 i k
Bin ik
i k
T M MD
p v v
,
8
3
pore
Kn i
i
d R TD
M
- Maxwell-Stefan diffusion matrix 1
D B
that consists of the elements dik and n gaseous
components
with: 1, , ,
( )
1ni k
ii
kBin in Bin ik Kn ii k
y yB
D D D
and , ,
1 1ik i
Bin ik Bin in
B yD D
Effective diffusivity ,
,
g p
eff ikD D
Table 2: Particle properties for the NiO/CaAl2O4 particle 10
.
Oxygen carrier 17-18.5wt% NiO on CaAl2O4 TGA experiments
Particle diameter, mm 1.7 sieved
Particle porosity, m3
gas/m3
particle 0.55 derived from combination
dry and liquid pycnometer
Average pore size, Å 130 BET porosimetry

6
3. Results and discussion
3.1.Pressure effect on kinetics
Experiments were carried out varying the total pressure (1-20 bar), while the partial pressure
of the reactant was kept constant at 1 bar. In this way, the reactant gas concentration and the
temperature were fixed, so that solely the influence of the total pressure is measured. Redox
cycles have been measured with CuO/Al2O3 and NiO/CaAl2O4 as oxygen carriers at 600 and
800 °C. In case of CO as reactant, a CO2/CO-ratio of 1 and 3 was used at 800 °C and 600 °C
respectively.
The results plotted as solid conversion (defined in equation (1)) as a function of time for the
experiments at constant temperature and different total pressures are shown in Figure 2 and
Figure 3. During the reduction cycles, full solid conversion was not reached. The maximum
solid conversion depends on the reduction temperature and the type of the support material 11,12
. The support material could be present as inert layer in the solid structure, which might
influence the accessibility of the oxygen and thus the degree of reduction. The maximum
degree of reduction depends on the operating temperature. The lowest conversion is reached
for the H2 experiments with CuO at 600 °C. For demonstration of the pressure effect, the
curve has been zoomed in on the first 60 seconds. But after that moment, the particle keeps
on reacting and a conversion of 80% is reached after longer times 7. From the experiments it
can be concluded that the maximum solid conversion does not depend on the operating
pressure, but only on the temperature.
observed mass changesolid conversion
maximum mass change for the assumed active weight content (1)
As can be observed from Figure 2 and Figure 3, where the partial pressure of the reactant was
fixed, but the total pressure was varied, the reaction rate decreases with increasing total
pressure. It has to be noted that in the experiments with a higher total pressure, the reactant
was thus more diluted, because the partial pressure of the reactant was kept constant. The
decreased reactivity with the pressure is observed for all reactants with both oxygen carriers.
At higher pressures, more fluctuations in the experimental results can be seen which is related
to limitations of the experimental set-up. These fluctuations could in principle be decreased
by reducing the total flow rate, but in that case external mass transfer limitations could occur.
Despite these fluctuations, a clear trend can still be discerned from the results at 20 bar.
External mass transfer limitations cannot be the cause for the decrease in the reaction rate,
because the same conversion curves were obtained from experiments with a lower gas flow
rate (320 mLn/min instead of 480 mLn/min). This experiment demonstrates that the reactant
flow rate was sufficiently high to refresh the gas around the sample and to supply a sufficient
amount of reactants for the gas/solid reactions. This has been validated for all the operating
conditions investigated.

7
0 50 100 150 200
0.0
0.2
0.4
0.6
0.8
1.0
a) H2
ptot
=
pH2
=1 bar
T= 800 °C
5bar
10bar
20bar
so
lid c
on
ve
rsio
n (
-)
time (s)
model exp
0 50 100 150 200
0.0
0.2
0.4
0.6
0.8
1.0
b) CO
2bar
5bar
10bar
20bar
so
lid c
on
ve
rsio
n (
-)
time (s)
pCO
=1 bar
T=800 °C
ptot
=model exp
0 50 100 150 200
0.0
0.2
0.4
0.6
0.8
1.0
c) O2
pO2
=1 bar
T= 800 °C
5bar
10bar
20bar
so
lid c
on
ve
rsio
n (
-)
time (s)
ptot
=model exp
Figure 2: The effect of pressure on the redox kinetics of NiO/CaAl2O4 at 800 °C with H2,
CO and air. The markers show the experimental data and the lines the model
predictions.

8
0 20 40 60 80 100
0.0
0.2
0.4
0.6
0.8
1.0
a) H2
pH2
=1 bar
T=600 °C
5bar
10bar
20bar
so
lid c
on
ve
rsio
n (
-)
time (s)
ptot
=model exp
0 20 40 60 80 100
0.0
0.2
0.4
0.6
0.8
1.0
b) CO
2bar
5bar
10bar
20bar
so
lid c
on
ve
rsio
n (
-)
time (s)
pCO
=1 bar
T=800 °C
ptot
=model exp
0 20 40 60 80 100
0.0
0.2
0.4
0.6
0.8
1.0
c) O2
pO2
=1 bar
T=600 °C
5bar
10bar
20bar
so
lid c
on
ve
rsio
n (
-)
time (s)
ptot
=model exp
Figure 3: The effect of pressure on the redox kinetics with CuO/Al2O3 with H2, CO and
air. The markers show the experimental data and the lines the model predictions.
Moreover, experiments have been carried out with different particle sizes and again the same
conversion curves have been obtained. This is illustrated in Figure 4, where the oxidation of
Cu/Al2O3 is displayed at 20 bar (with pO2=4 bar and 1 bar) and the particle size was varied
between 0.15 mm (lines) and 1.1 mm (markers). The same trends can be observed and for
that reason, internal mass transfer limitations can also be ruled out as cause for the observed
decrease in reactivity at elevated pressures.

9
0 50 100 150 200
0.0
0.2
0.4
0.6
0.8
1.0
25% air/N2
so
lid c
on
ve
rsio
n (
-)
time (s)
Air
Figure 4: The particle size effect on the solid reaction rate for the oxidation of Cu/Al2O3
at 800°C and 20 bar. The reactivity of 1.1 mm particles is represented by markers and
the 0.15 mm particles by lines.
Thus, the decrease in reactivity with increasing pressure has to be kinetically controlled. An
expression for the reaction rates including a pressure correction factor has been introduced by
García-Labiano et al. 1 and the kinetic term is demonstrated in equation (2).
0
5
exp
10
nact
q
tot
k Er C
R Tp
(2)
The same method has been followed here. By fitting the experimental data, a number for the
parameter q was determined. The determined numbers for q are displayed in Table 3 together
with the data from literature for comparison. In general, the same trend is observed as by
Garcia-Labiano, but somewhat different values for q have been found. There may be different
reasons for the observed discrepancies; firstly, the experiments reported in literature may
have been carried out with different materials or supports. Furthermore, the quality of the
fitting is different especially at high pressures.
Table 3: Determined values for q (in Eqn. 2) from the experimental data and
comparison with values found in literature.
q CuO/Al2O3 NiO/CaAl2O4
Gaseous
reactant
García-Labiano
et al. 1
This work García-Labiano
et al. 1
This work
H2 0.53 1.0 0.47 0.75
CO 0.83 1.2 0.93 0.85
O2 0.68 1.3 0.46 1.05
10
3.2. Discussion
In the previously described experiments the reactant partial pressure was kept constant, while
the total pressure was varied. The partial pressure was fixed by increasing the dilution at
higher pressures. During both the oxidation and the reduction reactions, the reaction rates
decrease with increasing pressure, which might to a large extent have been caused by the
dilution of the reactant gas.
The following reaction mechanism has been proposed in the literature for redox reactions 13,14
. First, the reactant adsorbs on the oxygen carrier and subsequently, an oxygen atom is
transferred from the adsorbed gas to the oxygen carrier or vice versa 13
. CO2 or H2O is
formed during reduction and this molecule is desorbed from the oxygen carrier. In principle,
not only the reactant could adsorb to the oxygen carrier surface, but also the other gases that
are considered to be inert in the reaction. In case of competitive adsorption, the reactant gas
fraction is a relevant parameter for the kinetics.
Furthermore, the surface is not expected to be flat, also because the metal (for example Ni has
an atomic radius of 125 pm 15
) has a different atomic radius than the oxide (atomic radius of
66 pm 15
). Due to this difference, cavities could be present on the solid surface. The gas
molecule that is present in the cavities could be inert or reactive with the solid. If the space of
a cavity is occupied by an inert gas, it blocks the pathway of the reactive gas. Therefore a
reactive spot on the solid remains unoccupied and this results in a lower reaction rate. These
diffusion limitations are not dependent on the particle size, because the gases are distributed
in the particle by pores that are much bigger, so that the gas close to the solid surface still has
the feed composition.
Other experiments have been carried out to exclude some effects and to prove what could be
the reason for the observed behavior in the experiments. Reductions have been carried out
with varying CO2/CO-ratios at different pressures and no effect on the kinetics was observed.
Therefore it seems that the desorption of gaseous products is not the limiting step.
Furthermore, oxidations have been carried out with air (25% air) that is diluted either by N2
or CO2 (so a 25% air/75%N2 vs. a 25% air/75% CO2 mixture). It is expected that CO2
adsorbs on the solid surface and therefore competitive adsorption with O2 is expected.
However, the experiments showed that the reaction rates did not change significantly, when
air was diluted with CO2. This means that either N2 adsorbs on the surface by physisorption
with the same impact as CO2 or that the adsorption is not a rate limiting step. In the latter
case, the blocking of the reactant gases in the cavities could explain the decrease in reactivity
when the mixture is more diluted.
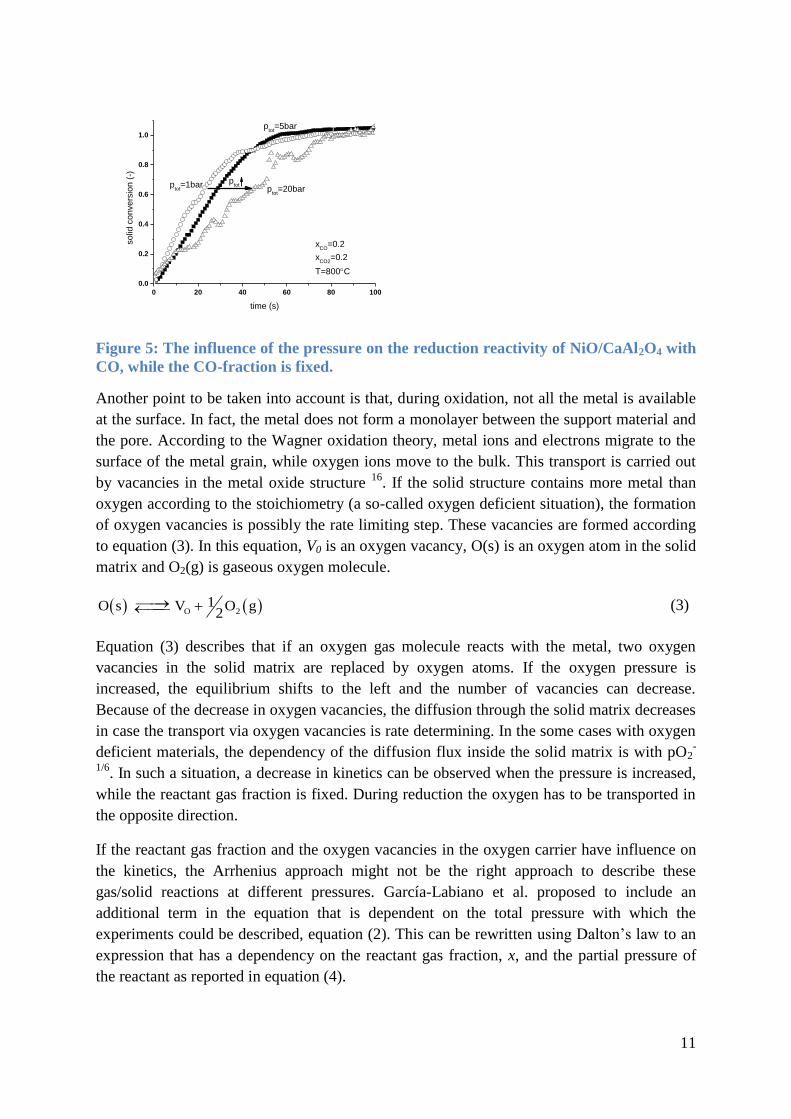
When the reactant gas fraction is fixed, while the pressure is increased, a small decrease in
reactivity is observed. The temporal evolution of the solid conversion of NiO during
reduction with 20% CO in 20% CO2 and 60% N2 at 1, 5 and 20 bar is illustrated in Figure 5.
The same trend was observed for reductions with H2 and oxidations with air.
11
0 20 40 60 80 100
0.0
0.2
0.4
0.6
0.8
1.0
ptot
=5bar
ptot
=20bar
so
lid c
on
ve
rsio
n (
-)
time (s)
ptot
xCO
=0.2
xCO2
=0.2
T=800°C
ptot
=1bar
Figure 5: The influence of the pressure on the reduction reactivity of NiO/CaAl2O4 with
CO, while the CO-fraction is fixed.
Another point to be taken into account is that, during oxidation, not all the metal is available
at the surface. In fact, the metal does not form a monolayer between the support material and
the pore. According to the Wagner oxidation theory, metal ions and electrons migrate to the
surface of the metal grain, while oxygen ions move to the bulk. This transport is carried out
by vacancies in the metal oxide structure 16
. If the solid structure contains more metal than
oxygen according to the stoichiometry (a so-called oxygen deficient situation), the formation
of oxygen vacancies is possibly the rate limiting step. These vacancies are formed according
to equation (3). In this equation, V0 is an oxygen vacancy, O(s) is an oxygen atom in the solid
matrix and O2(g) is gaseous oxygen molecule.
O 21O s V O g
2 (3)
Equation (3) describes that if an oxygen gas molecule reacts with the metal, two oxygen
vacancies in the solid matrix are replaced by oxygen atoms. If the oxygen pressure is
increased, the equilibrium shifts to the left and the number of vacancies can decrease.
Because of the decrease in oxygen vacancies, the diffusion through the solid matrix decreases
in case the transport via oxygen vacancies is rate determining. In the some cases with oxygen
deficient materials, the dependency of the diffusion flux inside the solid matrix is with pO2-
1/6. In such a situation, a decrease in kinetics can be observed when the pressure is increased,
while the reactant gas fraction is fixed. During reduction the oxygen has to be transported in
the opposite direction.
If the reactant gas fraction and the oxygen vacancies in the oxygen carrier have influence on
the kinetics, the Arrhenius approach might not be the right approach to describe these
gas/solid reactions at different pressures. García-Labiano et al. proposed to include an
additional term in the equation that is dependent on the total pressure with which the
experiments could be described, equation (2). This can be rewritten using Dalton’s law to an
expression that has a dependency on the reactant gas fraction, x, and the partial pressure of
the reactant as reported in equation (4).
12
5 5
1~ ~
10 10
n nn q n n q q n q
tot totq q n n
tot tot
C pr p p x p x p
R Tp p
(4)
During the experiments with a fixed reactant partial pressure, the gas fraction and the total
pressure was varied, which can be fitted by q. The obtained values for q are in general a
factor 0.2-0.4 larger than the reaction order, n. This results in a negative number for n-q with
an order of magnitude of p-0.2
to p-0.4
. It should be noted that the same trend is observed in the
number of vacancies at different pressures. This indicates that the similar trend is observed in
the above mentioned diffusion flux inside a solid matrix. This indicates that the decrease in
reactivity with increasing pressure might be related with the reduced rate in the formation of
oxygen vacancies at higher pressures.
Concluding, the lumped expression given by García-Labiano et al. can capture the effect of
observed phenomena, but a more detailed study preferably with in situ analysis should be
carried out to elucidate the phenomena prevailing at elevated pressures in more detail. The
experimentally determined pressure effect will be used in the next section to investigate its
implications for pressurized packed-bed CLC applications with relatively large particles.
3.3.Pressure effect in large particles for packed bed applications
An increase in pressure results in a decrease in the reaction rates by about a factor 3 at 20 bar
relative to atmospheric pressure. In this section, the effect of reduced reaction rates and the
extent of internal mass transfer limitations for the relatively large particles used in packed-
bed reactors will be studied in more detail.
For packed-bed applications, larger particles have to be used to avoid an excessive pressure
drop over the reactor, which would reduce the overall process efficiency. In case the particle
size is increased, the influence of internal diffusion limitations could increase, which could
result in a decrease of the effective reaction rates. Experiments have been carried out with
different particle sizes to evaluate the impact on the operation of packed bed reactors. The
NiO/CaAl2O4-particles were available with a larger particle size and have been used in this
part of the investigation.
A particle model has been developed to describe the effective reaction rates inside oxygen
carrier particles considering reaction kinetics, molecular diffusion and Knudsen diffusion
through the pores. In the previous section, it has been shown that the redox kinetics have a
negative pressure dependency. The molecular diffusion coefficient is inversely dependent on
the pressure, whereas the Knudsen diffusion coefficient is independent on pressure. The
overall diffusion coefficient is multiplied by the gas density that linearly increases with the
pressure. Hence, no pressure dependency is expected in the molecular diffusion limited
regime and a positive pressure dependency if Knudsen diffusion is the limiting step. At
atmospheric pressure the Knudsen diffusion is by far the most important limitation for
gas/solid reactions with oxygen carriers 6. So, the pressure might reduce the diffusion
limitations in the particles and increase the effective reaction rates.

13
The measured solid conversion as a function of time during the reduction with CO and the
oxidation of a NiO/CaAl2O4 particle with a relatively large particle size of 1.7 mm is
displayed in Figure 6 by the markers. The operating conditions were at 800 °C and the
reactant partial pressure was fixed, while the total pressure was varied. The same experiments
were simulated with the particle model and the model results are shown by the lines in Figure
6. The experiments are described quite reasonably by the model. The effectiveness factor that
is obtained from the model, increases with increasing pressure, meaning that the reaction
becomes more kinetically controlled. This is caused by two reasons. First, the decrease in the
redox kinetics with increasing pressure and second, the increase in the Knudsen diffusion flux
with increasing pressure due to the density increase.
0 50 100 150 200
0.0
0.2
0.4
0.6
0.8
1.0
a)
2bar
5bar
10bar
20bar
so
lid c
on
ve
rsio
n (
-)
time (s)
pCO
=1 bar
T=800°C
ptot
=model exp
0 50 100 150 200
0.0
0.2
0.4
0.6
0.8
1.0
5bar
10bar
20bar
so
lid c
on
ve
rsio
n (
-)
time (s)
pO2
= 1bar
T=800°C
b)
ptot
=
model exp
Figure 6: Effective reaction rates of NiO/CaAl2O4 for reductions with CO (a) and
oxidations (b) at 800 °C varying the operating pressure and constant reactant partial
pressure (particle size=1.7mm).
The good agreement between the model and the experiments with 1.7 mm particles indicates
that the model can be used for the prediction of the behavior of particles in packed bed
reactors. For the chemical-looping combustion process in packed bed reactors, an operating
pressure of about 20 bar is expected to be optimal 5. As an example the modelled solid
conversion as a function of time is displayed in Figure 7 for a reduction cycle with 50% CO
at 800 °C and 20 bar for different particle diameters. It is shown that the particle size does not

14
have a large effect on the effective reaction rates when smaller than about 5 mm, because the
extent of internal diffusion limitations decreases with increasing pressure. Hence, the fact that
larger particles have to be used to reduce the pressure drop in a packed-bed reactor does not
have a negative overall impact on the process performance.
0 50 100 150 200
0.0
0.2
0.4
0.6
0.8
1.0
ptot
=20bar, T=800°C
xCO
=0.5
so
lid c
on
ve
rsio
n (
-)
time (s)
0.2mm
1.7mm
5mm
10mm
dpart
=
Figure 7: The simulated influence of the particle size on the effective reaction rates for a
reduction of a NiO/CaAl2O4 particle with a 50% CO/CO2 mixture at 800°C and 20 bar.
4. Conclusions
The effect of the pressure on the reaction rates of CuO/Al2O3 and NiO/CaAl2O4 particles as
oxygen carriers for chemical-looping combustion has been investigated using a pressurized
magnetic suspension balance and the experimental results have been compared with a
numerical particle model. From the experimental results it was concluded that the pressure
decreases the solid reaction rate and it is proven that this decrease is kinetically controlled
and can be well described in case a pressure factor with a negative exponent is included in the
kinetic description. A possible explanation for the observed pressure effect is the competition
between gaseous species for adsorption on the oxygen carrier and the number of oxygen
vacancies that decreases with the pressure. Furthermore, it was shown that the solid
conversion was independent on the total pressure and thus only related to the temperature.
For packed bed applications, increasing the pressure has also a positive effect on the overall
reaction rates, because the internal diffusion limitations (controlled by Knudsen diffusion
flux) decrease with increasing pressure. For that reason, still reasonably high reaction rates
can be obtained when using relatively large oxygen carrier particles.
Acknowledgements
The research originating these results has been supported by the CATO-2 program under the
project number WP1.3F2.
15
References
(1) García-Labiano, F.; Adánez, J.; de Diego, L. F.; Gayán, P.; Abad, A.; Cuadrat, A. Energy & Fuels 2005,
24, 1402–1413.
(2) Chauk, S. S.; Agnihotri, R.; Jadhav, R. A.; Misro, S. K.; Fan, L.-S. AIChE J. 2000, 46, 1157–1167.
(3) García-Labiano, F.; Abad, A.; de Diego, L. F.; Gayán, P.; Adánez, J. Chem. Eng. Sci. 2002, 57, 2381–
2393.
(4) Xiao, R.; Chen, L.; Saha, C.; Zhang, S.; Bhattacharya, S. Int. J. Greenh. Gas Control 2012, 10, 363–
373.
(5) Hamers, H. P.; Romano, M. C.; Spallina, V.; Chiesa, P.; Gallucci, F.; Van Sint Annaland, M. Int. J.
Greenh. Gas Control 2014, 28, 65–78.
(6) Noorman, S.; Gallucci, F.; Van Sint Annaland, M.; Kuipers, J. A. M. Chem. Eng. J. 2011, 167, 297–
307.
(7) Hamers, H. P.; Gallucci, F.; Cobden, P. D.; Kimball, E.; van Sint Annaland, M. Appl. Energy 2014, 119,
163–172.
(8) García-Labiano, F.; de Diego, L. F.; Adánez, J.; Abad, A.; Gayán, P. Ind. Eng. Chem. Res. 2004, 43,
8168–8177.
(9) Medrano, J. A.; Hamers, H. P.; Ortiz, M.; Ramirez, A.; Van Sint Annaland, M.; Williams, G.; Gallucci,
F. In 3rd International Conference on Chemical Looping; 2014.
(10) Noorman, S.; Gallucci, F.; Van Sint Annaland, M.; Kuipers, J. A. M. Ind. Eng. Chem. Res. 2010, 49,
9720–9728.
(11) Adánez, J.; de Diego, L. F.; García-Labiano, F.; Gayán, P.; Abad, A.; Palacios, J. M. Energy & Fuels
2004, 18, 371–377.
(12) Baek, J.-I.; Kim, J.-W.; Lee, J. B.; Eom, T. H.; Ryu, J.; Ryu, C. K.; Yi, J. Oil Gas Sci. Technol. – Rev.
d’IFP Energies Nouv. 2011, 66, 223–234.
(13) Atkins, P.; de Paula, J. Atkins’ physical chemistry; 7th ed.; Oxford University Press: New York, 2002;
pp. 977–1012.
(14) Fierro, J. L. G. Metal oxides. Chemistry and applications.; CRC Press, 2006; pp. 215–236.
(15) Shriver, D. F.; Atkins, P. W. Inorganic chemistry; Third edit.; Oxford University Press: Oxford, 1999.
(16) Kofstad, P. Nonstoichiometry, diffusion, and electrical conductivity in binary metal oxides; Wiley-
Interscience: Olso, Norway, 1972.
Nomenclature
b gas solid reactant stoichiometric factor, mol solid/mol gas
[B] inversed diffusion matrix
C concentration, mol/m3
Cp heat capacity, J/kg/K
Di,k diffusivity, m2/s

16
D0 pre-exponential factor for diffusion term, m2/s
[D] diffusion matrix
EA activation energy, J/mol
ED activation energy for the diffusive component, J/mol
k0 pre-exponential factor, mol1-n
s-1
for CuO and mol1-n
m3n-3
s-1
for NiO
kx conversion dependent factor in reaction rate, -
j diffusive mass flux, kg/m2/s
M molar mass, kg/mol
N number of components
n reaction order related to gas phase, -
ni gas flux of component i, kg/m2/s
p pressure, Pa
r particle radius, m
T temperature, K
t time, s
R gas constant, J/mol/K
X solid conversion, -
x gas fraction, -
Greek symbols
ΔHR reaction enthalpy, J/mol
ε porosity, m3/m
3
λ heat dispersion, W/m/K
ν reaction stoichiometric factor (negative for reactants), -
νi diffusion volume of component i, m3/mol
νs stoichiometric factor for solids, mol MeO/mol Me
ρ density, kg/m3
τ tortuosity, -
ω mass fraction, kg/kg
Subscripts
act active
Bin binary
eff effective
g gas
i gas component number
j solid component number
k gas component number
Kn Knudsen
MeO metal oxide
Me metal
mol molecular
n number of gas components
p particle
s solid
tot total
Superscripts
ox in oxidized state