development of a driving anger scale
TRANSCRIPT

Psychological Reports, 1994, 74, 83-91. O Psychological Reports 1994
DEVELOPMENT OF A DRIVING ANGER SCALE ','
JERRY L. DEFFENBACHER, EUGENE R. OETTING, REBEKAH S. LYNCH
Colorado State Univprsity
Summary.-A cluster analysis of responses from more than 1500 college students to 53 potentially angering driving-related situations yielded a 33-item driving anger scale (alpha reliability = .90) with six reliable subscales involving hostile gestures, ille- gal driving, police presence, slow driving, discourtesy, and traffic obstructions. Sub- scales all correlated positively, suggesting a general dimension of driving anger as well as anger related to specific driving-related siruations. Men were more angered by police presence and slow driving whereas women were more angered by illegal behavior and traffic obstructions, but differences compensated so there were no gender differences on total score. A 14-item short form (alpha reliability = .SO) was developed from scores more highly correlated (r = .95) with scores on the long form. Driving anger may have potential value for research on accident prevention and health psychology.
Injury is the leading cause of death for persons between ages 1 and 24 years, with vehicle crashes accounting for more than half of the deaths from unintentional injury (National Safety Council, 1992) and for an estimated $75 billion lost productivity through death and disability (National Highway Traffic Safety Administration, 1987). Some approaches to altering these sta- tistics have focused on improved engineering, e.g., safer car construction, chdd's seat-construction, and placing the tail lights higher so that they are more visible, particularly in heavy traffic at higher speeds. Others are more psychological and educational in nature, e.g., driver's education to improve driving skills and prevention campaigns regarding decreased alcohol consump- tion, increased seatbelt use, and use of designated drivers. There has been, however, relatively little exploration of how emotional and ~ e r s o n a l i t ~ factors may influence driving behavior and accident risk (Frank, Bournan, Cain, & Watts, 1992). This paper explores one personality factor potentially related to drivers' safety; it describes the development of a measure to assess driving anger.
Driving anger was chosen for several reasons. First, anecdotal evidence suggests that i t occurs with enough frequency possibly to account for some of the variance in driving-related health concerns, influencing the safety of the driver and of others. Second, there is a logical rationale for assuming that
'Preparation of this paper was supported, in part, by National Institute on Dru Abuse Grant No. P50 DA07074. The Deffenbacher Driving An er Scale is copyrighted and afl tights are re- served. Researchers may use this scale for researcf pur oses only without further permission from the author. Scientists using the scale are responsibfe for assuring that the research meets American Psychological Association standards for human research. The scale may not be used for employment selection or included as part of materials that are sold without specific written ~ermission of the author. Corres ondence regarding this paper should be sent to Jerry L. Deffenbacher, Ph.D., Depart-
ment o?l'sychology, Colorado State University, Fort Collins, CO 80523.
84 J. L. DEFFENBACHER, ETAL
driving anger may affect safety. The literature on the influence of emotion on performance shows that emotional arousal can influence perception and information processing; this influence could presumably be strong enough to disrupt driving proficiency sufficiently to increase accident risk. That is, an- ger while driving may interfere sufficiently with attention, perception, infor- mation processing, and motor performance to increase the likelihood of an ac- cident directly or indirectly through the increased probability of other risk behaviors. Third, elevated anger may prompt aggressive and other risk-taking behavior (e.g., driving too fast, tailgating, flashing bright lights, aggressive verbal or physical behavior), behaviors that can increase accident risk, and risk of other deleterious behavior such as physical assault between drivers or arguments with passengers. Fourth, a scale assessing driving anger might be helpful to the study of at least three other health-related areas. A propensity to become angry while driving might be related to delayed psychological and health effects such as the postcommute reactions found by Novaco and his colleagues (Novaco, Stokols, Campbell, & Stokols, 1979; Novaco, Stokols, & Milanesi, 1990). A measure of driving anger may also be useful in the study of other aspects of the health and well-being of drivers and their passengers, for example, increases in stress and in negative social interactions while driv- ing. Finally, it would be helpful to have a driving-anger scale to serve as a selection and outcome measure in studies of reduction of driving-related an- ger.
Driving-related anger was conceptualized as a personality trait related to trait anger but a narrower, more situation- or context-bound anger than trait anger. Trait anger (Spielberger, 1988) reflects a broad predisposition to expe- rience anger more frequently and intensely across situations [i.e., the tenden- cy to become more easily angered by affronts, insults, injustices, and frustra- tions, to react with more anger, and to experience more negative physical, social, vocational, and psychological consequences (Deffenbacher, 1992)l. Driving anger was defined as more frequent and intense anger while operat- ing a motor vehicle. By analogy to anxiety, there is a general or trait anxiety, but there are also context-specific anxieties such as test or speech anxieties. While correlated with trait anxiety, these context-specific anxieties are more predictive of emotional responses and behaviors within these specific con- texts. Driving anger is like the latter; it is the extent to which anger is ex- perienced in driving-related contexts. Given that little is known about driv- ing anger, we generated a large, diverse item pool of driving contexts that might arouse anger. Those high in driving anger would be expected to be- come angry more frequently because more of these situations arouse anger and to experience a greater intensity of anger in these situations.
METHOD Subjects were 1526 (724 men, 802 women) incoming freshmen (modal

DRIVING ANGER 85
age = 18) at Colorado State University, a land-grant university of over 19,000 students. Fifty-three common, potentially provocative situations were devel- oped by interviewing faculty and students about the things that angered them while driving. Subjects were asked to imagine that each situation de- scribed was actually happening to them and then to rate the amount of anger that wodd be provoked. Ratings were made on a 5-point scale in Likert for- mat (1 = not at all; 2 = a little; 3 = some; 4 = much; 5 = very much) according to the amount of anger elicited. The driving anger items were included in a set of questionnaires which were completed in large groups during freshman orientation.
RESULTS Responses to the 53 items were subjected to a TRYSYS key cluster-vari-
able analysis (Dean & Winters, 1991; Tryon & Bailey, 1966). The cluster analysis resulted in six reliable clusters (see Table 1). Based on item content, the clusters were labeled as (1) Hostile Gestures (another driver signals anger at or displeasure with driver), (2) Illegal Driving (another driver breaks com- mon traffic laws), (3) Police Presence (police present in a driving situation), (4) Slow Driving (another driver or pedestrian impedes traffic flow), (5) Dis- courtesy (others engage in discourteous, as opposed to illegal, behavior), and (6) Traffic Obstructions (events, other than another's slow driving, that frus- trate or obstruct the driver, e.g., traffic jams and road construction). Item- to-total-scale score correlations are also presented in Table 1.
TABLE 1 DRIVING ANGER SCALE ITEMS
Item by Cluster Corrected Corrected Item/Total r Item/Total r Full Scale Short Scale
Cluster 1 Hostile Gestures 21. Someone makes an obscene gesture toward you about
your driving." .39 .39 24. Someone honks at you about your driving." .47 .47 27. Someone yells at you about your driving. .42
Cluster 2 Illegal Driving 2. Someone is driving too fast for the road conditions. .12 6. Someone is weaving in and out of traffic.* .28 .23
13. Someone runs a red light or stop sign.* .23 .19 25. Someone is driving way over the speed limit. .17
Cluster 3 Police Presence 11. You see a police car watchng traffic from a hidden posi-
tion. .41 16. You pass a radar speed trap." .46 .42
(continued on next page)
'Short scale items; the number before the item reflects the number in the item sequence in the long scale. Note: see Footnote 1.

86 J. L. DEFFENBACHER, ETAL.
TABLE 1 (CONT'D) D ~ G ANGER SCALE ITEMS
Item by Cluster Corrected Corrected Item/Total r Item/Total r F d Scale Short Scale
29. A police officer pulls you over.* 23. A police car is driving in traffic close to you.
Cluster 4 Slow Driving
1. Someone in front of you does not starc up when the light turns green.
3. A edestrian walks slowly across the middle of the street sfowing you.
4. Someone is driving too slowly in the passing lane holding up traffic.
9. Someone is driving slower than reasonable for the traffic flow.
10. A slow vehicle on a mountain road will not pull over and let people by.
18. Someone is slow in parking and holding up traffic.*
Cluster 5 Discourtesy 5. Someone is driving right up on your back bumper. 7. Someone cuts in right in front of you on the freeway. 8. Someone cuts in and takes the parking spot you have
been waiting for. 12. Someone backs right out in front of you without look-
ing* - 14. Someone coming toward you does not dim their head-
lights at night. 15. At night someone is driving right behind you with bright
lights on. 17. Someone speeds up when you try to pass them.* 20. Someone pulls right in front of you when there is no one
behind you. 28. A bicyclist is riding in the middle of the lane and slow-
ing traffic.*
Cluster 6 Traffic Obstructions 19. You are smck in a traffic jam.' 22. You hit a deep pothole that was not marked. 26. You are driving behind a truck which has material flap-
ping around in the back. 30. You are driving behind a vehicle that is smoking badly or
giving off diesel fumes. 31. A truck kicks up sand or gravel on the car you are driv-
ing.* .58 .55 32. You are driving behind a large truck and you cannot see
around it.* .52 .46 33. You encounter road construction and detours. .48
*Short scale items; the number before the item reflects the number in the item sequence in the long scale. Note: see Footnote 1.
The first step toward constructing a driving anger scale was to select the optimal subset of items that would tap each of these separate sources of vari-

DRIVING ANGER 8 7
ance and, at the same time, contribute to an over-all driving-anger score. Items were selected following the application of six criteria, which were (1) substantial oblique factor coefficients with item clusters, (2) adequate cor- rected item correlations with item clusters, (3) a positive corrected correla- tion with total scale score, (4) similar augmented coordinates in at least three dimensions of the six-dimensional space determined by the clusters (i.e., rigid rotation on all plotted points), (5) item elimination if items had com- rnunalities < .20, and (6) item elimination if items did not contribute addi- tional variance to a cluster score and the total score.
TABLE 2 DRIVING ANGER: PEARSON CORRELATIONS OF ITEMS WITH SUBSCALES AND TOTAL SCALE
Cluster Subscale Subscale Alpha Item Oblique Factor Average r Reliability Number Coefficient With Cluster'
1. Hostile Gestures .87 21 .77 .64 24 .82 .68 27 .90 .74
2. Illegal Driving .80 2 .67 .44 6 .70 .46
13 .54 .36 25 .72 .47
3. Police Presence .79 11 .74 .51 16 .75 .5 1 29 .63 .43 23 .60 .41
4. Slow Driving .81 1 .59 .37 3 .56 .36 4 .69 .44 9 .72 .46
10 .58 .37 18 .67 .42
5. Discourtesy .81 5 .53 .30 7 .53 .30 8 .56 .31
12 .62 .35 14 .57 .32 15 .65 .36 17 .56 .3 1 20 .54 .30 28 .47 .26
6. Traffic Obstructions .78 19 .51 .29 22 .52 .30 26 .48 .27 30 .56 .32 3 1 .67 .39 32 .66 .37 33 .55 .31
"Computed with cornmunalities in the diagonals.

88 J. L. DEFFENBACHER, ETAL.
Cluster alpha reliabilities, oblique factor coefficients, and average item correlation with the resulting clusters are presented in Table 2. Subscale reliabilities ranged from .78 to .87, yielding a 33-item driving anger scale with six subscales. Next, a short form of the driving anger scale was devel- oped, i.e., the shortest possible scale that had adequate reliability and as- sessed the same sources of variance as the longer scale. Items were selected from each subscale that were highly correlated with that subscale and that had substantial correlations with the total score on the long form. The result was a 14-item scale (see Table 1). The short driving anger scale has an alpha reliability of .80 and a correlation of .95 with scores on the full scale.
Table 3 presents the correlations of full scale clusters with each other and with the full-scale total score and the short-scale total score. As ex-
TABLE 3 PEARSON CORRELATIONS OF CLUSTER SCORES AND TOTAL SCORES
Cluster Subscale 1 2 3 4 5 6 7 8
1. Hostile Gestures .14 .24 .24 .35 .36 .59 .54 2. Illegal Driving - 0 -.04 .25 .26 .32 .34 3. Police Presence .50 .38 .47 .65 .66 4. Slow Driving .59 .52 .66 .73 5. Discourtesy .60 .76 .82 6. Traffic Obstructions .79 .83 7. Short Scale Total .95 8. Long Scale Total
pected, since the subscales were generated through a cluster analysis, they show considerable independence. The six subscales also show generally posi- tive correlations with each other, suggesting that there is a general propensity for driving anger as well as somewhat independent reactions to different types of situations. The correlations of each cluster score with the short scale
TABLE 4 MEANS AND STANDARD DEVIATIONS BY GENDER FOR CLUSTER AND TOTAL SCORES
Cluster Subscale Gender t q2t Men Women
M SD M S D
1. Hostile Gestures 9.6 3.6 9.4 3.2 2. Illegal Driving 10.2 3.5 11.6 3.5 3. Police Presence 12.5 4.1 11.5 3.9 4. Slow Driving 19.6 4.6 18.2 4.2 5. Discourtesy 34.4 6.0 34.9 5.4 6. Traffic Obstructions 22.5 5.1 23.5 4.9 7. Short Scale Total 46.9 8.9 47.2 8.3 8. Long Scale Total 108.8 18.4 109.2 17.3
* p < ,001. tq2 proportion of variance accounted for by gender differences.
DRIVING ANGER 89
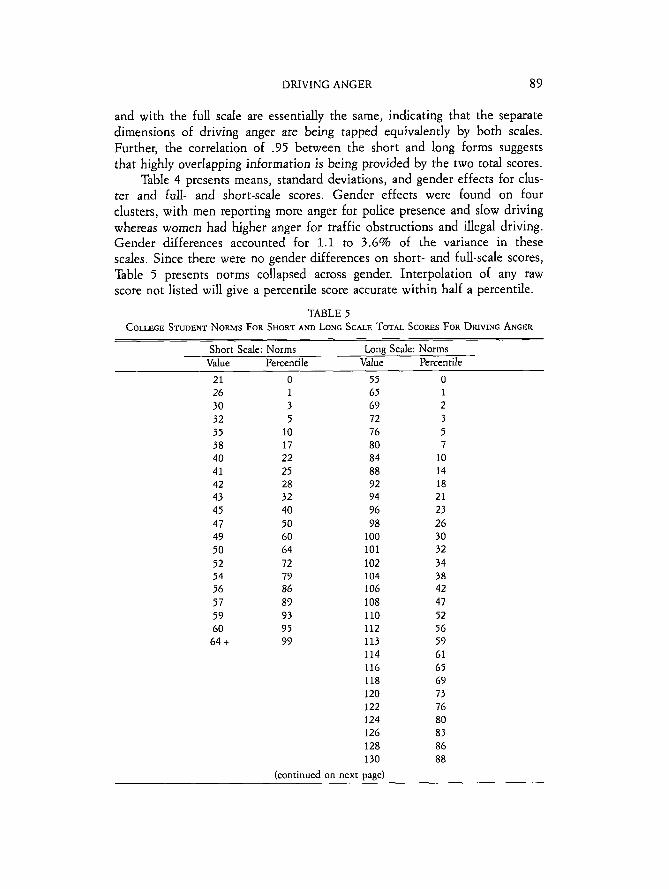
and with the f d scale are essentially the same, indicating that the separate dimensions of driving anger are being tapped equivalently by both scales. Further, the correlation of .95 between the short and long forms suggests that highly overlapping information is being provided by the two total scores.
Table 4 presents means, standard deviations, and gender effects for clus- ter and full- and short-scale scores. Gender effects were found on four clusters, with men reporting more anger for police presence and slow driving whereas women had higher anger for traffic obstructions and illegal driving. Gender differences accounted for 1.1 to 3.6% of the variance in these scales. Since there were no gender differences on short- and full-scale scores, Table 5 presents norms collapsed across gender. Interpolation of any raw score not listed will give a percentile score accurate within half a percentile.
TABLE 5 COLLEGE STLIDENT NORMS FOR SHORT AND LONG SCALE TOTAL SCORES FOR DRIVING ANGER
Short Scale: Norms Long Scale: Norms Value Percentile Value Percentile
21 0 55 0 26 1 65 1 30 3 69 2 32 5 72 3 35 10 76 5 3 8 17 80 7 40 22 84 10 41 25 88 14 42 28 92 18 43 32 94 21 45 40 96 23 4 7 50 98 26 49 60 100 30 50 64 101 32 5 2 72 102 34 54 79 104 38 56 86 106 42 5 7 89 108 47 59 93 110 52 60 95 112 56 64 + 99 113 59
114 61 116 65 118 69 120 73 122 76 124 80 126 83 128 86 130 88
(continued on next page)

90 J. L. DEFFENBACHER, ETAL.
TABLE 5 (CONT'D) COLLEGE STUDENT NORNIS FOR SHORT A N D LONG SCALE TOTAL SCORES FOR DRWING ANGER
Shorc Scale: Norms Long Scale: Norms Value Percentile Value Percentile
DISCUSSION The results indicate that the Driving Anger Scale provides a measure of
a personal trait, driving anger, that should be useful for research on health risk. A 33-item scale with six subscales and a 14-item short form were con- structed from an original pool of 53 items. The full- and short-scale reli- abilities were .90 and .80, respectively, indicating that both forms provide an in terndy consistent measure of the general trait, driving anger. The cor- relation between the short and long forms was .95, indicating that either form may be used when only a total score for driving anger is needed.
The subscales on the long form were intercorrelated, but the cluster analyses showed that the subscales assess different sources of variance. Cor- relations between subscale scores and total scores (Table 3) show that the to- tal scores on the long and short scales have essentially the same loadings on the different dimensions of driving anger. The short scale, however, does not have enough items to measure the individual dimensions reliably. While the over-all level of driving anger is likely to be the most important predictor of risks that derive from driving anger, there may be patterns of subscales that are predictive of different consequences of driving anger. For example, there may be subscale differences between adolescent and middle-age male drivers, e.g., middle-age drivers might be less angered by police presence or hostile gestures. If these differences are likely to be important, then the long scale should be used.
There were gender differences in the subscales. Although the differences are significant, they are not large, accounting for only a small proportion of the variance (see Table 4). Women are slightly more angry about things that are likely to interfere with their driving, for example, illegal behaviors on the part of other drivers such as speeding and running stop signs, and traffic ob- structions such as road repairs and vehicles that interfere with traffic flow. Men may be slightly more angry about authority, such as the presence of po- lice on the road, and about slow driving, which might make them more vulnerable to impulsive, anger-motivated behavior such as passing the per-

DRIVING ANGER 91
ceived offender under unsafe conditions. These small gender differences, however, compensate for each other so that men and women do not differ in total driving anger scores.
The development of a reliable scale to assess driving anger is only the first step toward exploring anger as a person-related variable in accidents or in other driving risks. It should now be possible to assess how driving anger relates to driving behaviors such as tailgating, speeding, and dangerous be- haviors in relation to traffic obstructions (passing on blind curves, driving around barriers, etc.). I n further studies, groups with high and low driving anger can be identified and studied in laboratory driving simulations to as- sess whether their information processing and driving skills are influenced differentially under provocative and nonprovocative driving situations. Driv- ing anger can now also be examined as a potential precursor for health risks that derive from conditions such as increased fatigue, stress, and elevated blood pressure. High trait anger has been shown to relate to increased alco- hol consumption and to behavior problems related to drinking (Liebsohn, 1992), and, perhaps, driving anger may prove to be an important factor in examining how alcohol interacts with driving and driving safety. If these studies indicate that driving anger does create risks, the driving-anger scale should provide a measure for testing efficacy of interventions aimed at re- ducing such anger. In sum, it appears that the scales developed in this study may advance these types of research by providing a reliable measure of the over-all trait of driving anger and measures of several of the separate compo- nents that enter into over-all driving anger.
REFERENCES
DEAN, R. B., & WINTERS, C. (1991) TRYSYPM, user's manual. Chicago, IL: d' Associates. DEFFENBACHER, J. L. (1992) Trait anger: theory, findings, and implications. In C. D. Spiel-
ber er & J N Butcher (Eds.), Advances in personality assessment. Vol. 9. Hillsdale, NJ: ~ r l % a u m . Pp. i77-201.
FRANK, R. G., BOUMAN, D. E., Cnm, K., & WAT~S, C. (1992) Primary prevention of cata- strophic injury. American Psychologist, 47, 1045-1049.
LIEBSOHN, M. T. (1992) The effects of anger on alcohol-related consequences. Unpublished doctoral dissertation, Colorado State Univer., Fort Collins, CO.
NATIONAL HIGHWAY TRAFFIC SAFETY ADMINISTRATION. (1987) The economic cost to socieo of motor vehicle accidents. (Tech. Rep. No. DOT H S 809-195) Washington, DC: Depart- ment of Transportation.
NATIONAL SAFETY COUNCIL. (1992) Accident facts. Chicago, IL: Author. N o v ~ c o , R. W., STOKOLS, D., CAMPBELL, J., & STOKOLS, J. (1979) Transportation, stress, and
community psychology. American Journal of Communiiy Psychology, 7 , 361-380. N o v ~ c o , R. W., STOKOLS, D., & ~ N E S I , L. (1990) Objective and subjective dimensions of
travel impedance as determinants of commuting stress. American Journal of Communio Psychology, 18, 231-257.
S P ~ B E R G E R , C. D. (1988) State-Trait Anger Expression Inventory: professional manual. (Res. ed.) Odessa, I:L Ps)chological Assessment Resources.
TRYON, R. C., & BAILEY, D. E. (1966) The BC TRY computer system of cluster and factor analysis. Multivariate Behavioral Research, 1, 95-11 1.
Accepted November 1, 1993.