development of 1- 4km resolution data...
TRANSCRIPT

© Crown copyright 2005 Page 1
DEVELOPMENT OF 1- 4KM RESOLUTION DATA ASSIMILATION
FOR NOWCASTING AT THE MET OFFICESue Ballard, November 2005
Z. Li, M. Dixon, S.Swarbrick, O.Stiller and H. Lean
Met Office, JCMM, Reading University + others

© Crown copyright 2005 Page 2
Background
Aim: to replace nowcasting system Hazardous weather , especially flood risk
Boscastle, North Cornwall16th August 2004 Estimated Cost £500million
Data Assimilation vital for these short period forecasts
4km UK 2005 short period 24-36 hours1.5km UK 2006 short period 24-36 hours1-1.5km ~ 2008-2010 0 to 6 hours hourly
© Crown copyright 2005 Page 3
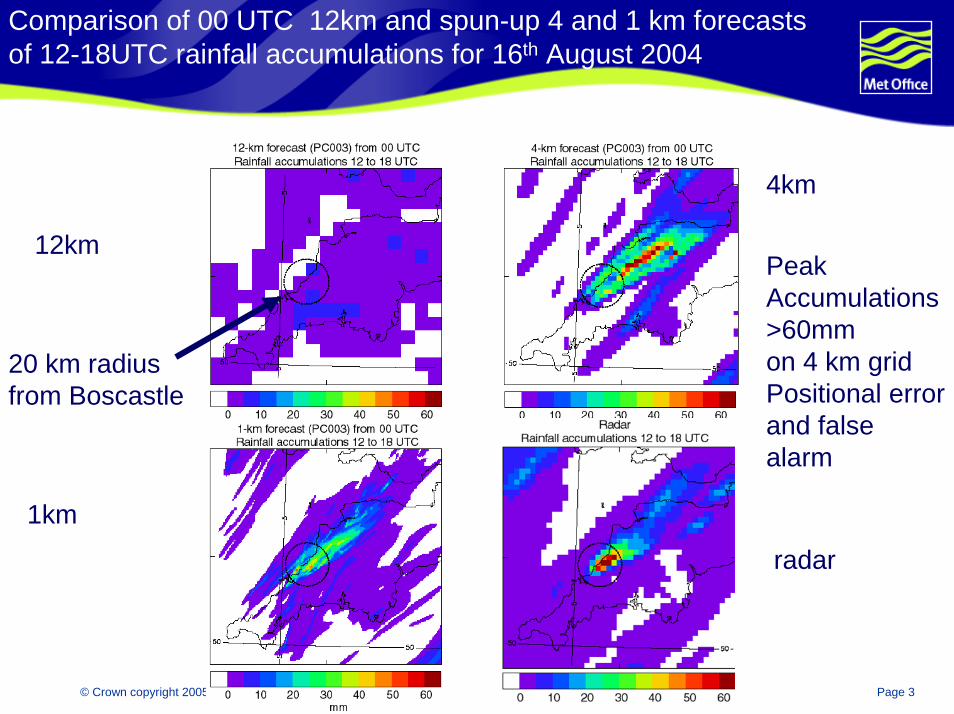
Comparison of 00 UTC 12km and spun-up 4 and 1 km forecasts of 12-18UTC rainfall accumulations for 16th August 2004
4km
12kmPeak Accumulations >60mmon 4 km gridPositional error and false alarm
20 km radius from Boscastle
1km
radar

© Crown copyright 2005 Page 4
High Resolution Trial Model
1 km76 levelsResolved convection
4 km38 levelsMass-limited convection

© Crown copyright 2005 Page 5
Current HRTM Assimilation Options
12 km 3D-Var Data Assimilation With or without moisture and Latent Heat Nudging (LHN) using AC scheme
(referred to as MOPS data – moisture observationprocessing system)
i.e. spin up 4km, 1km from 12km T+1 each cycle.
4km 3D-VAR with continuous cycles with or without MOPS
1km with nudged reconfigured 4km increments using IAUWith or without LHN and moisture nudging using AC scheme
IAU – increments output from 3D-Var and fixed over time windowAC scheme – increments depend on latest model fields so vary with timestep through weighting factor and model evolution/impact of data

© Crown copyright 2005 Page 6
Moisture Observation Preprocessing
Surface reports
Satellite data Radar data
Precipitation5km smoothed to 15km HourlyTesting 15min
Nudge model state
3D Cloud fraction
3D Relative humidity
Resolution: 15km, 3 hours
(Testing 1 hour)

© Crown copyright 2005 Page 7
3D-Var system including MOPS RH and LH nudging via AC scheme
T-3 T-1 T+0 T+1
AC scheme/UM3D cloud fractionSurface rainrate
IAU3 hour f/c: background Hourly ModelOb
Nudging RH & Latent heat
T+2T-2 T+3Next analysisPrevious analysis
Conventionalobservations
3D-Var (FGAT)
Obs window

© Crown copyright 2005 Page 8
Period over which observations and analysis increments are nudged into Unified Model
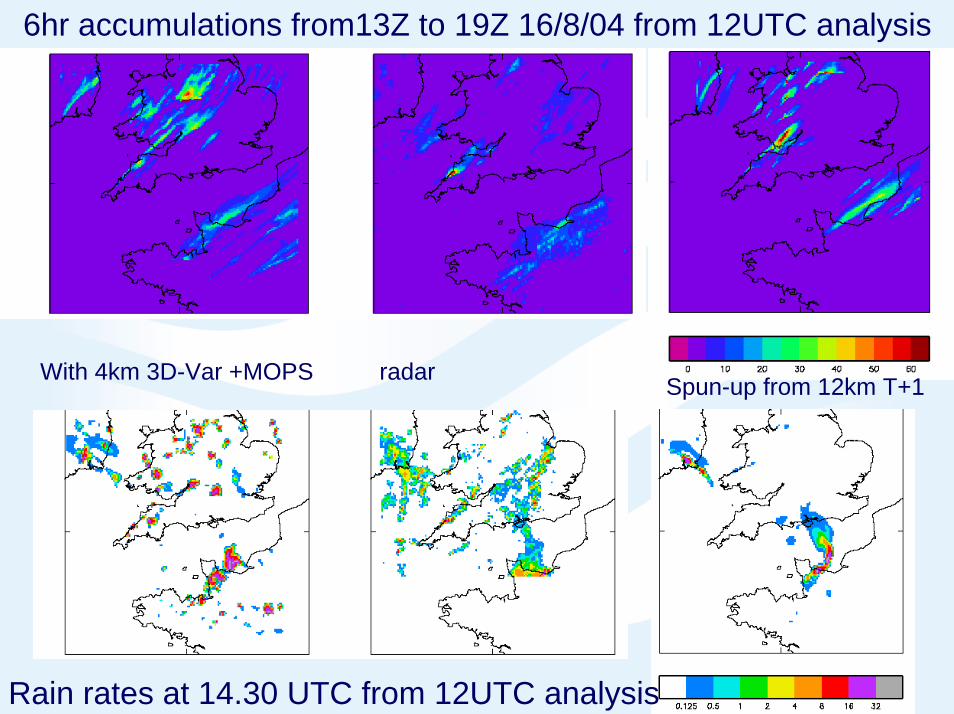
6hr accumulations from13Z to 19Z 16/8/04 from 12UTC analysis
Rain rates at 14.30 UTC from 12UTC analysis
Spun-up from 12km T+1With 4km 3D-Var +MOPS radar
© Crown copyright 2005 Page 10
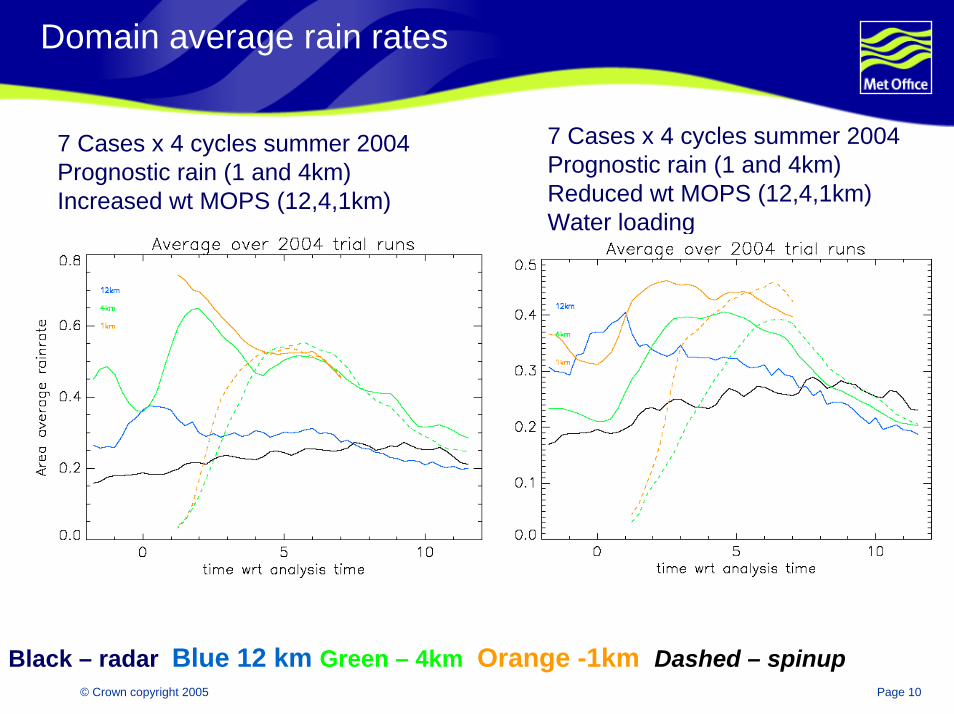
Domain average rain rates
7 Cases x 4 cycles summer 2004Prognostic rain (1 and 4km)Reduced wt MOPS (12,4,1km)Water loading
7 Cases x 4 cycles summer 2004Prognostic rain (1 and 4km)Increased wt MOPS (12,4,1km)
Black – radar Blue 12 km Green – 4km Orange -1km Dashed – spinup

© Crown copyright 2005 Page 11
T+2 Forecast precipitation rate for 20UTC 27April 2004
WaterLoading+ReducedMOPS wts
12km 4km 1km radar
© Crown copyright 2005 Page 12
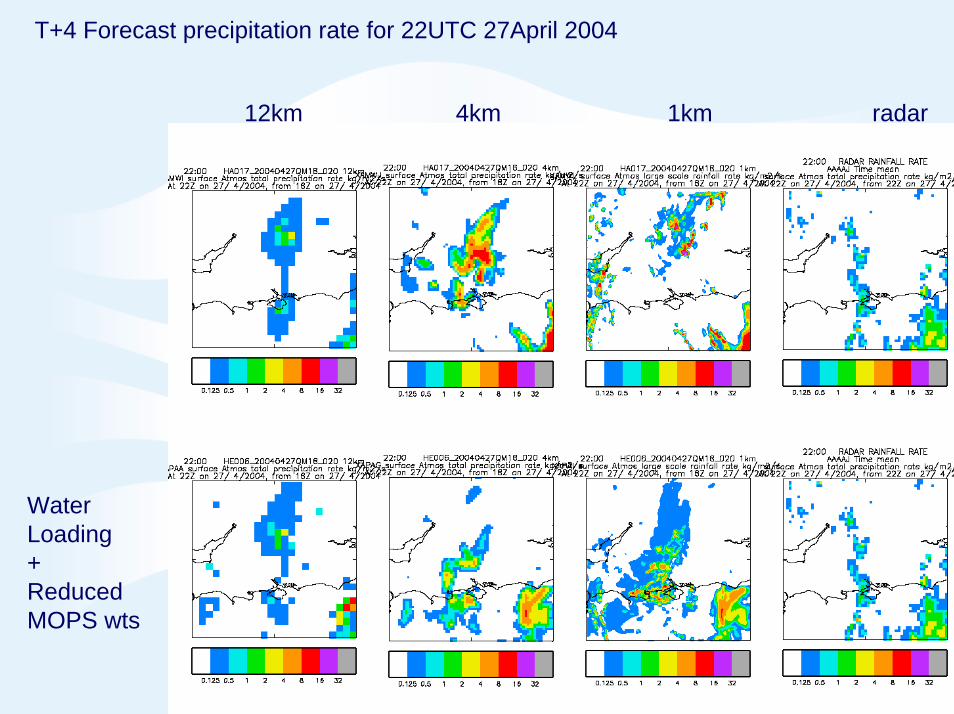
T+4 Forecast precipitation rate for 22UTC 27April 2004
12km 4km 1km radar
WaterLoading+ReducedMOPS wts
© Crown copyright 2005 Page 13
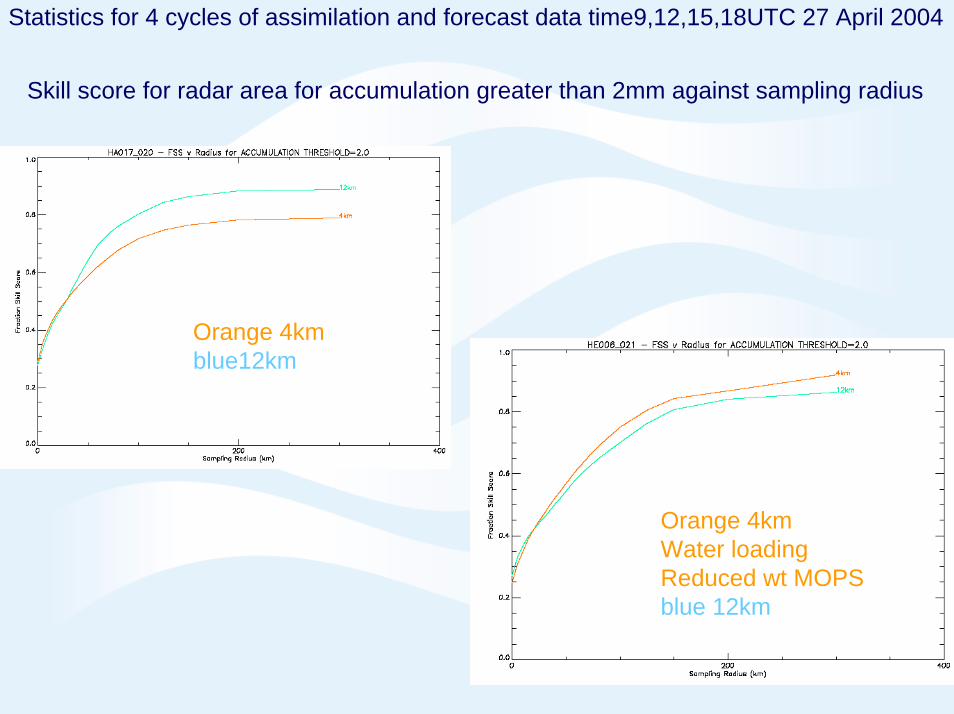
Statistics for 4 cycles of assimilation and forecast data time9,12,15,18UTC 27 April 2004
Skill score for radar area for accumulation greater than 2mm against sampling radius
Orange 4kmblue12km
Orange 4kmWater loadingReduced wt MOPSblue 12km

© Crown copyright 2005 Page 14
Impact of hourly cloud data T+2
Radar
3-hourlydata
Hourlydata
No MOPS

© Crown copyright 2005 Page 15
Scores for 1 hour accums 50km radius 1mm threshold
Blue 12kmGreen 4kmRed 1km
Solid AssimDotted spinup

© Crown copyright 2005 Page 16
Scores for 6 hour accums 1% threshold
Blue 12kmGreen 4kmRed 1km
Solid AssimDotted spinup
© Crown copyright 2005 Page 17
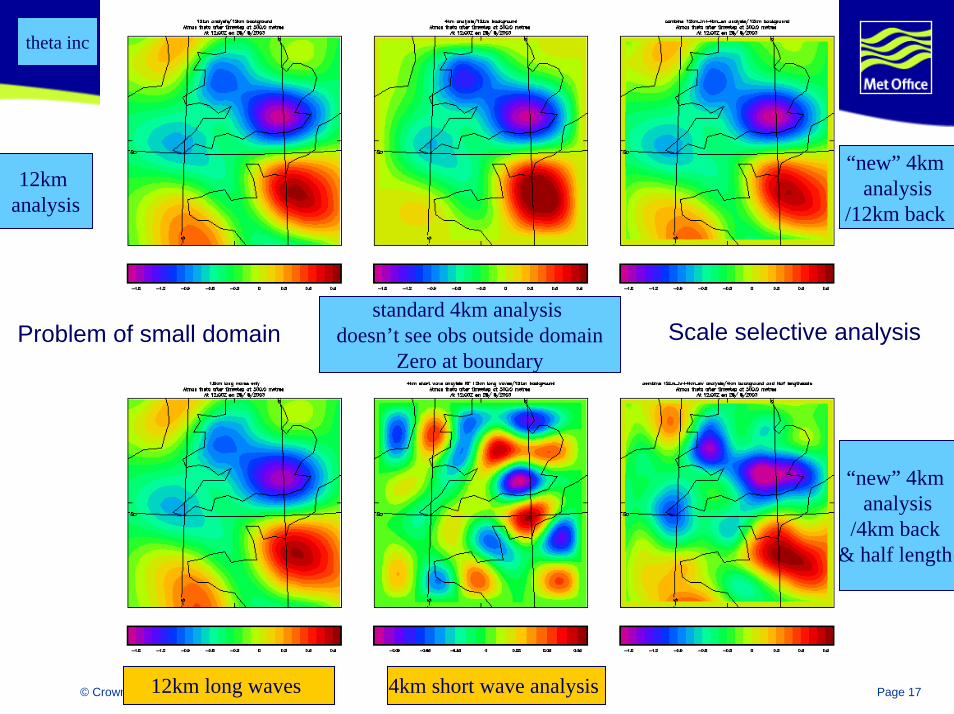
theta inc
12km analysis
“new” 4km analysis
/12km back
“new” 4km analysis
/4km back & half length
standard 4km analysis doesn’t see obs outside domain
Zero at boundary
4km short wave analysis 12km long waves
Problem of small domain Scale selective analysis
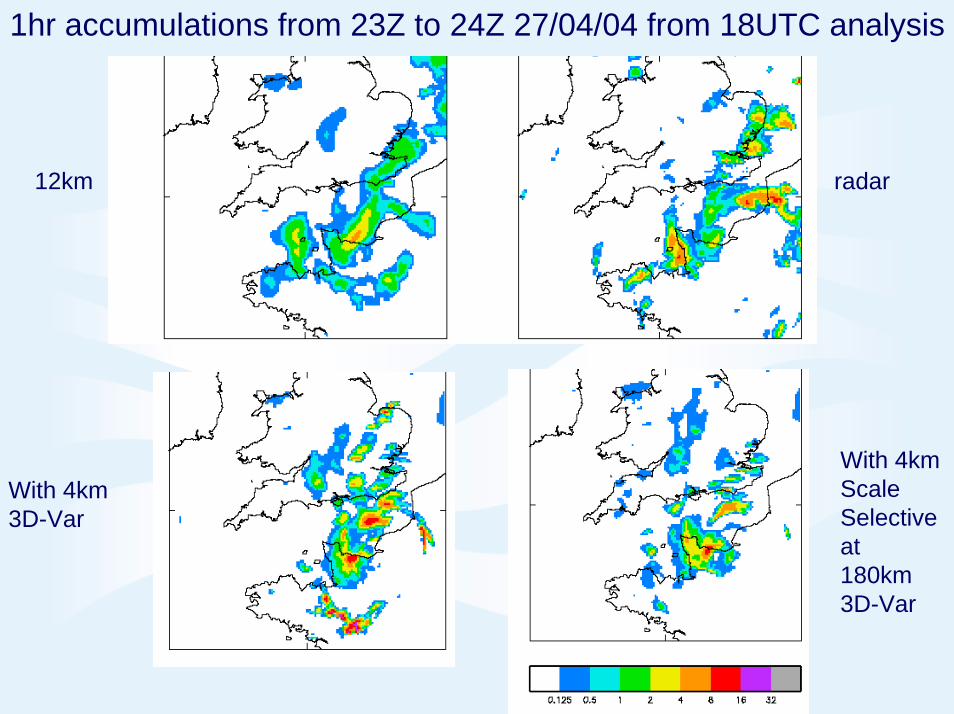
1hr accumulations from 23Z to 24Z 27/04/04 from 18UTC analysis
12km radar
With 4kmScale Selectiveat 180km 3D-Var
With 4km 3D-Var

Observed radial wind compared with radial wind diagnosed from 1km model
Domain radius 90km, centred on Chilbolton

© Crown copyright 2005 Page 20
Impact of S-band radar radial wind datav-component of velocity at 410m
12km analysis 4kmstandard
Scale selectiveRadar dataIn 12km and 4km
ScaleSelectiveRadar in 4km only

© Crown copyright 2005 Page 21
Conclusions
Need 1-4km to capture small scale severe eventsNeed DA to overcome spin-up of explicit convection
However long range forecasts can be better than short range
MOPS RH & LHN improves locationsAmounts sensitive to model formulation, weights, frequency of dataNeeds further development but ideally want to use assimilation of cloud and precipitation in 3D-Var and 4D-Var
Need to combine synoptic scale and convective analysisNeed improved background error covariancesNeed to move towards full analysis for 1km model

© Crown copyright 2005 Page 22
Plans - ongoing
4kmMOPS - Hourly cloud, 15min precipitation, filtering, weightsBackground errors – lagged/unlagged, lengthscalesOperational doppler radar winds – superobbing, errors, monitoring
Salford Univ and COST 731
Observations – Satellite Applications + Radar Group + ObsRadar reflectivity – observation operators, compare model and obs
Reading UnivGeostationary imagery – low level moisture, cloud topRadar refractivity – low level moisture (Reading Univ)Wind profiler humidity, ground based radiometer, cloud radar
Development of 3D-Var and 4D-Var for direct assimilation of cloud and precipitation
3D-Var MOPS cloud cover, precipitation rate – currently not resourcedCloudy radiance, PF physics, infrastructure

© Crown copyright 2005 Page 23
Plans - Future
Aim: 1hrly forecasts 0-6hours 1-1.5km NOWCASTSalso 36 hour UK forecasts ?
Need to move towards full analysis for 1km modelIdeally want 4D-Var and Ensembles
- Start with 3D-Var +MOPSneed to build on experience with 4km and NAEUse reduced vertical resolution (and horizontal?) for analysis?High resolution dataBalance and background errorsVariable resolution modelSurface analysis – SST and soil mositure
© Crown copyright 2005 Page 24
Other Collaborations
DARC (Reading University)PhD – combining small scale and large scale in LAM analysisPost-doc/lecturer – surface friction in control variablePost-doc/lecturer – non-linear evolution of Gaussian pdfsPost-doc – balance at convective scale Post-doc – wavelet transforms
EPSRC project – Peter Clark, Surrey, Aston

© Crown copyright 2005 Page 25
Current/planned data sources include:
Surface observations : now SYNOPs hourly, 69 stations every 10mins, full network every 10 mins by 2006-2009
AMDAR : now every 3 hours take off and landing can request hourly at extra cost
Geostationary imagery: every 15mins
Radar VAD profile: every hour user requirement, every 15mins potentially
Radar radial doppler winds: every 15mins, 5 elevations range 125km now 2 radars
Rainfall rate analysis : now every 15minutes 12 radars potentially every 5 mins
Radar reflectivity : 12 radars every 5 mins , 5 elevations range 255km
Cloud cover analysis: every hour (potentially every 15mins)
Wind profiler: 5 sites every 30mins (poss 15mins)
GPS: every 15mins 70-150 sites in GB end 2006
Integrated system – wind profiler, microwave radiometer (1+2), cloud radar, ceilometer, GPS
© Crown copyright 2005 Page 26
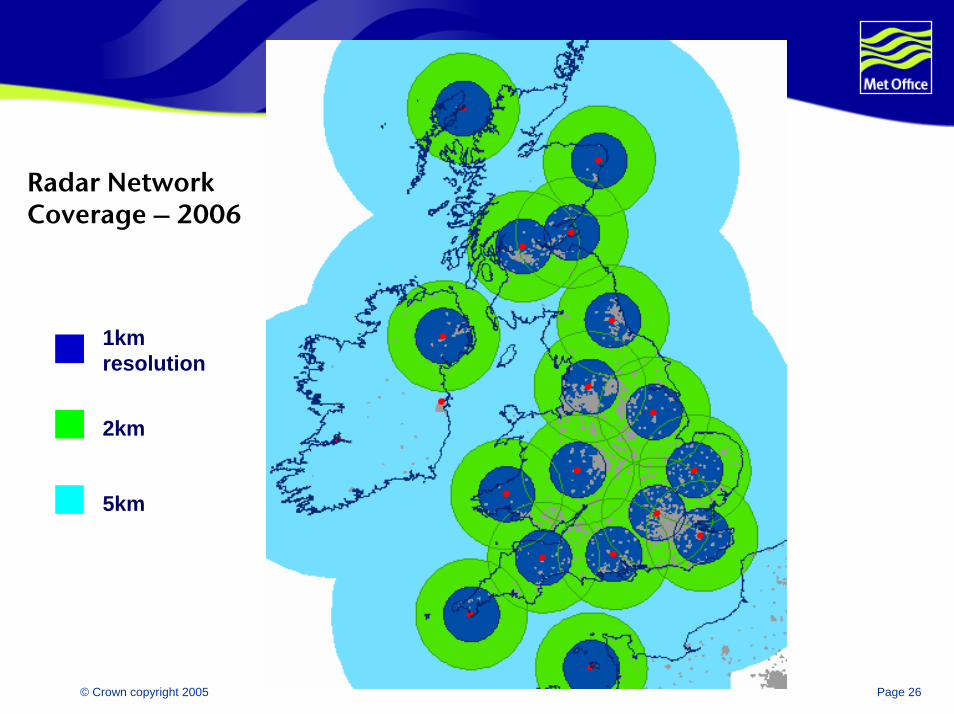
Radar Network Coverage – 2006
1km resolution
2km
5km

© Crown copyright 2005 Page 27
Coverage in SE England

© Crown copyright 2005 Page 28
Questions & Answers