developing water quality criteria for suspended … · developing water quality criteria. ......
TRANSCRIPT
DEVELOPING WATER QUALITY CRITERIA FORSUSPENDED AND BEDDED SEDIMENTS (SABS)
Potential Approaches
A U.S. EPA Science Advisory Board Consultation
DRAFTDRAFT
US EPAOffice of Water
Office of Science and Technology
August 2003

2
TABLE OF CONTENTS:
ACKNOWLEDGMENTS 4
GLOSSARY OF TERMS 5
WHAT IS THE PURPOSE OF THIS DOCUMENT? 8
BACKGROUND 8
– What Are Suspended and Bedded Sediments (SABS)? 8
– What Are the Impacts of SABS? 9
– What Are Water Quality Standards? 14
– What Are Water Quality Criteria? 14
WATER QUALITY CRITERIA FOR SABS– CURRENT STATUS 15
– What Has EPA Issued for Criteria in the Past? 15
– Other Recommended Values 16
– What Are States and Tribes Currently Doing? 16
– Turbidity 18
– Suspended Solids 20
– Biological and Other Criteria as Measures of SABS 20
– Narrative Criteria 21
--Recent Efforts by States to Develop New SABS Criteria 21
Idaho 21
New Mexico 23
– What Is Being Done Elsewhere in the World? 26
Canada 26

3
Australia and New Zealand 27
European Union (EU) 28
POTENTIAL APPROACHES FOR IMPROVED SABS CRITERIA 29
1. Toxicological Dose-Response Approach 31
2. Relative Bed Stability and Sedimentation Approach 32
3. Conditional Probability Approach to Establishing Thresholds 36
4. State-by-State Reference Condition Criteria Derivation Approach 37
5. Fluvial Geomorphic Approach 42
6. Water Body Use Functional Approach 44
7. Use of New State/International Approaches 46
8. Combinations/Synthesis of Above Approaches 46
CONCLUSIONS 47
REFERENCES CITED 51
APPENDICES 57

4
ACKNOWLEDGMENTS:
This paper has been compiled by William Swietlik of the Office of Water, Office ofScience and Technology (OST), Health and Ecological Criteria Division (HECD) at EPAHeadquarters with contributions and help from members of the workgroup listed below. Allinquiries about this paper should be directed to Mr. Swietlik by e-mail [email protected], or by phone at (202) 566-1129.
A group of EPA professionals has been assembled to work on Suspended and BeddedSediment Criteria. The group consists of the following individuals:
William Swietlik, HECD-OST-OW, HQWalter Berry, ORD-NHEERL, NarragansettThomas Gardner, SHPD-OST-OW, HQBrian Hill, ORD-NHEERL, DuluthMitra Jha, EPA Region 8, DenverPhil Kaufmann, ORD-NHEERL, CorvallisBrian Melzian, ORD-NHEERL, NarragansettDouglas Norton, AWPD-OWOW-OW, HQJohn Paul, ORD-NHEERL, RTPNorman Rubinstein, ORD-NHEERL, NarragansettRobert Shippen, SHPD-OST-OW, HQRobert Spehar, ORD-NHEERL, Duluth
Acknowledgment goes to each of these individuals for the contributions they have madeto this discussion paper and to the better understanding of SABS and possible approaches todeveloping water quality criteria.
Acknowledgment is also given to Michael Paul and Benjamin Jessup of Tetra Tech, Inc.,Ownings Mills, Maryland, (one of EPA’s contractors) for their contributions.

5
GLOSSARY OF TERMS:
Aquatic Life Use- a use designation in State/Tribal water quality standards that generallyprovides for survival and reproduction of desirable fish, shellfish, and other aquaticorganisms; classifications specified in state water quality standards relating to the level ofprotection afforded to the resident biological community.
Bedload- Sediment which moves along and is in contact with stream or river bottom.
Clean sediments- Suspended and bedded sediments that are not contaminated with toxicchemicals.
Contaminated sediments- Deposited or accumulated sediments, typically on the bottomof a water body, that contain contaminants. These may or may not be toxic as revealedby a whole sediment toxicity test, or as predicted by equilibrium partitioning.
1Criteria- Under section 304(a) of the Clean Water Act, EPA publishes scientificinformation regarding concentrations of specific chemicals or levels of parameters inwater that protect aquatic life and human health.
2Criteria- Levels of individual pollutants, or water quality characteristics, ordescriptions of conditions of a water body, adopted into State water quality standardsthat, if met, will generally protect the designated use of the water. In many cases, Statesmake use of the criteria developed by EPA under definition #1 above.
Designated Uses- those uses specified in State/Tribal water quality standards for eachwater body or segment whether or not they are being attained. Sometimes referred to asBeneficial Uses, i.e., desirable uses that water quality should support. Examples aredrinking water supply, primary contact recreation (such as swimming), and aquatic lifesupport.
Embeddedness- the amount of silt and sediment deposited in and around the largergravel, cobble and boulders in the bottom of a stream or river.
Fines- fine particulate material such as silt and clay particles typically of less than .85mm diameter.
Jackson turbidity units (JTU)- An alternative way (to NTU) to measure turbidity inwater based on the length of a light path through a suspension that causes the image of astandard candle flame to disappear.
Nephelometric turbidity units (NTU)- The units of measurement for turbidity in wateras determined by the degree light is scattered at right angles when compared to a standardreference solution.

6
Reference Condition (Biological Integrity)- the condition that approximates natural,un-impacted conditions (biological, chemical, physical, etc.) for a water body. Referencecondition (Biological Integrity) is best determined by collecting measurements at anumber of sites in a similar water body class or region under undisturbed or minimallydisturbed conditions (by human activity), if they exist. Since undisturbed or minimallydisturbed conditions may be difficult or impossible to find, least disturbed conditions,combined with historical information, models or other methods may be used toapproximate reference condition as long as the departure from natural or ideal isunderstood. Reference condition is used as a benchmark to determine how much otherwater bodies depart from this condition due to human disturbance.
Minimally disturbed- the physical, chemical, and biological conditions of awater body with very limited, or minimal, human disturbance in comparison toothers within the water body class or region. Minimally disturbed conditions canchange over time in response to natural processes.
Least Disturbed Condition- the best available existing conditions with regard tophysical, chemical, and biological characteristics or attributes of a water bodywithin a class or region. These waters have the least amount of humandisturbance in comparison to others within the water body class, region or basin. Least disturbed conditions can be readily found, but may depart significantly fromnatural, undisturbed conditions or minimally disturbed conditions. Leastdisturbed condition may change significantly over time as human disturbanceschange.
Regional Reference Condition- description of the chemical, physical, or biologicalcondition based on an aggregation of data from reference sites that are representative of awater body type in an ecoregion, subecoregion, watershed, or political unit.
Sediment- Fragmented material that originates from weathering and erosion of rocks orunconsolidated deposits, and is transported by, suspended in, or deposited by water.
Sedimentation- The depositing of sediment.
Settleable Solids- Those solids that will settle to the bottom of a cone-shaped container,an Imhoff cone, in a 60-minute period.
Silt – Noncohesive soil whole individual particles are not visible to the unaided humaneye (0.002 to 0.05 mm). Silt will crumble when rolled into a ball.
Siltation– The process by which a river, lake, or other water body becomes clogged withsediment.
Suspended and bedded sediments- particulate organic and inorganic matter that

7
suspend in or are carried by the water, and/or accumulate in a loose, unconsolidated formon the bottom of natural water bodies.
Suspended load- Sediment which is derived from a river/streambed and is wholly orintermittently supported in the water column by turbulence.
Suspended solids concentration (SSC)- The amount of organic and inorganic particlessuspended in water. SSC is determined by measuring the dry weight of all the sedimentfrom a known volume of a water-sediment mixture.
Total suspended solids (TSS)- The entire amount of organic and inorganic particlesdispersed in water. TSS is measured by several methods, most of which entail measuringthe dry weight of sediment from a known volume of a subsample of the original.
1Turbidity- The scattering of light by fine, suspended particles which causes water tohave a cloudy appearance. Turbidity is an optical property of water. More specifically,turbidity is the intensity of light scattered at one or more angles to an incident beam oflight as measured by a turbidity meter or nephelometer.
2Turbidity- A principal characteristic of water and is an expression of the opticalproperty that causes light to be scattered and absorbed by particles and molecules ratherthan be transmitted in straight lines through a water sample. It is caused by suspendedmatter or impurities that interfere with the clarity of water. These impurities may includeclay, silt, finely divided inorganic and organic matter, soluble colored organiccompounds, and plankton and other microscopic organisms.
Washload- Sediments smaller than 63 microns which are not from the bed but could befrom bank erosion or upland sources.
Water Quality Standards- are provisions in State or Tribal law or regulations thatdefine the water quality goals of a water body, or segment thereof, by designating the useor uses to be made of the water; setting criteria necessary to protect the uses; andprotecting existing water quality through anti-degradation policies and implementationprocedures.

8
WHAT IS THE PURPOSE OF THIS DOCUMENT?
The Office of Water in EPA, with support from the Office of Research and Development,is preparing to develop and issue improved water quality criteria (either recommended values ormethodologies) for use by the States to better manage Suspended and Bedded Sediments (SABS)in water bodies across the country. Before undertaking this effort, the Office of Water isundergoing a consultation with the EPA Science Advisory Board to gain their review andrecommendations on the best scientific approaches to accomplish this. This paper is beingprepared as the discussion paper for the Science Advisory Board to consider the key scientificquestions regarding methods and approaches for developing water quality criteria for SABS.
This paper provides an introduction to SABS and water quality criteria and discusses thetypes and status of water quality criteria that have been or are currently being used by the States,Canada and elsewhere. The paper also proposes several new approaches or methods fordeveloping SABS criteria for consideration by U.S. EPA Science Advisory Board. Theconsultation with the EPA Science Advisory Board is scheduled to take place October 2, 2003 inWashington, DC.
After the consultation, the Office of Water intends to prepare a comprehensive strategyfor developing and implementing new SABS criteria, or methods, to be used by the States andTribes in their water quality standards programs within the next few years as they adopt new andrevised criteria to protect their waters.
BACKGROUND:
– What are Suspended and Bedded Sediments (SABS)?
Suspended and bedded sediments (SABS) are defined by EPA as particulate organic andinorganic matter that suspend in or are carried by the water, and/or accumulate in a loose,unconsolidated form on the bottom of natural water bodies. This includes the frequently usedterms of clean sediment, suspended sediment, total suspended solids, bedload, turbidity, or incommon terms, dirt, soils or eroded materials.
EPA’s definition of SABS also includes organic solids such as algal material, particulateleaf detritus and other organic material. This initiative on SABS criteria intentionally does notlook at contamination in sediments, another significant environmental issue, rather, EPA hasdealt directly with the toxicity of chemicals in sediments through its work on EquilibriumPartitioning-Derived Sediment Benchmarks. EPA does recognize however, that managingSABS in the aquatic environment will have either direct or indirect consequences on the amountof contaminated sediments and may need to further examine these relationships in future efforts.
SABS can be further defined in regards to particle size which are related to the mode ofaction in the aquatic environment. SABS can be broken into two fractions based on size – finesediment and coarse sediment. Fine sediment is typically considered to consist mostly of

9
particles smaller than 0.85 mm and coarse sediment is defined as greater than 9.5 mm. Particlesless than 0.063 mm (silt and clay) remain suspended in flowing water and are largely the causeof turbidity (IDEQ, 2003).
– What are the impacts of SABS?
SABS are a unique water quality problem when compared to toxic chemicals, in thatsuspended solids and bedded sediments (including the organic fraction) occur naturally in waterbodies in natural or background amounts and are essential to the ecological function of a waterbody. Suspended solids and sediments transport nutrients, detritus, and other organic matter innatural amounts which are critical to the health of a water body. Suspended solids and sedimentin natural quantities also replenish sediment bedloads and create valuable micro-habitats, such aspools and sand bars. Therefore, a basic premise for managing suspended and bedded sedimentsin water bodies to protect aquatic life uses may be the need to maintain natural or backgroundlevels of SABS in water bodies.
However, SABS in excessive amounts constitute a major ecosystem stressor. Accordingto the EPA National Water Quality Inventory - 2000 Report, excessive sediment was the leadingcause of impairment of the Nation’s waters. The highest frequency of impairment was reportedfor rivers and streams, followed by lakes, reservoirs, ponds, and estuaries. In 1998,approximately 40% of assessed river miles in the U.S. were impaired or threatened fromexcessive SABS.
Suspended and bedded sediments have two major avenues of effect in aquatic systems; 1)direct effects on biota, and 2) direct effects on physical habitat, which result in effects on biota. In considering impacts, suspended sediment is the portion of SABS that exert a negative impactvia suspension in the water column, such as shading of submerged macrophytes. Beddedsediments are those sediments that have a negative impact when they settle out on the bottom ofthe water body and smother spawning beds and other habitats. (An additional summary of theeffects of SABS can be found in Appendix 1 and a comprehensive review can be found in Jha,2003. The following discussion is excerpted from Jha, 2003.)
In streams and rivers, fine inorganic sediments, especially silts and clays, affect thehabitat for macroinvertebrates and fish spawning, as well as fish rearing and feeding behavior.Larger sands and gravels can scour diatoms and cause burying of invertebrates, whereassuspended sediment affects the light available for photosynthesis by plants and visual capacity ofanimals. A potential problem with suspended sediment in reservoirs, coastal wetlands, estuaries,and near-shore zones is decreased light penetration, which often causes aquatic macrophytes tobe replaced with algal communities, with resulting changes in both the invertebrate and fishcommunities. Increased sedimentation also may functionally shift the fish community fromgeneralist feeding and spawning guilds to more bottom-oriented, silt tolerant fishes.
Sediment starvation caused by structures such as dams and levees is also a problem insome ecosystems, ranging from the loss of native fish species and native riparian ecosystem

10
structure in many dammed Western rivers (e.g., Colorado River, Platte River, Missouri River), tothe subsidence and loss of wetlands (e.g., Mississippi Delta in Louisiana).
Effects of excess suspended and bedded sediments on habitat structure include changes inrefugia for biota (e.g., changes in macrophyte communities), increased fines (and embeddedness)and scouring in streams, aggradation and destabilization of stream channels, and filling in ofwetlands and other receiving waters, and for sediment starvation, scouring and removal ofriparian and pool habitat, and subsidence and disappearance of wetlands and lowering of thewater table. Increased turbidity and concomitant changes in light regime may be considered tobe aspects of altered habitat. Indirect effects on biota will occur as the fish, invertebrates, algae,amphibians, and birds that rely upon aquatic habitat for reproduction, feeding, and cover areadversely affected by habitat loss or degradation. Sea grasses and other submerged aquaticvegetation (SAV) are considered “keystone” species in temperate and tropical estuaries andcoastal areas. These flora have a variety of beneficial attributes including providing food andshelter for many aquatic and terrestrial species. There has been a worldwide decline in seagrasses including dramatic regional losses in the Gulf of Mexico. When studied in detail,seagrass declines have always been linked to nutrient enrichment as the most important cause,but suspended sediment remains a suspected secondary cause in several cases.
SABS also affect fish populations. Three major effects of SABS on fishes include: 1)behavioral effects, such as inability to see prey or feed normally; 2) physiological effects, suchas gill clogging; and 3) effects due to sediment deposition, such as burial and suffocation of eggsand larvae. Physiological effects of sedimentation can result in impaired growth, histologicalchanges to gill tissue, alterations in blood chemistry, and an overall decrease in health andresistance to parasitism and disease. Lower doses or shorter duration of SABS will havetransitory effects, while higher doses for longer periods can result in more lasting and severeeffects.
Fish can also swallow large quantities of sediment, causing illness, reduced growth andeventual death, depending on other contaminants that may be adsorbed to the sediment. Someother physiological changes include; release of stress hormones (i.e., cortisol and epinephrine), acompensatory response to a decrease in gill function, and clogging gill mucus causingasphyxiation and traumatization of gill tissue. The severity of damage appears to be related tothe dose of exposure as well as the size and angularity of the particles involved.
Certain fish populations may be severely impacted in their ability to feed by even smallincreases in SABS concentrations because of increased turbidity. Fish that need to see their preyto feed suffer from reduced visibility in turbid water and may be restricted from otherwisesatisfactory habitat. Some fishes are able to hunt better as SABS concentrations increase up to apoint because of increased contrast between the prey and the surrounding water.
Many species of fish may relocate when sediment load is increased, because fish canreadily disperse. Other behavior responses include an increased frequency of the cough reflexand temporary disruption of territoriality. The severity of the behavioral response is associated
11
with the timing of disturbance, the level of stress, decreased energy reserves, phagocytes,metabolic depletion, seasonal variation, and alteration of the habitat.
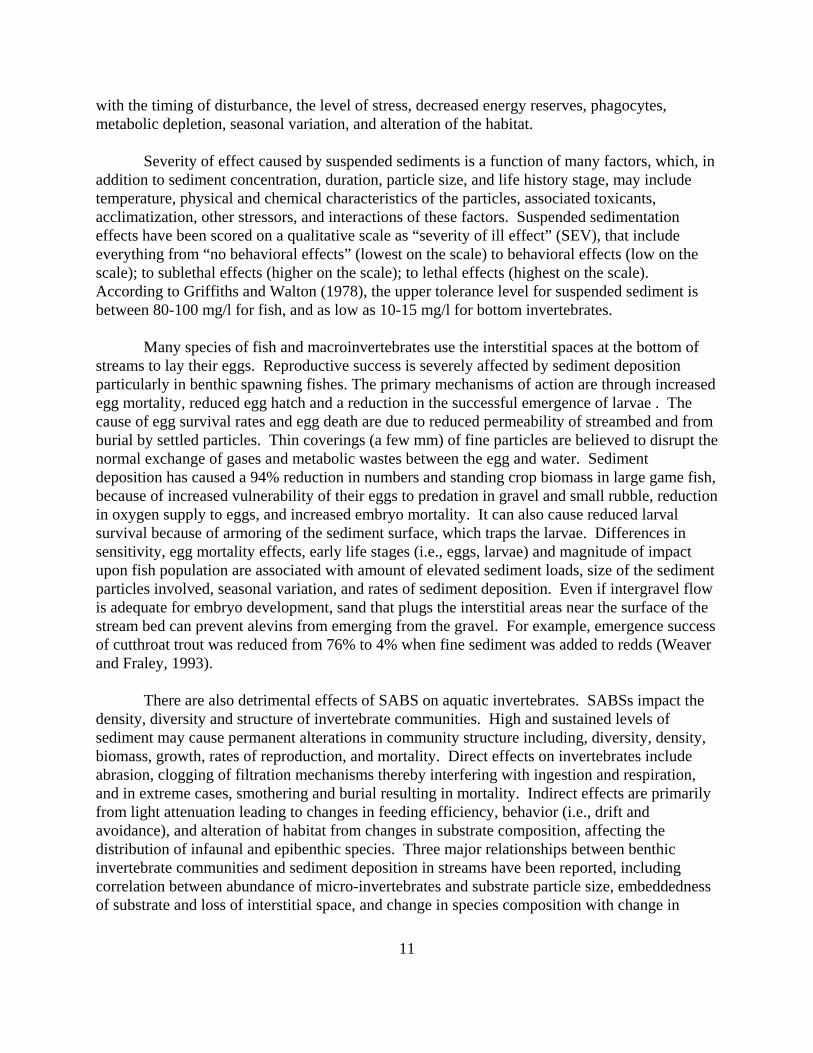
Severity of effect caused by suspended sediments is a function of many factors, which, inaddition to sediment concentration, duration, particle size, and life history stage, may includetemperature, physical and chemical characteristics of the particles, associated toxicants,acclimatization, other stressors, and interactions of these factors. Suspended sedimentationeffects have been scored on a qualitative scale as “severity of ill effect” (SEV), that includeeverything from “no behavioral effects” (lowest on the scale) to behavioral effects (low on thescale); to sublethal effects (higher on the scale); to lethal effects (highest on the scale). According to Griffiths and Walton (1978), the upper tolerance level for suspended sediment isbetween 80-100 mg/l for fish, and as low as 10-15 mg/l for bottom invertebrates.
Many species of fish and macroinvertebrates use the interstitial spaces at the bottom ofstreams to lay their eggs. Reproductive success is severely affected by sediment depositionparticularly in benthic spawning fishes. The primary mechanisms of action are through increasedegg mortality, reduced egg hatch and a reduction in the successful emergence of larvae . Thecause of egg survival rates and egg death are due to reduced permeability of streambed and fromburial by settled particles. Thin coverings (a few mm) of fine particles are believed to disrupt thenormal exchange of gases and metabolic wastes between the egg and water. Sedimentdeposition has caused a 94% reduction in numbers and standing crop biomass in large game fish,because of increased vulnerability of their eggs to predation in gravel and small rubble, reductionin oxygen supply to eggs, and increased embryo mortality. It can also cause reduced larvalsurvival because of armoring of the sediment surface, which traps the larvae. Differences insensitivity, egg mortality effects, early life stages (i.e., eggs, larvae) and magnitude of impactupon fish population are associated with amount of elevated sediment loads, size of the sedimentparticles involved, seasonal variation, and rates of sediment deposition. Even if intergravel flowis adequate for embryo development, sand that plugs the interstitial areas near the surface of thestream bed can prevent alevins from emerging from the gravel. For example, emergence successof cutthroat trout was reduced from 76% to 4% when fine sediment was added to redds (Weaverand Fraley, 1993).
There are also detrimental effects of SABS on aquatic invertebrates. SABSs impact thedensity, diversity and structure of invertebrate communities. High and sustained levels ofsediment may cause permanent alterations in community structure including, diversity, density,biomass, growth, rates of reproduction, and mortality. Direct effects on invertebrates includeabrasion, clogging of filtration mechanisms thereby interfering with ingestion and respiration,and in extreme cases, smothering and burial resulting in mortality. Indirect effects are primarilyfrom light attenuation leading to changes in feeding efficiency, behavior (i.e., drift andavoidance), and alteration of habitat from changes in substrate composition, affecting thedistribution of infaunal and epibenthic species. Three major relationships between benthicinvertebrate communities and sediment deposition in streams have been reported, includingcorrelation between abundance of micro-invertebrates and substrate particle size, embeddednessof substrate and loss of interstitial space, and change in species composition with change in

12
substrate composition.
Sedimentation alters the structure of the invertebrate community by causing a shift inproportions from one functional group to another. Sedimentation can lead to embeddedness,which blocks critical macroinvertebrate habitat by filling in the interstices of the cobble andother hard substrate on the stream bottom. As deposited sediment increases, changes ininvertebrate community structure and diversity occur.
Invertebrate drift is directly affected by increased suspended sediment load in freshwaterstreams. These changes generally involve a shift in dominance from ephemeroptera, plecopteraand trichoptera (EPT) taxa to other less pollution-sensitive species that can cope withsedimentation. Increases in sediment deposition that affect the growth, abundance, or speciescomposition of the periphytic (attached) algal community will also have an effect on themacroinvertebrate grazers that feed predominantly on periphyton. For example in the ChattoogaRiver watershed, accelerated sedimentation was identified as the leading cause of habitat lossand reduction in bed form diversity (Pruitt et. al., 2001). A significant correlation was observedbetween aquatic ecology and normalized total suspended solids (TSS) data. Effects on aquaticindividuals, populations, and communities are expressed through alterations in local food websand habitat. When sedimentation exceeds certain thresholds, ensuing effects will likely involvedecline of the existing aquatic invertebrate community and subsequent colonization by pioneerspecies.
SABS also have a negative affect on the survival of freshwater mussels. Increased levelsof SABS impair ingestion rates of freshwater mussels in laboratory studies. However, it hasbeen suggested that survival may be species-specific. Mussels compensate for increased levelsof suspended sediment by increasing filtration rates, increasing the proportion of filtered materialthat is rejected, and increasing the selection efficiency for organic matter. Species-specificresponses to SABS are adaptations to sediment levels in the local environment, such that speciesinhabiting turbid environments are better able to select between organic and inorganic particles. Many of the endangered freshwater mussel species have evolved in fast flowing streams withhistorically low levels of suspended sediment. Such species may not be able to actively selectbetween organic and inorganic particles in the water column. Therefore, even low levels ofsediment may reduce feeding and, in turn, reduce growth and reproduction.
Corals differ greatly in their ability to resist SABS, with most species being highlyintolerant of even small amounts while a minority are able to tolerate extremely embeddedsediment conditions, and a few are even able to live directly in sedimented bottoms. Excessivesedimentation can adversely affect the structure and function of the coral reef ecosystem byaltering physical and biological processes through a variety of mechanisms. These all requireexpenditure of metabolic energy and when sedimentation is excessive they eventually reach thepoint where they can no longer spare the energy to keep themselves clean, and the affected tissuedies back. Excess SABS cause reduced growth rates, temporary bleaching, and complex foodweb-associated effects with SABS killing not only corals but other reef dwelling organisms. Coral larvae will not settle and establish themselves in shifting sediments. Increases in

13
sedimentation rates alter the distribution of corals and their associated reef constituents byinfluencing the ability of coral larvae to settle and survive.
Changes in the supply rate of sediment causes drastic changes in aquatic, wetland, andriparian vegetation. Undesirable changes in vegetation can be induced by both decreases andincreases in SABS from natural levels. For example, in the Platte and Missouri Rivers,decreases in both sediment supply and scouring flows have resulted in the growth of stableriparian forests (including many exotic eastern tree species), and the loss of sandbar habitat forseveral wildlife species (e.g., cranes, piping plovers) (Johnson 1994). In the Colorado River,decreased sediment supply (but continuing scouring flow) has resulted in the loss of riparianwetland habitat dependent on sandbars (Stevens 1995). The magnitude and timing ofsedimentation may influence structure and recolonization of aquatic plant communities. Theeffects of reduced primary production on aquatic invertebrates and fishes at higher trophic levelsare compounded when SABS settles on remaining macrophytes. The macrophyte quality also isreduced as a food source. The periphyton communities are likely to be most susceptible to thescouring action of suspended particles or burial by sediments. For example, large-scale declinesof submerged aquatic vegetation (SAV) in Chesapeake Bay is directly related to increasingamounts of nutrients, and secondarily to sediments entering the Bay (Staver et. al., 1996).
Indirect impacts of excess sediment on water quality can occur through its influence onaquatic plant communities, organic exchange substrates, and microbial populations. Inenvironments with high concentrations of SABS, reductions in plant species density, biomass,and diversity throughout a trophic level are translated into reductions in energy input to the nexttrophic level. Decreases in plant populations may result in decreases in populations ofzooplankton, insect abundance and overall biomass which may initiate reductions in herbivore,omnivore and predatory fish. SABS deposition may cover microbes, or organic matter neededfor microbial processes, or alter redox profiles important in the performance of water qualityprocesses.
For other uses of water bodies, excessive SABS can, among other things, affect waterclarity and the aesthetic quality of swimming waters, increase pre-filtration efforts and expensesat drinking water purification facilities and lead to accelerated in-fill of dredged shippingchannels, harbors and marinas.
In summary, the current literature suggests SABS are significant contributors to declinesin populations of North American aquatic life and can impact other uses of waters. ImprovedSABS criteria are needed to properly manage the level of SABS in aquatic ecosystems tominimize or avoid these effects.
– What Are Water Quality Standards?
Water quality standards consist of a designated use(s) for a water body, water qualitycriteria to protect the designated use(s) and an antidegradation policy. States, and Tribes with

14
authorization to conduct a water quality standards program, are required by section 303(c) of theClean Water Act (CWA) to adopt water quality standards. States and Tribes adopt water qualitystandards to protect public health and welfare, protect designated uses, enhance the quality ofwater and serve the purposes of the CWA. Section 101(a) of the CWA specifies that waterquality standards should provide, wherever attainable, “water quality which provides for theprotection and propagation of fish, shellfish, and wildlife and provides for recreation in and onthe water”. Section 303(c) states that water quality standards should be established for waterbodies taking into consideration their use and value for public water supplies; propagation of fishand wildlife, recreational, agricultural, industrial, navigation and other purposes.
– What Are Water Quality Criteria?
Water quality criteria are levels of individual pollutants, or water quality characteristics,or descriptions of conditions of a water body that, if met, will generally protect the designateduse(s). EPA, under section 304(a) of the CWA, periodically publishes water quality criteriarecommendation for use by States, Tribes and territories in setting water quality standards. Water quality criteria published pursuant to Section 304(a) of the CWA are based solely on dataand scientific judgements on the relationship between (pollutant) concentrations andenvironmental (and human health) effects and do not reflect consideration of economic impactsor the technological feasibility of meeting the criteria values in ambient water.
When establishing numeric criteria, States and Tribes can 1) adopt EPA’s recommendedcriteria into their water quality standards, or 2) adopt EPA’s recommended water quality criteriamodified to reflect site-specific conditions, or 3) adopt criteria derived using other scientificallydefensible methods. EPA’s 304(a) criteria recommendations have been critical tools for theStates, Tribes and territories for controlling many forms of pollution and improving water qualityacross the Nation.
There are also other types of designated uses of water bodies, other than aquatic life,which need to be protected from excess SABS. These include recreation in and on the water,shipping, drinking water sources, industrial water use, agricultural water use and others. Waterbodies may have multiple use designations, including aquatic life, as well as those other useslisted above or may be limited to uses other than aquatic life if use attainability analyses havebeen performed by the State, Tribe or territories. There are human health criteria, and othercriteria, that are most appropriate for these uses.

15
WATER QUALITY CRITERIA FOR SABS– CURRENT STATUS:
During recent discussions between the States and EPA while developing a water qualitystandards and criteria strategy for the next decade (EPA 2003), the need for new/improved waterquality criteria for SABS, or for methodologies for deriving SABS criteria on a regional or site-specific basis, was identified as one of the highest priorities for the EPA water quality criteriaprogram. As a result, the EPA Office of Water has committed to do so.
At this time, EPA believes the biggest challenge will be to develop improved SABScriteria to protect aquatic life. Most other designated uses of water bodies (possibly with theexception of drinking water source uses) where aquatic life uses overlap, may be protected bythe potentially more stringent aquatic life criteria. Drinking water uses may need more stringentcriteria, but typically apply to few water bodies. Aquatic life uses typically apply to most allwaters. However, EPA also believes at this time that other forms of criteria for protecting usesother than aquatic life may still be necessary, where aquatic life uses do not exist or where theother uses are affected differently by SABS.
The section below provides a description of the current status of criteria related to SABSin State and Tribal water quality standards, and elsewhere, primarily as background forconsidering new criteria development methodologies. However, some of these examples of past,current and future criteria approaches may hold promise as approaches that could be used on anational scale by EPA.
– What Criteria Recommendations Has EPA Issued in the Past?
In 1976, EPA published a water quality criteria recommendation for solids and turbiditythat is based on light reduction. This criterion is summarized in the 1986 EPA Quality Criteriafor Water as:
“Solids (Suspended, Settleable) and Turbidity - Freshwater fish and other aquatic life:Settleable and suspended solids should not reduce the depth of the compensation pointfor photosynthetic activity by more than 10 percent from the seasonally established normfor aquatic life.”
The criterion and a brief description of the rationale can be found athttp://www.epa.gov/waterscience/criteria/goldbook.pdf. This criteria has not been frequentlyadopted or used by the States. However, in June 2003, Idaho DEQ proposed to use this criterionvalue as one component of their newly revised sediment TMDL targets (See description of Idahobelow).
EPA also published a narrative “free from” aesthetic standard that States have sinceadopted into their water quality standards. This narrative states:
“Aesthetic Qualities - All waters shall be free from substances attributable to wastewater

16
or other discharges that: settle to form objectionable deposits; float as debris, scum, oil,or other matter to form nuisances; produce objectionable color, odor, taste or turbidity;injure or are toxic or produce adverse physiological response in humans, animals, orplants; produce undesirable or nuisance aquatic life.”
– Other Recommended Values:
Referenced in the 1986 EPA Quality Criteria for Water are two reports by the NationalAcademy of Sciences (NAS, 1972) and the National Technical Advisory Committee (NTAC,1968) which were predecessor documents on water quality criteria. In these reports, criteriarecommendations related to drinking water and freshwater aquatic life were also provided. These are:
“Raw Drinking Water with Treatment - Turbidity in water should be readily removableby coagulation, sedimentation and filtration; it should not be present to an extent thatwill overload the water treatment plant facilities, and should not cause unreasonabletreatment costs. In addition, turbidity should not frequently change or vary incharacteristics to the extent that such changes cause upsets in water treatmentprocesses.”
“Freshwater Aquatic Life - Combined effect of color and turbidity should not change thecompensation point more than 10 percent from its seasonally established norm, norshould such a change take place in more than 10 percent of the biomass ofphotosynthetic organisms below the compensation point.”
For other types of designated uses such as boating, fishing, swimming, wading, aestheticsand hunting, a variety of factors contribute to the recreational quality of a water body(Parametrix, 2003). Visual factors such as color and clarity are important along with perceivedchanges in these factors. The ability to use water safely- to be able to see what is there- is alsoimportant. The National Academy of Sciences (NAS/NAE, 1973) recommended that watersused for bathing and swimming should have sufficient clarity to allow for the detection ofsubsurface hazards or submerged objects and for locating swimmers in danger of drowning. TheNational Technical Advisory Committee (NTAC) in 1968 recommended that clarity should besuch that a secchi disk is visible at minimum depth of four feet given its conclusion that clarity inrecreational waters is highly desirable from the standpoint of visual appeal, recreationalopportunity, enjoyment and safety (Parametrix, 2003).
– What Are States and Tribes Currently Doing?
Most States currently have water quality criteria that can be applied to SABS. Twounpublished summary tables – one of State sediment criteria and the other, State sedimentTMDLs, prepared by EPA in 2001, are provided in Appendices 3 and 4 for reference. A fewStates are developing new criteria for SABS and examples are described below.

17
Another summary of the current regulatory guidelines for SABS is in the TechnicalAppendix to the Ambient Water Quality Guidelines (Criteria) for Turbidity, Suspended andBenthic Sediments (Caux et al. 1997), prepared for the British Columbia Ministry ofEnvironment, Land and Parks. Caux et al. (1997) built on an earlier review of available criteriaby Singleton (1985). A third review of sediment targets used for TMDLs is provided in IdahoDEQ, 2003.
From these reviews it becomes clear there are a wide range of sediment criteria in currentuse in the United States. Some States use numerical criteria, some use narrative criteria, someuse both, and some States have no criteria related to SABS at all. Many States have differentcriteria for different stream channel substrate types. When they are differentiated, Statestypically have more stringent criteria for streams with hard substrates (gravel, cobble, bedrock)and less stringent criteria for streams with soft substrates (sand, silt, clay). Hawaii has a separatecriterion for reefs. Cold water fisheries typically have more rigorous criteria than do warm waterfisheries in states that differentiate between the two uses. A few States use biocriteria (e.g.,biotic indices), and at least one uses soil loss as a criterion. Several States provide criteria for anaveraging period (e.g., 30 days) as well as an allowed daily maximum concentration. SomeStates set an absolute value, some set a value over a background level.
Most States with numerical criteria use turbidity as a surrogate measure. Some useexceedances over background (e.g., “Not greater than 50 NTU over background”, or “not morethan 10% above background” or “no more than 5 NTUs above background”), while some useabsolute values (e.g., “Not greater than 100 NTU”). Some States have established numericstandards that are basin-specific while others vary with the presence of salmonids. In general,most States are concerned with the effects of water clarity and light scattering on aquatic life. The majority of States use EPA method 180.1 to measure turbidity and method 160.2 to measuretotal suspended solids (TSS). Most States use optical backscatter or optical transmissiontechnology for turbidity either by measuring in situ or in the lab after collecting grab or single-point samples. Very few, if any States, attempt to correlate turbidity with TSS or biologicalimpacts, and only a few States measure suspended solids concentration (SSC). Very few Statesmeasure particle size distribution and no States measure bedload.
Only a few States use suspended solids as a criterion. Suspended solids criterion valuesvary from 30 mg/L up to 158 mg/L. At least one State uses transparency (> 90% of background)as a standard. A number of States have criteria based on sediment deposited over a time period,or during a storm event. Values are typically 5 mm during an individual event (e.g., during the24 hours following a heavy rainstorm) for streams with hard substrates bottoms and 10 mm forstreams with soft bottoms. Hawaii's reef criterion is 2 mm deposited sediment after an event.
The Chesapeake Bay Program (a multi-state effort) has a criterion based on clarity,including a measurement of the percent light through water (PLW) and secchi disk clarity. Thecriteria are stratified by depth and salinity regime and are adjusted by season. Water claritycriteria are used in the Chesapeake Bay because it is assumed that they will result in achievementof clarity/solids levels that would not impair other habitats and organisms (with the exception

18
that the water clarity criteria may not fully protect smothering of soft or hard bottom habitatswith large sized sediment particles from sources that by-pass (don’t influence) shallow waterhabitats), since submerged aquatic vegetation represents one of the components of theChesapeake Bay ecosystem that is most sensitive to increases in SABS. A detailed explanationof the derivation of the Chesapeake Bay water clarity criteria can be found in Appendix 1.
Many States have narrative criteria for SABS in addition to, or instead of, numericalcriteria. These criteria most frequently pertain to turbidity or appearance of the water (e.g.,“Free of substances that change color or turbidity”). Others refer to undesirable biologicaleffects (e.g., “No adverse effects” or “No actions which will impair or alter the communities”). States that employ narrative sediment standards, typically also use a translator -- a numeric orquantifiable target for regulatory purposes (TMDLs, WLAs and permit limits).
Information from the EPA survey conducted in 2001 (Appendix 4) indicates that numericsediment criteria of some type were identified in 32 of the 53 States. Narrative criteria wereidentified in13 of the States with no numeric criteria (and in 23 of the States with numericcriteria as well), leaving 8 States where no sediment criteria (either numeric or narrative) wereidentified. Of these 8 States without criteria, 5 listed an alternative method or guide forestablishing sediment criteria such as effluent controls or regional criteria.
Of the 32 States with numeric criteria, 29 were for turbidity and 5 were for suspendedsolids, including three States listing criteria for both turbidity and suspended solids. Illinoislisted criteria for upland erosion, using the soil loss statistic “T”. Alaska and Hawaii are the onlyStates that list numeric criteria for bedded sediments. The narrative criteria are broader than thenumeric criteria, covering a large range of objectionable conditions that could affect aquatic lifeor other designated uses. Those related to sediments include water color (turbidity), floating andsettleable solids, harmful deposits, and channel habitat measures.
In addition, biological and habitat measures are used to indicate suspended and beddedsediment conditions. Florida is the only State with a numeric criterion for benthicmacroinvertebrates as an indicator of sediment conditions. In other States, biological and habitatcriteria are narrative or nonexistent.
– Turbidity Criteria:
Turbidity criteria were variable among the States and can be categorized into threevariations.
(1) Either thresholds in excess of background turbidity or absolute thresholds(independent of background) were established. The majority of States (15) set thresholdsin comparison to background, 12 used absolute thresholds, and 2 used a combination ofabsolute thresholds and those based on a comparison to background (Figure 1).

19
no numeric standard forturbidity (34)
compare to backgroundor natural conditions (15)
absolute threshold (12)
combination of absoluteand comparison (2)
Figure 1. Comparison of numeric criteria for turbidity, showingtypes of thresholds, among states.
no numeric standard for turbidity(34)
statew ide numeric standard, notvariable (11)
numeric standard variable byw aterbody class, designateduse, or f ishery type (14)numeric standard variable byw aterbody, NV, LA (2)
numeric standard variable byregion, AR (1)
numeric standard variable byseason (w et/dry), HI (1)
Figure 2. Comparison of the application of turbidity thresholds by State-wide, water body or class, region and season among States.
(2) Another variation regardedthe frequency of exceedances -daily or monthly averages,percentage of readings above athreshold, or instantaneousreadings. Instantaneousexceedances of absolutethresholds might be expected toresult from rainfall events,though accounting for natural andperiodic high turbidity waslacking in most of the criteria. Few States specified samplingduring low flow only and Hawaii
defined two criteria - one for the wet season and a lower threshold for the dry season.
(3) Within 17 States, thresholds vary based on designated uses, stream classes, fishery types,regions, or rivers (Figure 2). The other twelve of the 29 States with turbidity criteria have asingle threshold that applies throughout the State. Most (14) of the States with varyingthresholds have strictercriteria for streams thatsupport cool water aquaticcommunities (trout) or aresources of potable water. These streams are identifiedby their designated use,stream class, or fishery type. Nevada and Louisianadescribe criteria for specificwater bodies. Criteria inArkansas vary by region,probably based on underlyinggeologies.
The strictest criteriafor turbidity for all States arefor highly protected streamsin New Hampshire and in the dry season in Hawaii. These criteria require turbidity no greaterthan background (NH) and a mean value of 2 nephelometric turbidity units (NTU) in Hawaii.
Mountainous States with stable geology generally have stricter criteria than those incoastal or low gradient regions with sedimentary geology. The strictest thresholds within a Stateappear to be driven by aquatic life uses, whereas the more relaxed thresholds are driven byagricultural and non-aquatic life uses. In other words, where States have varying criteria, thestrictest criteria are generally in trout streams or highly protected waters. The highest numeric

20
NTUs above NTU NTUs above NTUbackground # states threshold # states background # states threshold # states
0 1 2 1 10 4 20 15 4 5 1 10% 3 25 210 4 10 6 15 2 50 5
10% 3 15 1 20% 1 75 125 1 20 1 25 1 150 229 1 50 2 29 1 qualitative 150 2 50 4
Strictest of state's criteria Most relaxed of state's criteria
Table 1. Numeric turbidity criteria. The strictest criteria within each State may only apply to highlyprotected waterbodies and the most relaxed criteria may only apply to naturally turbid waterbodies. IfStates have uniform statewide criteria, they are tabulated in both sides of the table (as both strictest andmost relaxed). Criteria are either NTUs above background levels or absolute thresholds.
thresholds (most relaxed criteria) are for large rivers in Louisiana and instantaneous readings inMaryland, both at 150 NTUs. The variability of turbidity criteria can be ascertained from Table1, which enumerates the States by their strictest and most relaxed criteria. The most commoncriterion is an absolute threshold of 10 NTUs, which is among the stricter criteria.
– Suspended Solids Criteria:
Four States have criteria for total suspended solids (TSS), of which two also haveturbidity criteria. However, it is not clear how these criteria are used in concert with each other. Hawaii has the strictest TSS criteria, which apply in their dry season, with a geometric mean ofreadings not to exceed 10 mg/L, less than 10% of readings to exceed 30 mg/L, and less than 2%of readings to exceed 55 mg/L. Utah, North Dakota, and South Dakota have similar criteria fortheir cold water streams; 35 mg/L, 30 mg/L, and 30 mg/L as a 30 day average or 58 mg/L dailymaximum, respectively. Utah and South Dakota have higher thresholds for their warm waterstreams; 90 mg/L and 150 mg/L as a 30 day average or 263 mg/L daily maximum, respectively.
– Biological and Other Criteria as Measures of SABS:
Florida’s biological criterion related to suspended sediments requires that the Shannon-Weaver index be reduced no more than 75% of a suitable background condition. New Mexico’smatrix of aquatic life use attainment for sediment (NMED, 2002) uses three measures incomparison to reference conditions. Embeddedness and percent pebble-count fines are evaluatedas percent increases above reference conditions. A biological index is evaluated as percentdecrease below reference conditions. Final assessments of support are then based on thecombination of physical and biological assessments. Other criteria based on biologicalcommunity metrics are narrative (see below).
In Hawaii, criteria are described for episodic sediment deposits in hard-bottomed andsoft-bottomed streams following storm events, allowing no more than 5 to 10 mm, respectively,

21
of episodic deposition. In addition, criteria for oxidation-reduction potential and grain sizedistribution in pools are defined. In Alaska, the percent accumulation of fine sediment inspawning gravel may not be increased more than 5% by weight above natural conditions and inno case may the fine sediment in those gravel beds exceed a maximum of 30% by weight. Florida has a criterion for transparency, not to be reduced by more than 10%.
– Narrative Criteria:
Narrative criteria are general statements regarding protection of aquatic life or designateduses. They are mostly of the form: “Surface waters shall be free from pollutants in amounts thatcause objectionable conditions or impairment of designated uses (including aquatic life uses)”. Some specify the resources that should be protected and the pollutants that should be controlled,while others are general. Of the 36 States with narrative criteria, 32 specifically advocate controlof suspended solids or turbidity and 23 specifically advocate control of bottom deposits orsettleable solids (bedded sediments). While many narrative criteria have protection of aquaticlife as a goal, only 8 recommend that the effects of sediments be determined by directmeasurement of biological community integrity as evidenced by changes in communitycomposition or reduction in diversity.
--Recent Efforts by States to Develop New SABS Criteria:
Idaho:
In Idaho, excessive fine sediment is the most common pollutant in impairedstreams. Total Maximum Daily Load (TMDL) plans prepared by the State to addressexcessive fine sediment must comply with the existing narrative water quality standardfor sediment, which states “Sediment shall not exceed quantities ... which impairbeneficial uses” (IDAPA 58.01.02.200.08). While for the State, this aptly described agoal, it did not describe quantifiable objectives for TMDL plans and stream restorations. Because of this, the Idaho Department of Environmental Quality recently prepared astudy suggesting appropriate water column and streambed measures for gaugingattainment of the narrative sediment goal.
One of the important beneficial uses of Idaho streams is production of trout andsalmon for ecological and recreational purposes. The effects of excessive fine sedimenton the embryo, fry, juvenile, and adult life stages of salmonids are well studied by Idahoand others. Characteristics of the stream that change with increasing fine sediments andare known to affect salmonids and other aquatic biota are the best measures of sediment-caused impairment of beneficial uses. These characteristics, and the threshold values thatdescribe minimal degradation, are the targets that are being contemplated for use by theState.
Water column and instream measures were determined to be the best indicators ofsediment related impacts including decreased light penetration; increased turbidity, total

22
suspended solids and sediments; increased embeddedness, increased extent of streambedcoverage by surface fines and percent subsurface fines in potential spawning gravels,decreased riffle stability, and reduced intergravel dissolved oxygen. The relationshipsbetween these measures and the aquatic biota were considered by the State, with specialattention given to growth, survival, reproductive success, and habitat suitability ofsalmonids. Target levels for most measures are recommended based on generalizedrelationships found in the scientific literature and specific background conditions thatexist in Idaho streams. The targets for turbidity and intergravel dissolved oxygen wereestablished based on existing Idaho Water Quality Standards. Where data to describesediment-biota relationships were lacking or highly variable or background conditionsare highly variable, statewide numeric thresholds were found to be inappropriate. Fortotal suspended solids and sediments, embeddedness, and surface sediments, target levelscould also be established for each individual stream based on local reference sedimentconditions. To provide a regional perspective of the recommended SABS target levels,Idaho made comparisons to standards adopted in neighboring states and provinces. Atable of these are included in the Idaho report (Idaho, 2003). The targets developed byIdaho were derived from literature values for studies primarily in the northwest U.S.
In Idaho, biological assessments and criteria are not used directly to managesediments. Macroinvertebrate and fish community integrity is measured using theStream Macroinvertebrate Index (SMI) and the Stream Fish Index (SFI), respectively. Reference conditions have been described for macroinvertebrates and fish afterrecognizing variability in natural stream types in Idaho. Departure from referenceconditions indicates that the community is exposed to a stressor(s). Neither the IdahoSMI nor the SFI are specifically calibrated to sediments as a stressor, rather they aresensitive to a range of stressors, including sediments.
Idaho also considered other options for targets for SABS than those summarizedin Table 2 below. These included measurements of channel and watershedcharacteristics. Channel characteristics considered included: width/depth ratio, sedimentrating curves, pool frequency and quality, bank stability, and changes in peak flow. Watershed characteristics that were considered included: land area disturbed (especiallyin unstable areas), road crossings, length and hydrologic connectivity, or condition. Idaho concluded that numeric targets would be difficult to establish for channel andwatershed characteristics and suggested that narrative targets or criteria would be moreappropriate.

23
Table 2: Idaho DEQ recommended instream sediment parameters and associated target levels.
Instream SedimentParameter
Recommended Target Levels
Turbidity Not greater than 50 NTU instantaneous or 25 NTU for more than 10consecutive days above baseline background, per existing Idahowater quality standard. Chronic levels not to exceed 10 NTU atsummer base flow
Light Penetration Not to reduce the depth of the compensation point forphotosynthetic activity by more than 10% from the seasonallyestablished norm for aquatic life
Total Suspended Solids andSuspended Sediment
No specific recommendation, establish site specific reference
Embeddedness No specific recommendation, establish site specific referenceSurface Sediment No specific recommendation, establish site specific referenceSubsurface Sediment inRiffles
For those streams with subsurface sediment less than 27% - do notexceed the existing fine sediment volume level. For streams thatexceed the 27% threshold - reduce subsurface sediment to a 5-yearmean not to exceed 27% with no individual year to exceed 29%. Percentage of subsurface sediment < 0.85 mm should not exceed10%
Riffle Stability Not to exceed a Riffle Stability Index of 70Intergravel DissolvedOxygen
Not less than 5.0 mg/L for a 1-day minimum or not less than 6.0mg/L for a 7-day average mean, per existing Idaho water qualitystandard
New Mexico:
New Mexico recently developed a draft protocol to support an interpretation oftheir State Water Quality Standards narrative standard for stream bottom deposits(NMED, 2002). The current standard for the deposition of material on the bottom of astream channel is listed in the State Of New Mexico Standards for Interstate andIntrastate Surface Waters, Section 1105.A General Standards: and states:
“Bottom Deposits: Surface waters of the State shall be free of water contaminants from other thannatural causes that will settle and damage or impair the normal growth, function,or reproduction of aquatic life or significantly alter the physical or chemicalproperties of the bottom.”
The State’s draft protocol for making use attainment decisions is a quantitative,three-step assessment procedure for determining whether the above narrative standard isbeing attained in a particular stream reach or segment by: 1) comparing changes ordifferences, if any, between the site of concern and a reference site; 2) directly evaluating

24
instream habitat by measuring either of two stream bottom substrate parameters orindicators, namely substrate size (mainly fines, 2 mm or less) abundance or cobbleembeddedness, and; 3) verifying or confirming results obtained in step 2 by assessing andcomparing benthic macroinvertebrate communities (or fish) at the same sites.
New Mexico’s step-by-step procedures are described below.
1. Select study site(s) along with a comparable reference site.
2. Perform a bioassessment on the benthic macroinvertebrate community at eachreference in which a pebble count and/or embeddedness procedure is to be performed.
3. Do a pebble count and/or embeddedness evaluation at the reference sites. Pebblecounts should be done in the same habitat unit(s) where the macroinvertebrates werecollected. When doing pebble count evaluations, it is important to determine thenecessary sample size (see page7) needed at each study site based on the evaluatedsample size and determined percent fines at each reference site. This calculation shouldpreferably be done streamside at the reference site using the pebble count analyzersoftware so that sufficient data can be collected with one visit. However, it is acceptableto do the calculations in the office, but realize that an additional visit to the stream maybe required if the sample size is inadequate.
4. Perform a bioassessment of the benthic macroinvertebrate community at each studysite, accompanied by collection of either pebble count and/or embeddedness data ofsufficient size to be statistically significant.
5. Compare the physical and biological data between the study and reference sites bydividing the results obtained at the study site by that of the reference site to obtainpercent “comparability.”
6. Using the final assessment matrix (Table 4 below), locate the proper support cells forboth the physical and biological percentages calculated in step 5, and determine the finaldegree of support for the aquatic life use that is affected by sediment.

25
Table 4: New Mexico Final Assessment Matrix for Aquatic Life Use Attainment:
Biological
Physical
Severely Impaired0-17%
ModeratelyImpaired21-50%
Slightly Impaired54-79%
Non-impaired84-100%
Non-SupportFines orEmbeddedness>40% increase
Non-Support Partial Support Full Support,Impacts Observed
Full Support,Impacts Observed
Partial SupportFines orEmbeddedness28-40%increase
Non-Support Partial Support Full Support,Impacts Observed
Full Support,Impacts Observed
SupportingFines orEmbeddedness11-27% increase
Non-Support1 Partial support1 Full Support,Impacts Observed
Full Support
Full SupportFines orembeddedness<10% increase2
Non-Support1 Partial Support1 Full Support,Impacts Observed
Full Support
1 Reduction in the relative support level for the aquatic life use in this particular matrix cell is probably not due tosediment. It is most likely the result of some other impairment (temperature, D.O., pH, toxicity, etc.), alone or incombination with sediment.
2 Raw percent values of =20% fines (pebble counts) and = 33% embeddedness at a study site should be evaluated asfully supporting regardless of the percent attained at the reference site.
The complete New Mexico stream bottom assessment protocol can be found athttp://www.nmenv.state.nm.us/swqb/protocols/StreamBottomProtocol.pdf.

26
– What Is Being Done Elsewhere in the World?
Canada:
Environment Canada has narrative guidelines for deposited bedload sediment,streambed substrate, suspended sediment, and turbidity for aquatic life uses. The BritishColumbia Ministry of Water, Land and Air Protection released the Ambient WaterQuality Guidelines (Criteria) for Turbidity, Suspended and Benthic Sediments whichcontains numeric thresholds in support of the national narrative guidelines. The BCguidelines are broken down by 5 water uses, 3 sediment parameters, and 2 flowconditions. The water use categories include untreated drinking water, treated drinkingwater, recreation and aesthetics, aquatic life, and the final catch-all, terrestrial life,irrigation, and industrial uses. Of the 3 sediment parameters, i.e., turbidity, suspendedsediments, and streambed substrate composition, turbidity guidelines are defined for allwater uses.
The strictest criterion is for untreated drinking water, allowing a turbidity increaseof only 1 NTU above background. The most relaxed criterion is for terrestrial life,irrigation, and industrial uses, allowing 10 NTUs or 20% above background (whicheveris greatest). Suspended sediments guidelines are defined for aquatic life, and terrestriallife, irrigation, and industrial uses. Streambed substrate composition guidelines are onlydefined for aquatic life uses and are only applied in actual and potential salmonidspawning areas. The criteria for aquatic life address all three parameters, with turbidityand suspended sediments thresholds varying for clear flow and turbid flow conditions. The thresholds for aquatic life uses are detailed below.
Turbidity:
Clear flow: Induced turbidity should not exceed background levels by more than8 NTU during any 24-hour period (hourly sampling preferred). For sediment inputs thatlast between 24 hours and 30 days the mean turbidity should not exceed background bymore than 2 NTU (daily sampling preferred).
Turbid flow: Induced turbidity should not exceed background levels by more than8 NTU at any time when background turbidity is between 8 and 80 NTU. Whenbackground exceeds 80 NTU, turbidity should not be increased by more than 10% of themeasured background level at any one time.
Suspended Sediments:
Clear flow: Induced suspended sediment concentrations should not exceedbackground levels by more than 25 mg/L during any 24-hour period (hourly samplingpreferred). For sediment inputs that last between 24 hours and 30 days, the average

27
suspended sediment concentration should not exceed background by more than 5 mg/L(daily sampling preferred).
Turbid Flow: Induced suspended sediment concentrations should not exceedbackground levels by more than 25 mg/L at any time when background levels arebetween 25 and 250 mg/L. When background exceeds 250 mg/L, suspended sedimentsshould not be increased by more than 10% of the measured background level at any onetime.
Stream substrate composition: These guidelines apply to actual and potentialspawning sites in streams throughout the province. The composition of fine sediment instreambed substrates should not exceed 10% having a diameter of less than 2.00 mm,19% having a diameter of less than 3.00 mm, and 25% having a diameter of less than6.35 mm at potential salmonid spawning sites. The geometric mean diameter and Fredlenumber of streambed substrates should not be less than 12.0 mm and 5.0, respectively. The minimum and 30-day average guideline for intra-gravel dissolved oxygen levels are6.0 and 8.0 mg/L, respectively. The British Columbia, Canada water quality standardsfor turbidity, suspended and benthic sediments are highlighted in Appendix 2.
A Summary of Existing Canadian Environmental Quality Guidelines is availableat: www.ccme.ca/assets/pdf/e1_06.pdf. The British Columbia Ambient Water QualityGuidelines (Criteria) for Turbidity, Suspended and Benthic Sediments are available at:wlapwww.gov.bc.ca/wat/wq/BCguidelines/turbidity.html. A guideline on sampling forturbidity and suspended and benthic sediments can be found athttp://wlapwww.gov.bc.ca/wat/wq/BCguidelines/sampstrat.html. As mentioned earlier, adetailed technical appendix to their criteria guidelines was prepared by Caux et. al., 1997and is available at http://wlapwww.gov.bc.ca/wat/wq/BCguidelines/turbiditytech.pdf.
Australia and New Zealand:
In Australia and New Zealand, guidelines have been developed for recreationalwater quality and aesthetics (ANZECC, 2000). Turbidity is not addressed. The visualclarity guidelines are based on the objective that to protect visual clarity of waters usedfor swimming, the horizontal sighting of a 200mm diameter black disc should exceed 1.6m. For protecting the aesthetic quality of recreational waters the natural visual clarityshould not be reduced by more than 20 percent, the natural hue of water should not bechanged by more than 10 points on the Munsell Scale and the natural reflectance of thewater should not be changed by more than 50%.
The Australian and New Zealand Guidelines for Fresh and Marine Water Quality(ANZECC, 2000) define an approach for defining trigger values which, when exceeded,indicate that a problem may be present due to the stressor of concern. To determinelow-risk trigger values, measure the statistical distribution of water quality indicatorseither at a specific site (preferred), or an appropriate reference system, and also study theecological and biological effects of physical and chemical stressors. Then define thetrigger value as the level of key physical or chemical stressors below which ecologicallyor biologically meaningful changes do not occur, i.e. the acceptable level of change. Regarding sediments as pollutants, the guidelines address turbidity and suspendedparticulate matter.

28
To apply the guidelines where an appropriate reference system is available andthere are sufficient resources to collect the necessary information for the referencesystem, the low-risk trigger concentrations for suspended particulate matter (suspendedsolids) or turbidity should be determined as the 80 percentile of the reference systemdistribution. Where possible the trigger values should be obtained for high flowconditions for rivers and streams and during inflow periods for other ecosystems, whenmost suspended particulate matter will be transported.
Default trigger values are provided for use where either an appropriate referencesystem is not available, or the scale of operation makes it difficult to justify the allocationof resources to collect the necessary information on a reference system. Ranges of low-risk default trigger values for turbidity indicative of slightly disturbed ecosystems insouth-east Australia are as follows; upland rivers: 2-25 NTUs, lowland rivers: 6-50NTUs, lakes and reservoirs: 1-20 NTUs, and estuaries and marine systems: 0.5-10 NTUs. For moderately or highly disturbed systems, more intensive study is recommended andtrigger values may be established using some appropriate percentile of the referencedistribution less than the 80th percentile.
The Australian and New Zealand guidelines are available at:www.mfe.govt.nz/publications/water/anzecc-water-quality-guide-02/anzecc-water-quality-guide-02-pdfs.html
European Union (EU):
The European Water Framework Directive (WFD) directs the member states toestablish goals, basin plans, and monitoring of ecological quality. Assessment ofecological quality is based on a reference condition approach. Annex II of the Directivespecifies methods for establishment of type-specific reference conditions for surfacewater body types.
For each water body type, type-specific hydromorphological, physicochemicaland biological conditions shall be established representing the parameter values for thatsurface water body type at high ecological status. In applying the reference conditionmethods in heavily modified or artificial water bodies, high ecological status shall beconstrued as maximum ecological potential. The values for maximum ecologicalpotential for a water body shall be reviewed every six years.
Type-specific reference conditions may be either spatially based or based onmodeling, or may be derived using a combination of these methods. Where it is notpossible to use these methods, expert judgement may be used to establish suchconditions. A reference network for each water body type should be developed using alarge enough reference data set to provide a sufficient level of confidence about theparameter values for the reference conditions, given the variability in the values and themodeling techniques. Type-specific biological reference conditions based on modelingmay be derived using either predictive models or hindcasting methods. The methodsshould use historical, palaeological and other available data.

29
The Annex goes on to state that Member States should collect and maintaininformation on the type and magnitude of the significant anthropogenic pressures. Thesignificant pressures include:
--Significant morphological alterations to water bodies.
--Other significant anthropogenic impacts on the status of surface waters.
--Land use patterns, including the main urban, industrial and agricultural areasand, where relevant, fisheries and forests.
In Annex VIII, a set of “main pollutants” are listed, among which is “Materials insuspension”, but no specific references are made to sediments. The WFD is available at:europa.eu.int/comm/environment/water/water-framework/index_en.html
POTENTIAL APPROACHES FOR IMPROVED SABS CRITERIA:
When developing improved SABS criteria, EPA anticipates that the biggest challengewill be developing improved criteria to protect aquatic life. Other designated uses of waterbodies where aquatic life uses overlap, most likely will be protected by the potentially moreprotective aquatic life criteria (with the exception possibly of some drinking water uses such asuntreated water source). However, EPA anticipates that other forms of criteria for protectinguses other than aquatic life will still be necessary, where aquatic life uses do not exist or wherethe other uses are affected differently by the SABS. Therefore, the primary focus of this sectionis on new and improved SABS criteria methods aimed primarily at aquatic life protection.
Regardless, EPA expects that establishing appropriate criteria for SABS will followmuch the same process used for establishing other water quality criteria. EPA, however, doesnot anticipate that issuance of a singular national recommended SABS criteria that would applyto all water bodies will be possible. Because water bodies vary from region to region withrespect to natural SABS regime, it is anticipated that States and Tribes will need adaptablemethodologies for deriving SABS on a water body-category basis or using a regionalclassification scheme.
Initially, EPA plans to produce a SABS criteria development strategy that outlines ageneral process that States and Tribes may follow when developing and adopting SABS criteria. As a part of this overall strategy, EPA anticipates laying out major goals and expectations, withkey milestones and approximate time frames for each activity. EPA plans to prepare a series oftechnical and programmatic memoranda to assist the States and Tribes during each critical step.
EPA anticipates it will ask States, territories and authorized Tribes to develop plans forimplementing new and improved SABS criteria in phases. The first phase, will likely include thedevelopment of individual State/Tribal/Territorial SABS adoption plans. The second phase willlikely include the adoption of improved narrative standards for SABS, with implementationprocedures where States do not currently have effective narrative standards. The third, and finalphase, will likely be to adopt regional or water body-category numeric criteria using one or moreEPA recommended procedures or methodologies, or scientifically defensible alternatives.
30
EPA also anticipates developing supporting technical information for the recommendedprocedures or methods. Potential methodologies that could be used by the States, Tribes andterritories are described in this section and are the specific subject of the consultation with theEPA Science Advisory Board. While there may be several ways to develop SABS criteria foraquatic life protection, and each method has strengths and limitations, EPA’s current thinking isthe best approaches should be based on a correlation of SABS with effects on biota or aquaticlife uses.
In general terms, an initial step in the process of developing aquatic life criteria for SABSis deciding which species, communities or designated aquatic life use to protect. The simplestapproach is to protect everything, that is, to set the criteria at a level protective of the mostsensitive aquatic organisms. This is roughly equivalent to making sure that SABS do not exceedthe natural background levels for a particular region or class of water bodies.
Another approach is to protect most everything, as is done for the toxic chemical criteria,which attempt to be protective of 95% of the genera tested (Stephan et al, 1985) as a surrogatefor the entire population or community. An alternative approach is to choose the most sensitive,or important of the biota and protect it.
Any approach, however, will be difficult because SABS are a natural component of theenvironment, and vary considerably within and among various habitats and regions. Biota invarious habitats has evolved to tolerate or even require various levels of SABS.
The following generic steps may be useful to consider when developing a method forsetting SABS criteria:
1) Develop a conceptual model outlining the ecological processes effected by SABS for aparticular water body;
2) Choose the ecological processes, species or groups of species, and beneficial usesdeemed desirable for protection; and
3) Develop numerical targets for protecting the ecological processes, species or groups ofspecies, and beneficial uses deemed desirable for protection based on the correlationsbetween SABS and the biota.
At this time, EPA is examining eight potential approaches to developing water qualitycriteria for SABS that need to be evaluated and then explained more thoroughly before any oneis recommended for use by the States, Tribes or territories. These eight preliminary approachesinclude; 1) the Toxicological Dose-Response Approach, 2) the Relative Bed Stability andSedimentation Approach, 3) the Conditional Probability Approach to Establishing Thresholds, 4) State-by-State Reference Condition Approach, 5) the Fluvial Geomorphic Approach, 6) theWater Body Use Functional Approach, 7) successful new State approaches and, 8) combinationsof 1-7 or a synthesis of components of each. The first 5 approaches focus on aquatic life. Theseapproaches are described in more detail below.

31
Potential Options:
1. Toxicological Dose-Response Approach:
Since the early 1980's, EPA has developed water quality criteria for specificpollutants to protect aquatic life under Section 304(a) of the Clean Water Act. Thecriteria provide recommendations to States and Tribes for adopting water qualitystandards which are the basis for water quality-based National Pollutant DischargeElimination System (NPDES) permit limits for controlling point source discharges andfor establishing total maximum daily loads (TMDLs) for water bodies. The majority ofEPA’s aquatic life criteria have been derived from two methodologies: the 1980Guidelines for Deriving Water Quality Criteria for the Protection of Aquatic Life and ItsUses, and the 1985 Guidelines for Deriving Numerical National Aquatic Life Criteria forProtection of Aquatic Organisms and Their Uses. A third revision is currently underwayat EPA to incorporate the science and technology advancements of the last 20 years.
When considering approaches for SABS criteria, it is useful to have anunderstanding of how the Guidelines are ordinarily applied. Under the Guidelinesapproach, acute toxicity test data must be available for species from a minimum of eightfamilies with a minimum required taxonomic diversity. The diversity of tested species isintended to assure protection of various components of an aquatic ecosystem. The finalacute value (FAV) is an estimate of the fifth percentile of a sensitivity distributionrepresented by the average LC50/EC50s of the tested genera. The Criterion MaximumConcentration (CMC) is set to one-half of the FAV to correspond to a lower level ofeffect than the LC50s/EC50s used to derive the FAV. Chronic toxicity test data (longerterm survival, growth, or reproduction) must be available for at least three taxa to derivea final chronic value (FCV). A Criterion Continuous Concentration (CCC) can beestablished from a FCV calculated similarly to an FAV, if chronic toxicity data areavailable for eight genera with a minimum required taxonomic diversity; or most oftenthe chronic criterion is set by determining an appropriate acute–chronic ratio (the ratio ofacutely toxic concentrations to the chronically toxic concentrations) and applying thatratio to the FAV. When necessary, the acute and/or chronic criterion may be adjusted toprotect locally important or sensitive species not considered during development of thecriterion, or can be adjusted based on local water chemistry. Once developed, the CMCand CCC incorporate exposure duration and frequency factors, i.e; the CMC one-houraverage should not be exceeded more than once in three years on average, or the CCCfour-day average should not be exceeded more than once in three years.
SABS criteria based on toxicological and/or behavioral effects can be developed,in theory, much like other EPA toxic chemical criteria. However, EPA has concludedthat sound data are lacking for most species, and standardized consensus-based testmethods for determining sediment effects are generally unavailable. Therefore, it isunlikely that a list of genus mean acute and chronic values for sediment can be developedin the short-term and such an effort would require substantial resources. A seconddifficulty is that sediment can consist of many things depending on the site. Therefore,much like other “conglomerate” substances such as oil and grease or dissolved solids, itwill be difficult to identify appropriate criteria for sediments without first determining thespecific type of sediment (organic vs. inorganic; silt vs. clay, fine vs. coarse, etc.).

32
However, toxicological or behavioral-based criteria for SABS have the advantageof specifying appropriate management levels depending on the types of aquatic lifepresent. Furthermore, this approach is explicitly causative; controlled laboratory or fieldanalyses are used to determine threshold effect concentrations. In addition, it could bepossible to specify the amount of reduction in suspended sediment or sedimentationneeded to maintain desired aquatic resources using this approach. One modified way inwhich sediment thresholds can be reasonably implemented is through sediment criteriabased on a few sensitive target indicator species for which some sediment effect levelsare known (e.g., trout, certain corals, certain EPT taxa, or bluegills). Each indicatorwould represent certain types of beneficial uses, aquatic systems or regions of the U.S. This is similar to a risk assessment approach. If such thresholds could be developed,however, there would still be uncertainties due to synergistic interaction of the manyother factors that influence sedimentation effects.
SABS have many impacts in aquatic ecosystems, and effects on the biota varyconsiderably among habitats. However, there are dose-response models for some speciesin some habitats, and criteria have been developed for their protection (e.g., BritishColumbia Guidelines in Caux et al., 1997, Chesapeake Bay Water Clarity Guidelines inU.S.EPA, 2000b). Using these approaches at a national level needs further investigation..
In summary, if the necessary data were available in the literature, the mainstrength of pursing a toxicological approach is that it employs a standardizedmethodology which has general acceptance by the scientific, regulatory and stakeholdercommunities. In addition, this approach would be more cost-effective and lessburdensome on the States, as nationally recommended criteria values could be readilyadopted without extensive data collection, analysis or water body-specific adjustments. This approach, however, would suffer from two additional key limitations. First is theabsence of natural or background concentrations and organism acclimation beingfactored into the methodology. The second is the presumption applied to toxic chemicalsthat there is an absolute value above which effects are likely to occur for certain sensitivespecies, and below which they do not. SABS do not necessarily act on organisms in theenvironment in the same way as do toxicants. Also how would duration and frequencybe defined for SABS, if at all? In principle, these limitations could be addressed throughcertain EPA-approved mechanisms to modify national criteria on a site-specific basis. The Recalculation Procedure (USEPA 1994), for example, could be used to refine thenational SABS criteria based on the types of species that could occur in the region orwaterbody classification, and their natural sensitivity to SABS. However, use of such aprocedure assumes the availability of fairly large acute toxicity database (>20 genera, at aminimum), which may not be feasible in the short-term.
2. Relative Bed Stability and Sedimentation Approach:
Stream bed characteristics are often cited as major controls on the speciescomposition of macroinvertebrate, periphyton, and fish assemblages in streams (e.g.,Hynes, 1972; Cummins, 1974; Platts et al., 1983). Along with bedform (e.g., riffles andpools), substrate size influences the hydraulic roughness and consequently the range ofwater velocities in a stream channel. It also influences the size range of interstices thatprovide living space and cover for macroinvertebrates, salamanders, sculpins, anddarters. Accumulations of fine substrate particles fill the interstices of coarser bed
33
materials, reducing habitat space and its availability for benthic fish andmacroinvertebrates (Platts et al. 1983; Hawkins et al., 1983; Rinne 1988). In addition,these fine particles impede circulation of oxygenated water into hyporheic habitats. Substrate characteristics are often sensitive indicators of the effects of human activitieson streams (MacDonald et al., 1991). Decreases in the mean substrate size and increasesin stream bed fine sediments can destabilize stream channels (Wilcock 1998) and mayindicate increases in the rates of upland erosion and sediment supply (Lisle, 1982Dietrich et al., 1989).
Although many human activities directly or indirectly alter stream substrates,streambed particle sizes also vary naturally in streams with different sizes, slopes, andsurficial geology (Leopold et al., 1964; Morisawa, 1968). The size composition of astreambed depends on the rates of supply of various sediment sizes to the stream and therate at which the flow takes them downstream (Mackin, 1948). Sediment supply tostreams is influenced by topography, precipitation, and land cover, but the source ofsediments is the basin soil and geology, and supplies are greater where these materialsare inherently more erodible. Once sediments reach a channel and become part of thestream bed, their transport is largely a function of channel slope and discharge duringfloods (in turn, discharge is largely dependent upon drainage area, precipitation, andrunoff rates). For streams that have the same rate of sediment input from watershederosion, steeper streams tend to have coarser substrates than those with lower gradient,and larger streams (because they tend to be deeper) have coarser substrates than smallones flowing at the same slope. However, this transport capability can be greatly alteredby the presence of such features as large woody debris and complexities in channel shape(sinuosity, pools, width/depth ratio, etc.). The combination of these factors determinesthe depth and velocity of streamflow and the shear stress (erosive force) that it exerts onthe streambed. By comparing the actual particle sizes observed in a stream with acalculation of the sizes of particles that can be mobilized by that stream, the stream bedstability can be evaluated. Furthermore, it can be evaluated whether low values of bedstability are due to accumulation of fine sediments (“excess fining”), and may examinewatershed data to infer whether the sediment supply to the stream may be augmented byupslope erosion from anthropogenic and natural disturbances.
Quantifying Relative Bed Stability and Sedimentation
Relative Bed Stability (RBS) is calculated as the ratio of observed substrate diameterdivided by the calculated “critical” or mobile diameter (Dingman, 1984). RBS is theinverse of the substrate “fining” measure calculated by Buffington and Montgomery(1999a, b), and is conceptually similar to the “Riffle Stability Index” of Kappesser (1995)and the bed stability ratio discussed by Dietrich et al., (1989).
Bed Substrate Size: When evaluating the stability of whole streambeds (vs. individualbed particles), observed substrate is typically represented by the average diameter ofsurface substrate particles (e.g., D50 or the geometric mean). To characterize the actualsubstrate particle size distribution in a stream channel, EMAP follows widely acceptedprocedures. The EMAP field protocols (Kaufmann and Robison, 1998) like those ofmost practitioners (e.g., Platts et al., 1983; Bauer and Burton, 1993) employ a systematic“pebble count," as described by Wolman (1954), to quantify the substrate sizedistribution.
34
Critical Substrate Size: For calculating critical (mobile) substrate diameter in a naturalstream, it is necessary to estimate average streambed tractive force, or shear stress, forsome common reference flow conditions likely to mobilize the streambed. Bankfulldischarge is typically chosen for this purpose, though it is more appropriate for gravel-bed streams than for “live-bed” streams such as naturally sand-bedded streams thattransport bedload at lower flows. The EMAP approach for estimating the criticalsubstrate particle diameter in a stream is based on sediment transport theory (e.g., Simonsand Senturk, 1977), which allows an estimate of the average streambed shear stress orerosive tractive force on the bed during bankfull flow. Stream channels can be verycomplex, exhibiting a wide range in local bed shear stress due to small-scale spatialvariation in slope, depth, and roughness within a channel reach (Lyle et al., 2000). Whendeveloping this approach, EMAP researchers (Kaufmann et al., 1999; Kaufmann andLarsen, in prep.) used physical habitat measurements collected in synoptic surveys(Kaufmann and Robison, 1998) to estimate the channel characteristics affecting bed shearstress at bankfull flows. These field measurements include bankfull channel dimensions,slope, channel complexity, and large woody debris. Using the channel and substrate datadescribed in the two preceding paragraphs, EMAP researchers modified the Dingman(1984) RBS calculation to accommodate losses in shear stress resulting from large woodydebris and channel complexity (Kaufmann et al., 1999). The reductions in shear stress,and therefore critical diameter, caused by these roughness elements allow fine particles tobe more stable in a stream of a given slope and depth.
RBS Range: RBS values in EMAP sample streams range from 0.0001 to 1000. A highpositive value of RBS (e.g., 100-1000) indicates an extremely stable, immovable streamsubstrate like that in an armored canal, a tailwater reach below a dam, or other situationswhere the sediment supply is low, relative to the hydraulic competence of the stream totransport bedload sediments downstream (Dietrich et al., 1989). Very small RBS values(e.g., .01-.0001) describe a channel composed of substrates that are frequently moved byeven small floods.
RBS Expectations in Unaltered Streams: It is hypothesized that, given a naturaldisturbance regime, sediment supply in watersheds not altered by human disturbanceswill be in approximate long-term dynamic equilibrium with transport. For streams withsediment transport limited by competence (critical shear stress), rather than total capacity(stream power), the mean of RBS values in these relatively unaltered streams shouldapproximate 1.0 (range from 0.3 to 3), and may have slight surface coarsening due to lowhillslope erosion rates (Dietrich et al., 1989). Alternatively, RBS for streams drainingwatersheds relatively undisturbed by humans should tend towards values other than 1.0that are characteristic of the region or specific classes of streams within a region,depending upon their natural lithology, soils, topography, climate, and vegetation. Inaddition, RBS in streams with minimal human disturbance might be expected to differsystematically across a geomorphic gradient from streams with transport dominated bybedload to those dominated by suspended load – generally this occurs in a downstreamdirection in the stream continuum. RBS values considerably lower than 1.0 may beexpected in naturally fine-bedded alluvial streams where transport is limited by averagestream power, rather than bankfull shear stress. Alternate hypotheses concerning theexpected values of RBS using synoptic data from EMAP surveys are being evaluated. Asthe EMAP approach for assessing excess streambed sedimentation in low-gradient, fine-bedded streams and rivers, is refined, it may be necessary to modify the approach

35
(currently based on the competence of bankfull floods to move given sizes of particles). For these waters, it may be useful to estimate bed stability in terms of the proportion ofthe year that the bed is in motion.
Excess Sediment: In watersheds where sediment supplies are augmented relative to astream’s bedload transport competence, it is expected there will be evidence of excessfine sediments, or “textural fining” (Dietrich et al., 1989). Very small RBS values (e.g.,.01-.0001) describe a channel composed of substrates that are frequently moved by evensmall floods, indicating excessive amounts of fine particles compared with expectedvalues in most relatively undisturbed watersheds. Such evidence of textural fining of thestream bed (RBS<<1) typically occurs when land use activities increase hillslope erosion (Lisle, 1982; Dietrich et al., 1989; Lisle and Hilton 1992). It is further expected that, forstreams draining basins of equal erodibility, RBS values should decrease in proportion toincreases in sediment supply above that provided by the natural land disturbance regime. To the extent that human land use increases sediment supply by land erosion withinregions of relatively uniform erodibility, RBS of streams in surveys should be inverselyproportional to basin and riparian land use intensity and extent. This association of lowerRBS with land use disturbances in several regions has been demonstrated (Kaufmann etal, 1999, Kaufmann and Larsen, in prep.) Finally, the more erodible the basin lithologywithin a geoclimatic region, the steeper the decline in RBS with progressive disturbanceis expected. As demonstrated for streams in the Pacific Coastal region by Kaufmann andLarsen (in prep.), this means that any given amount of land use disturbance is expected toaugment sediment supplies to a greater degree in basins underlain by erodible rocks thanby more resistant rock.
Evaluating Effects of Sediment on Biota
Once the degree of sedimentation is estimated for sample sites, associations betweenbiotic assemblages (algae, macroinvertebrates, fish, rooted aquatic plants), and/or keyaquatic species or guilds, and deviations of sediment from expected values will beexamined. In most cases, the data sets will include sites affected by multiple stressorsbesides sediment that could potentially act upon these aquatic biota. In such cases, aregional plot of sediment concentration versus some biotic assemblage characteristic(e.g., %EPT macroinvertebrates), will appear as a wedge-shaped pattern of points, whereprogressively higher fine sediment concentrations are sufficient to limit %EPT numbers,but low concentrations do not guarantee abundant EPT because of other habitat orchemical limitations. These patterns are consistent with a hypothesis that sediment islimiting biota. After demonstration of a plausible causal mechanism (from detailedexperimental studies) and elimination of other plausible explanations for theseobservations, these kinds of associational data in a weight-of-evidence approach tosupport modeling of the effects of bedded sediments on aquatic biota will be used.
For suspended sediments in streams and rivers, the effort will focus initially on chroniclevels of suspended sediments in streams and rivers, rather than those resulting fromepisodic events such as those accompanying storms. Expected natural levels of chronicsuspended solids will be set on the basis of data from flowing waters in basins relativelyundisturbed by human land uses and (in rivers) historic water clarity data to the extentpossible. Regional reference areas could serve this purpose. Where no relativelyundisturbed waters exist, as for large rivers, historic data or reconstructions of fish and/or

36
macroinvertebrate assemblage composition will be used to infer (from publishedtolerance information) pre-disturbance suspended sediment characteristics. In anapproach similar to that for bedded sediments, associations between biotic and/or keyaquatic species or guilds and deviations of sediment from expected values in appropriateregional settings will be examined. As for bedded sediments, patterns will be sought that are consistent with biotic limitation by suspended sediment in a weight-of-evidenceapproach to support modeling the effects of bedded sediments on aquatic biota,supporting this information with controlled experimentation or literature reference toestablish the suspended sediment levels that cause substantial impacts on assemblages,sensitive guilds, or key species.
3. Conditional Probability Approach to Establishing Thresholds:
A conditional probability approach using survey data is a third proposal fordeveloping SABS criteria. This approach is consistent with the expression of numericwater quality criteria as likelihood of impacts when exceeding a value of a pollutionmetric. The approach uses survey data (sites selected with a probabilistic design) anddetermines the likelihood of impaired biology for varying levels of a stressor (in thiscase, some form of sediment). The use of probability-based survey data permits anunbiased extrapolation of results to the statistical population from which the probabilitysample was drawn (e.g., the results would be applicable to all of the wadeable streams ina state if the sample was drawn from a sampling frame of all wadable streams in thestate).
For application to numeric water quality criteria, a conditional probabilitystatement provides the likelihood (probability) of impacts, if the value of the pollutionmetric is exceeded. The conditional probability is the probability of an event when it isknown that some other event has occurred, and is denoted P( Y | X* ), where X* is theother event that has occurred. For criterion development, X* is replaced with X > XC,where XC is the specific threshold that is exceeded. Therefore, the conditionalprobability statement is P ( Y | X > XC). This approach is similar to the apparent effectsthreshold approach developed by Long and Morgan (1991) and MacDonald and Ingersoll(2002) to derive sediment quality guidelines.
Data on benthic communities in Mid-Atlantic wadable streams were collected byUSEPA’s Environmental Monitoring and Assessment Program (EMAP) in 1993-94 andare used to test and evaluate the approach. These data were part of a suite of indicatorscollected at sites selected with a probability-based design, and have been reported in theMid-Atlantic Highlands Assessment State-of-the-Streams report (EPA-903-R-00-015). A stream sedimentation threshold of impacts was determined for a channel sedimentationindex (CSI). The CSI expresses the deviation in the actual amount of substrate fines fromthat which would be normally expected to occur. EMAP stream benthic invertebratesurvey data were used to determine the likelihood of impaired benthic community (EPTtaxa < 9) as a function of the CSI.
This approach is implemented as a two-step process: first, subset the surveyedstream segments into those that exceed a specific CSI value, and second, determine thefraction of the subset with impaired biology. Since the sites were selected with aprobabilistic design, the fraction of the stream segments that is impaired is the probability

37
of observing impaired streams if a specific CSI value is exceeded. This process is thenrepeated for the entire range of observed CSI values. The result is an empirical curve forprobability of impact for streams exceeding CSI values. Different analytical proceduresare used to illustrate how thresholds of impact can be identified from this empiricalcurve.
To implement this approach, the following must be assumed or provided:
1. Some metric, X, that quantifies the pollution parameter for which criteria will bedeveloped. In the example, the CSI is used.
2. It is not necessary that X be the only stressor affecting the aquatic community, but itmust be a strong stressor, that is, aquatic community condition Y is clearly related to thestressor X for higher values of X. Thus, if the value of Xcis exceeded, it is likely animpact of the biological resource will be present, over and above what occurs naturallyand from other stressors.
3. Some independent measure for determining biological impact must be available. Inthe example, EPT taxa < 9 defined biological impact.
4. Data from a probabilistic design must be available in order to establish the likelihoodfor impact across an entire geographic area. This is currently the only scientificallydefensible means of extrapolation from sites with data to all the sites across an entireregion.
Perhaps the biggest limitation of this approach is that it is correlative and notcausative. If other factors (including unmeasured ones) are actually responsible forbiological impact and not SABS at a given site, the model inaccurately represents SABSeffects, and inappropriate SABS criteria may result. This may be sufficient for screeningbut is inappropriate for regulatory actions.
4. State-by-State Reference Condition Criteria Derivation Approach:
The reference condition approach for developing sediment criteria is derived fromthe regional reference approach for developing biocriteria (EPA 1996; 1998, 2000;Barbour et al. 1999). Analytical approaches 2 and 3 above (relative bed stability andconditional probability), and 5 below (fluvial geomorphological approach) are alsocompatible with examining and identifying reference conditions, and many of the samemeasurements would be used in all three approaches. In fact, the derivation ofexpectations for relative bed stability (RBS) in unaltered streams (Approach 2 above) is aspecific reference condition predictive model. Described below is a more genericapproach to deriving sediment criteria from reference site information.
There are well-established empirical and theoretical relationships describing theeffects of landscape topography, climate, and geology (including soil properties) onchannel morphology and sediment dynamics of streams (see Fig. 3 and examples inKnighton 1984 and Gordon et al. 1992). It seems reasonable, therefore, that empiricalmodeling of sediment characteristics based on these known relationships would be anappropriate method of developing criteria for SABS. The most defensible expectations

38
would be built using relationships derived from non- or minimally disturbed streams (thedesired condition).

39
Figure 3 – Three major determinants of sediment characteristics in streams are catchment soil type,topography, and climate. The reference approach builds empirical models of sediment characteristics fromminimally disturbed sites using factors related to these major landscape determinants.
The reference approach to developing biocriteria uses minimally disturbedreference streams to build predictive models of stream condition based on measurablecharacteristics (e.g. topography, geographic region, site and basin physicalcharacteristics). Similar models can be constructed and confirmed to predict referenceconditions with respect to sediment. They can then be used to predict acceptable rangesfor specific streams based on the physical catchment characteristics of the stream. Fromthis, a variety of criteria could be developed. For example, a certain deviation fromprediction can be used (e.g. no more than 20 percent of predicted suspended solids) ormodels for different stream classes can be averaged to come up with class-specificcriteria (e.g., the 75th percentile for Piedmont streams with a watershed size less than 50km2). In addition, gradients or increases above reference condition associated withincreasing levels of human disturbance can both be explored and related to humandisturbance levels much as suggested for biological condition responses. In either case,the reference condition represents one point along the gradient. The approach alsoapplies to both suspended and bedded sediment characteristics and should be applicableto other water body types other than streams and rivers, with some modification.
Although the models are empirical in that they require data analysis to developthem, the hypothesized relationships between climate, topography, soils, etc. are firmlybased in theory and experiment from the body of hydrological knowledge. These modelsdo not merely attempt to find the best statistical predictors, but the best measurablepredictors that fit well in hydrological knowledge.
Defining Reference
An important step in the reference approach is selecting those streams that willmake up the reference database (i.e., to build the model). Reference, in this sense, doesnot mean pristine; rather, it represents the desired stream state or what is “referred” towhen evaluating the condition of any stream. Reference catchments are usually selectedusing a set of a priori designated reference criteria. In the case of model building forpredicting sediment, it is important to include criteria that screen for minimally disturbedcatchments. Since sediment supply and hydrology respond to most landscapemodifications, the first reference criteria are derived from contemporary land use/landcover data and catchments with predominantly natural vegetation cover. A uniqueconsideration for selecting sediment reference sites is also historic land use. The

40
response time of stream channel equilibrium to landscape alteration is on the decades tocenturies time scale, if not longer (Trimble 1974, Schumm 1977, Brunsden and Thornes1979, Trimble 1999). Therefore, it is important to consider historic catchment land usewhen evaluating potential reference catchments. Those that have experienced historicanthropogenic landscape disturbance may likely still be undergoing geomorphicreadjustment. Unless this is an acceptable “reference”, these sites should be excludedfrom the reference database.
In addition to land use/land cover, instream modifications are also important. Thepresence of dams, channelization, dredging, and diversions will all affect instreamsediment dynamics. Dams alter the sediment supply and hydrology of rivers, andtherefore, have dramatic impacts on sediment dynamics, often for long distancesdownstream (Walker 1985, Reiser et al. 1989, Gregory and Madew 1982, Gordon et al.1992). Channelization, dredging, and other channel modifications alter stream channelgeometry. Because channel geometry is related to stream power and, therefore, sedimenttransport, readjustments such as knickpoint migrations occur following these channelimpacts. These impacts often migrate downstream and upstream through a catchmentcausing long-term channel instability and altered sediment dynamics (Miller 1991, Simonand Hupp 1992). Water diversions alter the hydrology of receiving streams and theresulting reduction in flow can lead to channel destablization by sediment accretion. Therefore, it is important to identify present or historic instream modifications within thecatchment when developing a reference database.
A list of criteria would be prepared such that all conditions must be met for a siteto be designated as reference (Hughes 1995). The following list is an example ofpossible criteria for selecting reference sites for characterizing sediment benchmarks ornatural background.
• Upwards of 95% of the watershed is in natural and undisturbed cover. • Historical land uses did not disturb more than 10% of the land in the last 50 years
or more than 25% of the land in the last 100 years.• Activities in the portions of the watershed that are not in natural cover are not in
sediment generating land uses such as mining, logging or cultivation on steepslopes, etc.
• Roads do not cross the stream more than once per mile. Road maintenance doesnot include excessive sanding.
• The stream channel is not altered by dams, channelization, dredging, or diversionswithin 10 miles upstream of the sampling location. The stream channel was notaltered in the last 50 years.
These criteria might be considered too lenient in regions with extensiveundisturbed land (e.g. Rocky Mountains) or too restrictive in regions with highpopulation densities and few remote areas (e.g. Northeastern Coastal Plain). Whenapplication of a set of criteria result in too many or too few many reference sites, thecriteria can be adjusted and re-applied until appropriate sample sizes are obtained. Fivereference samples per discrete stream type is an absolute minimum reference data set. Thirty samples per stream type are desirable but often unobtainable (Elliott 1977). Whenreference stream types are not defined discretely a priori, then care must be taken to notexclude important unique natural stream conditions. Criteria may vary from one region
41
to the next, or from one discrete stream class to the next (e.g. mountain streams or plainsstreams). By varying the criteria to allow for natural variation in sediment loads orubiquitous land use patterns, all possible reference conditions are represented and modelsbuilt upon the reference data will be applicable in all types of streams in the region.
Data Requirements
Since many state and federal biological monitoring programs (e.g., statebiocriteria programs, EMAP, NAWQA) have identified reference sites and now havesizable reference databases, it may be possible to mine the existing reference data,augmented with basin-level data as necessary to examine preliminary models. It ishighly likely that EMAP and NAWQA have sufficient data, including extensivesediment, physical and hydrologic data, to develop good predictive models of referencesediment conditions. Many of the state programs, however do not collect hydrologic orsediment data beyond RBP habitat assessment, and their reference sites may need to berevisited to collect the relevant data.
Once reference sites are identified, empirical models of suspended and bedsediment characteristics of those reference streams can be constructed. The models arebuilt to predict the sediment characteristics of particular streams based on their soil,topographic, and climatic setting – the assumption is that these primary factors controlthe supply and transport of suspended and bed sediment. Several important sources ofdata are required to identify reference sites and build the models: land use, soil data,climate and hydrology, catchment geomorphology, and sediment data.
Current and historic land use data are necessary for reference site selection toestimate land use/land cover and the presence of any instream modifications. Currentland use data are available for most of the contiguous US (e.g., LANDSAT), and thetechnology is advancing rapidly so that more current data are being made availablerapidly. However, historic land use data are often harder to access due to the onlyrelatively recent development of GIS technology (e.g., ArcView, ArcInfo, ArcGIS). Fortunately, historic land use information can often be reconstructed from tax data,historic photographs, historic diaries, etc. In addition, several techniques have beendeveloped by fluvial geomorphologists to identify and/or infer past land use disturbance(e.g., dendrochronology, sediment profile dating, floodplain and terrace coring, etc., seeKnighton 1984). These methods can be used to investigate past impacts within apotential reference catchment.
To build predictive models, data on soils, including factors such as soil type,texture, erodibility, porosity will be necessary. Fortunately, detailed soil maps areavailable for much of the US and are maintained by the Natural Resources ConservationService (NRCS). Climate data, including precipitation and hydrology are also necessaryfor building these models. Climate data are available for most of the U.S. throughNOAA and state climate offices, and are often accessible via the internet. Hydrologicdata are maintained by several agencies, including the USGS and state geologicalsurveys, and are, likewise, often accessible via the internet. However, hydrology is oftenonly available for gauged catchments and may have to be modeled for others. A varietyof hydrologic models exist and can be used as necessary (Gordon et al. 1992). Catchment geomorphology is also necessary, including data on topography, catchment

42
size, etc. These data are readily extracted from surface topographic maps using a GIS. Ideally, the purpose of the models will be to predict reference sediment characteristicsmeasurable in single “snapshot” data collections during routine stream monitoring. Nevertheless, it will probably be necessary to begin with models and data sets thatinclude dynamics, including peak flows, stream power, sediment transport, etc. Initialmodeling efforts should focus on accurately and reliably predicting the critical dynamicmeasures from catchment characteristics.
Lastly, and most importantly, suspended and bed sediment data for specifiedstudy reaches are necessary. The same measures and derived quantities relevant toapproaches 2, 3, and 5 are also relevant here, e.g., relative bed stability (RBS), bedsubstrate size, critical substrate size, RBS range, channel sedimentation index (CSI),Rosgen class, etc. Total suspended sediment (TSS) data are ideal. Turbidity data usingnephelometric turbidity units (NTU) can be converted in some cases, depending on thesediment composition, but the relationship between TSS and NTU is not always linearand can be difficult to convert. Bed transport data are less often collected due to the lackof robust methods, but bed texture data are often available from pebble count or coredata.
Analytical Approaches
Once data have been assembled for a region, a number of analytical approachescan be used to build models to predict sediment characteristics for a stream. Empiricalmodels are those built from the existing data. Continuous predictive empirical modelspredict the sediment characteristics for a specific stream reach based on its particulartopography, soil type, and hydrology. The derivation of RBS expectations in unalteredstreams described in (2) above is an example of a continuous predictive model forreference conditions. Much like the River Invertebrate Prediction and ClassificationSystem (RIVPACS)-type models (Wright et al. 1984, Hawkins et al. 2000, Wright 2000)build site-specific predictions of invertebrate communities based on reference siteinvertebrate data for biological assessment and biocriteria development, continuouspredictive empirical sediment models would build a site-specific model for sedimentcharacteristics at a particular site based on data from similar reference sites in the region. This can be done using a combination of multivariate and multiple regression techniques. Discrete predictive empirical models could also be used. Instead of building a site-specific model, these models predict sediment characteristics for discrete classes ofstreams. Streams would be explicitly classified from the outset, and then statisticalmodels of sediment characteristics used to identify the expected sediment characteristicsfor each stream class. This has been the approach commonly used for buildingmultimetric-type biological assessment models (e.g., IBI). The Fluvial geomorphologicalapproach (option 5 below) is an example of a discrete classification.
In the absence of robust data for reference sites across the range of streams in aregion, which is often the case, theoretical models are also an option. Theoretical modelsare built from theoretical principles and do not require field data. Theoretical modelscould be used to predict sediment characteristics for specific sites (continuous) or siteclasses (discrete). A combination of empirical and theoretical models could also bedeveloped that uses theoretical estimates of predictor variables that can then be used inconcert with empirical data to build predictive models. Likely, combined models will be
43
most often used, since large spatial and temporal data gaps will exist for certain regionsor for certain types of data.
Once the models are built and confirmed using validation datasets, criteria can bedeveloped based on statistical properties of the predicted sediment values. For sitespecific predictions, deviations of the predicted values from observed values forreference sites can be used to construct an acceptable level of deviation based on naturalreference site variability. For example, in RIVPACS models, the standard deviation ofobserved/expected scores at reference sites is used as an indicator of methodological andnatural variability among reference sites. Any ratio outside that deviation is consideredimpaired. In a similar way, the predicted sediment to actual sediment value ratio fromspecific model building reference sites can be used as an indicator of acceptablevariability and a ratio outside that range (e.g., 20% greater than expected) would beconsidered impaired. The criteria in that case would be a standard deviation or percentileabove 1.0, where the expected value equals the observed value.
For discrete models, a percentile of the reference site values can be used as thecriterion. In IBI models, the 25th percentile of IBI values for a specific class of streams isoften used as the criterion for defining impairment where an IBI score below that isconsidered impaired. Similarly, the 75th percentile of reference site sediment values for aspecific class of streams could be used as the impairment criterion. A TSS value abovethe 75th percentile for that class of streams would be considered impaired.
Values from either of these approaches can also be interpreted along disturbancegradients. Either predicted to actual sediment scores or the sediment values themselvescan be related to human disturbance gradients. In either case, the reference conditionwould be placed along the gradient and other values interpreted appropriately.
5. Fluvial Geomorphic Approach:
Analytical methods that address within-channel and hillslope sediment sourcesand transport processes as well as sediment loads may be applicable to sediment criteriadevelopment and relevant to management actions that address impairments at the source. Fluvial geomorphology as a discipline offers theory, classification systems, and fieldmeasurement tools indicative of river or stream stability and changes relative to currentand predicted sediment supply. A geomorphic approach to criteria development wouldlikely have less measurement of effects on biota, but more emphasis on measuringerosional and depositional processes and rates that may affect a variety of designateduses.
An ongoing, EPA-funded study conducted by David L. Rosgen is developing asediment assessment framework, called Watershed Assessment of River Stability andSediment Supply (WARSSS), that is based on geomorphic analysis of the currentsedimentary state of watersheds and stream systems. Although this study is directedmore toward assessment to guide sediment management actions than to detect thresholdsof adverse impact, as criteria do, the WARSSS framework merits examination forelements potentially useful to sediment criteria development.
The analysis separately considers hillslope and channel processes responsible for

44
changes in erosion/sedimentation and related stream channel instability. Twohierarchical levels of assessment are included that provide: 1) an initial broad overview“screening level” to identify and prioritize potentially high risk sub-watersheds/riversystems to be subjected to a more detailed prediction assessment for process-specificmitigation; and 2) a process-based, quantitative prediction of potential sediment sourceand magnitude, streamflow changes and river stability related to the nature, extent andlocation of a variety of land uses. WARSSS includes a bank erosion model forquantifying the relative contribution of bank erosion versus hillslope and other sources ofsediment (Rosgen 2001). A monitoring methodology related to the prediction methodswill provide for validation of the assessment methodology and track effectiveness ofrecommended mitigation to reduce existing excess sediment loading and improvechannel stability. As an assessment framework rather than a rigid methodology,individual steps in a WARSSS assessment are amenable at the user’s discretion tosubstitution of alternate models or measures that are better suited to the region or waterbody type being assessed.
Numerous authors (Rosgen 1994 and 1996, Montgomery and Buffington 1993,Meyers and Swanson 1992, Simon 1992) have observed the relationship between channeltype classifications and differences in stability among channel types. This relationshiphas ramifications for determining appropriate strategies for sediment management. Forexample, an individual who hasn’t considered channel type or stability could spend agreat amount of time and effort running bedload transport equations and doing factor ofsafety analysis on streambanks, when the potential for instability and/or disproportionatesediment supply problems may be minimal. The channel type/stability relationship alsomay have value in determining appropriate differences in criteria among stable andunstable stream types. Channel evolution theory, which generally contrasts the structuralproperties of stable and unstable (or transitional) channels and identifies common sets ofsteps that transitional channels pass through in evolving toward a more stable state,further suggests that it may be possible to take into account the likely stable endpoint ofunstable channels when setting waterbody-specific sediment criteria.
Moreover, a variation of the concept of reference condition discussed previouslyis applied by geomorphologists and hydrologists to characterize “reference reaches” ofstable channel types. The channel type classes in the Rosgen classification system(Rosgen 1994) were developed and defined by recognizing consistent patterns in channelmeasurements from numerous reference reaches. Parameters commonly measured todocument channel dimension, pattern and profile include bankfull width/depth ratio,channel slope, sinuosity, entrenchment ratio, and bedload particle size distribution. Fora channel class that is typically stable, the physical traits of a reference reach wouldlikely complement the biological traits documented in the same channel type’sbioassessment of reference condition. Likewise, typically unstable classes’ referencereach data may co-occur with and help explain sub-par bioassessments. The added valueof structural reference reach data is their closer relationship to sediment supply andtransport processes that play a part in determining stream disturbance by sediment.
Another element addressed in the WARSSS study that can be evaluated forapplication to sediment criteria involves sediment rating curves (SRCs) that plot, for agiven channel, either suspended sediment or bedload against flow. Although generalunderstanding of SRCs is limited, they may have some application potential related to

45
criteria if reference relationships can be developed. Suspended sediment concentration,for example, is often found to be correlated with flow rate, and the literature does offersome evidence that sediment rating coefficients and flow are predictably interrelatedwithin a given region (Hawkins 2002). In an examination of SRCs for suspendedsediment and bedload of 160 Rocky Mountain rivers and streams, Troendle et al. (2001)were not able to show differences in dimensionless sediment transport attributable tostream type, but the analysis did reliably detect departure of generally unstable streamtypes as a group from values expected of stable channels. Ongoing work towarddeveloping and testing reference SRCs continues mainly in the Rocky Mountain stateswith some investigations in other regions of the United States and Great Britain. Preliminary findings suggest that channel type plus stability may reveal a strongerrelationship than channel type alone.
In conclusion, evaluating applicability of geomorphic approaches to EPA’ssediment criteria development process should consider:
• What geomorphic measures associated with channel stability and instabilitywould make suitable numeric criteria?
• Can water-column or bedload sediment measurements be paired with channeltype classification, by developing different instream numeric criteria for differentchannel types?
• How can measures of hillslope, land use-related sediment loads best be integratedwith measures of channel-derived sediment loads?
• What would be the cost and effort implications for state monitoring programs ofusing various geomorphic measurements to assess sediment impacts?
• Will other regions be able to develop and apply sediment rating curverelationships that are being developed in some regions of the US?
• Would integrating biotic with geomorphic reference data reduce variability inbiotic measures within a given channel type and make biocriteria for sedimentassessment consistent?
• As geomorphic measures are more closely related to sediment sources andsediment transport processes than are measures of water column effects orbiological effects, would they be more useful for guiding sediment control andremediation activities implemented as a result of criteria non-attainment?
• Can this approach be used to develop classification schemes for use with otherapproaches?
6. Water Body Use Functional Approach:
The waterbody functional approach is proposed for developing SABS criteria fordesignated uses other than aquatic life. This is not necessarily a new method orapproach, but is one that would examine the existing literature and focus criteria on non-

46
aquatic life uses. This approach would primarily apply to recreational (swimming,boating, etc.), industrial, navigational, drinking water and agricultural uses, etc. Underthis approach there would not be a need to determine toxic or harmful levels of SABS toaquatic life. Rather, benchmarks would be set based on data and information from theliterature and State experiences, that would be protective of the functional use. Forexample, if shipping and navigational uses were the primary use of a water body, criteriawould be established to prevent or minimize the depositional rates of sedimentation thatwould prevent accelerated filling of shipping channels thereby preventing frequentdredging to maintain those channels.
Likewise, for agricultural water usage, including irrigation and livestockwatering, etc., benchmarks could be set based on data that illustrates the level ofsediment that causes problems to pumps and piping or increases the need and expense forfiltering. Similarly, benchmarks could be set to protect levels of clarity for swimming,drinking water and other functional uses where the literature indicates potentialthresholds for protecting these non-aquatic life uses. Dose-response relationships foraquatic biota would not be a critical basis for these criteria.
Functional-based benchmarks for protecting uses other than aquatic life wouldapply primarily to waterbodies where aquatic life uses do not exist (historically notpresent, removed through a Use Attainability Analysis (UAA)), or where multipledesignated uses have been assigned to a water body (such as a extensive river system)and SABS levels fluctuate substantially throughout the length of the system.
However, where multiple designated uses such as aquatic life and irrigationoverlap in a water body or on a specific segment or portion of the water body, SABScriteria set to protect the aquatic life use most likely will be stringent enough to protectall other uses and additional functional criteria may not be necessary. This is apresumption that needs further investigation to confirm its validity.
Examples where “functional benchmarks” that have already been suggested orapplied include NAS 1972, NAS/NAE 1993, NTAC 1968, ANZECC 2000, Parametrix2003. Both narrative and numeric examples include:
Waters used for bathing and swimming should have sufficient clarity to allow forthe detection of subsurface hazards or submerged objects and for locatingswimmers in danger of drowning.
Clarity should be such that a secchi disk is visible at minimum depth of four feetgiven its conclusion that clarity in recreational waters is highly desirable formthe standpoint of visual appeal, recreational opportunity, enjoyment and safety.
The visual clarity guidelines are based on the objective that to protect visualclarity of waters used for swimming, the horizontal sighting of a 200mm diameterblack disc should exceed 1.6 m.
Turbidity in water should be readily removable by coagulation, sedimentationand filtration; it should not be present to an extent that will overload the watertreatment plant facilities, and should not cause unreasonable treatment costs. Inaddition, turbidity should not frequently change or vary in characteristics to the

47
extent that such changes cause upsets in water treatment processes.
No more than 15 NTUs over background will protect the visual aesthetic qualityof a clear water stream.
7. Use of successful new State/International approaches:
As summarized above, States under the pressure to develop and issue totalmaximum daily loads (TMDLs) for SABS impaired water bodies, are moving forward ontheir own to develop new and improved SABS criteria from which to implement theseregulatory actions. In many cases, these efforts are being initiated under the pressure oflegal actions and court ordered deadlines. EPA believes it is valuable to examine whatStates have done in the past, are currently doing, and are planning to do in the future forSABS criteria, to look for approaches and methods that may be useful, either directly, orwith adaptation, to the entire nation. EPA also believes this same consideration shouldbe given to the SABS criteria efforts of other countries. Where approaches and methodsof States and other countries appear promising, EPA intends to carefully review theseapproaches and consider them for application nationwide. At this time, the efforts ofIdaho, New Mexico and the province of British Columbia, Canada appear to beapproaches that warrant further consideration.
8. Combinations, or a synthesis of portions, of the above approaches.
This option is suggested as a separate approach primarily for the purpose ofstimulating consideration of a combination of the approaches described above, or asynthesis of components of the approaches. It may be possible that the best approach todeveloping SABS criteria would be the application of key concepts or components of allor some of the approaches above.
For example many possible synthesis approaches could be formulated from the followingoutline:
I. Select Indicators That Should be Measured:--Suspended sediment: suspended sediment concentration, turbidity, clarity (userating curves in flowing waters).--Bedded sediment: systematic particle size tally (“Wolman pebble count”),embeddedness.--Biota that indicate sediment problems: biological assemblage composition,“indicator taxa,” anomalies, etc.
II. Establish Expectations for Particular Water Bodies:A. Scale measurements by dominant local controlling factors:
1. Rating curves (scaling by discharge: suspended sediment, turbidity,clarity in streams and rivers).2. Scale by bankfull shear stress (bedded sediments in streams and rivers). (Relative Bed Stability and Sedimentation Approach)3. Scale by water depth and wave action (bedded sediment in lakes andestuaries.4. Scale fish assemblage measures by stream or lake size.

48
5. Scale macrobenthos measures by stream or river shear stress.B. Stratify waterbodies by type and landscape setting:
1. Waterbody type, size.2. Ecoregion.3. Further geomorphic classification- for lakes and wetlands (FluvialGeomorphic Classification Approach), Rosgen classification for streamsand rivers, Montgomery-Buffington classification for streams and rivers.
C. Identify minimally-disturbed reference sites: where measurements shall bemade. (State-by-State Reference Condition Approach)
III. Link Sediment Measures with Biotic Response:A. Use published literature: on tolerance and occurrence of biota.B. Associational analysis: conduct an analysis on survey data where biota andsediment have been measured (Evaluating Effects of Sediment on Biota --Relative Bed Stability and Excess Sedimentation Approach).C. Experimental dose-response relationships: Establish supplementalrelationships where needed. (Toxicological Approach).D. Link relative risk: link sediment measures with biotic impacts that isindependently defined. (Toxicological Approach).
IV. Define Impacts:A. Rule-based quantification of impacts: TSS value above the 75th percentile ofreference site, or 20% greater than expected, or more than 3 standard deviationsabove mean (State-by-State Reference Condition Approach) .B. Link relative risk: link biologically-defined impacts with sediment levels.(Toxicological Approach).C. Link impacts to uses other than aquatic life: (Water-Body Use FunctionalApproach).
CONCLUSIONS:
Developing and implementing improved water quality criteria for SABS will be asignificant challenge for EPA, the States, Tribes and territories. The biggest challenge lies inimproving criteria that are protective of aquatic life. The development of criteria for SABS maybe complicated because of the need to be site-specific. Different water bodies have differentprocesses involving SABS, and different tolerance levels depending on the species and thehabitat. The amount of suspended sediment tolerated in a mountain stream is obviously muchdifferent from that tolerated in the Mississippi River. Even within habitats there may be greatvariation in the effect of SABS, thus EPA concludes there is a need for habitat classification inorder to develop criteria.
EPA has examined the current status of SABS criteria throughout the country, and inspecific locations across the globe, to identify existing or new approaches that may be useful. EPA has also proposed four new possible approaches to SABS criteria development (theRelative Bed Stability and Sedimentation Approach, the Conditional Probability Approach toEstablishing Thresholds, the State-by-State Reference Condition Approach and the FluvialGeomorphic Approach).
During preparation of this discussion paper, some common conclusions or concepts

49
emerged that could be relevant to any criteria development methodology. A brief discussion ofthese concepts is presented below and are raised for consideration by the Science AdvisoryBoard.
Common Elements?
Two basic forms of criteria- The States and Tribes need to protect all designated usesfrom the detrimental effects of suspended and bedded sediments. This includes aquatic life uses,human health related uses, industrial, agricultural and others. It appears however, that criteria toaccomplish this will need to focus in two main areas; 1) criteria to protect aquatic life uses, and2) criteria to protect other uses. The basic methods for deriving criteria in these two areas arefundamentally different.
Aquatic Life Criteria - Most Stringent- It appears that SABS criteria established foraquatic life would be the most protective or stringent of criteria for any other potentialdesignated use (excluding some drinking water uses). By setting aquatic life criteria for waterbodies with multiple uses in addition to aquatic life, most other uses (recreation, irrigation,navigation, industrial, etc.) would most likely be protected. Only where aquatic life uses do notexist, or in other special circumstances, such as untreated drinking water source uses, wouldother forms of criteria be needed.
Natural or Background Levels- Criteria methods for aquatic life should factor inbackground concentrations or possibly even natural levels of turbidity, suspended solids andembedded materials as these are valuable and natural components of aquatic ecosystems when inproper concentration and levels for the ecosystem. Although natural levels and backgroundlevels could be considered the same, it may provide more flexibility to develop these as twodifferent concepts.
Lotic vs. Lentic (lacustrine)- Most likely, SABS criteria for aquatic life will need to bedeveloped or stratified by water body type especially flowing versus pooled. Streams and smallrivers have very different SABS background levels or natural regimes than do lakes, large rivers,estuaries, wetlands, coral reefs and other water bodies.
Modes of action- The effects of SABS on aquatic organisms are due primarily to impactsthat can be grouped into two categories; 1) the effects of light scattering, in the case of excessiveturbidity, and 2) the effects of particles, in the case of suspended solids, settleable solids and beddeposits.
Lack of data- There is inadequate data in the literature from which to developtoxicological-based thresholds for protecting all aquatic life from the effects of suspended andbedded sediments.
Classification- When developing SABS criteria using a reference condition approach, aconditional probability approach, or a habitat stability approach, the classification of waterbodies into their natural groupings is critical and will be difficult, data-intensive, and timeconsuming.
Programmatic needs of SABS criteria- Once criteria are developed (whatever formatthey take) there are a number of programmatic considerations for the successful use of the
50
criteria. They should relate to, and protect, designated uses. They need to be readily measurableand easily monitored by States and Tribes. They need to be readily implemented by EPA, theStates and Tribes into their different water programs. They need to be a number(s), orquantifiable in some way, so they can be translated into TMDL targets, wasteload allocationsand permit limits. They need to be able to indicate program effectiveness/success and they needto apply to all water body types, including streams, rivers, lakes, reservoirs, estuaries, wetlands,etc.
EPA is seeking advice on the information and conclusions/concepts raised in this paperand on the scientific viability of the proposed new approaches, a combination or synthesis ofthese approaches, or other approaches from it’s Science Advisory Board as stated in the Chargeand Specific Questions listed below.
Overall Charge:
While many questions and much research remain, EPA seeks the opportunity fora consultation with the Science Advisory Board to gain advice and recommendations onthe best potential approaches to developing water quality criteria for suspended andbedded sediments as is described in this discussion paper. The Office of Water is alsoseeking recommendations on additional criteria development approaches for differenttypes of water body uses, other than aquatic life, and is also seeking advice on any otherscientifically defensible criteria derivation methodology not included in this paper.
More Specific Consultation Questions:
1. Is it a scientifically valid premise that SABS in natural amounts (or at backgroundlevels) are beneficial to ecosystems and therefore water quality criteria shouldattempt to simulate natural regimes or background levels? If so, how shouldnatural levels or background be determined?
2. Can SABS criteria be stratified by water body type or by some other scheme? Ifby water body-type, by what level of classification? Lotic and lacustrine? Rivers and streams, wetlands, lakes/reservoirs and estuaries/coastal areas? Others? If some other classification scheme is necessary, what type and howmuch resolution must it have?
3. What indicators or components should a water quality criterion for SABS include-turbidity, suspended solids, and deposited solids? Others?
4. Can biological assessments and biocriteria play a role in SABS criteria? If so,what role?
5. Should EPA reconsider the inclusion of organic particulate material in itsdefinition of suspended and bedded sediments?
6. Which of the EPA proposed criteria methods do you believe have the greatestpotential? Why? Which ones should EPA not pursue further?
7. Can aspects of the different approaches described in the discussion paper be

51
combined into a synthesis approach?
8. Do any of the recent efforts of the States or other countries offer possibilities for anational criteria approach?
9. Does the Chesapeake Bay approach to light penetration (clarity) hold promise fora national scheme?
10. If SABS criteria are established to protect aquatic life in water bodies, is itreasonable to assume that these criteria will be stringent enough to also protectother uses of the water body (recreation, industrial water intake, drinking watersource, etc.)?
With the feedback and recommendations from the EPA Science Advisory Board, theOffice of Water anticipates proceeding forward to develop a strategy to be issued by the end of2004 suggesting the best approaches, processes and schedules for EPA, States, Tribes andterritories to pursue for developing and adopting improved SABS criteria.

52
REFERENCES CITED
Australian and New Zealand Environment and Conservation Council (ANZECC), 2000. Australian and New Zealand Guidelines for Fresh and Marine Water Quality Volume 1,The Guidelines. Agricultural and Resources Management Council of Australia and NewZealand (ARMCANZ). Canbera, ACT Australia.
Bauer, S.B., and T.A. Burton. 1993. Monitoring Protocols to Evaluate Water Quality Effects ofGrazing Management on Western Rangeland Streams. EPA 910/9-91-001. U.S.Environmental Protection Agency, Region X, Seattle, WA. 166 p.
Brunsden, D., and J.B. Thornes. 1979. Landscape sensitivity and change. Transactions of the
British Geographers New Series 4:462-484.
Buffington, J.M. and D.R. Montgomery. 1999a. Effects of hydraulic roughness on surface textures of gravel-bed rivers. Water. Resour. Res. 35(11):3507-3521.
Buffington, J.M. and D.R. Montgomery. 1999b. Effects of sediment supply on surface texturesof gravel-bed rivers. Water. Resour. Res. 35(11):3523-3530.
Caux, P. -Y., D.R.J. Moore, and D. MacDonald. 1997. Ambient water quality guidelines(criteria) for turbidity, suspended and benthic sediments. Technical Appendix. Preparedfor BC Ministry of Environment, Land and Parks. April, 1997.
Chesapeake Bay Program (CBP), 2003. Chesapeake Bay Water Quality Criteria. http://www.chesapeakebay.net/wqcriteriatech.htm
Cummins, K.W. 1974. Structure and function of stream ecosystems. Bioscience 24631-641.
Davies-Colley, R. J., W. N. Vant and D. G. Smith, 1993. Color of Water Clarity of NaturalWaters, Science and Management of Optical Water Quality. Ellis Horwood Limited,West Sussex, United Kingdom.
Davies-Colley, R. J., 1991. Guidelines for Optical Quality of Water for Protection from Damageby Suspended Solids. Consultancy Report No. 6213/1. Water Quality Centre. Hamilton,New Zealand.
Dietrich, W.E., J.W. Kirchner, H. Ikeda, and F. Iseya. 1989. Sediment supply and thedevelopment of the coarse surface layer in gravel bed rivers. Nature. 340(20)215-217.
Dingman, S.L. 1984. Fluvial Hydrology. W.H. Freeman, New York. 383 p.
Elliott, J.M. 1977. Some methods for the statistical analysis of samples of benthic invertebrates. Scientific Publication No. 25. Freshwater Biological Association. Ambleside, England. 156 pp.
Gregory, K.J., and J.R. Madew. 1982. Land use change, flood frequency, and channeladjustments. In Hey, R.D., J.C. Bathurst, and C.R. Thorne (eds), Gravel-Bed Rivers. John Wiley, Chichester

53
Griffiths, W., and B. Walton. 1978, The effects of sedimentation on the aquatic biota. AlbertaOil Sands Environmental Research Program, Report # 35.
Gordon, N.D., T.A. McMahon, and B.L. Finlayson. 1992. Stream Hydrology: An Introductionfor Ecologists. Wiley, New York.
Hawkins, R.H. 2002. Survey of methods for sediment TMDLs in western rivers and streams ofthe United States. Grant # 827666-01-0 final report, USEPA Office of Water,Washington DC. 51 pp.
Hawkins, C.P., R.H. Norris, J.N. Hogue, and J.W. Feminella. 2000. Development andevaluation of predictive models for measuring the biological integrity of streams. Ecological Applications 10:1456-1477.
Hawkins, C.P., M.L. Murphy, and N.J. Anderson. 1983. Density of fish and salamanders inrelation to riparian canopy and physical habitat in streams of the northwestern UnitedStates. Can. J. Fish. Aquat. Sci. 40(8):1173-1186.
Hynes, H.B.N. 1972. Ecology of Running Waters. Univ. of Toronto Press, Canada. 555p.
Idaho DEQ, 2003. Guide to Selection of Targets for Use in Idaho TMDLs. M. Rowe, D. Essigand B. Jessup. June 2003.
Jha, M. 2003. Ecological and Toxicological Effects of Suspended and Bedded Sediments onAquatic Habitats - A Concise Review for Developing Water Quality Criteria forSuspended and Bedded Sediments (SABS). US EPA, Office of Water draft report,August 2003.
Johnson, W.C. 1994. Woodland Expansion in the Platte River, Nebraska: Patterns and Causes.Ecological Monographs 64: 45-84.
Kappesser, G. 1995. Riffle Stability Index. Unpublished draft manuscript for review andcomment. George Washington and Jefferson National forests, Roanoke, VA, 21p.
Kaufmann, P.R. and D.P. Larsen. (In Prep). Sedimentation in Pacific Northwest Coastal Streams-- Evidence from Regional Surveys of Bed Substrate Size and Stability.
Kaufmann, P.R., P. Levine, E.G. Robison, C.Seeliger, and D.Peck. (1999) Quantifying physicalhabitat in wadeable streams EPA 620/R-99/003. Environmental Monitoring andAssessment Program (EMAP), U.S. Environmental Protection Agency, Washington, DC.102 pp + Appendices.
Kaufmann, P.R., Robison, E.G. 1998. Physical habitat assessment. In Klemm, D.J., Lazorchak,J.M., eds., Environmental Monitoring and Assessment Program 1994 Pilot FieldOperations Manual for Streams. *EPA/620/R-94/004. EPA, Environ. Monit. Syst. Lab.,Office of Research and Development, Cincinnati, OH, pp. 6-1 to 6-38.
Knighton, D. 1984. Fluvial Forms and Processes. Edward Arnold, New York.

54
Lane, E.W. 1955. The importance of fluvial geomorphology in hydraulic engineering. Proceedings of the American Society of Civil Engineers 81:1-17.
Leopold, L.B. and R.G. Wolman. 1957. River channel patterns – braided, meandering andstraight. United States Geological Survey Professional Paper 282B.
Leopold, L.B. and W.B. Langbein. 1962. The concept of entropy in landscape evolution. United States Geological Survey Professional Paper 500A.
Leopold, , L.B. M.G. Wolman, and J.P. Miller. 1964. Fluvial processes in geomorphology. W.H.Freeman and Co., San. Fran. CA, USA. 522 p.
Lisle, T.E. 1982. Effects of aggradation and degradation on riffle-pool morphology in naturalgravel channels, northwestern California. Wtr. Resour. Res. 18(6):1643-1651.
Lisle, T.E. and S. Hilton. 1992. The volume of fine sediment in pools: an index of sedimentsupply in gravel-bed streams. Water Res. Bull. 28(2):371-383.
Lisle, T.E., J.M. Nelson, J. Pitlick, M.A. Madej, and B.L. Barkett. 2000. Variability of bedmobility in natural, gravel-bed channels and adjustments to sediment load at local andreach scales. Water Resourc. Res. 36(12):3743-3755.
Long, E.R. and L.G. Morgan. 1991. The potential for biological effects of sediment-sorbedcontaminants tested in the National Status and Trends Program. NOAA TechnicalMemorandum NOS OMA 52. National Oceanic and Atmospheric Administration. Seattle, Washington. 175 pp. + appendices.
MacDonald, L.H. and C.G. Ingersoll. 2002. A guidance manual to support the assessment ofcontaminated sediments in freshwater ecosystems. EPA/905/B-02/001-C. U.S.Environmental Protection Agency, Great Lakes National Program Office, Chicago,Illinois. 120 pp.
MacDonald, L.H., A.W. Smart, and RC Wismar. 1991. Monitoring Guidelines to EvaluateEffects of Forestry Activities on Streams in the Pacific Northwest and Alaska. WPA910/9-91-001. U.S. Environmental Protection Agency, Region X, Seattle, Washington.166 p.
Mackin, J.H. 1948, Concept of the graded river. Geol. Soc. Am. Bull. 59:463-512.
Meyers, T.J. and S. Swanson. 1992. Variation of stream stability with stream type and livestockbank damage in northern Nevada. Water Resources Bulletin AWRA 28(4):743-754.
Miller, J.R. 1991. The influence of bedrock geology on kinckpoint development and channel-bed degradation along downcutting streams in south-central Indiana. Journal of Geology99:591-605
Montgomery, D.R. and J.M. Buffington. 1993. Channel classification, prediction of channelresponse, and assessment of channel condition. TFW-SH10-93-002, WA Dept. ofNatural Resources. 84 pp.

55
Morisawa, M. 1968. Streams, their dynamics and morphology. McGraw-Hill Book Company,New York. 175 p.
National Academy of Sciences (NAS) and National Academy of Engineering (NAE), 1973. Water Quality Criteria 1972. U.S. EPA Ecological Research Series. EPA-R3-73-033.
National Technical Advisory Committee (NTAC) to the Secretary of the Interior, 1968. WaterQuality Criteria. Federal Water Pollution Control Administration.
New Mexico Environment Department (NMED), 2002. Protocol For the Assessment of StreamBottom Deposits On Wadable Streams. Surface Water Quality Bureau, 1190 St. FrancisDrive, N2050, Santa Fe, New Mexico
Parametrix, 2003. Effects of Turbidity on Aquatic Life and Recreational and Consumptive Usesof Water: A Basis for Revising Oregon’s Water Quality Criterion for Turbidity. Preparedfor Blue Heron Paper Company. January 2003.
Platts, W.S., W.F. Megahan, and G.W. Minshall. 1983. Methods for evaluating stream, riparianand biotic conditions. Gen. Tech. Rep. INT-138. U.S. Forest Service, IntermountainForest and Range Experiment Station, Ogden, UT. 70 p.
Pruitt B. A., D. L. Melgaard, H. H. Morris, C. Flexner, A. S. Able. 2001. Chattooga riverwatershed ecological/sedimentation project; FISC Proceedings, Federal InteragencySedimentation Conference, Reno, Nevada, March 26-30, 2001.
Richards, C., 1992. Ecological effects of fine sediments in stream ecosystems, Proceedings ofthe US EPA and USDA FS Technical Workshop on Sediments, Corvallis, Oregon, pp.113-118.
Rinne, J. 1988. Effects of livestock grazing exclusion on aquatic macroinvertebrates in amontane stream, New Mexico. Great Basin Naturalist 48(2):146-153.
Reiser, D.W., M.P. Ramey, and T.A. Wesche. 1989. Flushing flows. In J.A. Gore and G.E.Petts (eds), Alternatives in Regulated River Management. CRC Press, Boca Raton.
Rosgen, D. L. 2001. A practical method for computing streambank erosion rate. Proceedings7th Interagency Sedimentation Conference, March 25-29, 2002, Reno, NV.
Rosgen, D.L. 1996. Applied River Morphology. Wildland Hydrology Books, Pagosa Springs,CO.
Rosgen, D.L. 1994. A classification of natural rivers. In: Catena, Vol. 22: 169-199. ElsevierScience, B.V. Amsterdam.
Rosetta, T. 2003. Draft Rulemaking and Options for Oregon Turbidity Standards. July 2003.
Schumm, S.A. 1977. The Fluvial System. Wiley-Interscience, New York
Simons, D.B. and F. Senturk. 1977. Sediment Transport Technology. Water Resources

56
Publications. Fort Collins, CO. 80522, USA. 807 p.
Simon, A., and C.R. Hupp. 1992. Geomorphic and vegetative recovery processes alongmodified stream channels of West Tennessee. United States Geological Survey Open-File Report 91-502
Simon, A. 1992a. Energy, time, and channel evolution in catastrophically disturbed fluvialsystems. In: Geomorphology 5:345-372.
Smith, David G. and R. J. Davies-Colley, 1992. Perception of Water Clarity and Color in Termsof Suitability for Recreational Use. Journal of Environmental Management. Vol. 36, No.2, pages 226-235.
Smith, David G. and A. M. Craig, and G. F. Croxer, 1991. Water Clarity Criteria for BathingWaters Based on User Perceptions. Journal of Environmental Management. Vol. 33,pages 285-299.
Staver, L. W., K. W. Staver, and J. C. Stevenson. 1996. Nutrient Inputs to the Choptank RiverEstuary: Implications for Watershed Management. Estuaries 19: 342-358.
Stephan, C.E., D.I. Mount, D.J. Hansen, J.H. Gentile, G.A. Chapman, W.A. Brungs. 1985. Guidelines for Deriving Numerical National Water Quality Criteria for the Protection ofAquatic Organisms and Their Uses. US EPA, Washington DC. National TechnicalInformation Service, Springfield, VA. No.PB85-227049.
Stevens, L.E. 1995. Flow regulation, geomorphology, and Colorado River marsh developmentin the Grand Canyon, Arizona. Ecological Applications 5: 1025-1039.
Troendle, C.A., D.L. Rosgen, S.E. Ryan, L.S. Porth and J.M. Nankervis. 2001. Developing a“reference” sediment transport relationship. Proceedings 7th Interagency SedimentationConference, March 25-29, 2002, Reno, NV.
Trimble, S.W. 1974. Man-induced soil erosion on the southern Piedmont, 1700-1970. SoilConservation Society of America.
Trimble, S.W. 1999. Decreased rates of alluvial sediment storage in the Coon Creek Basin,Wisconsin 1975-1993. Science 285:1244-1246.
U.S. EPA 2003. Strategy for Water Quality Standards and Criteria: Setting Priorities toStrengthen the Foundation for Protecting and Restoring the Nation’s Waters. Office ofWater (4305T). August. EPA-823-R-03-010.
U.S. EPA. 2000. Mid-Atlantic highlands streams assessment. EPA/903/R-00/015. U.S.Environmental Protection Agency. Region 3. Philadelphia, PA. 364 pp.
U.S. EPA, 2000a. Draft Technical Framework to Support the Development of Water QualityCriteria for Sediment. Office of Water. In draft June 1, 2000.
U.S. EPA, 2000b. Ambient water quality criteria for dissolved oxygen, water clarity and
57
Chlorophyll A for Chesapeake Bay and Tidal Tributaries. U.S. EPA, Chesapeake BayProgram Office, Annapolis MD. May, 2000.
U.S. EPA, 1994. Interim Guidance on Determination and Use of Water Effect Ratios for Metals. EPA-823-B-94-001. Office of Water, Washington, DC.
U.S. EPA, 1986. Quality Criteria for Water. Office of Water. EPA 440-5-86-001.
U.S. EPA, 1976. Quality Criteria for Water. Office of Water and Hazardous Materials. EPA440-9-76-023.
Valiela, I., K. Foreman, M. LaMontagne, D. Hersh, J. Costa, P. Peckol, B. DeMeo-Andreson, C.D'Avonzo, M. Babione, C. Sham, J. Brewley, and K. Lajtha. 1992. Couplings ofwatersheds and coastal waters: Sources and consequences of nutrient enrichment inWaquoit Bay, Massachusetts. Estuaries 15: 443-457.
Wilcock, P.R. 1988. Two-fraction model of initial sediment motion in gravel-bed rivers. Science280:410-412.
Walker, K.F. 1985. A review of the ecological effects of river regulation in Australia. Hydrobiologia 125:111-129.
Weaver T. M. & Fraley J. F., 1993. A method to measure emergence success of Westslopecutthroat trout fry from varying substrate compositions in a natural stream channel. N-Am J Fish Man 13: 817-822.
Wolman, M.G., 1954. A method of sampling coarse river-bed material. Trans. Am. Geophys.Union 35(6)951-956.
Wright, J.F. 2000. An introduction to RIVPACS. in Pages 1-24. Wright, J.F., D.W. Sutcliffe,and M.T. Furse (editors). Assessing the biological quality of freshwaters: RIVPACS andother techniques. Freshwater Biological Association, Ambleside, Cumbria, UK.
Wright, J.F., D. Moss, P.D. Armitage, and M.T. Furse. 1984. A preliminary classification ofrunning-water sites in Great Britain based on macro-invertebrate species and theprediction of community type using environmental data. Freshwater Biology 14:221-256.

58
APPENDICES:
Appendix 1: Literature review on SABS– Berry et al., 2003.
Appendix 2: British Columbia, Canada, Ambient Water Quality Guidelines (Criteria) forTurbidity, Suspended and Bedded Sediments.
Appendix 3: EPA Summary Table of Current State Standards.
Appendix 4: EPA Summary Table of Sediment TMDLs.
Appendix 5: Idaho DEQ, Guide to Selection of Sediment Targets for Use in Idaho TMDLs. June 2003.