developing ecosystem services accounts from …...danmark statistik sejrøgade 11 2100 københavn Ø...
TRANSCRIPT
Danmark Statistik
Sejrøgade 11
2100 København Ø
Developing Ecosystem Services Accounts from Land Accounts
by
Ingeborg Vind
December 2018
Final report on project under
grant agreement no. 05122.2017.003-2017.645
Ref. Ares(2019)133984 - 10/01/2019
2/42
DEVELOPING ECOSYSTEM SERVICES ACCOUNTS FROM LAND ACCOUNTS
Danmarks Statistik
December 2018
Ingeborg Vind
Senior Advisor
National Accounts
Phone +45 39 17 33 29
3/42
Preface This report has benefited from funding by the European Commission, Eurostat, through grant agreement no. 05122.2017.003-2017.645. The grant was awarded under the Knowledge Innovation Project on Accounting for Ecosystems (KIP-INCA), belonging to the objective 05.1 Provide environmental accounts and cli-mate change related statistics. The specific objective of the action has been to con-duct pilot tests of a number of ecosystem services accounts for Denmark in physical units. The present report was prepared in the National Accounts division of Statistics Denmark during 2018 by Ingeborg Vind with the cooperation of other staff of the section for environmental-economic accounts. The author would like to thank Ole Gravgård, Emil Urhammer and Vibe Busk Larsen for their valuable contributions to the project. Further details on the project can be obtained from the author.
4/42
Contents
1. Introduction ................................................................................................... 6
2. Land cover accounts and BASEMAP02 ........................................................ 7
2.1. Ecosystems extent accounts, spatial unit and maps .................................... 8
3. Ecosystem services accounts ....................................................................... 12
3.1. Measuring ecosystem services in physical terms ....................................... 12
3.2. Selection of pilot ecosystem services .......................................................... 13
3.3. Ecosystem services – physical supply and use tables ................................ 17
4. Selected ecosystem services ........................................................................ 21 4.1. Cultivated plants – from agricultural land ................................................. 21 4.2. Cultivated plants – from forests ................................................................. 25
4.3. Reared aquatic animals for nutrition, materials or energy ....................... 27
4.4. Wild animals for nutrition, materials or energy ........................................ 28
4.5. Groundwater for drinking and use as ‘material’ ........................................ 30
4.6. Physical and experiential interactions with natural environment ............ 32
4.7. Other biotic characteristics that have a non-use value .............................. 34
5. Dissemination .............................................................................................. 37
6. Discussion and conclusions .........................................................................40
7. Future steps and sustainability ...................................................................40
8. References .................................................................................................... 41
5/42
Summary The project has established pilot accounts for ecosystem services for Denmark in physical units. The ecosystem services included are mainly of the provisioning type: plants (crops, timber, etc.) and animals (fish, wild terrestrial animals), as well groundwater. Ecosystem services of the cultural type are also included, but data sources for these allow for much less detail in these accounts. All the ecosystem services are presented in the form of supply and use tables. As far as possible, they are also presented in the form of maps showing the geographical distribution of supply. The ecosystem services accounts have not yet been published through Statistics Denmark’s regular publication channels. The project has outlined a possible way to present and communicate such accounts so that in the future they may be included along with the core environmental-economic accounts based on SEEA-CF. The accounts for the provisioning ecosystem services are largely based on data and sta-tistics which are available annually and it is therefore possible to produce these accounts regularly with the methodology developed in the project. Publication as official statistics requires further work on quality and documentation.

6/42
1. Introduction
Statistics Denmark has a long tradition of compiling environmental-economic ac-counts. Energy accounts in both physical and monetary units have been produced since 1974. Also air emission accounts, economy-wide material flow accounts and accounts of environmental taxes and subsidies are well established. More recently, a project made possible by a three-year financing round (2015-17) from the Danish budget expanded the Danish environmental-economic accounts to cover a full set of SEEA-Central Framework (SEEA-CF) modules. The chart (figure 1) shows all the modules that are part of the Danish ‘Green National Accounts’. Green National Accounts is the name used to brand the Danish environmental-economic accounts as a statistical product. The modules of the Danish ‘Green National Accounts’
Source: Statistics Denmark (2018) A logical extension of the work on SEEA-CF is to develop ecosystem accounts, based on the SEEA – Experimental Ecosystem Accounting (SEEA-EEA). Many professional users have been asking for Statistics Denmark to develop the accounts in this direction. The project recorded in this report is Statistics Denmark’s first significant work in accounting for ecosystem services. However, the already devel-oped and published SEEA-CF based modules include stock accounts for forests and for land cover. These accounts are important foundations for this project, while there are also linkages to energy and water accounts. The conceptual and methodological framework for the pilot ecosystem services accounts of this report is that of the SEEA-EEA (UN, 2014), supplemented with methodological and conceptual developments in most recent years as the field of ecosystem accounting is rapidly developing. In particular reference is made to the ‘Technical recommendations in support of SEEA-EEA’ (UN, 2017). The most recent version of the Common International Classification of Ecosystem Services, CICES 5.1 is the reference used for classification of ecosystem services. The project establishes ecosystem services accounts in physical terms only.
Figure 1
7/42
2. Land cover accounts and BASEMAP02
Statistics Denmark has published land cover accounts as part of the ‘Green Nation-al Accounts’. Land cover classes from these accounts correspond to broad ecosys-tem types. The land cover accounts can thus be considered as basic ecosystem ex-tent accounts.
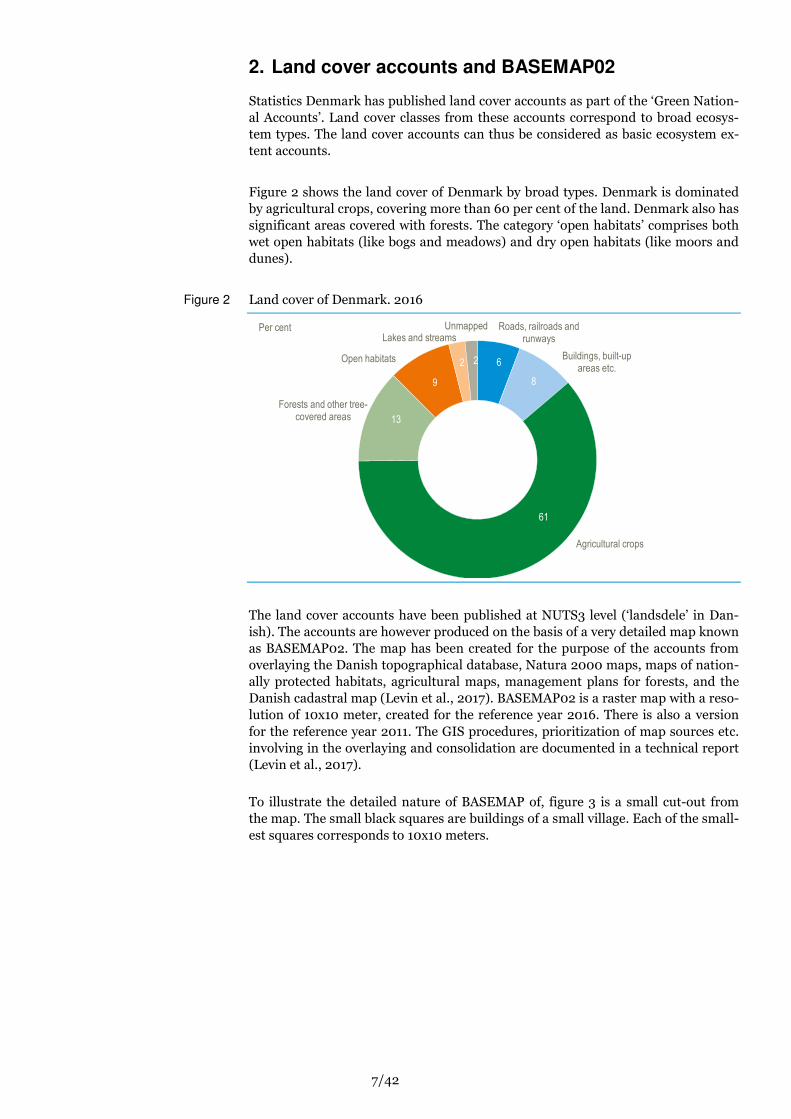
Figure 2 shows the land cover of Denmark by broad types. Denmark is dominated by agricultural crops, covering more than 60 per cent of the land. Denmark also has significant areas covered with forests. The category ‘open habitats’ comprises both wet open habitats (like bogs and meadows) and dry open habitats (like moors and dunes).
Land cover of Denmark. 2016
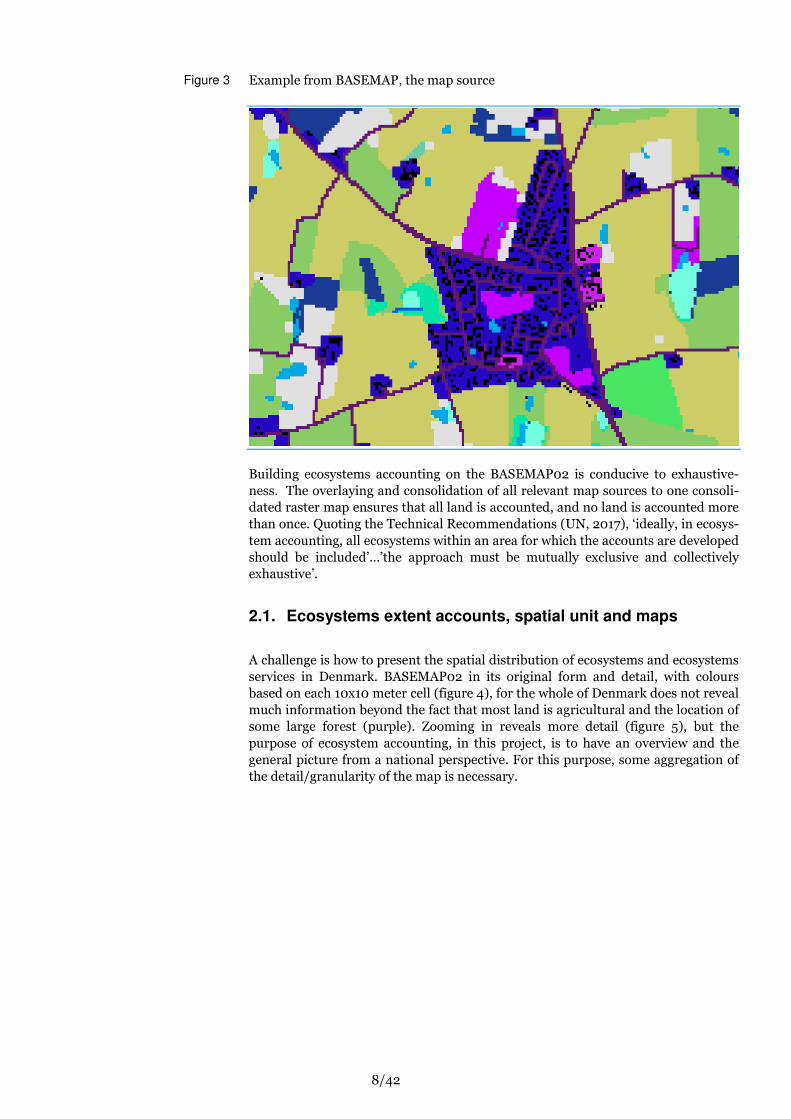
The land cover accounts have been published at NUTS3 level (‘landsdele’ in Dan-ish). The accounts are however produced on the basis of a very detailed map known as BASEMAP02. The map has been created for the purpose of the accounts from overlaying the Danish topographical database, Natura 2000 maps, maps of nation-ally protected habitats, agricultural maps, management plans for forests, and the Danish cadastral map (Levin et al., 2017). BASEMAP02 is a raster map with a reso-lution of 10x10 meter, created for the reference year 2016. There is also a version for the reference year 2011. The GIS procedures, prioritization of map sources etc. involving in the overlaying and consolidation are documented in a technical report (Levin et al., 2017).
To illustrate the detailed nature of BASEMAP of, figure 3 is a small cut-out from the map. The small black squares are buildings of a small village. Each of the small-est squares corresponds to 10x10 meters.
Roads, railroads and runways
Buildings, built-up areas etc.
Agricultural crops
Forests and other tree-covered areas
Open habitats
Lakes and streamsUnmapped
6
8
61
13
9
2 2
Per cent
Figure 2
8/42
Example from BASEMAP, the map source
Building ecosystems accounting on the BASEMAP02 is conducive to exhaustive-ness. The overlaying and consolidation of all relevant map sources to one consoli-dated raster map ensures that all land is accounted, and no land is accounted more than once. Quoting the Technical Recommendations (UN, 2017), ‘ideally, in ecosys-tem accounting, all ecosystems within an area for which the accounts are developed should be included’…’the approach must be mutually exclusive and collectively exhaustive’.
2.1. Ecosystems extent accounts, spatial unit and maps
A challenge is how to present the spatial distribution of ecosystems and ecosystems services in Denmark. BASEMAP02 in its original form and detail, with colours based on each 10x10 meter cell (figure 4), for the whole of Denmark does not reveal much information beyond the fact that most land is agricultural and the location of some large forest (purple). Zooming in reveals more detail (figure 5), but the purpose of ecosystem accounting, in this project, is to have an overview and the general picture from a national perspective. For this purpose, some aggregation of the detail/granularity of the map is necessary.
Figure 3

9/42
BASEMAP02
BASEMAP02 - zoomed
For this project, the BASEMAP02 has been further processed to a map of the extent of ecosystem types by municipality. The municipality is used throughout the project as the spatial unit in presentation. Denmark consists of 99 municipalities, of very different size. The municipality is an important administrative unit, but obviously it is not directly relevant to how ecosystems exist ‘on the ground’. The municipalities are however charged with most planning, monitoring and local decision making in relation to nature and environment. For communication, the municipal map has the advantage of being easily recognized and read by many users. The municipality is also a basic unit for many other statistics, and thus the choice of this unit facilitates integration of the ecosystem accounts with economic and social statistics.
Figure 4
Figure 5
10/42
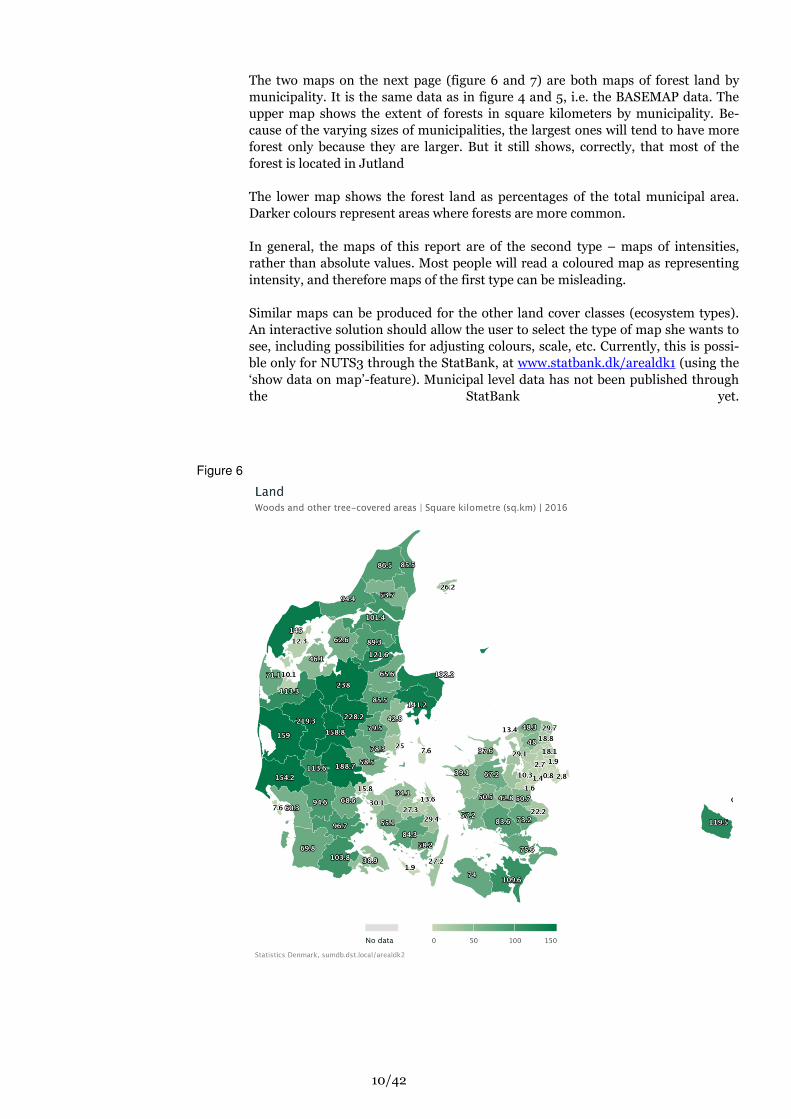
The two maps on the next page (figure 6 and 7) are both maps of forest land by municipality. It is the same data as in figure 4 and 5, i.e. the BASEMAP data. The upper map shows the extent of forests in square kilometers by municipality. Be-cause of the varying sizes of municipalities, the largest ones will tend to have more forest only because they are larger. But it still shows, correctly, that most of the forest is located in Jutland The lower map shows the forest land as percentages of the total municipal area. Darker colours represent areas where forests are more common. In general, the maps of this report are of the second type – maps of intensities, rather than absolute values. Most people will read a coloured map as representing intensity, and therefore maps of the first type can be misleading. Similar maps can be produced for the other land cover classes (ecosystem types). An interactive solution should allow the user to select the type of map she wants to see, including possibilities for adjusting colours, scale, etc. Currently, this is possi-ble only for NUTS3 through the StatBank, at www.statbank.dk/arealdk1 (using the ‘show data on map’-feature). Municipal level data has not been published through the StatBank yet.
Figure 6
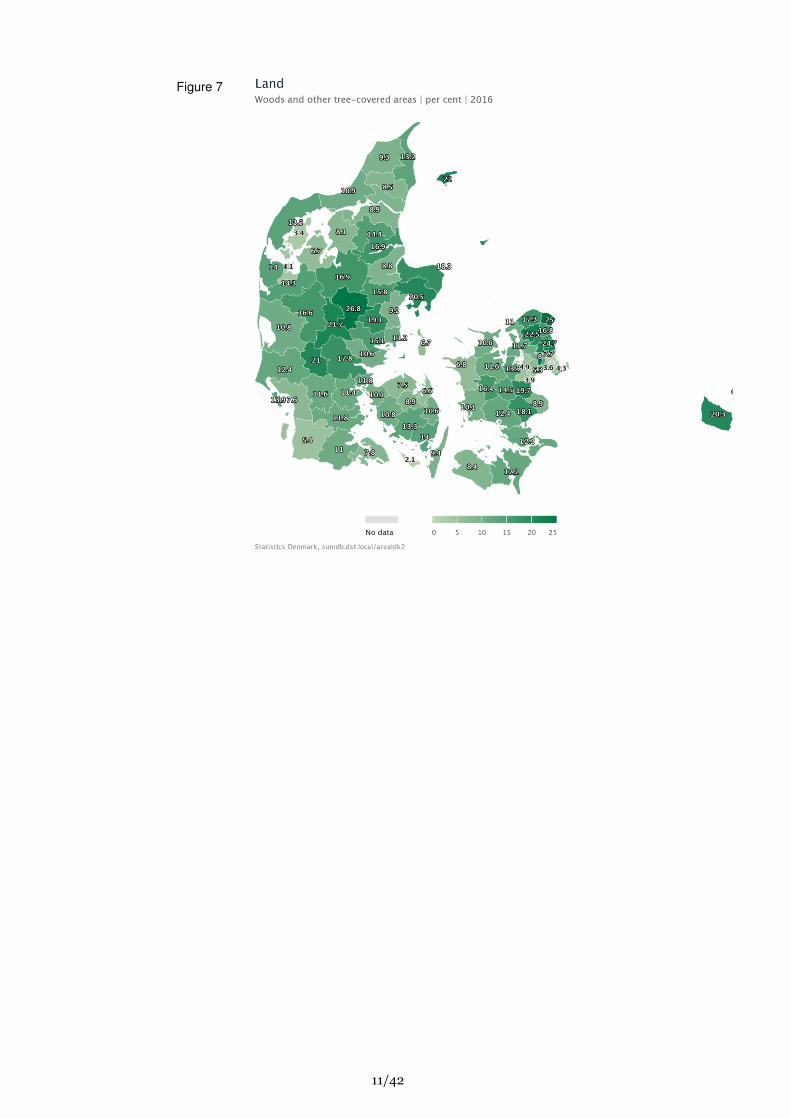
11/42
Figure 7
12/42
3. Ecosystem services accounts
3.1. Measuring ecosystem services in physical terms
An integral part of the mapping of relevant ecosystem services and data sources has been the identification of the relevant unit for measurement. This is crucial for operationalization – what is it that we want to measure, what can we measure and in what physical unit? Only ecosystem services which can be (meaningfully) meas-ured in the same physical unit can be aggregated. As far as possible, common units have been sought for related services – but even closely related services, like culti-vated terrestrial plants from agricultural land and from forests, may be measured in the primary sources in different units (tons, cubic metres). A final ecosystem service flow represents an exchange between an ecosystem asset (a producing unit) and an economic unit. There is only a supply if there is a use. There may be a potential for more use – or there may be over-use in relation to capacity/thresholds for sustainable use, but this is not directly part of ecosystem services accounting as attempted here and described in SEEA-EEA. The notion of supply equal to use is important for operationalization of accounting – as it points to what can be measured for a certain ecosystem service. For crop production, the use of the service is the harvested amount. For timber production, it is the fellings that represent the use – not the growth in biomass or living stock. The unit can be tons (weight) or GJ (energy content). For recreational use of the forest, it is the number of visitors (or number of trips, or hours spent or similar measure of the use). Many ecosystem services are not purely produced by ecosystems but have signifi-cant input from human labour or capital. Danish intensive agriculture is a good example. It is however not feasible to measure directly the ecosystem contribution (nutritional uptake, soil processes etc.). It is therefore measured by the crop pro-duction in physical terms. When accounting in monetary terms, it would be possi-ble and reasonable to deduct costs of the human inputs. Only final ecosystem services are included in the project. Many ecosystem services are intermediate – and these are crucial in the supply of the final services. Exam-ples include soil processes and pollination. They are only accounted for indirectly through their contribution to the final services measured.
13/42
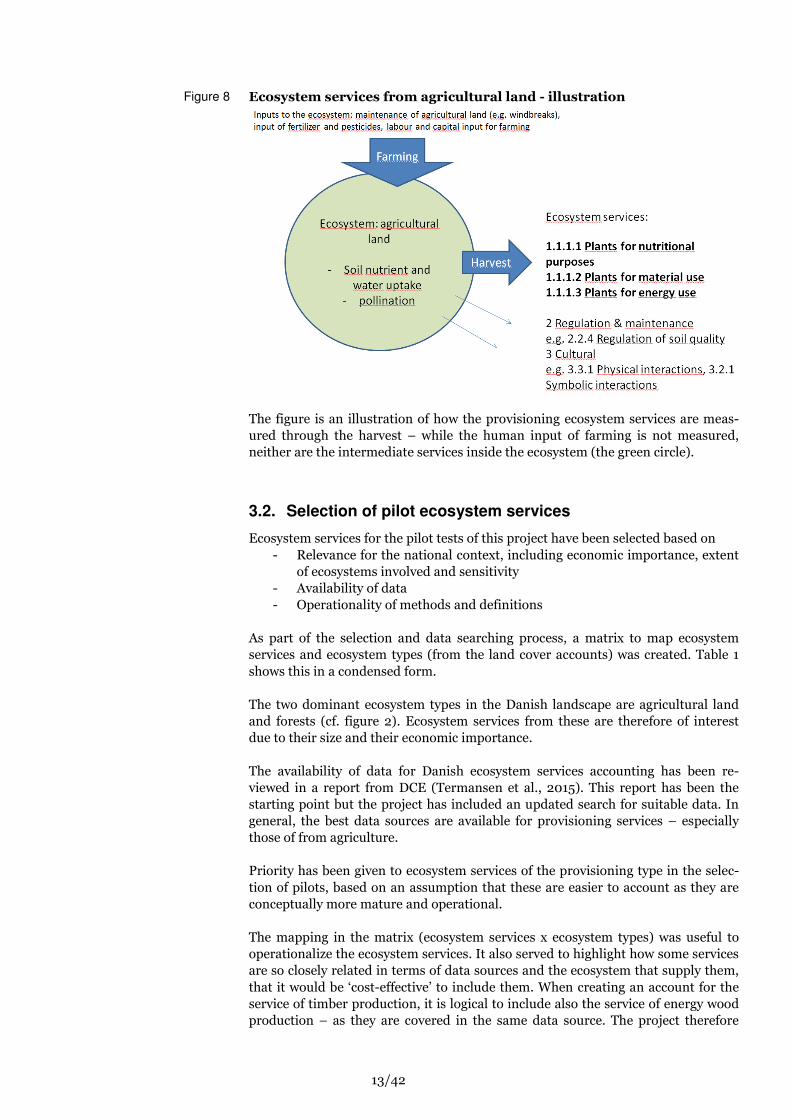
Ecosystem services from agricultural land - illustration
The figure is an illustration of how the provisioning ecosystem services are meas-ured through the harvest – while the human input of farming is not measured, neither are the intermediate services inside the ecosystem (the green circle).
3.2. Selection of pilot ecosystem services
Ecosystem services for the pilot tests of this project have been selected based on - Relevance for the national context, including economic importance, extent
of ecosystems involved and sensitivity - Availability of data - Operationality of methods and definitions
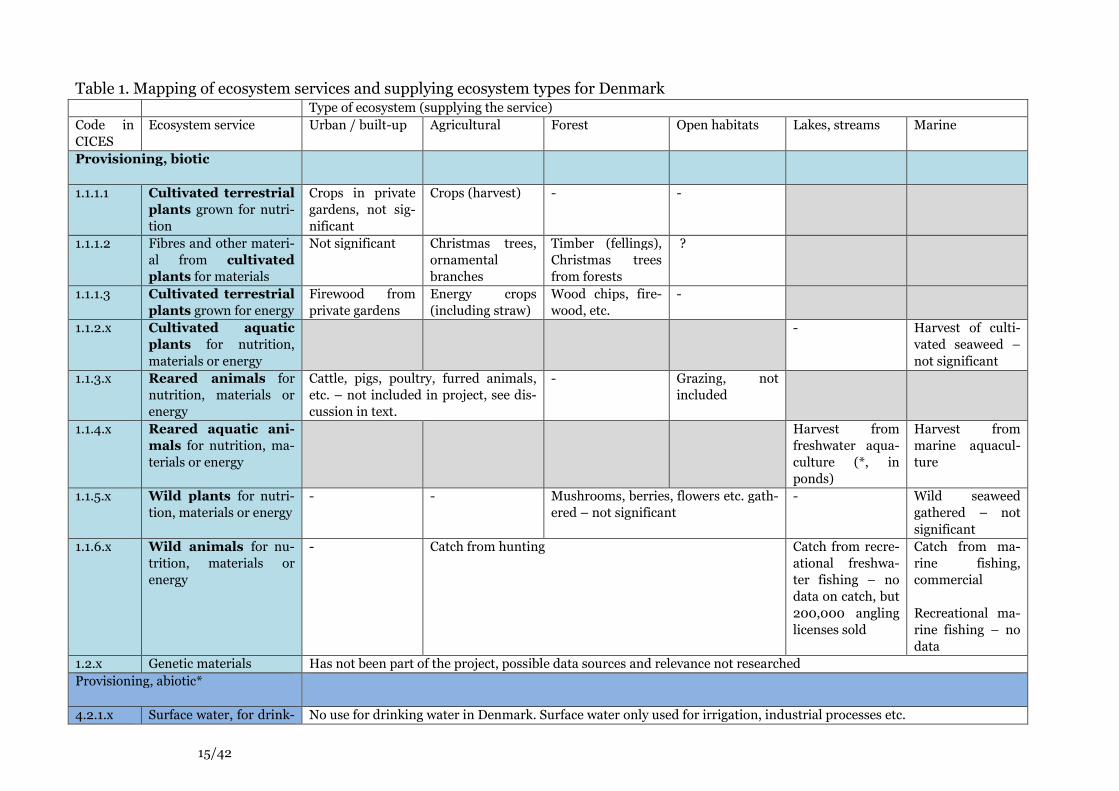
As part of the selection and data searching process, a matrix to map ecosystem services and ecosystem types (from the land cover accounts) was created. Table 1 shows this in a condensed form. The two dominant ecosystem types in the Danish landscape are agricultural land and forests (cf. figure 2). Ecosystem services from these are therefore of interest due to their size and their economic importance. The availability of data for Danish ecosystem services accounting has been re-viewed in a report from DCE (Termansen et al., 2015). This report has been the starting point but the project has included an updated search for suitable data. In general, the best data sources are available for provisioning services – especially those of from agriculture. Priority has been given to ecosystem services of the provisioning type in the selec-tion of pilots, based on an assumption that these are easier to account as they are conceptually more mature and operational. The mapping in the matrix (ecosystem services x ecosystem types) was useful to operationalize the ecosystem services. It also served to highlight how some services are so closely related in terms of data sources and the ecosystem that supply them, that it would be ‘cost-effective’ to include them. When creating an account for the service of timber production, it is logical to include also the service of energy wood production – as they are covered in the same data source. The project therefore
Figure 8
14/42
includes more than the initially planned 3 ecosystem services – also as a result of a more systematic, classification-based approach to identifying ecosystem services at most detailed level possible. Ecosystem services are mainly biotic (relating to living organisms). Abiotic services are however also systematically classified in the most recent version of CICES. In the Danish context, the abiotic service of abstraction of groundwater is particularly relevant and it has been included in this project for this reason. All Danish drinking water is abstracted groundwater and there are important links between intensive agricultural production and pressures on the drinking water resource. Provisioning services from reared animals are not included in the project. Denmark has a very large production of reared animals, especially pigs. However, this pro-duction does not fit very well into the ecosystem service framework. There is a high import content in the feeding and thereby links to ecosystems in other countries, which is not readily included in the framework. All crop production is covered in the pilot, also crops for animal feeding. So to include the reared animals would introduce some double-counting as well, as no animals are fed solely from grazing. Grazing of animals is not included in the project. Danish agriculture has significant production of seed for sowing (mainly grass seed) – 77 mill. kg in 2016. This harvest has not been included as ‘cultivated plants for nutrition’ as they are not directly used for nutrition. However, it is clearly an ecosystem service, perhaps to be classified as a subgroup.
15/42
Table 1. Mapping of ecosystem services and supplying ecosystem types for Denmark Type of ecosystem (supplying the service) Code in CICES
Ecosystem service Urban / built-up Agricultural Forest Open habitats Lakes, streams Marine
Provisioning, biotic
1.1.1.1
Cultivated terrestrial
plants grown for nutri-tion
Crops in private gardens, not sig-nificant
Crops (harvest) - -
1.1.1.2
Fibres and other materi-al from cultivated
plants for materials
Not significant Christmas trees, ornamental branches
Timber (fellings), Christmas trees from forests
?
1.1.1.3
Cultivated terrestrial
plants grown for energy Firewood from private gardens
Energy crops (including straw)
Wood chips, fire-wood, etc.
-
1.1.2.x Cultivated aquatic
plants for nutrition, materials or energy
- Harvest of culti-vated seaweed – not significant
1.1.3.x Reared animals for nutrition, materials or energy
Cattle, pigs, poultry, furred animals, etc. – not included in project, see dis-cussion in text.
- Grazing, not included
1.1.4.x Reared aquatic ani-
mals for nutrition, ma-terials or energy
Harvest from freshwater aqua-culture (*, in ponds)
Harvest from marine aquacul-ture
1.1.5.x Wild plants for nutri-tion, materials or energy
- - Mushrooms, berries, flowers etc. gath-ered – not significant
- Wild seaweed gathered – not significant
1.1.6.x
Wild animals for nu-trition, materials or energy
- Catch from hunting Catch from recre-ational freshwa-ter fishing – no data on catch, but 200,000 angling licenses sold
Catch from ma-rine fishing, commercial Recreational ma-rine fishing – no data
1.2.x Genetic materials Has not been part of the project, possible data sources and relevance not researched Provisioning, abiotic*
4.2.1.x Surface water, for drink- No use for drinking water in Denmark. Surface water only used for irrigation, industrial processes etc.

16/42
ing, material, energy use 4.2.2.1/.2 Groundwater for drink-
ing and as a ‘material’ Abstracted groundwater
4.2.2.3 Groundwater as a source of energy
Not significant in Denmark
Regulating, biotic and abiotic
2.x, 5.x These services not included in project. Data sources exists for some services of this type. Cultural, biotic 3.1.1.x Physical and experien-
tial interactions with natural environment – active and passive inter-actions in-situ
No. of trips/visits – to urban parks, green spaces
No. of trips/visits No. of trips/visits No. of trips/visits No. of trips/visits No. of trips/visits
3.1.2.x Intellectual and repre-sentative interactions with natural environ-ment in-situ – for edu-cation, traditional know-ledge, aesthetic experi-ence
Very difficult to operationalize in a standardized way – but many examples: Location of educational facilities (‘naturskoler’) as a proxy for interactions with educational purpose. The aesthetic experience is central to the ‘Naturkanon’, an official selection of the 15 most beautiful places in Danish na-ture/landscape revealed in 2018 (https://mst.dk/friluftsliv/danmarks-naturkanon/) Difficult to distinguish the aesthetic experience in-situ from passive interactions
3.2.1.x Indirect, remote, often indoor interactions with living systems that do not require presence in the environmental set-ting – symbolic or reli-gious meaning
3.2.2.x Other biotic characteris-tics that have a non-use value
No. of endangered, protected species Area of protected habitats (Natura2000, national legislation), area designated for ‘wild’ nature (e.g. ‘untouched forest’)
*Not all abiotic services shown, only this selected class.
17/42
3.3. Ecosystem services – physical supply and use tables
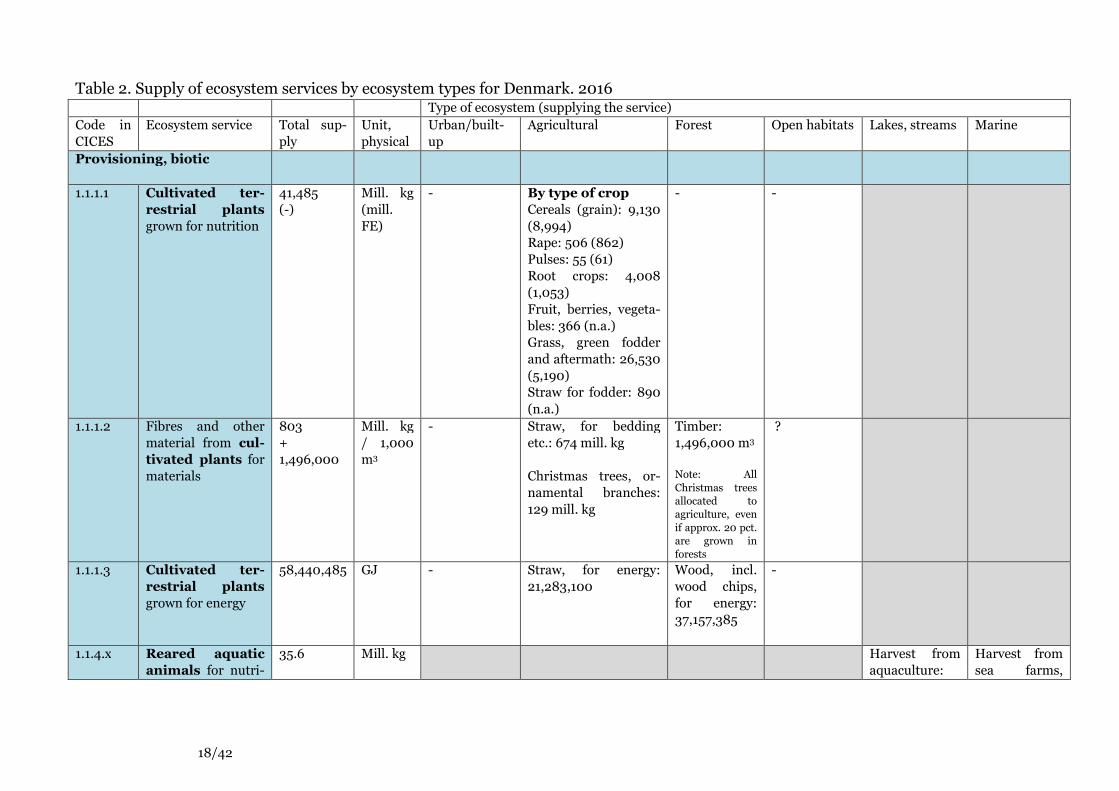
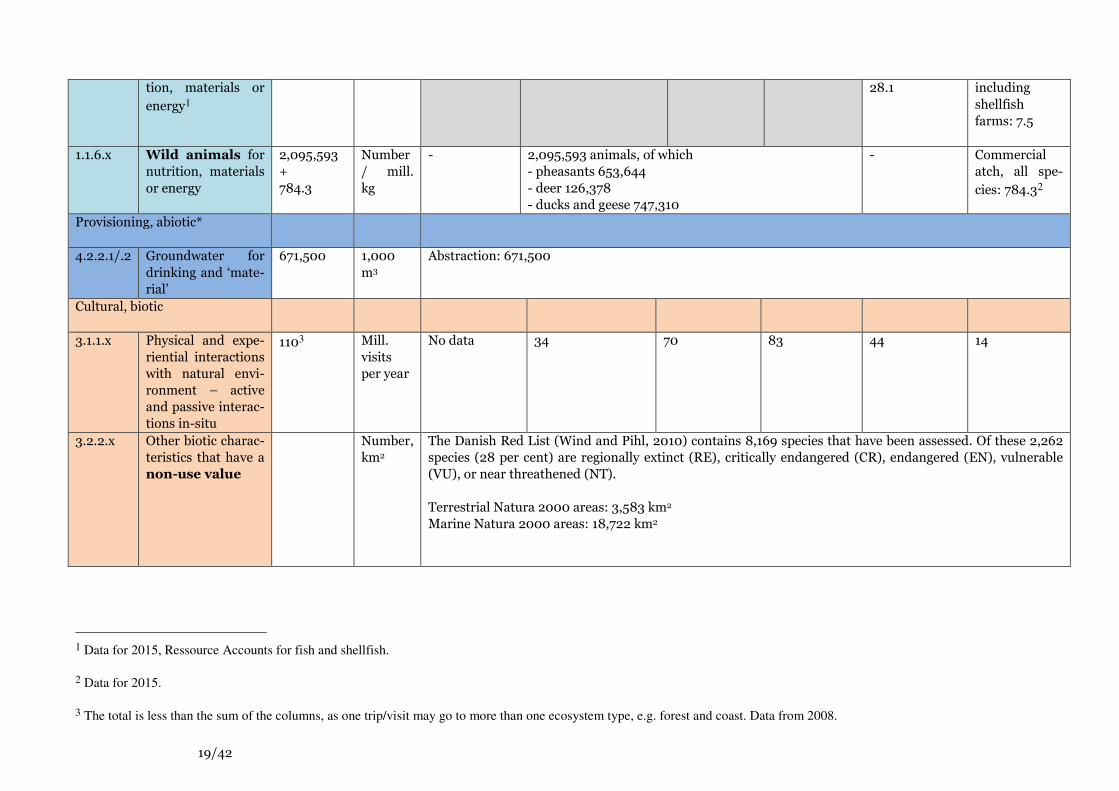
On the following pages, the physical supply and use tables of the selected ecosystem services are shown. The tables are compiled with data for reference year 2016, with a few exceptions as noted. The supply table (table 2) has the same main dimensions as table 1. The difference is that in table 2, actual data has been inserted – and an additional column for the physical unit. Those services not covered in terms of data in the project have been left out. The use table (table 3) has the same ecosystem services in the rows as the supply table, while the columns are the users: households, industry groups etc. The supply and use tables have data on national totals. In the following sections of the report, more detail is given on each row (type of service) in terms of description of data sources, method/data processing and results for the geographical distribu-tion. In principle, the supply and use tables should include columns for the rest of the world to record imports and exports of ecosystem services. Services used by non-residents (e.g. tourists) should be considered exports, whereas services consumed by residents abroad are imports. This has not been attempted within the project, even if there may be possibilities through statistics on tourism.
18/42
Table 2. Supply of ecosystem services by ecosystem types for Denmark. 2016 Type of ecosystem (supplying the service) Code in CICES
Ecosystem service Total sup-ply
Unit, physical
Urban/built-up
Agricultural Forest Open habitats Lakes, streams Marine
Provisioning, biotic
1.1.1.1
Cultivated ter-
restrial plants grown for nutrition
41,485 (-)
Mill. kg (mill. FE)
- By type of crop
Cereals (grain): 9,130 (8,994) Rape: 506 (862) Pulses: 55 (61) Root crops: 4,008 (1,053) Fruit, berries, vegeta-bles: 366 (n.a.) Grass, green fodder and aftermath: 26,530 (5,190) Straw for fodder: 890 (n.a.)
- -
1.1.1.2
Fibres and other material from cul-tivated plants for materials
803 + 1,496,000
Mill. kg / 1,000 m3
- Straw, for bedding etc.: 674 mill. kg Christmas trees, or-namental branches: 129 mill. kg
Timber: 1,496,000 m3
Note: All Christmas trees allocated to agriculture, even if approx. 20 pct. are grown in forests
?
1.1.1.3
Cultivated ter-
restrial plants grown for energy
58,440,485 GJ - Straw, for energy: 21,283,100
Wood, incl. wood chips, for energy: 37,157,385
-
1.1.4.x Reared aquatic
animals for nutri-35.6 Mill. kg Harvest from
aquaculture: Harvest from sea farms,
19/42
tion, materials or energy1
28.1 including shellfish farms: 7.5
1.1.6.x
Wild animals for nutrition, materials or energy
2,095,593 + 784.3
Number / mill. kg
- 2,095,593 animals, of which - pheasants 653,644 - deer 126,378 - ducks and geese 747,310
- Commercial atch, all spe-cies: 784.32
Provisioning, abiotic*
4.2.2.1/.2 Groundwater for drinking and ‘mate-rial’
671,500 1,000 m3
Abstraction: 671,500
Cultural, biotic
3.1.1.x Physical and expe-riential interactions with natural envi-ronment – active and passive interac-tions in-situ
1103 Mill. visits per year
No data 34 70 83 44 14
3.2.2.x Other biotic charac-teristics that have a non-use value
Number, km2
The Danish Red List (Wind and Pihl, 2010) contains 8,169 species that have been assessed. Of these 2,262 species (28 per cent) are regionally extinct (RE), critically endangered (CR), endangered (EN), vulnerable (VU), or near threathened (NT). Terrestrial Natura 2000 areas: 3,583 km2 Marine Natura 2000 areas: 18,722 km2
1 Data for 2015, Ressource Accounts for fish and shellfish.
2 Data for 2015.
3 The total is less than the sum of the columns, as one trip/visit may go to more than one ecosystem type, e.g. forest and coast. Data from 2008.
20/42
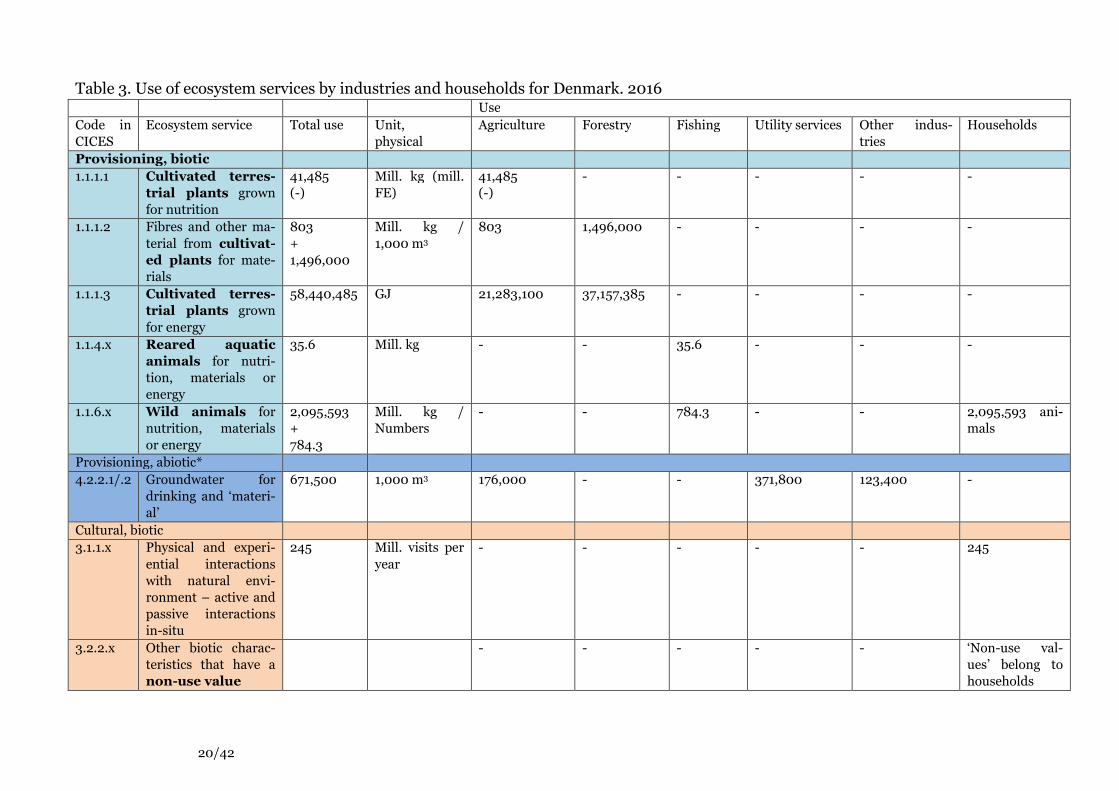
Table 3. Use of ecosystem services by industries and households for Denmark. 2016 Use Code in CICES
Ecosystem service Total use Unit, physical
Agriculture Forestry Fishing Utility services Other indus-tries
Households
Provisioning, biotic 1.1.1.1
Cultivated terres-
trial plants grown for nutrition
41,485 (-)
Mill. kg (mill. FE)
41,485 (-)
- - - - -
1.1.1.2
Fibres and other ma-terial from cultivat-ed plants for mate-rials
803 + 1,496,000
Mill. kg / 1,000 m3
803 1,496,000 - - - -
1.1.1.3
Cultivated terres-
trial plants grown for energy
58,440,485 GJ 21,283,100 37,157,385 - - - -
1.1.4.x Reared aquatic
animals for nutri-tion, materials or energy
35.6 Mill. kg - - 35.6 - - -
1.1.6.x
Wild animals for nutrition, materials or energy
2,095,593 + 784.3
Mill. kg / Numbers
- - 784.3 - - 2,095,593 ani-mals
Provisioning, abiotic* 4.2.2.1/.2 Groundwater for
drinking and ‘materi-al’
671,500 1,000 m3 176,000 - - 371,800 123,400 -
Cultural, biotic 3.1.1.x Physical and experi-
ential interactions with natural envi-ronment – active and passive interactions in-situ
245 Mill. visits per year
- - - - - 245
3.2.2.x Other biotic charac-teristics that have a non-use value
- - - - - ‘Non-use val-ues’ belong to households
21/42
4. Selected ecosystem services
In this chapter, the accounts for the selected ecosystem services are explored in more detail – in relation to the data sources, data processing and results, especially concerning the geographical distribution of the national totals from the supply and use tables (tables 2 and 3)
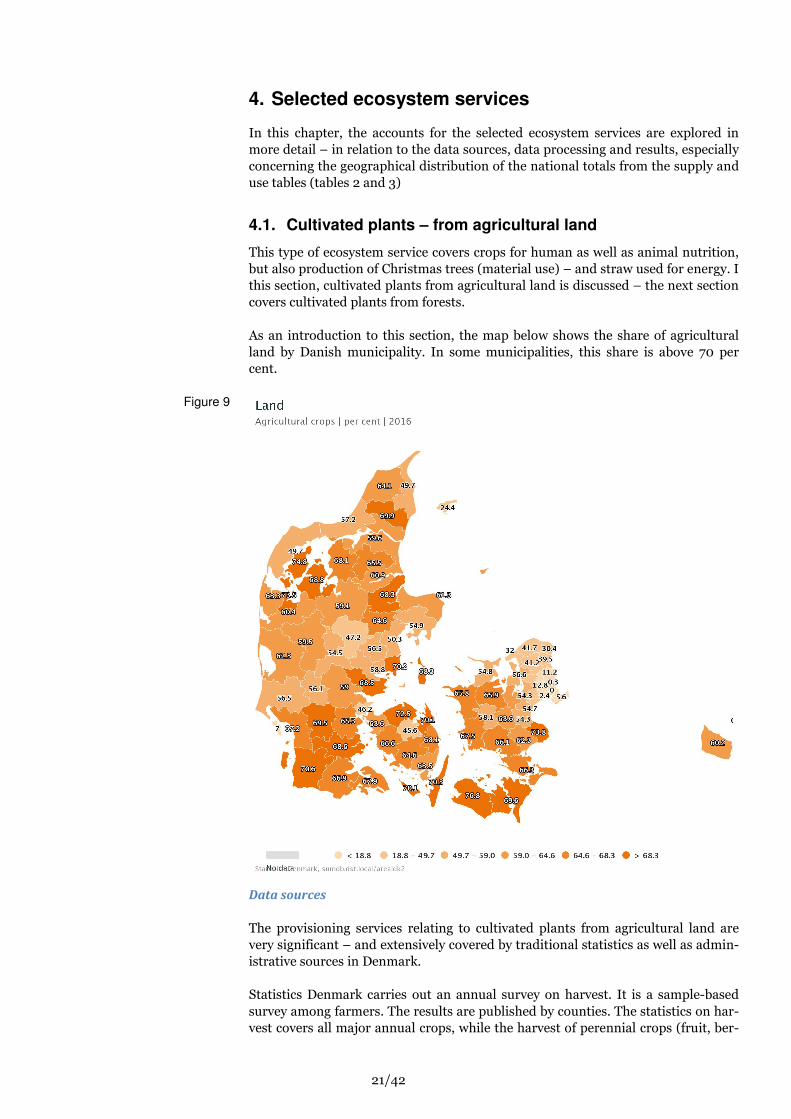
4.1. Cultivated plants – from agricultural land
This type of ecosystem service covers crops for human as well as animal nutrition, but also production of Christmas trees (material use) – and straw used for energy. I this section, cultivated plants from agricultural land is discussed – the next section covers cultivated plants from forests. As an introduction to this section, the map below shows the share of agricultural land by Danish municipality. In some municipalities, this share is above 70 per cent.
Data sources
The provisioning services relating to cultivated plants from agricultural land are very significant – and extensively covered by traditional statistics as well as admin-istrative sources in Denmark. Statistics Denmark carries out an annual survey on harvest. It is a sample-based survey among farmers. The results are published by counties. The statistics on har-vest covers all major annual crops, while the harvest of perennial crops (fruit, ber-
Figure 9
22/42
ries) and vegetables is surveyed less regularly – production in years without survey is calculated. The production of Christmas trees and ornamental branches is significant in Den-mark. This special ‘crop’ is not covered by the harvest statistics, but information on the annual production can be found through statistics on exports of goods. Infor-mation from the growers’ association has been used to make estimates covering the non-exported part of production. The main energy crop is straw. Agricultural production statistics covers the annual production and use of straw. The production of straw is estimated in agricultural production statistics based on the harvest of grain by applying standard factors specific to each type of cereal (tons straw per tons grain). Straw is used for several purposes: energy, fodder, bedding etc. – and some may be left in the field. Agricul-tural statistics includes a survey as to the use of straw, which is used as a source for determining the geographical distribution of straw used for energy purposes. This statistics on straw production is also input to the Energy Accounts. Figures for the energy content in straw for energy production are taken from the Energy Ac-counts where conversion factors are applied (GJ per ton). Some dedicated energy crops are also grown in Denmark. These are however not readily distinguished from crops for nutrition – it is especially rape which is grown for both purposes. All rape is included in the nutrition row in the supply table, so in that way there is an underestimate of the production of plants for energy. It has not been possible to find a good estimate on the share for each purpose. The statistics listed above are not very detailed at the geographical level. However, all agricultural plots in Denmark are registered in digital maps maintained by the Danish Agricultural Agency – the field and field parcel maps. Each year all farmers register the crop they will grow for each field. The maps are used for administrative and regulatory purposes, including subsidies under the common agricultural poli-cy. The maps provide detailed annual geographical data on the distribution on crops, including grass and fallow. Information on the maps is available online, but only in Danish at http://lbst.dk/landbrug/kort-og-markblokke/markkort-og-markblokke/. BASEMAP contains the field map – for practical reasons the data processing has been done not on BASEMAP, but on the original field map. The totals and the distribution are consistent with BASEMAP. Concerning the use, by definition the user of provisioning services from agricultural land is agriculture. All supply is therefore assigned to this use. A final note on the data sources for the provisioning services from agricultural land is that they are produced annually almost all of them. It is therefore possible to produce time series. Unfortunately, it has not been possible to do so within the time frame of this project.
Data processing
To have geographical distribution, the statistics on harvest have been combined with the field map through the following steps - The agricultural map is ‘clipped’ with the map of Danish municipalities. Clip-
ping is a GIS procedure combining two maps of ‘polygons’. Each field in the ag-ricultural map is through this step given a municipality code.
- For each crop, the average harvest pr hectare for the county is found from the harvest statistics. All municipalities are in a county.
- It is then possible to calculate at municipal level the harvest for each crop. This is based on an assumption that the municipal yield per hectare is similar to that of the county. Possibly this could be refined by adding to the calculations data
23/42
on the type of soil (digital maps of soil types are available for Denmark, but has not been incorporated in this project)
Similar processing has been done for the production of Christmas trees, only here the assumption has been that all fields have same average production per hectare. This is obviously not correct for a single year, as this is a perennial crop. So the resulting map is best interpreted as showing an average over a number of years. Also, some Christmas trees (approximately 20 percent) are grown not on fields registered in the field map, but in forests. Unfortunately, there is no map of Christmas tree plots in forests. The data processing has been done using the software FME, as well as SAS. The maps for showing the results are produced by an internal version of Statistics Denmark’s own Statbank.dk-solution, which has a built-in map feature.
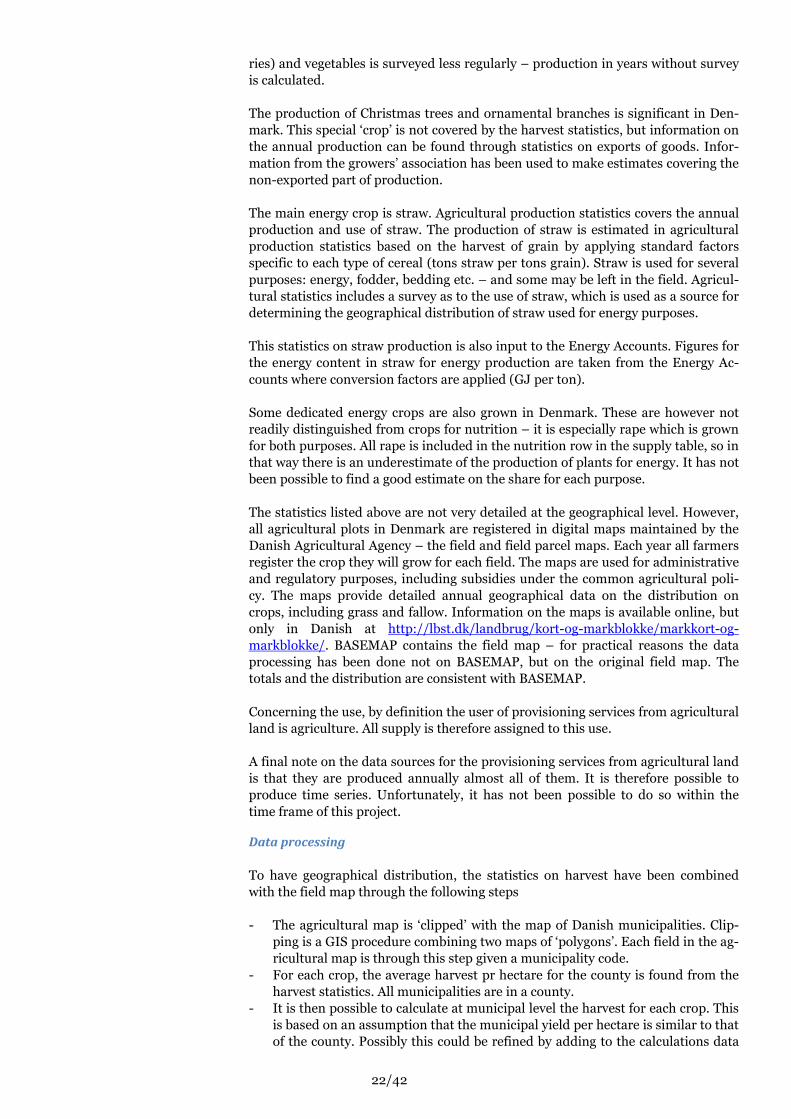
Results - Geographical distribution
To have a good map of the flow of ecosystem services from agricultural land, it is necessary to add together different crops. This is not straightforward as 1 kg of wheat is not quite similar to 1 kg of fodder beet – in monetary value, or in nutri-tional value. In Danish agricultural statistics, the ‘fodder unit’ (F.U.) is used to compare across crops. One fodder equivalent (FE) is equal to the nutritional value (energy content) of 1 kg of rye. 1 kg of grain yield of different crops is converted into fodder units with standard factors4.
4 Wheat 1.0241; Rye and triticale 1,0000; Barley 0,9551; Oat 0.7944; Mixed seed 0,7944; Rape 1,7037; Pulses 1,0897; Field peas 1.0897; Corn cobs 1.0638
Figure 10
24/42
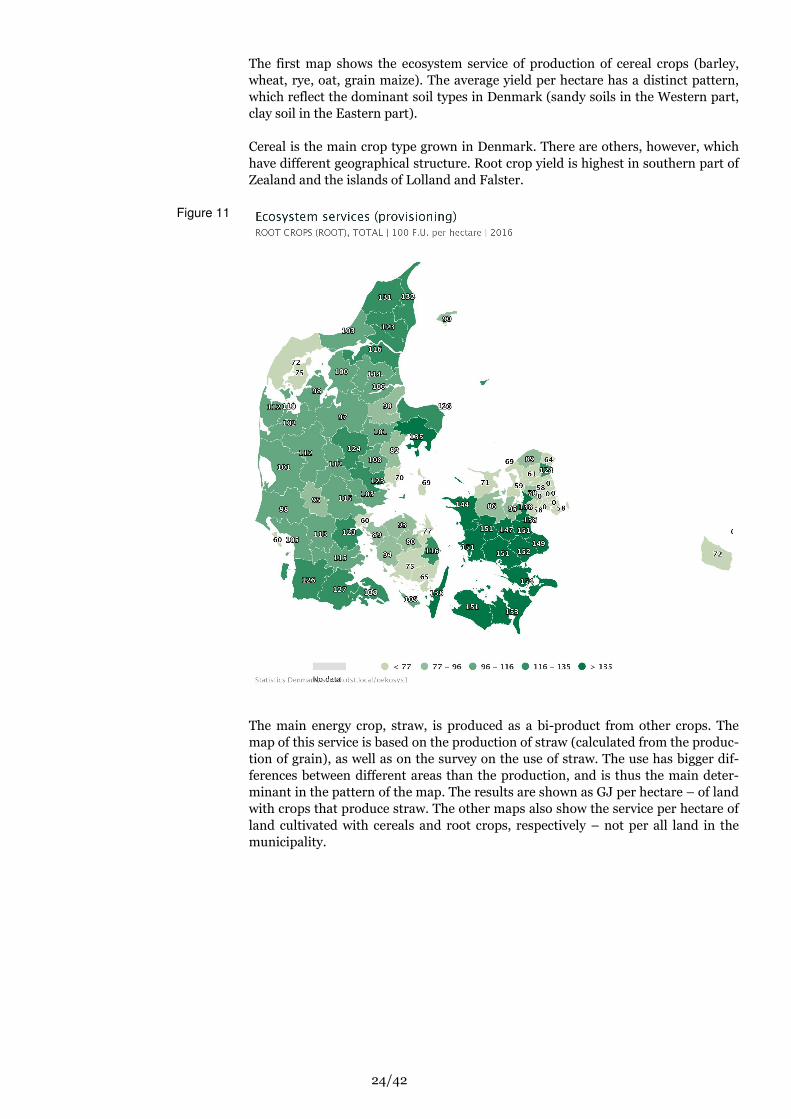
The first map shows the ecosystem service of production of cereal crops (barley, wheat, rye, oat, grain maize). The average yield per hectare has a distinct pattern, which reflect the dominant soil types in Denmark (sandy soils in the Western part, clay soil in the Eastern part). Cereal is the main crop type grown in Denmark. There are others, however, which have different geographical structure. Root crop yield is highest in southern part of Zealand and the islands of Lolland and Falster.
The main energy crop, straw, is produced as a bi-product from other crops. The map of this service is based on the production of straw (calculated from the produc-tion of grain), as well as on the survey on the use of straw. The use has bigger dif-ferences between different areas than the production, and is thus the main deter-minant in the pattern of the map. The results are shown as GJ per hectare – of land with crops that produce straw. The other maps also show the service per hectare of land cultivated with cereals and root crops, respectively – not per all land in the municipality.
Figure 11

25/42
4.2. Cultivated plants – from forests
The Danish forests produce provisioning services of material (timber) and energy (firewood, energy wood). There are no cultivated plants for nutrition from forests. Practically all Danish forests are managed to a degree that the trees can be consid-ered cultivated plants. Small ‘untouched forests’ exists, but these are protected and no fellings take place in these so no provisioning service of wild plants is used.
Data sources
The National Forest Inventory (NFI) is produced and published annually by the University of Copenhagen. It contains data on the Danish forest: the growing stock, types of trees, age of trees and similar. The geographical detail published is normal-ly the level of regions, but for this project we have been able to use municipal level data. These are not published as part of the NFI, as they are Statistics Denmark produces annual statistics on fellings through a survey. BASEMAP provides forest area by municipality. The forest area of BASEMAP and the forest area of the NFI are different in size, especially at detailed geographical level. There are some definitorial and methodological differences causing this. To have consolidated land accounts as the basis for the ecosystem services accounts, we have chosen to use the BASEMAP forest area in this project. The main source for the forest area in BASEMAP is the national topographical map. A significant part of fellings in Danish forests are for energy. The Energy Accounts are used as a source for the amount of energy (in GJ) that comes from Danish pro-duction of firewood and wood chips. The Energy Accounts have also other sources than the statistics on fellings, especially regarding firewood – as there is a large production of firewood through other channels (collection from private gardens,
Figure 12
26/42
informal gathering etc.). The calculation is based on the distribution of the forest land, even if we know that not all firewood is produced from forest land. This may skew the distribution – and it will mean that the level (GJ per hectare) is overesti-mated.
Data processing
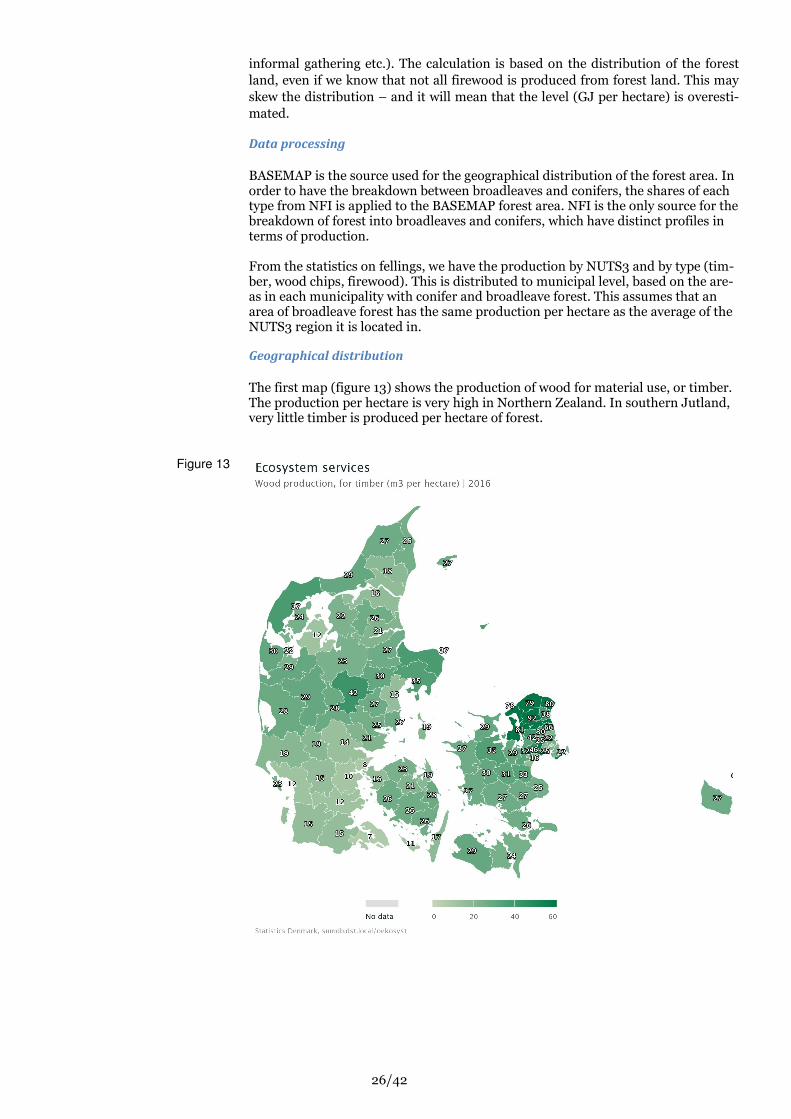
BASEMAP is the source used for the geographical distribution of the forest area. In order to have the breakdown between broadleaves and conifers, the shares of each type from NFI is applied to the BASEMAP forest area. NFI is the only source for the breakdown of forest into broadleaves and conifers, which have distinct profiles in terms of production. From the statistics on fellings, we have the production by NUTS3 and by type (tim-ber, wood chips, firewood). This is distributed to municipal level, based on the are-as in each municipality with conifer and broadleave forest. This assumes that an area of broadleave forest has the same production per hectare as the average of the NUTS3 region it is located in.
Geographical distribution
The first map (figure 13) shows the production of wood for material use, or timber. The production per hectare is very high in Northern Zealand. In southern Jutland, very little timber is produced per hectare of forest.
Figure 13

27/42
The map of the provisioning of wood (biomass from forest) for energy shows the highest supply per hectare in eastern Jutland.
4.3. Reared aquatic animals for nutrition, materials or energy
The data source for reared aquatic animals is the Resource Accounts for Fish and Shellfish – a module in the green national accounts. The link to land cov-er/BASEMAP is difficult for this service, as BASEMAP and the land cover accounts cover only ecosystems on land. The data does allow to distinguish between fish and shellfish harvested from ma-rine aquaculture – and hence the marine ecosystem – and fish and shellfish from freshwater aquaculture. Freshwater aquaculture relies on ecosystem services sup-plied by the ecosystem of streams – at least in traditional aquaculture where water from the streams is directed into a series of ponds. More and more aquaculture facilities recirculate water and are therefore less the dependent on the ecosystem of the stream (the flow of water). No geographical distribution of this service has been produced. For the marine part, there is no link to the BASEMAP or the municipal map – except for the har-bour of landing, but this is not really the location of the ecosystem service supply. For the freshwater part, we lack information on how much of production is in streams
Figure 14
28/42
4.4. Wild animals for nutrition, materials or energy
Data sources
Both aquatic and terrestrial wild animals are caught. The data on the catch of wild terrestrial animals come from the annual ‘bag statis-tics’. All hunters in Denmark make mandatory reportings of their game bag to the Environmental Protection Agency as part of the annual renewal of their hunting license. The reporting includes the species and the municipality. For the catch of wild fish, the data source is the Resource Account for Fish and Shellfish – also used for the reared aquatic animals from aquaculture. This covers only commercial cath, which is only from the sea. Recreational fishing of wild fish also takes place in Denmark, but no data exists on the amounts caught.
Data processing
For the terrestrial animals, only little data processing has been necessary, as data was already available by municipality. Most species that are hunted are not exclusive to one ecosystem type, but may ap-pear on forest land, open habitats as well as agricultural land. It is therefore not possible to connect the data to ecosystem types, as the location is not reported, only the municipality. It has therefore not been possible to calculate meaningful data on catch per hectare. For the aquatic animals, data processing for geographical distribution has not been done as the marine ecosystem is not included in the Land Accounts – and thus it is beyond scope for this project. Some information exists as to in which areas fish are caught – but accounting for this is challenged by the fact that not only Danish fish-ing vessels will catch fish in Danish waters, and vice versa.
Results – geographical distribution
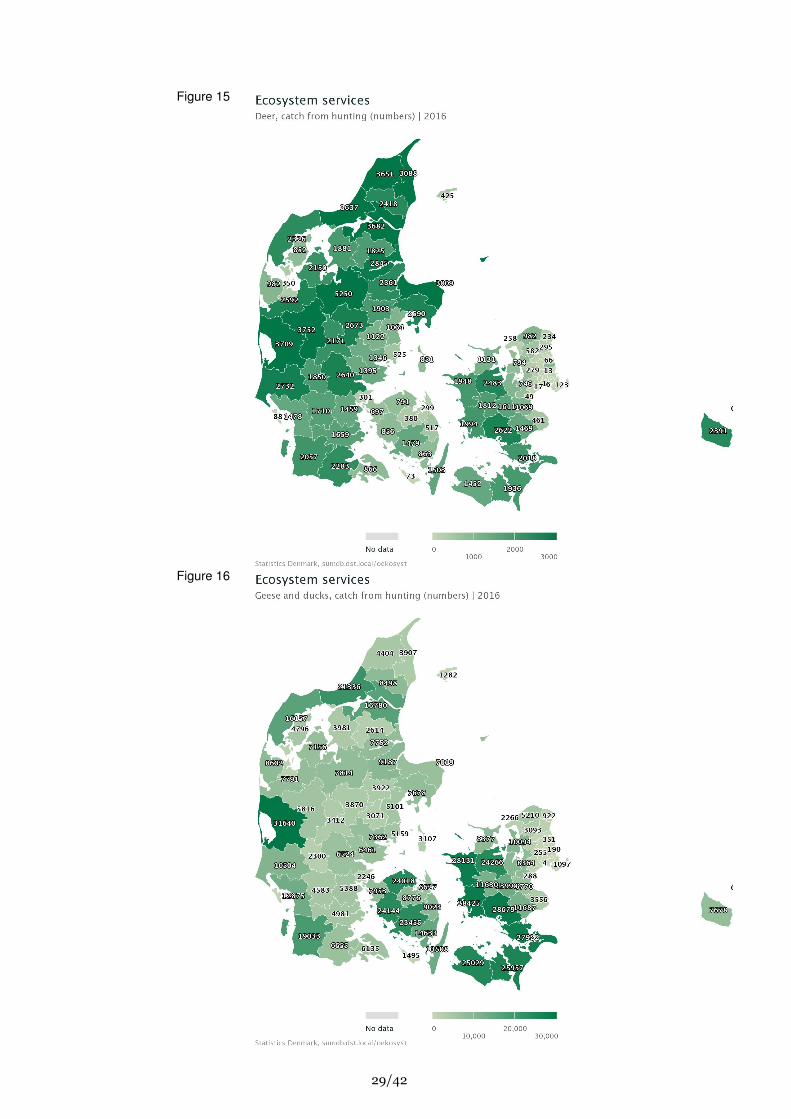
The largest animals hunted in Denmark are deer of various species. The first map shows the distribution of the catch of deer. The largest numbers of hunted animals are birds. The next maps shows catch of geese and ducks. This service is mainly produced in municipalities with large coastal areas.
29/42
Figure 15
Figure 16
30/42
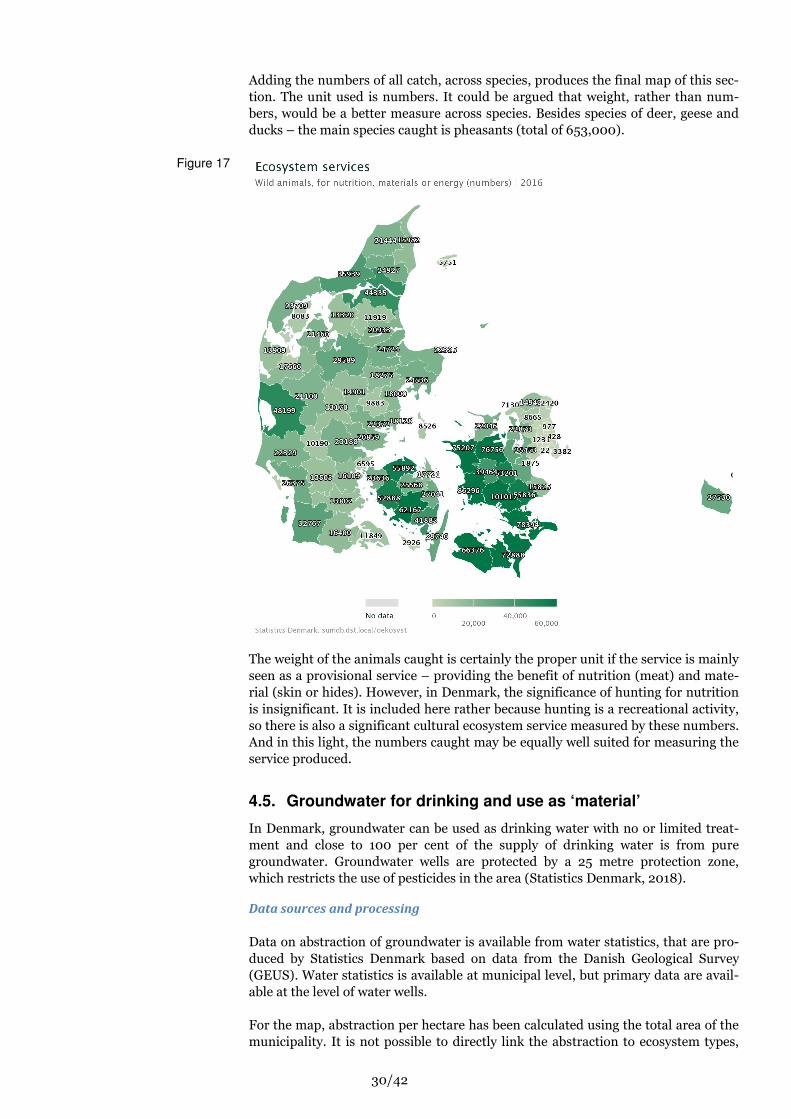
Adding the numbers of all catch, across species, produces the final map of this sec-tion. The unit used is numbers. It could be argued that weight, rather than num-bers, would be a better measure across species. Besides species of deer, geese and ducks – the main species caught is pheasants (total of 653,000).
The weight of the animals caught is certainly the proper unit if the service is mainly seen as a provisional service – providing the benefit of nutrition (meat) and mate-rial (skin or hides). However, in Denmark, the significance of hunting for nutrition is insignificant. It is included here rather because hunting is a recreational activity, so there is also a significant cultural ecosystem service measured by these numbers. And in this light, the numbers caught may be equally well suited for measuring the service produced.
4.5. Groundwater for drinking and use as ‘material’
In Denmark, groundwater can be used as drinking water with no or limited treat-ment and close to 100 per cent of the supply of drinking water is from pure groundwater. Groundwater wells are protected by a 25 metre protection zone, which restricts the use of pesticides in the area (Statistics Denmark, 2018).
Data sources and processing
Data on abstraction of groundwater is available from water statistics, that are pro-duced by Statistics Denmark based on data from the Danish Geological Survey (GEUS). Water statistics is available at municipal level, but primary data are avail-able at the level of water wells. For the map, abstraction per hectare has been calculated using the total area of the municipality. It is not possible to directly link the abstraction to ecosystem types,
Figure 17
31/42
even if using the data on location of each well – modelling of the water flow in the aquifer would be needed if a link between the ecosystems on the surface and the abstracted water at specific points were to be established. This has not been at-tempted.
Results – Geographical distribution
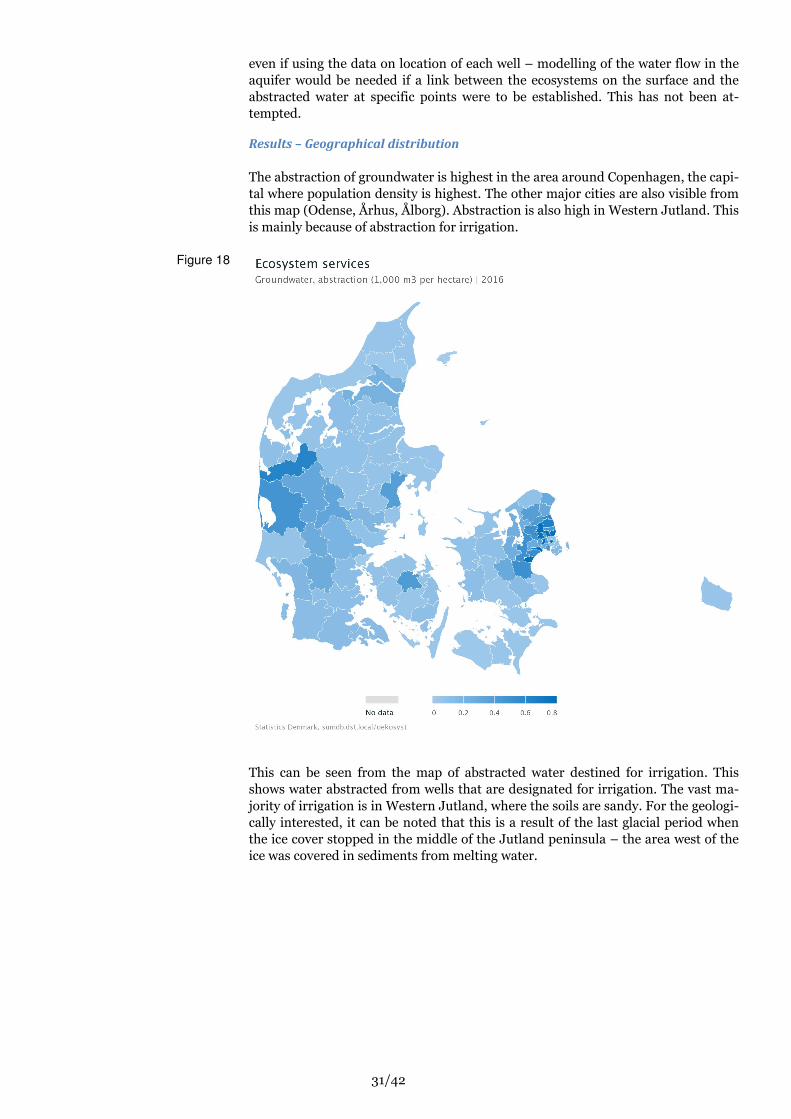
The abstraction of groundwater is highest in the area around Copenhagen, the capi-tal where population density is highest. The other major cities are also visible from this map (Odense, Århus, Ålborg). Abstraction is also high in Western Jutland. This is mainly because of abstraction for irrigation.
This can be seen from the map of abstracted water destined for irrigation. This shows water abstracted from wells that are designated for irrigation. The vast ma-jority of irrigation is in Western Jutland, where the soils are sandy. For the geologi-cally interested, it can be noted that this is a result of the last glacial period when the ice cover stopped in the middle of the Jutland peninsula – the area west of the ice was covered in sediments from melting water.
Figure 18

32/42
4.6. Physical and experiential interactions with natural envi-ronment
Data sources
Compared to the provisioning ecosystem services, data sources for cultural ecosys-tem services have much lower coverage, both for time series and geographical de-tail. This is also the case for the ecosystem service of recreation – or, as it is termed in CICES, physical and experiential interactions with the natural environment in-situ. Recreation as an ecosystem service may be supplied by many different ecosystems: forests, beaches, lakes and streams, and green artificial surfaces such as urban parks. In Denmark, the public have access rights to all forests as well as to field roads, making also agricultural land accessible for hiking, cycling, etc. Statistics Denmark produces and publishes some statistics that are relevant, at least as proxies, for recreational ecosystem services. This includes the statistics on members in associations for outdoor activities (table 4) and some parts of tourism statistics. Tourism statistics carries out a sample-based survey on travels of Danish population, abroad as well as within Denmark. Table 5 shows the results for the purpose of travel within Denmark, by Danes. A main difficulty is that even though there is a category for travelling with the purpose of experiencing nature, recrea-tional use of nature may also be an important part of travels in other categories, e.g. travels to holiday homes. The survey does not have information on the destination of the travel within Denmark.
Figure 19
33/42
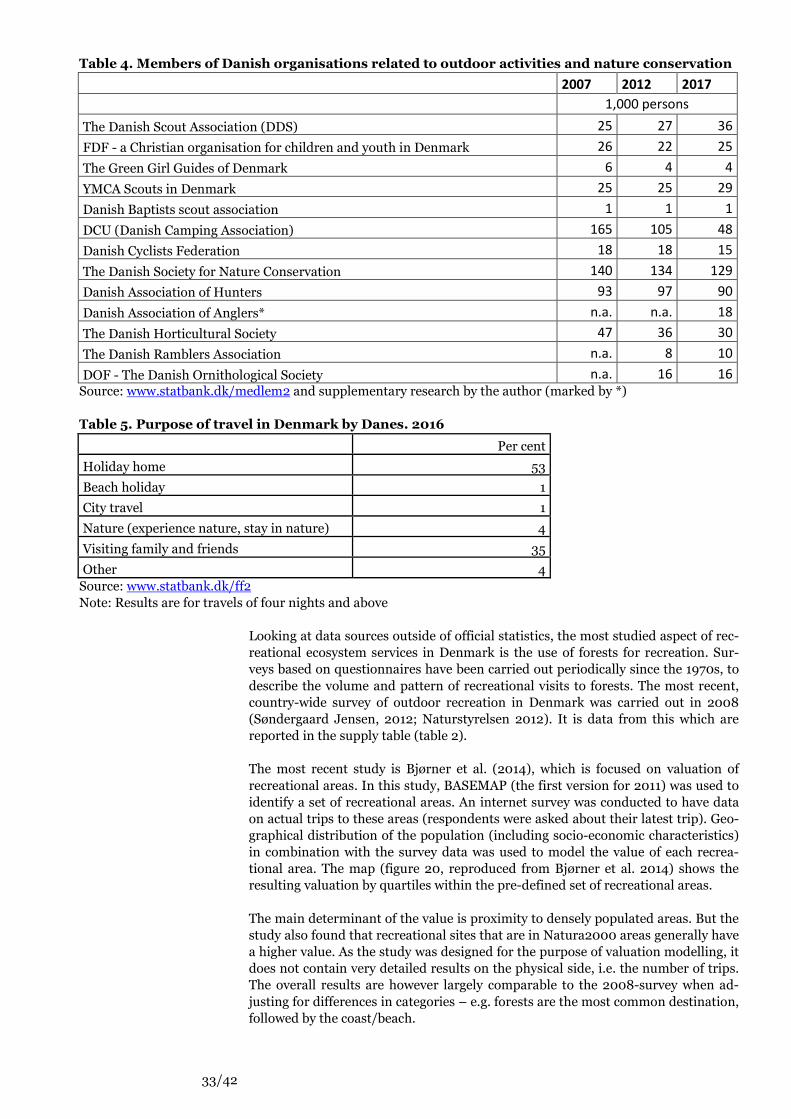
Table 4. Members of Danish organisations related to outdoor activities and nature conservation
2007 2012 2017
1,000 persons
The Danish Scout Association (DDS) 25 27 36
FDF - a Christian organisation for children and youth in Denmark 26 22 25
The Green Girl Guides of Denmark 6 4 4
YMCA Scouts in Denmark 25 25 29
Danish Baptists scout association 1 1 1
DCU (Danish Camping Association) 165 105 48
Danish Cyclists Federation 18 18 15
The Danish Society for Nature Conservation 140 134 129
Danish Association of Hunters 93 97 90
Danish Association of Anglers* n.a. n.a. 18
The Danish Horticultural Society 47 36 30
The Danish Ramblers Association n.a. 8 10
DOF - The Danish Ornithological Society n.a. 16 16
Source: www.statbank.dk/medlem2 and supplementary research by the author (marked by *) Table 5. Purpose of travel in Denmark by Danes. 2016
Per cent
Holiday home 53
Beach holiday 1
City travel 1
Nature (experience nature, stay in nature) 4
Visiting family and friends 35
Other 4 Source: www.statbank.dk/ff2 Note: Results are for travels of four nights and above
Looking at data sources outside of official statistics, the most studied aspect of rec-reational ecosystem services in Denmark is the use of forests for recreation. Sur-veys based on questionnaires have been carried out periodically since the 1970s, to describe the volume and pattern of recreational visits to forests. The most recent, country-wide survey of outdoor recreation in Denmark was carried out in 2008 (Søndergaard Jensen, 2012; Naturstyrelsen 2012). It is data from this which are reported in the supply table (table 2). The most recent study is Bjørner et al. (2014), which is focused on valuation of recreational areas. In this study, BASEMAP (the first version for 2011) was used to identify a set of recreational areas. An internet survey was conducted to have data on actual trips to these areas (respondents were asked about their latest trip). Geo-graphical distribution of the population (including socio-economic characteristics) in combination with the survey data was used to model the value of each recrea-tional area. The map (figure 20, reproduced from Bjørner et al. 2014) shows the resulting valuation by quartiles within the pre-defined set of recreational areas. The main determinant of the value is proximity to densely populated areas. But the study also found that recreational sites that are in Natura2000 areas generally have a higher value. As the study was designed for the purpose of valuation modelling, it does not contain very detailed results on the physical side, i.e. the number of trips. The overall results are however largely comparable to the 2008-survey when ad-justing for differences in categories – e.g. forests are the most common destination, followed by the coast/beach.

34/42
Monetary value of recreational areas, based on multiple site travel cost model
Source: Bjørner et al. (2014)
4.7. Other biotic characteristics that have a non-use value
The ecosystem service of the value we give to the existence of certain species or habitats is closely related to ecosystem condition and to biodiversity. It is difficult to distinguish between an account of the flow of the service of the existence of high-ly valued species from an account of biodiversity as part of the condition accounts of ecosystems. This is not necessarily a problem; it highlights the close linkages between the different types of accounts in SEEA-EEA. But accounting for biodiver-sity requires bringing the SEEA-EEA accounting framework together with data and concepts from ecology and biology (Urhammer, 2018).
Data sources and processing
There are many possible data sources for this service, from surveys, mapping and monitoring of protected habitats and species – under international conventions as well as national environmental legislation. But what actually should be measured is very difficult to determine. One possibility is the number of protected species and/or habitats. This has the advantage of being internationally harmonized to a high degree, it is well docu-mented and there are official figures.
Figure 20
Highest quartile 2nd quartile 3rd quartile Lowest quartile
35/42
Species
The Danish Red List (Wind and Pihl, 2010) contains 8,169 species that have been assessed. Of these 2,262 species are ‘red-listed’ as either regionally extinct, critical-ly endangered, endangered, vulnerable or near threatened. The total number of registered species in Denmark is 34,920, so the majority of species have not been assessed for the red list. Among the ecosystem types, forests have the highest number of species assessed on the red list – both non-threatened and ‘redlisted’. One species may belong to more than one ecosystem type. More than 50% of the ‘redlisted’ species are in forests, 27 % in open dry habitats, and 17.5 % by the coasts (Danmarks Naturfrednings-forening, 2016). Habitats
Areas protected under Natura 2000 regulation may also be used as a measure of ecosystem services of the existence value type. Natura 2000 is a network of sites selected to ensure the long-term survival of Europe's most threatened species and habitats. The mapping of these areas in Denmark is part of the BASEMAP and can therefore be extracted from this. Besides Natura 2000, the Danish Nature Protec-tion Act (§ 3) protects freshwater meadows, heather, bogs, dry meadows, coastal meadows and lakes. Therefore such open habitats are registered and mapped, a map which is also a source for BASEMAP. An area may often be protected by Natura 2000 as well as the Nature Protection Act. The BASEMAP consolidation will ensure that each km2 is only counted once. Effectively, all open habitat in BASEMAP is protected.
Results – Geographical distribution
The map shows, by municipality, the percentage of land covered by protected open habitats. Areas with forest and agricultural land may also be protected, but this is not included here. The Western coast of Jutland has the highest share of protected open habitats, whereas the southeastern parts of Denmark have significantly small-er shares. Comparing to the map of provisioning services, especially that of cereal production (figure 10) reveals how the municipalities with high cereal production per hectare are to a large extent those with the lowest shares of open habitats in municipal land. The explanation is in the fertility of the soil – in the areas of the most fertile soil, a very high share of the land has been cultivated and stays under cultivation.
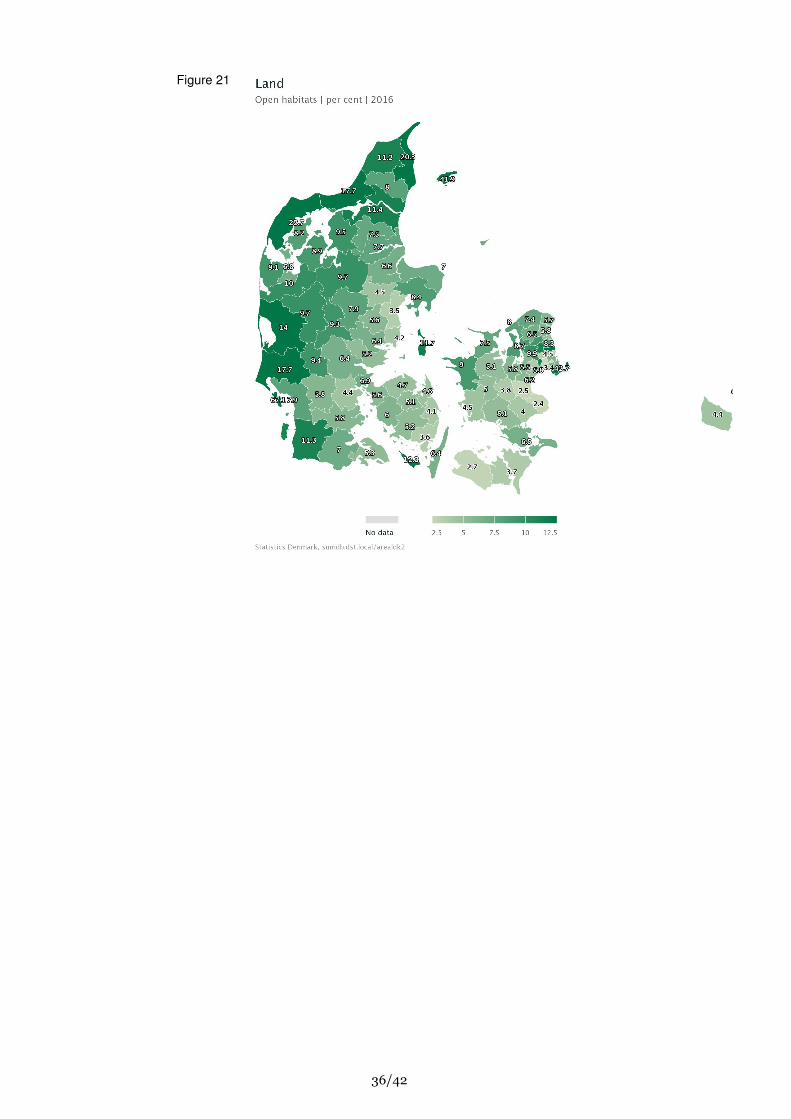
36/42
Figure 21

37/42
5. Dissemination
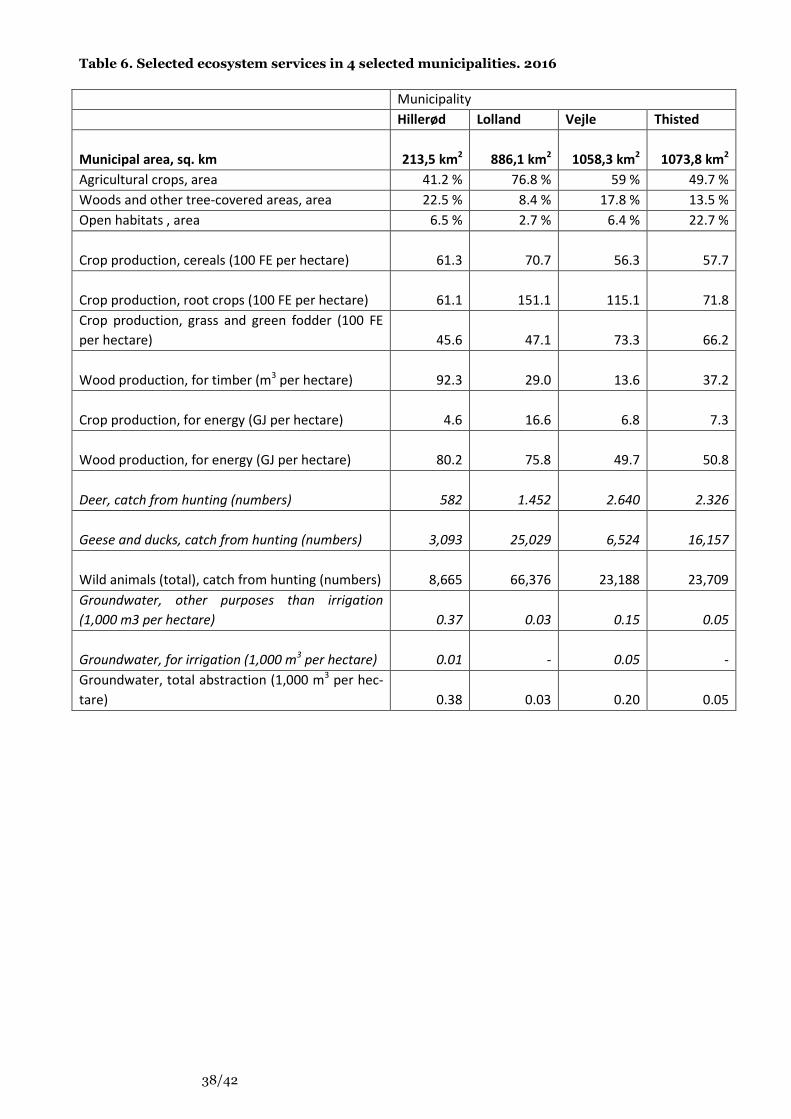
The data for all the pilot ecosystem services accounts have been uploaded in the internal version of Statistics Denmark’s dissemination data base (StatBank.dk). So they are in a format ready for dissemination. However, we have not yet decided if and how they can be published, as the accounts are not quite ready to be released as ‘official statistics’. They are partial, as not all ecosystem services are covered, and the methodology is, at least in some respects, tentative and ‘untested’. We need to work more on quality assurance and documentation before the accounts can be released. We will however attempt to publish the result in our series ‘DST Analyse’, which is used for ad hoc statistical analyses. Here it will be possible to communicate the results as well as the limitations and the experimental nature of such accounts at this stage. Another way in which the project may be disseminated is as part of cross-cutting publications from the Green National Accounts. This project has highlighted how several of the modules (Energy, Water, Forest, Fish – and, obviously, Land) are integral to ecosystem services account. An ecosystem services approach may thus be used as a framework for communicating green national accounts in a more ho-listic way, rather than as separate modules. We believe there are promising per-spectives in this approach. All the maps show the geographical distribution, ecosystem service by ecosystem service. Ideally, one should be able to ‘put all the maps on top of each other’ and see if there are areas with higher supply than others, ‘hot spots’ etc. Due to difficulties of aggregation, this is not possible or relevant – at least not for all services. There is no physical unit common across all services. So to facilitate looking across services, we have explored other possibilities. One way to present the results is to take one municipality and show all the services from ecosystems in this. This serves to highlight some of the trade-offs or synergies between ecosystem services. Even if the covered services are a very partial selec-tion, some such effects are visible from the results of this report – simply by com-paring the maps. In the table below, four municipalities representing different parts of Denmark have been selected for a presentation in this format.
38/42
Table 6. Selected ecosystem services in 4 selected municipalities. 2016
Municipality
Hillerød Lolland Vejle Thisted
Municipal area, sq. km 213,5 km2 886,1 km
2 1058,3 km
2 1073,8 km
2
Agricultural crops, area 41.2 % 76.8 % 59 % 49.7 %
Woods and other tree-covered areas, area 22.5 % 8.4 % 17.8 % 13.5 %
Open habitats , area 6.5 % 2.7 % 6.4 % 22.7 %
Crop production, cereals (100 FE per hectare)
61.3
70.7 56.3 57.7
Crop production, root crops (100 FE per hectare)
61.1
151.1 115.1 71.8
Crop production, grass and green fodder (100 FE
per hectare)
45.6
47.1 73.3 66.2
Wood production, for timber (m3 per hectare)
92.3
29.0 13.6 37.2
Crop production, for energy (GJ per hectare)
4.6
16.6
6.8
7.3
Wood production, for energy (GJ per hectare)
80.2 75.8 49.7 50.8
Deer, catch from hunting (numbers)
582
1.452 2.640 2.326
Geese and ducks, catch from hunting (numbers)
3,093
25,029 6,524 16,157
Wild animals (total), catch from hunting (numbers)
8,665
66,376 23,188 23,709
Groundwater, other purposes than irrigation
(1,000 m3 per hectare)
0.37
0.03 0.15 0.05
Groundwater, for irrigation (1,000 m3 per hectare)
0.01 - 0.05 -
Groundwater, total abstraction (1,000 m3 per hec-
tare)
0.38
0.03 0.20 0.05

39/42
The location of four selected municipalities in table 5
Figure 22
40/42
6. Discussion and conclusions
The pilot accounts have demonstrated that data are available for many ecosystem services to create accounts. But it has also encountered a number of challenges in how to produce and present such accounts in a relevant and meaningful way. The systematic classification-based approach through the matrix has been very useful for starting out. It highlights the possibilities in existing data – but also shows how it is a challenge to establish accounts for very diverse services – when a service takes many forms, defining a common physical unit for a single row be-comes difficult. Obviously, it is not possible to have one physical unit for the whole matrix. This is only possible when going to the monetary accounts, and through the associated challenges of valuation. All ecosystems supply a basket of ecosystem services. The intention of ecosystem accounting is to record all the ecosystem services provided from ecosystems – as only then will it be possible to examine trade-offs, synergies etc. This project has taken some steps towards this goal, but clearly more ecosystem services must be included in the accounts to fully realize the potential for using such accounts for policy analysis etc. Results from the pilot accounts are focused on provisioning services from agricul-tural land, which is also the dominant land cover in Denmark. The pilot accounts therefore show a very large supply of services from agricultural land. A better cov-erage of cultural services and inclusion of regulating ecosystem services might show that other ecosystems supply even more services. The pilot accounts in the present form are certainly not sufficient to inform a discussion on competing land uses in Denmark. This is very relevant as Denmark is a small country with no ‘un-used’ land and policy goals of afforestation and more ‘wild nature’ can only be realized if agricultural land is converted. Accounting also for ‘disservices’ may be necessary to have the full picture, such as contamination of groundwater.
7. Future steps and sustainability
For the provisioning services, it would be possible to go from accounts in physical units to accounts in monetary units quite readily. All the measured services (crops, timber, Christmas trees, fish etc.) have market prices. This is therefore one possible next step in ecosystem accounting in Statistics Denmark. This would have the ad-vantage of allowing aggregation across all services Another next step for Statistics Denmark in this area could be pilot accounts for regulating ecosystem services, as these have not been included in this project. For some services of this type, data sources exists readily (e.g. carbon sequestra-tion/atmospheric regulation), for others it is not immediately clear how far ac-counting could go with available data. Statistics Denmark will produce a new version of BASEMAP in 2019 (in coopera-tion with DCE, Aarhus University), for the reference year 2018. This will be used for Land Accounts for 2018. It will thus be possible to produce time series and monitor developments in ecosystems extent. Conditional on future funding, the map and the land cover accounts are to be produced every second or third year. The methodology and data processing developed in this project will be re-usable as the majority of data sources are annually produced statistics.

41/42
8. References
Bjørner, T.B., Jensen, C.U. & Termansen, M. 2014: Den rekreative værdi af naturområder i Danmark. https://dors.dk/oevrige-
publikationer/arbejdspapir/rekreative-vaerdi-naturomrader-danmark
Danmarks Naturfedningsforening. 2016. Sådan ligger landet – tal om naturen
2016. https://www.dn.dk/om-os/publikationer/sadan-ligger-landet/
European Environment Agency, 2018. Common International Classification of
Ecosystem Services, CICES, v. 5.1. https://cices.eu/
Ejrnæs, R., Petersen, A.H., Bladt, J., Bruun, H.H., Moeslund, J.E., Wiberg-Larsen, P. & Rahbek, C. 2014. Biodiversitetskort for Danmark. Udviklet i sam-arbejde mellem Center for Makroøkologi, Evolution og Klima på Københavns Universitet og Institut for Bioscience ved Aarhus Universitet. Aarhus Universi-tet, DCE – Nationalt Center for Miljø og Energi. http://dce2.au.dk/pub/SR112.pdf Friluftsrådet. 2013. Fakta om friluftslivet i Danmark.
https://friluftsraadet.dk/sites/friluftsraadet.dk/files/media/document/Fakta-om-
friluftslivet-i-Danmark-2013.pdf
Levin, G., Iosub, C.-I. & Jepsen, M.R. 2017. Basemap02. Technical documen-tation of a model for elaboration of a land-use and land-cover map for Den-mark. Aarhus University, DCE – Danish Centre for Environment and Energy http://dce2.au.dk/pub/TR95.pdf
Naturstyrelsen. 2012. Friluftslivets samfundsværdi.
Nord-Larsen, T., Johannsen, V. K., Arndal, M. F., Riis-Nielsen, T., Thomsen, I. M., Suadicani, K., & Jørgensen, B. B. (2017). Skove og plantager 2016: Forest statistics 2016. Frederiksberg.
Søndergaard Jensen, F. 2012. Friluftsliv i skovene 2008
http://videnomfriluftsliv.dk/tema/planlaegning-forvaltning/friluftsliv-i-skovene-
2008
Statistics Denmark 2018. Green National Accounts for Denmark 2015-2016.
Downloadable at www.dst.dk/publ/GreenNatUK
Termansen, M., Levin, G., Hasler, B., Jacobsen, J., Lundhede, T. & Thorsen, B.J.. 2015. Status for kortlægning af økosystemer, økosystemtjenester og deres værdier I Danmark. Aarhus Universitet, DCE – Nationalt Center for Miljø og Energi, 128 s. - Videnskabelig rapport fra DCE - Nationalt Center for Miljø og Energi nr. 147 http://dce2.au.dk/pub/SR147.pdf
UN, 2014. System of Environmental-Economic Accounting 2012 – Experi-
mental Ecosystem Accounting
UN, 2017. Technical recommendation in support of the System of Environmen-
tal-Economic Accounting 2012 - Experimental Ecosystem Accounting.

42/42
Urhammer, Emil. 2018. Biodiversity and the green national accounts in Den-
mark – a comparative analysis. Internal working paper, Statistics Denmark.
Aarhus University, 2018. Bag statistics (Vildtudbyttestatistik). Available from
http://fauna.au.dk/jagt-og-vildtforvaltning/vildtudbytte/udbyttet-online-siden-
1941/ [data downloaded September 2018].