na tional river ecosystem accounts for so uth africa ... · pdf filetake this project forward....
TRANSCRIPT
Na
tional River E
D
Je
Ecosyst
Discuss
Oct
eanne L. N
em Acc
ion Do
tober 20
Nel & Ama
counts
ocumen
015
anda Drive
for So
nt
er
uth Afrrica

National River Ecosystem Accounts for South Africa i Discussion Document, October 2015
Preface
South Africa is one of seven pilot countries involved in a global initiative called Advancing SEEA
Experimental Ecosystem Accounting,1 led by the United Nations Statistics Division (UNSD) in
partnership with the United Nations Environment Programme (UNEP) and the Convention on
Biodiversity (CBD), with funding from the Government of Norway. Within South Africa, the South
African National Biodiversity Institute (SANBI) and Statistics South Africa (Stats SA) have worked in
partnership with the Council for Scientific and Industrial Research (CSIR), the Department of Water
and Sanitation (DWS), the Department of Environmental Affairs (DEA) and Ezemvelo KZN Wildlife, to
take this project forward.
This discussion document forms part of a set of deliverables resulting from South Africa's
participation in Phase 1 of Advancing SEEA Experimental Ecosystem Accounting, which took place
from mid‐2014 to May 2016.
Relatedreports
The document forms part of a set of deliverables from South Africa for the Advancing SEEA
Experimental Ecosystem Accounting (AEEA) project. Related project reports include:
Land and Ecosystem Accounting in KwaZulu‐Natal, South Africa: Discussion Document
Advancing Experimental Ecosystem Accounting in South Africa: Stakeholder Engagement Report
National Plan for Advancing Environmental‐Economic Accounting: South Africa
Suggested citation: Nel, J.L. & Driver, A. 2015. National River Ecosystem Accounts for South Africa. Discussion document for Advancing SEEA Experimental Ecosystem Accounting Project, October 2015. South African National Biodiversity Institute, Pretoria.
1 Also referred to in some of the global project documents as Advancing Natural Capital Accounting or ANCA.
National River Ecosystem Accounts for South Africa ii Discussion Document, October 2015
Acknowledgements
We gratefully acknowledge the support of the UNSD, UNEP and the CBD Secretariat through the
Advancing SEEA Experimental Ecosystem Accounting project, as well as funding from the
Government of Norway. In particular we thank the UNSD for their enthusiastic support for South
Africa’s emerging programme of work on ecosystem accounting.
The work presented here builds on data collation and exploratory work on river condition indices in
South Africa, funded by SwedBio and led by the UNEP World Conservation Monitoring Centre and
the CSIR.
Stats SA has been a key partner in this work and a champion of ecosystem accounting, building on
their existing work on environmental accounting. In particular we thank Joe de Beer, Gerhardt
Bouwer, Riaan Grobler, Ester Koch, Robert Parry, Thembalihle Ndlovu and Brenda Mphakane for
their active advice and involvement.
We thank the Department of Water and Sanitation (DWS) for their strong commitment and
collaborative approach to this work. In particular we thank Ndileka Mohapi for her active
engagement and championship, and Neels Kleynhans for his help with interpreting national data on
present ecological state used in the river condition accounts. We also thank those who participated
in a series of technical workshops that were held to review the approach and draft results reported
here. These included a workshop on 22 July 2014 in Pretoria, at which the proposed data and
methods to develop national river ecosystem accounts for South Africa were presented, together
with initial draft results. About 25 people participated, including government officials, consultants
and other relevant experts from the freshwater ecosystem sector. On 12 May 2015 we held a
workshop to discuss the draft accounts and results in detail, involving mainly officials from DWS.
Regular reports on the development of river ecosystem accounts were provided at meetings of the
Inter‐departmental Committee on Inland Water Ecosystems, which is convened approximately twice
a year by DWS and aims to enable and strengthen co‐operative governance between national
departments and their agencies involved in managing and conserving inland water ecosystems.
The work benefited from the input of South Africa’s Strategic Advisory Committee on Ecosystem
Accounting. For a list of members and further information about stakeholder engagement linked to
the project please see the Stakeholder Engagement Report for the project as a whole.
We especially thank Lindie Smith‐Adao (CSIR) for her careful attention to detail in formatting all the
tables in this document, as well as Neels Kleynhans (DWS), Wietsche Roets (DWS), Michael Bordt
(consultant to the UNSD) and Carol Poole (SANBI) for their helpful comments on the approach and
on a draft of this document.
National River Ecosystem Accounts for South Africa iii Discussion Document, October 2015
Acronyms
AEEA
ANCA
Advancing SEEA Experimental Ecosystem Accounting
Advancing Natural Capital Accounting
CBD Convention on Biological Diversity
CSIR Council for Scientific and Industrial Research
DEA Department of Environmental Affairs
DWA Department of Water Affairs DWS Department of Water and Sanitation
GDP
GIS
Gross Domestic Product
Geographic Information Systems
KZN
LCEU
NFEPA
KwaZulu‐Natal
Land cover ecosystem functional unit
National Freshwater Ecosystem Priority Areas project
SANBI South African National Biodiversity Institute
SEEA System of Environmental‐Economic Accounting
SNA System of National Accounts
Stats SA Statistics South Africa
UNEP
UN
United Nations Environment Programme
United Nations
UNSD
WMA
United Nations Statistics Division
Water Management Area
National River Ecosystem Accounts for South Africa iv Discussion Document, October 2015
Contents
Preface .................................................................................................................................................. i
Related reports ........................................................................................................................................ i
Acknowledgements ................................................................................................................................. ii
Acronyms ............................................................................................................................................... iii
List of tables ........................................................................................................................................... vi
List of figures ......................................................................................................................................... vii
List of boxes ......................................................................................................................................... viii
Executive summary ................................................................................................................................ ix
1. Introduction ............................................................................................................................. 1
2. Ecosystem extent and condition accounts in SEEA Experimental Ecosystem Accounting ...... 5
2.1 Structure of ecosystem accounts ............................................................................................ 5
2.2 Spatial units for ecosystem accounting ................................................................................... 6
2.3 Guidance on ecosystem extent and condition accounts ......................................................... 7
3. National river‐related data in South Africa ........................................................................... 12
3.1 Catchments and river network data ...................................................................................... 12
3.2 Data on ecological condition of rivers ................................................................................... 15
3.3 River ecoregions and longitudinal zones ............................................................................... 19
3.4 Water Management Areas .................................................................................................... 21
4. Ecosystem extent account for rivers ..................................................................................... 23
4.1 Extent account for rivers in South Africa ............................................................................... 23
4.2 Extent account for rivers by Water Management Area ........................................................ 24
4.3 Extent account for rivers by longitudinal zone ...................................................................... 24
4.4 Extent account for rivers by river ecoregion ......................................................................... 25
5. Ecosystem condition account for rivers ................................................................................ 27
5.1 Condition account for main rivers, based on ecological condition indicators ...................... 27
5.2 Condition account for main rivers and tributaries, based on aggregated ecological condition
category ................................................................................................................................. 32
5.3 Condition account for main rivers and tributaries, based on the Ecological Condition Index
............................................................................................................................................... 34
6. Ecosystem condition account for rivers by Water Management Area ................................. 39
6.1 Condition account for Water Management Areas, based on ecological condition indicators
............................................................................................................................................... 39

National River Ecosystem Accounts for South Africa v Discussion Document, October 2015
6.2 Condition account for Water Management Areas, based on aggregated ecological condition
category ................................................................................................................................. 43
6.3 Condition account for Water Management Areas, based on the Ecological Condition Index
............................................................................................................................................... 46
7. Ecosystem condition account for rivers by longitudinal zone ............................................... 47
7.1 Condition account for longitudinal zones, based on aggregated ecological condition
category ................................................................................................................................. 47
7.2 Condition account for longitudinal zones, based on the Ecological Condition Index ........... 47
8. Ecosystem condition account for rivers by ecoregion .......................................................... 50
9. Recommendations and priorities for further work ............................................................... 52
9.1 Proposed indicators of ecological condition for ecosystem asset classes ............................ 52
9.2 Priorities for national river ecosystem accounting work ...................................................... 55
9.3 Priorities for further testing based on the extent and condition accounts presented here . 56
9.4 Improved systems for collecting and recording time series data on ecological condition of
rivers ...................................................................................................................................... 58
10. References ............................................................................................................................. 60

National River Ecosystem Accounts for South Africa vi Discussion Document, October 2015
Listoftables
Table 1: Example of an ecosystem extent account, from draft technical guidelines for SEEA
Experimental Ecosystem Accounting ......................................................................................... 9
Table 2: Example of an ecosystem condition account, from SEEA Experimental Ecosystem Accounting
................................................................................................................................................... 9
Table 3: Example of an ecosystem condition account, from draft technical guidelines for SEEA
Experimental Ecosystem Accounting ....................................................................................... 10
Table 4: Ecological condition indicators used in the 1999 and 2011 assessments of ecological
condition of rivers .................................................................................................................... 16
Table 5: Modification scores used for each of the ecological condition indicators, indicating the
degree of modification relative to a reference condition of natural ....................................... 17
Table 6: Aggregated ecological condition categories used in the river condition accounts, including
their relationship to the Present Ecological State categories used by DWS ........................... 17
Table 7: Ecosystem extent account for rivers in South Africa, showing length of main rivers,
tributaries and all rivers ........................................................................................................... 23
Table 8: Ecosystem extent account for rivers by Water Management Area ........................................ 25
Table 9: Ecosystem extent account for rivers by longitudinal zone ..................................................... 25
Table 10: Ecosystem extent account for rivers by river ecoregion ....................................................... 26
Table 11: Ecosystem condition account for main rivers using four ecological condition indicators,
1999 – 2011 ............................................................................................................................. 28
Table 12: Ecosystem condition account for rivers based on the aggregated ecological condition
category, for main rivers, tributaries and all rivers ................................................................. 32
Table 13: Example of how the Ecological Condition Index was calculated for main rivers in 1999 ..... 36
Table 14: The aggregated ecological condition categories and their percentile scores used by DWS to
describe modification from reference condition of natural, after Kleynhans and Louw (2007)
................................................................................................................................................. 37
Table 15: The Ecological Condition Index for 1999 and 2011 for main rivers and tributaries, on a scale
of 0 – 100 ................................................................................................................................. 37
Table 16: Ecosystem condition account for rivers of the Limpopo Water Management Area using
ecological condition indicators, 1999 – 2011 .......................................................................... 41
Table 17: Ecosystem condition account for main rivers, tributaries and all rivers in the Limpopo
Water Management Area using the aggregated ecological condition category ..................... 44
Table 18: Ecosystem condition account by longitudinal zone for (a) main rivers and (b) all rivers,
using the aggregated ecological condition category, 1999 – 2011 ......................................... 48
Table 19: Extent of main river in each aggregated ecological condition category (1999 and 2011), per
ecoregion, showing changes in absolute and percentage terms ............................................ 51
Table 20: Examples of possible indicators for assessing ecological condition in terrestrial, river,
wetland, coastal and marine realms ........................................................................................ 53

National River Ecosystem Accounts for South Africa vii Discussion Document, October 2015
Listoffigures
Figure 1: Major rivers in South Africa ..................................................................................................... 2
Figure 2: Steps in the compilation of ecosystem accounts (draft) ......................................................... 6
Figure 3: The conceptual framework used to guide assessments of ecological condition of rivers in
South Africa .............................................................................................................................. 11
Figure 4: Hydrological units (catchments) at the quaternary (fourth‐order) and quinary (fifth‐order)
scale ......................................................................................................................................... 13
Figure 5: Diagram showing the distinction between main rivers, tributaries and all rivers ................. 14
Figure 6: South Africa’s 1:500 000 river network showing (a) main rivers, and (b) main rivers and
their tributaries. ....................................................................................................................... 14
Figure 7: River ecoregions of South Africa ............................................................................................ 20
Figure 8: Schematic of four longitudinal zones for rivers, each of which has different ecological
characteristics .......................................................................................................................... 21
Figure 9: Map of South Africa showing boundaries of Water Management Areas in relation to
provinces .................................................................................................................................. 22
Figure 10: Schematic showing the three sets of ecosystem condition accounts for rivers .................. 27
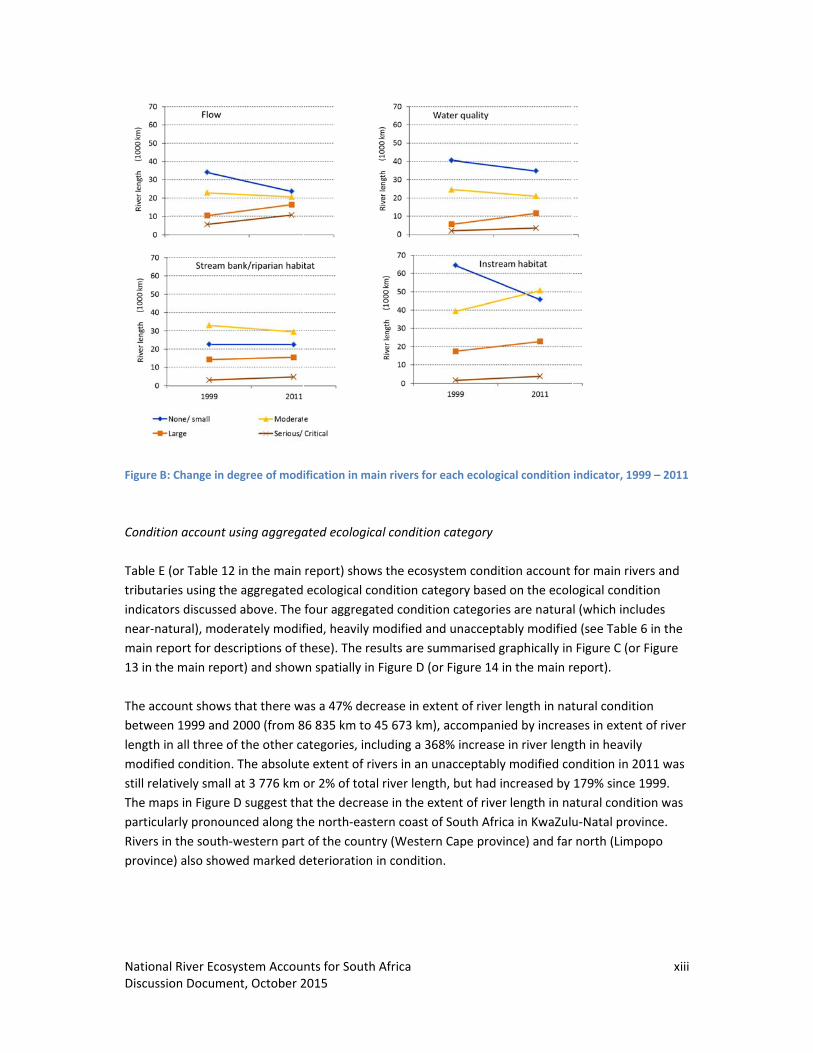
Figure 11: Change in degree of modification in main rivers for each of the four ecological condition
indicators, 1999 – 2011 ............................................................................................................ 30
Figure 12: Maps of the four ecological condition indicators for main rivers, showing the degree of
modification from natural, 1999 and 2011 .............................................................................. 31
Figure 13: Change in the extent of river length in each aggregated ecological condition category, for
main rivers, tributaries and all rivers, 1999 – 2011 ................................................................. 33
Figure 14: Maps of the aggregated ecological condition category for main rivers and all rivers in
South Africa, 1999 and 2011 .................................................................................................... 34
Figure 15: Four steps used to derive the Ecological Condition Index ................................................... 36
Figure 16: Change in the Ecological Condition Index for main rivers, tributaries and all rivers, 1999 –
2011 ......................................................................................................................................... 37
Figure 17: Comparison of trends in aggregated ecological condition categories and the Ecological
Condition Index for main rivers and all rivers .......................................................................... 38
Figure 18: Change per Water Management Area in the proportion of river length with no/small
modification (blue bars) and serious/critical modification (orange bars), for each of the four
ecological condition indicators, 1999 – 2011 .......................................................................... 42
Figure 19: Backlog in water service supply to households (DWA 2009) ............................................... 43
Figure 20: Change per Water Management Area in the proportion of river length in an aggregated
ecological condition category of natural (blue bars), and heavily or unacceptably modified
(orange bars), 1999 – 2011 ...................................................................................................... 45
Figure 21: Maps per Water Management Area of the change in the extent of river length in an
aggregated ecological condition category of natural (maps on left), and heavily or
unacceptably modified (maps on right) ................................................................................... 45
Figure 22: Change in the Ecological Condition Index of each Water Management Area for main rivers
and all rivers, 1999 – 2011 ....................................................................................................... 46

National River Ecosystem Accounts for South Africa viii Discussion Document, October 2015
Figure 23: Maps of the change in the Ecological Condition Index of each Water Management Area for
main rivers and all rivers .......................................................................................................... 46
Figure 24: Percentage of river length in each aggregated ecological condition category per
longitudinal zone ..................................................................................................................... 49
Figure 25: Change in the Ecological Condition Index per longitudinal zone for main rivers and all
rivers ........................................................................................................................................ 49
Listofboxes
Box 1: South Africa’s rivers in brief ......................................................................................................... 1
Box 2: Excerpt on ecosystem condition and extent from SEEA Experimental Ecosystem Accounting .. 8
Box 3: South Africa’s site‐based monitoring of river condition ............................................................ 58

National River Ecosystem Accounts for South Africa ix Discussion Document, October 2015
Executivesummary
This discussion document presents the results of South Africa’s first pilot set of national river
ecosystem accounts, undertaken as part of a global project on Advancing SEEA Experimental
Ecosystem Accounting. The purpose of the document includes highlighting key trends in the extent
and condition of the country’s river ecosystems, informing further ecosystem accounting work in
South Africa, and contributing to the global research agenda on ecosystem accounting.
Rivers were selected as a pilot class of ecosystem assets for national ecosystem accounts owing to
the availability of relatively comprehensive national datasets developed over more than a decade by
the Department of Water and Sanitation (DWS) and consolidated through the National Freshwater
Ecosystem Priority Areas project (NFEPA) (Nel et al 2011).
The accounts are set out as follows:
Ecosystem extent account for rivers,
Ecosystem condition account for rivers, presented in three different ways:
o Using four ecological condition indicators,
o Using an aggregated ecological condition category,
o Using an Ecological Condition Index.
In future work, our intention is to extend this set of accounts to include the full set of physical
ecosystem accounts for rivers, including ecosystem service generation and use accounts.
Throughout the accounts, a distinction is made between main rivers and tributaries. Main rivers are
defined as rivers that span more than one quaternary (fourth‐order) catchment, while tributaries are
defined as rivers that are contained within a single quaternary catchment, and usually feed into
main rivers. Main rivers and tributaries are collectively referred to as ‘all rivers’.
Ecosystem extent account
The extent of river ecosystems can be measured in terms of the length of the river network, the area
of river channels and their banks, or the volume of flow (e.g. naturalised, non‐cumulative volume of
water at a sub‐catchment scale). For the accounts presented here we measured extent in terms of
length in kilometres.
Table A (or Table 7 in the main report) shows the extent of main rivers, tributaries and all rivers,
based on the standard river network GIS layer used for national water resource management, which
is mapped at approximately 1:500 000 scale. The period 1999 to 2011 was used to correspond with
the ecosystem condition accounts shown below. There was no change in extent over this period,
reflecting the fact that river length is generally quite stable at the time scales used in accounting.
South Africa’s total river length of approximately 160 000 km is divided roughly equally between
main rivers and tributaries.

National River Ecosystem Accounts for South Africa x Discussion Document, October 2015
Table A: Ecosystem extent account for rivers in South Africa, showing length of main rivers, tributaries and all rivers
Kilometres Main rivers Tributaries All rivers
Opening stock 1999 76 310 87 223 163 533
Opening stock as % of total river length 47 53 100
Additions/reductions
Additions/reductions as a % opening stock
Opening stock 2011 76 310 87 223 163 533
Opening stock as % of total river length 47 53 100
The extent of rivers can be summarised to a range of reporting units, including administrative units
and biophysical units. Table B (or Table 8 in the main report) shows extent of rivers by the nine
Water Management Areas (WMAs) in South Africa (see Figure 9 in the main report for a map of
WMAs), which are important administrative units for management of water resources. The larger
WMAs tend to have a higher proportion of river length. Table C (or Table 9 in the main report) shows
extent of rivers by four longitudinal zones that are associated with different ecological
characteristics of rivers – from mountain streams through to lowland rivers. The majority of South
Africa’s rivers are upper or lower foothill rivers, with a moderate gradient and little to no floodplain.
Lowland rivers with distinct floodplains make up only 9% of total river length, making them relatively
rare, especially compared to many northern hemisphere countries. The fertile floodplains of these
lowland rivers are in high demand for intensive cultivation. It is also possible to show the extent
account by South Africa’s 31 river ecoregions (see Table 10 in main report, and Figure 7 for a map of
river ecoregions).
Table B: Ecosystem extent account for rivers by Water Management Area
Kilometres Main rivers Tributaries All rivers % total river
length
Berg‐Olifants 4 166 6 078 10 243 6Breede‐Gouritz 5 313 7 129 12 441 8Inkomati‐Usuthu 3 808 2 289 6 097 4Limpopo 6 117 5 625 11 742 7Mzimvubu‐Tsitsikamma
16 000 17 317 33 317 20
Olifants 6 242 4 722 10 964 7Orange 13 104 23 580 36 684 22Pongola‐Mzimkulu 10 613 7 272 17 884 11Vaal 10 948 13 212 24 160 15Total 76 310 87 233 163 533 100
* Percentage is based on the total length of all rivers in South Africa

NationaDiscussi
Table C:
Kilomet
Mounta
Upper f
Lower f
Lowland
No Data
Total
* Percenta
Ecosyste
Data for
the ecol
in 2011.
State in
for river
Figure A
the ecos
aggregat
and buil
Figure A:
Condition
lack for t
Conditio
Table D
using fo
bank/rip
conditio
l River Ecosyon Documen
Ecosystem ex
tres
ain stream
foothill stream
foothill stream
d river
a
age is based on
em condition
r the conditio
ogical condit
In each asse
South Africa
r reaches at t
A (or Figure 1
system cond
ted ecologic
ding on thes
: Schematic sh
n accounts ba
ributaries in 1
on account us
(or Table 11
ur ecologica
parian habita
on of natural
ystem Account, October 2
xtent account
Main riv
1
m 21
m 38
14
76
n the total lengt
n account
on accounts
tion of South
essment, an
a) was develo
the quaterna
10 in the mai
ition accoun
al condition
se to develop
howing the th
ased on the ec
1999 data.
sing four eco
in the main
l condition in
at. For each i
is shown as
nts for South2015
t for rivers by
vers Tribut
1 609
1 566 5
8 893 2
4 243
0
6 310 8
th of all rivers in
for rivers ca
h Africa’s rive
aggregated e
oped based o
ary (fourth‐o
n report) pro
nts are prese
category fro
p an Ecologic
hree sets of ec
cological cond
ological cond
report) show
ndicators: flo
indicator, the
none/small,
h Africa
longitudinal z
taries A
5 145
52 592
27 553
1 008
926
87 223
n South Africa
me from two
ers undertak
ecological co
on a set of u
order) or quin
ovides a sum
nted: using i
om the two n
cal Condition
cosystem con
dition indicato
dition indicat
ws the ecosy
ow, water qu
e degree of m
, moderate, l
zone
All rivers
6 754
74 158
66 445
15 251
926
163 533
o comprehen
ken by DWS,
ondition cate
nderlying ind
nary (fifth‐or
mmary of the
indicators of
national asse
n Index.
ndition accoun
ors were deve
tors
ystem condit
uality, instrea
modification
large or serio
% total rilength
nsive nationa
the first in 1
egory (called
dicators of e
rder) scale.
e three differ
f ecological c
essments und
nts for rivers
loped for mai
tion account
am habitat a
n relative to a
ous/critical. T
iver *
4
45
41
9
1
100
al assessmen
1999 and the
Present Eco
ecological con
rent ways in
condition and
dertaken by
n rivers only d
for main riv
and stream
a reference
The account
xi
nts of
e second
ological
ndition,
which
d the
DWS,
due to
ers
t sums

National River Ecosystem Accounts for South Africa xii Discussion Document, October 2015
the river length at each degree of modification, and shows the change in this length between 1999
and 2011 in absolute and proportional terms. The results are summarised graphically in Figure B (or
Figure 11 in the main report).
The account highlights that there were large declines between 1999 and 2011 in the proportion river
length with no/small modification for the indicators flow and instream habitat, reflected in steep
declines in the blue line for these indicators in Figure B. Changes in the degree of modification to
stream bank/riparian habitat were not large overall, but this indicator already reflected extensive
modification in 1999.
Table D: Ecosystem condition account for main rivers using four ecological condition indicators, 1999 – 2011
Degree of modification from natural
Kilometres None/ small
Moderate Large Serious/ Critical
No Data
Total
FLOW
Opening stock 1999 34 084 22 814 10 328 5 447 3 637 76 310
Opening stock as a % total river length 45 30 14 7 5 100
Increase/decreases ‐10 546 ‐2 316 6 017 5 129 1 715
Increases/decreases as % opening stock ‐31 ‐10 58 94 47
Opening stock 2011 23 538 20 499 16 345 10 576 5 352 76 310
Opening stock as a % total river length 31 27 21 14 7 100
WATER QUALITY
Opening stock 1999 40 579 24 634 5 518 1 943 3 637 76 310
Opening stock as a % total river length 53 32 7 3 5 100
Increase/decreases ‐5 769 ‐3 591 6 149 1 496 1 715
Increases/decreases as % opening stock ‐14 ‐15 111 77 47
Opening stock 2011 34 810 21 043 11 667 3 439 5 352 76 310
Opening stock as a % total river length
46 28 15 5 7 100
STREAM BANK/RIPARIAN HABITAT
Opening stock 1999 22 469 32 951 14 164 3 088 3 639 76 310
Opening stock as a % total river length 29 43 19 4 5 100
Increase/decreases ‐50 ‐3 612 1 255 1 667 740
Increases/decreases as % opening stock ‐11 9 54 20
Opening stock 2011 22 418 29 339 15 420 4 755 4 379 76 310
Opening stock as a % total river length
29 38 20 6 6 100
INSTREAM HABITAT
Opening stock 1999 39 736 26 188 5 446 1 301 3 639 76 310
Opening stock as a % total river length 52 34 7 2 5 100
Increase/decreases ‐11 245 426 8 180 1 898 740
Increases/decreases as % opening stock ‐28 2 150 146 6 840
Opening stock 2011 28 491 26 615 13 626 3 200 4 379 76 310
Opening stock as a % total river length 37 35 18 4 6 100
NationaDiscussi
Figure B:
Conditio
Table E (
tributari
indicato
near‐nat
main rep
13 in the
The acco
between
length in
modified
still relat
The map
particula
Rivers in
province
l River Ecosyon Documen
: Change in de
on account us
(or Table 12
ies using the
ors discussed
tural), mode
port for desc
e main repor
ount shows t
n 1999 and 2
n all three of
d condition.
tively small a
ps in Figure D
arly pronoun
n the south‐w
e) also showe
ystem Account, October 2
egree of modi
sing aggrega
in the main
e aggregated
above. The
erately modif
criptions of t
rt) and show
that there w
2000 (from 8
f the other ca
The absolute
at 3 776 km
D suggest tha
nced along th
western part
ed marked d
nts for South2015
ification in m
ated ecologic
report) show
ecological c
four aggrega
fied, heavily
these). The re
wn spatially in
as a 47% dec
86 835 km to
ategories, in
e extent of r
or 2% of tota
at the decrea
he north‐eas
t of the coun
deterioration
h Africa
ain rivers for
cal condition
ws the ecosy
ondition cat
ated conditio
modified an
esults are su
n Figure D (o
crease in ext
45 673 km),
cluding a 36
rivers in an u
al river lengt
ase in the ex
stern coast o
try (Western
n in condition
each ecologic
n category
ystem condit
egory based
on categorie
d unaccepta
ummarised g
or Figure 14 i
tent of river
, accompanie
8% increase
nacceptably
th, but had in
xtent of river
f South Afric
n Cape provi
n.
cal condition
ion account
on the ecolo
s are natura
ably modified
raphically in
n the main r
length in nat
ed by increa
in river leng
y modified co
ncreased by
r length in na
ca in KwaZulu
nce) and far
indicator, 199
for main rive
ogical condit
l (which inclu
d (see Table
Figure C (or
report).
tural conditio
ses in extent
gth in heavily
ondition in 20
179% since 1
atural condit
u‐Natal prov
north (Limp
xiii
99 – 2011
ers and
tion
udes
6 in the
r Figure
on
t of river
y
011 was
1999.
tion was
vince.
popo

NationaDiscussi
Table E: main rive
Kilometr
MAIN R
Opening
Opening
Increase
Increase
Opening
Opening
TRIBUT
Opening
Opening
Increase
Increase
Opening
Opening
ALL RIV
Opening
Opening
Increase
Increase
Opening
Opening
Figure C:rivers, tr
l River Ecosyon Documen
Ecosystem coers, tributarie
res
RIVERS
g stock 1999
g stock as a % to
e/decreases
es/decreases as
g stock 2011
g stock as a % to
TARIES
g stock 1999
g stock as a % to
e/decreases
es/decreases as
g stock 2011
g stock as a % to
VERS
g stock 1999
g stock as a % to
e/decreases
es/decreases as
g stock 2011
g stock as a % to
: Change in thibutaries and
ystem Account, October 2
ondition accoues and all rive
otal river length
% opening sto
otal river length
otal river length
% opening sto
otal river length
otal river length
% opening sto
otal river length
he extent of ri all rivers, 199
nts for South2015
unt for rivers rs
Natura
46 541
h 61
‐24 100
ck ‐52
22 441
h 29
40 294
h 46
‐17 062
ck ‐42
23 232
h 27
86 835
h 53
‐41 163
ck ‐47
45 673
h 28
iver length in 99 – 2011
h Africa
based on the
Degree
l Moderatemodified
1 22
1
0 9
2
1 31
9
4 7 4
6
2 11
2
2 18
7
5 29
3
3 20
7
3 50
8
each aggrega
e aggregated e
of modification
ely d
Heavilymodifie
315 2 79
29
467 13 16
42 47
782 15 96
42 2
470 2 08
9
339 4 76
152 22
809 6 85
22
784 4 87
18
806 17 93
70 36
591 22 81
31 1
ated ecologica
ecological con
n from natural
y d
Unacceptably
modified
91 1 02
4
68 1 46
72 14
60 2 49
21
84 32
2
66 95
29 29
50 1 28
8
75 1 35
3
35 2 42
68 17
10 3 77
14
al condition c
ndition catego
t‐
d
No Data
26 3 637
1 5
65
43
92 3 637
3 5
28 37 047
42
7
92
85 37 047
1 42
54 40 684
1 25
2
79
76 40 684
2 25
ategory, for m
xiv
ory, for
Total
76 310
100
76 310
100
87 223
100
87 223
100
163 533
100
163 533
100
main

NationaDiscussi
Figure D:1999 and
Conditio
With the
ecologic
main rep
indicatio
absence
The Eco
quinary
an index
regional
Table F a
estimate
10.6% b
tributari
l River Ecosyon Documen
: Maps of thed 2011
on account us
e aim of simp
cal condition
port for mor
on of the deg
e of significan
logical Cond
(fifth‐order)
x were to be
l, continenta
and Figure E
e of Ecologic
etween 1999
ies than mai
ystem Account, October 2
aggregated e
sing Ecologic
plifying the p
category to
re detail on t
gree of modi
nt modificati
ition Index is
catchments
developed i
l or global sc
(or Table 15
cal Condition
9 and 2011,
n rivers. Figu
nts for South2015
ecological con
cal Condition
presentation
an Ecologica
he method u
ification, wh
ion by huma
s scalable in
s to the natio
n a compara
cale.
5 and Figure
Index for riv
with a slight
ure F (or Figu
h Africa
ndition catego
n Index
n of the cond
al Condition
used). The in
ere 100 is th
n activity, an
that it can b
onal level, fo
able way for
16 in the ma
vers in South
tly lower rate
ure 22 in the
ory for main r
dition accoun
Index (see F
ndex ranges b
he reference
nd 0 is where
e calculated
r administra
other count
ain report) sh
h Africa. The
e of decline a
main report
rivers and all r
nt, we conve
igure 15 and
between 0 a
condition of
e ecosystem
for any repo
tive or bioph
ries, it could
how the resu
index for all
and better co
t) shows cha
rivers in Sout
rted the agg
d Table 13 in
nd 100, and
f an ecosyste
function is a
orting unit, f
hysical units.
be summar
ults of this in
rivers declin
ondition ove
nges in the
xv
h Africa,
regated
the
gives an
em in the
absent.
rom
. If such
ised at a
nitial
ned by
erall for

NationaDiscussi
Ecologic
the inde
Limpopo
water m
increasin
report) s
value of
experien
An analy
main rep
Western
largest d
urbanisa
Souther
where th
Table F: T
Chang
1999
Figure E:
l River Ecosyon Documen
cal Condition
ex declines in
o WMA (21%
management
ng developm
shows chang
f the index is
nced across a
ysis of the Ec
port) shows
n Coastal Bel
decline (41%
ation pressur
n Coastal Be
he main pres
The Ecologica
1999
2011
ge between
9 and 2011
Change in th
ystem Account, October 2
n Index per W
n all nine WM
%, from 83.1
(both in term
ment pressur
ges in the Eco
highest for
all four longi
cological Con
that the eco
t at 47 and t
) between 1
res around t
elt, next lowe
ssures on riv
al Condition In
Main
e Ecological C
nts for South2015
Water Manag
MAs, with the
to 61.5). Thi
ms of failing
es from min
ological Cond
mountain st
itudinal zone
ndition Index
oregions with
the Natal Coa
999 and 201
he Cape Tow
est at 50, is in
vers are from
ndex for 1999
n rivers
81.3
70.1
‐11.2
Condition Ind
h Africa
gement Area
e most dram
s is likely to
infrastructu
ing and agric
dition Index
reams and lo
es.
x by the 31 fr
h the lowest
astal Plain at
11. These two
wn and Ethek
n a known b
m cultivation
9 and 2011 for
Tributar
8
7
‐
ex for main ri
a between 19
matic decline
reflect a wid
re and poor
culture. Figu
by longitudi
owest for low
reshwater ec
Ecological Co
t 49. The Nat
o ecoregions
kwini (Durba
iodiversity h
and invasive
r main rivers a
ries
4.9
5.2
9.7
ivers, tributar
999 and 2011
being for ma
despread pro
operating ca
re G (or Figu
nal zone, an
wland rivers,
coregions (se
ondition Ind
tal Coastal P
s are subject
an) metropol
otspot (the A
e alien plants
and tributarie
All rivers
82.8
72.2
‐10.6
ries and all riv
1, and highlig
ain rivers in t
oblem of poo
apacity) and
ure 25 in the
d highlights
, with decline
ee Table 19 i
ex were the
lain showed
t to intense
itan centres
Agulhas Plain
s.
es
vers, 1999 – 2
xvi
ghts that
the
or waste
main
that the
es
n the
South
the
. The
n),
2011

NationaDiscussi
Figure F: rivers, 19
Figure G:
2011
The nati
experts
with the
rivers. O
single in
aggregat
politicia
We belie
and ther
l River Ecosyon Documen
Change in th999 – 2011
: Change in th
ional trends
involved in p
e manageme
Our overall as
ndex is gener
ted ecologic
ns or civil so
eve this inde
re has been
ystem Account, October 2
e Ecological C
he Ecological C
in the Ecolog
piloting this i
nt of rivers a
ssessment, c
rally easier to
al condition
ciety that ar
ex holds muc
considerable
nts for South2015
Condition Inde
Condition Ind
gical Conditi
index, who f
and water re
corroborated
o communica
categories, e
re not experi
ch promise fo
e excitement
h Africa
ex of each Wa
dex per longit
on Index con
felt that, base
esources, the
d by these sta
ate than sho
especially fo
enced in rive
or communic
t amongst st
ater Managem
udinal zone fo
ncur with the
ed on their e
e results refle
akeholders,
owing inter‐r
r target aud
er ecological
cating the ov
akeholders a
ment Area for
or main rivers
e judgement
experience o
ect real trend
is that summ
elated trend
iences such a
condition a
verall trends
about these
r main rivers
s and all river
t of stakehold
of working di
ds in the cou
marising tren
ds across sev
as national
nd spatial an
in river cond
initial results
xvii
and all
rs, 1999 –
ders and
rectly
untry’s
nds into a
eral
nalysis.
dition,
s.

National River Ecosystem Accounts for South Africa xviii Discussion Document, October 2015
Recommendations for ecosystem condition accounts
Drawing on our experience in developing the accounts presented here, we propose an approach to
the development of indicators of ecological condition and the structure of ecosystem condition
accounts, which can be applied across terrestrial, freshwater, coastal and marine realms, building on
the approach suggested in SEEA Experimental Ecosystem Accounting (see Section 2.3 in the main
report).
Key points include:
For each broad class of ecosystem assets (e.g. terrestrial, river, wetland, coastal, marine), four to
six indicators of ecological condition should be selected, which can be measured on a scale of 0
to 1 (or 0 to 100). These are aggregated to give an overall index of ecological condition.
Indicators of ecological condition should reflect a combination of:
o System drivers in the class of ecosystems concerned (such as land cover/land use change
in terrestrial systems, hydrological changes in freshwater systems, harvesting pressure in
marine systems),
o Habitat attributes (such as degree of fragmentation, instream siltation),
o Biological responses of the ecosystems and associated species (such as changes in
population levels of particular species, loss of species richness).
Ecologists in the different realms (terrestrial, freshwater, marine) have done substantial thinking
on this, and it is important to draw on this existing work in the process of developing the
condition accounts for a particular class of assets. It is essential for ecologists to be closely
involved in the selection of indicators of ecological condition, and in determining the method
used for aggregating them, to ensure that the result is ecologically meaningful and sensible.
It is not possible to devise a single set of indicators of ecological condition that applies to all
ecosystem asset classes; however, some indicators are likely to be common across more than
one asset class.
All indicators should be assessed/quantified in relation to a reference condition for the
ecosystem type concerned. Where possible, the reference condition is the natural condition in
the absence of significant modification by human activity. If this is not possible, an alternative
stable reference condition can be selected (e.g. condition at a particular baseline date).
Table 20 (a) to (e) in the main report provides examples of what the tables might look like for
different classes of ecosystem assets, with examples of possible indicators.
Priorities for national river ecosystem accounting work
Priorities for further work to take forward national river ecosystem accounting include the following:
Producing a full set of ecosystem accounts for rivers, including ecosystem service generation and
use accounts.
Linking the ecosystem accounts for rivers with national water accounts.
Developing land accounts for key ecological infrastructure features that are closely linked to
rivers, such as strategic water source areas, riparian zones and wetlands.

National River Ecosystem Accounts for South Africa xix Discussion Document, October 2015
Analysing ecosystem condition trends for rivers in relation to other socio‐economic indicators,
including:
o Links to census information, especially for low‐income households that rely on use of
water directly from rivers,
o Links to GDP and other aspects of the economy, especially if these can be spatially
disaggregated.
Priorities for further testing related directly to the extent and condition accounts presented here
include the following:
Reporting on the extent of rivers in terms of volume of water, in addition to length.
Testing which of the conditions accounts, graphics and maps are most useful for communicating
trends to different target audiences.
Developing a more robust Ecological Condition Index, by improving the underpinning data so
that the Present Ecological State is expressed as a continuous range from 100 (reference
condition) to zero in addition to categories.
Testing how to integrate and display confidence limits and uncertainty.
Testing the application of the ecosystem condition account in water resource planning and
policy.
Exploring options for using more quantitative, site‐based ecological condition data for rivers.
Lastly, we highlight priorities for improved systems for collecting and recording time series data on
ecological condition of rivers, including the spatial scale and methods for data collection. We
recommend that river extent and condition accounts be produced every five years in South Africa –
more frequent national scale assessment is not feasible given resource constraints. A major
challenge in this regard is that there is currently no plan for another national assessment of the
Present Ecological State of rivers. Especially if such a national assessment does not take place, we
need to ensure that there is regular monitoring in a comprehensive set of sites that can be built up
to a national picture, supplemented by innovative use of data gathered through remote sensing and
citizen science.

National River Ecosystem Accounts for South Africa 1 Discussion Document, October 2015
1. Introduction
This discussion document presents ecosystem extent and condition accounts for South Africa’s rivers
(Box 1, Figure 1). Rivers were chosen as the first set of ecosystem assets for which to compile
national ecosystem accounts primarily because of the availability of relatively comprehensive,
relevant national datasets on river ecosystems, discussed further in Section 3. The accounts
presented here build on many years of work by the Department of Water and Sanitation (DWS)2 on
mapping South Africa’s rivers and assessing their ecological condition, as well as on work undertaken
for the National Freshwater Ecosystem Priority Areas project (NFEPA),3 for which much data on
rivers was collated, reviewed and synthesised.
Box 1: South Africa’s rivers in brief
South Africa is a semi‐arid country, with an average annual rainfall of 465 mm compared to the world average
of 860 mm. The climate is characterised by an uneven, poorly predictable and highly seasonal distribution of
rainfall, while potential evapotranspiration rates exceed rainfall over most of the country. Droughts are
common and are often followed by equally devastating floods. South Africa has very few natural lakes and the
country’s rivers have highly variable flows between seasons and between years. Rivers located in the wetter
regions of the country, mainly in the east, tend to be perennial while those in the drier regions, mainly in the
west, are seasonal (flow some time each year) or ephemeral (can go for years without flowing).
As a result of unpredictable flows, large numbers of dams and inter‐basin transfer schemes have been
constructed in South Africa to increase the reliability of water supply to users. Most large rivers have been
impounded and 98% of the country’s surface‐water supply options have already been developed. There is very
limited opportunity for more dams and transfer schemes. In most catchments of the country, water demand
outstrips current water availability, and further water reconciliation options and strategies are being
considered (e.g. water demand management, water re‐use, groundwater resource development,
desalinisation).
The combination of climatic and hydrological circumstances, as well as socio‐economic demands, place
enormous pressure on the condition and functioning of South Africa’s river ecosystems. The country has a
diversity of river ecosystems, ranging from sub‐tropical in the north‐eastern part of the country, to semi‐arid
and arid in the interior, and mediterranean in the south‐west (see Section 3.3 for more on different river
ecosystem types). Consistent with global trends, high levels of threat have been reported for river ecosystems,
with over half of the country’s river and wetland ecosystem types assessed as threatened in the National
Biodiversity Assessment 2011 (Nel et al. 2007; Nel & Driver 2012).
2 Known as the Department of Water Affairs (DWA) prior to July 2014. 3 NFEPA was a three‐year multi‐partner project, completed in 2011. Products included an Atlas of Freshwater Ecosystem Priorities in South Africa (Nel et al 2011a), an accompanying implementation manual (Driver et al 2011) and a technical report (Nel et al 2011b). These documents and the data are available at http://bgis.sanbi.org/nfepa/NFEPAmap.asp.

NationaDiscussi
Figure 1:
This init
subsequ
includin
would li
conditio
future, w
of physic
generati
account
develop
The purp
ecosyste
making
to enabl
econom
manage
4 The glocontribut
l River Ecosyon Documen
Major rivers
ial set of acc
uent develop
g wetlands,
ke to motiva
on of rivers, s
we hope to b
cal ecosyste
ion and use a
s. We also h
ment of eco
pose of ecos
em services o
processes re
le links to be
my. Ecosystem
ment and ab
bal research ates particularl
Major rivers
ystem Account, October 2
in South Afri
counts for riv
pment of nat
marine and c
ate for the co
so that ecosy
build on the e
m accounts (
accounts, an
ope that this
system acco
system accou
over time. Th
elating to the
e made betw
m accounts c
bout trade‐o
agenda is set oly to the area
nts for South2015
ca
ver ecosystem
ional accoun
coastal ecosy
ollection and
ystem accou
extent and c
(see Figure 2
nd to link the
s work will co
ounting.4
unts is to qua
his is intende
e manageme
ween the mea
an support s
ffs between
out in SEEA Exof research o
h Africa
ms has been
nts for other
ystems, and
d recording o
nts for rivers
condition acc
2 in Section 2
ese accounts
ontribute to
antify and tra
ed to inform
ent of ecosys
asurement o
strategic dec
different ec
xperimental Eon physical eco
undertaken
classes of ec
terrestrial e
of improved t
s can be repe
counts prese
2.1) for rivers
with nation
the global re
ack changes
a range of p
tems and th
of ecosystem
cision making
osystem serv
Ecosystem Accosystem acco
n with a view
cosystem ass
ecosystems. I
times series
eated and st
ented here to
s, including e
al water acc
esearch agen
in ecosystem
policy, planni
e use of eco
s and the me
g about natu
vices, for exa
counting (UN unting (p147‐
w to informing
sets in South
In addition, w
data for eco
rengthened.
o produce th
ecosystem se
ounts and la
nda for the
m assets and
ing and decis
system servi
easurement
ural resource
ample in rela
2014b). This w‐148).
2
g the
h Africa,
we
ological
. In
e full set
ervice
nd
d
sion‐
ices, and
of the
e
ation to
work

National River Ecosystem Accounts for South Africa 3 Discussion Document, October 2015
the food‐water‐energy nexus. They can also provide a powerful set of information and indicators for
measuring and reporting on sustainable development.
Ecosystem accounts form part of the System of Environmental‐Economic Accounting (SEEA),
developed by the United Nations as a counterpart to the System of National Accounts (SNA). The
SNA focuses on how much is produced, consumed and invested in a country’s economy, providing a
range of information and indicators to inform macro‐economic policy, the most well‐known of which
is Gross Domestic Product (GDP). The SEEA focuses on interactions between the environment and
the economy, providing a set of complementary accounts to the SNA. The SEEA includes a Central
Framework, which was adopted by the United Nations Statistical Commission as an international
standard in 2012 (UN 2014a), as well as a more recently developed volume on Experimental
Ecosystem Accounting (UN 2014b). The SEEA Central Framework focuses on accounting for
individual environmental assets, such as timber, water, minerals and fish, while SEEA Experimental
Ecosystem Accounting focuses on accounting for ecosystem assets and ecosystem services. Relevant
aspects of SEEA Experimental Ecosystem Accounting for river ecosystem accounts are outlined
further in Section 2.
The ‘national accounting approach’ has several distinguishing characteristics, described in the
technical guidelines for ecosystem accounting which were in draft form at the time of writing (UN
2015). It implies that measurement efforts are guided by an accounting framework in which
concepts are consistently and coherently defined, thereby allowing the pragmatic integration of
multiple data sources and methods to develop metrics that provide the best possible estimates of
the concept(s) being measured. There is full recognition that data and methods are seldom perfect
and change over time, and that as data and methods change and improve, revisions of previously
published results will be required. A national accounting approach also implies a focus beyond the
local level or an individual sector – the aim is to develop a broad picture that covers the full scope
and territory of the concepts concerned.
Importantly, accounting does not necessarily imply quantification or valuation in monetary terms. In
both the SEEA Central Framework and SEEA Experimental Ecosystem Accounting, the starting point
is to account in physical terms. As explained in SEEA Experimental Ecosystem Accounting, “A key
feature of the SEEA lies in the fact that the organisation of information in physical terms facilitates
comparison with economic data even without monetary valuation and thus contributes to analysis
from both economic and environmental perspectives” (UN 2014b, p4). Monetary accounts that build
on the physical accounts may be appropriate and useful in some instances.
The accounting approach provides a systematic way of gathering and synthesising large amounts of
data that can then be used in multiple applications by a variety of sectors. Accounts in themselves
do not constitute policy advice or policy recommendations – they describe a series of stocks and
flows, and how these have changed over time. Because of the consistency and coherence of the
accounting approach, accounts can be used to provide indicators, aggregates and other information
that may help to identify key policy issues and inform policy responses. The multi‐purpose nature of
accounts is key – they are not aimed at one particular use or sector but should be able to be used in

National River Ecosystem Accounts for South Africa 4 Discussion Document, October 2015
a range of different contexts. Once‐off accounts can be useful, but the real power lies in accounts
that are produced regularly to provide consistent information over several accounting periods.
The focus of the accounts presented here is on physical accounts of the extent and condition of
rivers throughout South Africa, not on ecosystem services generated by or used from rivers or on
monetary accounts for rivers. The purpose of this document is four‐fold:
To present the extent and condition accounts for rivers for three different sets of reporting
units, highlighting key results,
To pilot an ecological condition index that shows trends in the ecological condition of rivers in a
single figure that is simple to communicate, and which can potentially be developed for other
classes of ecosystem assets,
To highlight some limitations of the underlying data on ecological condition of rivers and suggest
how these might be addressed in order to strengthen monitoring of river ecosystems going
forward, whether for ecosystem accounts or other purposes,
To contribute to the global research agenda on ecosystem accounting, especially in relation to
the measurement of ecosystem extent and condition.
The document is structured as follows:
Section 2 summarises key content from SEEA Experimental Ecosystem Accounting on ecosystem
extent and condition accounts,
Section 3 gives background on national river‐related data in South Africa,
Section 4 presents ecosystem extent accounts for rivers,
Section 5 presents ecosystem condition accounts for rivers, summarised at the national level,
Section 6 presents ecosystem condition accounts for rivers by Water Management Area (WMA),
Section 7 presents ecosystem condition accounts for rivers by longitudinal zone,
Section 8 presents ecosystem condition accounts for rivers by ecoregion,
Section 9 discusses recommendations, including a proposed approach for identifying indicators
of ecological condition across different realms, and priorities for further work.
The intended users of this document include:
Those involved in national development planning who need to consider synergies and trade‐offs
across multiple sectors,
Those involved in management of the country’s river ecosystems, including but not limited to
DWS, Catchment Management Agencies, provincial environmental affairs departments,
conservation authorities and municipalities,
Those involved in collecting and collating data for monitoring the condition of rivers, including
through government programmes and citizen science initiatives,
Those who have an interest in ecosystem accounting, especially organisations or individuals
involved in experimental ecosystem accounting work, in South Africa or elsewhere,
Those involved in developing national water accounts, which were being revitalised in South
Africa at the time of writing,
Those involved in developing national accounts and other official statistics, especially those with
an interest in strengthening the integration between geospatial and statistical information.

National River Ecosystem Accounts for South Africa 5 Discussion Document, October 2015
2. EcosystemextentandconditionaccountsinSEEAExperimentalEcosystemAccounting
SEEA Experimental Ecosystem Accounting sets out a framework for ecosystem accounting that
includes ecosystem asset accounts and ecosystem service accounts. This section summarises the
content of SEEA Experimental Ecosystem Accounting that is most directly relevant to ecosystem
extent and condition accounts, which are both components of ecosystem asset accounts. The
section includes content relating to:
The structure of ecosystem accounts,
Spatial units for ecosystem accounting,
Guidance specifically on ecosystem extent and condition accounts.
Some of the key challenges for ecosystem accounting that remain unresolved include which spatial
units to use to represent ecosystem assets, at what scale to map ecosystems, and which factors to
use to measure ecosystem condition. These are issues with which we have grappled in producing
national river ecosystem accounts, as reflected in the discussion below as well as in the rest of this
document.
2.1 Structureofecosystemaccounts
Ecosystem assets are defined in SEEA Experimental Ecosystem Accounting as “spatial areas
comprising a combination of biotic and abiotic components and characteristics that function
together” (UN 2014b, p22). Ecosystem asset accounts have three main elements according to SEEA
Experimental Ecosystem Accounting: ecosystem extent accounts, ecosystem condition accounts, and
the expected future flow of ecosystem services (which relates to the capacity of ecosystems to
provide services).
A technical guideline document that complements SEEA Experimental Ecosystem Accounting was in
draft form at the time of writing and provides more detail, including a diagram showing the
suggested full set of ecosystem accounts, reproduced here in Figure 2 (UN 2015). The intention is
that ecosystem accounts could be approached in a modular way, with different possible entry
points, represented by the different blocks in the diagram. For example, a country might start with
ecosystem service generation accounts rather than necessarily having to start with ecosystem extent
accounts. However, ultimately the aim would be to have the full set of accounts. In South Africa, we
have decided to start with ecosystem extent and condition accounts, as our available data is best
suited to this entry point.

NationaDiscussi
Figure 2:(Source:
2.2 Sp
Ecosyste
by spatia
ecosyste
Basi
Land
asse
Ecos
aggr
ecor
SEEA Ex
special t
mapped
atmosph
Account
ecosyste
flood pla
wetland
l River Ecosyon Documen
Steps in the UN 2015, p33
atialunit
em accounts
al areas. SEE
em accountin
c spatial unit
d cover ecos
ets,
system accou
regated, and
regions).
perimental E
treatment, b
d for the purp
here, marine
ting says: “Pa
ems that stra
ains; (c) cons
ds” (UN 2014
ystem Account, October 2
compilation o3)
tsforecos
s are inheren
EA Experimen
ng:
ts (BSUs) – u
ystem funct
unting units
d may be adm
Ecosystem Ac
ut does not
poses of eco
e areas and li
articular care
addle terrest
sidering othe
4b, paragraph
nts for South2015
of ecosystem
systemac
ntly spatial, a
ntal Ecosyste
usually envisa
ional units (L
(EAUs) – the
ministrative u
ccounting re
provide spec
system acco
inear feature
e should be t
trial and mar
er linear feat
h 2.81, p30,
h Africa
accounts (dra
ccounting
s they deal w
em Accounti
aged as a gri
LCEUs) – the
ese are essen
units (such a
ecognises tha
cific guidanc
ounting. Und
es, including
taken in (a) d
rine areas; (b
ures; and (d)
emphasis ad
aft)
with ecosyste
ng sets out t
id of pixels (e
se are intend
ntially report
s municipalit
at linear feat
e on how riv
er the sub‐h
rivers”, SEEA
determining
b) delineating
) defining aq
dded).
em assets th
three types o
e.g. 100m by
ded to repre
ting units to
ties) or biop
tures such as
vers should b
eading “Unit
A Experimen
the treatme
g areas relat
quatic ecosys
hat are repre
of spatial uni
y 100m),
esent ecosyst
which result
hysical units
s rivers may
be delineated
ts for the
ntal Ecosyste
ent of coasta
ted to rivers,
stems such a
6
esented
ts for
tem
ts are
s (such as
need
d or
em
l
such as
s
National River Ecosystem Accounts for South Africa 7 Discussion Document, October 2015
As discussed in Section 3 below, rivers in South Africa are currently mapped as lines, and for these
accounts we have therefore measured their extent in terms of length. In future we would ideally like
to map river channels as areas and to embed them in a national vegetation map, creating an
integrated national map of ecosystem types across the terrestrial and freshwater realms. If this is
achieved, the extent of rivers could be measured in terms of either length or area, or both. A third
option may be to measure the extent of rivers in terms of naturalised volume of water. It is already
possible to report on the volumetric extent of all rivers assessed in this report using currently
available data on mean annual runoff in South Africa. We have chosen not to pursue this option for
now, but have noted it as something to explore in future work (see Section 9).
Subsequent to the publication of SEEA Experimental Ecosystem Accounting there has been ongoing
discussion globally about how to delineate spatial units for ecosystem accounting and what to call
them. At the Forum of Experts on Ecosystem Accounting convened by the UNSD in April 2015, a
proposal was made to rename LCEUs as ‘ecosystem units’. We support this proposal for reasons
discussed in the companion discussion document to this one (Land and Ecosystem Accounting in
KwaZulu‐Natal), which relate to the need to separate the identification of ecosystem types from the
identification of land cover classes. An additional reason is that land cover datasets are generally
poor at identifying natural inland water features other than large permanent bodies of open water –
most rivers and seasonal wetlands are not picked up well in land cover datasets, and land cover data
thus provides a poor starting point for delineating most freshwater ecosystems. Rivers in South
Africa have been mapped at the national level as a river network, independently of land cover data
or land cover classes. For these accounts, ‘ecosystem units’ representing river ecosystem assets are
defined as river reaches at the fifth‐order sub‐catchment scale, as explained in more detail in
Section 3.
The interim high‐level land cover classes suggested in SEEA Experimental Ecosystem Accounting
include ‘inland water bodies’ and ‘regularly flooded areas’, which are intended to include rivers and
their floodplains. Using land cover to identify these features does not provide a comprehensive
spatial picture of the location of rivers and wetlands, and can thus be misleading for ecosystem
extent accounts. We suggest that a linear river network dataset is a better starting point for extent
accounts for rivers, recognising the limitations associated with treating rivers as lines rather than
features that also have area and volume. In the absence of a fully integrated national map of
ecosystem types across terrestrial and freshwater realms, with river channels included as areas, the
measurement of rivers by length has the advantage of avoiding any double‐counting of area
between extent accounts for terrestrial ecosystems and river ecosystems.
2.3 Guidanceonecosystemextentandconditionaccounts
In SEEA Experimental Ecosystem Accounting, ecosystem extent refers to the size of an ecosystem
asset. Extent is usually measured in terms of surface area, for example in hectares, but it is
recognised that this may be less straightforward for aquatic ecosystems. No specific guidance is
given in SEEA Experimental Ecosystem Accounting on the structure of tables for ecosystem extent

National River Ecosystem Accounts for South Africa 8 Discussion Document, October 2015
accounts, but in the draft technical guidelines referred to above (UN 2015), an example of an extent
account is given, reproduced here as Table 1. It records opening stock, additions to or reductions in
stock, and closing stock for each LCEU.
Somewhat more detail is given in SEEA Experimental Ecosystem Accounting on ecosystem condition
accounts. The relevant section is reproduced in Box 2. We are building on key points given in the
SEEA Experimental Ecosystem Accounting guidelines, including:
Ecosystem condition is assessed based on characteristics of an ecosystem asset.
Assessment of condition involves several steps:
o Identifying or selecting relevant characteristics that meaningfully reflect the functioning,
resilience and integrity of the ecosystem asset,
o Identifying indicators associated with those characteristics,
o Assessing each indicator relative to a common reference condition or benchmark.
Box 2: Excerpt on ecosystem condition and extent from SEEA Experimental Ecosystem Accounting
Ecosystem condition and ecosystem extent 2.35 Ecosystem condition reflects the overall quality of an ecosystem asset in terms of its characteristics. The assessment of ecosystem condition involves two distinct stages of measurement with reference to both the quantity and the quality aspects of the characteristics of the ecosystem asset. In the first stage, it is necessary to select appropriate characteristics and associated indicators of changes in those characteristics. The selection of characteristics and associated indicators should be carried out on a scientific basis so that there is an assessment of the ongoing functioning, resilience and integrity of the ecosystem asset. Thus, movements of the indicators should be responsive to changes in the functioning and integrity of the ecosystem as a whole. 2.36 Measures of ecosystem condition may be compiled in relation to key ecosystem characteristics (e.g., water, soil, carbon, vegetation, biodiversity) and the choice of characteristics will generally vary depending on the type of ecosystem asset. … Usually, there will not be a single indicator for assessing the quality of a single characteristic. Both the selection and measurement of characteristics and associated indicators are likely to present measurement challenges. 2.37 In the second stage, the indicators are related to a common reference condition or benchmark. … . The use of a common reference condition relative to all indicators for an ecosystem asset may allow an overall assessment of the condition of the asset. 2.38 Ecosystem extent refers to the size of an ecosystem asset. For ecosystem assets, the concept of extent is generally measured in terms of surface area, for example, hectares of a land‐cover type.21 21 Land cover is most easily associated with terrestrial ecosystems (e.g., forest, grassland, tundra). Aquatic ecosystems may be classified by type of water cover (e.g., inland water bodies, coastal water bodies, open wetlands) but also through aquatic ecosystem mapping systems which distinguish between marine, estuarine, riverine, palustrine and lacustrine environments…. These mapping systems may consider different aquatic habitats (e.g., reefs and seagrass) and factors such as depth and light availability. (Source: UN 2014b, p22‐23, italics and bold in the original)
There is an explicit recognition that “the choice of characteristics [for measuring ecosystem
condition] will generally vary depending on the type of ecosystem asset” and also that “selection of
characteristics and associated indicators should be carried out on a scientific basis” (UN 2014b, p23).
SEEA Experimental Ecosystem Accounting uses a standard set of characteristics of ecosystem
condition in all the examples given. These are: vegetation, biodiversity, soil, water, carbon, as shown
in Table 2 reproduced here. Water, carbon and soil accounts are also referred to as ‘basic resource

National River Ecosystem Accounts for South Africa 9 Discussion Document, October 2015
accounts’, and are assumed to provide information relevant for the measurement of ecosystem
condition. In other documentation on Experimental Ecosystem Accounting, the proposed
characteristics of ecosystem condition are often further simplified to: land, water, carbon,
biodiversity; and are often referred to ‘ecosystem component accounts’ as, for example, in Figure 2.
Table 1: Example of an ecosystem extent account, from draft technical guidelines for SEEA Experimental Ecosystem Accounting
Cover Urban and associated Rainfed herbaceous
cropland Forest tree cover Inland water bodies Open
wetlands Total
Use Infrastructure Residential Permanent
crops Maintenance Forestry Protected Infrastructure Aquaculture Maintenance
Ownership Government Private Private Private Private Government Government Private Government
Units hectares
Opening Stock
Additions to stock
Managed expansion
Natural expansion
Reductions to stock
Managed regression
Natural regression
Closing stock
(Source: UN 2015, Table 4.2, p35)
Table 2: Example of an ecosystem condition account, from SEEA Experimental Ecosystem Accounting
Characteristics of ecosystem condition
Vegetation Biodiversity Soil Water Carbon
Examples of indicators
Leaf area index, biomass, mean annual increment
Species richness, relative abundance
Soil organic matter content, soil carbon, groundwater table
River flow, water quality, fish species
Net carbon balance, primary productivity
Opening condition Improvements in condition Improvements due to natural regeneration (net of normal natural losses)
Improvements due to human activity
Reductions in condition Reductions due to extraction and harvest of resources
Reductions due to ongoing human activity
Catastrophic losses due to human activity
Catastrophic losses due to natural events
Closing condition
(Source: UN 2014b, Table 4.4, p83)
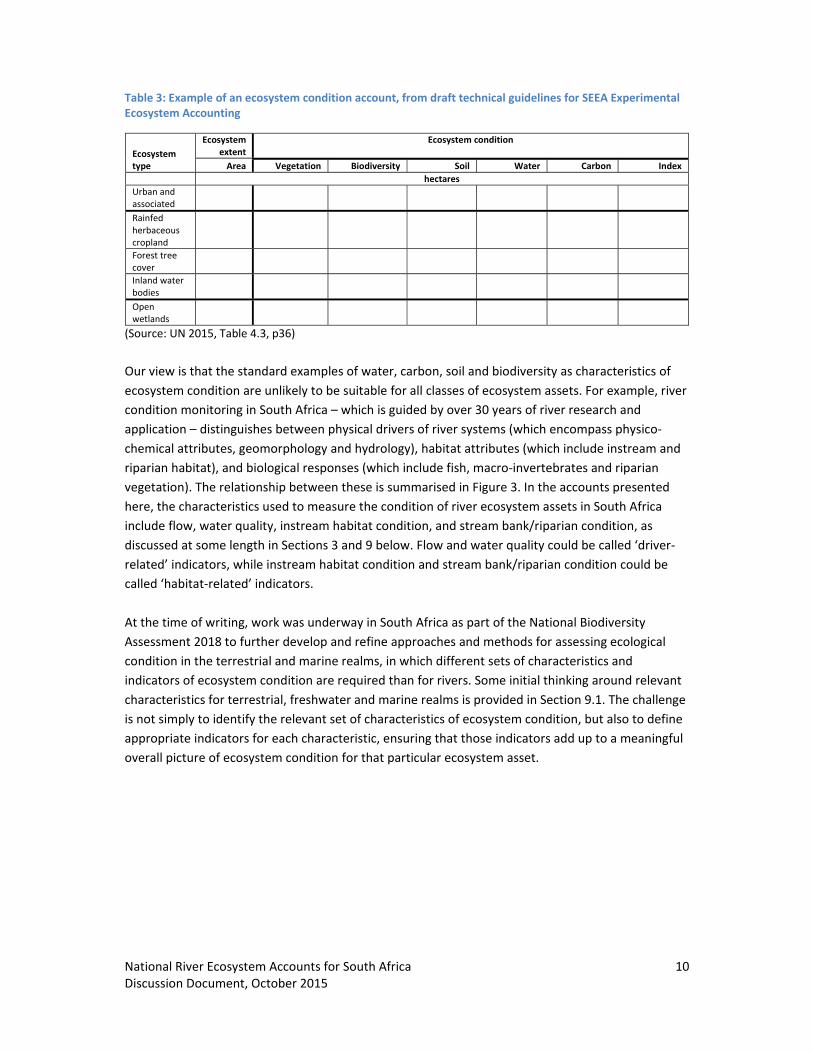
National River Ecosystem Accounts for South Africa 10 Discussion Document, October 2015
Table 3: Example of an ecosystem condition account, from draft technical guidelines for SEEA Experimental Ecosystem Accounting
Ecosystem type
Ecosystem extent
Ecosystem condition
Area Vegetation Biodiversity Soil Water Carbon Index
hectares
Urban and associated
Rainfed herbaceous cropland
Forest tree cover
Inland water bodies
Open wetlands
(Source: UN 2015, Table 4.3, p36)
Our view is that the standard examples of water, carbon, soil and biodiversity as characteristics of
ecosystem condition are unlikely to be suitable for all classes of ecosystem assets. For example, river
condition monitoring in South Africa – which is guided by over 30 years of river research and
application – distinguishes between physical drivers of river systems (which encompass physico‐
chemical attributes, geomorphology and hydrology), habitat attributes (which include instream and
riparian habitat), and biological responses (which include fish, macro‐invertebrates and riparian
vegetation). The relationship between these is summarised in Figure 3. In the accounts presented
here, the characteristics used to measure the condition of river ecosystem assets in South Africa
include flow, water quality, instream habitat condition, and stream bank/riparian condition, as
discussed at some length in Sections 3 and 9 below. Flow and water quality could be called ‘driver‐
related’ indicators, while instream habitat condition and stream bank/riparian condition could be
called ‘habitat‐related’ indicators.
At the time of writing, work was underway in South Africa as part of the National Biodiversity
Assessment 2018 to further develop and refine approaches and methods for assessing ecological
condition in the terrestrial and marine realms, in which different sets of characteristics and
indicators of ecosystem condition are required than for rivers. Some initial thinking around relevant
characteristics for terrestrial, freshwater and marine realms is provided in Section 9.1. The challenge
is not simply to identify the relevant set of characteristics of ecosystem condition, but also to define
appropriate indicators for each characteristic, ensuring that those indicators add up to a meaningful
overall picture of ecosystem condition for that particular ecosystem asset.

National River Ecosystem Accounts for South Africa 11 Discussion Document, October 2015
Figure 3: The conceptual framework used to guide assessments of ecological condition of rivers in South Africa Indicators of ecological condition should ideally reflect a combination of system drivers, habitat attributes and biological
responses. Habitat and species indicators are considered ‘response indicators’ that are influenced by system drivers.
Source: Kleynhans and Louw 2007.
FISHAQUATIC
INVERTEBRATESRIPARIAN
VEGETATIONFISH
AQUATIC INVERTEBRATES
RIPARIAN VEGETATION
HABITAT ATTRIBUTES: INSTREAM AND RIPARIAN
WATER COLUMN: PHYSICO-CHEMICAL
HYDROLOGY GEOMORPHOLOGYWATER COLUMN:
PHYSICO-CHEMICAL
HYDROLOGY GEOMORPHOLOGY
LAND USECATCHMENT AND ATMOSPHERE
SYSTEM DRIVERS
HABITAT
BIOLOGICAL RESPONSES
EC
OR
EG
ION
AL
RE
FE
RN
CE
S

National River Ecosystem Accounts for South Africa 12 Discussion Document, October 2015
3. Nationalriver‐relateddatainSouthAfrica
This section summarises the data that were used to construct the ecosystem extent and condition
accounts presented in this document, namely:
Nested hierarchical system of catchments
River network
Ecological condition of rivers
River ecoregions and longitudinal zones
Water Management Areas
More comprehensive technical information on these datasets is available elsewhere, as reflected in
the references of this section.
3.1 Catchmentsandrivernetworkdata
Key points
South Africa uses a nested hierarchy of hydrological catchments, from primary (first‐order) catchments
through to quinary (fifth‐order) catchments.
Rivers can be mapped at different scales, with finer‐scale mapping likely to pick up a more extensive
network of smaller rivers and streams than broad‐scale mapping. These accounts are based on DWS’s
1:500 000 river network layer.
A distinction is made between main rivers and tributaries. Main rivers are defined as rivers that span
more than one quaternary (fourth‐order) catchment, while tributaries are defined as rivers that are
contained within a single quaternary catchment. Tributaries usually feed into main rivers. Main rivers and
tributaries are collectively referred to as ‘all rivers’ in this document.
For these accounts, ecosystem units are defined as river reaches at the quinary (fifth‐order) catchment
scale. Some of them are main rivers and others are tributaries.
Catchments in South Africa are divided hierarchically into nested hydrological units, from primary
(first‐order) catchments, through to secondary, tertiary, quaternary and quinary (fifth‐order)
catchments.5 The quaternary catchment is used as the basic unit for national water resource
management (mean size 650 km2; Figure 4), and each contains hydrological data (gauged or
simulated) that is updated from time to time. More recently, a quinary hydrological subdivision has
been delineated, which splits quaternary catchments into roughly one fifth of their size (mean size of
5 Standard national data layers with boundaries for primary, secondary, tertiary and quaternary catchments have been developed and endorsed by DWS. A standard national set of quinary catchment boundaries has yet to be agreed on, partly because different quinary catchment boundaries are useful for different purposes. For example, quinary catchments based on altitudinal subdivisions of quaternary catchments are useful for climate change modelling, while quinary catchments based on drainage units within quaternary catchments are useful for hydrological modelling. For these accounts, we use hydrological quinaries based on the 1:500 000 river network drainage units, not altitudinal quinaries. This distinction is important for South African readers, many of whom will know the hydrological quinaries used here as ‘sub‐quaternaries’. We have decided to avoid the term ‘sub‐quaternaries’ in this document as it is less likely to be understood beyond South Africa.

NationaDiscussi
120 km2
catchme
Figure 4:(a) shows
outline);
main rive
catchme
where a
The exte
mapped
of rivers
also incl
layer for
that spa
are river
shows th
and trib
that fee
1:500 00
account
to use a
6 Availab
l River Ecosyon Documen
2; Figure 4). D
ent scale, as
Hydrologicals the relations
(b) shows the
er passing thro
nt; and (c) sho
quinary catch
ent of rivers
d at a 1:1 000
s will be less
uded in the
r national wa
n more than
rs that are co
he network o
utaries, colle
d into tribut
00 river netw
s. For more d
river netwo
le at http://w
ystem Account, October 2
Data on ecolo
discussed fu
l units (catchmship between
e relationship
ough the quat
ows the relati
hment has bee
depends on
0 000 scale, o
than if rivers
dataset. We
ater resource
n one quater
ompletely co
of main river
ectively refer
aries is not r
work provide
detailed plan
rk mapped a
www.dwaf.gov
nts for South2015
ogical condit
urther in Sect
ments) at the quaternary c
between qua
ternary catchm
onship betwe
en delineated
the scale at
only major ri
s were mapp
used the 1:5
e manageme
rnary catchm
ontained with
rs in South A
rred to as ‘al
reflected in t
es an approp
nning and as
at a finer sca
v.za/iwqs/gis_
h Africa
tion of rivers
tion 3.2.
quaternary (fcatchments (b
aternary catch
ment and the
een quinary ca
around each
which the ri
ivers will be
ped at a 1:50
500 000 rive
ent, as the ba
ment are cons
hin single qu
Africa, while F
ll rivers’ in th
he 1:500 000
riate level of
ssessment at
le.
_data/river/riv
s is available
fourth‐order)lack outline) a
hments and th
tributaries ne
atchments and
tributary.
vers are map
included in t
0 000 scale, w
r network of
asis for gene
sidered to be
uaternary cat
Figure 6b sho
his documen
0 river netwo
f detail for n
t a sub‐natio
vs500k.html
at the quate
) and quinary and quinary c
he 1:500 000 r
ested within t
d the 1:500 00
pped. For ex
the dataset,
with smaller
f DWS, which
erating river a
e main rivers
tchments (Fi
ows the netw
nt. The netwo
ork. Our view
ational river
nal level, it m
ernary and q
(fifth‐order) atchments (gr
river network
the quaternar
00 river netwo
xample, if rive
and the tota
rivers and st
h is the stand
accounts.6 .
s; while tribu
gure 5). Figu
work of main
ork of tiny st
w is that the
ecosystem
may be appro
13
uinary
scale rey
with the
ry
ork,
ers are
al length
treams
dard GIS
Rivers
utaries
ure 6a
n rivers
treams
opriate

NationaDiscussi
Figure 5:
Figure 6:tributarieRivers in
forming t
l River Ecosyon Documen
Diagram sho
South Africa’es. grey are shar
the border wi
ystem Account, October 2
owing the dist
’s 1:500 000 r
red rivers in ne
th other coun
nts for South2015
tinction betwe
river network
eighbouring c
ntries were inc
h Africa
een main rive
k showing (a) m
countries and
cluded.
ers, tributarie
main rivers, a
were not incl
s and all river
and (b) main r
uded in the ac
rs
rivers and the
ccounts. River
14
eir
rs

National River Ecosystem Accounts for South Africa 15 Discussion Document, October 2015
3.2 Dataonecologicalconditionofrivers
Key points
Two comprehensive national assessments of the ecological condition of South Africa’s rivers have been
undertaken by DWS, the first in 1999 and the second in 2011.
In each case, an aggregated ecological condition category, called Present Ecological State, was developed
based on a set of six underlying indicators of ecological condition. The aggregated ecological condition
category reflects the degree of modification from a reference condition of natural. We have summarised
DWS’s six Present Ecological State categories (A through to F) to four aggregated ecological condition
categories for the purposes of these accounts: Natural (A and B), Moderately modified (C), Heavily
modified (D), Unacceptably modified (E and F)7.
Four of the six underlying ecological condition indicators were consistent across the 1999 and 2011
assessments: These were:
o Flow
o Instream habitat condition
o Stream bank/riparian condition
o Water quality
The assessment in 1999 was undertaken at quaternary catchment scale, for main rivers only, i.e. each
main river reach in each quaternary catchment was scored based on the ecological condition indicators
and assigned an aggregated ecological condition category. Tributaries were not assessed.
The assessment in 2011 was undertaken at quinary catchment scale, for main rivers and tributaries, i.e.
each main river reach or tributary in each quinary catchment was scored based on the ecological condition
indicators and assigned an aggregated ecological condition category. Both main rivers and tributaries were
included in the assessment.
In order to enable time series comparison of the ecological condition of both main rivers and tributaries,
the ecological condition of tributaries in 1999 has been retrospectively estimated, based on modelling and
expert review. We have used these estimates of the condition of tributaries in 1999 in the accounts
presented here, recognising the limitations of the data, partly to demonstrate the importance of including
tributaries in any future assessments of ecological condition of rivers.
DWS has the mandate to monitor the ecological condition of South Africa’s rivers, and has invested
considerable effort in this task, including two comprehensive national assessments of the Present
Ecological State of rivers, the first in 1999 and the second in 2011 (Kleynhans et al. 2000; DWS 2014).
The Present Ecological State data describe the extent to which a river has been modified from its
reference condition, where reference condition is the ecological condition that existed before major
human modifications to the water resource (the river) and surrounding landscape. In both the 1999
and 2011 assessments, modification was described according to six indicators of ecological condition
(Table 4), which were assessed by aquatic ecologists with local knowledge using available data such
as existing bioassessment data at site level, presence of dams and water transfer schemes, and
surrounding land cover at 30 m resolution. Modification was scored from 0 (no or small
7 We have used the term “unacceptably modified” in accordance to DWS policy that states that no river should intentionally be managed or left in this ecological condition.

National River Ecosystem Accounts for South Africa 16 Discussion Document, October 2015
modification) to 5 (critical modification) (Table 5), and confidence levels were assigned to each
rating based on the data available for informing the assessment. An aggregated ecological condition
category was also calculated from the median of the modification ratings of the six indicators, which
then underwent further expert review. This median value was converted into six categories of
ecological condition ranging from A (natural) to F (unacceptably modified), which we grouped into
four ecological condition categories for the national river accounts: natural (A and B); moderately
modified (C); heavily modified (D); unacceptably modified (E and F) (Table 6).
Table 4: Ecological condition indicators used in the 1999 and 2011 assessments of ecological condition of rivers * Four of the indicators, marked with asterisks, were comparable across the 1999 and 2011 assessments.
Ecological condition indicator
Description
* Flow Relative deviation from the expected natural flow and flood regimes, based on land cover/land use information (urban areas, inter basin transfers), presence of weirs, dams, water abstraction, agricultural return flows, sewage releases.
* Water quality Water quality modification based on activities such as mining, cultivation, irrigation (i.e. agricultural return flows), sewage works, urban areas and industries, as well as algal growth and macrophyte data.
* Instream habitat Modification of stream bed habitat caused by disturbances such as sedimentation, covering by excessive algal growth related to eutrophication. Includes consideration of the functioning of instream habitats and processes, as well as habitat for instream biota.
* Stream bank/riparian habitat
Riparian or stream bank condition as indicated by physical disturbances such as removal of vegetation, invasive vegetation and erosion.
Introduced instream biota
The impact of invasive alien species on native biota in the form of impact on physical habitat, competition and predation. This was assessed separately in 1999, but incorporated into assessment of habitat modification in 2011.
Connectivity Alteration of connectivity along the longitudinal or lateral dimension (instream habitat and riparian/wetland zone respectively), and the possible fragmentation effect on biological populations and communities. Longitudinal and lateral connectivity were assessed together as one indicator in 1999 (inundation), and separated into two indicators (instream connectivity and riparian/wetland connectivity) in 2011.

National River Ecosystem Accounts for South Africa 17 Discussion Document, October 2015
Table 5: Modification scores used for each of the ecological condition indicators, indicating the degree of modification relative to a reference condition of natural
Modification score*
Description
0 None: Reference condition. No discernible impact, or the modification is located in such a way that it has no impact on habitat quality, diversity, size and variability.
1 Small: The modification is limited to very few localities and the impact on habitat quality, diversity, size and variability are also very small.
2 Moderate: The modifications are present at a small number of localities and the impact on habitat quality, diversity, size and variability are also limited.
3 Large: The modification is generally present with a clearly detrimental impact on habitat quality, diversity, size and variability. Large areas are, however, not influenced.
4 Serious: The modification is frequently present and the habitat quality, diversity, size and variability in almost the whole of the defined area are affected. Only small areas are not influenced.
5 Critical: The modification is present overall with a high intensity. The habitat quality, diversity, size and variability in almost the whole of the defined section are influenced detrimentally.
* In the original 1999 ecological condition dataset from DWS, the modification scores were reversed such that 5 indicated no modification and 0 indicated critical modification. We changed the 1999 order to match the 2011 order.
Table 6: Aggregated ecological condition categories used in the river condition accounts, including their relationship to the Present Ecological State categories used by DWS
Aggregated ecological condition category used in these accounts
DWS Present Ecological State category
Description (after Kleynhans 2000)
Natural A or B
Unmodified, natural rivers or rivers that are largely natural with few modifications. A small change in natural habitats and biota may have taken place but the ecosystem functions are essentially unchanged.
Moderately modified C Rivers where a loss and change of natural habitat and biota has occurred but the basic ecosystem functions are still predominantly unchanged.
Heavily modified D Rivers where a large loss of natural habitat, biota and basic ecosystem functions have occurred.
Unacceptably modified* E or F Includes rivers where the loss of natural habitat, biota and basic ecosystem functions is extensive, as well as rivers where modifications have reached a critical level and the system has been modified completely with an almost complete loss of natural habitat and biota. In the worst instances the basic ecosystem functions have been destroyed and the changes are irreversible.
* DWS policy is that ‘D’ is the lowest acceptable Present Ecological State for any river in South Africa, and that no river should intentionally be managed or left in an E or F condition. Taking the lead from this policy objective, we have used the term ‘unacceptably modified’ for rivers with a Present Ecological Condition of E or F.

National River Ecosystem Accounts for South Africa 18 Discussion Document, October 2015
The Present Ecological State data were originally collated to inform catchment‐scale water resource
management decisions and water simulation models, and have not previously been used in an
accounting context or for other time series comparisons. Using the data for accounting or
monitoring presents challenges related to the comparability of data over time and the scale of the
two assessments. In terms of comparability, only four of the six ecological condition indicators were
comparable across the 1999 and 2011 time periods (Table 4). In generating the river condition
accounts, we were therefore able to use only the four comparable indicators: flow, water quality,
instream habitat, and stream bank/riparian habitat.
In terms of scale, the assessment of Present Ecological State in 1999 was done for main rivers only,
compared to the 2011 assessment that also included tributaries. To allow for a less accurate, but
nevertheless indicative, assessment of tributaries in South Africa over the two time periods, we
supplemented the 1999 data for main rivers with estimates of the aggregated ecological condition
for tributaries derived for the National Freshwater Ecosystem Priority Areas project (Nel et al. 2011a
and 2011b). The ecological condition of tributaries in 1999 was modelled based on the proportion of
natural land cover within a series of GIS buffers around each river reach as well as within the
associated quinary catchment, and the results were reviewed by experts with local knowledge. We
used only those ecological condition data for tributaries in 1999 for which there was a reasonable
level of confidence, based on expert review. This amounted to 42% of tributary river length – in
other words the ecological condition data for tributaries in 1999 is not comprehensive.
Notwithstanding the limitations of the data on ecological condition of tributaries in 1999, we believe
that on balance it makes sense to include tributaries in the accounts. The inclusion of the tributaries
provides a more complete picture of the condition of rivers in South Africa. Main rivers are generally
heavily utilised to improve water security for socio‐economic use, whereas tributaries are less
heavily utilised on the whole. We would thus expect tributaries to be in a better condition on
average than main rivers. Main rivers also rely strongly on the flushing potential of healthy
tributaries for their rejuvenation – without this they are prone to deterioration in ecological
condition. Inclusion of the tributaries therefore not only provides a more complete picture of the
trends in South African river condition, but also alerts us to trends in the condition of tributaries that
may impact negatively on the condition of main rivers.

National River Ecosystem Accounts for South Africa 19 Discussion Document, October 2015
3.3 Riverecoregionsandlongitudinalzones
Key points
National river ecosystem types in South Africa are based on three factors: river ecoregions, broad
categories of flow variability, and longitudinal zones. These factors influence the ecological characteristics
of a river, and together provide a hierarchical classification of 223 river ecosystem types.
River ecoregions and longitudinal zones provide useful biophysical reporting units for river ecosystem
accounts, helping to highlight patterns that relate to ecological characteristics of different river ecosystem
types.
In a similar way that South Africa has a national vegetation map that delineates and classifies
different terrestrial ecosystem types across the country, different river ecosystem types have been
identified and classified. The classification and mapping of ecosystem types forms part of the
National Ecosystem Classification System (SANBI 2013a), and is guided by two key principles: that
ecosystems of the same type share similar ecological characteristics, and that ecosystems are
identified and mapped based on their characteristics and extent prior to major human modification.
A river can be characterised broadly according to the landscape through which it flows, its flow
regime or hydrology, and its position in the landscape (e.g. slope vs. lowland plain). Spatial
information on river ecoregions (Kleynhans et al. 2005), broad flow variability, and river channel
slope categories or longitudinal zones (Rowntree and Wadeson 1999) have been combined to
identify 223 national river ecosystem types across South Africa. These river types were formalised
for the first time in the Atlas of Freshwater Ecosystem Priority Areas in South Africa (Nel et al.
2011a). In these accounts, the national river ecosystem types are not used directly, but two of the
three factors that were used to identify them – river ecoregions and longitudinal zones – are used
for summarising the accounts. They are effectively biophysical reporting units, and are useful for
highlighting patterns in the extent and condition accounts that relate to ecological characteristics of
different river ecosystem types.
River ecoregions classify rivers according to similarities based on a top‐down nested hierarchy. South
Africa’s river ecoregions classify the landscape into 31 regions based on topography, altitude, slope,
rainfall, temperature, geology and potential natural vegetation (Kleynhans et al. 2005, Figure 7)8.
The ecoregions broadly characterise the landscape through which a river flows, such that rivers in
the same ecoregion share similar broad ecological characteristics compared to those in different
ecoregions. For example, the Highveld (ecoregion 11 in Figure 7) is characterised by extensive flat
plains with gentle meandering rivers, compared to rivers in the Eastern Coastal Belt (ecoregion 17 in
Figure 7), which are often in steeply incised and confined valleys.
8 These 31 river ecoregions are Level 1 ecoregions. There is also a more detailed set of approximately 120 Level 2 ecoregions, which may be useful for classifying river ecosystem types at a sub‐national scale but have not been used in the classification of national river ecosystem types.

NationaDiscussi
Figure 7:(Source:
Geomor
transpor
stratified
ecosyste
characte
rivers (F
differen
delivery
also con
impacts
l River Ecosyon Documen
River ecoregAfter Kleynha
rphological o
rt sediment
d into slope
em types, th
eristics at a n
igure 8). Eac
t vulnerabilit
. For exampl
ntain many e
. Upper foot
ystem Account, October 2
gions of Southans et al. 2005
or longitudin
(Rowntree a
categories u
ese are grou
national leve
ch zone repre
ties and resp
le, mountain
ndemic and
hill rivers pre
nts for South2015
h Africa 5)
nal river zone
nd Wadeson
using GIS slop
uped these in
el: mountain
esents distin
ponses to hu
n streams gen
specialised s
esent some o
h Africa
es character
n 1999). Sout
pe profiles (M
nto four long
streams, up
ct physical a
man impact
nerally tend
species that
of the best o
rise the abilit
th Africa’s 1:
Moolman et
gitudinal zon
per foothills,
and hydrolog
s, which in t
to be less im
are likely to
opportunities
ty of river rea
:500 000 rive
al. 2002). Fo
es that depic
, lower footh
gical characte
urn impacts
mpacted by h
be less resili
s for placem
aches to stor
er network h
or defining riv
ct ecological
hills and low
eristics, and
ecosystem s
human activi
ient to huma
ent of dams,
20
re or
has been
ver
land
has
service
ties, and
an
, where

NationaDiscussi
rivers em
contain
agricultu
is partic
Figure 8:characte(Source:
3.4 Wa
South Af
units for
process
Water M
provinci
example
l River Ecosyon Documen
merge from m
sensitive en
ure or urban
ularly import
Schematic ofristics SANBI 2013b,
aterMana
frica has nin
r implement
of being est
Management
al or municip
e of administ
ystem Account, October 2
mountains w
demic specie
developmen
tant in lowla
f four longitud
, p21)
agementA
e Water Man
ing water po
ablished for
t Areas are d
pal boundar
trative repor
nts for South2015
with water qu
es. Lower foo
nt. The main
and rivers as
dinal zones fo
Areas
nagement A
olicy and legi
Water Mana
elineated us
ies (Figure 9
rting units in
h Africa
uality that is
othill and low
ntenance of h
it provides f
or rivers, each
reas that are
slation. Catc
agement Are
sing catchme
). We have u
n these acco
often minim
wland rivers
healthy natu
filtering capa
h of which has
e used as adm
chment Man
eas or groups
ent boundari
used Water M
unts.
mally impacte
are often he
ral vegetatio
acity for pollu
s different ec
ministrative
agement Ag
s of Water M
es and do no
Management
ed. They also
eavily impact
on along rive
utants in run
ological
and manage
encies are in
Management
ot align with
t Areas as an
21
o often
ted by
er banks
noff.
ement
n the
t Areas.
n

NationaDiscussi
Figure 9:
l River Ecosyon Documen
Map of Sout
ystem Account, October 2
h Africa show
nts for South2015
wing boundari
h Africa
ies of Water MManagement Areas in relation to provin
22
nces

National River Ecosystem Accounts for South Africa 23 Discussion Document, October 2015
4. Ecosystemextentaccountforrivers
In this section we present extent accounts for rivers in South Africa, distinguishing between the
extent of main rivers, tributaries and all rivers. We base the extent account on river length (km),
which avoids area overlaps with terrestrial or wetland ecosystems. The extent account can be
summarised according to administrative or biophysical reporting units, and we demonstrate this by
presenting extent accounts for rivers summarised by Water Management Area, longitudinal zone
and river ecoregion.
4.1 ExtentaccountforriversinSouthAfrica
An extent account tracks how the extent of an ecosystem unit changes over time. Table 7 shows the
extent accounts for rivers of South Africa, calculated based on the length of main rivers and
tributaries in the 1:500 000 river network in 1999 and 2011 – the same time period as that used for
the ecosystem condition accounts that follow in later sections. In a ‘classic’ ecosystem extent
account, additions to stock are divided into managed expansion, natural expansion and upward
reappraisals, and reductions in stock are divided into managed regression, natural regression and
downward reappraisals. We have not shown these subdivisions as the values for each are zero in this
case, as discussed further below. We have added a row showing opening stock as a percentage of
total river length, as this provides useful information about the proportion of main rivers and
tributaries in relation to all rivers.
Table 7: Ecosystem extent account for rivers in South Africa, showing length of main rivers, tributaries and all rivers
Kilometres Main rivers Tributaries All rivers
Opening stock 1999 76 310 87 223 163 533
Opening stock as % of total river length 47 53 100
Additions/reductions
Additions/reductions as a % opening stock
Opening stock 2011 76 310 87 223 163 533
Opening stock as % of total river length 47 53 100
No changes were recorded in the length of main rivers and tributaries between 1999 and 2011.
When reported on in terms of length, river extent is quite stable compared to land cover or areal
extent – river channels experience most change over geological time scales rather than the human
time scales used in accounting, unless through relatively large human engineering schemes. Most of
the expected changes to length would therefore occur as a result of updating the river network data,
and would be recorded in the extent account as reappraisals. While ecosystem extent in terms of
length generally remains relatively stable for rivers, ecological condition of rivers can change rapidly
and substantially, as shown in the sections that follow.
National River Ecosystem Accounts for South Africa 24 Discussion Document, October 2015
We would have expected more change in extent had the extent account been reported in terms of
area of the river channel and its banks (e.g. owing to changes in riparian vegetation and channel
braiding). However, a high confidence map of river channels and riparian vegetation does not exist in
South Africa (or in most countries, even those that are data‐rich). We would like to emphasize that,
as discussed in Section 2.2, land cover data are unreliable sources for mapping river channels and
their riparian vegetation, particularly in semi‐arid environments, and it is for this reason that we
used a river network layer instead. In the future, deriving an integrated land‐based ecosystem map
that includes high confidence mapping of river channels would facilitate reporting on extent of river
ecosystems in terms of area.
Further, we also propose in future to analyse the extent of river ecosystems according to the
naturalised, non‐cumulative volume of water (m3) delivered by the sub‐catchment representing the
ecosystem unit (in this case, the quinary catchment). This may prove to be the most useful metric of
extent for river ecosystem accounting as volume of water is more closely related to potential
ecosystem service supply than length of river, particularly in semi‐arid environments.
4.2 ExtentaccountforriversbyWaterManagementArea
It is useful to summarise the data on extent of river ecosystems at a range of spatial scales for a
range of reporting units (administrative or biophysical), not just at the aggregate national level.
Throughout this document, we have used the Water Management Areas of South Africa to provide
an example of administrative reporting units. Water Management Areas are particularly relevant for
policy, decision‐making and management of water resources by DWS. Other useful administrative
reporting units could be provinces or municipalities, and it may be useful to explore these in future.
Table 8 shows the extent account for rivers summarised by Water Management Area. We have
already made the point that the extent of main rivers and tributaries measured in terms of length
did not change over the period 1999 to 2011 (Table 7), and is in general quite stable, so we have
dropped the opening/closing balance between time periods in Table 8. Rivers in the Orange,
Mzimvubu‐Tsitsikamma and Vaal Water Management Areas make up over 50% of the total river
length in South Africa. In terms of area, these are also the largest Water Management Areas in the
country.
4.3 Extentaccountforriversbylongitudinalzone
Extent accounts can also be summarised by biophysical reporting units, such as longitudinal zones or
river ecoregions. Table 9 shows the extent account for rivers summarised by longitudinal zone. As
for the extent account by Water Management Area, we have not included the opening/closing
balance between time periods in Table 9. The majority of South African rivers (86%) are upper or
lower foothill rivers, with a moderate gradient and little to no floodplain. Lowland rivers with distinct
floodplains constitute only 9% of South Africa’s total river length, making them relatively rare,
especially compared to many northern hemisphere countries. In a country with very little high

National River Ecosystem Accounts for South Africa 25 Discussion Document, October 2015
potential arable land, the fertile floodplains of these lowland rivers are in high demand for intensive
agriculture such as orchards and crops.
Table 8: Ecosystem extent account for rivers by Water Management Area
Kilometres Main rivers Tributaries All rivers % total river
length
Berg‐Olifants 4 166 6 078 10 243 6Breede‐Gouritz 5 313 7 129 12 441 8Inkomati‐Usuthu 3 808 2 289 6 097 4Limpopo 6 117 5 625 11 742 7Mzimvubu‐Tsitsikamma
16 000 17 317 33 317 20
Olifants 6 242 4 722 10 964 7Orange 13 104 23 580 36 684 22Pongola‐Mzimkulu 10 613 7 272 17 884 11Vaal 10 948 13 212 24 160 15Total 76 310 87 233 163 533 100
* Percentage is based on the total length of all rivers in South Africa
Table 9: Ecosystem extent account for rivers by longitudinal zone
Kilometres
Main rivers Tributaries All rivers % total river length*
Mountain stream 1 609 5 145 6 754 4
Upper foothill stream 21 566 52 592 74 158 45
Lower foothill stream 38 893 27 553 66 445 41
Lowland river 14 243 1 008 15 251 9
No Data 0 926 926 1
Total 76 310 87 223 163 533 100
* Percentage is based on the total length of all rivers in South Africa
4.4 Extentaccountforriversbyriverecoregion
Ecoregions present another biophysical reporting unit for ecosystem extent accounts, as presented
in Table 10. The Highveld and Nama Karoo ecoregions have the most extensive river networks,
mainly because of their large size (Figure 7) and not necessarily because of their drainage density. In
the Nama Karoo ecoregion, many of the rivers are ephemeral and may go for several years without
flowing.

National River Ecosystem Accounts for South Africa 26 Discussion Document, October 2015
Table 10: Ecosystem extent account for rivers by river ecoregion
Code
Kilometres Ecoregion
Main rivers Tributaries All rivers % total river length*
1 Limpopo Plain 2 156 1 183 3 339 2
2 Soutpansberg 516 304 820 1
3 Lowveld 5 019 2 995 8 014 5
4 North Eastern Highlands 1 242 336 1 577 1
5 Northern Plateau 407 336 744 0
6 Waterberg 404 754 1 158 1
7 Western Bankenveld 1 224 1 246 2 470 2
8 Bushveld Basin 2 114 2 192 4 306 3
9 Eastern Bankenveld 1 613 1 475 3 088 2
10 Northern Escarpment Mountains 998 561 1 558 1
11 Highveld 10 183 11 826 22 009 13
12 Lebombo Uplands 138 465 602 0
13 Natal Coastal Plain 393 355 748 0
14 North Eastern Uplands 3 850 2 677 6 527 4
15 Eastern Escarpment Mountains 3 471 3 247 6 718 4
16 South Eastern Uplands 6 059 5 475 11 534 7
17 Eastern Coastal Belt 2 062 1 328 3 390 2
18 Drought Corridor 4 969 6 264 11 233 7
19 Southern Folded Mountains 3 544 5 366 8 910 5
20 South Eastern Coastal Belt 1 602 988 2 590 2
21 Great Karoo 4 053 6 991 11 044 7
22 Southern Coastal Belt 1 168 1 407 2 575 2
23 Western Folded Mountains 1 453 1 200 2 652 2
24 South Western Coastal Belt 847 1 199 2 046 1
25 Western Coastal Belt 1 142 1 143 2 284 1
26 Nama Karoo 7 522 16 380 23 901 15
27 Namaqua Highlands 1 035 2 046 3 081 2
28 Orange River Gorge 657 987 1 644 1
29 Southern Kalahari 4 027 3 545 7 572 5
30 Ghaap Plateau 63 1 606 1 668 1
31 Eastern Coastal Belt 2 372 1 326 3 698 2
999 No Data 10 22 32 0
Total 76 310 87 223 163 533 100
* Percentage is based on the total length of all rivers in South Africa
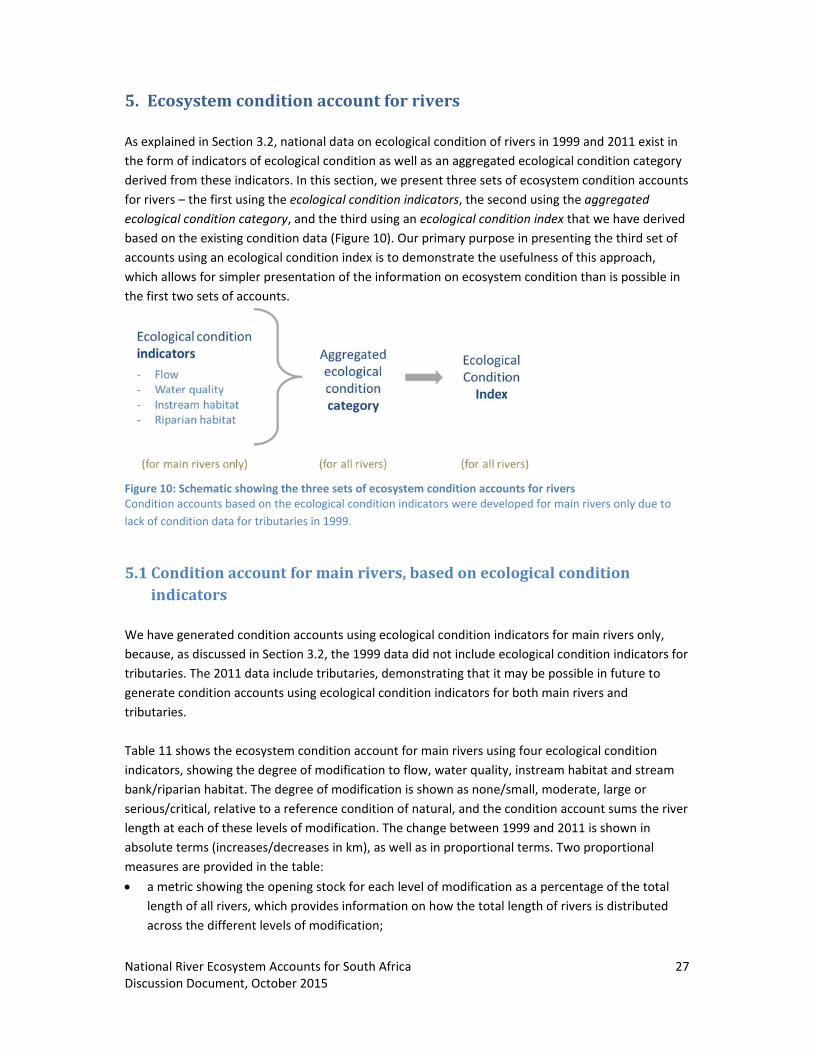
NationaDiscussi
5. Eco
As expla
the form
derived
for river
ecologic
based o
account
which al
the first
Figure 10Condition
lack of co
5.1 Coind
We have
because
tributari
generate
tributari
Table 11
indicato
bank/rip
serious/
length a
absolute
measure
a me
leng
acro
l River Ecosyon Documen
osystem
ained in Sect
m of indicato
from these i
rs – the first u
cal condition
n the existin
s using an ec
llows for sim
two sets of
0: Schematic sn accounts ba
ondition data
nditionadicators
e generated
e, as discusse
ies. The 2011
e condition a
ies.
1 shows the e
ors, showing t
parian habita
/critical, relat
t each of the
e terms (incr
es are provid
etric showin
gth of all rive
oss the differ
ystem Account, October 2
condition
ion 3.2, natio
rs of ecologi
indicators. In
using the eco
category, an
g condition d
cological con
mpler present
accounts.
showing the tased on the ec
for tributaries
ccountfo
condition ac
ed in Section
1 data includ
accounts usi
ecosystem c
the degree o
at. The degre
tive to a refe
ese levels of
reases/decre
ded in the ta
g the openin
ers, which pro
rent levels of
nts for South2015
naccoun
onal data on
cal condition
n this section
ological cond
nd the third
data (Figure
ndition index
tation of the
three sets of ecological cond
s in 1999.
ormainriv
ccounts using
3.2, the 199
de tributaries
ng ecologica
ondition acc
of modificati
ee of modific
erence condi
modification
eases in km),
ble:
ng stock for e
ovides inform
f modificatio
h Africa
ntforrive
ecological c
n as well as a
n, we presen
dition indicat
using an eco
10). Our prim
x is to demon
e information
ecosystem codition indicato
vers,base
g ecological
99 data did n
s, demonstra
al condition i
count for ma
on to flow, w
cation is show
ition of natu
n. The chang
as well as in
each level of
mation on ho
on;
ers
condition of r
an aggregate
t three sets
tors, the sec
ological cond
mary purpos
nstrate the u
n on ecosyste
ondition accouors were deve
edoneco
condition ind
not include e
ating that it m
ndicators for
in rivers usin
water quality
wn as none/
ral, and the c
ge between 1
n proportiona
f modificatio
ow the total
rivers in 199
ed ecological
of ecosystem
ond using th
dition index th
se in present
usefulness of
em condition
unts for riversloped for mai
logicalco
dicators for m
cological con
may be poss
r both main
ng four ecolo
y, instream h
/small, mode
condition ac
1999 and 201
al terms. Tw
n as a perce
length of riv
9 and 2011 e
l condition ca
m condition a
he aggregate
hat we have
ting the third
f this approac
n than is pos
s n rivers only d
ondition
main rivers o
ndition indic
sible in future
rivers and
ogical condit
habitat and s
erate, large o
count sums
11 is shown
o proportion
ntage of the
vers is distrib
27
exist in
ategory
accounts
ed
derived
d set of
ch,
ssible in
due to
only,
ators for
e to
ion
tream
or
the river
in
nal
total
buted

National River Ecosystem Accounts for South Africa 28 Discussion Document, October 2015
a metric showing increases/decreases as a percentage of opening stock within each level of
modification, which is useful for understanding proportional changes over the time period. Even
if the absolute river length at a particular level of modification is small, the proportion of river
length at this level of modification may nevertheless have undergone large increases or
decreases.
For example, there was a 150% increase in main rivers with a large degree of instream habitat
modification between 1999 and 2011, and these rivers constituted 18% of South Africa’s main rivers
by 2011 (Table 11).
Table 11: Ecosystem condition account for main rivers using four ecological condition indicators, 1999 – 2011
Degree of modification from natural
Kilometres None/ small
Moderate Large Serious/ Critical
No Data
Total
FLOW
Opening stock 1999 34 084 22 814 10 328 5 447 3 637 76 310
Opening stock as a % total river length 45 30 14 7 5 100
Increase/decreases ‐10 546 ‐2 316 6 017 5 129 1 715
Increases/decreases as % opening stock ‐31 ‐10 58 94 47
Opening stock 2011 23 538 20 499 16 345 10 576 5 352 76 310
Opening stock as a % total river length 31 27 21 14 7 100
WATER QUALITY
Opening stock 1999 40 579 24 634 5 518 1 943 3 637 76 310
Opening stock as a % total river length 53 32 7 3 5 100
Increase/decreases ‐5 769 ‐3 591 6 149 1 496 1 715
Increases/decreases as % opening stock ‐14 ‐15 111 77 47
Opening stock 2011 34 810 21 043 11 667 3 439 5 352 76 310
Opening stock as a % total river length
46 28 15 5 7 100
STREAM BANK/RIPARIAN HABITAT
Opening stock 1999 22 469 32 951 14 164 3 088 3 639 76 310
Opening stock as a % total river length 29 43 19 4 5 100
Increase/decreases ‐50 ‐3 612 1 255 1 667 740
Increases/decreases as % opening stock ‐11 9 54 20
Opening stock 2011 22 418 29 339 15 420 4 755 4 379 76 310
Opening stock as a % total river length
29 38 20 6 6 100
INSTREAM HABITAT
Opening stock 1999 39 736 26 188 5 446 1 301 3 639 76 310
Opening stock as a % total river length 52 34 7 2 5 100
Increase/decreases ‐11 245 426 8 180 1 898 740
Increases/decreases as % opening stock ‐28 2 150 146 6 840
Opening stock 2011 28 491 26 615 13 626 3 200 4 379 76 310
Opening stock as a % total river length 37 35 18 4 6 100

National River Ecosystem Accounts for South Africa 29 Discussion Document, October 2015
The ecosystem condition account in Table 11 highlights that:
The proportion of main river length with no/small modification declined across all four indicators
from 1999 to 2011, but most notably for flow and instream habitat, which experienced a decline
of 31% and 28% respectively in no/small modification relative to the opening stock.
The extent of main river length in which flow is seriously/critically modified doubled between
1999 and 2011, and by 2011 constituted 14% of the total length of main rivers. Moderate or
large modification of flow is often indicative of water schemes (including dams and other water
supply infrastructure such as pipelines and canals), while serious/critical modification can be
indicative of severe over‐abstraction of water, or poor management of environmental flow
releases from dams. Maintaining dammed rivers in a moderately modified ecological condition is
possible through environmental flow releases from dams and good management of surrounding
land.
The extent of main river length with a large or serious/critical degree of modification to instream
habitat more than doubled from 1999 to 2011 (from 9 to 22%), and in 2011 constituted 22% of
the river length. This is indicative of alteration of habitat as a result of processes such as
sedimentation and eutrophication, which affect the ability of river ecosystems to provide
continued ecosystem services, and can cause regime shifts in downstream dams and lakes.
The extent of main river length with a large degree of modification to water quality more than
doubled, adding 6 149 km to this category between 1999 and 2011. This is consistent with rising
evidence of failing waste‐water treatment infrastructure, increasing pollutant loads from
intensive land uses such as agriculture, and increasing instances of acid mine drainage from old
unused mines.
Changes in the degree of modification to stream bank/riparian habitat were not large overall,
but it is worth noting that of the four indicators this one already reflected the most extensive
modification in 1999, and that there was a substantial (54%) increase in the proportion of river
length with a serious/critical degree of modification to stream bank/riparian habitat between
1999 and 2011.
Figure 11 summarises the change in the extent of river length at different levels of modification for
each ecological condition indicator, presenting the information in Table 11 graphically. It confirms
the findings discussed above, showing that most change (reflected by the steepest lines on the
graphs) occurred in the flow and instream habitat indicators, as well as in the extent of river length
with a large degree of modification to water quality. The information is shown spatially in Figure 12.
The increasing degree of modification of flow and instream habitat is evident in these maps,
especially in the south western and north eastern parts of the country, as well as the increasing
degree of modification of water quality in parts of the interior of the country. These spatial trends
are discussed again in Section 6, which presents the condition accounts per Water Management
Area.

NationaDiscussi
modifica
l River Ecosyon Documen
tion in main r
ystem Account, October 2
rivers for each
nts for South2015
h of the four
h Africa
ecological conndition indicaators, 1999 – 22011
30
Figure 11: Change in degree of
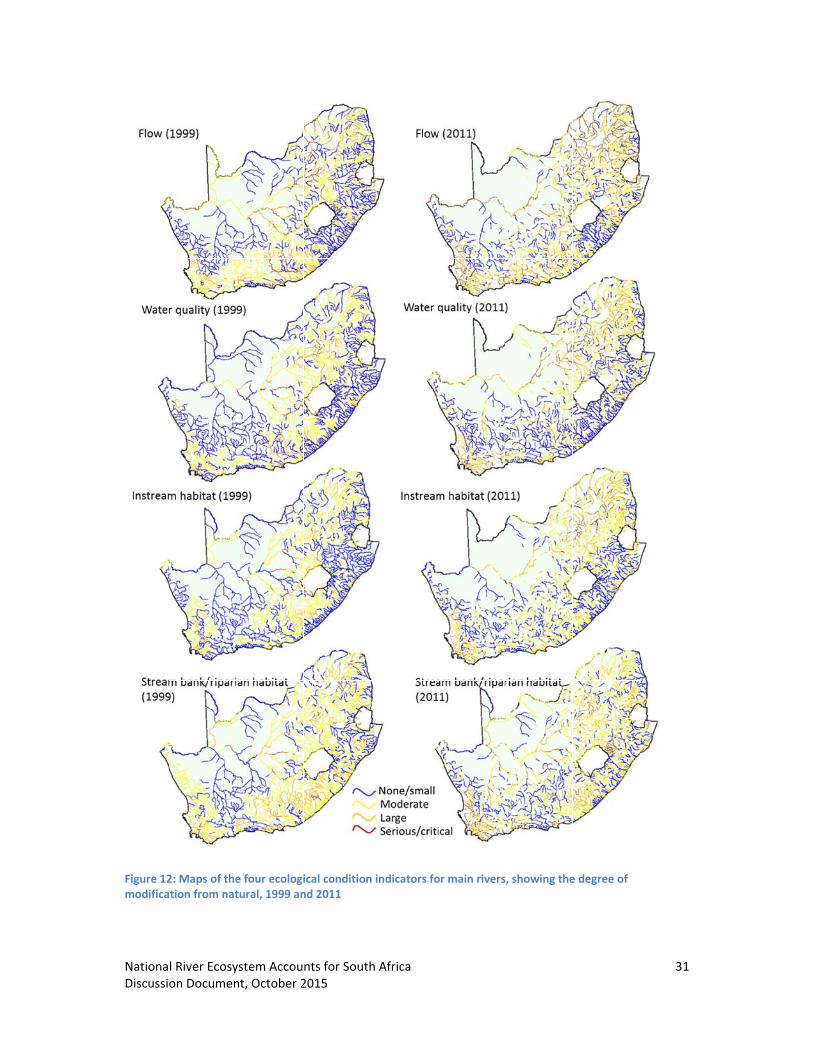
NationaDiscussi
Figure 12modifica
l River Ecosyon Documen
2: Maps of thetion from nat
ystem Account, October 2
e four ecologitural, 1999 an
nts for South2015
ical conditionnd 2011
h Africa
n indicators foor main rivers, showing thee degree of
31

National River Ecosystem Accounts for South Africa 32 Discussion Document, October 2015
5.2 Conditionaccountformainriversandtributaries,basedonaggregatedecologicalconditioncategory
As explained in Section 3.2, the individual ecological condition indicators reported on in Section 5.1
were used by DWS to assess the Present Ecological State of rivers in 1999 and again in 2011, giving
an overall picture of the degree to which a river has been modified from a reference condition of
natural. For these accounts, we have grouped the six Present Ecological State categories into four
aggregated ecological condition categories: natural, moderately modified, heavily modified, and
unacceptably modified. Even though the 1999 Present Ecological State assessment lacked data for
tributaries, we were able to use data for aggregated ecological condition of tributaries for 1999 from
Nel et al. (2011a). Table 12 therefore shows condition accounts based on the aggregated ecological
condition categories for both main rivers and tributaries.
Table 12: Ecosystem condition account for rivers based on the aggregated ecological condition category, for main rivers, tributaries and all rivers
Degree of modification from natural
Kilometres Natural Moderately modified
Heavily modified
Unaccept‐ably
modified
No Data Total
MAIN RIVERS
Opening stock 1999 46 541 22 315 2 791 1 026 3 637 76 310
Opening stock as a % total river length 61 29 4 1 5 100
Increase/decreases ‐24 100 9 467 13 168 1 465
Increases/decreases as % opening stock ‐52 42 472 143
Opening stock 2011 22 441 31 782 15 960 2 492 3 637 76 310
Opening stock as a % total river length
29 42 21 3 5 100
TRIBUTARIES
Opening stock 1999 40 294 7 470 2 084 328 37 047* 87 223
Opening stock as a % total river length 46 9 2 42* 100
Increase/decreases ‐17 062 11 339 4 766 957
Increases/decreases as % opening stock ‐42 152 229 292
Opening stock 2011 23 232 18 809 6 850 1 285 37 047* 87 223
Opening stock as a % total river length
27 22 8 1 42* 100
ALL RIVERS
Opening stock 1999 86 835 29 784 4 875 1 354 40 684 163 533
Opening stock as a % total river length 53 18 3 1 25 100
Increase/decreases ‐41 163 20 806 17 935 2 422
Increases/decreases as % opening stock ‐47 70 368 179
Opening stock 2011 45 673 50 591 22 810 3 776 40 684 163 533
Opening stock as a % total river length 28 31 14 2 25 100
* See the second last paragraph of Section 3.2 for an explanation of this high No Data value.

NationaDiscussi
The con
Ther
main
For
by a
by 1
dete
For t
by a
Alth
in 20
tribu
Figure 1
supports
natural c
Figure 1
all rivers
particula
Rivers in
(Limpop
Figure 13rivers, tr
l River Ecosyon Documen
dition accou
re was a sub
n rivers and
main rivers,
a large increa
13 168 km (a
erioration in
tributaries, t
a substantial
hough unacce
011), this cat
utaries.
3 shows the
s the finding
category, an
4 shows nat
s in 1999 and
arly pronoun
n the south‐w
po province)
3: Change in tibutaries and
ystem Account, October 2
nt in Table 1
bstantial decr
tributaries.
the decrease
ase in the ext
lmost 500%)
the ecologic
the decrease
increase in t
eptably mod
tegory exper
timeline tre
gs highlighted
d steep incli
ional maps o
d 2011. The d
nced along th
western port
also show m
the extent of r all rivers, 199
nts for South2015
12 shows tha
rease in the
e in extent o
tent of river
) between 19
cal condition
e in extent of
the moderat
ified rivers c
rienced a lar
ends from the
d above, sho
nes in the m
of the aggreg
decrease in t
he north‐eas
tion of the co
marked deter
river length in99 – 2011
h Africa
at:
extent of riv
of river lengt
length in the
999 and 201
of main rive
f river length
ely modified
comprise a m
ge proportio
e condition a
owing steep d
moderately m
gated ecolog
the extent of
stern coast o
ountry (West
rioration in c
n each aggreg
er length in t
h in the natu
e heavily mo
1. This sugge
ers.
h in the natu
d category (4
minor propor
onal increase
account in Ta
declines in th
modified and
gical conditio
f river length
f South Afric
tern Cape Pr
ondition.
gated ecologic
the natural c
ural category
odified categ
ests that the
ral category
4 766 km; 229
rtion of the t
e for both ma
able 12 in gr
he extent of
heavily mod
on category f
h in the natu
ca in KwaZulu
rovince) and
cal condition
category for
y was accom
ory, which in
re was subst
was accomp
9%).
otal river len
ain rivers and
raphical form
river length
dified catego
for main rive
ral category
u‐Natal Prov
the far nort
category, for
33
both
panied
ncreased
tantial
panied
ngth (2%
d
m. It
in the
ries.
rs and
is
vince.
h
main

NationaDiscussi
Figure 141999 and
5.3 CoEco
The aggr
overall p
an attem
Conditio
summar
It is scala
catchme
such an
at a regi
indicatio
l River Ecosyon Documen
4: Maps of thed 2011
nditionaologicalC
regated ecol
picture of the
mpt to provid
on Index base
rises the tren
able in the s
ents (Section
index were t
ional, contin
on of the deg
ystem Account, October 2
e aggregated
ccountfoCondition
logical condi
e state of riv
de a simple o
ed on the ag
nds in the ag
ense that it c
n 3.1) to the
to be develo
ental or glob
gree of modi
nts for South2015
ecological co
ormainrivIndex
tion categor
ver ecosystem
overall pictur
ggregated ec
gregated eco
can be calcu
national leve
oped in a com
bal scale. The
ification from
h Africa
ondition categ
versandt
ry used in Sec
ms, but is sti
re in a single
ological cond
ological cond
lated for any
el, for admin
mparable wa
e index range
m reference
gory for main
tributarie
ction 5.2 abo
ll relatively c
e number, we
dition data. T
dition catego
y reporting u
istrative or b
y in other co
es between 0
condition, w
rivers and all
es,based
ove is useful
complicated
e developed
The Ecologic
ories into a s
unit, from qu
biophysical r
ountries, it co
0 and 100, a
where 100 is t
rivers in Sou
onthe
for providin
to communi
an Ecologica
cal Condition
ingle, scalab
uinary (fifth‐o
reporting uni
ould be sum
nd gives an
the referenc
34
th Africa,
g an
icate. In
al
n Index
ble index.
order)
its. If
marised
ce

National River Ecosystem Accounts for South Africa 35 Discussion Document, October 2015
condition of an ecosystem as it would be without human modification, and 0 is where ecosystem
function is absent.
We developed and piloted the Ecological Condition Index with stakeholders who have many years of
experience in river health and water resource management. Our overall assessment, corroborated
by these stakeholders, is that summarising trends into a single index is generally easier to
communicate than showing inter‐related trends across several aggregated ecological condition
categories. The latter approach is more difficult to communicate when the target audience – such as
national politicians or civil society – is not experienced in river ecological condition and spatial
analysis. We believe this index holds much promise for communicating the overall trends in river
condition, and there has been considerable excitement amongst stakeholders about these initial
results.
We would like to stress that our purpose here is primarily to demonstrate the usefulness of an
Ecological Condition Index. We recognise that we have pushed the limits of the available data in
producing the results shown below, in ways that are not ideal. Our hope is that having demonstrated
the usefulness of such an index, it may be possible to refine systems for collecting and recording the
underlying ecological condition data, involving all key stakeholders collectively, to allow for the
construction of a more statistically robust index in future.
The steps we used to derive the Ecological Condition Index are summarised in Figure 15, and an
example of how we calculated the Ecological Condition Index for main rivers in 1999 is provided in
Table 13. We used the percentile ranges endorsed by DWS (Kleynhans and Louw 2007; Table 14) to
express the aggregated ecological condition category as a number. Ideally, the numbers for the
aggregated ecological condition should be continuous between 0 and 100. A limitation of the
national dataset we used was that the aggregated ecological condition was categorical (although
where site‐level river condition data exist, continuous data between 0 and 100 would most likely
have originally been available). To convert the aggregated ecological condition category to a
number, we assigned the midpoint of this percentile range such that the natural, moderately
modified, heavily modified and unacceptably modified categories were assigned a midpoint of 90,
70, 50 and 20 respectively (Table 13). The proportion river length in each aggregated ecological
condition category is based on the same data used for the condition account shown in Table 12 in
Section 5.2. Multiplying the midpoint of the aggregated ecological condition category by the
proportion of river length in each category provides a length‐weighted score for rivers in each
category (Table 13). The Ecological Condition Index is then calculated as the sum of the length‐
weighted scores for rivers in all aggregated ecological condition categories (Figure 15).

NationaDiscussi
Figure 15The nummodificat0 is wher
Table 13
Aggregaconditio
Natural
Modera
Heavily
Unacce
Total
* Percent
l River Ecosyon Documen
5: Four steps uber between tion from refere ecosystem
: Example of h
ated ecologicon category
ately modified
modified
ptably modifi
tile range is b
ystem Account, October 2
used to deriv0 and 100 thaerence conditfunction is ab
how the Ecolo
al Perceran
80‐1
d 60‐
40‐
ed 0‐3
based on modi
nts for South2015
e the Ecologicat is assigned ion, where 10bsent.
ogical Conditi
entile nge
Midpe
100
79
59
39
ification range
h Africa
cal Condition to the aggreg00 is the refer
ion Index was
dpoint of ercentile range
90
70
50
20
es used by DW
Index gated ecologicence conditio
s calculated fo
Length (km)
46
22
2
1
72
WS and shown
cal condition con prior to hum
or main rivers
Proporleng
541
315
791
026
674
n in Table 14
category descman modificat
s in 1999
rtional gth
Leweisc
0.640
0.307
0.038
0.014
36
ribes the tion, and
ngth‐ighted core
57.6
21.5
1.9
0.3
81.3

NationaDiscussi
Table 14describe
Aggregat
Natural ModeratHeavily mUnaccept
The resu
shown in
and 201
decline t
stakeho
directly
in the co
underlyi
Table 15100
Chang
1999
Figure 16
l River Ecosyon Documen
: The aggregamodification
ted ecologica
ely modified modified tably modified
ults of this in
n Table 15 a
1. Tributarie
than main riv
lders and ex
with manage
ountry’s rive
ing data.
: The Ecologic
1999
2011
ge between
9 and 2011
6: Change in t
ystem Account, October 2
ated ecologican from referen
l condition ca
d
nitial estimat
nd Figure 16
es are in sligh
vers (9.7% vs
perts involve
ement of riv
rs over the t
cal Condition
Main
the Ecological
nts for South2015
al condition cance condition
ategory
e of the Ecol
6. The Ecolog
htly better co
s. 11.2% resp
ed in piloting
ers and wate
ime period c
Index for 199
n rivers
81.3
70.1
‐11.2
Condition Ind
h Africa
ategories andof natural, af
Percentile rareference con
logical Cond
gical Conditio
ondition and
pectively). Th
g this index.
er resources
concerned, n
99 and 2011 fo
Tributar
8
7
‐
dex for main
d their percenfter Kleynhan
nge describinndition
80‐10060‐7940‐590‐39
ition Index fo
on Index dec
d appear to h
hese trends
Based on the
, they felt th
notwithstand
or main rivers
ries
4.9
5.2
9.7
rivers, tributa
ntile scores usns and Louw (2
ng deviation fr
0
or rivers in S
lined by 10.6
have a slightl
concur with
eir experienc
hat the result
ding the limit
s and tributar
All rivers
82.8
72.2
‐10.6
aries and all r
sed by DWS to2007)
rom
South Africa a
6% between
y lower rate
the judgeme
ce of workin
ts reflect rea
tations of the
ries, on a scal
rivers, 1999 –
37
o
are
1999
of
ent of
g
l trends
e
e of 0 –
2011

NationaDiscussi
Figure 1
the tren
commun
conditio
for acco
Figure 17Index for
l River Ecosyon Documen
7 compares
d in the Eco
nicating a sin
on categories
unting purpo
7: Comparisonr main rivers a
ystem Account, October 2
the trends in
logical Cond
ngle index, ra
s were devel
oses, so it is
n of trends in and all rivers
nts for South2015
n the aggreg
ition Index (r
ather than ch
oped primar
perhaps not
aggregated e
h Africa
gated ecologi
right side gra
hanges in a s
rily for plann
t surprising t
ecological con
ical conditio
aphs). It show
set of four ca
ing and man
hat they are
ndition catego
n categories
ws the clarit
ategories. Th
nagement pu
not as well
ories and the
(left side gra
y and ease o
he ecological
urposes rathe
suited to acc
Ecological Co
38
aphs) to
of
er than
counts.
ondition

National River Ecosystem Accounts for South Africa 39 Discussion Document, October 2015
6. EcosystemconditionaccountforriversbyWaterManagementArea
To understand how ecosystem condition trends differ across the country, ecosystem condition
accounts can be constructed for administrative or biophysical units at the sub‐national level. In this
section we show how ecosystem condition accounts can be developed for Water Management Areas
to examine trends between these water resource administrative units. We show examples of
condition accounts for the Limpopo Water Management Area, using ecological condition indicators
and the aggregated ecological condition category; use bar charts to summarise trends in the
ecological condition indicators and the aggregated ecological condition category for all Water
Management Areas; and then show the Ecological Condition Index for each Water Management
Area. We chose the Limpopo Water Management Area as an example because it has undergone high
rates of change in the last decade, both in terms of land use change and river ecological condition. It
also reflects an area more typical of developing countries, with many low‐income rural households
that depend on untreated water drawn directly from rivers for domestic consumption.
6.1 ConditionaccountforWaterManagementAreas,basedonecologicalconditionindicators
Similar to the national‐level accounts presented in Table 11, Table 16 shows the ecosystem condition
account for main rivers of the Limpopo Water Management Area using the ecological condition
indicators for flow, water quality, instream habitat and stream bank/riparian habitat. It shows that
rivers of this area have experienced substantial modification to flow, water quality and instream
habitat. Between 1999 and 2011, the proportion of river length with a critical/serious degree of
modification doubled for both flow (from 34% to 66%) and water quality (from 9% to 25%), and
increased seven‐fold for instream habitat (from 8% to 55%). Factors influencing these large changes
in the Limpopo Water Management Area include failing treatment of waste water, and pressure
from growing industries of agriculture and mining. Such an account can be generated for each Water
Management Area.
Figure 18 uses bar graphs to compare some of the changes to the ecological condition indicators
across all nine Water Management Areas. Overall, the Limpopo and Olifants Water Management
Areas stand out as the ones that are experiencing extreme levels of modification – particularly for
flow, water quality and instream habitat. The key changes shown in Figure 18 include:
Substantial increases in the proportion of river length with a critical/serious degree of flow
modification for the Limpopo, Inkomati‐Usuthu, Berg‐Olifants and Breede‐Gouritz Water
Management Areas. It is also worth noting that a slight increase in the proportion of river length
with no/small modification was detected in the Breede‐Gouritz and Mzimvubu‐Tsitsikamma
Water Management Areas. This could potentially be from additional flows released from
invasive alien clearing or environmental flow management, but this would need to be
investigated.
A sharp decline in water quality in the Breede‐Gouritz, Olifants, Vaal, Limpopo Water
Management Areas, with over 20% of the river length in these areas now being in a
National River Ecosystem Accounts for South Africa 40 Discussion Document, October 2015
critically/seriously modified state. Failing waste water infrastructure and agricultural
intensification is a major driver of water quality decline across the country, with the former
particularly problematic in Limpopo. In addition, the Olifants, Vaal and Limpopo Water
Management Areas have water quality issues associate with mining and severe acid mine
drainage problems. The water quality problems in Limpopo are particularly concerning given
that there is substantial backlog in supply of water services to households in the north‐eastern
portion of the country combined with population demographics of many low‐income rural
communities that often rely on run‐of‐river use without water treatment (Figure 19).
High levels of serious/critical modification to instream habitat in the Olifants and Limpopo Water
Management Areas – almost 50% of the river length in these Water Management Areas has
instream habitat that is now critically/seriously modified. This is most likely associated with
eutrophication problems caused mainly by failing waste water infrastructure and exacerbated by
agricultural intensification.
The proportion of river length with no or small modification to stream bank or riparian habitat is
generally low relative to that for flow, water quality and instream habitat, and the changes to
this indicator were not as dramatic. Riparian habitat provides a very important natural filter for
pollutants that would otherwise be washed into the river, and attention needs to be given to
maintaining and restoring such habitat.

National River Ecosystem Accounts for South Africa 41 Discussion Document, October 2015
Table 16: Ecosystem condition account for rivers of the Limpopo Water Management Area using ecological condition indicators, 1999 – 2011
Degree of modification from natural
Kilometres None/ small
Moderate Large Serious/ Critical
No Data
Total
FLOW
Opening stock 1999 2 456 1 403 1 209 854 195 6 117
Opening stock as a % total river length 40 23 20 14 3 100
Increase/decreases ‐1 574 ‐549 336 1 785
Increases/decreases as % opening stock ‐64 ‐39 28 209
Opening stock 2011 882 854 1 545 2 639 195 6 115
Opening stock as a % total river length
14 14 25 43 3 100
WATER QUALITY
Opening stock 1999 3 332 2 024 503 62 195 6 117
Opening stock as a % total river length 54 33 8 1 3 100
Increase/decreases ‐1 363 364 563 435
Increases/decreases as % opening stock ‐41 18 112 700
Opening stock 2011 1 969 2 387 1 066 497 195 6 115
Opening stock as a % total river length
32 39 17 8 3 100
INSTREAM HABITAT
Opening stock 1999 3 046 2 372 503 0.2 195 6 117
Opening stock as a % total river length 50 39 8 0 3 100
Increase/decreases ‐2 695 ‐196 2 017 872
Increases/decreases as % opening stock ‐88 ‐8 401 383 799
Opening stock 2011 351 2 176 2 521 873 195 6 115
Opening stock as a % total river length
6 36 41 14 3 100
STREAM BANK/RIPARIAN HABITAT
Opening stock 1999 2 041 2 803 1 043 34 195 6 117
Opening stock as a % total river length 33 46 17 1 3 100
Increase/decreases ‐1 090 653 263 172
Increases/decreases as % opening stock ‐53 23 25 500
Opening stock 2011 951 3 456 1 306 207 195 6 115
Opening stock as a % total river length
16 57 21 3 3 100

NationaDiscussi
Figure 18(blue barindicator
�
l River Ecosyon Documen
8: Change perrs) and seriours, 1999 – 201
ystem Account, October 2
r Water Manaus/critical mod11
nts for South2015
agement Areadification (ora
h Africa
a in the propoange bars), fo
ortion of riveror each of the
length with n four ecologic
no/small modcal condition
42
dification

NationaDiscussi
Figure 19
6.2 Coeco
Table 17
Water M
be gene
The cha
modified
spatially
extent o
extent o
Limpopo
decline i
proporti
Gouritz,
river len
l River Ecosyon Documen
9: Backlog in w
nditionaologicalc
7 shows the e
Management
rated for eac
nges in the e
d categories
y in Figure 21
of river lengt
of river lengt
o, Pongola‐M
in the propo
ion of heavil
Olifants and
ngth either h
ystem Account, October 2
water service
ccountfocondition
ecosystem c
t Area using t
ch Water Ma
extent of rive
are summar
1. The trends
h in the natu
h in the heav
Mzimkulu and
ortion of rive
y and unacce
d Berg‐Olifan
eavily or una
nts for South2015
supply to ho
orWaterMcategory
ondition acc
the aggregat
anagement A
er length in t
rised for all W
s for both ma
ural category
vily and unac
d Inkomati‐U
r length in th
eptably mod
nts Water Ma
acceptably m
h Africa
useholds (DW
Managem
count for ma
ted ecologica
Area.
the natural c
Water Manag
ain rivers and
y decreased i
cceptably mo
Usuthu Wate
he natural ca
dified river le
anagement A
modified in 2
WA 2009)
entAreas
in rivers and
al condition
ategory and
gement Area
d tributaries
in every Wat
odified categ
er Manageme
ategory. The
ength occurre
Areas, all of w
011.
�
s,basedo
d tributaries o
category. Su
the heavily
as in Figure 2
are similar a
ter Managem
gories increa
ent Areas ex
highest incr
ed in the Lim
which had m
onaggrega
of the Limpo
uch an accou
and unaccep
20, and show
and show tha
ment Area, w
ased (Figure 2
xperienced ov
eases in the
mpopo, Breed
more than 25
43
ated
opo
nt can
ptably
wn
at the
while the
20). The
ver 40%
de‐
5% of

National River Ecosystem Accounts for South Africa 44 Discussion Document, October 2015
Table 17: Ecosystem condition account for main rivers, tributaries and all rivers in the Limpopo Water Management Area using the aggregated ecological condition category
Degree of modification from natural
Kilometres Natural Moderately modified
Heavily modified
Unacceptably modified
No Data
Total
MAIN RIVERS
Opening stock 1999 3 966 1 882 73 195 6 117
Opening stock as a % total river length 65 31 1 3 100
Increase/decreases ‐3 363 937 2 002 423
Increases/decreases as % opening stock ‐85 50 2 743
Opening stock 2011 604 2 820 2 075 423 195 6 117
Opening stock as a % total river length
10 46 34 7 3 100
TRIBUTARIES
Opening stock 1999 2 177 2 270 675 96 407 5 625
Opening stock as a % total river length 39 40 12 2 7 100
Increase/decreases ‐1 015 177 688 150
Increases/decreases as % opening stock ‐47 8 102 157
Opening stock 2011 1 163 2 447 1 363 246 407 5 625
Opening stock as a % total river length
21 43 24 4 7 100
ALL RIVERS
Opening stock 1999 6 144 4 152 748 96 603 11 742
Opening stock as a % total river length 52 35 6 1 5 100
Increase/decreases ‐4 378 1 114 2 690 573
Increases/decreases as % opening stock ‐71 27 360 600
Opening stock 2011 1 766 5 267 3 438 669 603 11 742
Opening stock as a % total river length
15 45 29 6 5 100

NationaDiscussi
Figure 20condition
Figure 21ecologicaright)
l River Ecosyon Documen
0: Change pern category of
1: Maps per Wal condition c
ystem Account, October 2
r Water Mananatural (blue
Water Manageategory of na
nts for South2015
agement Areae bars), and he
ement Area oatural (maps o
h Africa
a in the propoeavily or unac
of the change on left), and h
ortion of rivercceptably mo
in the extentheavily or una
length in an odified (orang
t of river lengtacceptably mo
aggregated ee bars), 1999
th in an aggreodified (maps
45
cological – 2011
egated s on

NationaDiscussi
6.3 CoEco
Figure 2
for main
Manage
Area exp
waste w
increasin
Orange
Tsitsikam
Figure 22rivers, 19
Figure 23rivers an
l River Ecosyon Documen
nditionaologicalC
2 shows the
n rivers and f
ement Areas
perienced th
water manage
ng developm
Water Mana
mma showed
2: Change in t999 – 2011
3: Maps of thed all rivers
ystem Account, October 2
ccountfoCondition
Ecological C
for all rivers.
between 19
he most dram
ement (both
ment pressur
agement Are
d the smalles
the Ecological
e change in th
nts for South2015
orWaterMIndex
Condition Ind
The Ecologi
99 and 2011
matic decline
h in terms of
es from min
eas also show
st decline. Th
Condition Ind
he Ecological
h Africa
Managem
dex for each
cal Condition
1 The main ri
e (22%, from
poor infrast
ing and agric
wed declines
hese results
dex of each W
Condition Ind
entAreas
Water Mana
n Index decli
ivers of the L
83.1 to 61.5
ructure and
culture. The
of over 10%
are summar
Water Manage
dex of each W
s,basedo
agement Are
ined in all nin
Limpopo Wa
5%), most like
poor operat
Breede‐Gou
%, while the M
rised spatially
ement Area fo
Water Manage
onthe
ea in 1999 an
ne Water
ter Managem
ely reflecting
ing capacity)
ritz, Olifants
Mzimvubu‐
y in Figure 2
or main rivers
ement Area fo
46
nd 2011,
ment
g poor
) and
s and
3.
s and all
or main

National River Ecosystem Accounts for South Africa 47 Discussion Document, October 2015
7. Ecosystemconditionaccountforriversbylongitudinalzone
In this section we show the ecosystem condition accounts for the four longitudinal zones defined for
rivers in South Africa (mountain streams, upper foothill streams, lower foothill streams and lowland
rivers). We develop the ecosystem condition accounts using the aggregate ecological condition
category, summarise the results graphically and show trends in the Ecological Condition Index for
each longitudinal zone.
7.1 Conditionaccountforlongitudinalzones,basedonaggregatedecologicalconditioncategory
The ecosystem condition account for each longitudinal zone using the aggregated ecological
condition category is provided in Table 18. This information was used to generate Figure 24, which
shows how the percentage of river length in each ecological condition category changed between
1999 and 2011 within each longitudinal zone. Table 18 and Figure 24 show similar patterns of
change for main rivers and all rivers, indicating that the trends in main rivers and tributaries are
similar. In all longitudinal zones, the proportion of river length in the natural category showed a
sharp decline, with increases occurring mainly in the moderately modified and heavily modified
categories. The degree of modification becomes more pronounced along the continuum of
longitudinal zones, from mountain streams, through upper and lower foothill streams, to lowland
rivers. Lowland main rivers have the steepest increase in heavily modified rivers (over 1000%
increase). This is indicative of the cumulative impacts on rivers as they run from source to sea, as
well as the fact that lowland rivers with their associated fertile floodplains comprise only 9% of
South Africa’s rivers (Table 9) and are under extreme utilisation pressure for cultivation and housing.
7.2 Conditionaccountforlongitudinalzones,basedontheEcologicalConditionIndex
Trends in the Ecological Condition Index for longitudinal zones are shown in Figure 25 and support
the finding that the degree of modification increases sharply along the continuum of longitudinal
zones, with mountain streams having the lowest levels of modification and lowland rivers the
highest. The rate of decline in the Ecological Condition Index is similar for main rivers and tributaries
across all longitudinal zones, although the index for mountain streams is slightly higher when
tributaries are included, indicating that tributaries in the mountain stream longitudinal zone are
overall in better condition than main rivers in that zone.

National River Ecosystem Accounts for South Africa 48 Discussion Document, October 2015
MOUNTAIN STREAM
Opening stock 1999 1 141 383 47 22 16 1 609
Opening stock as a % total river length 71 24 3 1 1 100
Increase/decreases ‐459 175 274 10
Increases/decreases as % opening stock ‐40 46 588 44
Opening stock 2011 682 558 321 32 16 1 609
Opening stock as a % total river length
42 35 20 2 1 100
UPPER FOOTHILL STREAM
Opening stock 1999 15 054 5 371 621 140 380 21 566
Opening stock as a % total river length 70 25 3 1 2 100
Increase/decreases ‐6 584 2 923 3 249 412
Increases/decreases as % opening stock ‐44 54 523 295
Opening stock 2011 8 470 8 294 3 870 551 380 21 566
Opening stock as a % total river length
39 38 18 3 2 100
LOWER FOOTHILL STREAM
Opening stock 1999 23 683 11 820 1 714 480 1 195 38 893
Opening stock as a % total river length 61 30 4 1 3 100
Increase/decreases ‐12 755 5 056 6 649 1 050
Increases/decreases as % opening stock ‐54 43 388 218
Opening stock 2011 10 929 16 876 8 364 1 530 1 195 38 893
Opening stock as a % total river length
28 43 22 4 3 100
LOWLAND RIVER
Opening stock 1999 6 663 4 741 410 384 2 046 14 243
Opening stock as a % total river length 47 33 3 3 14 100
Increase/decreases ‐12 755 5 056 6 649 1 050
Increases/decreases as % opening stock ‐191 107 1 623 273
Opening stock 2011 2 359 6 054 3 405 378 2 046 14 243
(a)
Degree of modification from natural
Kilometres Natural Moderately
modified
Heavily
modified
Unacceptably
modified
No
Data
Total
(b)
Degree of modification from natural
Kilometres Natural Moderately
modified
Heavily
modified
Unacceptably
modified
No Data Total
MOUNTAIN STREAM
Opening stock 1999 4 366 659 174 34 1 520 6 754
Opening stock as a % total river length 65 10 3 1 23 100
Increase/decreases ‐1 589 978 571 41
Increases/decreases as % opening stock ‐36 148 328 118
Opening stock 2011 2 777 1 637 745 75 1 520 6 754
Opening stock as a % total river length
41 24 11 1 23 100
UPPER FOOTHILL STREAM
Opening stock 1999 42 616 9 200 1 844 300 20 198 74 158
Opening stock as a % total river length 57 12 2 27 100
Increase/decreases ‐18 130 11 212 5 980 938
Increases/decreases as % opening stock ‐43 122 324 313
Opening stock 2011 24 485 20 412 7 824 1 238 20 198 74 158
Opening stock as a % total river length
33 28 11 2 27 100
LOWER FOOTHILL STREAM
Opening stock 1999 32 926 15 132 2 420 632 15 335 66 445
Opening stock as a % total river length 50 23 4 1 23 100
Increase/decreases ‐17 006 7 213 8 380 1 413
Increases/decreases as % opening stock ‐52 48 346 224
Opening stock 2011 15 920 22 345 10 800 2 045 15 335 66 445
Opening stock as a % total river length
24 34 16 3 23 100
LOWLAND RIVER
Opening stock 1999 6 927 4 793 437 388 2 706 15 251
Opening stock as a % total river length 45 31 3 3 18 100
Increase/decreases ‐4 437 1 404 3 003 30
Increases/decreases as % opening stock ‐64 29 687 8
Opening stock 2011 2 491 6 197 3 440 418 2 706 15 251
Table 18: Ecosystem condition account by longitudinal zone for (a) main rivers and (b) all rivers, using the aggregated ecological condition category, 1999 – 2011

NationaDiscussi
Figure 24
Figure 25
l River Ecosyon Documen
4: Percentage
5: Change in t
ystem Account, October 2
e of river lengt
the Ecological
nts for South2015
th in each agg
Condition Ind
h Africa
gregated ecol
dex per longit
ogical conditi
tudinal zone f
ion category p
for main river
per longitudin
rs and all rive
49
nal zone
ers

National River Ecosystem Accounts for South Africa 50 Discussion Document, October 2015
8. Ecosystemconditionaccountforriversbyecoregion
An ecosystem condition account using the aggregated ecological condition category could be
developed for each of the 31 river ecoregions, in the same way as we did for the Limpopo Water
Management Area (Table 17) and for longitudinal zones (Table 18). We have not done this for this
discussion document because of the large number of river ecoregions, but the data that would be
used to develop the condition account for main rivers in each ecoregion are shown in Table 19. The
Ecological Condition Index for 1999 and 2011 for each ecoregion is also shown in Table 19. The red
text in the table indicates river ecoregions with the largest changes.
In absolute terms (length in km), the Highveld, Nama Karoo, Bushveld Basin and Western
Bankenveld ecoregions stand out as river ecoregions that experienced extreme increases in the
degree of modification between 1999 and 2011 – the extent of river length in the natural category
decreased substantially (by over 1 500 km) in these ecoregions, while the extent of river length in
the heavily and critically modified categories increased (Table 19). All of these ecoregions except the
Nama Karoo are in mining centres (i.e. parts of the country where mining plays a large role in the
economy).
In proportional terms, the Bushveld Basin, Nama Karoo and Western Bankenveld showed similar
trends, with increases of between 1 124 and 3 929% in the proportion of river length in the heavily
and critically modified categories (Table 19). The Highveld ecoregion, which had a high absolute
increase, also had a sharp increase in the proportion of river length in the heavily and critically
modified categories (384%). The Southern Coastal Belt had a very high increase in the proportion of
river length in the critically modified category (3 472%), but the absolute increase was relatively
small (208 km). Table 19 shows that nine ecoregions had a decrease of more than 80% in river length
in natural condition between 1999 and 2011 – the Bushveld Basin and Western Bankenveld are
included in this list. Biodiversity in ecoregions such as these that have lost a high proportion of rivers
in a natural ecological condition will be severely jeopardised, and these ecoregions are likely to
contain many critically endangered river ecosystem types. This is corroborated by the National
Biodiversity Assessment 2011 (Driver et al. 2012).
The Ecological Condition Index of three ecoregions – the South Western Coastal Belt, Natal Coastal
Plain and Southern Coastal Belt – fell to 50 or lower in 2011 (Table 19). The first two of these
ecoregions (South Western Coastal Belt and Natal Coastal Plain) are subject to intense urbanisation
pressures around the Cape Town and eThekwini (Durban) metropolitan centres. The remaining one
(Southern Coastal Belt) is in a known biodiversity hotspot (the Agulhas Plain), where the main
pressures on rivers are from cultivation (dryland and irrigated) and invasive alien plants. Ecoregions
with the biggest changes in Ecological Condition Index included the Natal Coastal Plain (41% change),
Southern Coastal Belt (32%), Northern Plateau (30%), Western Bankenveld (23%), Bushveld Basin
(22%) and South Western Coastal Belt (21%).

National River Ecosystem Accounts for South Africa 51 Discussion Document, October 2015
Table 19: Extent of main river in each aggregated ecological condition category (1999 and 2011), per ecoregion, showing changes in absolute and percentage terms
1999 (km) 2011 (km) Change between 1999 and 2011 (km)
Change between 1999 and 2011 (as % opening stock)
Ecological Condition Index
Code
Ecoregion
Total river
length (km
)
Natural
Moderately
modified
Heavily
modified
Unacceptably
modified
Natural
Moderately
modified
Heavily
modified
Unacceptbly
modified
Natural
Moderately
modified
Heavily
modified
Unacceptably
modified
Natural
Moderately
modified
Heavily
modified
Unacceptbly
modified
ECI 1999
ECI 2011
Change in ECI
1 Limpopo Plain 2 156 1 507 649 188 1 285 683 ‐1 318 635 683 ‐87 98 ‐‐ ‐‐ 84 65 ‐19
2 Soutpansberg 516 375 142 32 334 150 ‐342 192 150 ‐91 136 ‐‐ ‐‐ 85 65 ‐19
3 Lowveld 4 958 3 211 1 655 92 1 702 2 033 983 240 ‐1 508 378 891 240 ‐47 23 965 ‐‐ 83 70 ‐12
4 North Eastern Highlands 1 242 708 519 15 178 655 371 38 ‐530 136 371 23 ‐75 26 ‐‐ 161 81 65 ‐15
5 Northern Plateau 366 283 83 103 263 ‐283 20 263 ‐100 24 ‐‐ ‐‐ 85 56 ‐30
6 Waterberg 395 271 81 43 127 194 69 4 ‐143 113 26 4 ‐53 139 60 ‐‐ 82 72 ‐9
7 Western Bankenveld 1 145 768 349 29 128 519 353 146 ‐640 170 324 146 ‐83 49 1 124 ‐‐ 83 60 ‐23
8 Bushveld Basin 2 051 1 073 925 24 28 165 724 974 188 ‐908 ‐201 950 160 ‐85 ‐22 3 929 571 80 58 ‐22
9 Eastern Bankenveld 1 602 916 686 354 780 442 26 ‐562 95 442 26 ‐61 14 ‐‐ ‐‐ 81 68 ‐13
10 Northern Escarpmt Mountains 993 766 227 149 641 204 ‐617 414 204 0 ‐81 182 ‐‐ ‐‐ 85 69 ‐17
11 Highveld 9 939 4 353 4 857 452 277 1 502 5 653 2 184 600 ‐2 851 796 1 732 322 ‐65 16 384 116 76 66 ‐11
12 Lebombo Uplands 132 98 21 14 98 24 11 ‐21 10 11 ‐100 72 ‐‐ 83 77 ‐6
13 Natal Coastal Plain 336 336 6 147 68 114 ‐330 147 68 114 ‐98 ‐‐ ‐‐ ‐‐ 90 49 ‐41
14 North Eastern Uplands 3 767 3 488 279 1 463 1 947 319 39 ‐2 025 1 668 319 39 ‐58 597 ‐‐ ‐‐ 89 76 ‐13
15 Eastern Escarpment Mountains 3 470 1 877 1 371 157 64 1 694 1 462 297 17 ‐184 91 140 ‐48 ‐10 7 89 ‐74 79 78 ‐1
16 South Eastern Uplands 6 051 4 410 1 531 110 2 415 2 806 744 86 ‐1 995 1 275 634 86 ‐45 83 578 ‐‐ 84 75 ‐9
17 Eastern Coastal Belt 2 055 1 689 367 1 196 545 245 69 ‐493 178 245 69 ‐29 49 ‐‐ ‐‐ 86 78 ‐9
18 Drought Corridor 4 952 1 954 1 950 1 048 992 2 633 1 196 131 ‐962 683 148 131 ‐49 35 14 ‐‐ 74 68 ‐6
19 Southern Folded Mountains 3 534 1 932 1 376 149 77 1 020 1 264 1 045 205 ‐912 ‐112 896 128 ‐47 ‐8 600 166 79 67 ‐12
20 South Eastern Coastal Belt 1 585 775 596 80 134 494 509 553 28 ‐281 ‐87 474 ‐106 ‐36 ‐15 593 ‐79 75 68 ‐6
21 Great Karoo 4 053 3 271 611 82 88 2 701 1 104 248 1 ‐571 492 166 ‐88 ‐17 81 203 ‐99 85 82 ‐3
22 Southern Coastal Belt 1 053 698 297 52 6 46 247 547 214 ‐652 ‐51 495 208 ‐93 ‐17 958 3 472 82 50 ‐32
23 Western Folded Mountains 1 452 774 529 50 99 559 314 551 27 ‐215 ‐214 501 ‐71 ‐28 ‐41 992 ‐73 77 69 ‐7
24 South Western Coastal Belt 847 144 561 90 52 69 641 136 ‐144 ‐491 551 84 ‐100 ‐88 613 161 68 47 ‐21
25 Western Coastal Belt 1 096 938 158 629 156 311 ‐309 ‐2 311 ‐33 ‐1 ‐‐ ‐‐ 87 76 ‐11
26 Nama Karoo 6 517 4 900 1 416 71 130 1 654 3 188 1 635 41 ‐3 246 1 771 1 564 ‐89 ‐66 125 2 216 ‐69 84 70 ‐14
27 Namaqua Highlands 992 992 786 182 24 ‐206 182 24 ‐21 ‐‐ ‐‐ ‐‐ 90 85 ‐5
28 Orange River Gorge 611 611 322 289 ‐289 289 ‐47 ‐‐ ‐‐ ‐‐ 90 81 ‐9
29 Southern Kalahari 2 376 1 568 752 56 592 1 073 596 116 ‐976 320 596 60 ‐62 43 ‐‐ 106 82 68 ‐14
30 Ghaap Plateau 58 58 15 30 13 ‐43 30 13 ‐74 ‐‐ ‐‐ ‐‐ 90 71 ‐19
31 Eastern Coastal Belt 2 372 1 797 326 249 1 232 895 228 17 ‐565 569 ‐22 17 ‐31 174 ‐9 ‐‐ 83 78 ‐5

National River Ecosystem Accounts for South Africa 52 Discussion Document, October 2015
9. Recommendationsandprioritiesforfurtherwork
In this section we provide recommendations for enhancing ecosystem condition accounts, drawing
on our experience in developing the accounts presented here, with a view to contributing to the
global research agenda. We set out priorities for national river ecosystem accounting work in South
Africa, and suggest further testing that could be done based directly on these pilot accounts. Lastly
we make recommendations for improving the collection and recording of the data on ecological
condition of rivers that underpins ecosystem accounting. We hope that this will address some of the
key data limitations that we encountered in developing the ecosystem condition accounts presented
here, which are likely to be common among many countries.
9.1 Proposedindicatorsofecologicalconditionforecosystemassetclasses
As summarised in Section 2.3, SEEA Experimental Ecosystem Accounting and the accompanying draft
technical guidelines set out steps for assessing ecosystem condition, including identifying relevant
characteristics of ecosystem condition and then identifying indicators associated with those
characteristics. Examples of characteristics of ecosystem condition that are often used are
vegetation, biodiversity, soil, water and carbon (as reflected in Table 2 which is reproduced from
SEEA Experimental Ecosystem Accounting). We discussed in Section 2.3 the fact that these
characteristics are unlikely to be suitable for all classes of ecosystem assets, and we have shown in
the accounts presented here how a different set of characteristics and indicators is needed for river
ecosystem condition accounts, relating to system drivers and habitat attributes in the freshwater
realm (see Figure 3). Based on our experience in developing these accounts, we propose an
approach to developing indicators of ecological condition that could be applied across the terrestrial,
freshwater and marine realms. While the approach is common across realms, the resulting set
indicators is likely to be different for each realm, as shown in Table 20(a)‐(e).
Key points about the proposed approach include:
For each broad class of ecosystem assets (e.g. terrestrial, river, wetland, coastal, marine), four to
six indicators of ecological condition should be selected, which can be aggregated to give an
overall index of ecological condition.
Indicators of ecological condition should ideally reflect a combination of:
o System drivers in the class of ecosystems concerned (such as land cover/land use change
in terrestrial systems, hydrological changes in freshwater systems, harvesting pressure in
marine systems);
o Habitat attributes (such as degree of fragmentation, instream siltation); and
o Biological responses of the ecosystems and associated species (such as changes in
population levels of particular species, loss of species richness).

National River Ecosystem Accounts for South Africa 53 Discussion Document, October 2015
Ecologists in the different realms (terrestrial, freshwater, marine) have done substantial thinking
on this, and it is important to draw on this existing work in the process of developing the
condition accounts for a particular class of assets. It is essential for ecologists to be closely
involved in the selection of indicators of ecological condition, and in determining the method
used for aggregating them, to ensure that the result is ecologically meaningful and sensible.
It is not possible to devise a single set of indicators of ecological condition that applies to all
ecosystem asset classes; however, some indicators are likely to be common across more than
one asset class. Some examples are given in Table 20(a)‐(e). The set of indicators of ecological
condition eventually selected for a particular asset class may depend partly on data availability,
but ideally should not be driven by data availability as the starting point.
All indicators should be assessed/quantified in relation to a reference condition for the
ecosystem type concerned (e.g. on a scale of 0 to 100, where 100 represents the reference
condition). Where possible, the reference condition should be the natural condition in the
absence of significant modification by human activity. If this is not possible, an alternative stable
reference condition can be selected (e.g. condition at a particular baseline date).
Table 20 (a) to (e) provides an example of what the ecosystem condition table might look like for
different classes of ecosystem assets. These are simply suggestions to illustrate the approach – the
indicators suggested here are not intended to be exhaustive or definitive.
Table 20: Examples of possible indicators for assessing ecological condition in terrestrial, river, wetland, coastal and marine realms
(a) Terrestrial ecosystems
Ecosystem type
Indicators of ecological condition – possible examples
Overall index of ecological condition
Habitat modification/intensity of land‐use indicator(s) (e.g. loss of natural vegetation, density of invasive species, quantity of irrigation, quantity of fertilizer, density of livestock)
Fragmentation‐related indictor(s) (there are many possible ways to measure fragmentation)
Soil‐related indicator(s) (e.g extent of erosion gullies and rills, sediment loss or accumulation, soil chemistry (pH, salinization), extent of tillage)
Species‐related indicator(s) (e.g. loss of keystone species, loss of palatable species, reduced populations of harvested species, loss of species richness)
e.g. Grassland
Savannah
Forest
Desert
…
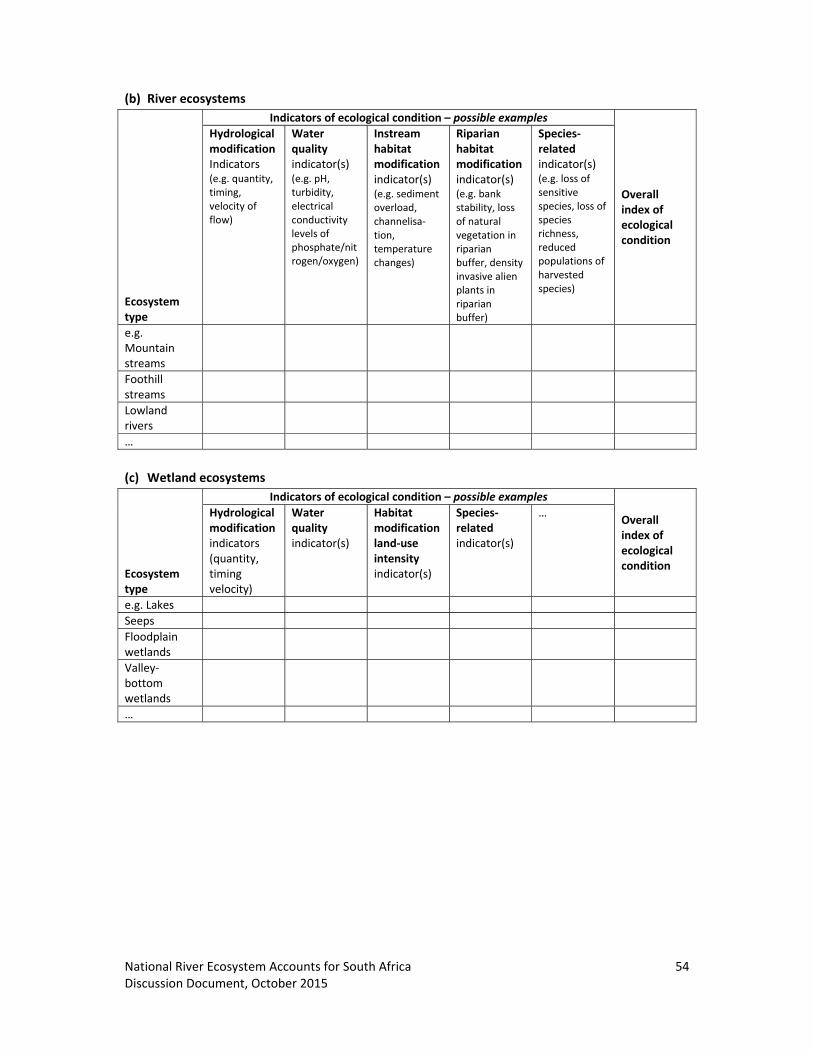
National River Ecosystem Accounts for South Africa 54 Discussion Document, October 2015
(b) River ecosystems
Ecosystem type
Indicators of ecological condition – possible examples
Overall index of ecological condition
Hydrological modification Indicators (e.g. quantity, timing, velocity of flow)
Water quality indicator(s) (e.g. pH, turbidity, electrical conductivity levels of phosphate/nitrogen/oxygen)
Instream habitat modification indicator(s) (e.g. sediment overload, channelisa‐tion, temperature changes)
Riparian habitat modification indicator(s) (e.g. bank stability, loss of natural vegetation in riparian buffer, density invasive alien plants in riparian buffer)
Species‐related indicator(s) (e.g. loss of sensitive species, loss of species richness, reduced populations of harvested species)
e.g. Mountain streams
Foothill streams
Lowland rivers
…
(c) Wetland ecosystems
Ecosystem type
Indicators of ecological condition – possible examples
Overall index of ecological condition
Hydrological modification indicators (quantity, timing velocity)
Water quality indicator(s)
Habitat modification land‐use intensity indicator(s)
Species‐related indicator(s)
…
e.g. Lakes
Seeps
Floodplain wetlands
Valley‐bottom wetlands
…

National River Ecosystem Accounts for South Africa 55 Discussion Document, October 2015
(d) Coastal ecosystems
Ecosystem type
Indicators of ecological condition – possible examplesOverall index of ecological condition
Habitat modification/ land‐use intensity indicator(s)
Harvesting pressure indicator(s)
Freshwater inputs
Species‐related indicator(s)
…
e.g. Estuaries and lagoons
Sandy beaches
Rocky shores
Coastal dunes
…
(e) Marine ecosystems (may need different indicators for inshore and offshore ecosystems, and for
pelagic and benthic ecosystems)
Ecosystem type
Indicators of ecological condition – possible examples Overall index of ecological condition
Harvesting pressure indicator(s)
Habitat modification indicator(s)
Species‐related indicator(s)
… …
e.g. Reefs
Soft shelf
Rocky shelf
Deep‐sea sediment
Sea mounts
Pelagic ecosystems
…
9.2 Prioritiesfornationalriverecosystemaccountingwork
This initial set of accounts for river ecosystems has been undertaken with a view to informing
subsequent development of national accounts for other classes of ecosystem assets in South Africa,
such as wetlands, marine and coastal ecosystems, and terrestrial ecosystems, as well as developing a
full set of physical ecosystem accounts (see Figure 2 in Section 2.1) for rivers. We hope to build on
this work with continued partnership between SANBI, Stats SA, DWS and CSIR. Below we suggest
some priorities for taking forward the work on national river ecosystem accounts:
Producing a full set of physical ecosystem accounts for rivers: This would include extent and
condition accounts, as well as ecosystem service generation and use accounts (see Figure 2 in
Section 2.1).
Linking the ecosystem accounts for rivers with national water accounts: Water accounts differ
from ecosystem accounts in that they focus on the water resource, while ecosystem accounts
focus on the underlying river ecosystems. Initiatives are currently underway in South Africa to
further develop the country’s national water accounts, which will include physical (volumetric
National River Ecosystem Accounts for South Africa 56 Discussion Document, October 2015
and quality) and monetary accounts for the water resource. The water accounts will present,
inter alia, water availability and quality for specified reporting units, sectoral and population
water use, and monetary value. If the water accounts are at a scale that is sufficiently spatially
disaggregated, they may help us understand the drivers of change in river ecosystems and
develop ecosystem service accounts linked to river ecosystems (by providing information both
about the generation of water as an ecosystem service and the users of the service). Ideally the
national river ecosystem accounts and the national water accounts should complement each
other.
Developing land accounts for key ecological infrastructure features related to rivers, such as
strategic water source areas, riparian zones, and wetlands.
Developing an integrated national map of ecosystem types across the terrestrial and
freshwater realms: Rivers in South Africa are currently mapped as lines, and these accounts
measured their extent in terms of length. In future we would ideally like to map river channels as
areas and to embed them in the national vegetation map. If this is achieved, the extent of rivers
could be measured in terms of either length or area, or both.
Analysing ecosystem condition trends for rivers in relation to other socio‐economic indicators,
which includes exploring:
o Links to census information especially for poor communities that rely on use of water
directly from rivers,
o Links to GDP and other aspects of the economy, especially if these can be spatially
disaggregated,
o Investigating use of integrated indicators for monitoring the implementation of
Sustainable Development Goals in South Africa.
Further priorities for national ecosystem accounting work, including the development of national
land and ecosystem accounts, are discussed in the companion discussion document to this one.
9.3 Prioritiesforfurthertestingbasedontheextentandconditionaccountspresentedhere
Further work and testing could be done based on the data and information already compiled for the
accounts, as well as with through the collation of other existing data that is currently scattered
across different regions and institutions. This includes:
Reporting on the extent of rivers in terms of volume of water: In addition to reporting on river
extent in terms of length, it is feasible to report on the extent of rivers in terms of naturalised,
non‐cumulative volume of water (m3) using currently available data on mean annual runoff in
South Africa. This option may hold particular potential for linking more directly to water
accounts, as well as for linking to ecosystem service generation and use accounts.

National River Ecosystem Accounts for South Africa 57 Discussion Document, October 2015
Testing which of the condition accounts, graphics and maps are most useful for communicating
trends to different target audiences: At this developmental stage of river ecosystem accounting,
we have deliberately shown many different options for presenting and summarising the
ecosystem condition accounts – e.g. showing condition accounts that use the ecological
condition indicators and ones that use aggregated ecological condition category, presenting an
Ecological Condition Index, and summarising the condition accounts according to three different
reporting units (Water Management Areas, longitudinal zones and river ecoregions). We felt that
presenting all these alternatives was necessary so that stakeholders could further explore the
utility of each option. Further testing is required to understand which of the options are most
useful for taking forward, and which may differ depending on the targeted stakeholder group or
decision‐making process.
Developing a more robust Ecological Condition Index: The index, as it is presented in this report,
serves primarily to demonstrate the usefulness of having a single index. Feedback from the
stakeholder workshops – primarily from DWS water resource planners – indicates that it is a
useful index that helps communicate the trends in ecological condition of rivers more easily than
the trends in the aggregated ecological condition categories. While we acknowledge the
limitations of the data we had available for developing the Ecological Condition Index reported
here, we feel optimistic about constructing a more statistically robust index in future. This will
require improving the underpinning data, primarily by ensuring that the Present Ecological State
is expressed as a continuous range from 100 (reference condition) to 0.
Testing how to integrate and display confidence limits and uncertainty: This applies to the
ecological condition indicators and the aggregated ecological condition categories that are
provided in the Present Ecological State data, as well as the Ecological Condition Index.
Testing the application of the ecosystem condition account in water resource planning and
policy: A key implementation mechanism for this could be catchment‐level water resource
planning (known as ‘Classification of Water Resources’ in terms of the National Water Act),
which sets a Management Class for every significant water resource in a catchment (e.g.
stretches of river). The Management Class stipulates a desired condition of the resource (based
on the aggregated ecological condition categories) and the extent to which it can be utilised. The
Class is determined through environmental flow assessment at a basin‐wide scale and scenario
development (Dollar et al. 2010). Using river condition accounts to compare the actual condition
trends over time to the desired condition would be a way of tracking the effectiveness of the
Classification process.
Exploring options for using more quantitative, site‐based ecological condition data for rivers:
We used the Present Ecological State data as our underpinning data on ecological condition
primarily because the data were national in scope, at a relatively fine scale, and collated for two
time periods. The use of quantitative, site‐based assessment data from other sources should be

National River Ecosystem Accounts for South Africa 58 Discussion Document, October 2015
explored (e.g. historical River Health Programme data and DWS monitoring sites for resource
quality objectives and environmental water requirements; see Box 3).
Box 3: South Africa’s site‐based monitoring of river condition
Prior to the late 1980s, water quality was monitored using only chemical and physical water quality variables. This ‘stressor monitoring’ (which focuses on the stressors that are likely to cause pollution or ecological change) was complemented with ‘response monitoring’ (which uses of biological or ecological indicators to characterise the response of the environment to a stressor) by the introduction of the South African Scoring System or SASS in the late 1980s (Chutter 1998; Dickens and Graham 2002). SASS is a bioassessment protocol which uses the identification of families of aquatic invertebrates in the field to assess the condition or health of river systems. Since then, the suite of tools for response monitoring has grown to also include biological indices for fish, and riparian and instream habitats. Initially, between the late 1990s and mid‐2000s, DWS and provincial conservation authorities collected site level data under the coordination of the River Health Programme. This programme evolved into the River Ecostatus Monitoring Programme, which was brought in line with the National Water Act, to meet DWS needs for monitoring Resource Quality Objectives and Environmental Water Requirements. Bringing the monitoring in line with national legislation represents an important opportunity for maintaining ongoing monitoring of river condition across the country. However, to use these data effectively in time series assessment for ecosystem accounting, it will be essential to explore how the data are collected and collated, and at what scale. Although some of the historical river health data have been collated into a single database, much of it is still scattered across the country, and the information in the database is often incomplete or referenced with incorrect geographic coordinates. Furthermore, the sampling sites tend to focus on monitoring of cumulative effects in main rivers – monitoring in the tributaries is heavily under‐represented, and an effort should be made to correct this bias.
9.4 Improvedsystemsforcollectingandrecordingtimeseriesdataonecologicalconditionofrivers
The ecological condition data that we used to generate the ecosystem condition accounts are
traditionally used for water resource planning and decision‐making, and not for monitoring trends in
river condition. Using them in an accounting context was challenging and highlighted two major data
constraints for ecosystem accounts:
The scope of the ecological condition data needs to be national, but the spatial scale should be
sufficiently disaggregated to help understand the likely drivers of change in order to inform
management interventions. Sites for monitoring the ecological condition of rivers tend to be on
large, main rivers, and are often intended to monitor the cumulative impacts in very large
catchments. Ideally, ecological condition should be provided not just for the main rivers of a
country but also for the smaller tributaries. Inclusion of tributaries will not only give a finer‐scale
understanding of the drivers of change, but also alerts us to trends in the condition of tributaries
that may impact negatively on the condition of downstream main rivers. We suggest that
ecological condition data should be collected for river reaches in sub‐catchments of
approximately 150‐200 km2. This recommended spatial scale is derived from freshwater
conservation planning experience over the last decade in Australia (Linke et al. 2007) and South

National River Ecosystem Accounts for South Africa 59 Discussion Document, October 2015
Africa (Nel et al. 2009). Setting up an entirely site‐based national monitoring programme at a
relatively fine spatial scale may not be possible or sustainable in most countries. A more feasible
option is to investigate modern technologies for achieving this, which combine remote sensing
with traditional site‐based assessment (Janse et al. 2015; Stein et al. 2014). In addition, citizen
science is emerging as a major source of new data (Dickinson et al. 2012), and it offers enormous
potential for expanding the coverage of ecological condition data for rivers and for validating
estimates of condition based on remote sensing products. In South Africa, citizen scientists are
already being used to collect river condition data
(www.groundtruth.co.za/projects/minisass.html ).
Data need to be comparable over time, which requires agreeing on a defined set of ecological
condition indicators and achieving methodological consistency in measuring these indicators and
quantifying the confidence of this measurement. This will help to ensure that changes detected
over time do not merely reflect data artefacts from different methodologies. Assessment of the
degree of modification of each indicator should ideally be based on a quantitative measurement,
and not rely solely on expert judgement. We recommend that river extent and condition
accounts be produced every five years in South Africa – more often than that is not feasible
given resource constraints. A major challenge in this regard is that there is currently no plan for
another national assessment of the Present Ecological State of rivers. If this is not done through
a national assessment, then we need to ensure that there is regular monitoring in a
comprehensive set of sites that can be built up to a national picture, together with further
testing of modern technologies for collecting data, as discussed above.

National River Ecosystem Accounts for South Africa 60 Discussion Document, October 2015
10. References
Chutter F.M. 1998. Research on the rapid biological assessment of water quality impacts in streams
and rivers. Report No. 422/1/98. Water Research Commission, Pretoria.
Dickens C.W.S. and Graham P.M. 2002. The South African Scoring System (SASS), version 5 rapid
bioassessment method for rivers. African Journal of Aquatic Science 27(1): 1–10.
Dickinson J.L., Shirk J., Bonter D., Bonney R., Crain R.L., Martin J., Phillips T. and Purcell K. 2012. The
current state of citizen science as a tool for ecological research and public engagement.
Frontiers in Ecology and the Environment 10:291–97.
Dollar E.S.J., Nicolson C.R., Brown C.A., Turpie J. K., Joubert A.R., Turton A.R,. Grobler D.F., Pienaar
H.H., Ewart‐Smith J. and Manyaka S.M. 2010. The development of the South African Water
Resource Classification System (WRCS): a tool towards the sustainable, equitable and
efficient use of water resources in a developing country. Water Policy 12:479‐499.
Driver A., Nel J.L., Snaddon K., Murray K., Roux D.J., Swartz E.R., Manuel J. and Funke N. 2011.
Implementation manual for Freshwater Ecosystem Priority Areas. Water Research
Commission Report No. 1801/1/11, Water Research Commission, Pretoria.
Driver A., Sink K.J., Nel J.N., Holness S., Van Niekerk L., Daniels F., Jonas Z., Majiedt P.A., Harris L. and
Maze K. 2012. National Biodiversity Assessment 2011: An assessment of South Africa’s
biodiversity and ecosystems. Synthesis Report. South African National Biodiversity Institute
and Department of Environmental Affairs, Pretoria.
DWA 2009. Water for Growth and Development Framework. Department of Water Affairs, Pretoria.
DWS. 2014. A Desktop Assessment of the Present Ecological State, Ecological Importance and
Ecological Sensitivity per Sub Quaternary Reaches for Secondary Catchments in South Africa.
Secondary: W5 (example). Compiled by RQIS‐RDM:
http://www.dwa.gov.za/iwqs/rhp/eco/peseismodel.aspx: accessed on: July 2014.
Janse J.H., Kuiper J.J., Weijters M.J., Westerbeek E.P., Jeuken M.H.J.L., Bakkenes M., Alkemade R.,
Mooij W.M. and Verhoeven J.T.A. 2015. GLOBIO‐Aquatic, a global model of human impact
on the biodiversity of inland aquatic ecosystems. Environmental Science & Policy 48:99‐114.
Kleynhans C.J., 2000. Desktop Estimates of the Ecological Importance and Sensitivity Categories
(EISC), Default Ecological Management Classes (DEMC), Present Ecological Status Categories
(PESC), Present Attainable Ecological Management Classes (Present AEMC), and Best
Attainable Ecological Management Class (Best AEMC) for Quaternary Catchments in South
Africa. DWAF report, Institute for Water Quality Studies, Department of Water Affairs and
Forestry, Private Bag X313, Pretoria, 0001, South Africa.
Kleynhans C.J. and Louw M.D. 2007. Module A: EcoClassification and EcoStatus determination in
River EcoClassification: Manual for EcoStatus Determination (version 2). Joint Water
Research Commission and Department of Water Affairs and Forestry report. WRC Report
No. TT329‐08, Water Research Commission, Pretoria.

National River Ecosystem Accounts for South Africa 61 Discussion Document, October 2015
Kleynhans C.J., Thirion C. and Moolman J., 2005. A Level I Ecoregion classification system for South
Africa, Lesotho and Swaziland. Resource Quality Services, Department of Water Affairs and
Forestry, Private Bag X313, Pretoria.
Linke S., Pressey R.L., Bailey R.C. and Norris R.H., 2007. Management options for river conservation
planning: condition and conservation re‐visited. Freshwater Biology 52:918‐938.
Moolman J., Kleynhans C.J. and Thirion C., 2002. Channel Slopes in the Olifants, Crocodile and Sabie
River Catchments. Department of Water Affairs and Forestry, Institute for Water Quality
Studies, Internal Report No.N/0000/00REH/0102, 41pp
Nel J.L., Reyers B., Roux D.J. and Cowling R.M. 2009. Expanding protected areas beyond their
terrestrial comfort zone: identifying spatial options for river conservation. Biological
Conservation 142: 1605‐1616.
Nel J.L., Driver A., Strydom W.F., Maherry A., Petersen C., Hill L., Roux D.J, Nienaber S., Van Deventer
H., Swartz E. and Smith‐Adao L.B., 2011a. Atlas of Freshwater Ecosystem Priority Areas in
South Africa: Maps to support sustainable development of water resources. Water Research
Commission Report No. TT 500/11, Water Research Commission, Pretoria.
Nel J.L., Murray K.M., Maherry A., Petersen C.P., Roux D.J., Driver A., Hill L., Van Deventer H., Funke
N., Swartz E.R., Smith‐Adao L.B., Mbona N., Downsborough L. and Nienaber S., 2011b.
Technical Report for the National Freshwater Ecosystem Priority Areas project. Water
Research Commission Report No. 1801/2/11, Water Research Commission, Pretoria.
Nel J.L. and Driver A. 2012. South African National Biodiversity Assessment 2011: Technical Report.
Volume 2: Freshwater Component. CSIR Report Number CSIR/NRE/ECO/IR/2012/0022/A,
Council for Scientific and Industrial Research, Stellenbosch.
Rowntree K.M. and Wadeson R.A., 1999. A Hierarchical Geomorphological Model for the
Classification of Selected South African Rivers. Water Research Commission Report No
497/1/99, Water Research Commission, Pretoria.
SANBI. 2013a. National Ecosystem Classification System: Concept note. March 2013, South African
National Biodiversity Institute, Pretoria. 25pp.
SANBI. 2013b. Life: the state of South Africa’s biodiversity 2012. South African National Biodiversity
Institute, Pretoria.
Stein J.L., Hutchinson M.F. and Stein J.A. 2014. A new stream and nested catchment framework for
Australia. Hydrology and Earth System Sciences Discussion 18: 19 17‐1933.
United Nations (UN), European Union, Food and Agriculture Organization of the United Nations,
International Monetary Fund, Organisation for Economic Co‐operation and Development,
World Bank. 2014a. System of Environmental‐Economic Accounting 2012: Central
Framework. United Nations, New York City.
United Nations (UN), European Commission, Food and Agriculture Organization of the United
Nations, Organisation for Economic Co‐operation and Development, World Bank Group.
2014b. System of Environmental‐Economic Accounting 2012: Experimental Ecosystem
Accounting. United Nations, New York City.

National River Ecosystem Accounts for South Africa 62 Discussion Document, October 2015
United Nations (UN). 2015a. SEEA Experimental Ecosystem Accounting: Technical Guidance. Version
3.0 (Draft for review, 3 April 2015). Editor: Carl Obst. Prepared as part of the Advancing SEEA
Experimental Ecosystem Accounting project, presented for discussion at the Forum of Expert
on Ecosystem Accounting in New York City, 28‐30 April 2015.