the implementation of land and ecosystem accounts in europe towards integrated land and ecosystem...
TRANSCRIPT

The Implementation of Land and Ecosystem Accounts in Europe
Towards integrated land and ecosystem accounting
Roy Haines-Young, University of Nottingham&
Jean-Louis Weber, European Environment Agency
Ninth Biennial Conference
of International Society for Ecological Economics
On Ecological Sustainability and Human Well-Being
December 15-18 2006 India Habitat Centre, New Delhi
Technical Session 1: Modelling, Valuation and Evaluation
Sub-Theme: Geographical Representations of Environmental Changes

Background and Overview
• There is a growing demand for spatially explicit indicators for to support policies for
– nature, – regional development,– agriculture, – transport, – coastal management …

Background and Overview• EEA has demonstrated that at European scales
land accounts can be constructed in ways that are:– Conceptually robust– Capable of being maintained ‘operationally’; and– ‘Fit for purpose’, in both the scientific and policy arenas
• The work also provides an important platform for future developments in relation to:– The construction of integrated ecosystem accounts– Making sustainability impact assessments– Modelling and scenario development

Part I:
The Story so far..
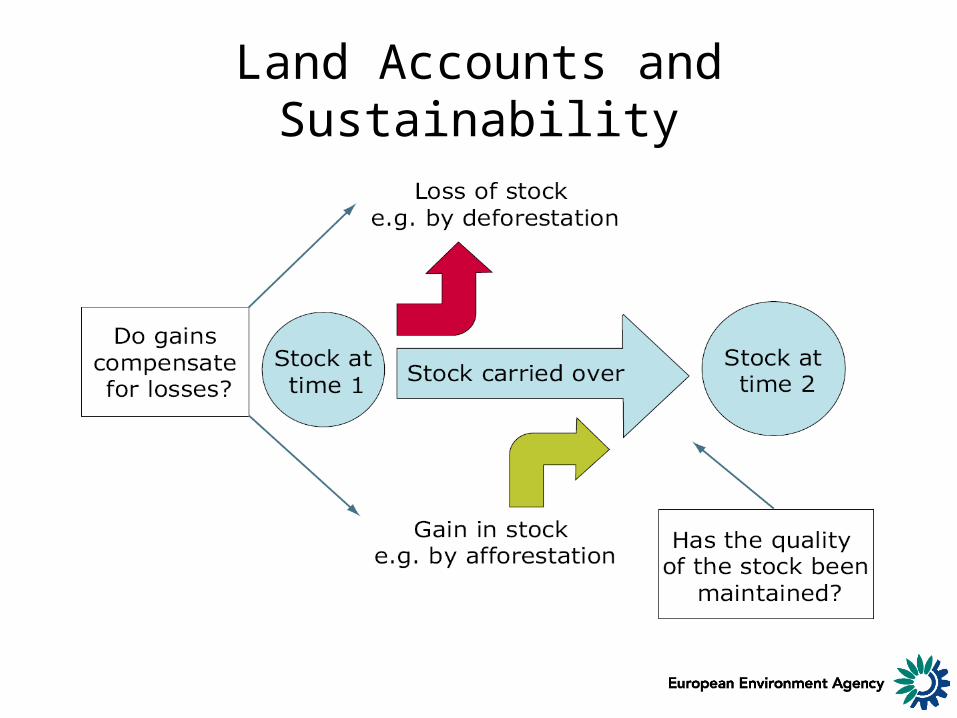
Land Accounts and Sustainability

Accounting for Stocks & Flows
Land cover changes matrix Land cover x land use matrix
Land cover (initial state)
Land cover (final state)
Land cover core account
Land use x activities matrix
economic decisions
natural causes
multiple causes
Lan
d c
ov
er
Activitie
s/ secto
rs
Land cover flows due to Final
state
Land cover (final state)
Land use functions
Land use functions
Lan
d c
ov
er
(i
nit
ial
sta
te)
Lan
d c
ov
er
flo
ws
Initial state
Land use accounts and
Ecosystem accounts
Land use accounts and
Ecosystem accounts
Basic land cover stocks and flows accounts
Basic land cover stocks and flows accounts
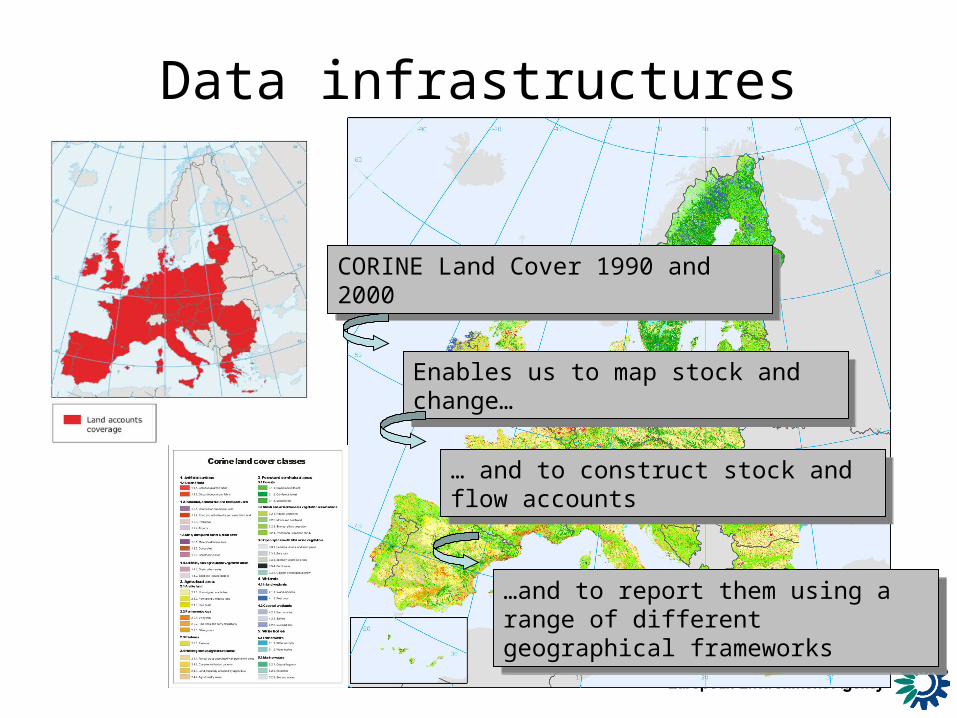
Data infrastructures
CORINE Land Cover 1990 and 2000CORINE Land Cover 1990 and 2000
Enables us to map stock and change…Enables us to map stock and change…
… and to construct stock and flow accounts
… and to construct stock and flow accounts
…and to report them using a range of different geographical frameworks
…and to report them using a range of different geographical frameworks
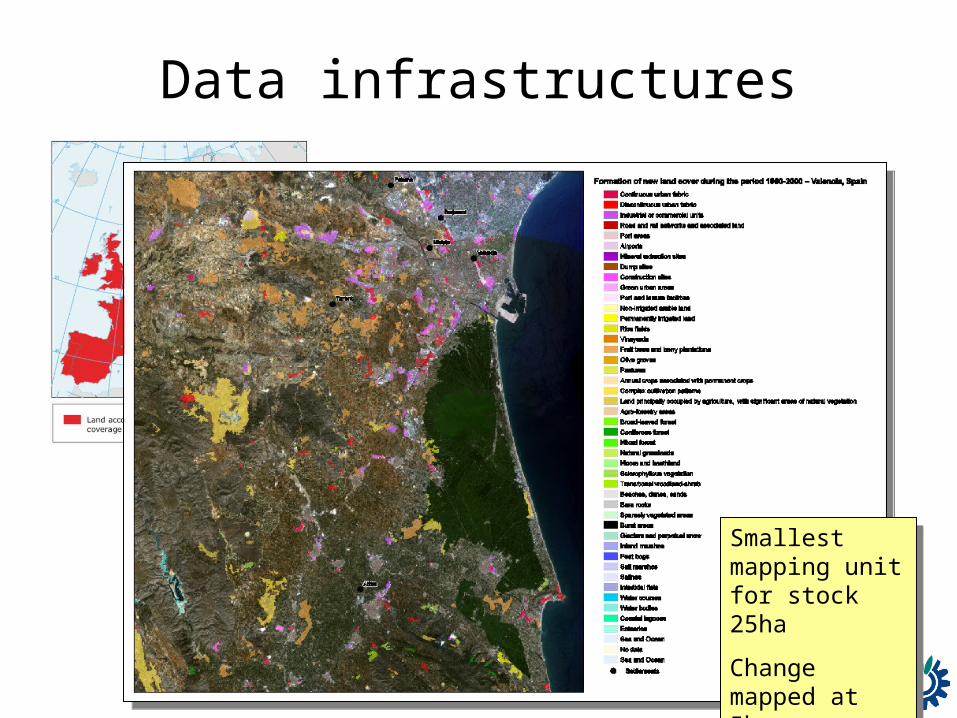
Data infrastructures
Smallest mapping unit for stock 25ha
Change mapped at 5ha
Smallest mapping unit for stock 25ha
Change mapped at 5ha
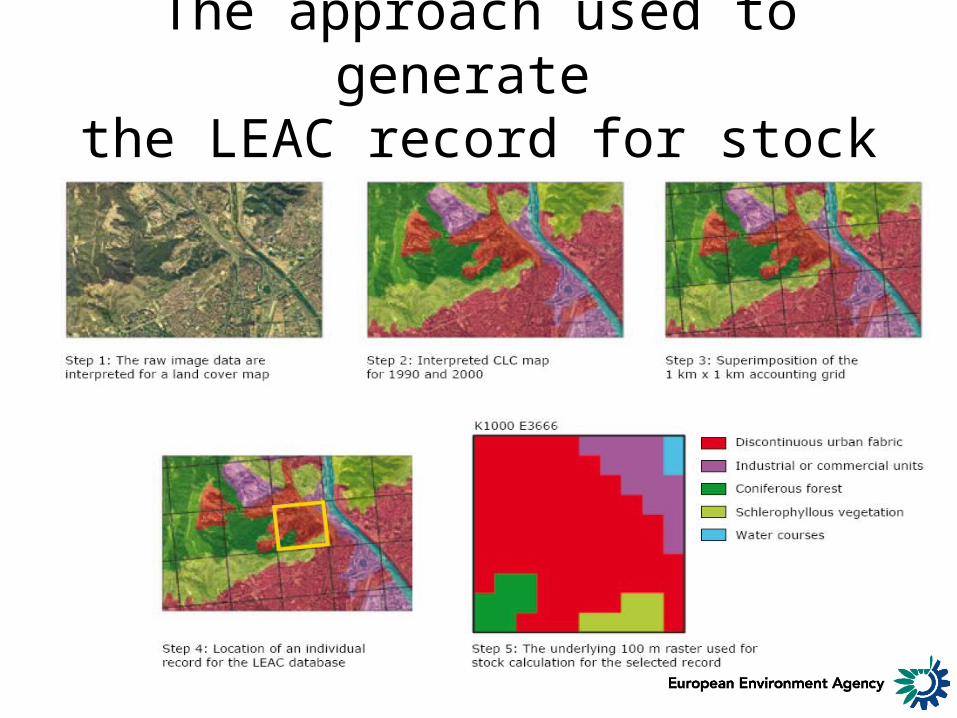
The approach used to generate
the LEAC record for stock
Stock and change
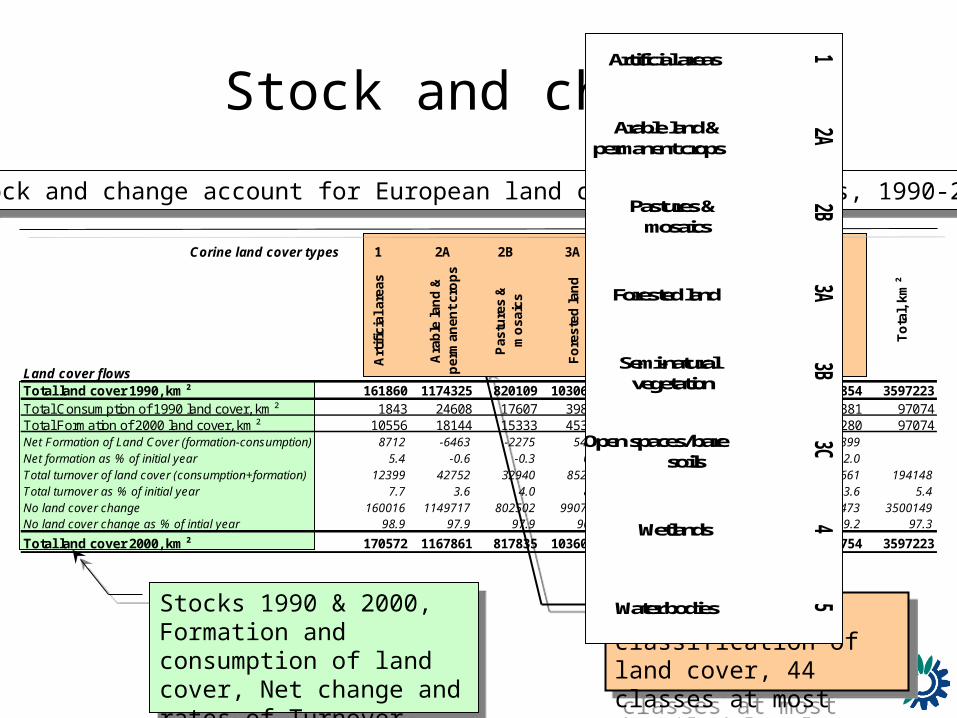
A stock and change account for European land cover, 24 countries, 1990-2000 A stock and change account for European land cover, 24 countries, 1990-2000
Hierarchical classification of land cover, 44 classes at most detailed level
Hierarchical classification of land cover, 44 classes at most detailed level
Stocks 1990 & 2000, Formation and consumption of land cover, Net change and rates of Turnover
Stocks 1990 & 2000, Formation and consumption of land cover, Net change and rates of Turnover
Corine land cover types 1 2A 2B 3A 3B 3C 4 5
Land cover flowsA
rtif
icia
l are
as
Ara
ble
lan
d &
p
erm
anen
t cr
op
s
Pas
ture
s &
m
osa
ics
Fo
rest
ed la
nd
Sem
i-n
atu
ral
veg
etat
ion
Op
en s
pac
es/ b
are
soils
Wet
lan
ds
Wat
er b
od
ies
Total land cover 1990, km² 161860 1174325 820109 1030635 264932 52593 46915 45854 3597223Total Consumption of 1990 land cover, km² 1843 24608 17607 39899 9018 2304 1413 381 97074Total Formation of 2000 land cover, km² 10556 18144 15333 45343 4177 1858 383 1280 97074Net Formation of Land Cover (formation-consumption) 8712 -6463 -2275 5444 -4842 -446 -1030 899Net formation as % of initial year 5.4 -0.6 -0.3 0.5 -1.8 -0.8 -2.2 2.0Total turnover of land cover (consumption+formation) 12399 42752 32940 85242 13195 4162 1796 1661 194148Total turnover as % of initial year 7.7 3.6 4.0 8.3 5.0 7.9 3.8 3.6 5.4No land cover change 160016 1149717 802502 990736 255914 50289 45502 45473 3500149No land cover change as % of intial year 98.9 97.9 97.9 96.1 96.6 95.6 97.0 99.2 97.3
Total land cover 2000, km² 170572 1167861 817835 1036079 260090 52147 45885 46754 3597223
To
tal,
km²
Corine land cover types1
2A2B
3A3B
3C4
5
Land cover flows
Artificial areas
Arable land & permanent crops
Pastures & mosaics
Forested land
Semi-natural vegetation
Open spaces/ bare soils
Wetlands
Water bodies
LCF1 Urban land management 737
1519
08
00
780LCF2 Urban residential sprawl
19241867
200145
83
24149
LCF3 Sprawl of economic sites and infrastructures 77
27281595
665451
3522
535627
LCF4 Agriculture internal conversions 17252
1006227314
LCF5 Conversion from other land cover to agriculture 273
9351796
1734155
9650
5039LCF6 W
ithdrawal of farming 2393
28605253
LCF7 Forests creation and management 254
358035166
10481063
343337
LCF8 Water bodies creation and management
191252
253117
19017
211042
No Change160016
1149717802502
990736255914
5028945502
454733500149
LCF1 Urban land management 780
780LCF2 Urban residential sprawl
41494149
LCF3 Sprawl of economic sites and infrastructures 5627
5627LCF4 Agriculture internal conversions
1569511619
27314LCF5 Conversion from other land cover to agriculture
24502590
5039LCF6 W
ithdrawal of farming 1124
27921244
2370
05253
LCF7 Forests creation and management 42547
76624
43337LCF8 W
ater bodies creation and management 21
10211042
No Change160016
1149717802502
990736255914
5028945502
454733500149

Summary indicators

From changes to flows
LCF3
LCF1
LCF2
LCF5
LCF4
LCF7
LCF6
LCF8
Change Matrix(44x43=1932
possible changes)summarized into
flows
LCF9
Corine land cover types 1 2A 2B 3A 3B 3C 4 5
Land cover flows
Art
ific
ial a
reas
Fo
rest
ed la
nd
Wet
lan
ds
Wat
er b
od
ies
LCF1 Urban land management 737 15 19 0 8 0 0 780LCF2 Urban residential sprawl 1924 1867 200 145 8 3 2 4149LCF3 Sprawl of economic sites and infrastructures 77 2728 1595 665 451 35 22 53 5627LCF4 Agriculture internal conversions 17252 10062 27314LCF5 Conversion from other land cover to agriculture 273 935 1796 1734 155 96 50 5039LCF6 Withdrawal of farming 2393 2860 5253LCF7 Forests creation and management 254 35803 5166 1048 1063 3 43337LCF8 Water bodies creation and management 191 252 253 117 190 17 21 1042LCF9 Changes due to natural & multiple causes 311 44 15 1317 1323 1041 229 252 4534
No Change 160016 1149717 802502 990736 255914 50289 45502 45473 3500149
LCF1 Urban land management 780 780LCF2 Urban residential sprawl 4149 4149LCF3 Sprawl of economic sites and infrastructures 5627 5627LCF4 Agriculture internal conversions 15695 11619 27314LCF5 Conversion from other land cover to agriculture 2450 2590 5039LCF6 Withdrawal of farming 1124 2792 1244 23 70 0 5253LCF7 Forests creation and management 42547 766 24 43337LCF8 Water bodies creation and management 21 1021 1042
No Change 160016 1149717 802502 990736 255914 50289 45502 45473 3500149
Flow accounts
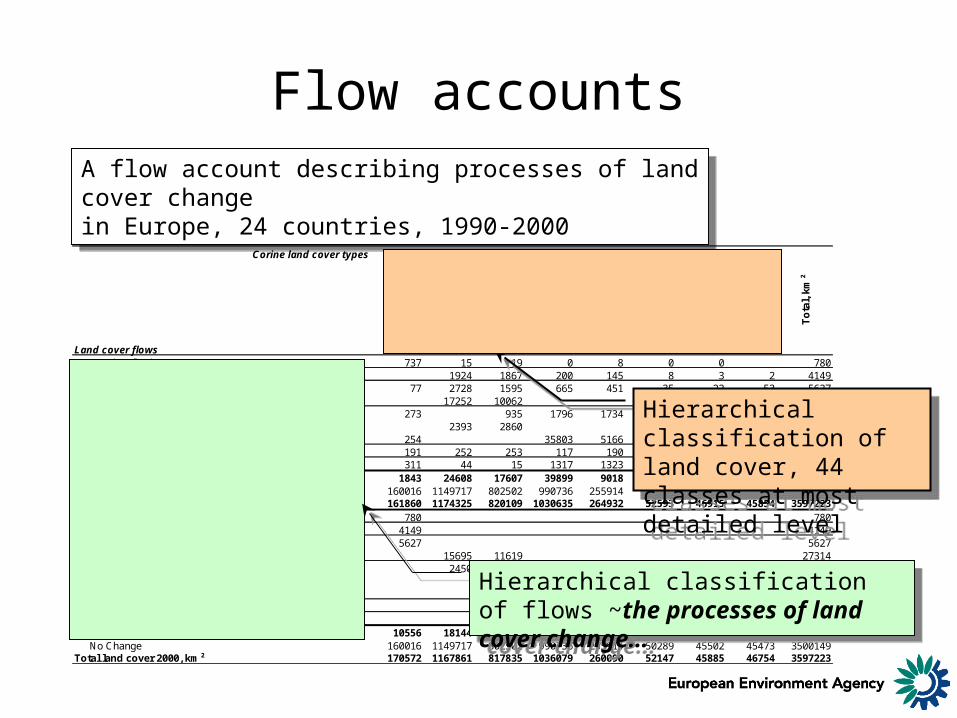
A flow account describing processes of land cover change in Europe, 24 countries, 1990-2000
A flow account describing processes of land cover change in Europe, 24 countries, 1990-2000
Corine land cover types 1 2A 2B 3A 3B 3C 4 5
Land cover flows
Art
ific
ial a
reas
Ara
ble
lan
d &
p
erm
an
ent
cro
ps
Pas
ture
s &
m
osa
ics
Fo
res
ted
lan
d
Sem
i-n
atu
ral
veg
eta
tio
n
Op
en
sp
ace
s/ b
are
soil
s
Wet
lan
ds
Wat
er
bo
die
s
LCF1 Urban land management 737 15 19 0 8 0 0 780LCF2 Urban residential sprawl 1924 1867 200 145 8 3 2 4149LCF3 Sprawl of economic sites and infrastructures 77 2728 1595 665 451 35 22 53 5627LCF4 Agriculture internal conversions 17252 10062 27314LCF5 Conversion from other land cover to agriculture 273 935 1796 1734 155 96 50 5039LCF6 Withdrawal of farming 2393 2860 5253LCF7 Forests creation and management 254 35803 5166 1048 1063 3 43337LCF8 Water bodies creation and management 191 252 253 117 190 17 21 1042LCF9 Changes due to natural & multiple causes 311 44 15 1317 1323 1041 229 252 4534Total Consumption of 1990 land cover, km² 1843 24608 17607 39899 9018 2304 1413 381 97074
No Change 160016 1149717 802502 990736 255914 50289 45502 45473 3500149Total land cover 1990, km² 161860 1174325 820109 1030635 264932 52593 46915 45854 3597223LCF1 Urban land management 780 780LCF2 Urban residential sprawl 4149 4149LCF3 Sprawl of economic sites and infrastructures 5627 5627LCF4 Agriculture internal conversions 15695 11619 27314LCF5 Conversion from other land cover to agriculture 2450 2590 5039LCF6 Withdrawal of farming 1124 2792 1244 23 70 0 5253LCF7 Forests creation and management 42547 766 24 43337LCF8 Water bodies creation and management 21 1021 1042LCF9 Land Cover due to natural & multiple causes 4 2167 1790 313 260 4534Total Formation of 2000 land cover, km² 10556 18144 15333 45343 4177 1858 383 1280 97074
No Change 160016 1149717 802502 990736 255914 50289 45502 45473 3500149Total land cover 2000, km² 170572 1167861 817835 1036079 260090 52147 45885 46754 3597223
To
tal,
km
²
Hierarchical classification of land cover, 44 classes at most detailed level
Hierarchical classification of land cover, 44 classes at most detailed level
Hierarchical classification of flows ~the processes of land cover change…
Hierarchical classification of flows ~the processes of land cover change…

Artificial land uptake

Comparison of artificial land uptake by countries

Mapping flows
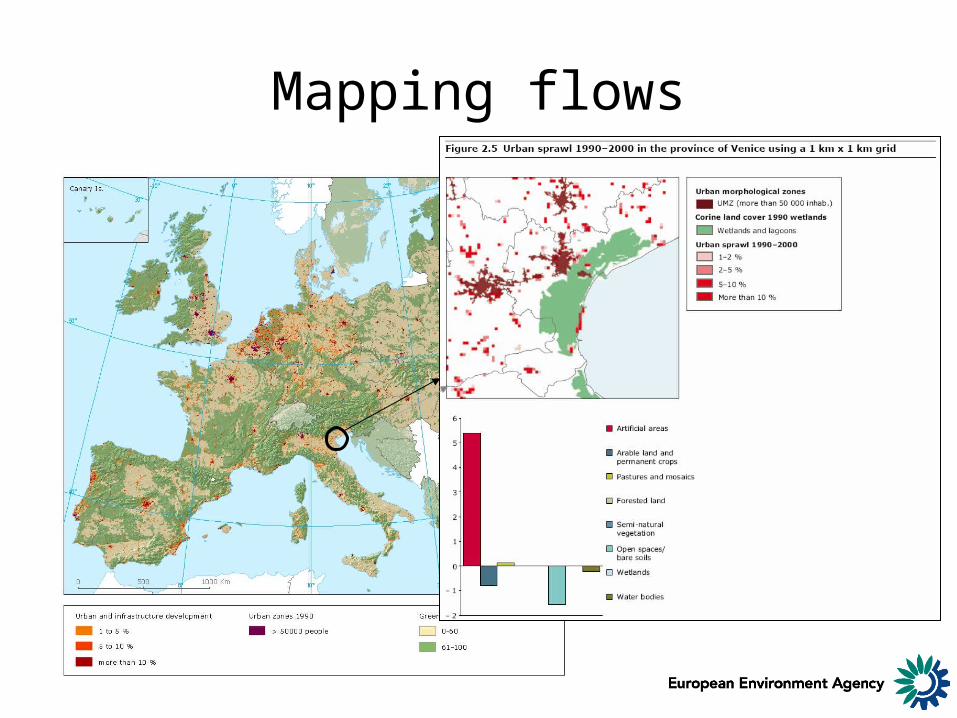
Patterns of urban sprawl across Europe, 24 countries, 1990-2000, 1km x 1km grid
Patterns of urban sprawl across Europe, 24 countries, 1990-2000, 1km x 1km grid
Mapping flows

Main change in land use by agriculture

Extension of forest territory by creation or removal of farming

Mapping flows
Intensity of urban sprawl, 1990-2000, by NUTS 2/3 region; sprawl is now expressed on a unit area basis
Intensity of urban sprawl, 1990-2000, by NUTS 2/3 region; sprawl is now expressed on a unit area basis

Mapping flowsData held on a standardised 1km x 1km Europe wide grid which enables construction of a different ‘zonal accounts’ including those for:
•Regions•Biogeographical zones
•Mountain areas •Coastal zones
•Major sea basins •Dominant landscape types…
Data held on a standardised 1km x 1km Europe wide grid which enables construction of a different ‘zonal accounts’ including those for:
•Regions•Biogeographical zones
•Mountain areas •Coastal zones
•Major sea basins •Dominant landscape types…Sprawl of artificial areas 1990-2000 on Europen coasts,
by dominant land cover types, km²
0100200300400500600700800900
North Sea
Mediterra
nean
Black SeaBaltic
Atlantic
D1 - Composite landscape
C2 - Open semi-natural ornatural landscape
C1 - Forested landscape
B2 - Rural mosaic andpasture landscapeB1 - Broad patternintensive agriculture
A2 - Dispersed urbanareas
A1 - Urban dense areas
Sprawl of artificial areas 1990-2000 on Europen coasts, by dominant land cover types, km²
0100200300400500600700800900
North Sea
Mediterra
nean
Black SeaBaltic
Atlantic
D1 - Composite landscape
C2 - Open semi-natural ornatural landscape
C1 - Forested landscape
B2 - Rural mosaic andpasture landscapeB1 - Broad patternintensive agriculture
A2 - Dispersed urbanareas
A1 - Urban dense areas
e.g
Dominant Landscape Types

Part II:
Platform for the future
Contribution to knowledge
• Land Cover Accounts provides a platform for:– Sustainable development and understanding
patterns of change– Accounting for ecosystem goods and services
(Ecosystem Assessment…)– Valuation of natural assets and environmental
expenditures– Tool for Sustainability Impact Assessment
(Targeted Accounts)– Platform for building scenarios and models

Accounting for Stocks & Flows
Land cover changes matrix Land cover x land use matrix
Land cover (initial state)
Land cover (final state)
Land cover core account
Land use x activities matrix
economic decisions
natural causes
multiple causes
Lan
d c
ov
er
Activitie
s/ secto
rs
Land cover flows due to Final
state
Land cover (final state)
Land use functions
Land use functions
Lan
d c
ov
er
(i
nit
ial
sta
te)
Lan
d c
ov
er
flo
ws
Initial state
Land use accounts and
Ecosystem accounts
Land use accounts and
Ecosystem accounts
The story so far….The story so far…. The next steps….The next steps….

CORE LAND COVER ACCOUNT
Soil
Flora & Fauna
Water system
Atmosphere/ Climate
Land use economic &
social functions
Artificiality of land
Intensityof use
LAND & ECOSYSTEM ACCOUNTS
Ecosystem services
Ecosystempotentials
Integrity, health & viability
Vulnerability
Production & Consumption
Natural Assets
Population
Infrastructures & Technologies
Land use and ecosystem accounting

Accounting for ecosystems: Conceptual Model
Distribution Patterns Neighbourhoods
S
C
A
L
E
S
Distribution Patterns Neighbourhoods
S
C
A
L
E
S
Spatial analysisSpatial analysis
DP S IRDriving forces (production, consumption)
Pressures
State of environment
Impacts of state on society, economy and ecosystems
Responses
CausationCausation
FrameworkFramework
Stocks & flows
Values
Goods & Services
System interactions
Stocks & flows
Values
Goods & Services
System interactions

Stocks/ flows
Assets & Values
Goods & Services
System Interactions,
resilience
Framework
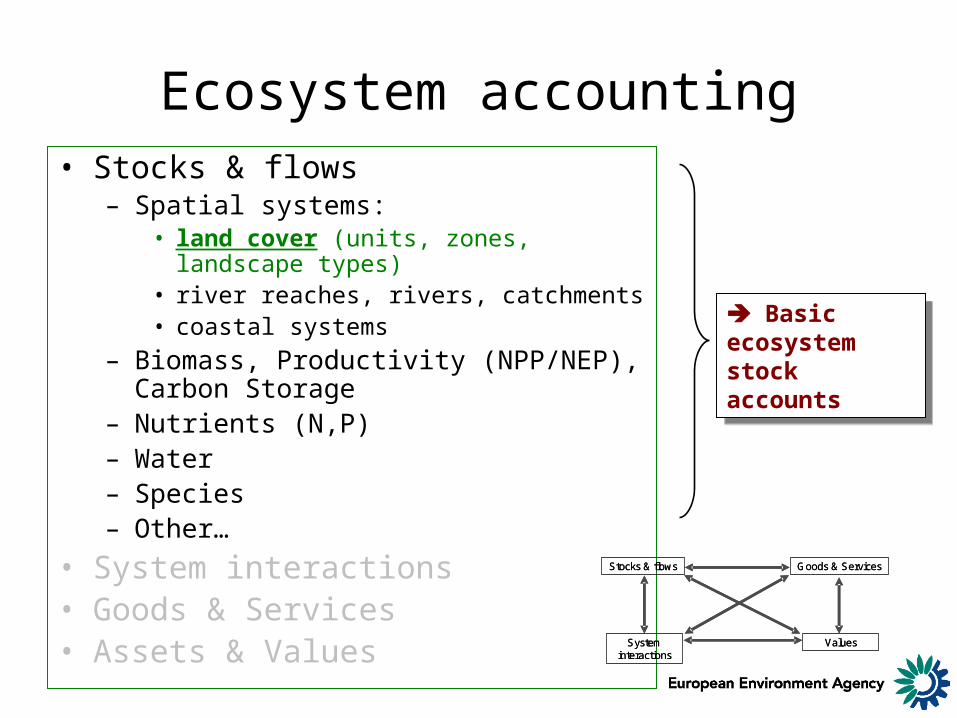
Ecosystem accounting• Stocks & flows
– Spatial systems:• land cover (units, zones, landscape
types)• river reaches, rivers, catchments• coastal systems
– Biomass, Productivity (NPP/NEP), Carbon Storage
– Nutrients (N,P)– Water– Species – Other…
• System interactions• Goods & Services• Assets & Values
Basic ecosystem stock accounts
Basic ecosystem stock accounts
Stocks & flows
Values
Goods & Services
System interactions
Stocks & flows
Values
Goods & Services
System interactions
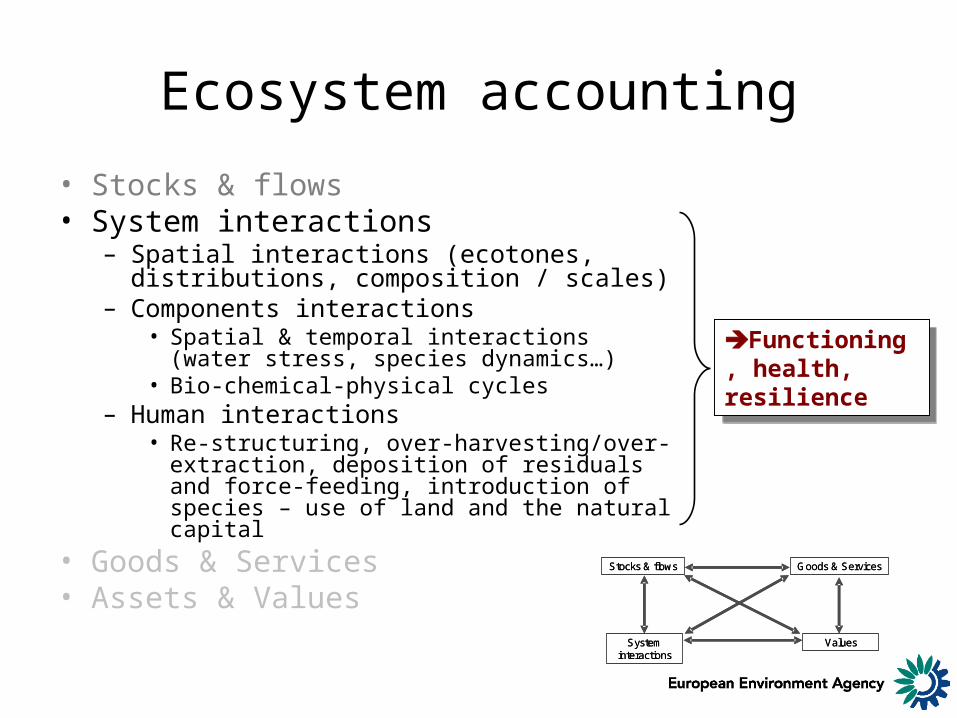
Ecosystem accounting
• Stocks & flows• System interactions
– Spatial interactions (ecotones, distributions, composition / scales)
– Components interactions• Spatial & temporal interactions (water
stress, species dynamics…)• Bio-chemical-physical cycles
– Human interactions • Re-structuring, over-harvesting/over-
extraction, deposition of residuals and force-feeding, introduction of species – use of land and the natural capital
• Goods & Services• Assets & Values
Functioning, health, resilience
Functioning, health, resilience
Stocks & flows
Values
Goods & Services
System interactions
Stocks & flows
Values
Goods & Services
System interactions
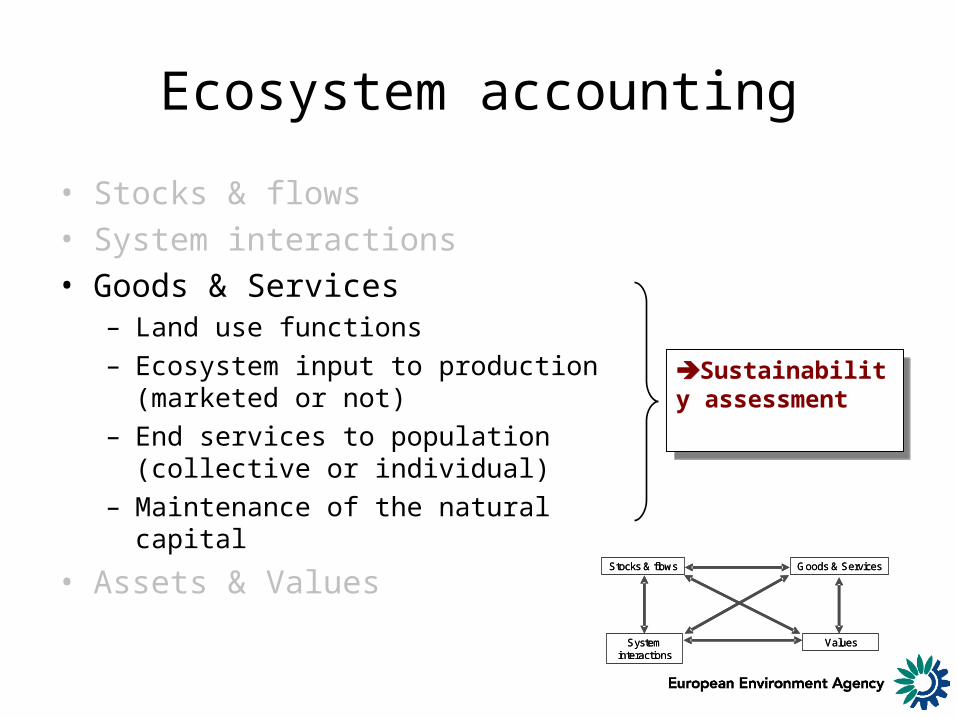
Ecosystem accounting
• Stocks & flows• System interactions• Goods & Services
– Land use functions– Ecosystem input to production
(marketed or not)– End services to population
(collective or individual)– Maintenance of the natural capital
• Assets & Values
Sustainability assessment
Sustainability assessment
Stocks & flows
Values
Goods & Services
System interactions
Stocks & flows
Values
Goods & Services
System interactions

Ecosystem accounting
• Stocks & flows• System interactions• Goods & Services• Assets & Values Value of ecosystem goods and
services, wealth, natural capital
Value of ecosystem goods and services, wealth, natural capital
Stocks & flows
Values
Goods & Services
System interactions
Stocks & flows
Values
Goods & Services
System interactions

Framework of Ecosystem Accounts
Natural assets accounts • Natural capital structure, resilience & wealth (physical
units, by sectors)• Capital consumption & accumulation (physical units, €)• Ecosystem assets wealth (€)
Natural Capital Accounts/ living & cycling natural capital
Functions & Services• Land use function• Natural function
Supply & use of ecosystem goods and services(Use of resource by sectors, supply to consumption &
residuals, accumulation, I-O analysis)
Material/energy flows(focus on biomass, water,
nutrients, residuals)
Accounts of flows of ecosystem goods and services
Counts of stocks diversity / integrity(by ecosystem types,
focus on quality)
Ecosystem Stocks & State Accounts
Ecosystem State (health diagnosis and
wealth calculation)
Core accounts of stocks & flows
(by ecosystem types, raw quantities)
Eco
syst
em t
ypes
Economic sectorsSpatial integration
Economic integration
Platform for the future
~First steps

Integration of Environmental & Socio-Economic Data
Land cover maps
Area sampling (crops,
habitats…)
Socio-economicstatistics (e.g. by
regions, municipalities, sectors, farm holdings, household groups...)
Monitoring of individual sites or stations
(e.g. nature, water…)
Earth observation:multi-scales land cover
+ vegetation + NPP +…
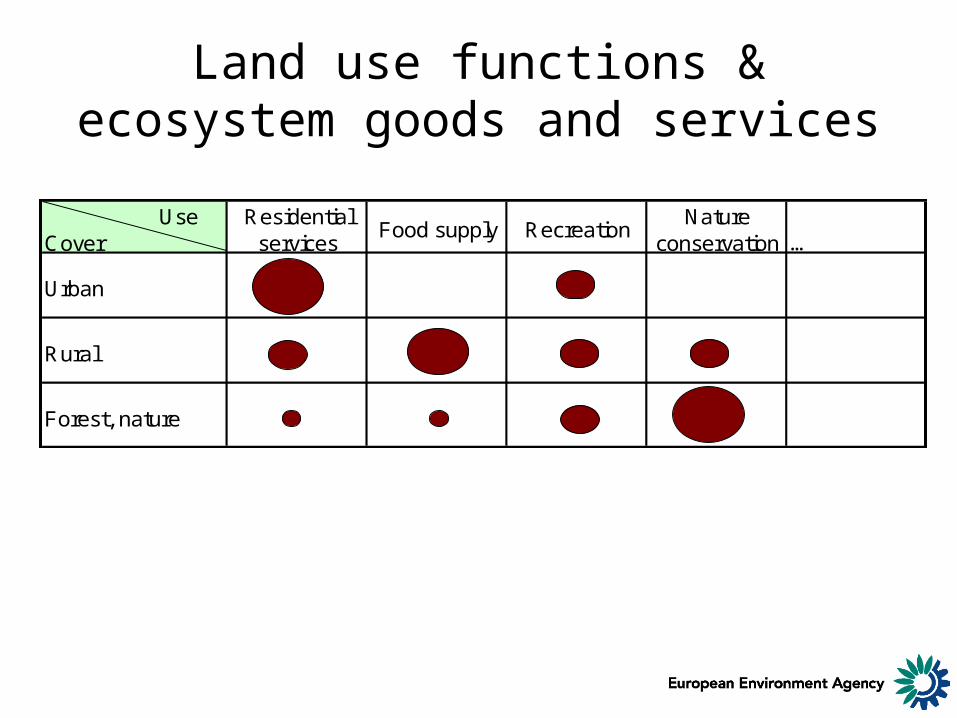
Land use functions & ecosystem goods and services
Use Cover
Residential services
Food supply RecreationNature
conservation …
Urban
Rural
Forest, nature
Conclusions
“By examining all uses of land in an integrated manner, it makes it possible to minimize conflicts, to make the most efficient trade-offs and to link social and economic development with environmental protection and enhancement, thus helping to achieve the objectives of sustainable development.” Agenda 21, Chapter 10
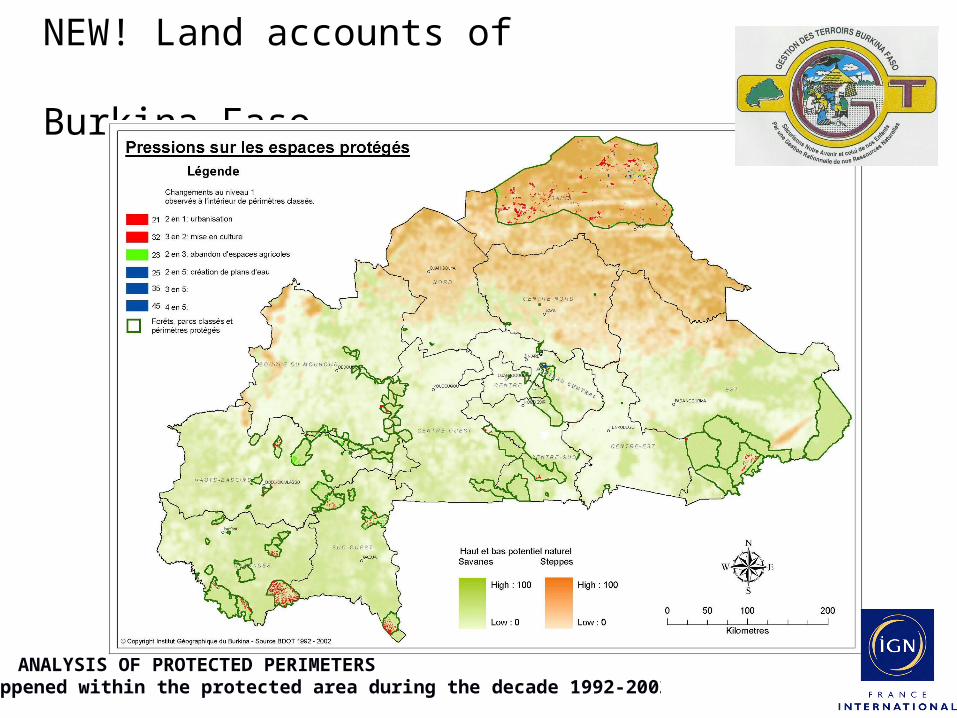
NEW! Land accounts of Burkina Faso
What happened within the protected area during the decade 1992-2002 ?ANALYSIS OF PROTECTED PERIMETERS